APPENDIX I TRAFFIC IMPACT ANALYSIS
|
|
|
- Jocelin Byrd
- 5 years ago
- Views:
Transcription
1 I NITIAL S TUDY/MITIGATED NEGATIVE D ECLARATION NO M ARCH 2018 K ILLEFER SQUARE A PARTMENTS C ITY OF ORANGE, COUNTY OF ORANGE, CALIFORNIA APPENDIX I TRAFFIC IMPACT ANALYSIS P:\WSH1601\March 2018\Killefer ISMND _City Comments_ docx «03/08/18»
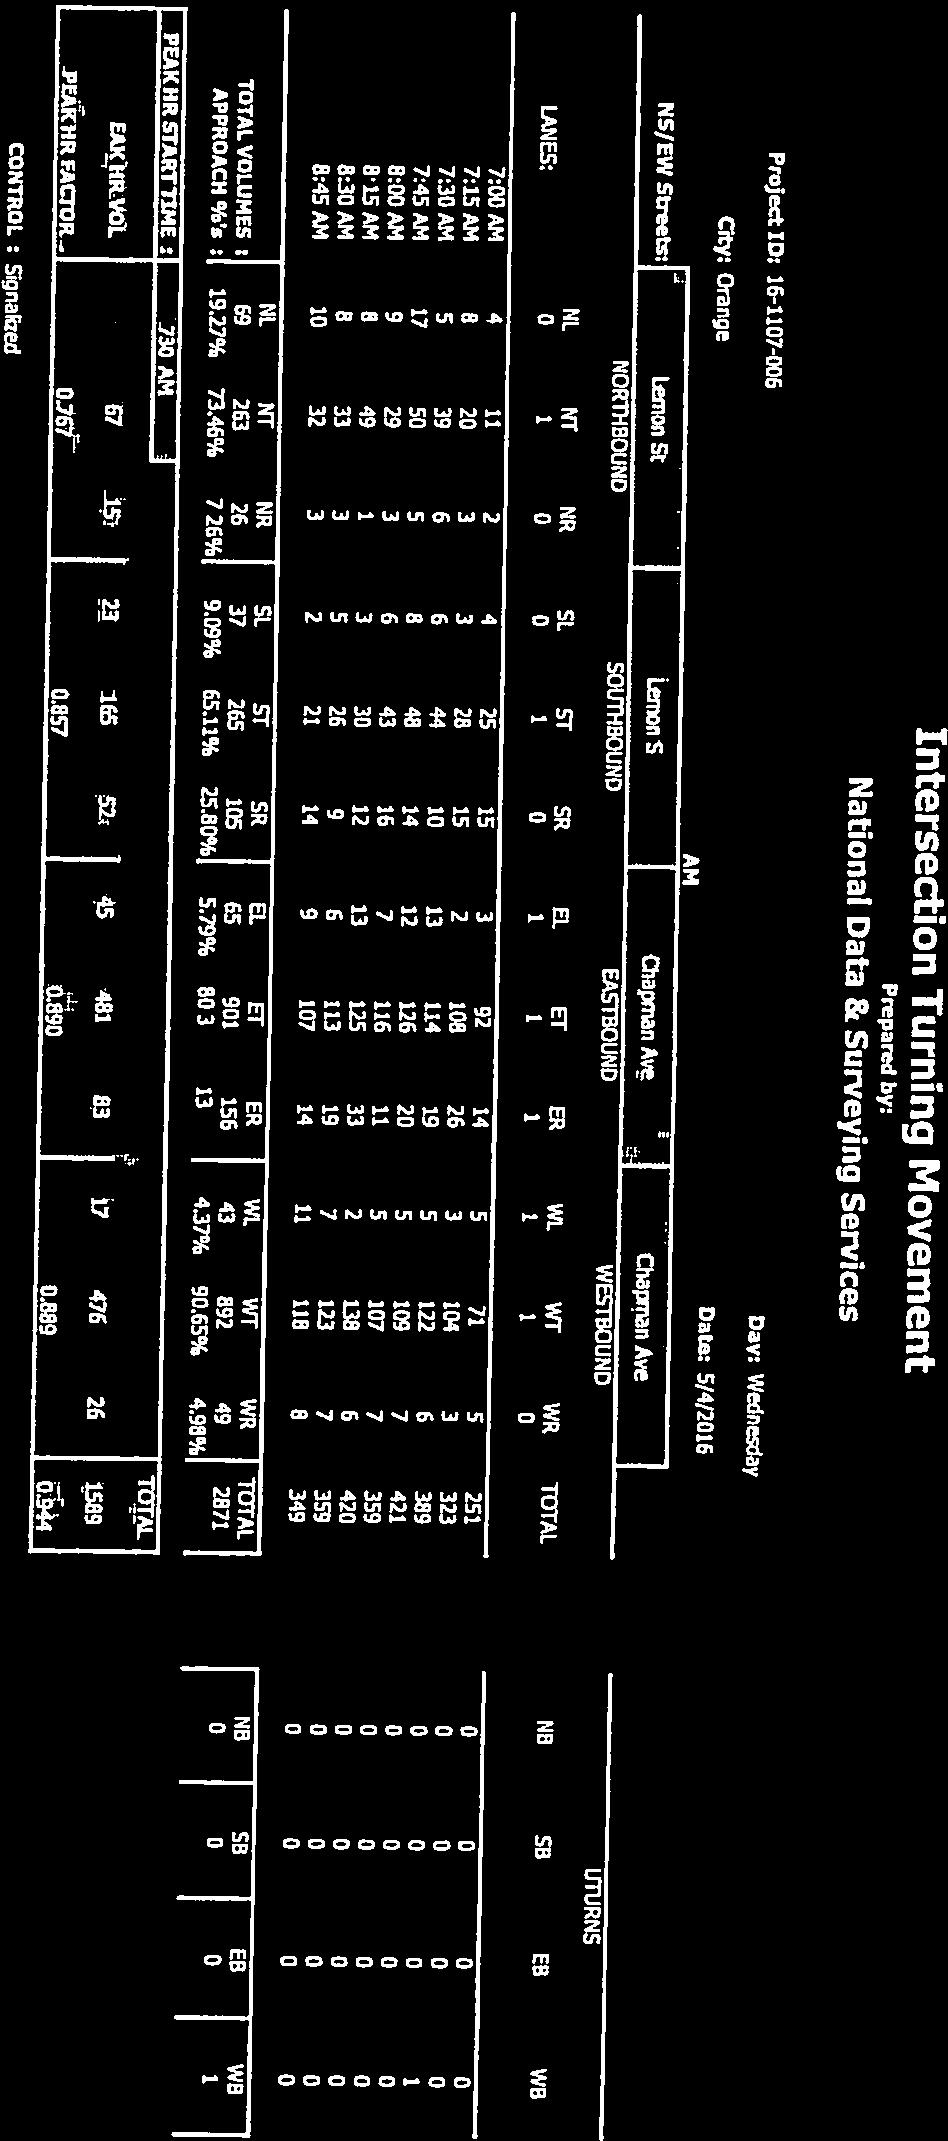
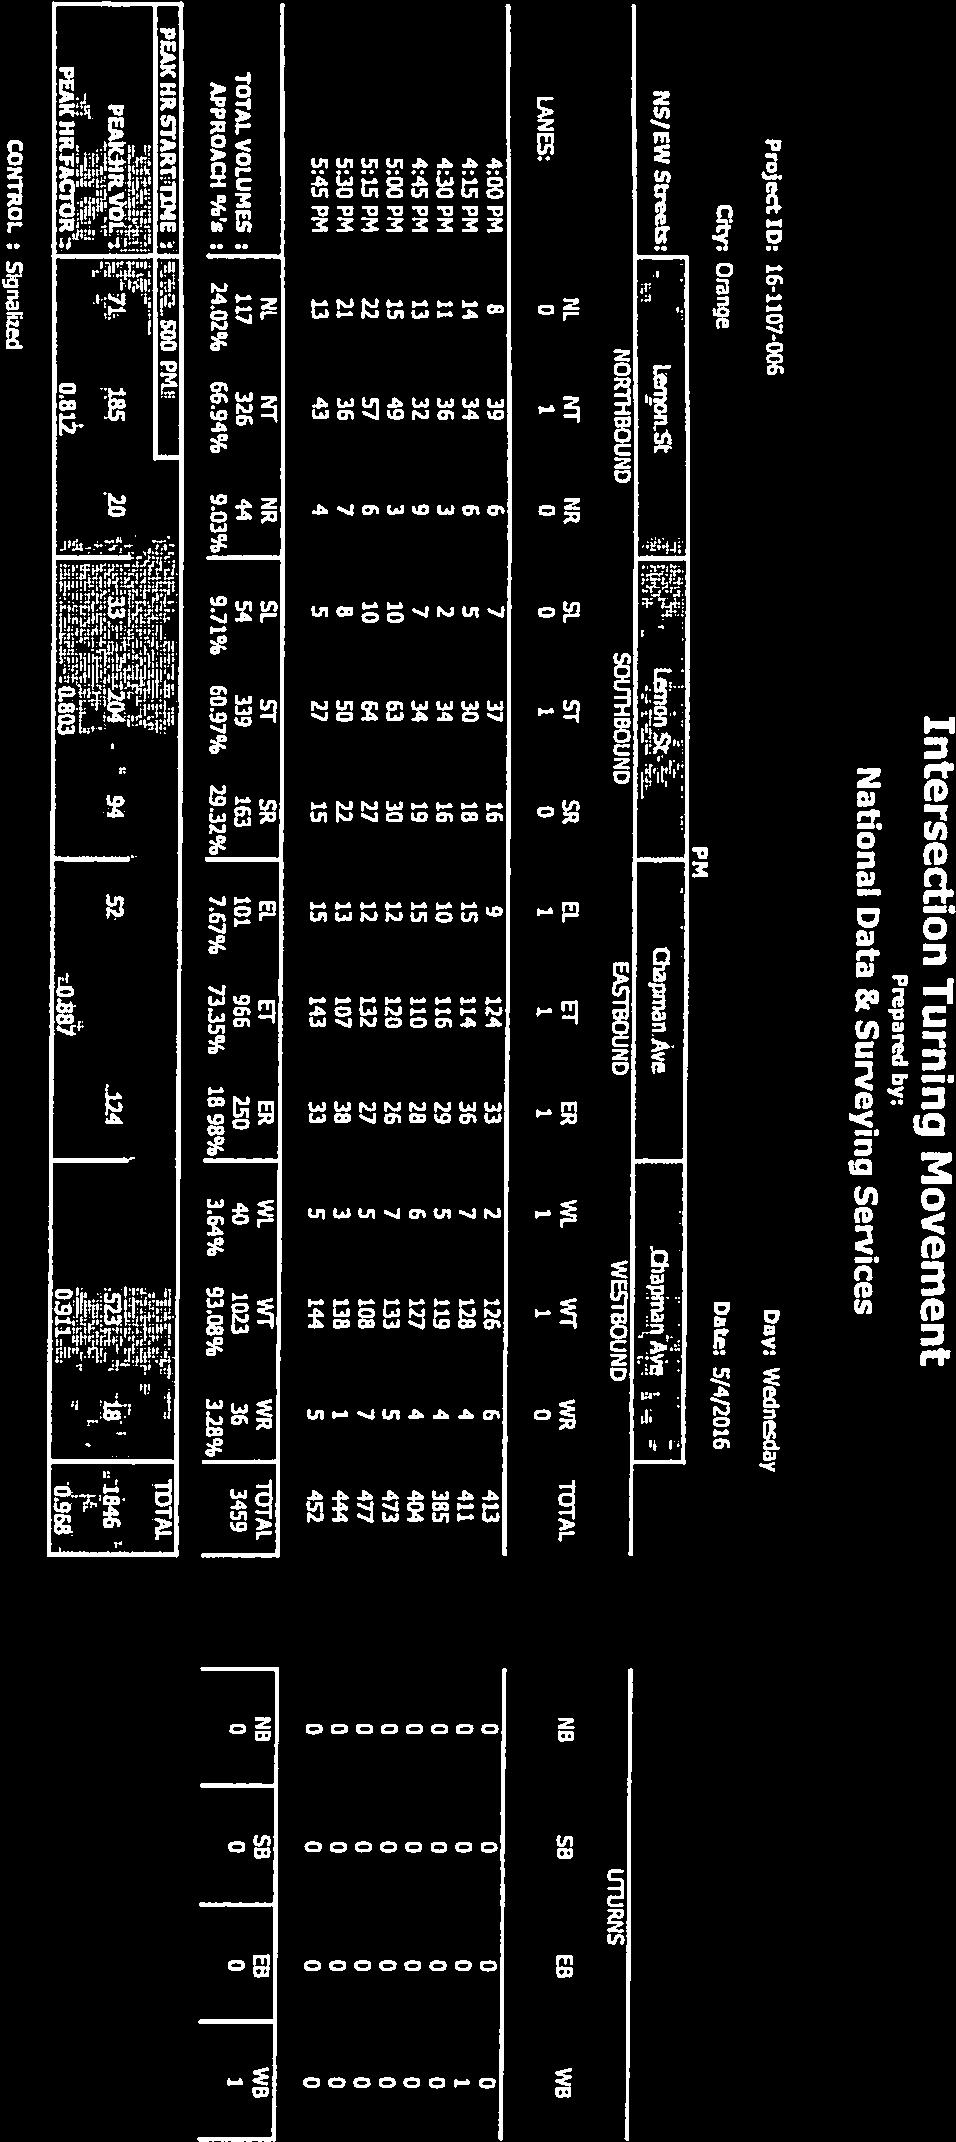
2 November 22, 2017 BERKELEY CARLSBAD FRESNO IRVINE LOS ANGELES PALM SPRINGS POINT RICHMOND RIVERSIDE ROSEVILLE SAN LUIS OBISPO Doug Keys City of Orange Traffic Engineering 300 E. Chapman Avenue Orange, CA Subject: Killefer Square Apartments Traffic Impact Analysis Dear Mr. Keys: LSA had previously submitted this Traffic Impact Analysis (TIA) for the Killefer Square Apartments Project (project), formerly known as Killefer Square Specific Plan, at 541 North Lemon Street in the City of Orange (City) in August This TIA focused on weekday a.m. and p.m. peak-hour operations at eight study intersections and concluded that the development of an 80 unit student housing facility would not result in any significant traffic impacts to the surrounding roadway network. In September 2017, the project was revised and resubmitted to the City with a new dwelling unit count of 24 multiple-family residential units. Pursuant to our telephone conversation on October 4th, 2017 we agreed that an entirely new TIA would not be necessary to analyze another project on the same site with fewer units. As shown below, LSA prepared a trip generation and comparison table for the revised project. AM Peak Hour PM Peak Hour Land Use Size Unit ADT In Out Total In Out Total Trip Ratesˡ Apartments (Land Use 220) DU Trip Generation Previous TIA 80 DU Current Project 24 DU ˡ Trip rates based on the Institute of Transportation Engineers (ITE) Trip Generation manual, 10th Edition (2017). As anticipated, the revised 24 unit project was found to generate less traffic and would not result in a significant traffic impacts to the surrounding roadway network, and would not create a need for any mitigation measures. Sincerely, LSA Associates, Inc. Donson Liu, T.E. Transportation Engineer 20 Executive Park, Suite 200, Irvine, California
3
4 T R A F F I C I M P A C T A N A LY S I S KILLEFER SQUARE SPEC IFIC PLAN CITY OF ORANGE, CALIFORNIA Submitted to: Doug DeCinces Western States Housing, LLC 12 Strawberry Farms Road Irvine, California Prepared by: LSA 20 Executive Park, Suite 200 Irvine, California (949) Project No. WSH1601 August 2017
5 T R A F F I C I M P A C T A N A L Y S I S A U G U S T 2017 K I L L E F E R S Q U A R E S P E C I F I C P L A N C I T Y O F O R A N G E, C A L I F O R N I A TABLE OF CONTENTS INTRODUCTION... 3 PROJECT DESCRIPTION... 3 Study Area Boundary... 3 PERFORMANCE CRITERIA... 6 EXISTING CONDITIONS... 7 Existing Setting... 7 Existing Traffic Volumes and Levels of Service... 7 CUMULATIVE OPENING YEAR NO PROJECT CONDITIONS Cumulative Opening Year No Project Level of Service Analysis PROPOSED PROJECT Trip Generation Trip Distribution and Assignment EXISTING PLUS PROJECT CONDITIONS CUMULATIVE OPENING YEAR PLUS PROJECT CONDITIONS SITE ACCESS ANALYSIS TRAFFIC SIGNAL WARRANT ANALYSIS CONCLUSIONS APPENDICES A: Existing Traffic Counts B: ICU Level of Service Worksheets C: HCM Level of Service Worksheets D: Cumulative Projects P:\WSH1601\LSA tech studies\traffic\tia\tia docx «08/23/17» i
6 T R A F F I C I M P A C T A N A L Y S I S A U G U S T 2017 K I L L E F E R S Q U A R E S P E C I F I C P L A N C I T Y O F O R A N G E, C A L I F O R N I A FIGURES FIGURES AND TABLES Figure 1: Project Location and Study Area Intersections... 4 Figure 2: Site Plan... 5 Figure 3: Existing Geometrics and Traffic Control... 8 Figure 4: Existing Peak-Hour Volumes... 9 Figure 5: Cumulative Opening Year (2019) Peak-Hour Volumes Figure 6: A.M. Trip Distribution and Assignment Figure 7: P.M. Trip Distribution and Assignment Figure 8: Existing Plus Project Peak-Hour Volumes Figure 9: Cumulative Opening Year (2019) Plus Project Peak-Hour Volumes TABLES Table A: Existing Intersection LOS Summary... 7 Table B: Cumulative Opening Year (2019) Intersection LOS Summary Table C: Killefer Student Housing Trip Generation Table D: Existing Plus Project Intersection LOS Summary Table E: Cumulative Opening Year (2019) Plus Project Intersection LOS Summary P:\WSH1601\LSA tech studies\traffic\tia\tia docx «08/23/17» ii
7 T R A F F I C I M P A C T A N A L Y S I S A U G U S T 2017 K I L L E F E R S Q U A R E S P E C I F I C P L A N C I T Y O F O R A N G E, C A L I F O R N I A KILLEFER SQUARE SPECIFIC PLAN TRAFFIC IMPACT ANALYSIS LSA has prepared the following analysis to identify the traffic impacts resulting from the assumed construction of 80 units of student housing (project), which represents the maximum build-out of the Killefer Square Specific Plan, at 541 North Lemon Street in the City of Orange (City), County of Orange, California. LSA has prepared this analysis consistent with the City of Orange Traffic Impact Analysis Guidelines (August 2007) and the requirements of the California Environmental Quality Act. The Scope of Work for this analysis was reviewed and approved by City Traffic Engineering staff (April 2016) prior to its preparation. This study was then revised based on City provided comments in a letter dated May 8, Revisions included the expansion of the study area, updates to the cumulative project list, and project trip generation assumptions. This Traffic Impact Analysis (TIA) focuses on the daily, a.m. peak-hour, and p.m. peak-hour levels of service (LOS) at eight intersections. Project impacts are determined based on analysis of the following scenarios: 1. Existing 2. Existing Plus Project 3. Cumulative (2019) 4. Cumulative Plus Project INTRODUCTION The existing 1.70-acre project area contains the currently vacant Killefer Elementary School historic building, two ancillary school structures on the north and south sides of the school building, and associated parking. The school is at 541 North Lemon Street, north of Walnut Avenue and bounded by Lemon Street on the west and Olive Street on the east. The project site is approximately 1.5 blocks (approximately 800 feet [ft]) northwest of Chapman University (University), as shown on Figure 1. The site is within a mixed-use area that includes single-family residential uses, multifamily residential uses, schools, and a park. Richland Continuation High School is north of the project site and currently shares a parking area with the project site. PROJECT DESCRIPTION The project would permit up to 80 units (354 beds) of student housing and up to two levels of subterranean parking in addition to preserving the Killefer Elementary School building. The tallest structure proposed on the site would be four stories high (above ground surface). Access to the project would use one unsignalized driveway on Lemon Street. Figure 2 provides a site plan for the proposed student housing project. Study Area Boundary As illustrated on Figure 1, the study area includes the following intersections within the project vicinity: P:\WSH1601\LSA tech studies\traffic\tia\tia docx «08/23/17» 3

8 PROJECT SITE LEGEND - Study Area Intersection # FIGURE 1 0 N 500 FEET SOURCE: ESRI 1000 I:\WSH1601\G\Traffic\Location&Study Ints.cdr (8/24/2017) Killefer Square Specific Plan Project Location and Study Area Intersections
9 FIGURE 2 N FEET SOURCE: Gilbert Engineering & Associates, Inc. I:\WSH1601\G\Traffic\Site Plan.cdr (8/21/2017) Killefer Square Specific Plan Site Plan
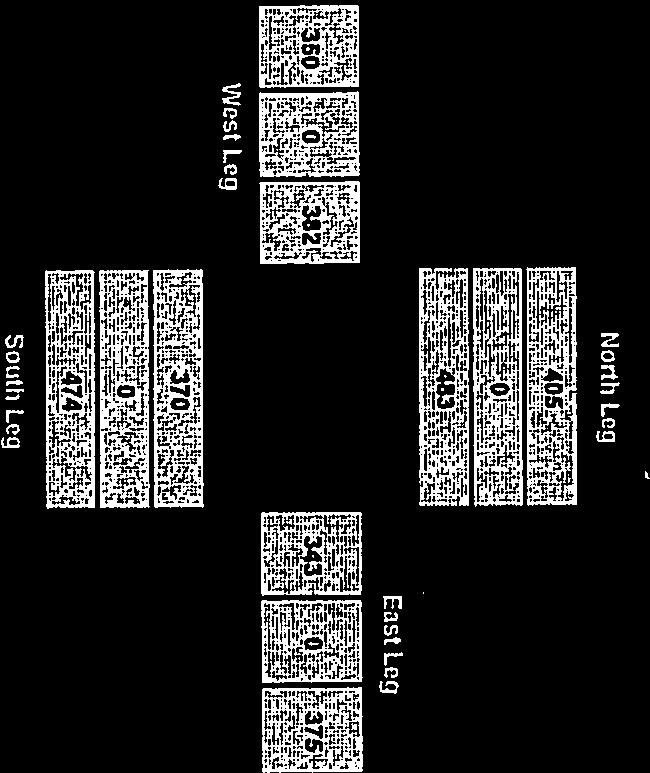
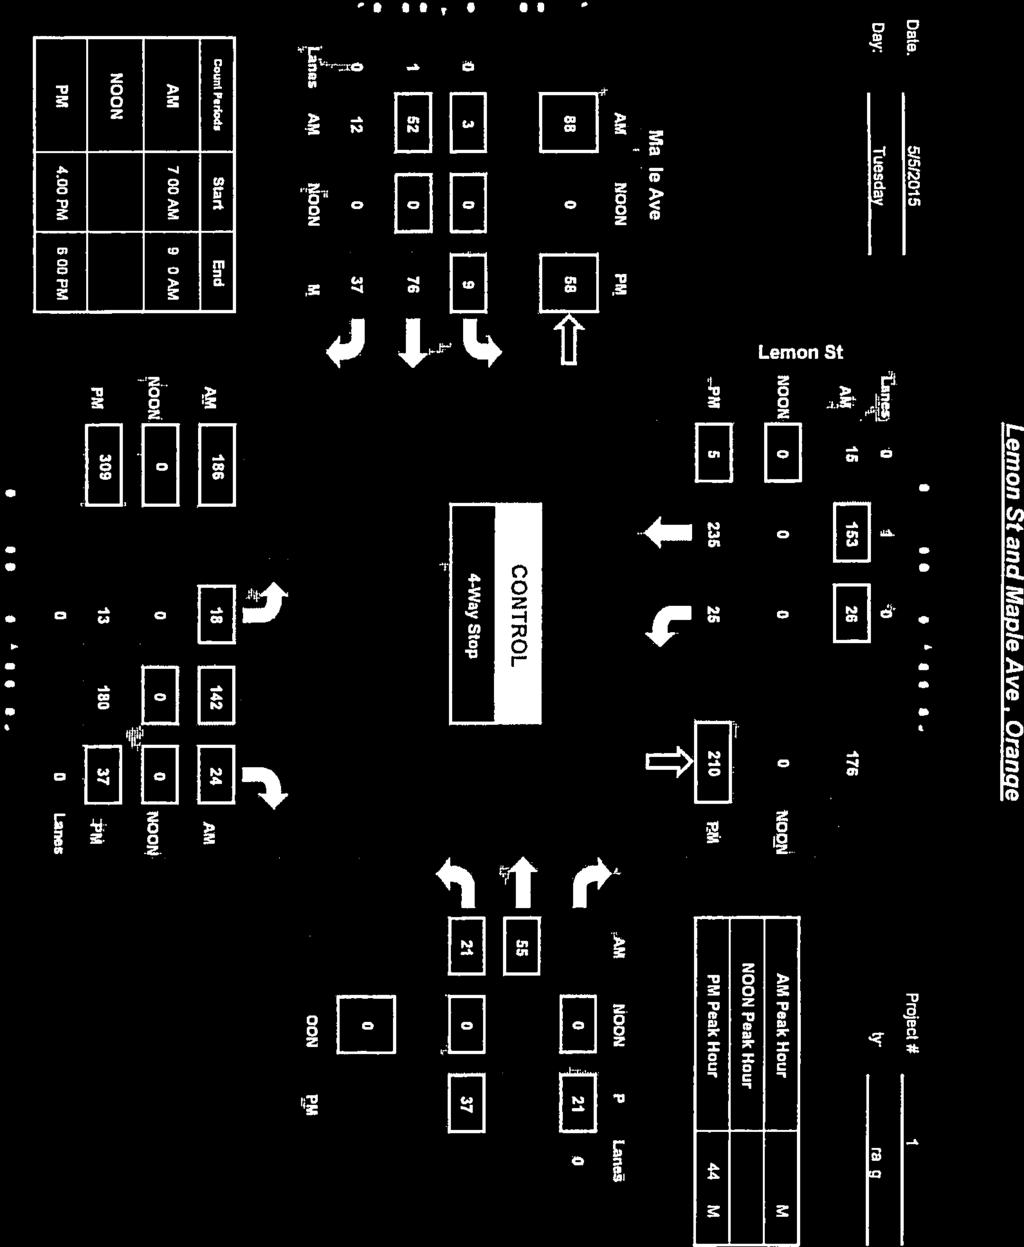
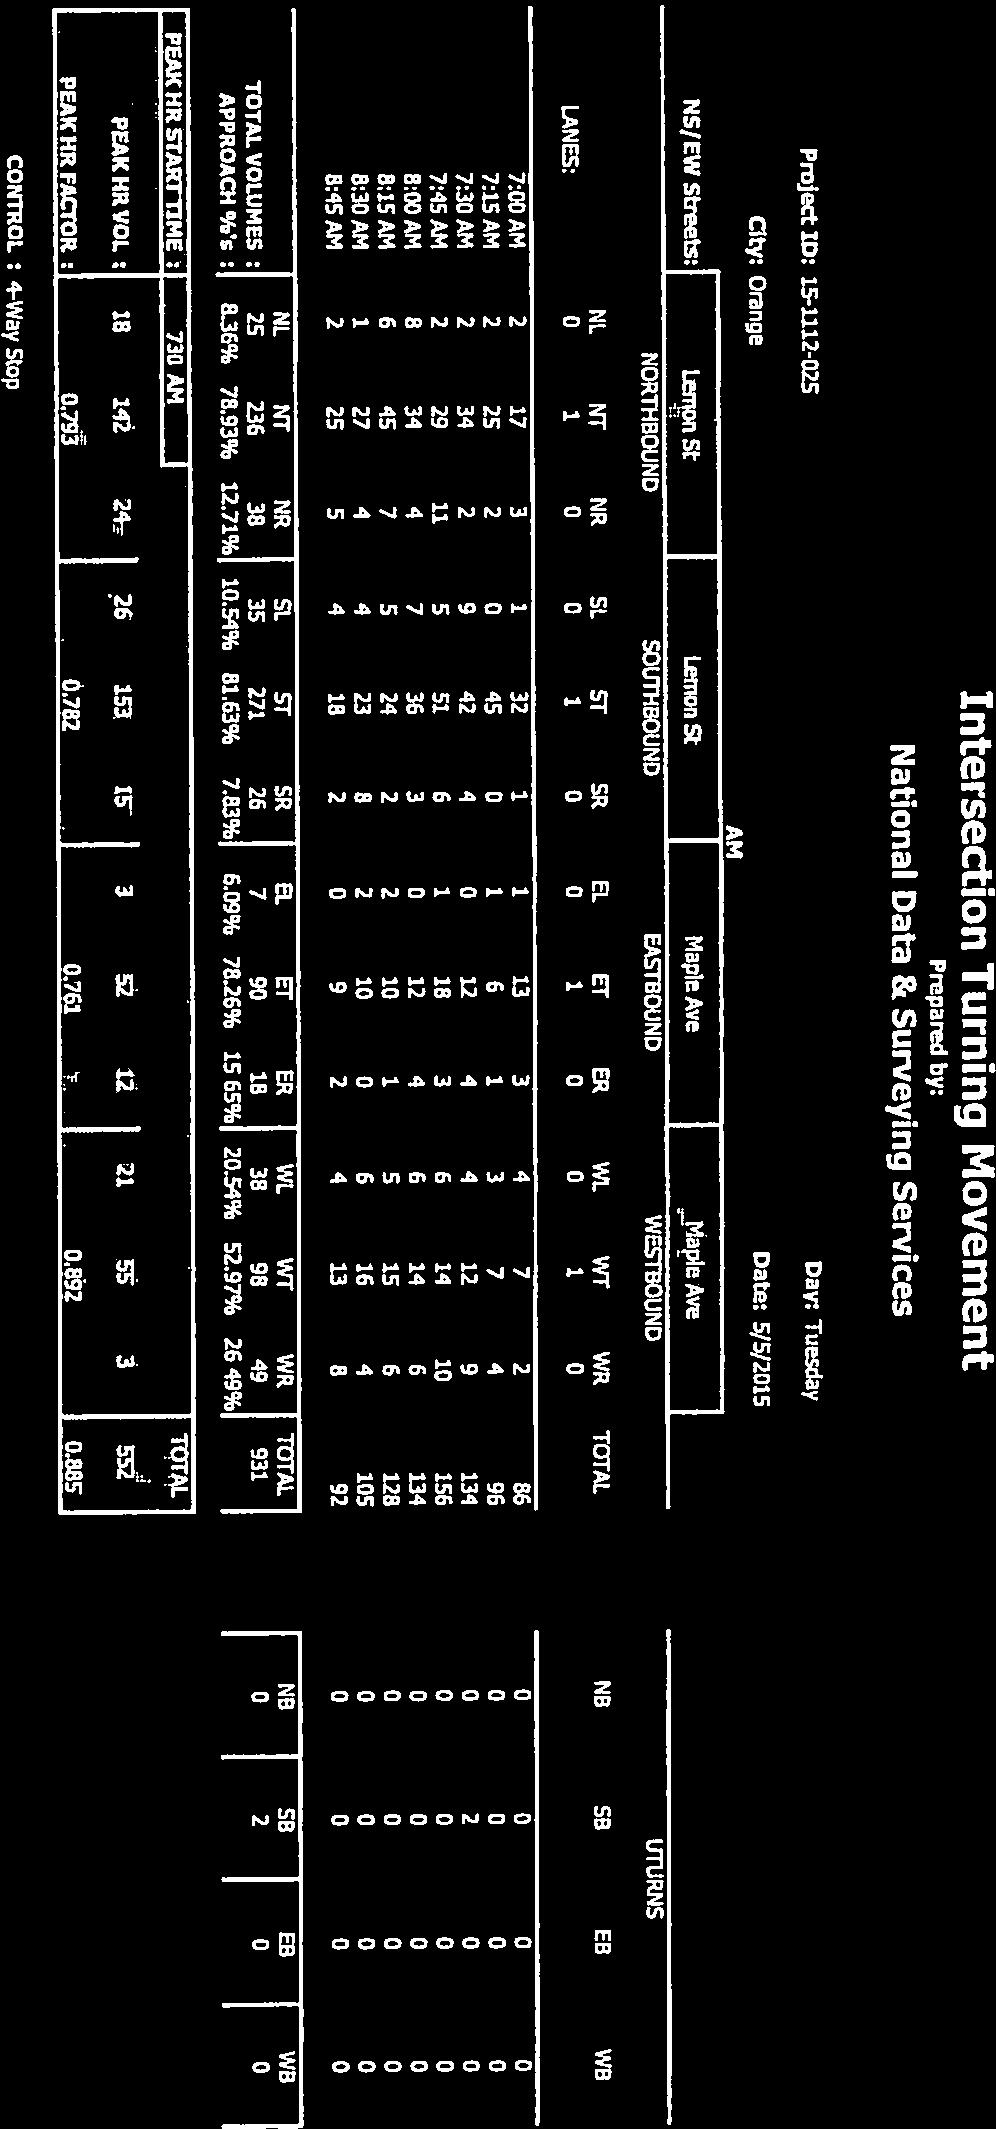
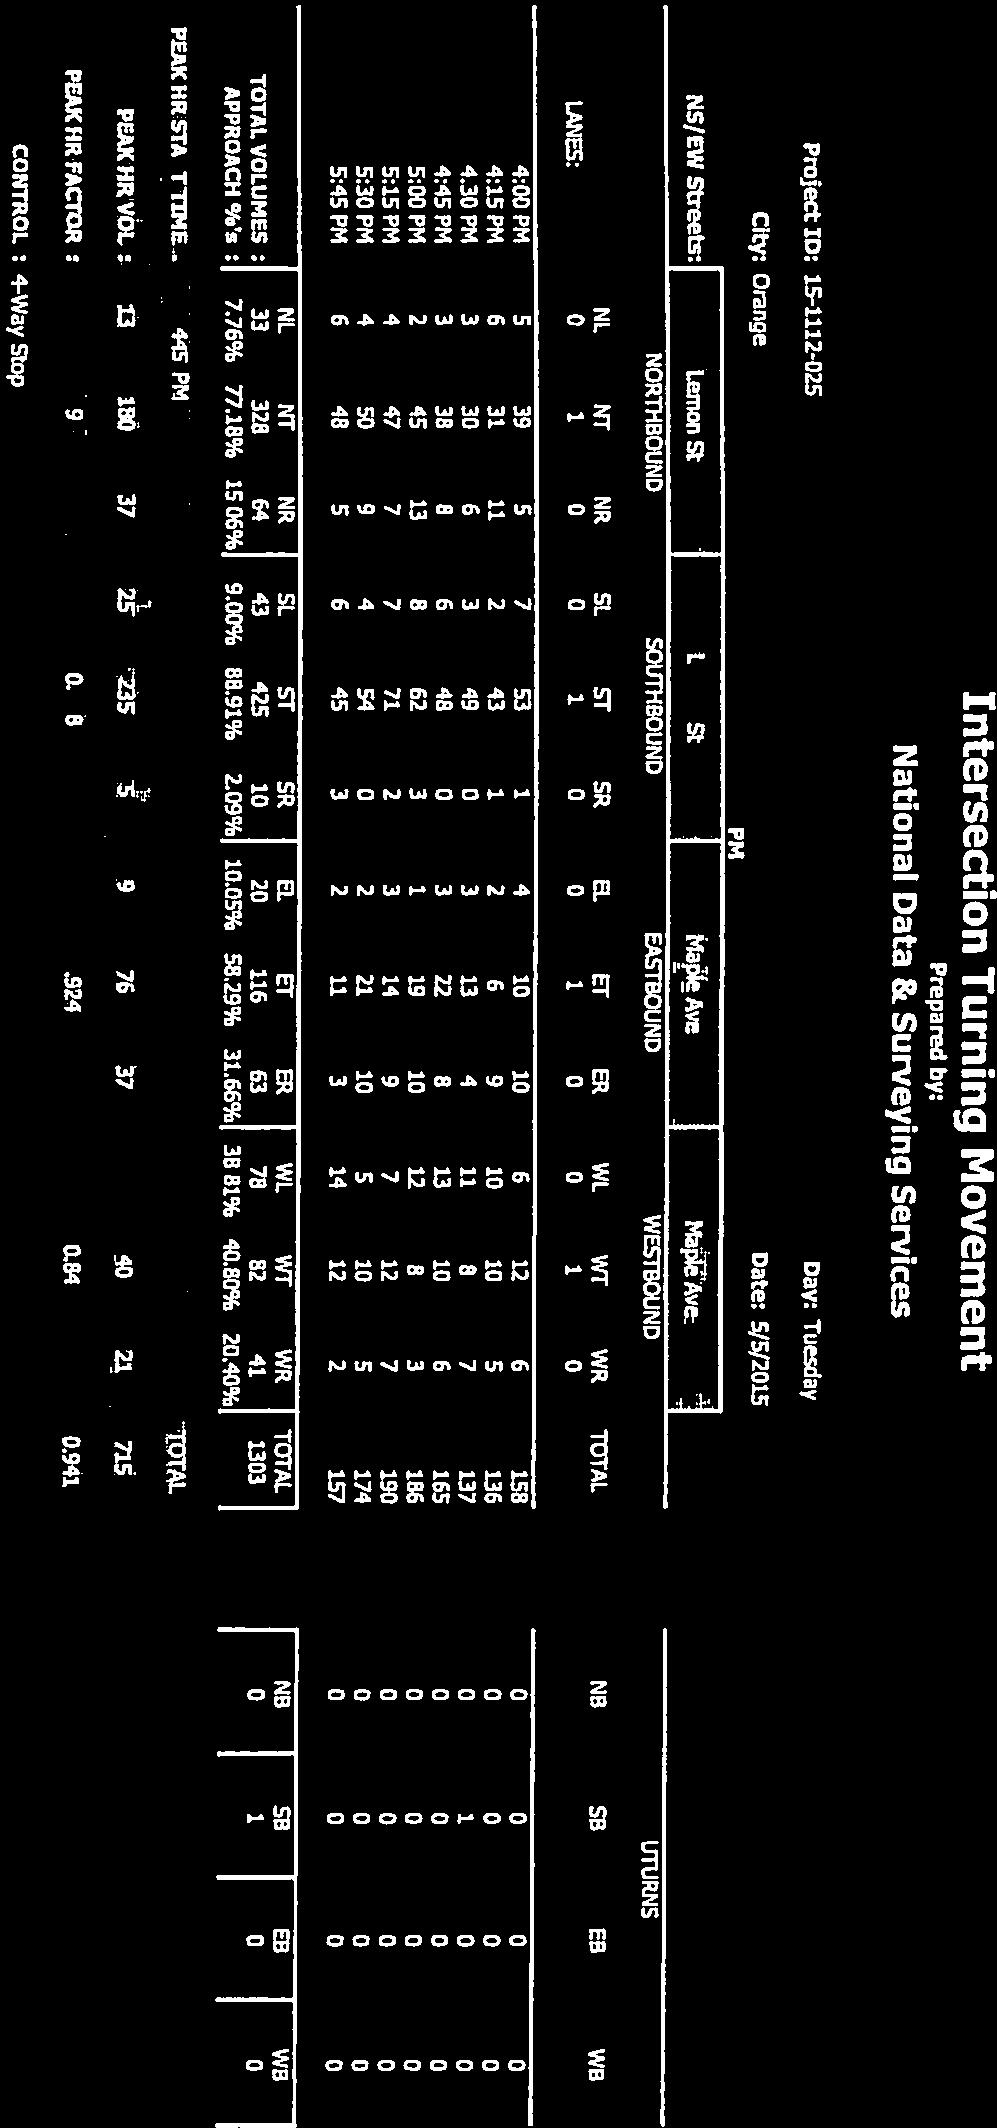
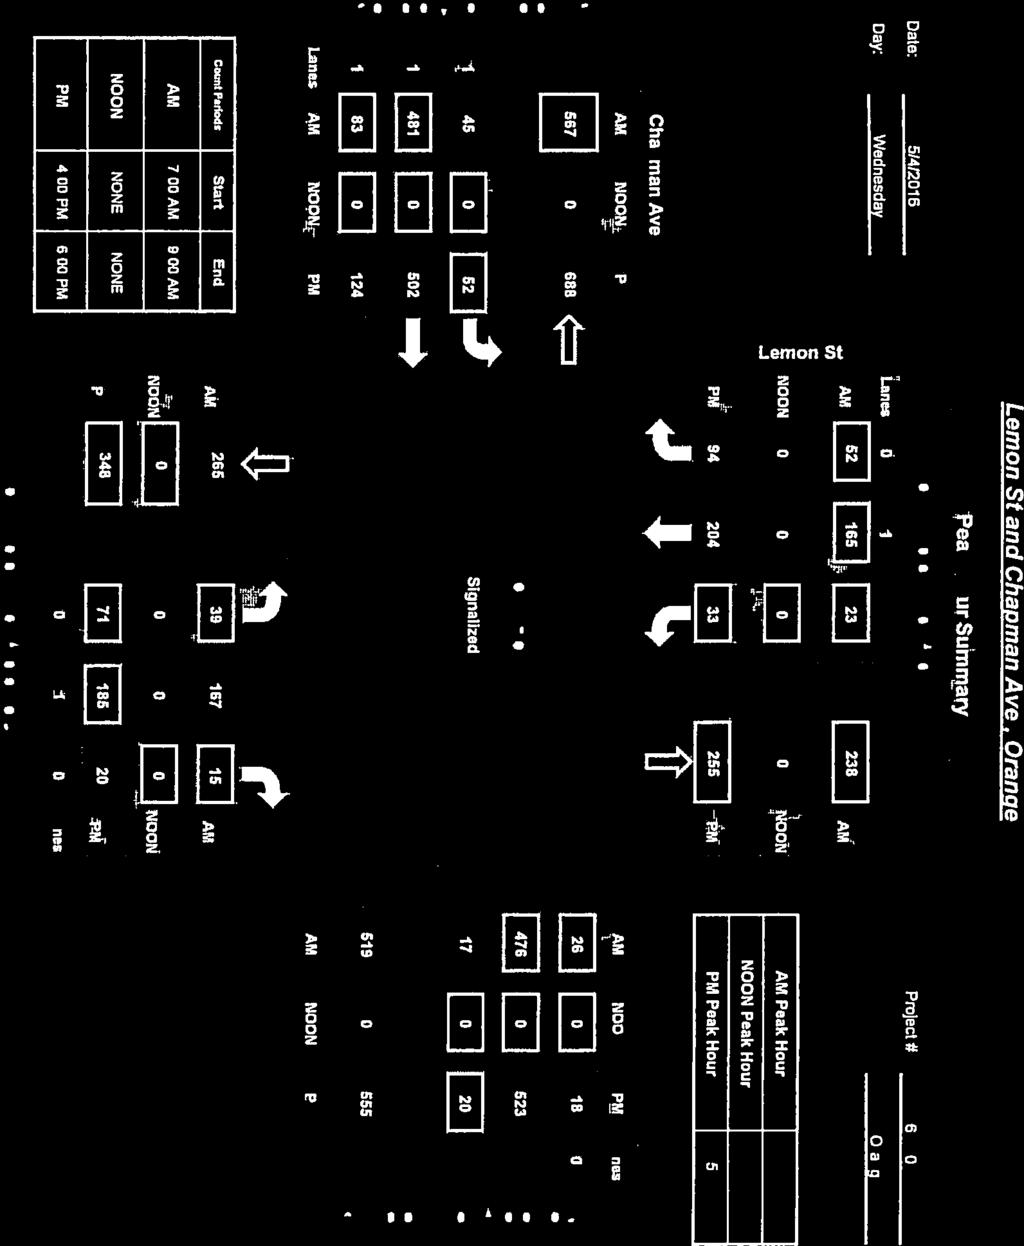
10 T R A F F I C I M P A C T A N A L Y S I S A U G U S T 2017 K I L L E F E R S Q U A R E S P E C I F I C P L A N C I T Y O F O R A N G E, C A L I F O R N I A 1. Main Street/Walnut Avenue 2. Batavia Street/Walnut Avenue 3. Lemon Street/Walnut Avenue 4. Glassell Street/Walnut Avenue 5. Orange Street/Walnut Avenue 6. Lemon Street/Palm Avenue 7. Lemon Street/Maple Avenue 8. Lemon Street/Chapman Avenue PERFORMANCE CRITERIA To determine the peak-hour intersection operations at signalized intersections within the study area, intersection capacity utilization (ICU) methodology was used. The ICU methodology compares the volume-to-capacity (v/c) ratios of conflicting turn movements at an intersection, sums these critical conflicting v/c ratios for each intersection approach, and determines the overall ICU. The resulting ICU is expressed in terms of LOS, where LOS A represents free-flow activity and LOS F represents overcapacity operation. According to the City s TIA Guidelines, LOS at an intersection is considered unsatisfactory when the ICU exceeds 0.90 (LOS D). The relationship of ICU (v/c ratio) to LOS is demonstrated in the following table. LOS Signalized ICU (v/c ratio) Unsignalized Intersection Delay (seconds) A B >10.0 and 15.0 C >15.0 and 25.0 D >25.0 and 35.0 E >35.0 and 50.0 F > 1.00 >50.0 ICU = intersection capacity utilization LOS = level of service v/c = volume-to-capacity A project impact at a signalized intersection occurs when the LOS changes from an acceptable LOS (LOS A through D) to LOS E or F, or if the project increases the ICU by 0.01 or more at an already unacceptable LOS. In addition to the ICU methodology of calculating signalized intersection LOS, the California Department of Transportation (Caltrans) Highway Capacity Manual (HCM) 2010 methodology was used to determine the LOS at unsignalized study area intersections. The HCM 2010 unsignalized intersection methodology presents LOS in terms of control delay in seconds per vehicle. The resulting delay is expressed in terms of LOS, as in the ICU methodology. The relationship of delay to LOS is demonstrated in the above table. P:\WSH1601\LSA tech studies\traffic\tia\tia docx «08/23/17» 6
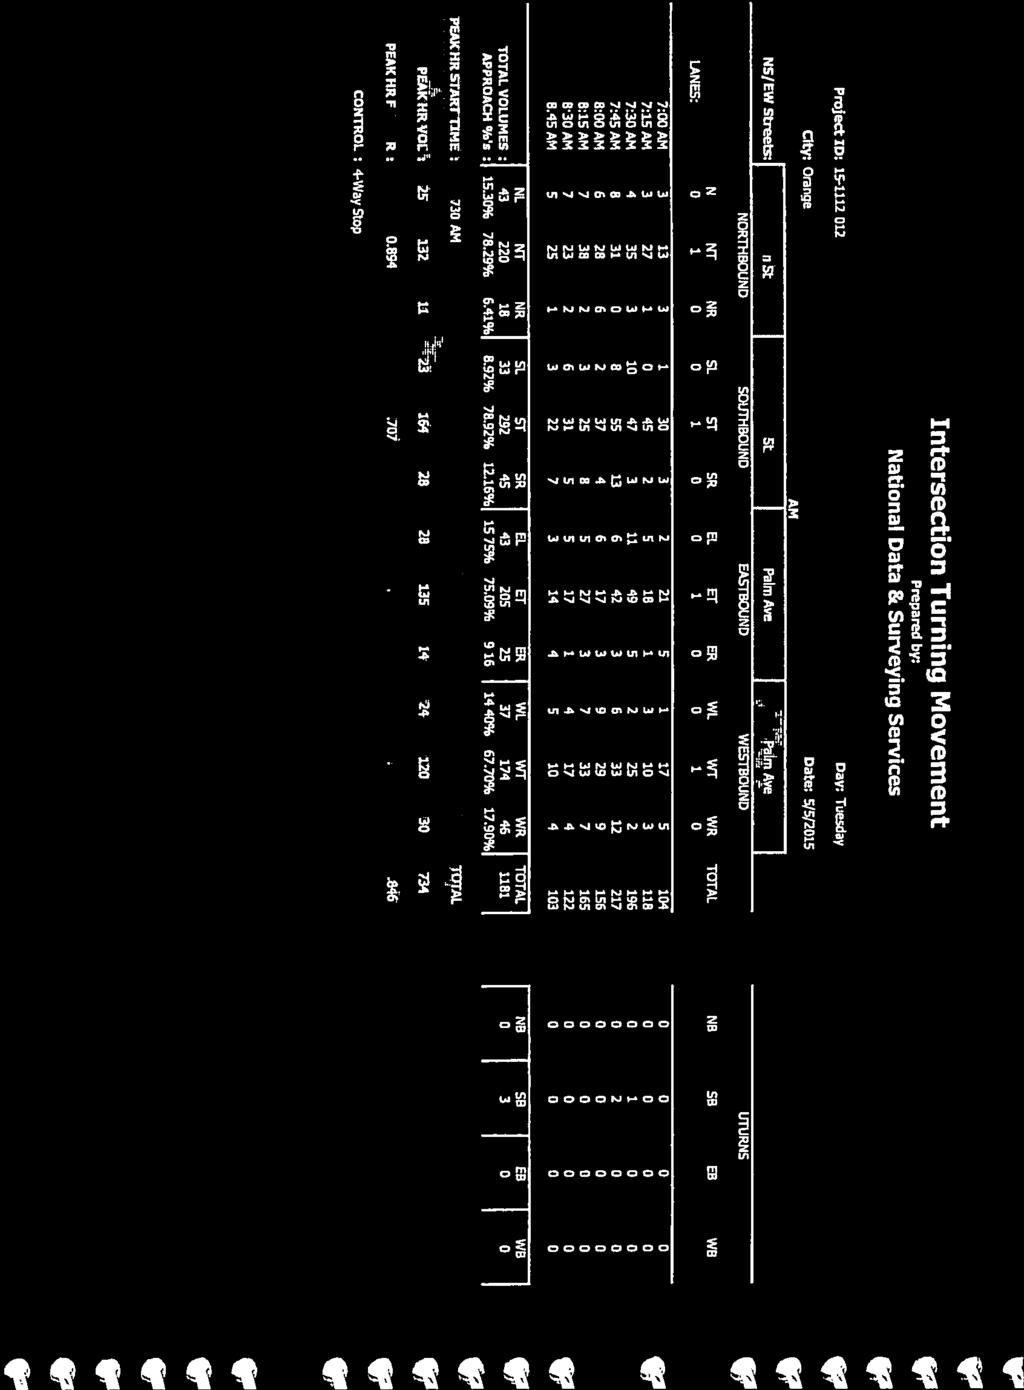
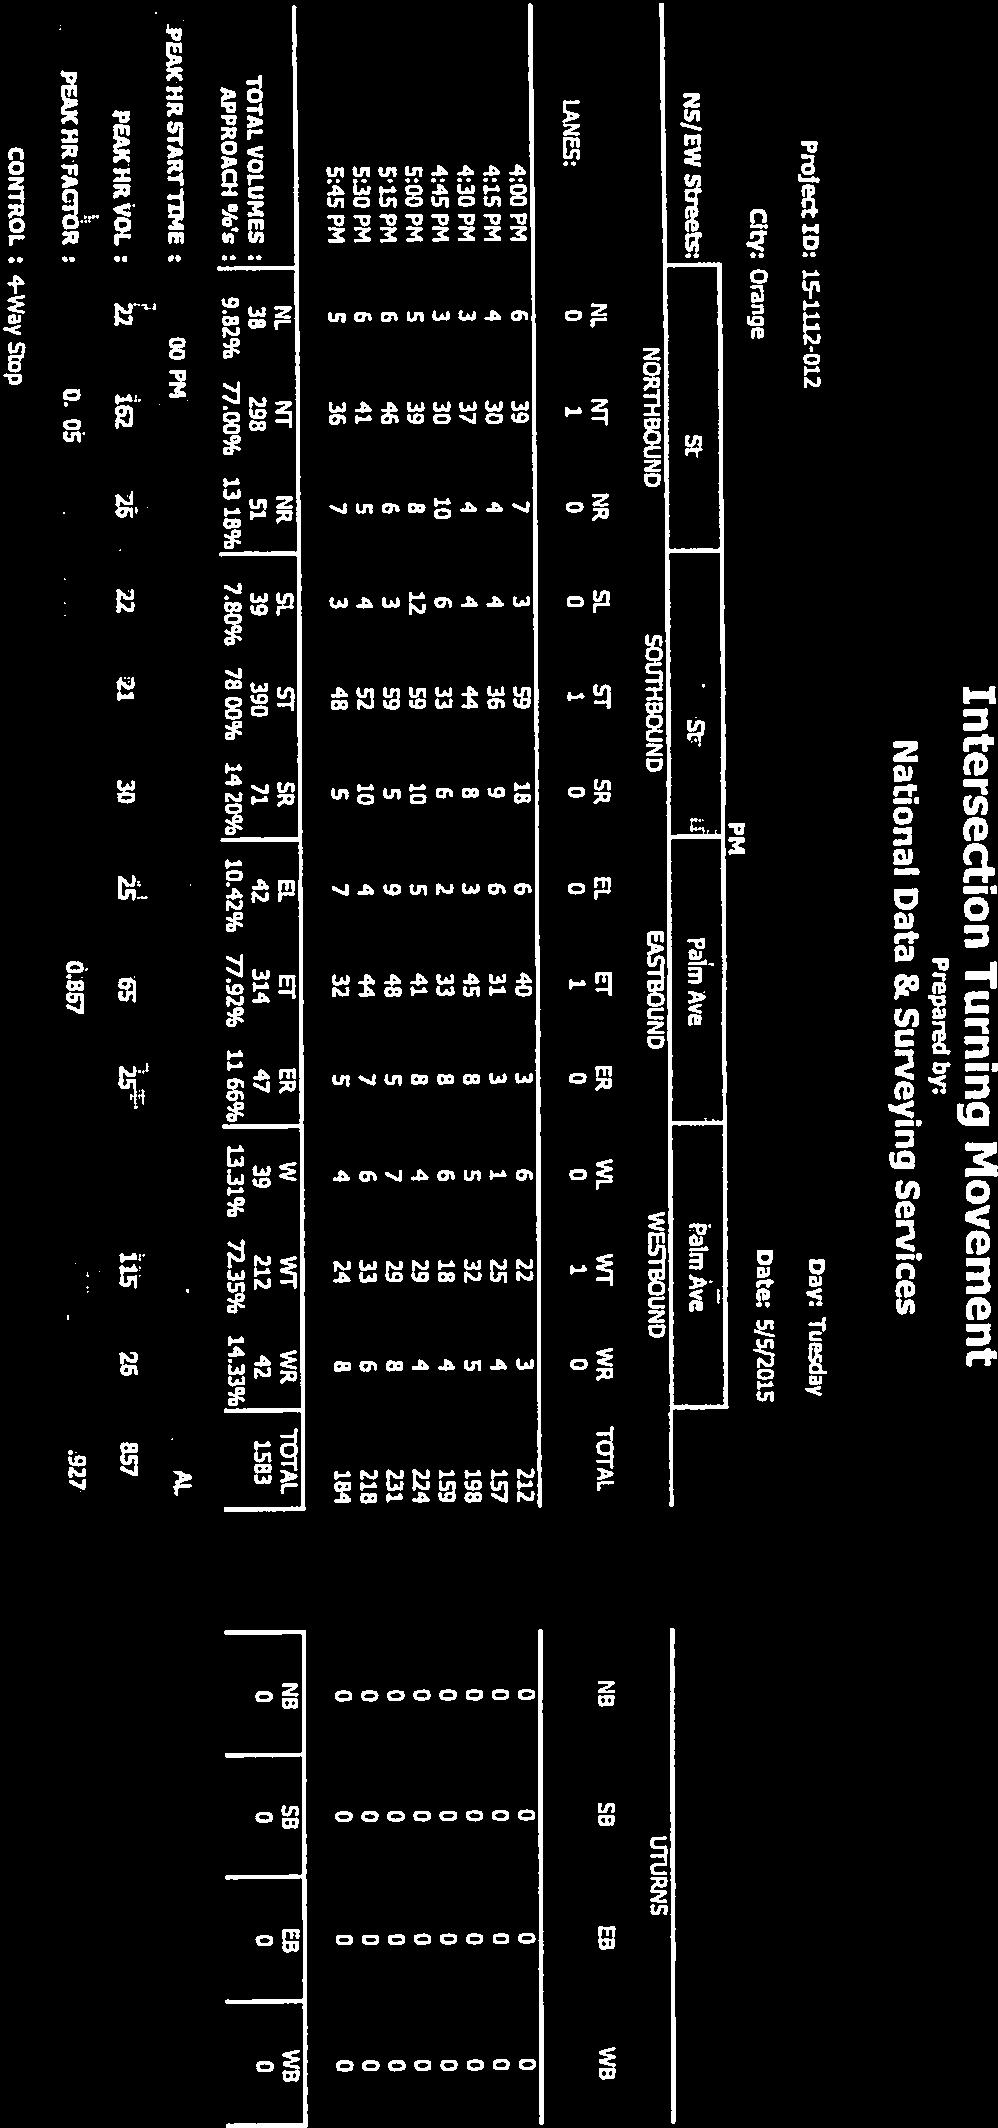
11 T R A F F I C I M P A C T A N A L Y S I S A U G U S T 2017 K I L L E F E R S Q U A R E S P E C I F I C P L A N C I T Y O F O R A N G E, C A L I F O R N I A A project impact at an unsignalized intersection occurs when the LOS changes from an acceptable LOS (LOS A through D) to LOS E or F, or if the impact of the development is greater than or equal to 10 percent of the existing delay at an already unacceptable LOS and the intersection meets a signal warrant. EXISTING CONDITIONS Existing Setting The project site is bounded by Lemon Street on the west and Olive Street on the east. These two streets are designated as Collector Streets in the City s General Plan. Collector streets are two-lane roadways (without medians) that gather and distribute traffic to higher-capacity streets (e.g., Walnut Avenue). Intersections along these streets are typically stop-controlled. On-street parking is allowed on both of these streets, and sidewalks are provided on both sides. In the project vicinity, Glassell Street is designated as a Primary Arterial, except for the segment between La Veta Avenue and Walnut Avenue, where it is designated as a Collector Street. Walnut Avenue is designated as a Collector Street. Figure 3 shows the existing geometries and traffic control at study area intersections. Existing Traffic Volumes and Levels of Service National Data & Surveying Services conducted existing traffic counts for the study area intersections and roadway segments on Tuesday, April 12, 2016, when the University and the nearby Orange Unified School District schools were in session. Due to the timing of the revised scope and request to add additional intersections to the study area, City staff provided additional count data for the intersections of Lemon Street at Palm Avenue, Maple Avenue, and Chapman Avenue. These City provided counts were collected on May 5, 2015, and May 4, The existing traffic counts are provided in Appendix A. Figure 4 shows the existing peak-hour volumes at the study area intersections. The ICU and HCM worksheets for existing (and all future) conditions are included in Appendices B and C, respectively. A summary of existing intersection LOS is presented in Table A. As this table indicates, all study area intersections currently operate at satisfactory LOS (LOS D or better). Table A: Existing Intersection LOS Summary Study Area AM Peak Hour PM Peak Hour No. Intersection ICU/Delay LOS ICU/Delay LOS 1 Main Street/Walnut Avenue 0.63 B 0.68 B 2 Batavia Street/Walnut Avenue 0.51 A 0.46 A 3 Lemon Street/Walnut Avenue HCM 16.3 C 16.3 C 4 Glassell Street/Walnut Avenue 0.54 A 0.63 B 5 Orange Street/Walnut Avenue HCM 17.7 C 21.6 C 6 Lemon Street/Palm Avenue HCM 11.4 B 12.0 B 7 Lemon Street/Maple Avenue HCM 9.3 A 10.3 B 8 Lemon Street/Chapman Avenue 0.51 A 0.58 A HCM = Highway Capacity Manual ICU = Intersection Capacity Utilization LOS = level of service P:\WSH1601\LSA tech studies\traffic\tia\tia docx «08/23/17» 7

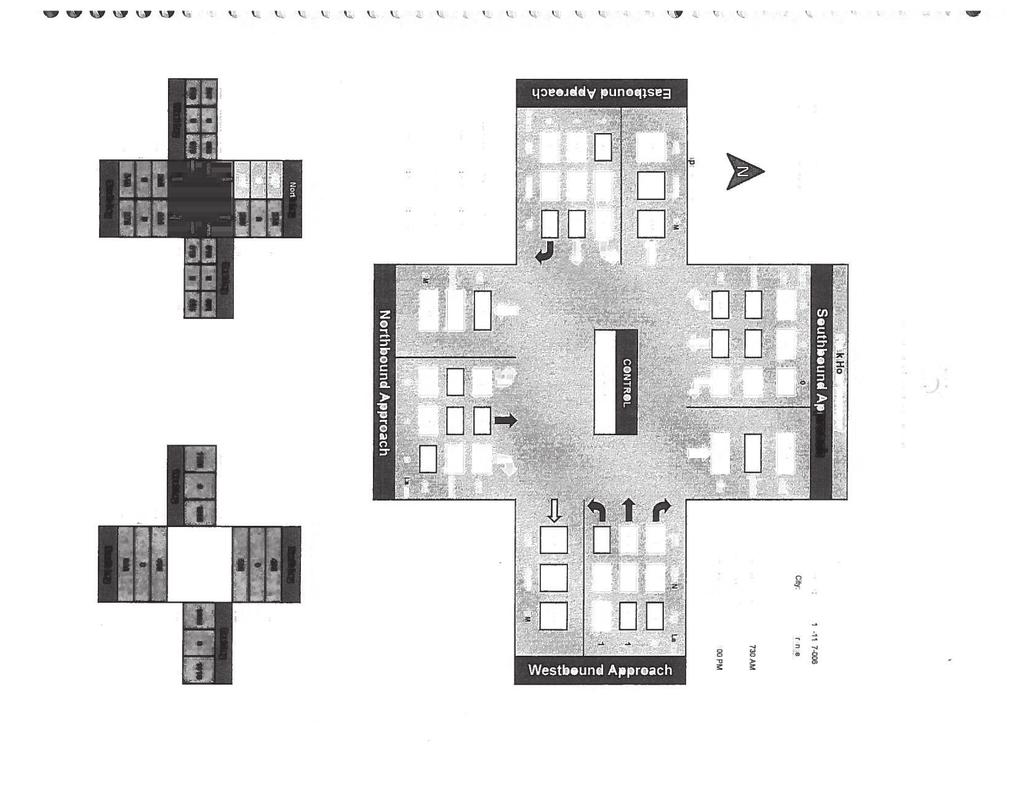
12 wvt ad ace acd 1 Main Street/Walnut Avenue wvt ad ad acd 2 Batavia Street/Walnut Avenue y f wt f y ad f f ad ae be be 3 Lemon Street/Walnut Avenue 4 Glassell Street/Walnut Avenue 5 Orange Street/Walnut Avenue y f y be d d xu ad d be f d f be be ace d 6 Lemon Street/Palm Avenue 7 Lemon Street/Maple Avenue 8 Lemon Street/Chapman Avenue FIGURE 3 LEGEND Killefer Square Specific Plan Signal Existing Geometrics and Traffic Control Stop Sign Defacto Right Turn d P:\WSH1601\LSA tech studies\traffic\xls\fig 3 geometrics.xls 8/24/2017
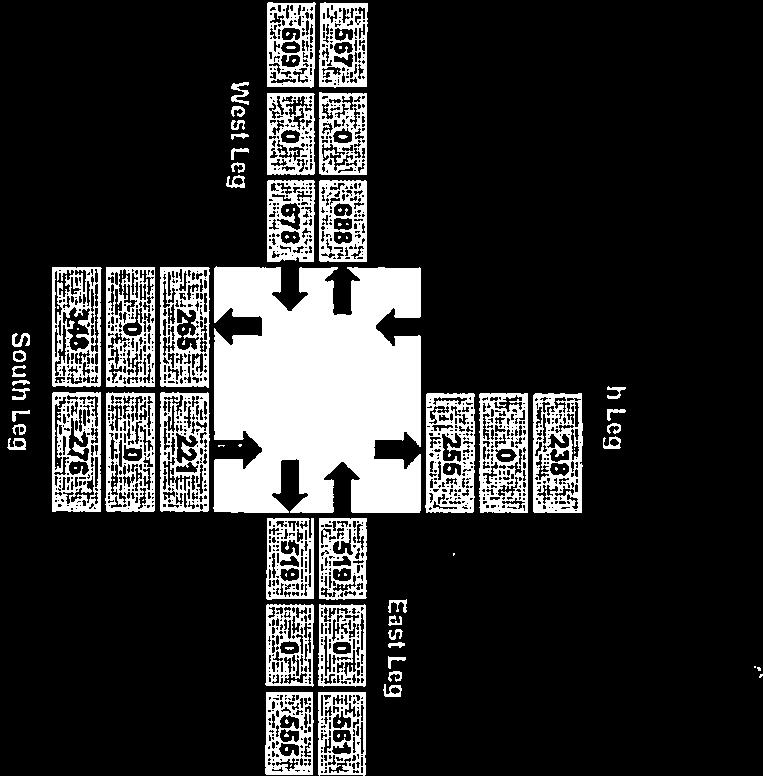
13 12 / / / / / / Main Street/Walnut Avenue 29 / / / / / / 31 2 Batavia Street/Walnut Avenue 21 / / 42 3 / / / / / / / / / 42 3 / / / / / / / / / / / / / / / / / / / / / / / / / 1 6 / / 33 4 / / / 42 5 / / / / / / 57 7 / Lemon Street/Walnut Avenue 4 Glassell Street/Walnut Avenue 5 Orange Street/Walnut Avenue 30 / / / / / / / / / / 25 3 / 9 45 / / / / / / / / / / / / / / / / / / / / / / / / / 20 6 Lemon Street/Palm Avenue 7 Lemon Street/Maple Avenue 8 Lemon Street/Chapman Avenue FIGURE 4 XXX / YYY AM / PM Volume Killefer Square Specific Plan Existing Peak-Hour Volumes P:\WSH1601\LSA tech studies\traffic\xls\fig 4 Existing ITMs 2.xls (8/24/2017)
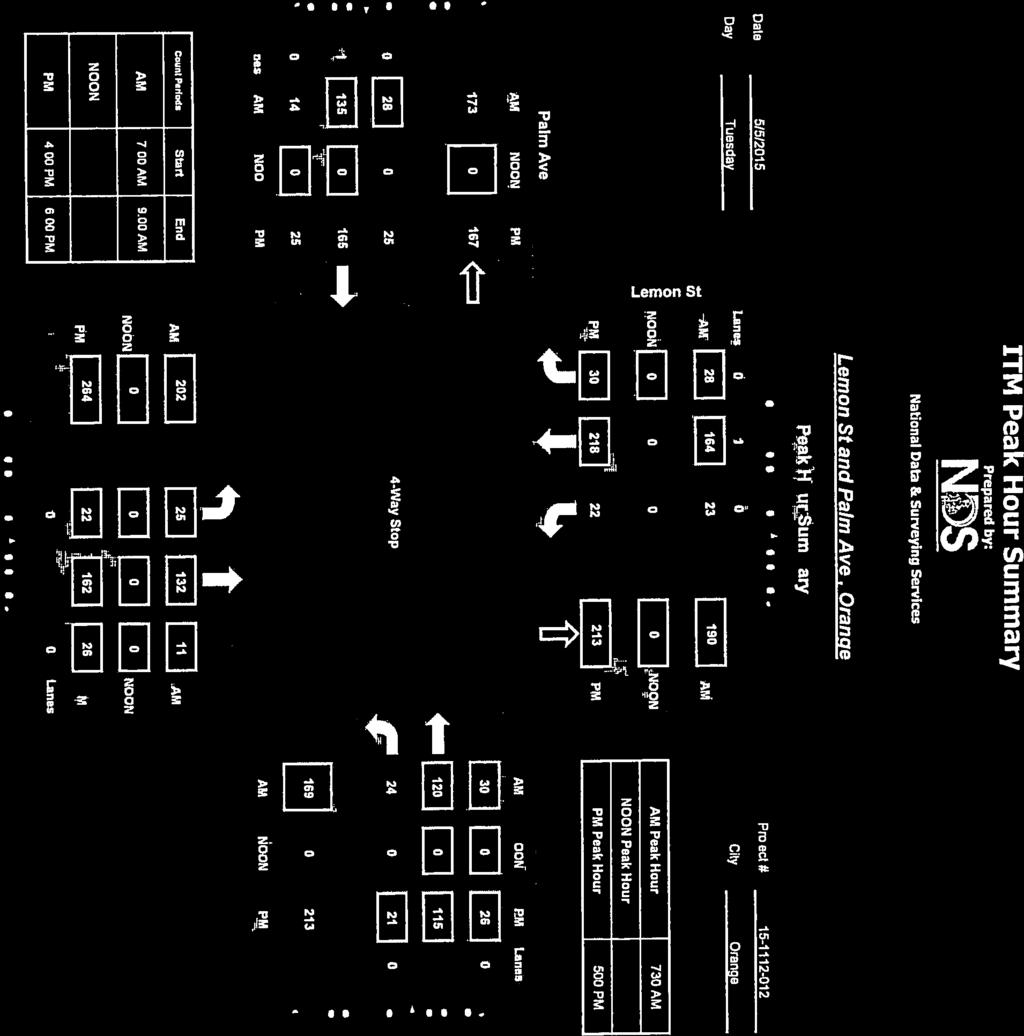
14 T R A F F I C I M P A C T A N A L Y S I S A U G U S T 2017 K I L L E F E R S Q U A R E S P E C I F I C P L A N C I T Y O F O R A N G E, C A L I F O R N I A CUMULATIVE OPENING YEAR NO PROJECT CONDITIONS According to the applicant, the project will be completed by In order to develop a cumulative opening year (2019) condition, an ambient growth rate of 1 percent per year (a total of 3 percent) was applied to existing traffic volumes to account for regional growth between the year of existing counts and the project completion year. Additionally, anticipated traffic from other committed and/or approved (cumulative) developments was added. Prior to the preparation of this analysis, LSA obtained information regarding approved and pending projects from the City Planning Department (May 2016). This list of cumulative projects was refined through coordination with City staff based on the anticipated contribution to traffic within the study area. As a result, several cumulative projects were included as part of this analysis because they have the greatest potential to add traffic within the study area. Further updates to this list were provided by City staff in their May 2017 letter. Updates included the removal of a cumulative project that is not anticipated to be completed and the addition of two new projects. The updated cumulative project list is as follows: Urth Caffé (southwest corner of Glassell Street and Chapman Avenue) Old Town Gateway (west side of Cypress Street, north of Chapman Avenue) Chapman Villa Park Orchards Packing House (west side of Cypress Street, between Sycamore Avenue and Palm Avenue) Chapman Villa Park Orchards West Residential Village (north side of Sycamore Avenue, east of Center Street) Quality Aluminum Forge (west side of Cypress Street, between Collins Avenue and Walnut Avenue) Lemon Grove (west side of Lemon Street, between Hoover Avenue and Wilson Avenue) Chapman Center for Science and Technology (south side of Walnut Avenue, between Grand Street and Center Street) Chapman University Recreation/Tennis Center (north side of Palm Avenue, between Cypress Street and Lemon Street) Metrolink Parking Structure (southwest corner of Lemon Street and Maple Avenue) Santa Fe Depot Specific Plan (between Palmyra Avenue and Walnut Avenue, between Parker Street and Olive Street) The project trip distribution and assignment for the cumulative projects were manually assigned to the local roadway network based on regional trip destinations and the existing roadway network. The cumulative project trip generation potential and assignment to the study area are provided in Appendix D. Figure 5 shows the cumulative (2019) no project peak-hour volumes. P:\WSH1601\LSA tech studies\traffic\tia\tia docx «08/23/17» 10
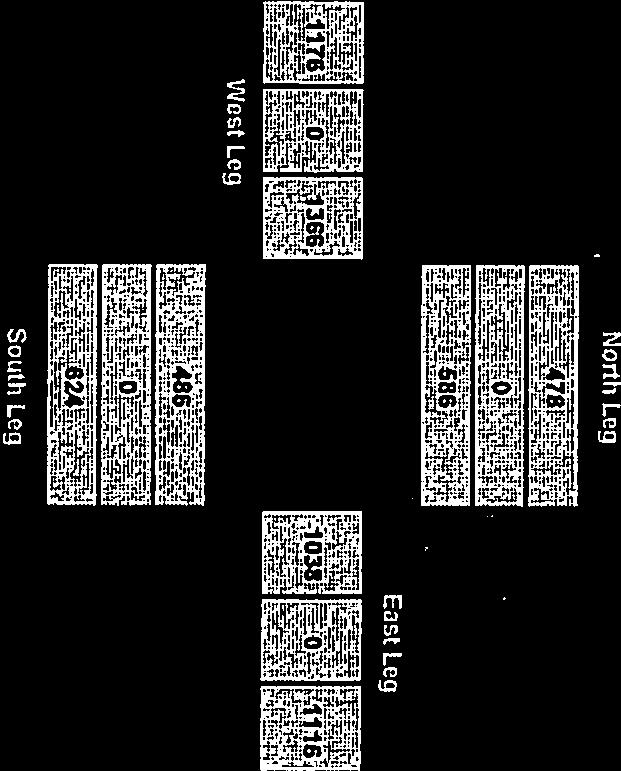
15 12 / / / / / / Main Street/Walnut Avenue 34 / / / / / / 46 2 Batavia Street/Walnut Avenue 22 / / 56 3 / / / / / / / / / 58 3 / / / / / / / / / / / / / / / / / / / / / / / / / 1 6 / / 39 4 / / / / / / / / / / Lemon Street/Walnut Avenue 4 Glassell Street/Walnut Avenue 5 Orange Street/Walnut Avenue 31 / / / / / / / / / / 27 3 / 9 76 / / / / / / / / / / / / / / / / / / / / / / / / / 21 6 Lemon Street/Palm Avenue 7 Lemon Street/Maple Avenue 8 Lemon Street/Chapman Avenue FIGURE 5 XXX / YYY AM / PM Volume Killefer Square Specific Plan Cumulative Opening Year (2019) Peak-Hour Volumes P:\WSH1601\LSA tech studies\traffic\xls\fig 5 OY ITMs.xls (8/24/2017)
16 T R A F F I C I M P A C T A N A L Y S I S A U G U S T 2017 K I L L E F E R S Q U A R E S P E C I F I C P L A N C I T Y O F O R A N G E, C A L I F O R N I A Cumulative Opening Year No Project Level of Service Analysis Table B summarizes the results of the cumulative a.m. and p.m. peak-hour LOS analysis for all study area intersections. Table B: Cumulative Opening Year (2019) Intersection LOS Summary Study AM Peak Hour PM Peak Hour Area No. Intersection ICU/Delay LOS ICU/Delay LOS 1 Main Street/Walnut Avenue 0.68 B 0.75 C 2 Batavia Street/Walnut Avenue 0.57 A 0.52 A 3 Lemon Street/Walnut Avenue HCM 22.3 C 24.2 C 4 Glassell Street/Walnut Avenue 0.61 A 0.72 C 5 Orange Street/Walnut Avenue HCM 20.4 C 28.5 D 6 Lemon Street/Palm Avenue HCM 12.6 B 14.5 B 7 Lemon Street/Maple Avenue HCM 10.0 A 11.9 B 8 Lemon Street/Chapman Avenue 0.59 A 0.69 A HCM = Highway Capacity Manual ICU = Intersection Capacity Utilization LOS = level of service As Table B indicates, all study area intersections would continue to operate at acceptable LOS (LOS D or better). PROPOSED PROJECT Trip Generation For the purposes of disclosing the approximate number of trips generated by the project, trip rates contained in the Institute of Transportation Engineers (ITE) Trip Generation Manual, 9 th Edition, were used to calculate the potential trip generation. Specifically, the apartment by unit land use was selected through coordination with City staff as the most appropriate rate for the project. It should be noted that this trip generation rate is based on non-student housing and therefore would overstate the trip generation potential of a student apartment use. As previously noted, the site is 1.5 blocks away from Chapman University, a distance that would lend itself to travel modes such as walking and biking. This estimate does not take credit for student trips to school that would be made via walking or biking and therefore presents a higher trip generation potential than would be expected. Table C shows the project trip generation. Table C: Killefer Student Housing Trip Generation Daily AM Peak Hour PM Peak Hour Land Use Size Unit Trips In Out Total In Out Total Trip Ratesˡ Apartments (220) DU Trip Generation Killefer Student Housing 80 DU ˡ Trip rates are based on the Institute of Transportation Engineers Trip Generation Manual, 9 th Edition (2012). P:\WSH1601\LSA tech studies\traffic\tia\tia docx «08/24/17» 12
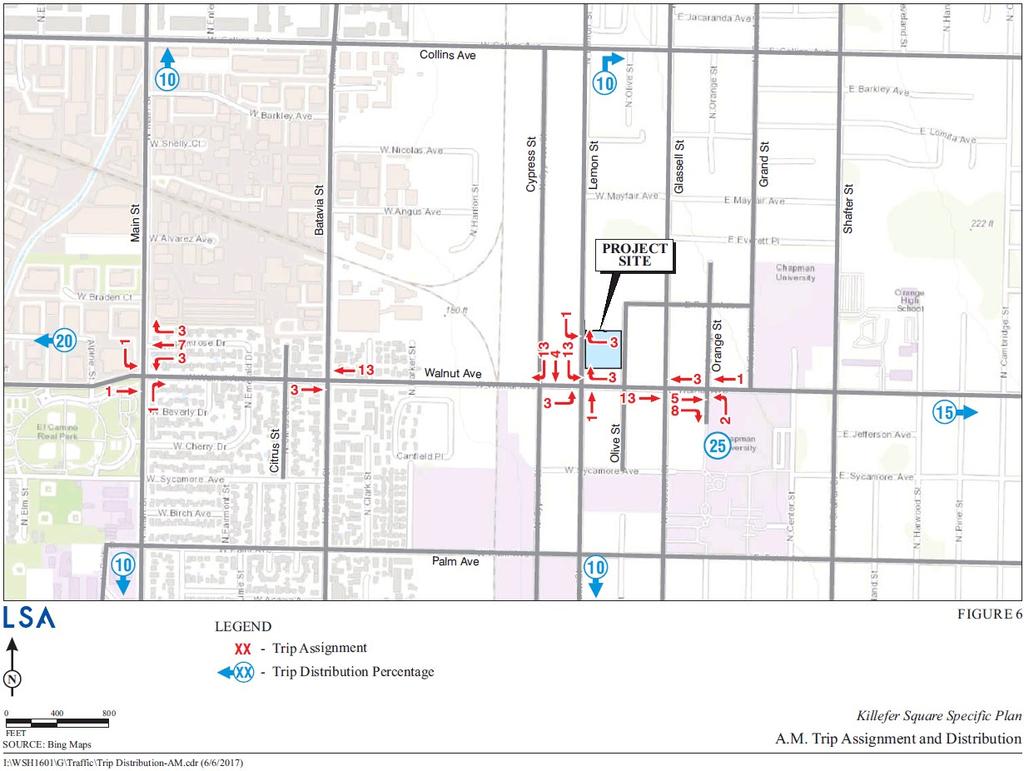
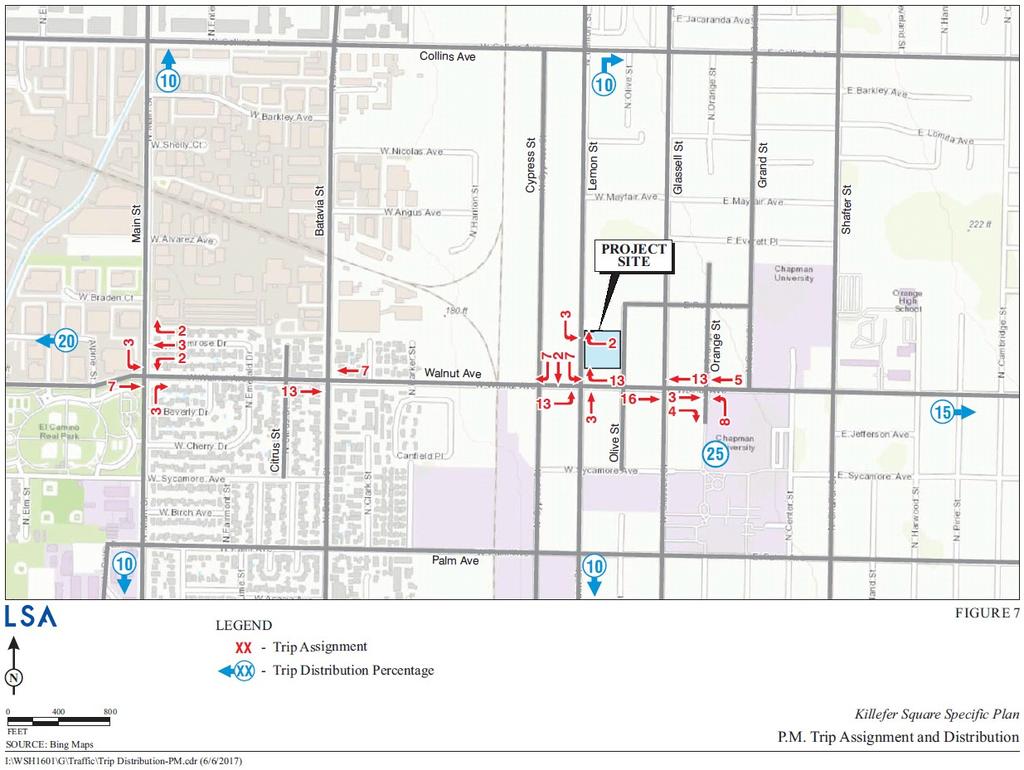
17 T R A F F I C I M P A C T A N A L Y S I S A U G U S T 2017 K I L L E F E R S Q U A R E S P E C I F I C P L A N C I T Y O F O R A N G E, C A L I F O R N I A As shown in Table C, the proposed project is forecast to generate 532 average daily trips (ADT), 41 a.m. peak-hour trips (8 inbound and 33 outbound), and 50 p.m. peak-hour trips (32 inbound and 18 outbound). Trip Distribution and Assignment The regional project trip distribution and assignment for a.m. and p.m. peak hours are illustrated on Figures 6 and 7 in blue. City staff reviewed and approved these percentages prior to the completion of the analysis (May 2017). As shown on Figures 6 and 7, 20 percent of the trips are destined to the south (via Lemon Street and Main Street) toward State Route 22, 20 percent are destined to the west (via Walnut Avenue) toward Interstate 5 and State Route 57, 40 percent are destined east (via Walnut Avenue) toward the Chapman University campus and State Route 55, and 20 percent are destined north (via Main Street and Lemon Street). The project trip distribution shows that approximately 25 percent of the project trips are oriented toward the University. Figures 6 and 7 illustrate the project vehicle trip assignment in red based on the net project trip generation and the trip distribution identified above. EXISTING PLUS PROJECT CONDITIONS To demonstrate the effect the project would have on the study area intersections in the existing condition, an existing plus project LOS analysis was prepared. This analysis assumed that the proposed project would add 532 ADT, 41 a.m. peak-hour trips, and 50 p.m. peak-hour trips (i.e., the trip generation for an 80-unit apartment) to the existing conditions. Figure 8 illustrates the existing plus project peak-hour volumes. Table D presents the summary of the existing plus project intersection LOS. As indicated in Table D, all study area intersections would continue to operate at satisfactory LOS (LOS D or better) Table D: Existing Plus Project Intersection LOS Summary Baseline Plus Project Study AM Peak Hour PM Peak Hour AM Peak Hour PM Peak Hour Area ICU/ ICU/ ICU/ ICU/ No. Intersection Delay LOS Delay LOS Delay LOS Delay LOS 1 Main Street/Walnut Avenue 0.63 B 0.68 B 0.64 B 0.69 B 2 Batavia Street/Walnut Avenue 0.51 A 0.46 A 0.52 A 0.48 A 3 Lemon Street/Walnut Avenue HCM 16.3 C 16.3 C 17.6 C 18.9 C 4 Glassell Street/Walnut Avenue 0.54 A 0.63 B 0.57 A 0.64 B 5 Orange Street/Walnut Avenue HCM 17.7 C 21.6 C 17.9 C 22.6 C 6 Lemon Street/Palm Avenue HCM 11.4 B 12.0 B 11.4 B 12.0 B 7 Lemon Street/Maple Avenue HCM 9.3 A 10.3 B 9.3 A 10.3 B 8 Lemon Street/Chapman Avenue 0.51 A 0.58 A 0.51 A 0.58 A HCM = Highway Capacity Manual ICU = Intersection Capacity Utilization LOS = level of service P:\WSH1601\LSA tech studies\traffic\tia\tia docx «08/24/17» 13
18 12 / / / / / / Main Street/Walnut Avenue 34 / / / / / / 46 2 Batavia Street/Walnut Avenue 22 / / 56 3 / / / / / / / / / 58 3 / / / / / / / / / / / / / / / / / / / / / / / / / 1 6 / / 39 4 / / / / / / / / / / Lemon Street/Walnut Avenue 4 Glassell Street/Walnut Avenue 5 Orange Street/Walnut Avenue 31 / / / / / / / / / / 27 3 / 9 76 / / / / / / / / / / / / / / / / / / / / / / / / / 21 6 Lemon Street/Palm Avenue 7 Lemon Street/Maple Avenue 8 Lemon Street/Chapman Avenue FIGURE 5 XXX / YYY AM / PM Volume Killefer Square Specific Plan Cumulative Opening Year (2019) Peak-Hour Volumes P:\WSH1601\LSA tech studies\traffic\xls\fig 5 OY ITMs.xls (8/24/2017)
19
20
21 15 / / / / / / Main Street/Walnut Avenue 29 / / / / / / 31 2 Batavia Street/Walnut Avenue 24 / / 42 3 / / / / / / / / / 42 3 / / / / / / / / / / / / / / / / / / / / / / / / / 1 7 / / 33 4 / / / 42 7 / / / / / / 57 7 / Lemon Street/Walnut Avenue 4 Glassell Street/Walnut Avenue 5 Orange Street/Walnut Avenue 30 / / / / / / / / / / 25 3 / 9 45 / / / / / / / / / / / / / / / / / / / / / / / / / 20 6 Lemon Street/Palm Avenue 7 Lemon Street/Maple Avenue 8 Lemon Street/Chapman Avenue FIGURE 8 XXX / YYY AM / PM Volume Killefer Square Specific Plan Existing Plus Project Peak-Hour Volumes P:\WSH1601\LSA tech studies\traffic\xls\fig 8 Existing + Project ITMs.xls (8/24/2017)
22 T R A F F I C I M P A C T A N A L Y S I S A U G U S T 2017 K I L L E F E R S Q U A R E S P E C I F I C P L A N C I T Y O F O R A N G E, C A L I F O R N I A CUMULATIVE OPENING YEAR PLUS PROJECT CONDITIONS Traffic generated by the project was added to the cumulative traffic volumes at each study area intersection. Figure 9 illustrates the resulting cumulative plus project a.m. and p.m. peak-hour traffic volumes. Table E summarizes the results of the cumulative plus project a.m. and p.m. peak-hour LOS analysis for all study area intersections. As indicated in Table E, all study area intersections would continue to operate at satisfactory LOS (LOS D or better). Table E: Cumulative Opening Year (2019) Plus Project Intersection LOS Summary Baseline Plus Project Study AM Peak Hour PM Peak Hour AM Peak Hour PM Peak Hour Area ICU/ ICU/ ICU/ ICU/ No. Intersection Delay LOS Delay LOS Delay LOS Delay LOS 1 Main Street/Walnut Avenue 0.68 B 0.75 C 0.70 B 0.76 C 2 Batavia Street/Walnut Avenue 0.57 A 0.52 A 0.57 A 0.55 A 3 Lemon Street/Walnut Avenue HCM 22.3 C 24.2 C 24.9 C 28.6 D 4 Glassell Street/Walnut Avenue 0.61 A 0.72 C 0.64 B 0.74 C 5 Orange Street/Walnut Avenue HCM 20.4 C 28.5 D 20.7 C 30.3 D 6 Lemon Street/Palm Avenue HCM 12.6 B 14.5 B 12.8 B 14.6 B 7 Lemon Street/Maple Avenue HCM 10.0 A 11.9 B 10.1 B 12.0 B 8 Lemon Street/Chapman Avenue 0.59 A 0.69 A 0.59 A 0.70 B Note: Delay is reported in seconds. ICU = Intersection Capacity Utilization HCM = Highway Capacity Manual LOS = level of service SITE ACCESS ANALYSIS Currently, three driveways provide access to the parking lot shared by Killefer Elementary School and Richland Continuation High School. All three driveways are located on the east side of North Lemon Street. Residential lots with private driveways are located opposite the project site. The northernmost driveway is 140 ft from the middle driveway, which is 240 ft from the southernmost driveway. The project would use one driveway that leads to a subterranean parking lot. This driveway would be located near the existing southernmost driveway. Because Lemon Street is a Collector Street with low volumes and speeds, the distance between the driveways and major intersections is sufficient. An LOS analysis was performed for cumulative plus project conditions for the driveway. The driveway was found to operate at LOS B for all scenarios. The worksheets for the driveway LOS analysis are included in Appendix C. The project incorporates a continuous system of sidewalks within the project site. Safe access to the public street system (via Lemon Street and Olive Street) would be provided. Sidewalks are currently provided on both sides of Lemon Street and Olive Street. Where modes intersect (i.e., streets and P:\WSH1601\LSA tech studies\traffic\tia\tia docx «08/24/17» 17
23 15 / / / / / / Main Street/Walnut Avenue 34 / / / / / / 46 2 Batavia Street/Walnut Avenue 25 / / 56 3 / / / / / / / / / 58 3 / / / / / / / / / / / / / / / / / / / / / / / / / 1 7 / / 39 4 / / / / / / / / / / Lemon Street/Walnut Avenue 4 Glassell Street/Walnut Avenue 5 Orange Street/Walnut Avenue 31 / / / / / / / / / / 27 3 / 9 76 / / / / / / / / / / / / / / / / / / / / / / / / / 21 6 Lemon Street/Palm Avenue 7 Lemon Street/Maple Avenue 8 Lemon Street/Chapman Avenue FIGURE 9 XXX / YYY AM / PM Volume Killefer Square Specific Plan Cumulative Opening Year (2019) Plus Project Peak-Hour Volumes P:\WSH1601\LSA tech studies\traffic\xls\fig 9 OY+P ITMs.xls (8/24/2017)
24 T R A F F I C I M P A C T A N A L Y S I S A U G U S T 2017 K I L L E F E R S Q U A R E S P E C I F I C P L A N C I T Y O F O R A N G E, C A L I F O R N I A sidewalks), accessible ramps would be incorporated. Land uses within close proximity to the project site include other residential, industrial, retail, and University sites. All these land use types are accessible by nonautomotive means. According to the City s Circulation and Mobility Element, the City is looking to expand its bikeway and trail network. It is proposed that Walnut Avenue will eventually have a Class II on-street bike path and Glassell Street will have a Class III on-street bike path. Bicycles can travel on both of these streets as they exist today. Transit facilities are accessible to and from the project site. The Orange Metrolink Station is less than 1 mile from the project site. The Orange County Line and Inland Empire-Orange County Line stop at this station. The Orange County Line services stations from Oceanside to Los Angeles Union Station every day, with reduced service on weekends. The Inland Empire-Orange County Line services stations from Oceanside to San Bernardino every day, with reduced service on weekends. Orange County Transportation Authority (OCTA) buses service the region. A bus stop is provided at the northeast and southwest corners of Glassell Street/Walnut Avenue (Route 59). OCTA Route 59 provides transportation to and from the Cities of Anaheim and Irvine via Glassell Street. TRAFFIC SIGNAL WARRANT ANALYSIS Traffic signal warrant analyses are required when an unsignalized intersection is anticipated to operate at unacceptable LOS E or F. As all study area intersections are anticipated to operate at acceptable LOS D or better for all scenarios analyzed, a traffic signal warrant analysis is not considered necessary and is therefore not included in this TIA. CONCLUSIONS The evaluation of the study area intersection LOS with the construction of an 80-unit, 354-bed student housing facility show that the addition of project traffic to the existing and cumulative conditions is not anticipated to result in any significant impacts to the surrounding intersections. P:\WSH1601\LSA tech studies\traffic\tia\tia docx «08/23/17» 19
25 T R A F F I C I M P A C T A N A L Y S I S A U G U S T 2017 K I L L E F E R S Q U A R E S P E C I F I C P L A N C I T Y O F O R A N G E, C A L I F O R N I A APPENDIX A EXISTING TRAFFIC COUNTS P:\WSH1601\LSA tech studies\traffic\tia\tia docx «08/23/17»
26
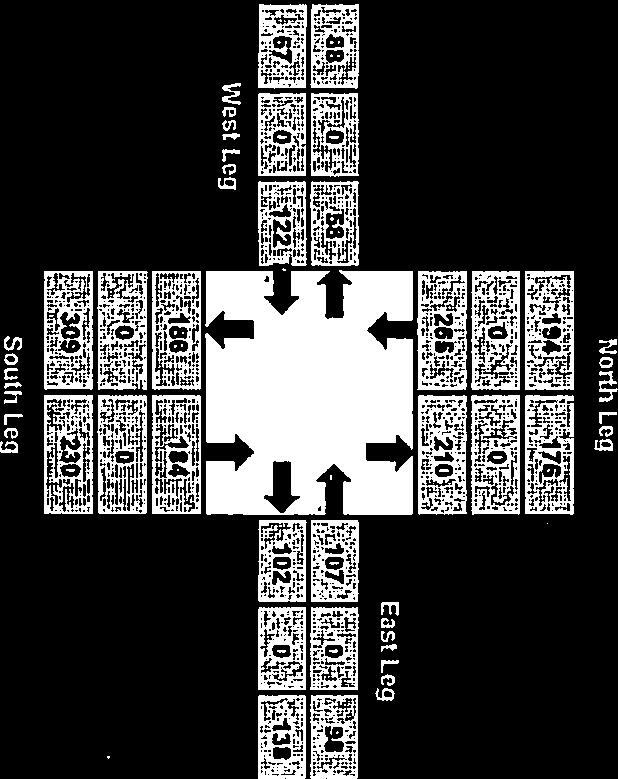
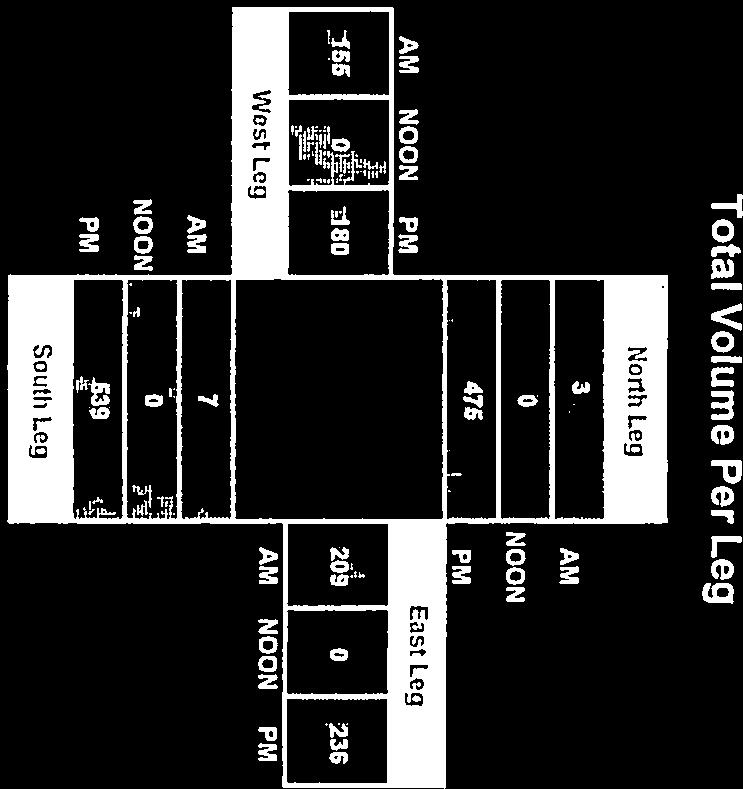
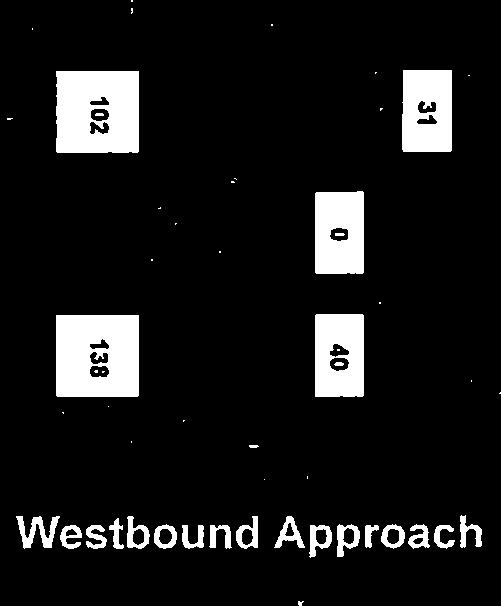
27 Main St and Walnut Ave, Orange Peak Hour Summary Date: 4/12/2016 Southbound Approach Project #: Day: Tuesday Lanes City: Orange AM AM AM Peak Hour 715 AM 0 NOON NOON 0 Main St NOON Peak Hour PM PM PM Peak Hour 445 PM Westbound Approach Walnut Ave AM NOON PM AM NOON PM Lanes CONTROL Signalized Lanes AM NOON PM AM NOON PM Eastbound Approach Count Periods Start End AM AM AM 7:00 AM 9:00 AM NOON NOON NOON NONE NONE PM PM PM 4:00 PM 6:00 PM Lanes Northbound Approach Total Volume Per Leg Total Ins & Outs North Leg North Leg AM 1493 AM NOON NOON PM 1726 PM East Leg AM NOON PM East Leg AM NOON PM AM NOON PM West Leg AM NOON PM West Leg AM AM 1761 NOON 0 0 NOON PM PM 1876 South Leg South Leg
28 Batavia St and Walnut Ave, Orange Peak Hour Summary Date: 4/12/2016 Southbound Approach Project #: Day: Tuesday Lanes City: Orange 0 0 AM AM 0 AM Peak Hour 715 AM NOON NOON Batavia St NOON Peak Hour PM PM PM Peak Hour 430 PM Westbound Approach Walnut Ave AM NOON PM AM NOON PM Lanes CONTROL Signalized Lanes AM NOON PM AM NOON PM Eastbound Approach Count Periods Start End AM AM AM 7:00 AM 9:00 AM NOON NOON NOON NONE NONE PM PM PM 4:00 PM 6:00 PM Lanes Northbound Approach Total Volume Per Leg Total Ins & Outs North Leg North Leg AM 1143 AM NOON NOON PM 1075 PM East Leg AM NOON PM East Leg AM NOON PM AM NOON PM West Leg AM NOON PM West Leg AM AM 1121 NOON 0 0 NOON PM PM 1070 South Leg South Leg
29
30 Lemon St and Walnut Ave, Orange Peak Hour Summary Date: 4/12/2016 Southbound Approach Project #: Day: Tuesday Lanes City: Orange AM AM AM Peak Hour 715 AM 0 NOON NOON 0 Lemon St NOON Peak Hour PM PM PM Peak Hour 500 PM Westbound Approach Walnut Ave AM NOON PM AM NOON PM Lanes CONTROL Way Stop Lanes AM NOON PM AM NOON PM Eastbound Approach Count Periods Start End AM AM AM 7:00 AM 9:00 AM NOON NOON NOON NONE NONE PM PM PM 4:00 PM 6:00 PM Lanes Northbound Approach Total Volume Per Leg Total Ins & Outs North Leg North Leg AM 377 AM NOON NOON PM 237 PM East Leg AM NOON PM East Leg AM NOON PM AM NOON PM West Leg AM NOON PM West Leg AM AM 370 NOON 0 0 NOON PM PM 316 South Leg South Leg
31 Glassell St and Walnut Ave, Orange Peak Hour Summary Date: 4/12/2016 Southbound Approach Project #: Day: Tuesday Lanes City: Orange 0 0 AM AM 0 AM Peak Hour 730 AM NOON NOON Glassell St NOON Peak Hour PM PM PM Peak Hour 500 PM Westbound Approach Walnut Ave AM NOON PM AM NOON PM Lanes CONTROL Signalized Lanes AM NOON PM AM NOON PM Eastbound Approach Count Periods Start End AM AM AM 7:00 AM 9:00 AM NOON NOON NOON NONE NONE PM PM PM 4:00 PM 6:00 PM Lanes Northbound Approach Total Volume Per Leg Total Ins & Outs North Leg North Leg AM 822 AM NOON NOON PM 851 PM East Leg AM NOON PM East Leg AM NOON PM AM NOON PM West Leg AM NOON PM West Leg AM AM 810 NOON 0 0 NOON PM PM 890 South Leg South Leg
32
33 Orange St and Walnut Ave, Orange 0 Peak Hour Summary Date: 4/12/2016 Southbound Approach Project #: Day: Tuesday Lanes City: Orange AM AM 0 AM Peak Hour 730 AM 0 0 NOON NOON Orange St NOON Peak Hour PM PM PM Peak Hour 445 PM Westbound Approach Walnut Ave AM NOON PM AM NOON PM Lanes CONTROL Way Stop (NB/SB) Lanes AM NOON PM AM NOON PM Eastbound Approach Count Periods Start End AM AM AM 7:00 AM 9:00 AM NOON NOON NOON NONE NONE PM PM PM 4:00 PM 6:00 PM Lanes Northbound Approach Total Volume Per Leg Total Ins & Outs North Leg North Leg AM 13 AM NOON NOON PM 46 PM East Leg AM NOON PM East Leg AM NOON PM AM NOON PM West Leg AM NOON PM West Leg AM AM 469 NOON 0 0 NOON PM PM 502 South Leg South Leg

34
35


36

37
38
39
40
41 T R A F F I C I M P A C T A N A L Y S I S A U G U S T 2017 K I L L E F E R S Q U A R E S P E C I F I C P L A N C I T Y O F O R A N G E, C A L I F O R N I A APPENDIX B ICU LEVEL OF SERVICE WORKSHEETS P:\WSH1601\LSA tech studies\traffic\tia\tia docx «08/23/17»
42
43 01 Existing No Project AM Tue May 30, :26:04 Page 2-1 Killefer Residential (WSH1601) Existing Conditions AM Peak Hour Level Of Service Computation Report ICU 1(Loss as Cycle Length %) Method (Future Volume Alternative) Intersection #1 Main St & Walnut Ave, Orange Cycle (sec): 100 Critical Vol./Cap.(X): Loss Time (sec): 5 Average Delay (sec/veh): xxxxxx Optimal Cycle: 31 Level Of Service: B Street Name: Main St Walnut Ave Approach: North Bound South Bound East Bound West Bound Movement: L - T - R L - T - R L - T - R L - T - R Control: Protected Protected Prot+Permit Prot+Permit Rights: Include Include Ovl Include Min. Green: Y+R: Lanes: Volume Module: Base Vol: Growth Adj: Initial Bse: Added Vol: PasserByVol: Initial Fut: User Adj: PHF Adj: PHF Volume: Reduct Vol: Reduced Vol: PCE Adj: MLF Adj: FinalVolume: OvlAdjVol: 145 Saturation Flow Module: Sat/Lane: Adjustment: Lanes: Final Sat.: Capacity Analysis Module: Vol/Sat: OvlAdjV/S: 0.09 Crit Moves: **** **** **** **** Traffix (c) 2008 Dowling Assoc. Licensed to LSA ASSOC. IRVINE, CA 01 Existing No Project AM Tue May 30, :26:04 Page 3-1 Killefer Residential (WSH1601) Existing Conditions AM Peak Hour Level Of Service Computation Report ICU 1(Loss as Cycle Length %) Method (Future Volume Alternative) Intersection #2 Batavia St & Walnut Ave, Orange Cycle (sec): 100 Critical Vol./Cap.(X): Loss Time (sec): 5 Average Delay (sec/veh): xxxxxx Optimal Cycle: 24 Level Of Service: A Street Name: Batavia St Walnut Ave Approach: North Bound South Bound East Bound West Bound Movement: L - T - R L - T - R L - T - R L - T - R Control: Permitted Permitted Permitted Permitted Rights: Include Include Include Include Min. Green: Y+R: Lanes: Volume Module: Base Vol: Growth Adj: Initial Bse: Added Vol: PasserByVol: Initial Fut: User Adj: PHF Adj: PHF Volume: Reduct Vol: Reduced Vol: PCE Adj: MLF Adj: FinalVolume: Saturation Flow Module: Sat/Lane: Adjustment: Lanes: Final Sat.: Capacity Analysis Module: Vol/Sat: Crit Moves: **** **** **** **** Traffix (c) 2008 Dowling Assoc. Licensed to LSA ASSOC. IRVINE, CA
44 01 Existing No Project AM Tue May 30, :26:04 Page 4-1 Killefer Residential (WSH1601) Existing Conditions AM Peak Hour Level Of Service Computation Report ICU 1(Loss as Cycle Length %) Method (Future Volume Alternative) Intersection #4 Glassell St & Walnut Ave, Orange Cycle (sec): 100 Critical Vol./Cap.(X): Loss Time (sec): 5 Average Delay (sec/veh): xxxxxx Optimal Cycle: 25 Level Of Service: A Street Name: Glassell St Walnut Ave Approach: North Bound South Bound East Bound West Bound Movement: L - T - R L - T - R L - T - R L - T - R Control: Permitted Permitted Permitted Permitted Rights: Include Include Include Include Min. Green: Y+R: Lanes: ! 0 0 Volume Module: Base Vol: Growth Adj: Initial Bse: Added Vol: PasserByVol: Initial Fut: User Adj: PHF Adj: PHF Volume: Reduct Vol: Reduced Vol: PCE Adj: MLF Adj: FinalVolume: Saturation Flow Module: Sat/Lane: Adjustment: Lanes: Final Sat.: Capacity Analysis Module: Vol/Sat: Crit Moves: **** **** **** **** Traffix (c) 2008 Dowling Assoc. Licensed to LSA ASSOC. IRVINE, CA 01 Existing No Project AM Tue May 30, :26:04 Page 5-1 Killefer Residential (WSH1601) Existing Conditions AM Peak Hour Level Of Service Computation Report ICU 1(Loss as Cycle Length %) Method (Future Volume Alternative) Intersection #8 Lemon St & Chapman Ave, Orange Cycle (sec): 100 Critical Vol./Cap.(X): Loss Time (sec): 5 Average Delay (sec/veh): xxxxxx Optimal Cycle: 24 Level Of Service: A Street Name: Lemon St Chapman Ave Approach: North Bound South Bound East Bound West Bound Movement: L - T - R L - T - R L - T - R L - T - R Control: Permitted Permitted Permitted Permitted Rights: Include Include Include Include Min. Green: Y+R: Lanes: Volume Module: Base Vol: Growth Adj: Initial Bse: Added Vol: PasserByVol: Initial Fut: User Adj: PHF Adj: PHF Volume: Reduct Vol: Reduced Vol: PCE Adj: MLF Adj: FinalVolume: Saturation Flow Module: Sat/Lane: Adjustment: Lanes: Final Sat.: Capacity Analysis Module: Vol/Sat: Crit Moves: **** **** **** **** Traffix (c) 2008 Dowling Assoc. Licensed to LSA ASSOC. IRVINE, CA
45 01 Existing No Project PM Tue May 30, :27:05 Page 2-1 Killefer Residential (WSH1601) Existing Conditions PM Peak Hour Level Of Service Computation Report ICU 1(Loss as Cycle Length %) Method (Future Volume Alternative) Intersection #1 Main St & Walnut Ave, Orange Cycle (sec): 100 Critical Vol./Cap.(X): Loss Time (sec): 5 Average Delay (sec/veh): xxxxxx Optimal Cycle: 35 Level Of Service: B Street Name: Main St Walnut Ave Approach: North Bound South Bound East Bound West Bound Movement: L - T - R L - T - R L - T - R L - T - R Control: Protected Protected Prot+Permit Prot+Permit Rights: Include Include Ovl Include Min. Green: Y+R: Lanes: Volume Module: Base Vol: Growth Adj: Initial Bse: Added Vol: PasserByVol: Initial Fut: User Adj: PHF Adj: PHF Volume: Reduct Vol: Reduced Vol: PCE Adj: MLF Adj: FinalVolume: OvlAdjVol: 74 Saturation Flow Module: Sat/Lane: Adjustment: Lanes: Final Sat.: Capacity Analysis Module: Vol/Sat: OvlAdjV/S: 0.04 Crit Moves: **** **** **** **** Traffix (c) 2008 Dowling Assoc. Licensed to LSA ASSOC. IRVINE, CA 01 Existing No Project PM Tue May 30, :27:05 Page 3-1 Killefer Residential (WSH1601) Existing Conditions PM Peak Hour Level Of Service Computation Report ICU 1(Loss as Cycle Length %) Method (Future Volume Alternative) Intersection #2 Batavia St & Walnut Ave, Orange Cycle (sec): 100 Critical Vol./Cap.(X): Loss Time (sec): 5 Average Delay (sec/veh): xxxxxx Optimal Cycle: 22 Level Of Service: A Street Name: Batavia St Walnut Ave Approach: North Bound South Bound East Bound West Bound Movement: L - T - R L - T - R L - T - R L - T - R Control: Permitted Permitted Permitted Permitted Rights: Include Include Include Include Min. Green: Y+R: Lanes: Volume Module: Base Vol: Growth Adj: Initial Bse: Added Vol: PasserByVol: Initial Fut: User Adj: PHF Adj: PHF Volume: Reduct Vol: Reduced Vol: PCE Adj: MLF Adj: FinalVolume: Saturation Flow Module: Sat/Lane: Adjustment: Lanes: Final Sat.: Capacity Analysis Module: Vol/Sat: Crit Moves: **** **** **** **** Traffix (c) 2008 Dowling Assoc. Licensed to LSA ASSOC. IRVINE, CA
IV. REVISIONS TO THE DRAFT IS/MND
 IV. REVISIONS TO THE DRAFT IS/MND 1. REVISIONS TO THE DRAFT IS/MND This section presents corrections and clarifications that have been made to the text of the Draft IS/MND. These changes include revisions
Escondido Marriott Hotel and Mixed-Use Condominium Project TRAFFIC IMPACT ANALYSIS REPORT
 Escondido Marriott Hotel and Mixed-Use Condominium Project TRAFFIC IMPACT ANALYSIS REPORT Prepared for Phelps Program Management 420 Sixth Avenue, Greeley, CO 80632 Prepared by 5050 Avenida Encinas, Suite
APPENDIX B Traffic Analysis
 APPENDIX B Traffic Analysis Rim of the World Unified School District Reconfiguration Prepared for: Rim of the World School District 27315 North Bay Road, Blue Jay, CA 92317 Prepared by: 400 Oceangate,
Traffic Impact Analysis 5742 BEACH BOULEVARD MIXED USE PROJECT
 Traffic Impact Analysis 5742 BEACH BOULEVARD MIXED USE PROJECT CITY OF BUENA PARK Prepared by Project No. 14139 000 April 17 th, 2015 DKS Associates Jeffrey Heald, P.E. Rohit Itadkar, T.E. 2677 North Main
APPENDIX C-2. Traffic Study Supplemental Analysis Memo
 APPENDIX C-2 Traffic Study Supplemental Analysis Memo The Mobility Group Transportation Strategies & Solutions Memorandum To: From: Subject: Tomas Carranza, LADOT Matthew Simons Traffic Review - Revised
EXECUTIVE SUMMARY. The following is an outline of the traffic analysis performed by Hales Engineering for the traffic conditions of this project.
 EXECUTIVE SUMMARY This study addresses the traffic impacts associated with the proposed Shopko redevelopment located in Sugarhouse, Utah. The Shopko redevelopment project is located between 1300 East and
Bay Terrace Apartments
 Bay Terrace Apartments Traffic Impact Analysis Prepared for: City of San Mateo September 16, 2011 Hexagon Office: 111 W. St. John Street, Suite 850 San Jose, CA 95113 Hexagon Job Number: 10MH08 Phone:
Appendix Q Traffic Study
 Appendices Appendix Q Traffic Study Crummer Site Subdivision Draft EIR City of Malibu Appendices This page intentionally left blank. The Planning Center April 2013 TRAFFIC IMPACT ANALYSIS Photo z here
TABLE OF CONTENTS SECTION PAGE. Executive Summary... xii
 TABLE OF CONTENTS SECTION PAGE Executive Summary... xii 1.0 Introduction... 1 1.1 Study Area... 2 1.2 Traffic Impact Analysis Scenarios... 4 1.3 Study Area - City of Orange... 4 2.0 Project Description
2.0 Development Driveways. Movin Out June 2017
 Movin Out June 2017 1.0 Introduction The proposed Movin Out development is a mixed use development in the northeast quadrant of the intersection of West Broadway and Fayette Avenue in the City of Madison.
King Soopers #116 Thornton, Colorado
 Traffic Impact Study King Soopers #116 Thornton, Colorado Prepared for: Galloway & Company, Inc. T R A F F I C I M P A C T S T U D Y King Soopers #116 Thornton, Colorado Prepared for Galloway & Company
Draft Supplemental Transportation Analysis Santa Clara - Alum Rock Transit Corridor APPENDIX A TRAFFIX Level of Service Calculation Sheets 2012 BRT 20
 Draft Supplemental Transportation Analysis Santa Clara - Alum Rock Transit Corridor APPENDIX A TRAFFIX Level of Service Calculation Sheets 202 BRT 2030 BRT 2030 BRT Mitigation COMPARE Wed May 8 2:02: 20
LAWRENCE TRANSIT CENTER LOCATION ANALYSIS 9 TH STREET & ROCKLEDGE ROAD / 21 ST STREET & IOWA STREET LAWRENCE, KANSAS
 LAWRENCE TRANSIT CENTER LOCATION ANALYSIS 9 TH STREET & ROCKLEDGE ROAD / 21 ST STREET & IOWA STREET LAWRENCE, KANSAS TRAFFIC IMPACT STUDY FEBRUARY 214 OA Project No. 213-542 TABLE OF CONTENTS 1. INTRODUCTION...
L1TILE BEARS DAY CARE TRANSPORTATION IMPACT STUDY FORT COLLINS, COLORADO MAY Prepared for:
 L1TILE BEARS DAY CARE TRANSPORTATION IMPACT STUDY FORT COLLINS, COLORADO MAY 2012 Prepared for: Hillside Construction, Inc. 216 Hemlock Street, Suite B Fort Collins, CO 80534 Prepared by: DELICH ASSOCIATES
Transportation & Traffic Engineering
 Transportation & Traffic Engineering 1) Project Description This report presents a summary of findings for a Traffic Impact Analysis (TIA) performed by A+ Engineering, Inc. for the Hill Country Family
West Hills Shopping Centre Lowe s Expansion Traffic Impact Study
 West Hills Shopping Centre Lowe s Expansion Traffic Impact Study Prepared for: Armel Corporation January 2015 Paradigm Transportation Solutions Ltd. 22 King Street South, Suite 300 Waterloo ON N2J 1N8
TIMBERVINE TRANSPORTATION IMPACT STUDY FORT COLLINS, COLORADO JANUARY Prepared for:
 TIMBERVINE TRANSPORTATION IMPACT STUDY FORT COLLINS, COLORADO JANUARY 2014 Prepared for: Hartford Companies 1218 W. Ash Street Suite A Windsor, Co 80550 Prepared by: DELICH ASSOCIATES 2272 Glen Haven Drive
Oakbrook Village Plaza City of Laguna Hills
 Oakbrook Village Plaza City of Laguna Hills Traffic Impact Analysis Prepared by: HDR Engineering 3230 El Camino Real, Suite 200 Irvine, CA 92602 October 2012 Revision 3 D-1 Oakbrook Village Plaza Laguna
Appendix C. Traffic Study
 Appendix C Traffic Study TABLE OF CONTENTS SECTION Executive Summary PAGE 1.0 Introduction... 1 1.1 Scope of Work... 1 1.2 Study Area... 2 2.0 Project Description... 3 2.1 Site Access... 4 2.2 Pedestrian
Lacey Gateway Residential Phase 1
 Lacey Gateway Residential Phase Transportation Impact Study April 23, 203 Prepared for: Gateway 850 LLC 5 Lake Bellevue Drive Suite 02 Bellevue, WA 98005 Prepared by: TENW Transportation Engineering West
Volume 1 Traffic Impact Analysis Turtle Creek Boulevard Dallas, Texas. Kimley-Horn and Associates, Inc. Dallas, Texas.
 Volume 1 Traffic Impact Analysis 2727 Dallas, Texas June 18, 2018 Kimley-Horn and Associates, Inc. Dallas, Texas Project #064523000 Registered Firm F-928 Traffic Impact Analysis 2727 Dallas, Texas Prepared
Existing Traffic Conditions
 May 14, 2014 Ms. Lorraine Weiss City of San Mateo 330 West 20 th Avenue San Mateo, CA 94403 Subject: Traffic Operational Study for the Proposed Tilton Avenue Residential Development in San Mateo, California
Traffic Impact Analysis. Alliance Cole Avenue Residential Site Dallas, Texas. Kimley-Horn and Associates, Inc. Dallas, Texas.
 Traffic Impact Analysis Alliance Cole Avenue Residential Site Dallas, Texas February 15, 2018 Kimley-Horn and Associates, Inc. Dallas, Texas Project #064524900 Registered Firm F-928 Traffic Impact Analysis
TRANSPORTATION STUDY FOR THE 8899 BEVERLY BOULEVARD PROJECT
 DRAFT TRANSPORTATION STUDY FOR THE 8899 BEVERLY BOULEVARD PROJECT WEST HOLLYWOOD, CALIFORNIA NOVEMBER 2013 PREPARED FOR BEVERLY BOULEVARD ASSOCIATION PREPARED BY DRAFT TRANSPORTATION STUDY FOR THE 8899
Traffic Impact Study Speedway Gas Station Redevelopment
 Traffic Impact Study Speedway Gas Station Redevelopment Warrenville, Illinois Prepared For: Prepared By: April 11, 2018 Table of Contents 1. Introduction... 1 2. Existing Conditions... 4 Site Location...
TRAFFIC IMPACT ANALYSIS FOR. McDONALD S RESTAURANT IN CARMICAEL Sacramento County, CA. Prepared For:
 TRAFFIC IMPACT ANALYSIS FOR McDONALD S RESTAURANT IN CARMICAEL Sacramento County, CA Prepared For: McDonald s USA, LLC Pacific Sierra Region 2999 Oak Road, Suite 900 Walnut Creek, CA 94597 Prepared By:
Perris Apartments Traffic Impact Analysis City of Perris, California
 Perris Apartments Traffic Impact Analysis City of Perris, California Prepared for: JD Pierce Company, Inc. 2222 Martin St., Suite 100 Irvine, CA 92612 Prepared by: TJW ENGINEERING, INC. 540 N. Golden Circle
DRAFT TRANSPORTATION IMPACT STUDY CASTILIAN REDEVELOPMENT PROJECT
 DRAFT TRANSPORTATION IMPACT STUDY CASTILIAN REDEVELOPMENT PROJECT Prepared for: Submitted by: 299 Lava Ridge Ct. Suite 2 Roseville, CA. 95661 June 212 TABLE OF CONTENTS 1. Introduction... 1 Project Location
MINERVA PARK SITE TRAFFIC IMPACT STUDY M/I HOMES. September 2, 2015
 5500 New Albany Road Columbus, Ohio 43054 Phone: 614.775.4500 Fax: 614.775.4800 Toll Free: 1-888-775-EMHT emht.com 2015-1008 MINERVA PARK SITE TRAFFIC IMPACT STUDY M/I HOMES September 2, 2015 Engineers
TALMONT TOWNHOMES MADISON KENNETH SPA TRAFFIC IMPACT STUDY. Sacramento, CA. Prepared For: MBK Homes. Prepared By:
 TALMONT TOWNHOMES MADISON KENNETH SPA TRAFFIC IMPACT STUDY Sacramento, CA Prepared For: MBK Homes Prepared By: KD Anderson & Associates 3853 Taylor Road, Suite G Loomis, California 95650 (916) 660-1555
The major roadways in the study area are State Route 166 and State Route 33, which are shown on Figure 1-1 and described below:
 3.5 TRAFFIC AND CIRCULATION 3.5.1 Existing Conditions 3.5.1.1 Street Network DRAFT ENVIRONMENTAL IMPACT REPORT The major roadways in the study area are State Route 166 and State Route 33, which are shown
MILLERSVILLE PARK TRAFFIC IMPACT ANALYSIS ANNE ARUNDEL COUNTY, MARYLAND
 MILLERSVILLE PARK TRAFFIC IMPACT ANALYSIS ANNE ARUNDEL COUNTY, MARYLAND Prepared for: Department of Public Works Anne Arundel County Prepared by: URS Corporation 4 North Park Drive, Suite 3 Hunt Valley,
TRAFFIC IMPACT STUDY FOR SONIC DRIVE-IN RESTAURANT. Vallejo, CA. Prepared For:
 TRAFFIC IMPACT STUDY FOR SONIC DRIVE-IN RESTAURANT Vallejo, CA Prepared For: ELITE DRIVE-INS, INC. 2190 Meridian Park Blvd, Suite G Concord, CA 94520 Prepared By: KD Anderson & Associates 3853 Taylor Road,
NEWCASTLE MIDDLE SCHOOL Traffic Impact Analysis
 Gibson Traffic Consultants 2802 Wetmore Avenue Suite 220 Everett, WA 98201 425.339.8266 NEWCASTLE MIDDLE SCHOOL Traffic Impact Analysis Prepared for: Renton School District Jurisdiction: City of Newcastle
King County Metro. Columbia Street Transit Priority Improvements Alternative Analysis. Downtown Southend Transit Study. May 2014.
 King County Metro Columbia Street Transit Priority Improvements Alternative Analysis Downtown Southend Transit Study May 2014 Parametrix Table of Contents Introduction... 1 Methodology... 1 Study Area...
Appendix G: Transportation/Traffic
 City of Irvine - William Lyon Homes: Vista Verde Draft EIR Appendix G: Transportation/Traffic Michael Brandman Associates H:\Client (PN-JN)\0006\00060034\EIR\3 - DEIR\00060034 Sec99-00 Appendix Dividers
Appendix C-5: Proposed Refinements Rail Operations and Maintenance Facility (ROMF) Traffic Impact Analysis. Durham-Orange Light Rail Transit Project
 Traffic Impact Analysis. Durham-Orange Light Rail Transit Project") Appendix C-5: Proposed Refinements Rail Operations and Maintenance Facility (ROMF) Traffic Impact Analysis Durham-Orange Light Rail Transit Project July 25, 218 ROMF Transportation Impact Analysis Version
Appendix C-5: Proposed Refinements Rail Operations and Maintenance Facility (ROMF) Traffic Impact Analysis Durham-Orange Light Rail Transit Project July 25, 218 ROMF Transportation Impact Analysis Version
APPENDIX C1 TRAFFIC ANALYSIS DESIGN YEAR TRAFFIC ANALYSIS
 APPENDIX C1 TRAFFIC ANALYSIS DESIGN YEAR TRAFFIC ANALYSIS DESIGN YEAR TRAFFIC ANALYSIS February 2018 Highway & Bridge Project PIN 6754.12 Route 13 Connector Road Chemung County February 2018 Appendix
INDUSTRIAL DEVELOPMENT
 INDUSTRIAL DEVELOPMENT Traffic Impact Study Plainfield, Illinois August 2018 Prepared for: Seefried Industrial Properties, Inc. TABLE OF CONTENTS Executive Summary 2 Introduction 3 Existing Conditions
Traffic Impact Statement (TIS)
") Traffic Impact Statement (TIS) Vincentian PUDA Collier County, FL 10/18/2013 Prepared for: Global Properties of Naples Prepared by: Trebilcock Consulting Solutions, PA 2614 Tamiami Trail N, Suite 615 1205
Traffic Impact Statement (TIS) Vincentian PUDA Collier County, FL 10/18/2013 Prepared for: Global Properties of Naples Prepared by: Trebilcock Consulting Solutions, PA 2614 Tamiami Trail N, Suite 615 1205
4.14 TRANSPORTATION AND CIRCULATION
 4.14 TRANSPORTATION AND CIRCULATION 4.14.1 Summary Table 4.14-1 summarizes the identified environmental impacts, proposed mitigation measures, and residual impacts of the proposed project with regard to
LCPS Valley Service Center
 Traffic Impact Study LCPS Valley Service Center Loudoun County, Virginia November 4, 2015 Prepared For: Loudoun County Public Schools 21000 Education Court Ashburn, VA 20148 Prepared by: 1140 Connecticut
TRAFFIC IMPACT ANALYSIS WESTMINSTER SEMINARY. Escondido, California June 25, LLG Ref Transportation Engineer II
 TRAFFIC IMPACT ANALYSIS WESTMINSTER SEMINARY Escondido, California June 25, 2015 LLG Ref. 3-15-2420 Prepared by: Pedram Massoudi Transportation Engineer II Under the Supervision of: John Boarman, P.E.
2. Valley Circle Boulevard/Andora Avenue/Baden Avenue and Lassen Street
 IV.J TRANSPORTATION 1. INTRODUCTION This section presents an overview of the existing traffic and circulation system in and surrounding the project site. This section also discusses the potential impacts
Date: February 7, 2017 John Doyle, Z-Best Products Robert Del Rio. T.E. Z-Best Traffic Operations and Site Access Analysis
 Memorandum Date: February 7, 07 To: From: Subject: John Doyle, Z-Best Products Robert Del Rio. T.E. Z-Best Traffic Operations and Site Access Analysis Introduction Hexagon Transportation Consultants, Inc.
MEMO VIA . Ms. Amy Roth DPS Director, City of Three Rivers. To:
 MEMO To: Ms. Amy Roth DPS Director, City of Three Rivers VIA EMAIL From: Michael J. Labadie, PE Julie M. Kroll, PE, PTOE Brandon Hayes, PE, P.Eng. Fleis & VandenBrink Date: January 5, 2017 Re: Proposed
Re: Addendum No. 4 Transportation Overview 146 Mountshannon Drive Ottawa, Ontario
 April 18 th, 2017 Mr. Kevin Yemm Vice President, Land Development Richraft Group of Companies 2280 St. Laurent Boulevard, Suite 201 Ottawa, Ontario (Tel: 613.739.7111 / e-mail: keviny@richcraft.com) Re:
Craig Scheffler, P.E., PTOE HNTB North Carolina, P.C. HNTB Project File: Subject
 TECHNICAL MEMORANDUM To Kumar Neppalli Traffic Engineering Manager Town of Chapel Hill From Craig Scheffler, P.E., PTOE HNTB North Carolina, P.C. Cc HNTB Project File: 38435 Subject Obey Creek TIS 2022
Traffic Impact Analysis West Street Garden Plots Improvements and DuPage River Park Garden Plots Development Naperville, Illinois
 Traffic Impact Analysis West Street Garden Plots Improvements and DuPage River Park Garden Plots Development Naperville, Illinois Submitted by April 9, 2009 Introduction Kenig, Lindgren, O Hara, Aboona,
IRSCH REEN Hirsch/Green Transportation Consulting, Inc.
 IRSCH REEN Hirsch/Green Transportation Consulting, Inc. February 6, 2013 Mr. David Weil Director of Finance St. Matthew s Parish School 1031 Bienveneda Avenue Pacific Palisades, California 90272 RE: Trip
Traffic Impact Analysis Update
 Willow Bend Traffic Impact Analysis Update TABLE OF CONTENTS Page I. INTRODUCTION -------------------------------------------------------------------------------------------- 1 II. EXISTING CONDITIONS
Draft Report: West Berkeley Bowl Project
 Draft Report: West Berkeley Bowl Project July 2004 Prepared for: The City of Berkeley 1031-1925 F EHR & PEERS TRANSPORTATION CONSULTANTS 3685 Mt. Diablo Blvd. #301 Lafayette, CA 94549 925-284-3200 Fax:
West Rosslyn Development
 Traffic Impact Study and Transportation Management Plan West Rosslyn Development Arlington County, VA Revised: January 11, 2017 May 10, 2016 Prepared for: Penzance 2400 N Street, NW, Suite 600 Washington,
LOTUS RANCH TRAFFIC IMPACT ANALYSIS. LLG Ref Senior Transportation Engineer & Charlene Sadiarin Transportation Engineer II
 TRAFFIC IMPACT ANALYSIS LOTUS RANCH El Centro, California July 31, 2015February 12, 2016 LLG Ref. 3-14-2392 Prepared by: KC Yellapu, P.E Senior Transportation Engineer & Charlene Sadiarin Transportation
TRAFFIC IMPACT ANALYSIS RIZZO CONFERENCE CENTER EXPANSION FINAL REPORT
 TRAFFIC IMPACT ANALYSIS RIZZO CONFERENCE CENTER EXPANSION Chapel Hill, North Carolina FINAL REPORT Prepared for: The Town of Chapel Hill, NC Prepared by: Architects-Engineers-Planners, Inc. December 2010
APPENDIX E. Traffic Analysis Report
 APPENDIX E Traffic Analysis Report THIS PAGE INTENTIONALLY BLANK EAGLE RIVER TRAFFIC MITIGATION PHASE I OLD GLENN HIGHWAY/EAGLE RIVER ROAD INTERSECTION IMPROVEMENTS TRAFFIC ANALYSIS Eagle River, Alaska
TRAFFIC IMPACT ANALYSIS
 TRAFFIC IMPACT ANALYSIS Emerald Isle Commercial Development Prepared by SEPI Engineering & Construction Prepared for Ark Consulting Group, PLLC March 2016 I. Executive Summary A. Site Location The Emerald
Clean Harbors Canada, Inc.
 Clean Harbors Canada, Inc. Proposed Lambton Landfill Expansion Environmental Assessment Terms of Reference Transportation Assessment St. Clair Township, Ontario September 2009 itrans Consulting Inc. 260
ZINFANDEL LANE / SILVERADO TRAIL INTERSECTION TRAFFIC ANALYSIS
 ZINFANDEL LANE / SILVERADO TRAIL INTERSECTION TRAFFIC ANALYSIS UPDATED TRAFFIC STUDY FOR THE PROPOSED RAYMOND VINEYARDS WINERY USE PERMIT MODIFICATION #P11-00156 AUGUST 5, 2014 PREPARED BY: OMNI-MEANS,
TRAFFIC IMPACT STUDY DERRY GREEN CORPORATE BUSINESS PARK MILTON SECONDARY PLAN MODIFICATION
 TRAFFIC IMPACT STUDY DERRY GREEN CORPORATE BUSINESS PARK MILTON SECONDARY PLAN MODIFICATION TRAFFIC IMPACT STUDY DERRY GREEN CORPORATE BUSINESS PARK MILTON SECONDARY PLAN MODIFICATION DECEMBER 24 UPDATED
Appendix H TRAFFIC IMPACT ANALYSIS
 Appendix H TRAFFIC IMPACT ANALYSIS Teichert Boca Quarry Expansion Traffic Impact Analysis Prepared for Teichert Aggregates Prepared by TRANSPORTATION CONSULTANTS, INC. LSC Transportation Consultants, Inc.
TRAFFIC IMPACT ANALYSIS SAFARI HIGHLANDS RANCH
 TRAFFIC IMPACT ANALYSIS SAFARI HIGHLANDS RANCH, California November 11, 2016 LLG Ref. 3-14-2334 EXECUTIVE SUMMARY The Project proposes the development of 550 luxury residential dwelling units, public trails,
TRAFFIC IMPACT ANALYSIS SHORTBREAD LOFTS 2009 MODIFICATION Chapel Hill, North Carolina
 TRAFFIC IMPACT ANALYSIS SHORTBREAD LOFTS 2009 MODIFICATION Chapel Hill, North Carolina Prepared for: The Town of Chapel Hill, NC Prepared by: Architects-Engineers-Planners, Inc. November 2009 Traffic Impact
MONTEREY BAY AQUARIUM RESEARCH INSTITUTE (MBARI) MASTER PLAN UPDATE MOSS LANDING, CALIFORNIA
 MASTER PLAN UPDATE MOSS LANDING, CALIFORNIA") MONTEREY BAY AQUARIUM RESEARCH INSTITUTE (MBARI) MASTER PLAN UPDATE MOSS LANDING, CALIFORNIA TRAFFIC IMPACT ANALYSIS Administrative Draft Report Prepared For Monterey Bay Aquarium Research Institute Moss
MONTEREY BAY AQUARIUM RESEARCH INSTITUTE (MBARI) MASTER PLAN UPDATE MOSS LANDING, CALIFORNIA TRAFFIC IMPACT ANALYSIS Administrative Draft Report Prepared For Monterey Bay Aquarium Research Institute Moss
Los Angeles Mission College Facilities Master Plan Draft Program Environmental Impact Report 3.13 TRANSPORTATION / TRAFFIC
 3.13 TRANSPORTATION / TRAFFIC As a result of the analysis undertaken in the Initial Study for the Los Angeles Mission College Facilities Master Plan, the (LACCD) determined that the proposed project may
Proposed location of Camp Parkway Commerce Center. Vicinity map of Camp Parkway Commerce Center Southampton County, VA
 Proposed location of Camp Parkway Commerce Center Vicinity map of Camp Parkway Commerce Center Southampton County, VA Camp Parkway Commerce Center is a proposed distribution and industrial center to be
MURRIETA APARTMENTS TRAFFIC IMPACT ANALYSIS CITY OF MURRIETA, CALIFORNIA
 MURRIETA APARTMENTS TRAFFIC IMPACT ANALYSIS CITY OF MURRIETA, CALIFORNIA SEPTEMBER 20, 2012 Prepared for: Golden Eagle Multi-Family Properties, LLC 6201 Oak Canyon Rd., Suite 250 Irvine, CA 92618 Prepared
MERIVALE PRIORITY SQUARE 2852 MERIVALE ROAD CITY OF OTTAWA TRANSPORTATION BRIEF. Prepared for: ONT Inc. 25 Winding Way Nepean, Ontario K2C 3H1
 MERIVALE PRIORITY SQUARE 2852 MERIVALE ROAD CITY OF OTTAWA TRANSPORTATION BRIEF Prepared for: 2190986ONT Inc. 25 Winding Way Nepean, Ontario K2C 3H1 October 6, 2010 110-502 Report_1.doc D. J. Halpenny
Bennett Pit. Traffic Impact Study. J&T Consulting, Inc. Weld County, Colorado. March 3, 2017
 Bennett Pit Traffic Impact Study J&T Consulting, Inc. Weld County, Colorado March 3, 217 Prepared By: Sustainable Traffic Solutions, Inc. http://www.sustainabletrafficsolutions.com/ Joseph L. Henderson,
TRAFFIC SIGNAL DESIGN REPORT KING OF PRUSSIA ROAD & RAIDER ROAD RADNOR TOWNSHIP PENNSYLVANIA
 TRAFFIC SIGNAL DESIGN REPORT KING OF PRUSSIA ROAD & RAIDER ROAD RADNOR TOWNSHIP PENNSYLVANIA PREPARED FOR: UNIVERSITY OF PENNSYLVANIA HEALTH SYSTEM 34 CIVIC CENTER BOULEVARD PHILADELPHIA, PA 1987 (61)
Shirk Road at State Route 198 Interchange Analysis Tulare County, California
 Shirk Road at State Route 198 Interchange Analysis Tulare County, California DRAFT REPORT Prepared By Tulare County Association of Governments (TCAG) April 2013 Table of Contents Introduction:... 3 Project
DEVELOPMENT PROPERTY 1627 MAXIME STREET CITY OF OTTAWA TRANSPORTATION OVERVIEW. Prepared for: Subhas Bhargava. July 9, Overview_1.
 DEVELOPMENT PROPERTY 1627 MAXIME STREET CITY OF OTTAWA TRANSPORTATION OVERVIEW Prepared for: Subhas Bhargava July 9, 2015 115-620 Overview_1.doc D. J. Halpenny & Associates Ltd. Consulting Transportation
The key roadways in the project vicinity are described below. Exhibit displays the existing number of lanes on the study roadways.
 4.2 TRAFFIC AND CIRCULATION This section presents the key assumptions, methods, and results of analysis for the transportation and circulation impacts of the proposed project. This section is based on
Traffic Engineering Study
 Traffic Engineering Study Bellaire Boulevard Prepared For: International Management District Technical Services, Inc. Texas Registered Engineering Firm F-3580 November 2009 Executive Summary has been requested
HIGHWAY 28 FUNCTIONAL DESIGN
 HIGHWAY 28 FUNCTIONAL DESIGN PUBLIC OPEN HOUSE #1 WEDNESDAY, MARCH 12, 2014 Stantec Presenters: Brad Vander Heyden, Project Engineer Neal Cormack, Project Manager Dave Parker, Project Engineer Beth Thola,
700 University Avenue Mixed-Use Development. Traffic Impact Analysis
 700 University Avenue Mixed-Use Development Traffic Impact Analysis January 20, 2006 Prepared by 700 UNIVERSITY AVENUE MIXED- USE DEVELOPMENT TRAFFIC IMPACT STUDY Table of Contents 1.0 Executive Summary...
Table of Contents. Traffic Impact Analysis Capital One Building at Schilling Place
 Traffic Impact Analysis Capital One Building at Schilling Place Table of Contents Executive Summary... 1 1. Introduction... 4 2. Project Description... 4 3. Background Information... 4 4. Study Scope...
IV. ENVIRONMENTAL IMPACT ANALYSIS J. TRANSPORTATION AND TRAFFIC
 IV. ENVIRONMENTAL IMPACT ANALYSIS J. TRANSPORTATION AND TRAFFIC This Section summarizes the information provided in the Traffic Study for the Santa Monica College Bundy Campus Master Plan (Traffic Study),
TRAFFIC IMPACT ANALYSIS FOR. Prepared For: Din/Cal 3, Inc Richmond Avenue, Suite 200 Houston, Texas Prepared By:
 TRAFFIC IMPACT ANALYSIS FOR STERLING 5 th STREET APARTMENTS PROJECT Davis, CA Prepared For: Din/Cal 3, Inc. 3411 Richmond Avenue, Suite 200 Houston, Texas 77046 Prepared By: KD Anderson & Associates, Inc.
Proposed Inn at Bellefield Traffic Impact Assessment
 Proposed Inn at Bellefield Traffic Impact Assessment Town of Hyde Park Dutchess County, New York Prepared for: T-Rex Hyde Park Owner LLC 500 Mamroneck Avenue, Suite 300 Harrison, NY 10528 June 21, 2017
Quantitative analyses of weekday a.m. and p.m. commuter hour conditions have been conducted for the following five scenarios:
 6.1 TRANSPORTATION AND CIRCULATION 6.1.1 INTRODUCTION This section of the EIR presents the results of TJKM s traffic impact analysis of the proposed Greenbriar Development. The analysis includes consideration
VOA Vista Drive Residential housing Development TIA Project #13915 TABLE OF CONTENTS
 VOA Vista Drive Residential housing Development TIA Project #13915 TABLE OF CONTENTS Executive Summary... 2 Project Background... 2 Conditions... 2 Findings... 3 Recommendations... 4 Introduction... 6
Traffic Impact Analysis for 2171 Rosecrans Avenue
 Traffic Impact Analysis for 2171 Rosecrans Avenue Prepared for: Continental Development Corporation Revised May 2016 LA16-2831 Prepared by: Fehr & Peers 600 Wilshire Blvd, Suite 1050 Los Angeles, CA 90017
IV. ENVIRONMENTAL IMPACT ANALYSIS L. TRANSPORTATION/TRAFFIC
 IV. ENVIRONMENTAL IMPACT ANALYSIS L. TRANSPORTATION/TRAFFIC INTRODUCTION The following section summarizes the information provided in the traffic report entitled Traffic Impact Analysis for a Proposed
APPENDIX J LAKE WOHLFORD DAM REPLACEMENT PROJECT TRAFFIC IMPACT ANALYSIS (DAM REPLACEMENT) Lake Wohlford Dam Replacement Project EIR
 Lake Wohlford Dam Replacement Project EIR") APPENDIX J LAKE WOHLFORD DAM REPLACEMENT PROJECT TRAFFIC IMPACT ANALYSIS (DAM REPLACEMENT) Replacement Project EIR Appendices TRAFFIC IMPACT ANALYSIS LAKE WOHLFORD DAM Escondido, California December 19,
APPENDIX J LAKE WOHLFORD DAM REPLACEMENT PROJECT TRAFFIC IMPACT ANALYSIS (DAM REPLACEMENT) Replacement Project EIR Appendices TRAFFIC IMPACT ANALYSIS LAKE WOHLFORD DAM Escondido, California December 19,
April 7, Mr. Blake Shutler Compass Homes Development LLC Summit Homes Construction, LLC PO Box 6539 Dillon, CO 80435
 Compass Homes Development LLC Summit Homes Construction, LLC PO Box 6539 Dillon, CO 80435 Re: Trip Generation Comparison West Hills Townhomes Keystone, Colorado FHU Reference No. 116388-01 Dear Mr. Shutler:
TRAFFIC IMPACT STUDY FOR
 TRAFFIC IMPACT STUDY FOR YUBA CROSSINGS MIXED USE DEVELOPMENT Yuba City, CA Prepared For: Yuba Crossings LLC 1825 Del Paso Blvd Sacramento, CA 95815 Prepared By: KDAnderson & Associates, Inc. 3853 Taylor
Traffic Impact Study for Proposed Olive Boulevard Development
 Traffic Impact Study for Proposed 11330 Olive Boulevard Development Creve Coeur, Missouri July 7, 2017 Prepared For: 11330 Olive Boulevard Development 11330 Olive Boulevard Creve Coeur, Missouri 63141
MADERAS HOTEL TRANSPORTATION IMPACT ANALYSIS. LLG Ref Transportation Planner III & Jorge Cuyuch Transportation Engineer I
 TRANSPORTATION IMPACT ANALYSIS MADERAS HOTEL Poway, California June 21, 2016 LLG Ref. 3-16-2602 Prepared by: Amelia Giacalone Transportation Planner III & Jorge Cuyuch Transportation Engineer I Under the
Appendix C. Traffic Impact Study
 Appendix C Traffic Impact Study TRAFFIC STUDY FOR THE EAGLE ROCK AGGREGATE TERMINAL Prepared by: FEHR & PEERS 201 Santa Monica Blvd. Suite 500 Santa Monica, CA 90401-2213 T. (310) 458-9916 F. (310) 394-7663
TRAFFIC IMPACT ANALYSIS 661 BEAR VALLEY. Escondido, California September 1, LLG Ref
 TRAFFIC IMPACT ANALYSIS 661 BEAR VALLEY Escondido, California September 1, 2015 LLG Ref. 3-13-2299 EXECUTIVE SUMMARY The Project (Project) proposes the development of 55 residential dwelling units on 40.88
BERKELEY DOWNTOWN AREA PLAN PROGRAM ENVIRONMENTAL IMPACT REPORT TRAFFIC IMPACT ANALYSIS
 BERKELEY DOWNTOWN AREA PLAN PROGRAM ENVIRONMENTAL IMPACT REPORT TRAFFIC IMPACT ANALYSIS Prepared for: City of Berkeley Prepared by: REVISED JANUARY 9, 2009 Berkeley Downtown Area Plan Program EIR Traffic
APPENDICES. Appendix R Traffic Impact Analysis (January 2017)
") APPENDICES Appendix R Traffic Impact Analysis (January 2017) 661 Bear Valley Parkway EIR March 2017 APPENDICES This page intentionally left blank 661 Bear Valley Parkway EIR March 2017 TRAFFIC IMPACT ANALYSIS
APPENDICES Appendix R Traffic Impact Analysis (January 2017) 661 Bear Valley Parkway EIR March 2017 APPENDICES This page intentionally left blank 661 Bear Valley Parkway EIR March 2017 TRAFFIC IMPACT ANALYSIS
One Harbor Point Residential
 Residential Gig Harbor, WA Transportation Impact Analysis January 23, 2017 Prepared for: Neil Walter Company PO Box 2181 Tacoma, WA 98401 Prepared by: TENW Transportation Engineering NorthWest 11400 SE
Appendix G Traffic and Parking Report
 Appendix G Traffic and Parking Report TABLE OF CONTENTS SECTION PAGE Executive Summary... v 1.0 Introduction... 1 1.1 Study Area... 3 2.0 Project Description... 4 2.1 Site Location... 4 2.2 Existing Project
Table of Contents INTRODUCTION... 3 PROJECT STUDY AREA Figure 1 Vicinity Map Study Area... 4 EXISTING CONDITIONS... 5 TRAFFIC OPERATIONS...
 Crosshaven Drive Corridor Study City of Vestavia Hills, Alabama Table of Contents INTRODUCTION... 3 PROJECT STUDY AREA... 3 Figure 1 Vicinity Map Study Area... 4 EXISTING CONDITIONS... 5 TRAFFIC OPERATIONS...
Trafalgar Road & Lower Base Line Transportation Study Ontario Inc.
 Trafalgar Road & Lower Base Line Transportation Study 1255723 Ontario Inc. Trafalgar Road & Lower Base Line Transportation Study 1255723 Ontario Inc. 1465 Pickering Parkway Suite 200 Pickering ON L1V 7G7
105 Toronto Street South, Markdale Transportation Impact Study. Paradigm Transportation Solutions Limited
 105 Toronto Street South, Markdale Transportation Impact Study Paradigm Transportation Solutions Limited December 2016 Project Summary Project Number 162060 December 2016 Client Zelinka Priamo Ltd 318
INTERSECTION ANALYSIS PARK AVENUE AND BRADDOCK ROAD (FROSTBURG, MD) FOR LENHART TRAFFIC CONSULTING, INC.
 FOR LENHART TRAFFIC CONSULTING, INC.") INTERSECTION ANALYSIS FOR PARK AVENUE AND BRADDOCK ROAD (FROSTBURG, MD) Prepared for: City of Frostburg, Maryland & Allegany County Commissioners Prepared by: LENHART TRAFFIC CONSULTING, INC. TRAFFIC ENGINEERING
INTERSECTION ANALYSIS FOR PARK AVENUE AND BRADDOCK ROAD (FROSTBURG, MD) Prepared for: City of Frostburg, Maryland & Allegany County Commissioners Prepared by: LENHART TRAFFIC CONSULTING, INC. TRAFFIC ENGINEERING
LOTUS RANCH TRAFFIC IMPACT ANALYSIS. LLG Ref Senior Transportation Engineer & Charlene Sadiarin Transportation Engineer II
 TRAFFIC IMPACT ANALYSIS LOTUS RANCH El Centro, California April 26, 2016 LLG Ref. 3-14-2392 Prepared by: KC Yellapu, P.E Senior Transportation Engineer & Charlene Sadiarin Transportation Engineer II Under