Appendix C. Traffic Impact Study
|
|
|
- Dorothy Bennett
- 5 years ago
- Views:
Transcription
1 Appendix C Traffic Impact Study
2 TRAFFIC STUDY FOR THE EAGLE ROCK AGGREGATE TERMINAL Prepared by: FEHR & PEERS 201 Santa Monica Blvd. Suite 500 Santa Monica, CA T. (310) F. (310) Prepared for: Aspen Environmental Group and Port of Long Beach Ref: SM May 2012
3 TRAFFIC STUDY FOR THE EAGLE ROCK AGGREGATE TERMINAL May 2012 Prepared for: ASPEN ENVIRONMENTAL GROUP AND THE PORT OF LONG BEACH Prepared by: FEHR & PEERS 201 Santa Monica Boulevard, Suite 500 Santa Monica, California (310) Ref: SM
4 TABLE OF CONTENTS 1. INTRODUCTION... 1 PROJECT ALTERNATIVES DESCRIPTION... 1 STUDY SCOPE... 3 ORGANIZATION OF REPORT EXISTING CONDITIONS... 6 EXISTING HIGHWAY AND STREET SYSTEM... 6 EXISTING TRAFFIC VOLUMES AND LEVELS OF SERVICE TRAFFIC PROJECTIONS PROJECT TRIP GENERATION ESTIMATES PROJECT TRIP DISTRIBUTION AND TRIP ASSIGNMENT EXISTING PLUS PROJECT TRAFFIC PROJECTIONS FUTURE BASE TRAFFIC VOLUMES FUTURE (YEAR 2035) BASE TRAFFIC PROJECTIONS FUTURE (YEAR 2035) PLUS PROJECT TRAFFIC PROJECTIONS CRITERIA FOR DETERMINATION OF SIGNIFICANT TRAFFIC IMPACT TRAFFIC IMPACT ANALYSIS CEQA TRAFFIC IMPACT ANALYSIS NEPA CONGESTION MANAGEMENT PROGRAM ANALYSIS CONSTRUCTION-PERIOD IMPACT ANALYSIS ALTERNATIVE 1 CONSTRUCTION-PERIOD TRIP GENERATION ESTIMATES ALTERNATIVE 2 CONSTRUCTION-PERIOD TRIP GENERATION ESTIMATES ALTERNATIVE 3 CONSTRUCTION-PERIOD TRIP GENERATION ESTIMATES PROJECT CONSTRUCTION-PERIOD TRAFFIC IMPACT ANALYSIS CEQA PROJECT CONSTRUCTION-PERIOD TRAFFIC IMPACT ANALYSIS NEPA SUMMARY AND CONCLUSIONS APPENDICES Appendix A Lane Configurations Appendix B Traffic Counts Appendix C Level of Service Worksheets Appendix D Detailed Construction Activity Schedule and Proposed Construction Equipment
5 LIST OF FIGURES Figure 1 Conceptual Site Plan... 2 Figure 2 Study Area and Analyzed Intersections... 5 Figure 3 Existing (Year 2011) Peak Hour Traffic Volumes... 8 Figure 4 Estimated Hourly Project Trip Generation Figure 5 Project-Only Peak Hour Traffic Volumes (Alternatives 1 and 3) Figure 6 Project-Only Peak Hour Traffic Volumes (Alternative 2) Figure 7 Existing plus Project Peak Hour Traffic Volumes (Alternatives 1 and 3) Figure 8 Existing plus Project Peak Hour Traffic Volumes (Alternative 2) Figure 9 Future Base (Year 2035) Peak Hour Traffic Volumes Figure 10 Future Base (Year 2035) plus Project Peak Hour Traffic Volumes (Alternatives 1 and 3) Figure 11 Future Base (Year 2035) plus Project Peak Hour Traffic Volumes (Alternative 2) Figure 12 Project Only Construction Peak Hour Traffic Volumes (Alternatives 1 and 3) Figure 13 Project Only Construction Peak Hour Traffic Volumes (Alternative 2) Figure 14 Existing (Year 2011) plus Project Construction Peak Hour Traffic Volumes (Alternatives 1 and 3) Figure 15 Existing (Year 2011) plus Project Construction Peak Hour Traffic Volumes (Alternative 2) Figure 16 Future Base (Year 2013) Peak Hour Traffic Volumes (Alternative 3) Figure 17 Future Base (Year 2013) plus Project Construction Peak Hour Traffic Volumes (Alternative 1) Figure 18 Future Base (Year 2013) plus Project Construction Peak Hour Traffic Volumes (Alternative 2)... 52
6 LIST OF TABLES Table 1 Level of Service Definitions for Signalized Intersections ICU Method... 9 Table 2 Level of Service Definitions for Unsignalized Intersections HCM Method Table 3 Existing (Year 2011) Levels of Service Table 4 Estimated Weekday Hourly Truck Trips Table 5 Project Trip Generation Estimates Table 6 Existing plus Project Peak Hour Levels of Service and CEQA Impact Analysis (Alternatives 1 and 3) Table 7 Existing plus Project Peak Hour Levels of Service and CEQA Impact Analysis (Alternative 2). 28 Table 8 Future plus Project Peak Hour Levels of Service and CEQA Impact Analysis (Alternatives 1 and 3) Table 9 Future plus Project Peak Hour Levels of Service and CEQA Impact Analysis (Alternative 2) Table 10 Future (Year 2035) Intersection Level of Service and NEPA Impact Analysis (Alternative 1). 32 Table 11 Future (Year 2035) Intersection Level of Service and NEPA Impact Analysis (Alternative 2). 33 Table 12 Construction-Period Trip Generation Estimates (Alternative 1) Table 13 Construction-Period Trip Generation Estimates (Alternative 2) Table 14 Construction-Period Trip Generation Estimates (Alternative 3) Table 15 Existing plus Project Construction Peak Hour Levels of Service and CEQA Analysis (Alternatives 1 and 3) Table 16 Existing plus Project Construction Intersection Level of Service and CEQA Impact Analysis (Alternative 2) Table 17 Construction (Year 2013) Peak Hour Intersection Level of Service and NEPA Impact Analysis (Alternative 1) Table 18 Construction (Year 2013) Intersection Level of Service and NEPA Impact Analysis (Alternative 2)... 50
7 Traffic Study for the Eagle Rock Aggregate Terminal Project May INTRODUCTION Fehr & Peers conducted this study to evaluate the potential traffic impacts associated with the proposed development of an aggregate terminal in the Port of Long Beach (POLB, or Port) in Long Beach, California. This report identifies the base data and assumptions, explains the methodologies used, and summarizes the findings of the study, which was conducted in support of the Environmental Impact Statement/Environmental Impact Report (EIS/EIR) being prepared for the project. The traffic study conducted for the proposed facility analyzes potential project impacts against existing (2011) conditions and cumulative (2035) conditions for four project alternatives, including the No Project Alternative. The existing conditions baseline year is premised on the date that the project s Notice of Intent (NOI) to prepare an EIS/EIR and Notice of Preparation (NOP) were published (October 2011), per the requirements of the National Environmental Policy Act (NEPA) and California Environmental Quality Act (CEQA), respectively. Constructionn impacts during the most intense phase of project construction are also analyzed. PROJECT ALTERNATIVES DESCRIPTION This study analyzes the proposed project (Alternative 1) and three project alternatives at the same level of detail: Alternative 1 (Proposed Project) Eagle Rock Aggregates Incorporated (Eagle Rock or Applicant) proposes to construct and operate a sand, gravel and granite aggregate receiving, storage and distribution terminal (project). The project site is at 1925 Pier D Street (Berth D-44) and is currently vacant. Aggregate would be received from self-unloading Panamax-class into trucks for distribution to area customers. Construction of the vessels and stockpiled and then loadedd project as proposed would require the dredging of approximately 6,000 cubic yards (cy) of material from Channel 3, disposal of the dredged material at the Middle Harborr Slip No. 1 Fill Site, as well as site preparation, berth improvements, installation of a land-based conveyor and distribution system, and the placement of truck scales and a prefabricated (e.g., trailer) office building. Operation of the proposed project would have a maximum capacity of approximately 2.75 million tons per year and a peak hourly throughput capacity of 32 truckloads per hour. Figure 1 shows the conceptual site plan. Alternative 2 (Pier B Street Alternative) Alternative 2 would be located on a vacant site at 1710 Pier B Street (Berths B82 and B83), approximately 500 feet east of the intersection of Edison Street and Pier B Street. Construction of this alternative would start in late 2012 or early 2013, and the terminal would be operational by the fall of Alternative 2 would have the same throughput annual and hourly capacity as the proposed project. Alternative 3 (No Federal Action Alternative) The No Federal Action Alternative would be on the same site as the proposed project. However, under this alternative there would be no dredging in Channel 3 or wharf improvements to Berth D-44. Aggregate materials would be barged to the site and unloaded to the stockpile areas via conveyor systems. It is anticipated that construction would occur in late 2012 or early in 2013, and the site would become operational in Operation of Alternative 3 would have the same throughput annual and hourly capacity as the proposed project and is identical to Alternative 1 for the purposes of this traffic impact i analysis. 1
8
9 Traffic Study for the Eagle Rock Aggregate Terminal Project May 2012 Alternative 4 (No Project Alternative) Under the No Project Alternative (Alternative 4), implementation of the project would not occur. The proposed project site and Pier B Street Alternative site would both remain vacant and no project-related activities of any kind would be undertaken. STUDY SCOPE The scope of work for this study was developed in conjunction with POLB staff. The base assumptions and technical methodologies were discussed as part of the study approach. The study analyzes potential project-generated traffic impacts on the adjacent street system for three peak hours under existing, construction period, and cumulative (Year 2035) conditions. The following weekday traffic scenarios were analyzed for the morning (AM) peak hour (the peak hour between 6:00 and 9:00 AM) ), the midday (PM) peak hour (between 2:00 and 3:00 PM), and the evening (PM) peak hour (the peak hour between 3:00 and 6:00 PM): Existing (Year 2011) Conditions The analysis of existing year 2011 traffic conditions provides a basis for the remainder of the study. The existing conditions analysis includes an assessment of streets, traffic volumes, and operating conditions. Existing (Year 2011) plus Project Conditions This is an analysis of existing traffic conditions with traffic during both the construction phase and during the operational phase of each project alternative added. This scenario is assessed assuming peak project operating conditions and the peak phase of construction activity. Future (Year 2013) plus Construction Conditions This is an analysis of future traffic conditions with traffic expected from project construction under Alternatives 1, 2 and 4 relative to Alternative 3 (the No Federal Action Alternative). Future plus construction conditions under each alternative were developed for year 2013 to assess potential construction-related impacts under NEPA. Cumulative Base (Year 2035) Conditions Cumulative traffic conditions are projected without the proposed project in future year The objective of this analysis is to project future traffic growth and operating conditions that could be expected to result from regional ambient growth and known cumulative projects if the proposed project were not developed. Cumulative (Year 2035) plus Project Conditions This is an analysis of future traffic conditions with traffic expected from project operation added to the cumulative base traffic forecasts. Cumulative plus project conditions weree developed for year The objective of this analysis is to develop the traffic forecasts of the proposed project that are then used to assess potential project-related impacts. 3
10 Traffic Study for the Eagle Rock Aggregate Terminal Project May 2012 The nine intersections illustrated in Figure 2 were identified in consultation with Port staff for weekday peak hour analysis as part of the scope of work for this project: 1. Pier B Street/Pico Avenue & Long Beach Freeway (I-710) Southbound Ramps 2. Pier C Street & Pico Avenuee 3. Pier D Street/Water Street & Pico Avenue 4. Pier E Street/Eastbound Ocean Boulevard Ramps & Pico Avenue 5. Seaside Avenue & Navy Way 6. Anaheim Street & Farragut Street 7. Anaheim Street & I Street/West 9 th Street 8. Pier B Street & Edison Avenue 9. Pier B Street & Anaheim Way ORGANIZATION OF REPORT This report is divided into six chapters, including this introduction. Chapter 2 describes the existing conditions in the study area including an inventory of the streets, highways, and a summary of traffic volumes and an assessment of operating conditions. The methodologies used to develop traffic forecasts for cumulative conditions in 2035 and the forecasts themselves are presented in Chapter 3. Chapter 4 presents an assessment of potential local and regional traffic impacts that could result from the proposed project alternatives. The analysis of construction-period traffic impacts is provided in Chapter 5. Chapter 6 summarizes the key findings and conclusions of the study. Appendices to this report include details of the technical analysis. 4
11
12 Traffic Study for the Eagle Rock Aggregate Terminal Project May EXISTING CONDITIONS A comprehensive data collection effort was undertaken to develop a detailed description of existing conditions in the study area. The assessment of conditions relevant to this study includes an inventory of the street and highway systems, traffic volumes on these facilities, and operating conditions at key intersections. A detailed description of these elements is presented in this chapter. EXISTING HIGHWAY AND STREET SYSTEM The project site is in the Northeast Harbor Planning District of the Port of Long Beach. Primary regional access to the project area is provided by the I-710 east of the project site and by the Gerald Desmond Bridge and Ocean Boulevard/Seaside Avenue south of the project site. Seaside Avenue is designated as State Route (SR) 47 east of the Terminal Island Freeway (SR 103). Year 2010 data from the California Department of Transportation (Caltrans) shows that the average daily traffic (ADT) volume on I-710 south of Willow Street was approximately 150,000 vehicles per day (vpd) and 13,800 vpd on Seaside Avenue approaching State Route 103 on Terminal Island (2010 Traffic Volumes on Californiaa State Highways, California Department of Transportation, accessed January 2012). Both of these highways provide ramps on Pico Avenue. Following its reconstruction, the Gerald Desmond Bridge willl be designated as SR 710. Pico Avenue is a four-lane north/south street in the Port that lies west of I-710 and provides connections to the regional freeway system and to various berths and other facilities in the Port. Local access to the project site is provided by Pier D Street, a two-lane industrial street in the Port that runs west from Pico Avenue and terminates on Pier D south of the Gerald Desmond Bridge. Local accesss to the alternative project site is provided by Pier B Street, a two-lane industrial street that begins at Pico Avenue and terminates near the Terminal Island Freeway (SR 103). Pier B Street is accessible from Anaheim Street via Edison Avenue. Neither the project site nor the Pier B Street alternative site is served by public transit. Diagrams of the existing lane configurations at the analyzed intersections are provided in i Appendix A. EXISTING TRAFFIC VOLUMES AND LEVELS OF SERVICE This section presents the existing peak hour turning movement traffic volumes for the analyzed intersections, describes the methodology used to assess the traffic conditions at each intersection, and analyzes the resulting operating conditions at each, indicating volume-to-capacity (V/C) ratios and level of service (LOS). Existing Traffic Volumes New classified traffic counts were collected at study intersections 2 through 4 during the weekday AM peak period (between 6:00 and 9:000 AM), PM peak period (between 3:00 and 6:00 PM) ), and midday peak period (between 2:00 and 3:00 PM) in December This data was adjusted to account for the presence of heavy trucks in the traffic stream by applying a passenger-car equivalent (PCE) factor of 2.0 to tractor-trailer combinations, and a PCE factor of 1.1 was applied to bobtail trucks. Recent traffic count data for the other study intersections was furnished by Port staff for use in this study. This data was increased by a factor of one percent per year to estimate 2011 conditions. Existing weekday peak hour 6
13 Traffic Study for the Eagle Rock Aggregate Terminal Project May 2012 traffic volumes at the analyzed intersections are presented in Figure 3. Traffic count data sheets are provided in Appendix B. Level of Service Methodology LOS is a quantitative measure used to describe the condition of traffic flow, ranging from excellent freedefinitions for both flow conditions at LOS A to overloaded stop-and-go conditions at LOS F. LOS methodologies are provided in Tables 1 and 2. Intersection capacity and LOS have been analyzed using methods that assess the peak hour operating conditions at each study intersection. Two types of LOS analysis were conducted: Intersection Capacity Utilization (ICU) at signalized intersections; and, the Highway Capacity Manual (HCM) stop-controlled methodology at unsignalized intersections. Both methodologies are described below. Intersection Capacity Utilization The ICU method of intersection analysis was used to determine the intersection V/C ratio and corresponding LOS listed in Table 1 for the turning movements and intersection characteristics at the signalized intersections. The ICU value is determined by summing the V/C ratio sum of the critical movements, plus a factor for yellow signal time. Highway Capacity Manual Unsignalized intersections were analyzed using the Two-Way Stop method from the Highway Capacity Manual (Transportation Research Board, 2000). Delay was calculated based on the worst-case approach, and used to find the corresponding LOS listed in Table 2. The Traffix software package was used to produce the HCM results. Existing Peak Hour Levels of Service The existing weekday peak hour turning movement volumes presented in Figure 3 were used in conjunction with the LOS methodologies described above to determine existing operating conditions at each of the study intersections. LOS calculation worksheets are included in Appendix C. Table 3 summarizes the existing weekday peak hour V/C ratios and corresponding LOS at each of the study intersections. The results of this analysis indicate that all study intersections are currently operating at acceptable LOS (LOS C or better) during the weekday AM, PM, and midday peak hours. 7
14
15 Traffic Study for the Eagle Rock Aggregate Terminal Project May 2012 TABLE 1 LEVEL OF SERVICE DEFINITIONS FOR SIGNALIZED INTERSECTIONS ICU METHOD Level of Service Intersection Capacity Utilization (ICU) A B C D E F >1.000 Source: Adapted from Transportation Research Board Definition EXCELLENT. No vehicle waits longer than one red light and no approach phase is fully used. VERY GOOD. An occasional approach phase is fully utilized; many drivers begin to feell somewhat restricted within groups of vehicles. GOOD. Occasionally drivers may have to wait through more than one red light; backups may develop behind turning vehicles. FAIR. Delays may be substantial during portions of the rush hours, but enough lower volume periods occur to permit clearing of developing lines, preventing excessive backups. POOR. Represents the most vehicles intersection approaches can accommodate; may be long lines of waiting vehicles through several signal cycles. FAILURE. Backups from nearby locations or on cross streets may restrict or prevent movement of vehicles out of the intersection approaches. Tremendous delays with continuously increasing queue lengths. 9
16 Traffic Study for the Eagle Rock Aggregate Terminal Project May 2012 TABLE 2 LEVEL OF SERVICE DEFINITIONS FOR UNSIGNALIZED INTERSECTIONS HCM METHOD Level of Servi ce Intersection Control Delay (sec/veh) 1 A Little to no congestion or delays. B Limited congestion. Short delays. C Some congestion with average delays. D Significant congestion and delays. E Severe congestion and delays. F > 50.0 Total breakdown with extreme delays. Notes: 1. Control delay includes initial deceleration delay, queue move-up time, stopped delay, and acceleration delay. Source: Highway Capacity Manual (Transportation Research Board, 2000). General Description 10
17 TABLE 3 EXISTING (YEAR 2011) LEVELS OF SERVICE NO. INTERSECTION PEAK EXISTING (YEAR 2011) HOUR V/C DELAY* LOS 1 Pier B St & Pico Ave AM A Signalized PM A MID A 2 Pico Ave & Pier C St AM A Signalized PM A MID A 3 Pico Ave & Pier D St/Water St AM A 4-Way Stop PM A MID A 4 Pico Ave & Pier E St/EB Ocean Ave AM A 4-Way Stop PM A MID A 5 Navy Way and Seaside Ave AM A Signalized PM B MID A 6 Anaheim St & Farragut Ave AM A Signalized PM A MID A 7 Anaheim St & 1 St/West 9th St AM A Signalized PM A MID A 8 Pier B St & Edison Ave AM -- 9 A 2-Way Stop PM -- 9 A [1] MID -- 9 A 9 Anaheim Way & Pier B St AM A 4-Way Stop PM A MID A Notes: * Average stopped delay per vehicle, in seconds. [1] Worst approach LOS was used to determine increment for impact.
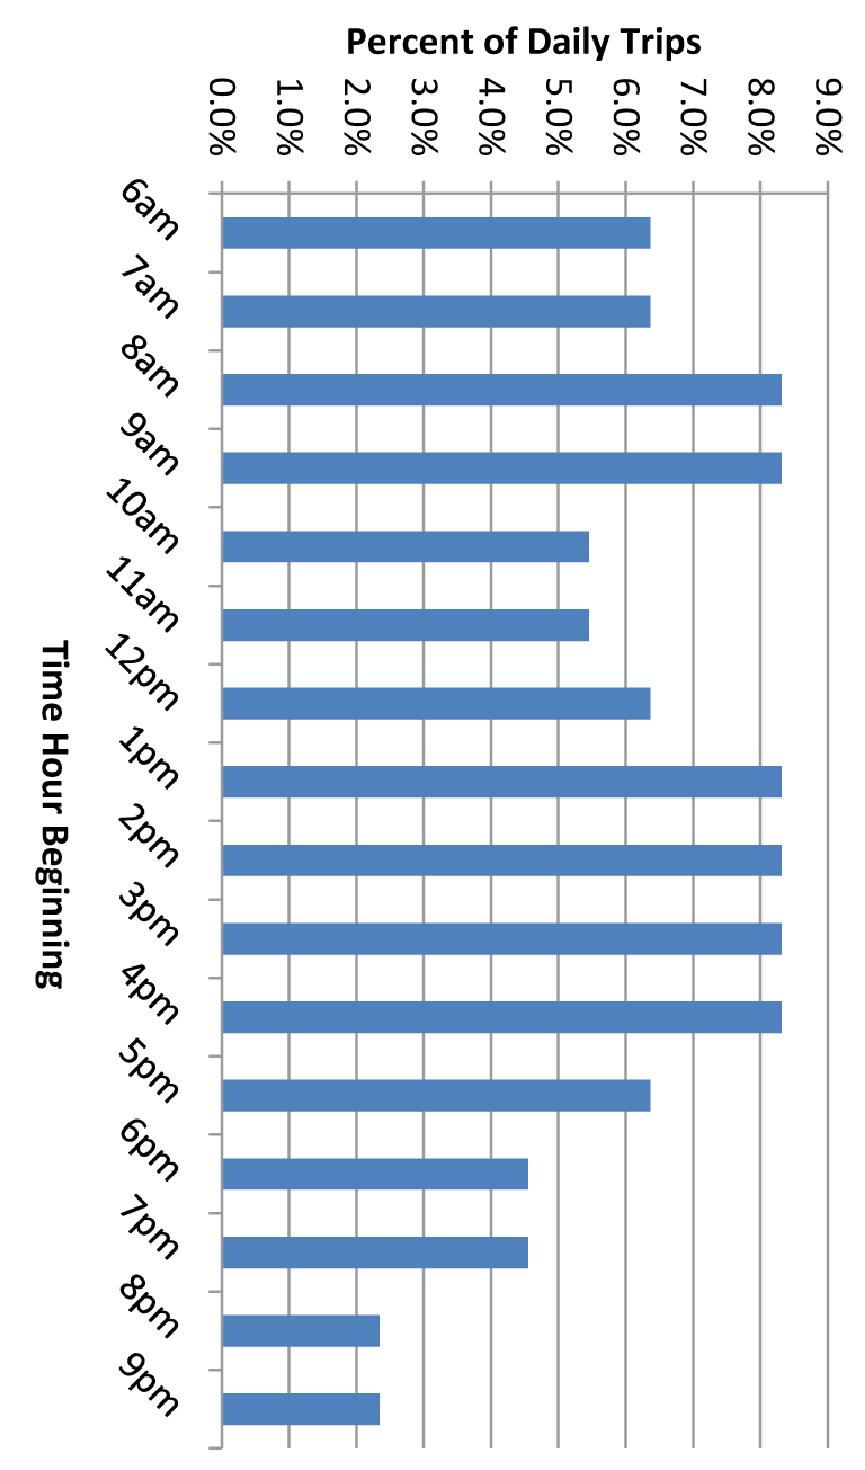
18 Traffic Study for the Eagle Rock Aggregate Terminal Project May TRAFFIC PROJECTIONS Development of the trip generationn estimates for the project alternatives involved a three-step t process including traffic generation, trip distribution, and traffic assignment. PROJECT TRIP GENERATION ESTIMATES Trip generation estimates were prepared for the future operating conditions of the project based on information from the Applicant on the expected operation of the facility. The proposed project would operate 52 weeks per year with two weekday shifts and one Saturday shift. On an average day, it is estimated that 770 truck trips (385 inbound plus 385 outbound) would occur at the project site. Each truck is assumed to have a 25-ton capacity. The estimated maximum hourly throughput for the facility of 32 truck loads per hour was identified for use in this study using information developed in the Eagle Rock Terminal Capacity Analysis (AECOM US, January 5, 2012). The estimated weekday hourly throughput shown in Table 4 and Figure 4 was extrapolated from dataa on actual hourly throughput at a similar facility operated by Eagle Rock in Richmond, California. Actual hourly throughput at the facility will vary depending on market demand. The maximum estimated annual throughput of the facility is 2.75 million tons. A total of four full-time employees would be required to operate the facility, including two equipment operators, one weigh master and a site manager. Up to 35 vessel calls per year would be expected, and approximately four to six additional l workers (longshoremen) would be on site when a vessel is present. Because of the intermittent and unpredictable timing of ship calls, trips associated with these additional workers were not included in project trip generation estimates. Because the project site is not served by public transit and to provide a conservative analysis, all employees are assumed to travel by private automobile; that is, no employee carpooling has been assumed (average vehicle ridership of 1.0). A PCE factor of 2.0 was applied to truck trips. Table 5 shows the trip generationn estimates for the proposed project that were developed using the assumptions described above. As shown in Table 5, the new facility would generate a maximum of approximately 1,556 daily PCE trips, of which 128 trips would be estimated to occur in the AM and PM peak hours (64 inbound, 64 outbound) and 136 PCE trips would be estimated to occur in the midday peak hour (68 inbound, 68 outbound). PROJECT TRIP DISTRIBUTION AND TRIP ASSIGNMENT The regional trip distribution pattern was estimated based on the potential market areaa for the aggregate materials and was confirmed by the project Applicant. From the regional distribution perspective, 10% of the truck trips would travel west via SR 47 and 90% would use I-710 to access the project site. Employee trip distribution was estimated based on the location of the site in the context of the surrounding developed areas. Employee trips were assigned 50% to/from the north and 50% to/from the west. Estimated project-only peak hour trips for Alternatives 1 and 3 are shown in Figure 5. Estimated project- only peak hour trips for Alternative 4 are shown in Figure 6. 12
19 TABLE 4 ESTIMATED WEEKDAY HOURLY TRUCK TRIPS Time Hour Beginning Percent Trips per Hour 6am 6% 49 7am 6% 49 8am 8% 64 9am 8% 64 10am 5% 42 11am 5% 42 12pm 6% 49 1pm 8% 64 2pm 8% 64 3pm 8% 64 4pm 8% 64 5pm 6% 49 6pm 5% 35 7pm 5% 35 8pm 2% 18 9pm 2% 18 Total 100% 770
20
21 Estimated Trip Generation Land Use Type Daily AM Peak Hour Trips MD Peak Hour Trips PM Peak Hour Trips Trips In Out Total In Out Total In Out Total Aggregate Passenger Car Equivalent 1, Employees (autos) Total 1, Notes: TABLE 5 PROJECT TRIP GENERATION ESTIMATES - Employee shift changes occur at 6:00 AM and 2:00 PM (outside of the AM and PM peak hour). - Aggregate trucks have been assumed as "tractor trailers" with a passenger car equivalent of two cars per heavy vehicle.
22
23
24 Traffic Study for the Eagle Rock Aggregate Terminal Project May 2012 EXISTING PLUS PROJECT TRAFFIC PROJECTIONS The estimated project traffic volumes described above were added to the existing (2011) traffic volumes to develop the existing plus project traffic volumes. Figure 7 illustrates the resulting projected existing plus project peak hour traffic volumes for the analyzed weekday peak hours for Alternatives 1 and 3. Figure 8 illustrates the existing plus project traffic volumes for Alternative 2. FUTURE BASE TRAFFIC VOLUMES The nine study intersections were analyzed for cumulative year 2035 conditions without and with the addition of project-generated traffic.. The future base traffic projections reflect the changes to existing traffic conditions that can be expected from three primary sources. The first source is the ambient growth in traffic, which reflects increases in traffic because of regional growth and development. The second source is traffic generated by specific development projects located within, or in the vicinity of, the study area (also known as related projects ). The third source is roadway or intersection capacity enhancements. These factors are described below. Areawide Traffic Growth Forecast traffic volumes for the study intersections in year 2030 were obtained from the Port s travel demand forecasting model and were provided by Port staff. These forecasts include traffic growth for the Port and the local area expected to result from regional growth in employment, population, schools, and other activities, with one exception as described in the next section. Following consultation with Port staff, a one percent annual growth rate was applied to estimate 2035 conditions. Related Project Traffic Generationn and Assignment Future base traffic forecasts include the effects of specific cumulative development projects expected to be built in the vicinity of the proposed project site prior to the proposed project s future years of A concrete batch plant in the Berth D-43 backlands area was included in the related project traffic generation and assignment, as it is currently planned for development; Berth D-43 is located immediately west of the proposed project site. Normal operating hours for this facility would be 7:00 AM to 2:00 PM with two to three employees on site. It is expected to generate 125 to 140 truck round trips per day. AM and midday peak hour truck trip generation for this planned project was estimated to be 20 round trip truck trips, or 40 PCE trips inbound and 40 PCE trips outbound. In addition, outbound employee trips were assumed to occur in the midday peak hour. The regional distribution of these trips was assumed to be generally similar to that of truck trips generated by the proposed project alternatives, with a portion of those trips staying in the Port, including one to two truckloads per hour between the concrete batch plant and the Mitsubishi cement facility on Pier F Street. Future Baseline Street Improvements Per information received from Port staff, several study intersections will be modified by cumulative year 2035 either as the result of capital improvement projects at the Port or as mitigation for approved projects in the vicinity. These improvements would result in capacity changes at the analyzed intersections specified below. Pier B Street/Pico Avenue & I-710 Southbound Ramps (study intersection 1) will be modified to remove the existing free right turn on the westbound approach. 18
25
26
27 Traffic Study for the Eagle Rock Aggregate Terminal Project May 2012 Pier B Street/Pico Avenue & I-710 Southbound Ramps (study intersection 1) will be modified to remove the existing free right turn on the westbound approach. Pier D Street/Water Street & Pico Avenue (study intersection 3) will be signalized. Pier E Street/Eastbound Ocean Boulevard Ramps & Pico Avenue (study intersection 4) will be signalized and the westbound approach will be modified to provide one shared through/left-turn lane and one right-turn lane. Future lane geometries are includedd in Appendix A of this report. FUTURE (YEAR 2035) BASE TRAFFIC PROJECTIONS Figure 9 illustrates the future base weekday peak hour traffic volume projections for cumulative 2035 conditions at the analyzed intersections. The future base traffic conditions represent an estimate of future conditions without development of the proposed project. FUTURE (YEAR 2035) PLUS PROJECT TRAFFIC PROJECTIONS The proposed project traffic volumes shown in Figures 5 and 6 were modified slightly to reflect future changes in the local street network and were added to the future base traffic projections to develop the future plus project traffic forecasts for the year Figure 10 illustrates the resulting projected future plus project (Alternatives 1 and 3) peak hour traffic volumes for typical weekday AM, PM, and midday peak hours with the inclusion of peak throughput project traffic. Figure 11 illustrates the projected future plus project (Alternative 2) peak hour traffic volumes. These volumes represent future traffic conditions following completion of the proposed project for the 2035 analysis year. For the traffic impact analysis under CEQA, Alternative 4 (No Project) represents cumulative baseline conditions. For the traffic impact analysis under NEPA, Alternative 3 (No Federal Action) represents cumulative baselinee conditions. 21
28
29
30
31 Traffic Study for the Eagle Rock Aggregate Terminal Project May LEVEL OF SERVICE AND SIGNIFICANT IMPACT ANALYSIS This section presents an analysis of the existing and future without and with project alternative traffic to determine the potential traffic impacts of the proposed project on the operating conditions of the surrounding street system. The traffic impact analysis compares the projected LOS at each study intersection under existing and future plus project alternative conditions to the existing and future base conditions to estimate the incremental increase in the V/C ratio caused by the proposed project. This provides the information needed to assess the potential impact of the project using significance criteria established by the Port and the Los Angeles Department of Transportation (LADOT). Detailed LOS calculations are included in Appendix C. CRITERIA FOR DETERMINATION OF SIGNIFICANT TRAFFIC IMPACT All but one of the study intersections are in the City of Long Beach. The exception is Seaside Avenue & Navy Way (study intersection 5) in the City of Los Angeles. For those study intersections in Long Beach, significance criteria established by the POLB were used to assess the potential for significant project impacts. The POLB has established threshold criteria to determine the significant traffic impacts of a proposed project in its jurisdiction. Under these guidelines, a signalized intersection would be significantly impacted with an increase in V/C ratio equal to or greater than 0.02 for intersections projected to operate at LOS E or F without the addition of project traffic, or that are projected to decline to LOS E or F with the addition of project V/C being attributable to project traffic. An unsignalized intersection would be considered significantly impacted with an increase in delay of 2 percent or more if under projected LOS E or F conditions. City of Los Angeles significance criteria were used to assess the potential for significant impacts at study intersection 5, which is located in that city. The City of Los Angeles has established threshold criteria to determine the significant traffic impacts of a proposed project. Under the LADOT guidelines, an intersection would be significantly impacted with an increase in V/C ratio equal to or greater than 0.04 for intersections operating at LOS C, equal to or greater than 0.02 for intersections operating at LOS D, and equal to or greater than 0.01 for intersections operating at LOS E or F after the addition of project traffic. Intersections operating at LOS A or B after the addition of the project traffic are not considered significantly impacted regardless of the increase in V/C ratio. The following summarizes the impact criteria: LOS Final V/C Ratio Project-related Increase in V/C C > equal to or greater than D > equal to or greater than E or F > equal to or greater than
32 Traffic Study for the Eagle Rock Aggregate Terminal Project May 2012 TRAFFIC IMPACT ANALYSIS CEQA Existing plus Project Traffic Conditions Project impacts under CEQA were compared against existing conditions, which are described in Chapter 2. The existing plus project peak hour traffic volumes illustrated in Figures 7 and 8 were analyzed to determine the projected existing operating conditions with the addition of the proposed project traffic for each alternative. The results of this analysis are presented in Tables 6 and 7. As indicated in the tables, all nine study intersections would continue to operate at LOS D or better during each analyzed peak hour. Project Intersection Impacts Existing plus Project To determine whether significant impacts would occur, the existing plus project operating conditions were compared to the existing operating conditions. As shown in Tables 6 and 7, using the criteria described above for determination of significant impacts, Alternatives 1, 2 and 3 would not result in i significant traffic impacts under existing plus project conditions. Because Alternative 4, the No Project Alternative, would not involve any new development on the project site, there would be no operational impacts for Alternative 4. Future Base (Year 2035) Traffic Conditions Cumulative impacts under CEQA were compared against Future (Year 2035) No Project (Alternative 4) conditions. Future base traffic projections presented in Figure 9 were analyzed to establish future base operating conditions without the project. As shown in Tables 8 and 9, eight of the nine intersections are projected to operate at LOS D or better during the analyzed peak hours. The intersection of Navy Way & Seaside Avenue is projected to operate at LOS F during the weekday AM and PM peak hours. Future (Year 2035) plus Project Traffic Conditions The resulting future (year 2035) plus project peak hour traffic volumes for Alternatives 1 and 3, illustrated in Figure 10, and for Alternative 2, illustrated in Figure 11, were analyzed to project future operating conditions with the addition of the proposed project traffic. As shown in Tables 8 and 9, the intersection of Navy Way & Seaside Avenue is projected to operate at LOS F during the weekday AM and PM peak hours. Project Intersection Impact Analysis Year 2035 To determine whether significant impacts would occur, the future plus project (2035) operating conditions were compared to the 2035 future base operating conditions. As shown in Tables 8 and 9, using the criteria described above for determination of significant impacts, Alternatives 1, 2 and 3 would not result in significant traffic impacts under future (2035) plus project conditions. Because Alternative 4, the No Project Alternative, would not involve any new development on the project site, there would be no operational impacts for Alternative 4. Because no significant impacts are identified, no traffic mitigation measures would be required. 26
33 NO. TABLE 6 EXISTING PLUS PROJECT PEAK HOUR LEVELS OF SERVICE AND CEQA IMPACT ANALYSIS (ALTERNATIVES 1 AND 3) INTERSECTION PEAK HOUR CEQA BASELINE (EXISTING 2011) EXISTING + ALTS 1 AND 3 PROJECT INCREASE SIGNIFICANT IMPACT? V/C DELAY* LOS V/C DELAY* LOS IN V/C 1 Pier B St & Pico Ave AM A A NO Signalized PM A A NO MID A A NO 2 Pico Ave & Pier C St AM A A NO Signalized PM A A NO MID A A NO 3 Pico Ave & Pier D St/Water St AM A A NO 4-Way Stop PM A A NO MID A A NO 4 Pico Ave & Pier E St/EB Ocean Ave AM A A 0 NO 4-Way Stop PM A A 0 NO MID A A 0 NO 5 Navy Way and Seaside Ave AM A A NO Signalized PM B B NO MID A A NO 6 Anaheim St & Farragut Ave AM A A 0 NO Signalized PM A A 0 NO MID A A 0 NO 7 Anaheim St & 1 St/West 9th St AM A A 0 NO Signalized PM A A 0 NO MID A A 0 NO 8 Pier B St & Edison Ave AM -- 9 A -- 9 A -- NO 2-Way Stop PM -- 9 A -- 9 A -- NO [1] MID -- 9 A -- 9 A -- NO 9 Anaheim Way & Pier B St AM A A 0 NO 4-Way Stop PM A A 0 NO MID A A 0 NO Notes: * Average stopped delay per vehicle, in seconds. [1] Worst approach LOS was used to determine increment for impact.
34 NO. TABLE 7 EXISTING PLUS PROJECT PEAK HOUR LEVELS OF SERVICE AND CEQA IMPACT ANALYSIS (ALTERNATIVE 2) INTERSECTION PEAK HOUR CEQA BASELINE (EXISTING 2011) EXISTING + ALT 2 PROJECT INCREASE SIGNIFICANT IMPACT? V/C DELAY* LOS V/C DELAY* LOS IN V/C 1 Pier B St & Pico Ave AM A A NO Signalized PM A A NO MID A A NO 2 Pico Ave & Pier C St AM A A NO Signalized PM A A NO MID A A NO 3 Pico Ave & Pier D St/Water St AM A A NO 4-Way Stop PM A A NO MID A A NO 4 Pico Ave & Pier E St/EB Ocean Ave AM A A 0 NO 4-Way Stop PM A A 0 NO MID A A 0 NO 5 Navy Way and Seaside Ave AM A A NO Signalized PM B B NO MID A A NO 6 Anaheim St & Farragut Ave AM A A NO Signalized PM A A 0 NO MID A A NO 7 Anaheim St & 1 St/West 9th St AM A A 0 NO Signalized PM A A 0 NO MID A A 0 NO 8 Pier B St & Edison Ave AM -- 9 A -- 9 A -- NO 2-Way Stop PM -- 9 A -- 9 A -- NO [1] MID -- 9 A -- 9 A -- NO 9 Anaheim Way & Pier B St AM A A NO 4-Way Stop PM A A 0 NO MID A A NO Notes: * Average stopped delay per vehicle, in seconds. [1] Worst approach LOS was used to determine increment for impact.
35 NO. TABLE 8 FUTURE PLUS PROJECT PEAK HOUR LEVELS OF SERVICE AND CEQA IMPACT ANALYSIS (ALTERNATIVES 1 AND 3) INTERSECTION PEAK HOUR CEQA BASELINE (YEAR 2035 NO FUTURE + ALTS 1 AND 3 PROJECT) V/C DELAY* LOS V/C DELAY* LOS PROJECT INCREASE SIGNIFICANT IMPACT? IN V/C 1 Pier B St & Pico Ave AM C C NO Signalized PM C C NO MID C C NO 2 Pico Ave & Pier C St AM A A NO Signalized PM A A NO MID A A 0.02 NO 3 Pico Ave & Pier D St/Water St AM B B NO Signalized PM B B 0.03 NO MID B B NO 4 Pico Ave & Pier E St/EB Ocean Ave AM B B 0 NO Signalized PM B B 0 NO MID B B 0 NO 5 Navy Way and Seaside Ave AM F F NO Signalized PM F F NO MID D D 0 NO 6 Anaheim St & Farragut Ave AM B B 0 NO Signalized PM C C 0 NO MID B B NO 7 Anaheim St & 1 St/West 9th St AM C C 0 NO Signalized PM C C 0 NO MID D D 0 NO 8 Pier B St & Edison Ave AM B B -- NO 2-Way Stop PM C C -- NO [1] MID C C -- NO 9 Anaheim Way & Pier B St AM C C 0 NO 4-Way Stop PM C C 0 NO MID C C NO Notes: * Average stopped delay per vehicle, in seconds. [1] Worst approach LOS was used to determine increment for impact.
36 NO. TABLE 9 FUTURE PLUS PROJECT PEAK HOUR LEVELS OF SERVICE AND CEQA IMPACT ANALYSIS (ALTERNATIVE 2) INTERSECTION PEAK HOUR CEQA BASELINE (YEAR 2035 NO FUTURE + ALT 2 PROJECT) V/C DELAY* LOS V/C DELAY* LOS PROJECT INCREASE SIGNIFICANT IMPACT? IN V/C 1 Pier B St & Pico Ave AM C C NO Signalized PM C D NO MID C D NO 2 Pico Ave & Pier C St AM A A NO Signalized PM A A NO MID A A NO 3 Pico Ave & Pier D St/Water St AM B B 0 NO Signalized PM B B 0 NO MID B B NO 4 Pico Ave & Pier E St/EB Ocean Ave AM B B 0 NO Signalized PM B B 0 NO MID B B 0 NO 5 Navy Way and Seaside Ave AM F F NO Signalized PM F F NO MID D D 0 NO 6 Anaheim St & Farragut Ave AM B B NO Signalized PM C C NO MID B B NO 7 Anaheim St & 1 St/West 9th St AM C C 0 NO Signalized PM C C 0 NO MID D D 0 NO 8 Pier B St & Edison Ave AM B B -- NO 2-Way Stop PM C C -- NO [1] MID C C -- NO 9 Anaheim Way & Pier B St AM C C NO 4-Way Stop PM C C NO MID C C NO Notes: * Average stopped delay per vehicle, in seconds. [1] Worst approach LOS was used to determine increment for impact.
37 Traffic Study for the Eagle Rock Aggregate Terminal Project May 2012 TRAFFIC IMPACT ANALYSIS NEPA NEPA Baseline Traffic Conditions Impacts under NEPA were compared against Future (Year 2035) No Federal Action (Alternative 3) conditions. Future plus project with no federal action traffic projections, shown in Figure 10 were analyzed to establish future base operating conditions. As shown in Tables 10 and 11, eight of the nine intersections are projected to operate at LOS D or better during the analyzed peak hours. The intersection of Navy Way & Seaside Avenue is projected to operate at LOS F during the weekday AM and PM peak hours. NEPA Baseline plus Project Traffic Conditions Projected future (year 2035) plus project peak hour traffic volumes for Alternative 1, illustrated in Figure 10, and for Alternative 2, illustrated in Figure 11, were analyzed to project future operating conditions with the addition of the proposed project alternative traffic. As shown in Tables 10 and 11, the intersection of Navy Way & Seaside Avenue is projected to operate at LOS F during the weekday AM and PM peak hours. Project Intersection Impact Analysis NEPA To determine whether significant impacts would occur, the future plus project (2035) operating conditions were compared to the 2035 future baseline operating conditions. As shown in Tables 10 and 11, using the criteria described above for determination of significant impacts, none of the project alternatives would result in significant traffic impacts under future (2035) plus project conditions. By definition, Alternative 3 would result in no impact under NEPA. Because Alternative 4, the No Project Alternative, would not involve any new activity, there would be no impacts for Alternative 4. Because no significant impacts are identified, no traffic mitigation measures would be required. CONGESTION MANAGEMENTT PROGRAM ANALYSIS This section presents the regional transportation system impact analysis conducted in accordance with the procedures outlined in the 2010 Congestion Management Program for Los Angeles County (CMP) (Metro, October 2010). The CMP requires that when an EIR is prepared for a project, traffic impact analyses be conducted for select regional facilities based on the quantity of project traffic expected to use these facilities. 31
38 TABLE 10 FUTURE (YEAR 2035) INTERSECTION LEVEL OF SERVICE AND NEPA IMPACT ANALYSIS (ALTERNATIVE 1) NO. INTERSECTION PEAK HOUR NEPA BASELINE (NO FEDERAL FUTURE + ALTERNATIVE 1 ACTION ALTERNATIVE) V/C DELAY* LOS V/C DELAY* LOS PROJECT INCREASE IN V/C SIGNIFICANT IMPACT? 1 Pier B St & Pico Ave AM C C 0 NO Signalized PM C C 0 NO MID C C 0 NO 2 Pico Ave & Pier C St AM A A 0 NO Signalized PM A A 0 NO MID A A 0 NO 3 Pico Ave & Pier D St/Water St AM B B 0 NO Signalized PM B B 0 NO MID B B 0 NO 4 Pico Ave & Pier E St/EB Ocean Ave AM B B 0 NO Signalized PM B B 0 NO MID B B 0 NO 5 Navy Way and Seaside Ave AM F F 0 NO Signalized PM F F 0 NO MID D D 0 NO 6 Anaheim St & Farragut Ave AM B B 0 NO Signalized PM C C 0 NO MID B B 0 NO 7 Anaheim St & 1 St/West 9th St AM C C 0 NO Signalized PM C C 0 NO MID D D 0 NO 8 Pier B St & Edison Ave AM B B -- NO Two-Way Stop PM C C -- NO [1] MID C C -- NO 9 Anaheim Way & Pier B St AM C C 0 NO Four-Way Stop PM C C 0 NO MID C C 0 NO Notes: * Average stopped delay per vehicle, in seconds. [1] Worst approach LOS was used to determine increment for impact.
39 TABLE 11 FUTURE (YEAR 2035) INTERSECTION LEVEL OF SERVICE AND NEPA IMPACT ANALYSIS (ALTERNATIVE 2) NO. INTERSECTION PEAK HOUR NEPA BASELINE (NO FEDERAL FUTURE + ALTERNATIVE 2 ACTION ALTERNATIVE) V/C DELAY* LOS V/C DELAY* LOS PROJECT INCREASE IN V/C SIGNIFICANT IMPACT? 1 Pier B St & Pico Ave AM C C NO Signalized PM C D NO MID C D NO 2 Pico Ave & Pier C St AM A A NO Signalized PM A A NO MID A A NO 3 Pico Ave & Pier D St/Water St AM B B NO Signalized PM B B NO MID B B NO 4 Pico Ave & Pier E St/EB Ocean Ave AM B B 0 NO Signalized PM B B 0 NO MID B B 0 NO 5 Navy Way and Seaside Ave AM F F 0 NO Signalized PM F F 0 NO MID D D 0 NO 6 Anaheim St & Farragut Ave AM B B NO Signalized PM C C NO MID B B NO 7 Anaheim St & 1 St/West 9th St AM C C 0 NO Signalized PM C C 0 NO MID D D 0 NO 8 Pier B St & Edison Ave AM B B -- NO Two-Way Stop PM C C -- NO [1] MID C C -- NO 9 Anaheim Way & Pier B St AM C C NO Four-Way Stop PM C C NO MID C C NO Notes: * Average stopped delay per vehicle, in seconds. [1] Worst approach LOS was used to determine increment for impact.
40 Traffic Study for the Eagle Rock Aggregate Terminal Project May 2012 The CMP guidelines require that the first issue to be addressed is the determination of the geographic scope of the study area. The criteria for determining the study area for CMP arterial monitoring intersections and for freeway monitoring locations are: All CMP arterial monitoring intersections where the proposed project will addd 50 or more trips during either the AM or PM peak hours of adjacent street traffic. All CMP mainline freeway monitoring locations where the proposed project will add 150 or more trips, in either direction, during either the AM or PM peak hours. The CMP traffic impact analysis guidelines establish that a significant project impact occurs when the following threshold is exceeded: The proposed project increases traffic demand on a CMP facility by 2% of capacity (V/C 0.02), causing LOS F (V/C > 1.00) ). If the facility is already at LOS F, a significant impact occurs when the proposed project increases traffic demand on a CMP facility by 2% of capacity (V/C 0.02). Arterial Monitoring Station Analysis The CMP arterial monitoring stations nearest to the project study area are located one to two miles from the sites of the project alternatives: Pacific Coast Highway & Santa Fe Avenue Pacific Coast Highway & Alameda Street Given the regional nature of the market for the aggregate that would be imported to the project site on Pier D Street or Pier B Street, and the trip distribution pattern described in Chapter 3, the project would add fewer than 50 peak hour vehicle trips through either of these arterial monitoring stations; as such, no further analysis of CMP arterial intersections is required, and CMP arterial intersection impacts are considered to be less than significant. Freeway Mainline Monitoring Station Analysis This section presents an analysis of potential project impacts on the regional transportation system. This analysis was conducted in accordance with the transportation impact analysis procedures outlined in the CMP. The nearest CMP mainline freeway monitoring locations nearest to the project site are: I-710 between Pacific Coast Highway and Willow Street I-710 between 405 and south of Del Amo Boulevard I-110 between Wilmington Avenue and south of C Street According to the project trip generation estimates developed in Chapter 3 and the project-only traffic volumes illustrated in Figures 5 and 6, the proposed project is not expected to add sufficient new traffic to meet the freeway analysis criteria at these locations. Since incremental project-related traffic in any direction during either peak hour is projected to be less than the minimum criteria of 150 vph, no further CMP freeway analysis is required, and CMP freeway impacts are considered to be less than significant. 34
41 Traffic Study for the Eagle Rock Aggregate Terminal Project May CONSTRUCTION-PERIOD IMPACT ANALYSIS Project impacts under CEQA were compared against existing conditions, which are described in Chapter 2. Construction of the proposed project alternatives would occur in two phases. Because Phase 1 would be the most intensive period of activity for each alternative, detailed trip generation estimates for Phase 1 for each alternative were prepared and analyzed to assess the maximum potential for project impacts. As described, the peak of project construction traffic is analyzed against existing (2011) conditions for the CEQA impact analysis, while the NEPA analysis compares year 2013 conditions with Alternative 3 (the No Federal Action alternative) against estimated conditions with the addition of construction traffic under Alternatives 1, 2 and 4. Cumulative base traffic forecasts were developed by applying a one percent per year ambient growth factor to groww the existing 2011 baseline volumes to estimate 2013 volumes. For the traffic impact analysis under NEPA, Alternative 3 (No Federal Action) represents cumulative baseline conditions against which the other alternatives were compared. ALTERNATIVE 1 CONSTRUCTION-PERIOD TRIP GENERATION ESTIMATES Construction of Alternative 1 would be expected to begin in late 2012 or early 2013, and Phase 1 would occur over a period of approximately five months ending in Phase 2 would occur when throughput reaches one million tons per year, at which time a semi-portable conveyor system would be dismantled and replaced with a fixed conveyor system and a second truck scale would be installed over a three- month period. Construction activity would be expected to occur between 7:00 AM and 4:00 PM, Monday through Friday, but could also occur on Saturdays as needed. No road closures would be anticipated during construction, as the construction activities would occur within the project site on Pier D Street. Details of the construction schedulee and proposed construction equipment are providedd in Appendix D. Phase 1A1 Phase 1A2 Phase 1A3 Phase 1A4 Phase 1B Phase 1C Phase 1D Phase 1E Phase 2A Phase 2B Site Preparation & Dredging (Truck Dredged Material) Site Preparation & Dredging (Clearing) Site Preparation & Dredging (Grading) Site Preparation & Dredging (Road Construction) Pile Driving Concrete Forming Steel Erection Electrical Steel Erection Electrical Table 12 presents the anticipated construction schedule for Alternative 1 and the estimated daily and peak hour trip generation during each sub-phase of Phase 1. For a worst-case scenario analysis, the estimated peak hour traffic volumes were generated by conservatively assuming that all workers would arrive at the site during the AM peak hour (7:00 to 8:00 AM), and leave the site during the PM peak hour 35
42 Traffic Study for the Eagle Rock Aggregate Terminal Project May 2012 (4:00 to 5:00 PM). Truck trips weree converted to PCEs by applying a PCE factor of Then, the daily truck trips were averaged across an 8-hour daily construction schedule and multiplied by 1.5, which assumes that the peak hour is 50 percent busier than the average hour. It was assumed that 50 percent of the truck trips generated during the peak hours would be inbound trips and the remaining 50 percent would be outbound trips. The initial period of project construction, expected to last one month, would generate the most traffic to and from the site. The dredged material would be transported either by barge or by truck to the Middle Harbor Slip No. 1 fill site, approximately 1.2 miles from the project site. If it is transported by truck, the identified haul route would use Pier D Street west of the project site, rather than Pico P Avenue. This activity, Phase 1A1, would occur concurrently with Phases 1A2 and 1A3, but not with Phase 1A4. Phases 1A2 through 1A4 would occur concurrently and would generate more off-site traffic than Phases 1A1 through 1A3, and were therefore analyzed to provide a conservative analysis of potential construction-period impacts. As indicated in Table 12, during the peak construction period lasting approximately one month, the following traffic would be generated on a daily basis: 84 truck trips (168 PCE truck trips) and 44 trips for construction workers, for a total of 212 daily PCE trips. Of these daily trips, 54 would be expected to occur in the AM and PM peak hours (38 inbound and 16 outbound PCE trips in the AM peak hour and 16 inbound and 38 outbound PCE trips in the PM peak hour), and 32 PCE trips would be expected to occur in the midday peak hour (16 inbound and 16 outbound PCE trips). ALTERNATIVE 2 CONSTRUCTION-PERIOD TRIP GENERATION ESTIMATES Construction of Alternative 2 would be expected to begin in late 2012 or early 2013 and Phase 1 would occur over a period of approximately 21 months. As with Alternative 1, Phase 2 would occur when throughput reaches one million tons per year, at which time the semi-portable conveyor system would be dismantled and replaced with a fixed conveyor system and a second truck scale would be installed over a three-month period. Construction activity is expected to occur between 7:00 AM and 4:00 PM, Monday through Friday, but may also occur on Saturdays as needed. No road closures are anticipated during construction, as the construction activities would occur within the project site on Pier B Street. Details of the anticipated construction schedule and proposed construction equipment are provided in Appendix D. D Phase 1A Phase 1B Phase 1C Phase 1D1 Phase 1D2 Phase 1E Phase 1F Phase 2A Phase 2B Clearing Ground Surcharge Grading, Storm Water Collection & Drainage System Concrete Capping Road Constructionn Steel Erection, Truck Scale & Office Building Electrical Steel Erection Electrical 36
43 TABLE 12 CONSTRUCTION-PERIOD TRIP GENERATION ESTIMATES (ALTERNATIVE 1) Average Daily Privately-Owned Vehicle Trips [a] Duration Construction Phase Workers Per Day (Work Days M-F) Phase 1A Phase 1A Phase 1A Phase 1A Phase 1B Phase 1C Phase 1D Phase 1E Total Average Daily Truck Trips [b] Construction Phase Truck Trips per Phase Duration (Work Days M-F) Phase 1A1 - external Phase 1A1 - within Port Phase 1A Phase 1A Phase 1A Phase 1B Phase 1C Phase 1D Phase 1E Total 1, Average Daily Passenger Car Equivalent (PCE) External Trips [c] Construction Phase PCEs Trips per phase Duration (Work Days M-F) Phase 1A Phase 1A Phase 1A Phase 1A Phase 1B Phase 1C Phase 1D 2, Phase 1E Total 5, Peak Hour Privately-Owned Vehicle Trips [d] Construction Phase Workers Per Day Dir. Split Phase 1A2-1A4 22 AM In/Out: 22 0 Mid In/Out: 0 0 PM In/Out: 0 22 Phase 1B 6 AM In/Out: 6 0 Mid In/Out: 0 0 PM In/Out: 0 6 Phase 1C 4 AM In/Out: 4 0 Mid In/Out: 0 0 PM In/Out: 0 4 Phase 1D 4 AM In/Out: Mid In/Out: PM In/Out: Phase 1E 3 AM In/Out: 3 0 Mid In/Out: 0 0 PM In/Out: 0 3 Peak Hour PCE Truck Trips [e] Construction Phase Daily Truck Trips Dir. Split Phase 1A2-1A4 84 In/Out: Phase 1B 6 In/Out: 1 1 Phase 1C 8 In/Out: 2 2 Phase 1D 20 In/Out: Phase 1E 6 In/Out: 1 1 Total Peak Hour PCE Trips [f] Construction Phase Workers Per Day Dir. Split Phase 1A2-1A4 22 AM In/Out: Mid In/Out: PM In/Out: Phase 1B 6 AM In/Out: 7 1 Mid In/Out: 1 1 PM In/Out: 1 7 Phase 1C 4 AM In/Out: 6 2 Mid In/Out: 2 2 PM In/Out: 2 6 Phase 1D 4 AM In/Out: Mid In/Out: PM In/Out: Phase 1E 3 AM In/Out: 4 1 Mid In/Out: 1 1 PM In/Out: 1 4 Notes: During Phase 1, subphases 1A1-1A3 and 1A2-1A4 are assumed to overlap and the latter was analyzed because it is more conservative. Subphases 1A1 and 1A4 would not be concurrent. Subphase 1A1 could only occur under Alternative 1. [a] Inbound and outbound trips are accounted as two separate trips. [b] Inbound and outbound trips are accounted as two separate trips. Estimates of daily truck trips were prepared by Aspen Environmental and include 1 daily round trip by a fuel truck. Calculations are rounded up to the nearest even number. [c] A PCE factor of 2.0 has been applied to heavy truck trips for this analysis. This factor was used as a conservative approach, a PCE of 2.0 is usually used for all tractor (bobtail) trailer combinations. [d] All workers are assumed to come to the facility in the AM peak and leave in the PM peak hour. [e] For the Peak Hour PCE Truck Trip calculations, daily truck trip estimates were divided evenly across an 8 hours construction schedule and multiplied by 1.5, which assumes that the peak hours is 50% busier than the average hour. Calculations are rounded. [f] Bold numbers in this table represent the most intense period of site-generated traffic during construction.
44 Traffic Study for the Eagle Rock Aggregate Terminal Project May 2012 Table 13 presents the anticipated construction schedule for Alternative 2 and the estimated daily and peak hour trip generation during each sub-phase of Phase 1. The assumptions regarding construction worker trips and truck trips were the same as those described above for Alternative 1. Project construction during Phase 1D, expected to last two months, would generate the most traffic to and from the site. As indicated in Table 13, during the two-month peak construction period, the following traffic would be generated on a daily basis: 204 truck trips (408 PCE truck trips) and 120 trips for construction workers, for a total of 528 daily PCE trips. Of these daily trips, 136 would be expected to occur in the AM and PM peak hours (98 inbound and 38 outbound PCE trips in the AM peak hour and 38 inbound and 98 outbound PCE trips in the PM peak hour), and 76 PCE trips would be expected to occur in the midday peak hour (38 inboundnd and 38 outbound PCE trips). ALTERNATIVE 3 CONSTRUCTION-PERIOD TRIP GENERATION ESTIMATES Construction of Alternative 3 would be expected to begin in late 2012 or early 2013 and Phase 1 would occur over a period of approximately three months ending in No dredging or wharf improvements would be made under Alternative 3. As with Alternatives 1 and 2, Phase 2 would occur when throughput reaches one million tons per year, at which time the semi-portable conveyor system would be dismantled and replaced with a fixed conveyor system and a second truck scale would be installed over a three- Friday, but month period. Construction activity is expected to occur between 7:00 AM and 4:00 PM, Monday through may also occur on Saturdays as needed. No road closures would be anticipated during construction, as the construction activities would occur within the project site on Pier D Street. Details of the construction schedule and proposed constructionn equipment are provided in Appendix D. Phase 1A Site Preparation (Clearing, Grading) & Road Construction Phase 1B Phase 1C Phase 2A Phase 2B Steel Erection Electrical Steel Erection Electrical Table 14 presents the anticipated construction schedule for Alternative 3 and the estimated daily and peak hour trip generation during each sub-phase of Phase 1. The assumptions regarding construction worker trips and truck trips were the same as those described above for Alternatives 1 and 2. As with Alternative 1, the initial period of project construction, would be expected to last one month and would generate the most traffic to and from the site. As indicated in Table 14, during the one-month peak construction period, the following traffic would be generated on a daily basis: 84 truck trips (168 PCE truck trips) and 44 trips for construction workers, for a total of 212 daily PCE trips. Of these daily trips, 54 would be expected to occur in the AM and PM peak hours (38 inbound and 16 outbound PCE trips in the AM peak hour and 16 inbound and 38 outbound PCE trips in the PM peak hour), and 32 PCE trips would be expected to occur in the midday peak hour (16 inbound and 16 outbound PCE trips). 38
45 TABLE 13 CONSTRUCTION-PERIOD TRIP GENERATION ESTIMATES (ALTERNATIVE 2) Average Daily Privately-Owned Vehicle Trips [a] Duration Construction Phase Workers Per Day (Work Days M-F) Phase 1A Phase 1B Phase 1C Phase 1D Phase 1D Phase 1E Phase 1F Total Average Daily Truck Trips [b] Construction Phase Truck Trips per Phase Duration (Work Days M-F) Phase 1A Phase 1B Phase 1C Phase 1D1 4, Phase 1D Phase 1E Phase 1F Total 6, Average Daily Passenger Car Equivalent (PCE) Trips [c] Construction Phase PCEs Trips per phase Duration (Work Days M-F) Phase 1A 3, Phase 1B Phase 1C Phase 1D Phase 1D Phase 1E Phase 1F Total 41, Peak Hour Privately-Owned Vehicle Trips [d] Construction Phase Workers Per Day Dir. Split Phase 1A 13 AM In/Out: 13 0 Mid In/Out: 0 0 PM In/Out: 0 13 Phase 1B 9 AM In/Out: Mid In/Out: PM In/Out: Phase 1C 11 AM In/Out: Mid In/Out: PM In/Out: Phase 1D 60 AM In/Out: 60 0 Mid In/Out: 0 0 PM In/Out: 0 60 Phase 1E 4 AM In/Out: 4 0 Mid In/Out: 0 0 PM In/Out: 0 4 Phase 1F 3 AM In/Out: 3 0 Mid In/Out: 0 0 PM In/Out: 0 3 Peak Hour PCE Truck Trips [e] Construction Phase Daily Truck Trips Dir. Split Phase 1A 14 In/Out: 3 3 Phase 1B 6 In/Out: Phase 1C 6 In/Out: Phase 1D1 124 In/Out: Phase 1D2 80 In/Out: Phase 1E 10 In/Out: 2 2 Phase 1F 6 In/Out: 1 1 Total Peak Hour PCE Trips [f] Construction Phase Dir. Split Phase 1A AM In/Out: 16 3 Mid In/Out: 3 3 PM In/Out: 3 16 Phase 1B AM In/Out: Mid In/Out: PM In/Out: Phase 1C AM In/Out: Mid In/Out: PM In/Out: Phase 1D AM In/Out: Mid In/Out: PM In/Out: Phase 1E AM In/Out: 6 2 Mid In/Out: 2 2 PM In/Out: 2 6 Phase 1F AM In/Out: 4 1 Mid In/Out: 1 1 PM In/Out: 1 4 Notes: [a] Inbound and outbound trips are accounted as two separate trips. [b] Inbound and outbound trips are accounted as two separate trips. Estimates of daily truck trips were prepared by Aspen Environmental and include 1 daily round trip by a fuel truck. Calculations are rounded up to the nearest even number. [c] A PCE factor of 2.0 has been used for this analysis. This factor was used as a conservative approach, a PCE of 2.0 is usually used for all tractor (bobtail) trailer combinations. [d] All workers are assumed to come to the facility in the AM peak and leave in the PM peak hour. [e] For the Peak Hour PCE Truck Trip calculations, daily truck trip estimates were divided evenly across an 8 hours construction schedule and multiplied by 1.5, which assumes that the peak hours is 50% busier than the average hour. Calculations are rounded. [f] Bold numbers in this table represent the most intense period of site-generated traffic during construction.
46 TABLE 14 CONSTRUCTION-PERIOD TRIP GENERATION ESTIMATES (ALTERNATIVE 3) Average Daily Privately-Owned Vehicle Trips [a] Duration Construction Phase Workers Per Day (Work Days M-F) Phase 1A Phase 1A Phase 1A Phase 1B Phase 1C Phase 1D Phase 1E Total Average Daily Truck Trips [b] Construction Phase Truck Trips per Phase Duration (Work Days M-F) Phase 1A Phase 1A Phase 1A Phase 1B Phase 1C Phase 1D Phase 1E Total 1, Average Daily Passenger Car Equivalent (PCE) Trips [c] Construction Phase PCEs Trips per phase Duration (Work Days M-F) Phase 1A Phase 1A Phase 1A Phase 1B Phase 1C Phase 1D 2, Phase 1E Total 5, Peak Hour Privately-Owned Vehicle Trips [d] Construction Phase Workers Per Day Dir. Split Phase 1A1-1A3 22 AM In/Out: 22 0 Mid In/Out: 0 0 PM In/Out: 0 22 Phase 1B 6 AM In/Out: 0 0 Mid In/Out: 0 0 PM In/Out: 0 0 Phase 1C 4 AM In/Out: 0 0 Mid In/Out: 0 0 PM In/Out: 0 0 Phase 1D 4 AM In/Out: Mid In/Out: PM In/Out: Phase 1E 3 AM In/Out: 3 0 Mid In/Out: 0 0 PM In/Out: 0 3 Peak Hour PCE Truck Trips [e] Construction Phase Daily Truck Trips Dir. Split Phase 1A1-1A3 84 In/Out: Phase 1B 6 In/Out: 0 0 Phase 1C 8 In/Out: 0 0 Phase 1D 20 In/Out: Phase 1E 6 In/Out: 1 1 Total Peak Hour PCE Trips [f] Construction Phase Workers Per Day Dir. Split Phase 1A1-1A3 22 AM In/Out: Mid In/Out: PM In/Out: Phase 1B 6 AM In/Out: 0 0 Mid In/Out: 0 0 PM In/Out: 0 0 Phase 1C 4 AM In/Out: 0 0 Mid In/Out: 0 0 PM In/Out: 0 0 Phase 1D 4 AM In/Out: Mid In/Out: PM In/Out: Phase 1E 3 AM In/Out: 4 1 Mid In/Out: 1 1 PM In/Out: 1 4 Notes: [a] Inbound and outbound trips are accounted as two separate trips. [b] Inbound and outbound trips are accounted as two separate trips. Estimates of daily truck trips were prepared by Aspen Environmental and include 1 daily round trip by a fuel truck. Calculations are rounded up to the nearest even number. [c] A PCE factor of 2.0 has been used for this analysis. This factor was used as a conservative approach, a PCE of 2.0 is usually used for all tractor (bobtail) trailer combinations. [d] All workers are assumed to come to the facility in the AM peak and leave in the PM peak hour. [e] For the Peak Hour PCE Truck Trip calculations, daily truck trip estimates were divided evenly across an 8 hours construction schedule and multiplied by 1.5, which assumes that the peak hours is 50% busier than the average hour. Calculations are rounded. [f] Bold numbers in this table represent the most intense period of site-generated traffic during construction.
47 Traffic Study for the Eagle Rock Aggregate Terminal Project May 2012 PROJECT CONSTRUCTION-PERIOD TRAFFIC IMPACT ANALYSIS CEQA Existing plus Project Construction Traffic Conditions Project construction impacts under CEQA were compared against existing conditions, which are described in Chapter 2. The peak hour project-generated trips during the peak phase of project construction for Alternatives 1 and 3 are illustrated in Figure 12 and for Alternative 2 are illustrated in Figure 13. These volumes were added to existing traffic volumes to develop existing with project construction traffic volumes, shown in Figures 14 and 15. The results of this analysiss are presented in Tables 15 and 16. As indicated in the tables, all nine study intersections would continue to operate at LOS D or better during each analyzed peak hour. Project Intersection Impacts Existing plus Project Construction To determine whether significant impacts would occur during project construction, the existing plus project construction operating conditions were compared to the existing base operating conditions. As shown in Tables 15 and 16, using the criteria described above for the determination of significant impacts, none of the project alternatives would result in significant traffic impacts during project construction. Because no significant impacts have been identified, no traffic mitigation measures would be required. As shown in Tables 17 and 18, using the criteria described above for the determination of significant impacts, Alternatives 1, 2 and 2 would not result in significant traffic impacts during project construction. Because Alternative 4, the No Project Alternative, would not involve any construction activity, there would be no construction impacts for Alternative 4. PROJECT CONSTRUCTION-PERIOD TRAFFIC IMPACT ANALYSIS NEPA Construction Period (Year 2013) Traffic Volumes The peak hour project-generated trips during the peak phase of project construction shown in Figure 12 for Alternative 3 (the No Federal Action Alternative) were added to estimated 2013 volumes to develop estimates of NEPA baseline conditions. Estimated conditions during the peak construction period of Alternatives 1, 2 and 4 were also developed by adding the estimated project-only trips to the estimated 2013 volumes. Construction Period (Year 2013) plus Project Construction Traffic Conditions Future baseline (Year 2013 plus Alternative 3) traffic projections presented in Figure 16 were analyzed to establish future baseline (NEPA) operating conditions. As shown in Tables 17 and 18, all nine study intersections are projected to continue operating at LOS D or better during the analyzed peak hours. The future plus construction traffic volumes, illustrated in Figures 17 and 18, were analyzed to assess future operating conditions with the addition of the proposed project traffic relative to the NEPA baseline and the results are summarized in Tables 17 and 18. As indicated in the tables, all nine study intersections are projected to continue operating at LOS D or better during the analyzed peak hours with the addition of construction-period traffic generated under each project alternative. 41
48
49
50
51
52
53 TABLE 15 EXISTING PLUS PROJECT CONSTRUCTION INTERSECTION LEVEL OF SERVICE AND CEQA IMPACT ANALYSIS (ALTERNATIVES 1 AND 3) NO. INTERSECTION PEAK HOUR EXISTING + CONSTRUCTION CEQA BASELINE (EXISTING 2011) (ALTS 1 & 3) V/C DELAY* LOS V/C DELAY* LOS PROJECT INCREASE SIGNIFICANT IMPACT? IN V/C 1 Pier B St & Pico Ave AM A A NO Signalized PM A A NO MID A A NO 2 Pico Ave & Pier C St AM A A NO Signalized PM A A NO MID A A NO 3 Pico Ave & Pier D St/Water St AM A A NO Four-Way Stop PM A A NO MID A A NO 4 Pico Ave & Pier E St/EB Ocean Ave AM A A 0 NO Four-Way Stop PM A A 0 NO MID A A 0 NO 5 Navy Way and Seaside Ave AM A A NO Signalized PM B B 0 NO MID A A 0 NO 6 Anaheim St & Farragut Ave AM A A NO Signalized PM A A 0 NO MID A A 0 NO 7 Anaheim St & 1 St/West 9th St AM A A 0 NO Signalized PM A A NO MID A A 0 NO 8 Pier B St & Edison Ave AM -- 9 A -- 9 A -- NO Two-Way Stop PM -- 9 A -- 9 A -- NO [1] MID -- 9 A -- 9 A -- NO 9 Anaheim Way & Pier B St AM A A NO Four-Way Stop PM A A 0 NO MID A A 0 NO Notes: * Average stopped delay per vehicle, in seconds. [1] Worst approach LOS was used to determine increment for impact.
54 TABLE 16 EXISTING PLUS PROJECT CONSTRUCTION INTERSECTION LEVEL OF SERVICE AND CEQA IMPACT ANALYSIS (ALTERNATIVES 2) NO. INTERSECTION PEAK HOUR EXISTING + CONSTRUCTION (ALT CEQA BASELINE (EXISTING 2011) 2) V/C DELAY* LOS V/C DELAY* LOS PROJECT INCREASE SIGNIFICANT IMPACT? IN V/C 1 Pier B St & Pico Ave AM A A NO Signalized PM A A NO MID A A NO 2 Pico Ave & Pier C St AM A A NO Signalized PM A A NO MID A A NO 3 Pico Ave & Pier D St/Water St AM A A NO Four-Way Stop PM A A NO MID A A NO 4 Pico Ave & Pier E St/EB Ocean Ave AM A A 0 NO Four-Way Stop PM A A 0 NO MID A A 0 NO 5 Navy Way and Seaside Ave AM A A NO Signalized PM B B 0 NO MID A A NO 6 Anaheim St & Farragut Ave AM A A NO Signalized PM A A 0.01 NO MID A A NO 7 Anaheim St & 1 St/West 9th St AM A A 0 NO Signalized PM A A NO MID A A 0 NO 8 Pier B St & Edison Ave AM -- 9 A -- 9 A -- NO Two-Way Stop PM -- 9 A -- 9 A -- NO [1] MID -- 9 A -- 9 A -- NO 9 Anaheim Way & Pier B St AM A A NO Four-Way Stop PM A A 0 NO MID A A 0 NO Notes: * Average stopped delay per vehicle, in seconds. [1] Worst approach LOS was used to determine increment for impact.
55 TABLE 17 CONSTRUCTION (YEAR 2013) INTERSECTION LEVEL OF SERVICE AND NEPA IMPACT ANALYSIS (ALTERNATIVE 1) NO. INTERSECTION PEAK HOUR NEPA BASELINE (NO FEDERAL YEAR CONSTRUCTION (ALT ACTION ALT.) 1) V/C DELAY* LOS V/C DELAY* LOS PROJECT INCREASE SIGNIFICANT IMPACT? IN V/C 1 Pier B St & Pico Ave AM A A 0 NO Signalized PM A A 0 NO MID A A 0 NO 2 Pico Ave & Pier C St AM A A 0 NO Signalized PM A A 0 NO MID A A 0 NO 3 Pico Ave & Pier D St/Water St AM A A 0 NO Four-Way Stop PM A A 0 NO MID A A 0 NO 4 Pico Ave & Pier E St/EB Ocean Ave AM A A 0 NO Four-Way Stop PM A A 0 NO MID A A 0 NO 5 Navy Way and Seaside Ave AM A A 0 NO Signalized PM C C 0 NO MID A A 0 NO 6 Anaheim St & Farragut Ave AM A A 0 NO Signalized PM A A 0 NO MID A A 0 NO 7 Anaheim St & 1 St/West 9th St AM A A 0 NO Signalized PM A A 0 NO MID A A 0 NO 8 Pier B St & Edison Ave AM -- 9 A -- 9 A -- NO Two-Way Stop PM -- 9 A -- 9 A -- NO [1] MID -- 9 A -- 9 A -- NO 9 Anaheim Way & Pier B St AM A A 0 NO Four-Way Stop PM A A 0 NO MID A A 0 NO Notes: * Average stopped delay per vehicle, in seconds. [1] Worst approach LOS was used to determine increment for impact.
56 TABLE 18 CONSTRUCTION (YEAR 2013) INTERSECTION LEVEL OF SERVICE AND NEPA IMPACT ANALYSIS (ALTERNATIVE 2) NO. INTERSECTION PEAK HOUR NEPA BASELINE (NO FEDERAL YEAR CONSTRUCTION (ALT ACTION ALT.) 2) V/C DELAY* LOS V/C DELAY* LOS PROJECT INCREASE SIGNIFICANT IMPACT? IN V/C 1 Pier B St & Pico Ave AM A A NO Signalized PM A A NO MID A A NO 2 Pico Ave & Pier C St AM A A NO Signalized PM A A NO MID A A NO 3 Pico Ave & Pier D St/Water St AM A A 0 NO Four-Way Stop PM A A NO MID A A NO 4 Pico Ave & Pier E St/EB Ocean Ave AM A A 0 NO Four-Way Stop PM A A 0 NO MID A A 0 NO 5 Navy Way and Seaside Ave AM A A 0 NO Signalized PM C C NO MID A A 0 NO 6 Anaheim St & Farragut Ave AM A A NO Signalized PM A A NO MID A A NO 7 Anaheim St & 1 St/West 9th St AM A A 0 NO Signalized PM A A NO MID A A 0 NO 8 Pier B St & Edison Ave AM -- 9 A -- 9 A -- NO Two-Way Stop PM -- 9 A -- 9 A -- NO [1] MID -- 9 A -- 9 A -- NO 9 Anaheim Way & Pier B St AM A A NO Four-Way Stop PM A A NO MID A A 0 NO Notes: * Average stopped delay per vehicle, in seconds. [1] Worst approach LOS was used to determine increment for impact.
57
58
59 Traffic Study for the Eagle Rock Aggregate Terminal Project May 2012 Project Intersection Impact Analysis (Year 2013) To determine whether significant impacts would occur during project construction, the future plus project construction operating conditions were compared to the future baseline operating conditions. As shown in Tables 17 and 18, using the criteria described above for the determination of significant impacts, neither Alternative 1 nor Alternativee 2 would result in significant traffic impacts during project construction. By definition, Alternative 3 would result in no impact under NEPA. Because Alternativee 4, the No Project Alternative, would not involve any construction activity, there would be no construction impacts for Alternative 4. Because no significant impacts have been identified, no traffic mitigation measures would be required. 53
60 Traffic Study for the Eagle Rock Aggregate Terminal Project May SUMMARY AND CONCLUSIONS This study was undertaken to analyze the potential for traffic impacts resulting from the proposed Eagle Rock Aggregate Terminal project in the POLB. Four project alternatives were analyzed in this study, including the No Project Alternative. The key findings and conclusions of the study are summarized below. The proposed project (Alternative 1) and Alternatives 2 and 3 involve the construction and operation of a sand, gravell and granite aggregate receiving, storage and distribution terminal in the Port. Alternative 1 would be located at 1925 Pier D Street. Alternative 2 would be located at 1710 Pier B Street. Alternative 3, the No Federal Action Alternative, would be on the same site as Alternative 1, but would not include the channel dredging or wharf improvements that would occur under Alternative 1. Alternative 4 is the No Project Alternative. Each of the alternative sites is currently vacant. Alternatives 1, 2 and 3 would support a maximum throughput capacity of 2.75 million tons of aggregate material per year. Detailed intersection capacity and operation analyses were conducted at nine intersections i in the vicinity of the alternatives for the AM peak hour (the peak hour between 6:00 and 9:00 PM), the midday peak hour (between 2:00 and 3:00 PM), and the PM peak hour (the peak hour between 3:00 and 6:00 PM). All nine study intersections are currently (2011) operating at acceptable levels of service (LOS D or better). Project trip generation was estimated using information provided by the Applicant on the expected operation of the facility, which would require four full-time employees and would operate 52 weeks per year with two weekday shifts and one Saturday shift. On an average day, it is estimated that 770 truck trips (385 inbound plus 385 outbound) would occur at the project site. The estimated maximum hourly throughput for the facility was identified as 32 truck loads per hour. Actual hourly throughput at the facility will vary depending on market demand. A PCE factor of 2.0 was applied to truck trips. The new facility would generate a maximum of approximately 1,556 daily PCE trips, of which 128 PCE trips would be expected to occur in the AM and PM peak hours (64 inbound, 64 outbound) and 136 PCE trips would be expected to occur in the midday peak hour (68 inbound, 68 outbound). Analysis of existing (2011) plus project conditions and cumulative (2035) plus project conditions was conducted to identify impacts during the operational phase of the project under CEQA and NEPA. Applying the significant impact criteria used by the Port and the City of Los Angeles, it was found that no significant traffic impacts would occur under any of the analyzed alternatives. Based on the magnitude of project-generated traffic, it was found that the project alternatives would not result in significant impacts at any CMP arterial and intersection locations. Construction-period trip generation estimates were prepared using detailed information i on the number of workers that would be needed for each sub-phase of construction and the amount of material to be transported to and from the site of each alternative. Traffic impacts during the peak sub-phase of construction ( anticipated to be 2013) were assessed. Applying the significant impact criteria used by the Port and the City of Los Angeles, it was determined that no significant impacts would occur during construction of any of the analyzed alternatives. 54
61 REFERENCES 2000 Highway Capacity Manual, Transportation Research Board, Congestion Management Program for Los Angeles County, Los Angeles County Metropolitan Transportation Authority, October Traffic Volumes on California State Highways, California Department of Transportation, accessed January Eagle Rock Terminal Capacity Analysis, AECOM US, January 5, Traffic Study Policies and Procedures, Los Angeles Department of Transportation, August 2011.
62 APPENDIX A: INTERSECTION LANE CONFIGURATIONS
63
64
65 APPENDIX B: TRAFFIC COUNTS
66 Location: Pico Ave & Pier C St City: Long Beach Date: 12/6/2011 Day: Tuesday CONTROL: Signalized LANES: NL NT NR SL ST SR EL ET ER WL WT WR 6:00 CARS Other Trucks Bobtails Chassis Container :15 CARS Other Trucks Bobtails Chassis Container :30 CARS Other Trucks Bobtails Chassis Container :45 CARS Other Trucks Bobtails Chassis Container :00 CARS Other Trucks Bobtails Chassis Container :15 CARS Other Trucks Bobtails Chassis Container :30 CARS Other Trucks Bobtails Chassis Container :45 CARS Other Trucks Bobtails Chassis Container :00 CARS Other Trucks Bobtails Chassis Container :15 CARS Other Trucks Bobtails Chassis Container :30 CARS Other Trucks Bobtails Chassis Container :45 CARS Other Trucks Bobtails Chassis Container AM Peak Hr Begins at: NATIONAL DATA AND SURVEYING SERVICES Axle Count MOVEMENT TOTALS CARS Other Trucks Bobtails Chassis Container TOTALS NL NT NR SL ST SR EL ET ER WL WT WR 745 AM Project # Class PEAK VOLUMES = PEAK HR. FACTOR:
67 NATIONAL DATA AND SURVEYING SERVICES Axle Count Project # Class Location: Pico Ave & Pier C St City: Long Beach Date: 12/6/2011 Day: Tuesday CONTROL: Signalized LANES: NL NT NR SL ST SR EL ET ER WL WT WR 14:00 CARS Other Trucks Bobtails Chassis Container :15 CARS Other Trucks Bobtails Chassis Container :30 CARS Other Trucks Bobtails Chassis Container :45 CARS Other Trucks Bobtails Chassis Container :00 CARS Other Trucks Bobtails Chassis Container :15 CARS Other Trucks Bobtails Chassis Container :30 CARS Other Trucks Bobtails Chassis Container :45 CARS Other Trucks Bobtails Chassis Container :00 CARS Other Trucks Bobtails Chassis Container :15 CARS Other Trucks Bobtails Chassis Container :30 CARS Other Trucks Bobtails Chassis Container :45 CARS Other Trucks Bobtails Chassis Container :00 CARS Other Trucks Bobtails Chassis Container :15 CARS Other Trucks Bobtails Chassis Container :30 CARS Other Trucks Bobtails Chassis Container :45 CARS Other Trucks Bobtails Chassis Container MOVEMENT TOTALS CARS Other Trucks Bobtails Chassis Container TOTALS NL NT NR SL ST SR EL ET ER WL WT WR PM Peak Hr Begins at: 1600 PM PEAK VOLUMES = PEAK HR. FACTOR:
68 Location: Pico Ave & Pier D Street/Water Street City: Long Beach Date: 12/6/2011 Day: Tuesday CONTROL: Signalized LANES: NL NT NR SL ST SR EL ET ER WL WT WR 6:00 CARS Other Trucks Bobtails Chassis Container :15 CARS Other Trucks Bobtails Chassis Container :30 CARS Other Trucks Bobtails Chassis Container :45 CARS Other Trucks Bobtails Chassis Container :00 CARS Other Trucks Bobtails Chassis Container :15 CARS Other Trucks Bobtails Chassis Container :30 CARS Other Trucks Bobtails Chassis Container :45 CARS Other Trucks Bobtails Chassis Container :00 CARS Other Trucks Bobtails Chassis Container :15 CARS Other Trucks Bobtails Chassis Container :30 CARS Other Trucks Bobtails Chassis Container :45 CARS Other Trucks Bobtails Chassis Container AM Peak Hr Begins at: MOVEMENT TOTALS CARS Other Trucks Bobtails Chassis Container TOTALS NL NT NR SL ST SR EL ET ER WL WT WR 645 AM PEAK VOLUMES = PEAK HR. FACTOR: NATIONAL DATA AND SURVEYING SERVICES Axle Count Project # Class
69 Location: Pico Ave & Pier D Street/Water Street City: Long Beach Date: 12/6/2011 Day: Tuesday CONTROL: Signalized LANES: NL NT NR SL ST SR EL ET ER WL WT WR 14:00 CARS Other Trucks Bobtails Chassis Container :15 CARS Other Trucks Bobtails Chassis Container :30 CARS Other Trucks Bobtails Chassis Container :45 CARS Other Trucks Bobtails Chassis Container :00 CARS Other Trucks Bobtails Chassis Container :15 CARS Other Trucks Bobtails Chassis Container :30 CARS Other Trucks Bobtails Chassis Container :45 CARS Other Trucks Bobtails Chassis Container :00 CARS Other Trucks Bobtails Chassis Container :15 CARS Other Trucks Bobtails Chassis Container :30 CARS Other Trucks Bobtails Chassis Container :45 CARS Other Trucks Bobtails Chassis Container :00 CARS Other Trucks Bobtails Chassis Container :15 CARS Other Trucks Bobtails Chassis Container :30 CARS Other Trucks Bobtails Chassis Container :45 CARS Other Trucks Bobtails Chassis Container MOVEMENT TOTALS CARS Other Trucks Bobtails Chassis Container TOTALS NL NT NR SL ST SR EL ET ER WL WT WR PM Peak Hr Begins at: 1600 PM PEAK VOLUMES = PEAK HR. FACTOR: NATIONAL DATA AND SURVEYING SERVICES Axle Count Project # Class
70 Location: Pico Ave & Pier E St/EB Ocean Ave City: Long Beach Date: 12/6/2011 Day: Tuesday CONTROL: Signalized LANES: NL NT NR SL ST SR EL ET ER WL WT WR 6:00 CARS Other Trucks Bobtails Chassis Container :15 CARS Other Trucks Bobtails Chassis Container :30 CARS Other Trucks Bobtails Chassis Container :45 CARS Other Trucks Bobtails Chassis Container :00 CARS Other Trucks Bobtails Chassis Container :15 CARS Other Trucks Bobtails Chassis Container :30 CARS Other Trucks Bobtails Chassis Container :45 CARS Other Trucks Bobtails Chassis Container :00 CARS Other Trucks Bobtails Chassis Container :15 CARS Other Trucks Bobtails Chassis Container :30 CARS Other Trucks Bobtails Chassis Container :45 CARS Other Trucks Bobtails Chassis Container AM Peak Hr Begins at: MOVEMENT TOTALS CARS Other Trucks Bobtails Chassis Container TOTALS NL NT NR SL ST SR EL ET ER WL WT WR 645 AM PEAK VOLUMES = PEAK HR. FACTOR: NATIONAL DATA AND SURVEYING SERVICES Axle Count Project # Class
71 Location: Pico Ave & Pier E St/EB Ocean Ave City: Long Beach Date: 12/6/2011 Day: Tuesday CONTROL: Signalized LANES: NL NT NR SL ST SR EL ET ER WL WT WR 14:00 CARS Other Trucks Bobtails Chassis Container :15 CARS Other Trucks Bobtails Chassis Container :30 CARS Other Trucks Bobtails Chassis Container :45 CARS Other Trucks Bobtails Chassis Container :00 CARS Other Trucks Bobtails Chassis Container :15 CARS Other Trucks Bobtails Chassis Container :30 CARS Other Trucks Bobtails Chassis Container :45 CARS Other Trucks Bobtails Chassis Container :00 CARS Other Trucks Bobtails Chassis Container :15 CARS Other Trucks Bobtails Chassis Container :30 CARS Other Trucks Bobtails Chassis Container :45 CARS Other Trucks Bobtails Chassis Container :00 CARS Other Trucks Bobtails Chassis Container :15 CARS Other Trucks Bobtails Chassis Container :30 CARS Other Trucks Bobtails Chassis Container :45 CARS Other Trucks Bobtails Chassis Container MOVEMENT TOTALS CARS Other Trucks Bobtails Chassis Container TOTALS NL NT NR SL ST SR EL ET ER WL WT WR PM Peak Hr Begins at: 1600 PM PEAK VOLUMES = PEAK HR. FACTOR: NATIONAL DATA AND SURVEYING SERVICES Axle Count Project # Class
72 APPENDIX C: LEVEL OF SERVICE WORKSHEETS
73 EXISTING (2011)
74 EX AM Wed Jan 11, :54:55 Page 3-1 ICU 1(Loss as Cycle Length %) Method (Base Volume Alternative) Intersection #1 Pier B St & Pico Ave Cycle (sec): 100 Critical Vol./Cap.(X): Loss Time (sec): 10 (Y+R=4.0 sec) Average Delay (sec/veh): xxxxxx Optimal Cycle: 23 Level Of Service: A Street Name: Pier B St Pico Ave Control: Split Phase Split Phase Protected Protected Rights: Ignore Include Include Ignore Lanes: Base Vol: Initial Bse: User Adj: PHF Adj: PHF Volume: Reduced Vol: PCE Adj: MLF Adj: FinalVolume: Sat/Lane: Lanes: Final Sat.: Vol/Sat: Crit Moves: **** **** **** ****
75 EX AM Wed Jan 11, :54:55 Page 4-1 ICU 1(Loss as Cycle Length %) Method (Base Volume Alternative) Intersection #2 Pico Ave & Pier C St Cycle (sec): 100 Critical Vol./Cap.(X): Loss Time (sec): 10 (Y+R=4.0 sec) Average Delay (sec/veh): xxxxxx Optimal Cycle: 22 Level Of Service: A Control: Protected Protected Protected Protected Rights: Include Ignore Ovl Include Lanes: Base Vol: Initial Bse: User Adj: PHF Adj: PHF Volume: Reduced Vol: PCE Adj: MLF Adj: FinalVolume: OvlAdjVol: 0 Sat/Lane: Lanes: Final Sat.: Vol/Sat: OvlAdjV/S: 0.00 Crit Moves: **** **** ****
76 EX AM Wed Jan 11, :54:55 Page HCM 4-Way Stop Method (Base Volume Alternative) Intersection #3 Pico Ave & Pier D St/Water St Cycle (sec): 100 Critical Vol./Cap.(X): Loss Time (sec): 0 (Y+R=4.0 sec) Average Delay (sec/veh): 8.2 Optimal Cycle: 0 Level Of Service: A Control: Stop Sign Stop Sign Stop Sign Stop Sign Rights: Include Include Include Include Lanes: Base Vol: Initial Bse: User Adj: PHF Adj: PHF Volume: Reduced Vol: PCE Adj: MLF Adj: FinalVolume: Lanes: Final Sat.: Vol/Sat: xxxx Crit Moves: **** **** **** **** Delay/Veh: Delay Adj: AdjDel/Veh: LOS by Move: A A A * A A A A A A A A ApproachDel: Delay Adj: ApprAdjDel: LOS by Appr: A A A A AllWayAvgQ: Note: Queue reported is the number of cars per lane.
77 EX AM Wed Jan 11, :54:55 Page HCM 4-Way Stop Method (Base Volume Alternative) Intersection #4 Pico Ave & Pier E St/EB Ocean Ave Cycle (sec): 100 Critical Vol./Cap.(X): Loss Time (sec): 0 (Y+R=4.0 sec) Average Delay (sec/veh): 9.0 Optimal Cycle: 0 Level Of Service: A Control: Stop Sign Stop Sign Stop Sign Stop Sign Rights: Include Include Include Include Lanes: Base Vol: Initial Bse: User Adj: PHF Adj: PHF Volume: Reduced Vol: PCE Adj: MLF Adj: FinalVolume: Lanes: Final Sat.: Vol/Sat: Crit Moves: **** **** **** **** Delay/Veh: Delay Adj: AdjDel/Veh: LOS by Move: A A A A A A A A A B A A ApproachDel: Delay Adj: ApprAdjDel: LOS by Appr: A A A A AllWayAvgQ: Note: Queue reported is the number of cars per lane.
78
79 EX AM Wed Jan 11, :54:55 Page 11-1 ICU 1(Loss as Cycle Length %) Method (Base Volume Alternative) Intersection #7 Anaheim St & Farragut Av Cycle (sec): 100 Critical Vol./Cap.(X): Loss Time (sec): 10 (Y+R=4.0 sec) Average Delay (sec/veh): xxxxxx Optimal Cycle: 30 Level Of Service: A Control: Protected Protected Protected Protected Rights: Include Ovl Include Ovl Lanes: Base Vol: Initial Bse: User Adj: PHF Adj: PHF Volume: Reduced Vol: PCE Adj: MLF Adj: FinalVolume: OvlAdjVol: 0 13 Sat/Lane: Lanes: Final Sat.: Vol/Sat: OvlAdjV/S: Crit Moves: **** **** ****
80 EX AM Wed Jan 11, :54:55 Page 12-1 ICU 1(Loss as Cycle Length %) Method (Base Volume Alternative) Intersection #8 Anaheim S & 1 St/West 9th St Cycle (sec): 100 Critical Vol./Cap.(X): Loss Time (sec): 10 (Y+R=4.0 sec) Average Delay (sec/veh): xxxxxx Optimal Cycle: 32 Level Of Service: A Control: Permitted Permitted Protected Protected Rights: Ignore Ignore Include Include Lanes: Base Vol: Initial Bse: User Adj: PHF Adj: PHF Volume: Reduced Vol: PCE Adj: MLF Adj: FinalVolume: Sat/Lane: Lanes: Final Sat.: Vol/Sat: Crit Moves: **** **** **** ****
81 EX AM Wed Jan 11, :54:55 Page HCM Unsignalized Method (Base Volume Alternative) Intersection #9 Pier B St & Edison Ave Average Delay (sec/veh): 2.1 Worst Case Level Of Service: A[ 8.6] Control: Stop Sign Stop Sign Uncontrolled Uncontrolled Rights: Include Include Include Include Lanes: Base Vol: Initial Bse: User Adj: PHF Adj: PHF Volume: FinalVolume: Critical Gap Module: Critical Gp: 6.8 xxxx 6.9 xxxxx xxxx xxxxx xxxxx xxxx xxxxx 4.1 xxxx xxxxx FollowUpTim: 3.5 xxxx 3.3 xxxxx xxxx xxxxx xxxxx xxxx xxxxx 2.2 xxxx xxxxx Capacity Module: Cnflict Vol: 126 xxxx 22 xxxx xxxx xxxxx xxxx xxxx xxxxx 43 xxxx xxxxx Potent Cap.: 862 xxxx 1057 xxxx xxxx xxxxx xxxx xxxx xxxxx 1579 xxxx xxxxx Move Cap.: 852 xxxx 1057 xxxx xxxx xxxxx xxxx xxxx xxxxx 1579 xxxx xxxxx Volume/Cap: 0.00 xxxx 0.02 xxxx xxxx xxxx xxxx xxxx xxxx 0.01 xxxx xxxx Level Of Service Module: 2Way95thQ: 0.0 xxxx 0.1 xxxx xxxx xxxxx xxxx xxxx xxxxx 0.0 xxxx xxxxx Control Del: 9.2 xxxx 8.5 xxxxx xxxx xxxxx xxxxx xxxx xxxxx 7.3 xxxx xxxxx LOS by Move: A * A * * * * * * A * * Movement: LT - LTR - RT LT - LTR - RT LT - LTR - RT LT - LTR - RT Shared Cap.: xxxx xxxx xxxxx xxxx xxxx xxxxx xxxx xxxx xxxxx xxxx xxxx xxxxx SharedQueue:xxxxx xxxx xxxxx xxxxx xxxx xxxxx xxxxx xxxx xxxxx 0.0 xxxx xxxxx Shrd ConDel:xxxxx xxxx xxxxx xxxxx xxxx xxxxx xxxxx xxxx xxxxx 7.3 xxxx xxxxx Shared LOS: * * * * * * * * * A * * ApproachDel: 8.6 xxxxxx xxxxxx xxxxxx ApproachLOS: A * * * Note: Queue reported is the number of cars per lane.
82 EX AM Wed Jan 11, :54:56 Page HCM 4-Way Stop Method (Base Volume Alternative) Intersection #10 Anaheim Way & Pier B St Cycle (sec): 100 Critical Vol./Cap.(X): Loss Time (sec): 0 (Y+R=4.0 sec) Average Delay (sec/veh): 7.6 Optimal Cycle: 0 Level Of Service: A Control: Stop Sign Stop Sign Stop Sign Stop Sign Rights: Include Include Include Include Lanes: Base Vol: Initial Bse: User Adj: PHF Adj: PHF Volume: Reduced Vol: PCE Adj: MLF Adj: FinalVolume: Lanes: Final Sat.: Vol/Sat: xxxx xxxx xxxx 0.03 xxxx xxxx xxxx Crit Moves: **** **** **** Delay/Veh: Delay Adj: AdjDel/Veh: LOS by Move: * * * A * A A A * * A A ApproachDel: xxxxxx Delay Adj: xxxxx ApprAdjDel: xxxxxx LOS by Appr: * A A A AllWayAvgQ: Note: Queue reported is the number of cars per lane.
83 EX MIDDAY Wed Jan 11, :54:46 Page 3-1 ICU 1(Loss as Cycle Length %) Method (Base Volume Alternative) Intersection #1 Pier B St & Pico Ave Cycle (sec): 100 Critical Vol./Cap.(X): Loss Time (sec): 10 (Y+R=4.0 sec) Average Delay (sec/veh): xxxxxx Optimal Cycle: 25 Level Of Service: A Street Name: Pier B St Pico Ave Control: Split Phase Split Phase Protected Protected Rights: Ignore Include Include Ignore Lanes: Base Vol: Initial Bse: User Adj: PHF Adj: PHF Volume: Reduced Vol: PCE Adj: MLF Adj: FinalVolume: Sat/Lane: Lanes: Final Sat.: Vol/Sat: Crit Moves: **** **** **** ****
84 EX MIDDAY Wed Jan 11, :54:46 Page 4-1 ICU 1(Loss as Cycle Length %) Method (Base Volume Alternative) Intersection #2 Pico Ave & Pier C St Cycle (sec): 100 Critical Vol./Cap.(X): Loss Time (sec): 10 (Y+R=4.0 sec) Average Delay (sec/veh): xxxxxx Optimal Cycle: 22 Level Of Service: A Control: Protected Protected Protected Protected Rights: Include Ignore Ovl Include Lanes: Base Vol: Initial Bse: User Adj: PHF Adj: PHF Volume: Reduced Vol: PCE Adj: MLF Adj: FinalVolume: OvlAdjVol: 17 Sat/Lane: Lanes: Final Sat.: Vol/Sat: OvlAdjV/S: 0.01 Crit Moves: **** **** ****
85 EX MIDDAY Wed Jan 11, :54:47 Page HCM 4-Way Stop Method (Base Volume Alternative) Intersection #3 Pico Ave & Pier D St/Water St Cycle (sec): 100 Critical Vol./Cap.(X): Loss Time (sec): 0 (Y+R=4.0 sec) Average Delay (sec/veh): 8.2 Optimal Cycle: 0 Level Of Service: A Control: Stop Sign Stop Sign Stop Sign Stop Sign Rights: Include Include Include Include Lanes: Base Vol: Initial Bse: User Adj: PHF Adj: PHF Volume: Reduced Vol: PCE Adj: MLF Adj: FinalVolume: Lanes: Final Sat.: Vol/Sat: xxxx Crit Moves: **** **** **** **** Delay/Veh: Delay Adj: AdjDel/Veh: LOS by Move: A A * A A A A A A A A A ApproachDel: Delay Adj: ApprAdjDel: LOS by Appr: A A A A AllWayAvgQ: Note: Queue reported is the number of cars per lane.
86 EX MIDDAY Wed Jan 11, :54:47 Page HCM 4-Way Stop Method (Base Volume Alternative) Intersection #4 Pico Ave & Pier E St/EB Ocean Ave Cycle (sec): 100 Critical Vol./Cap.(X): Loss Time (sec): 0 (Y+R=4.0 sec) Average Delay (sec/veh): 8.8 Optimal Cycle: 0 Level Of Service: A Control: Stop Sign Stop Sign Stop Sign Stop Sign Rights: Include Include Include Include Lanes: Base Vol: Initial Bse: User Adj: PHF Adj: PHF Volume: Reduced Vol: PCE Adj: MLF Adj: FinalVolume: Lanes: Final Sat.: Vol/Sat: Crit Moves: **** **** **** **** Delay/Veh: Delay Adj: AdjDel/Veh: LOS by Move: A A A A A A A A A A A A ApproachDel: Delay Adj: ApprAdjDel: LOS by Appr: A A A A AllWayAvgQ: Note: Queue reported is the number of cars per lane.
87
88 EX MIDDAY Wed Jan 11, :54:47 Page 11-1 ICU 1(Loss as Cycle Length %) Method (Base Volume Alternative) Intersection #7 Anaheim St & Farragut Av Cycle (sec): 100 Critical Vol./Cap.(X): Loss Time (sec): 10 (Y+R=4.0 sec) Average Delay (sec/veh): xxxxxx Optimal Cycle: 28 Level Of Service: A Control: Protected Protected Protected Protected Rights: Include Ovl Include Ovl Lanes: Base Vol: Initial Bse: User Adj: PHF Adj: PHF Volume: Reduced Vol: PCE Adj: MLF Adj: FinalVolume: OvlAdjVol: 19 0 Sat/Lane: Lanes: Final Sat.: Vol/Sat: OvlAdjV/S: Crit Moves: **** **** ****
89 EX MIDDAY Wed Jan 11, :54:47 Page 12-1 ICU 1(Loss as Cycle Length %) Method (Base Volume Alternative) Intersection #8 Anaheim S & 1 St/West 9th St Cycle (sec): 100 Critical Vol./Cap.(X): Loss Time (sec): 10 (Y+R=4.0 sec) Average Delay (sec/veh): xxxxxx Optimal Cycle: 29 Level Of Service: A Control: Permitted Permitted Protected Protected Rights: Ignore Ignore Include Include Lanes: Base Vol: Initial Bse: User Adj: PHF Adj: PHF Volume: Reduced Vol: PCE Adj: MLF Adj: FinalVolume: Sat/Lane: Lanes: Final Sat.: Vol/Sat: Crit Moves: **** **** **** ****
90 EX MIDDAY Wed Jan 11, :54:47 Page HCM Unsignalized Method (Base Volume Alternative) Intersection #9 Pier B St & Edison Ave Average Delay (sec/veh): 1.8 Worst Case Level Of Service: A[ 8.7] Control: Stop Sign Stop Sign Uncontrolled Uncontrolled Rights: Include Include Include Include Lanes: Base Vol: Initial Bse: User Adj: PHF Adj: PHF Volume: FinalVolume: Critical Gap Module: Critical Gp: 6.8 xxxx 6.9 xxxxx xxxx xxxxx xxxxx xxxx xxxxx 4.1 xxxx xxxxx FollowUpTim: 3.5 xxxx 3.3 xxxxx xxxx xxxxx xxxxx xxxx xxxxx 2.2 xxxx xxxxx Capacity Module: Cnflict Vol: 158 xxxx 45 xxxx xxxx xxxxx xxxx xxxx xxxxx 89 xxxx xxxxx Potent Cap.: 823 xxxx 1022 xxxx xxxx xxxxx xxxx xxxx xxxxx 1519 xxxx xxxxx Move Cap.: 817 xxxx 1022 xxxx xxxx xxxxx xxxx xxxx xxxxx 1519 xxxx xxxxx Volume/Cap: 0.00 xxxx 0.03 xxxx xxxx xxxx xxxx xxxx xxxx 0.01 xxxx xxxx Level Of Service Module: 2Way95thQ: 0.0 xxxx 0.1 xxxx xxxx xxxxx xxxx xxxx xxxxx 0.0 xxxx xxxxx Control Del: 9.4 xxxx 8.6 xxxxx xxxx xxxxx xxxxx xxxx xxxxx 7.4 xxxx xxxxx LOS by Move: A * A * * * * * * A * * Movement: LT - LTR - RT LT - LTR - RT LT - LTR - RT LT - LTR - RT Shared Cap.: xxxx xxxx xxxxx xxxx xxxx xxxxx xxxx xxxx xxxxx xxxx xxxx xxxxx SharedQueue:xxxxx xxxx xxxxx xxxxx xxxx xxxxx xxxxx xxxx xxxxx 0.0 xxxx xxxxx Shrd ConDel:xxxxx xxxx xxxxx xxxxx xxxx xxxxx xxxxx xxxx xxxxx 7.4 xxxx xxxxx Shared LOS: * * * * * * * * * A * * ApproachDel: 8.7 xxxxxx xxxxxx xxxxxx ApproachLOS: A * * * Note: Queue reported is the number of cars per lane.
91 EX MIDDAY Wed Jan 11, :54:47 Page HCM 4-Way Stop Method (Base Volume Alternative) Intersection #10 Anaheim Way & Pier B St Cycle (sec): 100 Critical Vol./Cap.(X): Loss Time (sec): 0 (Y+R=4.0 sec) Average Delay (sec/veh): 8.4 Optimal Cycle: 0 Level Of Service: A Control: Stop Sign Stop Sign Stop Sign Stop Sign Rights: Include Include Include Include Lanes: Base Vol: Initial Bse: User Adj: PHF Adj: PHF Volume: Reduced Vol: PCE Adj: MLF Adj: FinalVolume: Lanes: Final Sat.: Vol/Sat: xxxx xxxx xxxx 0.10 xxxx xxxx xxxx Crit Moves: **** **** **** Delay/Veh: Delay Adj: AdjDel/Veh: LOS by Move: * * * A * A A A * * A A ApproachDel: xxxxxx Delay Adj: xxxxx ApprAdjDel: xxxxxx LOS by Appr: * A A A AllWayAvgQ: Note: Queue reported is the number of cars per lane.
92 EX PM Wed Jan 11, :54:16 Page 3-1 ICU 1(Loss as Cycle Length %) Method (Base Volume Alternative) Intersection #1 Pier B St & Pico Ave Cycle (sec): 100 Critical Vol./Cap.(X): Loss Time (sec): 10 (Y+R=4.0 sec) Average Delay (sec/veh): xxxxxx Optimal Cycle: 26 Level Of Service: A Street Name: Pier B St Pico Ave Control: Split Phase Split Phase Protected Protected Rights: Ignore Include Include Ignore Lanes: Base Vol: Initial Bse: User Adj: PHF Adj: PHF Volume: Reduced Vol: PCE Adj: MLF Adj: FinalVolume: Sat/Lane: Lanes: Final Sat.: Vol/Sat: Crit Moves: **** **** **** ****
93 EX PM Wed Jan 11, :54:16 Page 4-1 ICU 1(Loss as Cycle Length %) Method (Base Volume Alternative) Intersection #2 Pico Ave & Pier C St Cycle (sec): 100 Critical Vol./Cap.(X): Loss Time (sec): 10 (Y+R=4.0 sec) Average Delay (sec/veh): xxxxxx Optimal Cycle: 22 Level Of Service: A Control: Protected Protected Protected Protected Rights: Include Ignore Ovl Include Lanes: Base Vol: Initial Bse: User Adj: PHF Adj: PHF Volume: Reduced Vol: PCE Adj: MLF Adj: FinalVolume: OvlAdjVol: 42 Sat/Lane: Lanes: Final Sat.: Vol/Sat: OvlAdjV/S: 0.03 Crit Moves: **** **** ****
94 EX PM Wed Jan 11, :54:16 Page HCM 4-Way Stop Method (Base Volume Alternative) Intersection #3 Pico Ave & Pier D St/Water St Cycle (sec): 100 Critical Vol./Cap.(X): Loss Time (sec): 0 (Y+R=4.0 sec) Average Delay (sec/veh): 8.4 Optimal Cycle: 0 Level Of Service: A Control: Stop Sign Stop Sign Stop Sign Stop Sign Rights: Include Include Include Include Lanes: Base Vol: Initial Bse: User Adj: PHF Adj: PHF Volume: Reduced Vol: PCE Adj: MLF Adj: FinalVolume: Lanes: Final Sat.: Vol/Sat: Crit Moves: **** **** **** **** Delay/Veh: Delay Adj: AdjDel/Veh: LOS by Move: A A A A A A A A A A A A ApproachDel: Delay Adj: ApprAdjDel: LOS by Appr: A A A A AllWayAvgQ: Note: Queue reported is the number of cars per lane.
95 EX PM Wed Jan 11, :54:16 Page HCM 4-Way Stop Method (Base Volume Alternative) Intersection #4 Pico Ave & Pier E St/EB Ocean Ave Cycle (sec): 100 Critical Vol./Cap.(X): Loss Time (sec): 0 (Y+R=4.0 sec) Average Delay (sec/veh): 9.0 Optimal Cycle: 0 Level Of Service: A Control: Stop Sign Stop Sign Stop Sign Stop Sign Rights: Include Include Include Include Lanes: Base Vol: Initial Bse: User Adj: PHF Adj: PHF Volume: Reduced Vol: PCE Adj: MLF Adj: FinalVolume: Lanes: Final Sat.: Vol/Sat: Crit Moves: **** **** **** **** Delay/Veh: Delay Adj: AdjDel/Veh: LOS by Move: A A A A A A A A A A A A ApproachDel: Delay Adj: ApprAdjDel: LOS by Appr: A A A A AllWayAvgQ: Note: Queue reported is the number of cars per lane.
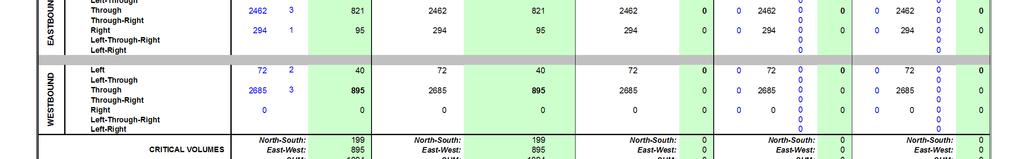
96
97 EX PM Wed Jan 11, :54:16 Page 11-1 ICU 1(Loss as Cycle Length %) Method (Base Volume Alternative) Intersection #7 Anaheim St & Farragut Av Cycle (sec): 100 Critical Vol./Cap.(X): Loss Time (sec): 10 (Y+R=4.0 sec) Average Delay (sec/veh): xxxxxx Optimal Cycle: 32 Level Of Service: A Control: Protected Protected Protected Protected Rights: Include Ovl Include Ovl Lanes: Base Vol: Initial Bse: User Adj: PHF Adj: PHF Volume: Reduced Vol: PCE Adj: MLF Adj: FinalVolume: OvlAdjVol: 50 0 Sat/Lane: Lanes: Final Sat.: Vol/Sat: OvlAdjV/S: Crit Moves: **** **** ****
98 EX PM Wed Jan 11, :54:16 Page 12-1 ICU 1(Loss as Cycle Length %) Method (Base Volume Alternative) Intersection #8 Anaheim S & 1 St/West 9th St Cycle (sec): 100 Critical Vol./Cap.(X): Loss Time (sec): 10 (Y+R=4.0 sec) Average Delay (sec/veh): xxxxxx Optimal Cycle: 31 Level Of Service: A Control: Permitted Permitted Protected Protected Rights: Ignore Ignore Include Include Lanes: Base Vol: Initial Bse: User Adj: PHF Adj: PHF Volume: Reduced Vol: PCE Adj: MLF Adj: FinalVolume: Sat/Lane: Lanes: Final Sat.: Vol/Sat: Crit Moves: **** **** **** ****
99 EX PM Wed Jan 11, :54:16 Page HCM Unsignalized Method (Base Volume Alternative) Intersection #9 Pier B St & Edison Ave Average Delay (sec/veh): 1.0 Worst Case Level Of Service: A[ 9.0] Control: Stop Sign Stop Sign Uncontrolled Uncontrolled Rights: Include Include Include Include Lanes: Base Vol: Initial Bse: User Adj: PHF Adj: PHF Volume: FinalVolume: Critical Gap Module: Critical Gp: 6.8 xxxx 6.9 xxxxx xxxx xxxxx xxxxx xxxx xxxxx 4.1 xxxx xxxxx FollowUpTim: 3.5 xxxx 3.3 xxxxx xxxx xxxxx xxxxx xxxx xxxxx 2.2 xxxx xxxxx Capacity Module: Cnflict Vol: 251 xxxx 95 xxxx xxxx xxxxx xxxx xxxx xxxxx 189 xxxx xxxxx Potent Cap.: 722 xxxx 950 xxxx xxxx xxxxx xxxx xxxx xxxxx 1397 xxxx xxxxx Move Cap.: 720 xxxx 950 xxxx xxxx xxxxx xxxx xxxx xxxxx 1397 xxxx xxxxx Volume/Cap: 0.01 xxxx 0.03 xxxx xxxx xxxx xxxx xxxx xxxx 0.00 xxxx xxxx Level Of Service Module: 2Way95thQ: 0.0 xxxx 0.1 xxxx xxxx xxxxx xxxx xxxx xxxxx 0.0 xxxx xxxxx Control Del: 10.0 xxxx 8.9 xxxxx xxxx xxxxx xxxxx xxxx xxxxx 7.6 xxxx xxxxx LOS by Move: B * A * * * * * * A * * Movement: LT - LTR - RT LT - LTR - RT LT - LTR - RT LT - LTR - RT Shared Cap.: xxxx xxxx xxxxx xxxx xxxx xxxxx xxxx xxxx xxxxx xxxx xxxx xxxxx SharedQueue:xxxxx xxxx xxxxx xxxxx xxxx xxxxx xxxxx xxxx xxxxx 0.0 xxxx xxxxx Shrd ConDel:xxxxx xxxx xxxxx xxxxx xxxx xxxxx xxxxx xxxx xxxxx 7.6 xxxx xxxxx Shared LOS: * * * * * * * * * A * * ApproachDel: 9.0 xxxxxx xxxxxx xxxxxx ApproachLOS: A * * * Note: Queue reported is the number of cars per lane.
100 EX PM Wed Jan 11, :54:16 Page HCM 4-Way Stop Method (Base Volume Alternative) Intersection #10 Anaheim Way & Pier B St Cycle (sec): 100 Critical Vol./Cap.(X): Loss Time (sec): 0 (Y+R=4.0 sec) Average Delay (sec/veh): 7.7 Optimal Cycle: 0 Level Of Service: A Control: Stop Sign Stop Sign Stop Sign Stop Sign Rights: Include Include Include Include Lanes: Base Vol: Initial Bse: User Adj: PHF Adj: PHF Volume: Reduced Vol: PCE Adj: MLF Adj: FinalVolume: Lanes: Final Sat.: Vol/Sat: xxxx xxxx xxxx 0.03 xxxx xxxx xxxx Crit Moves: **** **** **** Delay/Veh: Delay Adj: AdjDel/Veh: LOS by Move: * * * A * A A A * * A A ApproachDel: xxxxxx Delay Adj: xxxxx ApprAdjDel: xxxxxx LOS by Appr: * A A A AllWayAvgQ: Note: Queue reported is the number of cars per lane.
101 EXISTING (2011) PLUS PROJECT ALTERNATIVES 1 AND 3
102 E+P AM Thu Feb 2, :58:27 Page 3-1 ICU 1(Loss as Cycle Length %) Method (Base Volume Alternative) Intersection #1 Pier B St & Pico Ave Cycle (sec): 100 Critical Vol./Cap.(X): Loss Time (sec): 10 (Y+R=4.0 sec) Average Delay (sec/veh): xxxxxx Optimal Cycle: 23 Level Of Service: A Street Name: Pier B St Pico Ave Control: Split Phase Split Phase Protected Protected Rights: Ignore Include Include Ignore Lanes: Base Vol: Initial Bse: User Adj: PHF Adj: PHF Volume: Reduced Vol: PCE Adj: MLF Adj: FinalVolume: Sat/Lane: Lanes: Final Sat.: Vol/Sat: Crit Moves: **** **** **** ****
103 E+P AM Thu Feb 2, :58:27 Page 4-1 ICU 1(Loss as Cycle Length %) Method (Base Volume Alternative) Intersection #2 Pico Ave & Pier C St Cycle (sec): 100 Critical Vol./Cap.(X): Loss Time (sec): 10 (Y+R=4.0 sec) Average Delay (sec/veh): xxxxxx Optimal Cycle: 22 Level Of Service: A Control: Protected Protected Protected Protected Rights: Include Ignore Ovl Include Lanes: Base Vol: Initial Bse: User Adj: PHF Adj: PHF Volume: Reduced Vol: PCE Adj: MLF Adj: FinalVolume: OvlAdjVol: 0 Sat/Lane: Lanes: Final Sat.: Vol/Sat: OvlAdjV/S: 0.00 Crit Moves: **** **** ****
104 E+P AM Thu Feb 2, :58:27 Page HCM 4-Way Stop Method (Base Volume Alternative) Intersection #3 Pico Ave & Pier D St/Water St Cycle (sec): 100 Critical Vol./Cap.(X): Loss Time (sec): 0 (Y+R=4.0 sec) Average Delay (sec/veh): 8.6 Optimal Cycle: 0 Level Of Service: A Control: Stop Sign Stop Sign Stop Sign Stop Sign Rights: Include Include Include Include Lanes: Base Vol: Initial Bse: User Adj: PHF Adj: PHF Volume: Reduced Vol: PCE Adj: MLF Adj: FinalVolume: Lanes: Final Sat.: Vol/Sat: xxxx Crit Moves: **** **** **** **** Delay/Veh: Delay Adj: AdjDel/Veh: LOS by Move: A A A * A A A A A A A A ApproachDel: Delay Adj: ApprAdjDel: LOS by Appr: A A A A AllWayAvgQ: Note: Queue reported is the number of cars per lane.
105 E+P AM Thu Feb 2, :58:27 Page HCM 4-Way Stop Method (Base Volume Alternative) Intersection #4 Pico Ave & Pier E St/EB Ocean Ave Cycle (sec): 100 Critical Vol./Cap.(X): Loss Time (sec): 0 (Y+R=4.0 sec) Average Delay (sec/veh): 9.0 Optimal Cycle: 0 Level Of Service: A Control: Stop Sign Stop Sign Stop Sign Stop Sign Rights: Include Include Include Include Lanes: Base Vol: Initial Bse: User Adj: PHF Adj: PHF Volume: Reduced Vol: PCE Adj: MLF Adj: FinalVolume: Lanes: Final Sat.: Vol/Sat: Crit Moves: **** **** **** **** Delay/Veh: Delay Adj: AdjDel/Veh: LOS by Move: A A A A A A A A A B A A ApproachDel: Delay Adj: ApprAdjDel: LOS by Appr: A A A A AllWayAvgQ: Note: Queue reported is the number of cars per lane.
106
107 E+P AM Thu Feb 2, :58:27 Page 11-1 ICU 1(Loss as Cycle Length %) Method (Base Volume Alternative) Intersection #7 Anaheim St & Farragut Av Cycle (sec): 100 Critical Vol./Cap.(X): Loss Time (sec): 10 (Y+R=4.0 sec) Average Delay (sec/veh): xxxxxx Optimal Cycle: 30 Level Of Service: A Control: Protected Protected Protected Protected Rights: Include Ovl Include Ovl Lanes: Base Vol: Initial Bse: User Adj: PHF Adj: PHF Volume: Reduced Vol: PCE Adj: MLF Adj: FinalVolume: OvlAdjVol: 0 13 Sat/Lane: Lanes: Final Sat.: Vol/Sat: OvlAdjV/S: Crit Moves: **** **** ****
108 E+P AM Thu Feb 2, :58:27 Page 12-1 ICU 1(Loss as Cycle Length %) Method (Base Volume Alternative) Intersection #8 Anaheim S & 1 St/West 9th St Cycle (sec): 100 Critical Vol./Cap.(X): Loss Time (sec): 10 (Y+R=4.0 sec) Average Delay (sec/veh): xxxxxx Optimal Cycle: 32 Level Of Service: A Control: Permitted Permitted Protected Protected Rights: Ignore Ignore Include Include Lanes: Base Vol: Initial Bse: User Adj: PHF Adj: PHF Volume: Reduced Vol: PCE Adj: MLF Adj: FinalVolume: Sat/Lane: Lanes: Final Sat.: Vol/Sat: Crit Moves: **** **** **** ****
109 E+P AM Thu Feb 2, :58:27 Page HCM Unsignalized Method (Base Volume Alternative) Intersection #9 Pier B St & Edison Ave Average Delay (sec/veh): 2.1 Worst Case Level Of Service: A[ 8.6] Control: Stop Sign Stop Sign Uncontrolled Uncontrolled Rights: Include Include Include Include Lanes: Base Vol: Initial Bse: User Adj: PHF Adj: PHF Volume: FinalVolume: Critical Gap Module: Critical Gp: 6.8 xxxx 6.9 xxxxx xxxx xxxxx xxxxx xxxx xxxxx 4.1 xxxx xxxxx FollowUpTim: 3.5 xxxx 3.3 xxxxx xxxx xxxxx xxxxx xxxx xxxxx 2.2 xxxx xxxxx Capacity Module: Cnflict Vol: 126 xxxx 22 xxxx xxxx xxxxx xxxx xxxx xxxxx 43 xxxx xxxxx Potent Cap.: 862 xxxx 1057 xxxx xxxx xxxxx xxxx xxxx xxxxx 1579 xxxx xxxxx Move Cap.: 852 xxxx 1057 xxxx xxxx xxxxx xxxx xxxx xxxxx 1579 xxxx xxxxx Volume/Cap: 0.00 xxxx 0.02 xxxx xxxx xxxx xxxx xxxx xxxx 0.01 xxxx xxxx Level Of Service Module: 2Way95thQ: 0.0 xxxx 0.1 xxxx xxxx xxxxx xxxx xxxx xxxxx 0.0 xxxx xxxxx Control Del: 9.2 xxxx 8.5 xxxxx xxxx xxxxx xxxxx xxxx xxxxx 7.3 xxxx xxxxx LOS by Move: A * A * * * * * * A * * Movement: LT - LTR - RT LT - LTR - RT LT - LTR - RT LT - LTR - RT Shared Cap.: xxxx xxxx xxxxx xxxx xxxx xxxxx xxxx xxxx xxxxx xxxx xxxx xxxxx SharedQueue:xxxxx xxxx xxxxx xxxxx xxxx xxxxx xxxxx xxxx xxxxx 0.0 xxxx xxxxx Shrd ConDel:xxxxx xxxx xxxxx xxxxx xxxx xxxxx xxxxx xxxx xxxxx 7.3 xxxx xxxxx Shared LOS: * * * * * * * * * A * * ApproachDel: 8.6 xxxxxx xxxxxx xxxxxx ApproachLOS: A * * * Note: Queue reported is the number of cars per lane.
110 E+P AM Thu Feb 2, :58:27 Page HCM 4-Way Stop Method (Base Volume Alternative) Intersection #10 Anaheim Way & Pier B St Cycle (sec): 100 Critical Vol./Cap.(X): Loss Time (sec): 0 (Y+R=4.0 sec) Average Delay (sec/veh): 7.6 Optimal Cycle: 0 Level Of Service: A Control: Stop Sign Stop Sign Stop Sign Stop Sign Rights: Include Include Include Include Lanes: Base Vol: Initial Bse: User Adj: PHF Adj: PHF Volume: Reduced Vol: PCE Adj: MLF Adj: FinalVolume: Lanes: Final Sat.: Vol/Sat: xxxx xxxx xxxx 0.03 xxxx xxxx xxxx Crit Moves: **** **** **** Delay/Veh: Delay Adj: AdjDel/Veh: LOS by Move: * * * A * A A A * * A A ApproachDel: xxxxxx Delay Adj: xxxxx ApprAdjDel: xxxxxx LOS by Appr: * A A A AllWayAvgQ: Note: Queue reported is the number of cars per lane.
111 E+P MIDDAY Thu Feb 2, :58:29 Page 3-1 ICU 1(Loss as Cycle Length %) Method (Base Volume Alternative) Intersection #1 Pier B St & Pico Ave Cycle (sec): 100 Critical Vol./Cap.(X): Loss Time (sec): 10 (Y+R=4.0 sec) Average Delay (sec/veh): xxxxxx Optimal Cycle: 26 Level Of Service: A Street Name: Pier B St Pico Ave Control: Split Phase Split Phase Protected Protected Rights: Ignore Include Include Ignore Lanes: Base Vol: Initial Bse: User Adj: PHF Adj: PHF Volume: Reduced Vol: PCE Adj: MLF Adj: FinalVolume: Sat/Lane: Lanes: Final Sat.: Vol/Sat: Crit Moves: **** **** **** ****
112 E+P MIDDAY Thu Feb 2, :58:29 Page 4-1 ICU 1(Loss as Cycle Length %) Method (Base Volume Alternative) Intersection #2 Pico Ave & Pier C St Cycle (sec): 100 Critical Vol./Cap.(X): Loss Time (sec): 10 (Y+R=4.0 sec) Average Delay (sec/veh): xxxxxx Optimal Cycle: 22 Level Of Service: A Control: Protected Protected Protected Protected Rights: Include Ignore Ovl Include Lanes: Base Vol: Initial Bse: User Adj: PHF Adj: PHF Volume: Reduced Vol: PCE Adj: MLF Adj: FinalVolume: OvlAdjVol: 17 Sat/Lane: Lanes: Final Sat.: Vol/Sat: OvlAdjV/S: 0.01 Crit Moves: **** **** ****
113 E+P MIDDAY Thu Feb 2, :58:29 Page HCM 4-Way Stop Method (Base Volume Alternative) Intersection #3 Pico Ave & Pier D St/Water St Cycle (sec): 100 Critical Vol./Cap.(X): Loss Time (sec): 0 (Y+R=4.0 sec) Average Delay (sec/veh): 8.6 Optimal Cycle: 0 Level Of Service: A Control: Stop Sign Stop Sign Stop Sign Stop Sign Rights: Include Include Include Include Lanes: Base Vol: Initial Bse: User Adj: PHF Adj: PHF Volume: Reduced Vol: PCE Adj: MLF Adj: FinalVolume: Lanes: Final Sat.: Vol/Sat: xxxx Crit Moves: **** **** **** **** Delay/Veh: Delay Adj: AdjDel/Veh: LOS by Move: A A * A A A A A A A A A ApproachDel: Delay Adj: ApprAdjDel: LOS by Appr: A A A A AllWayAvgQ: Note: Queue reported is the number of cars per lane.
114 E+P MIDDAY Thu Feb 2, :58:29 Page HCM 4-Way Stop Method (Base Volume Alternative) Intersection #4 Pico Ave & Pier E St/EB Ocean Ave Cycle (sec): 100 Critical Vol./Cap.(X): Loss Time (sec): 0 (Y+R=4.0 sec) Average Delay (sec/veh): 8.8 Optimal Cycle: 0 Level Of Service: A Control: Stop Sign Stop Sign Stop Sign Stop Sign Rights: Include Include Include Include Lanes: Base Vol: Initial Bse: User Adj: PHF Adj: PHF Volume: Reduced Vol: PCE Adj: MLF Adj: FinalVolume: Lanes: Final Sat.: Vol/Sat: Crit Moves: **** **** **** **** Delay/Veh: Delay Adj: AdjDel/Veh: LOS by Move: A A A A A A A A A A A A ApproachDel: Delay Adj: ApprAdjDel: LOS by Appr: A A A A AllWayAvgQ: Note: Queue reported is the number of cars per lane.
115
116 E+P MIDDAY Thu Feb 2, :58:30 Page 11-1 ICU 1(Loss as Cycle Length %) Method (Base Volume Alternative) Intersection #7 Anaheim St & Farragut Av Cycle (sec): 100 Critical Vol./Cap.(X): Loss Time (sec): 10 (Y+R=4.0 sec) Average Delay (sec/veh): xxxxxx Optimal Cycle: 28 Level Of Service: A Control: Protected Protected Protected Protected Rights: Include Ovl Include Ovl Lanes: Base Vol: Initial Bse: User Adj: PHF Adj: PHF Volume: Reduced Vol: PCE Adj: MLF Adj: FinalVolume: OvlAdjVol: 19 0 Sat/Lane: Lanes: Final Sat.: Vol/Sat: OvlAdjV/S: Crit Moves: **** **** ****
117 E+P MIDDAY Thu Feb 2, :58:30 Page 12-1 ICU 1(Loss as Cycle Length %) Method (Base Volume Alternative) Intersection #8 Anaheim S & 1 St/West 9th St Cycle (sec): 100 Critical Vol./Cap.(X): Loss Time (sec): 10 (Y+R=4.0 sec) Average Delay (sec/veh): xxxxxx Optimal Cycle: 29 Level Of Service: A Control: Permitted Permitted Protected Protected Rights: Ignore Ignore Include Include Lanes: Base Vol: Initial Bse: User Adj: PHF Adj: PHF Volume: Reduced Vol: PCE Adj: MLF Adj: FinalVolume: Sat/Lane: Lanes: Final Sat.: Vol/Sat: Crit Moves: **** **** **** ****
118 E+P MIDDAY Thu Feb 2, :58:30 Page HCM Unsignalized Method (Base Volume Alternative) Intersection #9 Pier B St & Edison Ave Average Delay (sec/veh): 1.8 Worst Case Level Of Service: A[ 8.7] Control: Stop Sign Stop Sign Uncontrolled Uncontrolled Rights: Include Include Include Include Lanes: Base Vol: Initial Bse: User Adj: PHF Adj: PHF Volume: FinalVolume: Critical Gap Module: Critical Gp: 6.8 xxxx 6.9 xxxxx xxxx xxxxx xxxxx xxxx xxxxx 4.1 xxxx xxxxx FollowUpTim: 3.5 xxxx 3.3 xxxxx xxxx xxxxx xxxxx xxxx xxxxx 2.2 xxxx xxxxx Capacity Module: Cnflict Vol: 160 xxxx 45 xxxx xxxx xxxxx xxxx xxxx xxxxx 90 xxxx xxxxx Potent Cap.: 822 xxxx 1022 xxxx xxxx xxxxx xxxx xxxx xxxxx 1518 xxxx xxxxx Move Cap.: 816 xxxx 1022 xxxx xxxx xxxxx xxxx xxxx xxxxx 1518 xxxx xxxxx Volume/Cap: 0.00 xxxx 0.03 xxxx xxxx xxxx xxxx xxxx xxxx 0.01 xxxx xxxx Level Of Service Module: 2Way95thQ: 0.0 xxxx 0.1 xxxx xxxx xxxxx xxxx xxxx xxxxx 0.0 xxxx xxxxx Control Del: 9.4 xxxx 8.6 xxxxx xxxx xxxxx xxxxx xxxx xxxxx 7.4 xxxx xxxxx LOS by Move: A * A * * * * * * A * * Movement: LT - LTR - RT LT - LTR - RT LT - LTR - RT LT - LTR - RT Shared Cap.: xxxx xxxx xxxxx xxxx xxxx xxxxx xxxx xxxx xxxxx xxxx xxxx xxxxx SharedQueue:xxxxx xxxx xxxxx xxxxx xxxx xxxxx xxxxx xxxx xxxxx 0.0 xxxx xxxxx Shrd ConDel:xxxxx xxxx xxxxx xxxxx xxxx xxxxx xxxxx xxxx xxxxx 7.4 xxxx xxxxx Shared LOS: * * * * * * * * * A * * ApproachDel: 8.7 xxxxxx xxxxxx xxxxxx ApproachLOS: A * * * Note: Queue reported is the number of cars per lane.
119 E+P MIDDAY Thu Feb 2, :58:30 Page HCM 4-Way Stop Method (Base Volume Alternative) Intersection #10 Anaheim Way & Pier B St Cycle (sec): 100 Critical Vol./Cap.(X): Loss Time (sec): 0 (Y+R=4.0 sec) Average Delay (sec/veh): 8.4 Optimal Cycle: 0 Level Of Service: A Control: Stop Sign Stop Sign Stop Sign Stop Sign Rights: Include Include Include Include Lanes: Base Vol: Initial Bse: User Adj: PHF Adj: PHF Volume: Reduced Vol: PCE Adj: MLF Adj: FinalVolume: Lanes: Final Sat.: Vol/Sat: xxxx xxxx xxxx 0.11 xxxx xxxx xxxx Crit Moves: **** **** **** Delay/Veh: Delay Adj: AdjDel/Veh: LOS by Move: * * * A * A A A * * A A ApproachDel: xxxxxx Delay Adj: xxxxx ApprAdjDel: xxxxxx LOS by Appr: * A A A AllWayAvgQ: Note: Queue reported is the number of cars per lane.
120 E+P PM Thu Feb 2, :58:32 Page 3-1 ICU 1(Loss as Cycle Length %) Method (Base Volume Alternative) Intersection #1 Pier B St & Pico Ave Cycle (sec): 100 Critical Vol./Cap.(X): Loss Time (sec): 10 (Y+R=4.0 sec) Average Delay (sec/veh): xxxxxx Optimal Cycle: 27 Level Of Service: A Street Name: Pier B St Pico Ave Control: Split Phase Split Phase Protected Protected Rights: Ignore Include Include Ignore Lanes: Base Vol: Initial Bse: User Adj: PHF Adj: PHF Volume: Reduced Vol: PCE Adj: MLF Adj: FinalVolume: Sat/Lane: Lanes: Final Sat.: Vol/Sat: Crit Moves: **** **** **** ****
121 E+P PM Thu Feb 2, :58:32 Page 4-1 ICU 1(Loss as Cycle Length %) Method (Base Volume Alternative) Intersection #2 Pico Ave & Pier C St Cycle (sec): 100 Critical Vol./Cap.(X): Loss Time (sec): 10 (Y+R=4.0 sec) Average Delay (sec/veh): xxxxxx Optimal Cycle: 23 Level Of Service: A Control: Protected Protected Protected Protected Rights: Include Ignore Ovl Include Lanes: Base Vol: Initial Bse: User Adj: PHF Adj: PHF Volume: Reduced Vol: PCE Adj: MLF Adj: FinalVolume: OvlAdjVol: 42 Sat/Lane: Lanes: Final Sat.: Vol/Sat: OvlAdjV/S: 0.03 Crit Moves: **** **** ****
122 E+P PM Thu Feb 2, :58:32 Page HCM 4-Way Stop Method (Base Volume Alternative) Intersection #3 Pico Ave & Pier D St/Water St Cycle (sec): 100 Critical Vol./Cap.(X): Loss Time (sec): 0 (Y+R=4.0 sec) Average Delay (sec/veh): 8.7 Optimal Cycle: 0 Level Of Service: A Control: Stop Sign Stop Sign Stop Sign Stop Sign Rights: Include Include Include Include Lanes: Base Vol: Initial Bse: User Adj: PHF Adj: PHF Volume: Reduced Vol: PCE Adj: MLF Adj: FinalVolume: Lanes: Final Sat.: Vol/Sat: Crit Moves: **** **** **** **** Delay/Veh: Delay Adj: AdjDel/Veh: LOS by Move: A A A A A A A A A A A A ApproachDel: Delay Adj: ApprAdjDel: LOS by Appr: A A A A AllWayAvgQ: Note: Queue reported is the number of cars per lane.
123 E+P PM Thu Feb 2, :58:32 Page HCM 4-Way Stop Method (Base Volume Alternative) Intersection #4 Pico Ave & Pier E St/EB Ocean Ave Cycle (sec): 100 Critical Vol./Cap.(X): Loss Time (sec): 0 (Y+R=4.0 sec) Average Delay (sec/veh): 9.0 Optimal Cycle: 0 Level Of Service: A Control: Stop Sign Stop Sign Stop Sign Stop Sign Rights: Include Include Include Include Lanes: Base Vol: Initial Bse: User Adj: PHF Adj: PHF Volume: Reduced Vol: PCE Adj: MLF Adj: FinalVolume: Lanes: Final Sat.: Vol/Sat: Crit Moves: **** **** **** **** Delay/Veh: Delay Adj: AdjDel/Veh: LOS by Move: A A A A A A A A A A A A ApproachDel: Delay Adj: ApprAdjDel: LOS by Appr: A A A A AllWayAvgQ: Note: Queue reported is the number of cars per lane.
124
125 E+P PM Thu Feb 2, :58:32 Page 11-1 ICU 1(Loss as Cycle Length %) Method (Base Volume Alternative) Intersection #7 Anaheim St & Farragut Av Cycle (sec): 100 Critical Vol./Cap.(X): Loss Time (sec): 10 (Y+R=4.0 sec) Average Delay (sec/veh): xxxxxx Optimal Cycle: 32 Level Of Service: A Control: Protected Protected Protected Protected Rights: Include Ovl Include Ovl Lanes: Base Vol: Initial Bse: User Adj: PHF Adj: PHF Volume: Reduced Vol: PCE Adj: MLF Adj: FinalVolume: OvlAdjVol: 50 0 Sat/Lane: Lanes: Final Sat.: Vol/Sat: OvlAdjV/S: Crit Moves: **** **** ****
126 E+P PM Thu Feb 2, :58:32 Page 12-1 ICU 1(Loss as Cycle Length %) Method (Base Volume Alternative) Intersection #8 Anaheim S & 1 St/West 9th St Cycle (sec): 100 Critical Vol./Cap.(X): Loss Time (sec): 10 (Y+R=4.0 sec) Average Delay (sec/veh): xxxxxx Optimal Cycle: 31 Level Of Service: A Control: Permitted Permitted Protected Protected Rights: Ignore Ignore Include Include Lanes: Base Vol: Initial Bse: User Adj: PHF Adj: PHF Volume: Reduced Vol: PCE Adj: MLF Adj: FinalVolume: Sat/Lane: Lanes: Final Sat.: Vol/Sat: Crit Moves: **** **** **** ****
127 E+P PM Thu Feb 2, :58:32 Page HCM Unsignalized Method (Base Volume Alternative) Intersection #9 Pier B St & Edison Ave Average Delay (sec/veh): 1.0 Worst Case Level Of Service: A[ 9.0] Control: Stop Sign Stop Sign Uncontrolled Uncontrolled Rights: Include Include Include Include Lanes: Base Vol: Initial Bse: User Adj: PHF Adj: PHF Volume: FinalVolume: Critical Gap Module: Critical Gp: 6.8 xxxx 6.9 xxxxx xxxx xxxxx xxxxx xxxx xxxxx 4.1 xxxx xxxxx FollowUpTim: 3.5 xxxx 3.3 xxxxx xxxx xxxxx xxxxx xxxx xxxxx 2.2 xxxx xxxxx Capacity Module: Cnflict Vol: 251 xxxx 95 xxxx xxxx xxxxx xxxx xxxx xxxxx 189 xxxx xxxxx Potent Cap.: 722 xxxx 950 xxxx xxxx xxxxx xxxx xxxx xxxxx 1397 xxxx xxxxx Move Cap.: 720 xxxx 950 xxxx xxxx xxxxx xxxx xxxx xxxxx 1397 xxxx xxxxx Volume/Cap: 0.01 xxxx 0.03 xxxx xxxx xxxx xxxx xxxx xxxx 0.00 xxxx xxxx Level Of Service Module: 2Way95thQ: 0.0 xxxx 0.1 xxxx xxxx xxxxx xxxx xxxx xxxxx 0.0 xxxx xxxxx Control Del: 10.0 xxxx 8.9 xxxxx xxxx xxxxx xxxxx xxxx xxxxx 7.6 xxxx xxxxx LOS by Move: B * A * * * * * * A * * Movement: LT - LTR - RT LT - LTR - RT LT - LTR - RT LT - LTR - RT Shared Cap.: xxxx xxxx xxxxx xxxx xxxx xxxxx xxxx xxxx xxxxx xxxx xxxx xxxxx SharedQueue:xxxxx xxxx xxxxx xxxxx xxxx xxxxx xxxxx xxxx xxxxx 0.0 xxxx xxxxx Shrd ConDel:xxxxx xxxx xxxxx xxxxx xxxx xxxxx xxxxx xxxx xxxxx 7.6 xxxx xxxxx Shared LOS: * * * * * * * * * A * * ApproachDel: 9.0 xxxxxx xxxxxx xxxxxx ApproachLOS: A * * * Note: Queue reported is the number of cars per lane.
128 E+P PM Thu Feb 2, :58:32 Page HCM 4-Way Stop Method (Base Volume Alternative) Intersection #10 Anaheim Way & Pier B St Cycle (sec): 100 Critical Vol./Cap.(X): Loss Time (sec): 0 (Y+R=4.0 sec) Average Delay (sec/veh): 7.7 Optimal Cycle: 0 Level Of Service: A Control: Stop Sign Stop Sign Stop Sign Stop Sign Rights: Include Include Include Include Lanes: Base Vol: Initial Bse: User Adj: PHF Adj: PHF Volume: Reduced Vol: PCE Adj: MLF Adj: FinalVolume: Lanes: Final Sat.: Vol/Sat: xxxx xxxx xxxx 0.03 xxxx xxxx xxxx Crit Moves: **** **** **** Delay/Veh: Delay Adj: AdjDel/Veh: LOS by Move: * * * A * A A A * * A A ApproachDel: xxxxxx Delay Adj: xxxxx ApprAdjDel: xxxxxx LOS by Appr: * A A A AllWayAvgQ: Note: Queue reported is the number of cars per lane.
129 EXISTING (2011) PLUS PROJECT ALTERNATIVE 2
130 E+PIERB AM Thu Feb 2, :58:34 Page 3-1 ICU 1(Loss as Cycle Length %) Method (Base Volume Alternative) Intersection #1 Pier B St & Pico Ave Cycle (sec): 100 Critical Vol./Cap.(X): Loss Time (sec): 10 (Y+R=4.0 sec) Average Delay (sec/veh): xxxxxx Optimal Cycle: 25 Level Of Service: A Street Name: Pier B St Pico Ave Control: Split Phase Split Phase Protected Protected Rights: Ignore Include Include Ignore Lanes: Base Vol: Initial Bse: User Adj: PHF Adj: PHF Volume: Reduced Vol: PCE Adj: MLF Adj: FinalVolume: Sat/Lane: Lanes: Final Sat.: Vol/Sat: Crit Moves: **** **** **** ****
131 E+PIERB AM Thu Feb 2, :58:34 Page 4-1 ICU 1(Loss as Cycle Length %) Method (Base Volume Alternative) Intersection #2 Pico Ave & Pier C St Cycle (sec): 100 Critical Vol./Cap.(X): Loss Time (sec): 10 (Y+R=4.0 sec) Average Delay (sec/veh): xxxxxx Optimal Cycle: 22 Level Of Service: A Control: Protected Protected Protected Protected Rights: Include Ignore Ovl Include Lanes: Base Vol: Initial Bse: User Adj: PHF Adj: PHF Volume: Reduced Vol: PCE Adj: MLF Adj: FinalVolume: OvlAdjVol: 0 Sat/Lane: Lanes: Final Sat.: Vol/Sat: OvlAdjV/S: 0.00 Crit Moves: **** **** ****
132 E+PIERB AM Thu Feb 2, :58:34 Page HCM 4-Way Stop Method (Base Volume Alternative) Intersection #3 Pico Ave & Pier D St/Water St Cycle (sec): 100 Critical Vol./Cap.(X): Loss Time (sec): 0 (Y+R=4.0 sec) Average Delay (sec/veh): 8.2 Optimal Cycle: 0 Level Of Service: A Control: Stop Sign Stop Sign Stop Sign Stop Sign Rights: Include Include Include Include Lanes: Base Vol: Initial Bse: User Adj: PHF Adj: PHF Volume: Reduced Vol: PCE Adj: MLF Adj: FinalVolume: Lanes: Final Sat.: Vol/Sat: xxxx Crit Moves: **** **** **** **** Delay/Veh: Delay Adj: AdjDel/Veh: LOS by Move: A A A * A A A A A A A A ApproachDel: Delay Adj: ApprAdjDel: LOS by Appr: A A A A AllWayAvgQ: Note: Queue reported is the number of cars per lane.
133 E+PIERB AM Thu Feb 2, :58:34 Page HCM 4-Way Stop Method (Base Volume Alternative) Intersection #4 Pico Ave & Pier E St/EB Ocean Ave Cycle (sec): 100 Critical Vol./Cap.(X): Loss Time (sec): 0 (Y+R=4.0 sec) Average Delay (sec/veh): 9.0 Optimal Cycle: 0 Level Of Service: A Control: Stop Sign Stop Sign Stop Sign Stop Sign Rights: Include Include Include Include Lanes: Base Vol: Initial Bse: User Adj: PHF Adj: PHF Volume: Reduced Vol: PCE Adj: MLF Adj: FinalVolume: Lanes: Final Sat.: Vol/Sat: Crit Moves: **** **** **** **** Delay/Veh: Delay Adj: AdjDel/Veh: LOS by Move: A A A A A A A A A B A A ApproachDel: Delay Adj: ApprAdjDel: LOS by Appr: A A A A AllWayAvgQ: Note: Queue reported is the number of cars per lane.
134
135 E+PIERB AM Thu Feb 2, :58:35 Page 11-1 ICU 1(Loss as Cycle Length %) Method (Base Volume Alternative) Intersection #7 Anaheim St & Farragut Av Cycle (sec): 100 Critical Vol./Cap.(X): Loss Time (sec): 10 (Y+R=4.0 sec) Average Delay (sec/veh): xxxxxx Optimal Cycle: 30 Level Of Service: A Control: Protected Protected Protected Protected Rights: Include Ovl Include Ovl Lanes: Base Vol: Initial Bse: User Adj: PHF Adj: PHF Volume: Reduced Vol: PCE Adj: MLF Adj: FinalVolume: OvlAdjVol: 0 13 Sat/Lane: Lanes: Final Sat.: Vol/Sat: OvlAdjV/S: Crit Moves: **** **** ****
136 E+PIERB AM Thu Feb 2, :58:35 Page 12-1 ICU 1(Loss as Cycle Length %) Method (Base Volume Alternative) Intersection #8 Anaheim S & 1 St/West 9th St Cycle (sec): 100 Critical Vol./Cap.(X): Loss Time (sec): 10 (Y+R=4.0 sec) Average Delay (sec/veh): xxxxxx Optimal Cycle: 32 Level Of Service: A Control: Permitted Permitted Protected Protected Rights: Ignore Ignore Include Include Lanes: Base Vol: Initial Bse: User Adj: PHF Adj: PHF Volume: Reduced Vol: PCE Adj: MLF Adj: FinalVolume: Sat/Lane: Lanes: Final Sat.: Vol/Sat: Crit Moves: **** **** **** ****
137 E+PIERB AM Thu Feb 2, :58:35 Page HCM Unsignalized Method (Base Volume Alternative) Intersection #9 Pier B St & Edison Ave Average Delay (sec/veh): 2.0 Worst Case Level Of Service: A[ 8.6] Control: Stop Sign Stop Sign Uncontrolled Uncontrolled Rights: Include Include Include Include Lanes: Base Vol: Initial Bse: User Adj: PHF Adj: PHF Volume: FinalVolume: Critical Gap Module: Critical Gp: 6.8 xxxx 6.9 xxxxx xxxx xxxxx xxxxx xxxx xxxxx 4.1 xxxx xxxxx FollowUpTim: 3.5 xxxx 3.3 xxxxx xxxx xxxxx xxxxx xxxx xxxxx 2.2 xxxx xxxxx Capacity Module: Cnflict Vol: 131 xxxx 24 xxxx xxxx xxxxx xxxx xxxx xxxxx 47 xxxx xxxxx Potent Cap.: 855 xxxx 1054 xxxx xxxx xxxxx xxxx xxxx xxxxx 1573 xxxx xxxxx Move Cap.: 846 xxxx 1054 xxxx xxxx xxxxx xxxx xxxx xxxxx 1573 xxxx xxxxx Volume/Cap: 0.00 xxxx 0.02 xxxx xxxx xxxx xxxx xxxx xxxx 0.01 xxxx xxxx Level Of Service Module: 2Way95thQ: 0.0 xxxx 0.1 xxxx xxxx xxxxx xxxx xxxx xxxxx 0.0 xxxx xxxxx Control Del: 9.3 xxxx 8.5 xxxxx xxxx xxxxx xxxxx xxxx xxxxx 7.3 xxxx xxxxx LOS by Move: A * A * * * * * * A * * Movement: LT - LTR - RT LT - LTR - RT LT - LTR - RT LT - LTR - RT Shared Cap.: xxxx xxxx xxxxx xxxx xxxx xxxxx xxxx xxxx xxxxx xxxx xxxx xxxxx SharedQueue:xxxxx xxxx xxxxx xxxxx xxxx xxxxx xxxxx xxxx xxxxx 0.0 xxxx xxxxx Shrd ConDel:xxxxx xxxx xxxxx xxxxx xxxx xxxxx xxxxx xxxx xxxxx 7.3 xxxx xxxxx Shared LOS: * * * * * * * * * A * * ApproachDel: 8.6 xxxxxx xxxxxx xxxxxx ApproachLOS: A * * * Note: Queue reported is the number of cars per lane.
138 E+PIERB AM Thu Feb 2, :58:35 Page HCM 4-Way Stop Method (Base Volume Alternative) Intersection #10 Anaheim Way & Pier B St Cycle (sec): 100 Critical Vol./Cap.(X): Loss Time (sec): 0 (Y+R=4.0 sec) Average Delay (sec/veh): 7.6 Optimal Cycle: 0 Level Of Service: A Control: Stop Sign Stop Sign Stop Sign Stop Sign Rights: Include Include Include Include Lanes: Base Vol: Initial Bse: User Adj: PHF Adj: PHF Volume: Reduced Vol: PCE Adj: MLF Adj: FinalVolume: Lanes: Final Sat.: Vol/Sat: xxxx xxxx xxxx 0.03 xxxx xxxx xxxx Crit Moves: **** **** **** Delay/Veh: Delay Adj: AdjDel/Veh: LOS by Move: * * * A * A A A * * A A ApproachDel: xxxxxx Delay Adj: xxxxx ApprAdjDel: xxxxxx LOS by Appr: * A A A AllWayAvgQ: Note: Queue reported is the number of cars per lane.
139 E+PIERB MIDDAY Thu Feb 2, :58:36 Page 3-1 ICU 1(Loss as Cycle Length %) Method (Base Volume Alternative) Intersection #1 Pier B St & Pico Ave Cycle (sec): 100 Critical Vol./Cap.(X): Loss Time (sec): 10 (Y+R=4.0 sec) Average Delay (sec/veh): xxxxxx Optimal Cycle: 28 Level Of Service: A Street Name: Pier B St Pico Ave Control: Split Phase Split Phase Protected Protected Rights: Ignore Include Include Ignore Lanes: Base Vol: Initial Bse: User Adj: PHF Adj: PHF Volume: Reduced Vol: PCE Adj: MLF Adj: FinalVolume: Sat/Lane: Lanes: Final Sat.: Vol/Sat: Crit Moves: **** **** **** ****
140 E+PIERB MIDDAY Thu Feb 2, :58:36 Page 4-1 ICU 1(Loss as Cycle Length %) Method (Base Volume Alternative) Intersection #2 Pico Ave & Pier C St Cycle (sec): 100 Critical Vol./Cap.(X): Loss Time (sec): 10 (Y+R=4.0 sec) Average Delay (sec/veh): xxxxxx Optimal Cycle: 22 Level Of Service: A Control: Protected Protected Protected Protected Rights: Include Ignore Ovl Include Lanes: Base Vol: Initial Bse: User Adj: PHF Adj: PHF Volume: Reduced Vol: PCE Adj: MLF Adj: FinalVolume: OvlAdjVol: 17 Sat/Lane: Lanes: Final Sat.: Vol/Sat: OvlAdjV/S: 0.01 Crit Moves: **** **** ****
141 E+PIERB MIDDAY Thu Feb 2, :58:36 Page HCM 4-Way Stop Method (Base Volume Alternative) Intersection #3 Pico Ave & Pier D St/Water St Cycle (sec): 100 Critical Vol./Cap.(X): Loss Time (sec): 0 (Y+R=4.0 sec) Average Delay (sec/veh): 8.2 Optimal Cycle: 0 Level Of Service: A Control: Stop Sign Stop Sign Stop Sign Stop Sign Rights: Include Include Include Include Lanes: Base Vol: Initial Bse: User Adj: PHF Adj: PHF Volume: Reduced Vol: PCE Adj: MLF Adj: FinalVolume: Lanes: Final Sat.: Vol/Sat: xxxx Crit Moves: **** **** **** **** Delay/Veh: Delay Adj: AdjDel/Veh: LOS by Move: A A * A A A A A A A A A ApproachDel: Delay Adj: ApprAdjDel: LOS by Appr: A A A A AllWayAvgQ: Note: Queue reported is the number of cars per lane.
142 E+PIERB MIDDAY Thu Feb 2, :58:36 Page HCM 4-Way Stop Method (Base Volume Alternative) Intersection #4 Pico Ave & Pier E St/EB Ocean Ave Cycle (sec): 100 Critical Vol./Cap.(X): Loss Time (sec): 0 (Y+R=4.0 sec) Average Delay (sec/veh): 8.8 Optimal Cycle: 0 Level Of Service: A Control: Stop Sign Stop Sign Stop Sign Stop Sign Rights: Include Include Include Include Lanes: Base Vol: Initial Bse: User Adj: PHF Adj: PHF Volume: Reduced Vol: PCE Adj: MLF Adj: FinalVolume: Lanes: Final Sat.: Vol/Sat: Crit Moves: **** **** **** **** Delay/Veh: Delay Adj: AdjDel/Veh: LOS by Move: A A A A A A A A A A A A ApproachDel: Delay Adj: ApprAdjDel: LOS by Appr: A A A A AllWayAvgQ: Note: Queue reported is the number of cars per lane.
143
144 E+PIERB MIDDAY Thu Feb 2, :58:36 Page 11-1 ICU 1(Loss as Cycle Length %) Method (Base Volume Alternative) Intersection #7 Anaheim St & Farragut Av Cycle (sec): 100 Critical Vol./Cap.(X): Loss Time (sec): 10 (Y+R=4.0 sec) Average Delay (sec/veh): xxxxxx Optimal Cycle: 28 Level Of Service: A Control: Protected Protected Protected Protected Rights: Include Ovl Include Ovl Lanes: Base Vol: Initial Bse: User Adj: PHF Adj: PHF Volume: Reduced Vol: PCE Adj: MLF Adj: FinalVolume: OvlAdjVol: 20 0 Sat/Lane: Lanes: Final Sat.: Vol/Sat: OvlAdjV/S: Crit Moves: **** **** ****
145 E+PIERB MIDDAY Thu Feb 2, :58:36 Page 12-1 ICU 1(Loss as Cycle Length %) Method (Base Volume Alternative) Intersection #8 Anaheim S & 1 St/West 9th St Cycle (sec): 100 Critical Vol./Cap.(X): Loss Time (sec): 10 (Y+R=4.0 sec) Average Delay (sec/veh): xxxxxx Optimal Cycle: 29 Level Of Service: A Control: Permitted Permitted Protected Protected Rights: Ignore Ignore Include Include Lanes: Base Vol: Initial Bse: User Adj: PHF Adj: PHF Volume: Reduced Vol: PCE Adj: MLF Adj: FinalVolume: Sat/Lane: Lanes: Final Sat.: Vol/Sat: Crit Moves: **** **** **** ****
146 E+PIERB MIDDAY Thu Feb 2, :58:36 Page HCM Unsignalized Method (Base Volume Alternative) Intersection #9 Pier B St & Edison Ave Average Delay (sec/veh): 1.7 Worst Case Level Of Service: A[ 8.7] Control: Stop Sign Stop Sign Uncontrolled Uncontrolled Rights: Include Include Include Include Lanes: Base Vol: Initial Bse: User Adj: PHF Adj: PHF Volume: FinalVolume: Critical Gap Module: Critical Gp: 6.8 xxxx 6.9 xxxxx xxxx xxxxx xxxxx xxxx xxxxx 4.1 xxxx xxxxx FollowUpTim: 3.5 xxxx 3.3 xxxxx xxxx xxxxx xxxxx xxxx xxxxx 2.2 xxxx xxxxx Capacity Module: Cnflict Vol: 164 xxxx 47 xxxx xxxx xxxxx xxxx xxxx xxxxx 93 xxxx xxxxx Potent Cap.: 816 xxxx 1019 xxxx xxxx xxxxx xxxx xxxx xxxxx 1514 xxxx xxxxx Move Cap.: 811 xxxx 1019 xxxx xxxx xxxxx xxxx xxxx xxxxx 1514 xxxx xxxxx Volume/Cap: 0.00 xxxx 0.03 xxxx xxxx xxxx xxxx xxxx xxxx 0.01 xxxx xxxx Level Of Service Module: 2Way95thQ: 0.0 xxxx 0.1 xxxx xxxx xxxxx xxxx xxxx xxxxx 0.0 xxxx xxxxx Control Del: 9.4 xxxx 8.7 xxxxx xxxx xxxxx xxxxx xxxx xxxxx 7.4 xxxx xxxxx LOS by Move: A * A * * * * * * A * * Movement: LT - LTR - RT LT - LTR - RT LT - LTR - RT LT - LTR - RT Shared Cap.: xxxx xxxx xxxxx xxxx xxxx xxxxx xxxx xxxx xxxxx xxxx xxxx xxxxx SharedQueue:xxxxx xxxx xxxxx xxxxx xxxx xxxxx xxxxx xxxx xxxxx 0.0 xxxx xxxxx Shrd ConDel:xxxxx xxxx xxxxx xxxxx xxxx xxxxx xxxxx xxxx xxxxx 7.4 xxxx xxxxx Shared LOS: * * * * * * * * * A * * ApproachDel: 8.7 xxxxxx xxxxxx xxxxxx ApproachLOS: A * * * Note: Queue reported is the number of cars per lane.
147 E+PIERB MIDDAY Thu Feb 2, :58:36 Page HCM 4-Way Stop Method (Base Volume Alternative) Intersection #10 Anaheim Way & Pier B St Cycle (sec): 100 Critical Vol./Cap.(X): Loss Time (sec): 0 (Y+R=4.0 sec) Average Delay (sec/veh): 8.4 Optimal Cycle: 0 Level Of Service: A Control: Stop Sign Stop Sign Stop Sign Stop Sign Rights: Include Include Include Include Lanes: Base Vol: Initial Bse: User Adj: PHF Adj: PHF Volume: Reduced Vol: PCE Adj: MLF Adj: FinalVolume: Lanes: Final Sat.: Vol/Sat: xxxx xxxx xxxx 0.11 xxxx xxxx xxxx Crit Moves: **** **** **** Delay/Veh: Delay Adj: AdjDel/Veh: LOS by Move: * * * A * A A A * * A A ApproachDel: xxxxxx Delay Adj: xxxxx ApprAdjDel: xxxxxx LOS by Appr: * A A A AllWayAvgQ: Note: Queue reported is the number of cars per lane.
148 E+PIERB PM Thu Feb 2, :58:37 Page 3-1 ICU 1(Loss as Cycle Length %) Method (Base Volume Alternative) Intersection #1 Pier B St & Pico Ave Cycle (sec): 100 Critical Vol./Cap.(X): Loss Time (sec): 10 (Y+R=4.0 sec) Average Delay (sec/veh): xxxxxx Optimal Cycle: 29 Level Of Service: A Street Name: Pier B St Pico Ave Control: Split Phase Split Phase Protected Protected Rights: Ignore Include Include Ignore Lanes: Base Vol: Initial Bse: User Adj: PHF Adj: PHF Volume: Reduced Vol: PCE Adj: MLF Adj: FinalVolume: Sat/Lane: Lanes: Final Sat.: Vol/Sat: Crit Moves: **** **** **** ****
149 E+PIERB PM Thu Feb 2, :58:37 Page 4-1 ICU 1(Loss as Cycle Length %) Method (Base Volume Alternative) Intersection #2 Pico Ave & Pier C St Cycle (sec): 100 Critical Vol./Cap.(X): Loss Time (sec): 10 (Y+R=4.0 sec) Average Delay (sec/veh): xxxxxx Optimal Cycle: 22 Level Of Service: A Control: Protected Protected Protected Protected Rights: Include Ignore Ovl Include Lanes: Base Vol: Initial Bse: User Adj: PHF Adj: PHF Volume: Reduced Vol: PCE Adj: MLF Adj: FinalVolume: OvlAdjVol: 42 Sat/Lane: Lanes: Final Sat.: Vol/Sat: OvlAdjV/S: 0.03 Crit Moves: **** **** ****
150 E+PIERB PM Thu Feb 2, :58:37 Page HCM 4-Way Stop Method (Base Volume Alternative) Intersection #3 Pico Ave & Pier D St/Water St Cycle (sec): 100 Critical Vol./Cap.(X): Loss Time (sec): 0 (Y+R=4.0 sec) Average Delay (sec/veh): 8.4 Optimal Cycle: 0 Level Of Service: A Control: Stop Sign Stop Sign Stop Sign Stop Sign Rights: Include Include Include Include Lanes: Base Vol: Initial Bse: User Adj: PHF Adj: PHF Volume: Reduced Vol: PCE Adj: MLF Adj: FinalVolume: Lanes: Final Sat.: Vol/Sat: Crit Moves: **** **** **** **** Delay/Veh: Delay Adj: AdjDel/Veh: LOS by Move: A A A A A A A A A A A A ApproachDel: Delay Adj: ApprAdjDel: LOS by Appr: A A A A AllWayAvgQ: Note: Queue reported is the number of cars per lane.
151 E+PIERB PM Thu Feb 2, :58:37 Page HCM 4-Way Stop Method (Base Volume Alternative) Intersection #4 Pico Ave & Pier E St/EB Ocean Ave Cycle (sec): 100 Critical Vol./Cap.(X): Loss Time (sec): 0 (Y+R=4.0 sec) Average Delay (sec/veh): 9.0 Optimal Cycle: 0 Level Of Service: A Control: Stop Sign Stop Sign Stop Sign Stop Sign Rights: Include Include Include Include Lanes: Base Vol: Initial Bse: User Adj: PHF Adj: PHF Volume: Reduced Vol: PCE Adj: MLF Adj: FinalVolume: Lanes: Final Sat.: Vol/Sat: Crit Moves: **** **** **** **** Delay/Veh: Delay Adj: AdjDel/Veh: LOS by Move: A A A A A A A A A A A A ApproachDel: Delay Adj: ApprAdjDel: LOS by Appr: A A A A AllWayAvgQ: Note: Queue reported is the number of cars per lane.
152
153 E+PIERB PM Thu Feb 2, :58:37 Page 11-1 ICU 1(Loss as Cycle Length %) Method (Base Volume Alternative) Intersection #7 Anaheim St & Farragut Av Cycle (sec): 100 Critical Vol./Cap.(X): Loss Time (sec): 10 (Y+R=4.0 sec) Average Delay (sec/veh): xxxxxx Optimal Cycle: 32 Level Of Service: A Control: Protected Protected Protected Protected Rights: Include Ovl Include Ovl Lanes: Base Vol: Initial Bse: User Adj: PHF Adj: PHF Volume: Reduced Vol: PCE Adj: MLF Adj: FinalVolume: OvlAdjVol: 49 0 Sat/Lane: Lanes: Final Sat.: Vol/Sat: OvlAdjV/S: Crit Moves: **** **** ****
154 E+PIERB PM Thu Feb 2, :58:37 Page 12-1 ICU 1(Loss as Cycle Length %) Method (Base Volume Alternative) Intersection #8 Anaheim S & 1 St/West 9th St Cycle (sec): 100 Critical Vol./Cap.(X): Loss Time (sec): 10 (Y+R=4.0 sec) Average Delay (sec/veh): xxxxxx Optimal Cycle: 31 Level Of Service: A Control: Permitted Permitted Protected Protected Rights: Ignore Ignore Include Include Lanes: Base Vol: Initial Bse: User Adj: PHF Adj: PHF Volume: Reduced Vol: PCE Adj: MLF Adj: FinalVolume: Sat/Lane: Lanes: Final Sat.: Vol/Sat: Crit Moves: **** **** **** ****
155 E+PIERB PM Thu Feb 2, :58:37 Page HCM Unsignalized Method (Base Volume Alternative) Intersection #9 Pier B St & Edison Ave Average Delay (sec/veh): 1.0 Worst Case Level Of Service: A[ 9.1] Control: Stop Sign Stop Sign Uncontrolled Uncontrolled Rights: Include Include Include Include Lanes: Base Vol: Initial Bse: User Adj: PHF Adj: PHF Volume: FinalVolume: Critical Gap Module: Critical Gp: 6.8 xxxx 6.9 xxxxx xxxx xxxxx xxxxx xxxx xxxxx 4.1 xxxx xxxxx FollowUpTim: 3.5 xxxx 3.3 xxxxx xxxx xxxxx xxxxx xxxx xxxxx 2.2 xxxx xxxxx Capacity Module: Cnflict Vol: 256 xxxx 96 xxxx xxxx xxxxx xxxx xxxx xxxxx 192 xxxx xxxxx Potent Cap.: 717 xxxx 948 xxxx xxxx xxxxx xxxx xxxx xxxxx 1394 xxxx xxxxx Move Cap.: 715 xxxx 948 xxxx xxxx xxxxx xxxx xxxx xxxxx 1394 xxxx xxxxx Volume/Cap: 0.01 xxxx 0.03 xxxx xxxx xxxx xxxx xxxx xxxx 0.00 xxxx xxxx Level Of Service Module: 2Way95thQ: 0.0 xxxx 0.1 xxxx xxxx xxxxx xxxx xxxx xxxxx 0.0 xxxx xxxxx Control Del: 10.1 xxxx 8.9 xxxxx xxxx xxxxx xxxxx xxxx xxxxx 7.6 xxxx xxxxx LOS by Move: B * A * * * * * * A * * Movement: LT - LTR - RT LT - LTR - RT LT - LTR - RT LT - LTR - RT Shared Cap.: xxxx xxxx xxxxx xxxx xxxx xxxxx xxxx xxxx xxxxx xxxx xxxx xxxxx SharedQueue:xxxxx xxxx xxxxx xxxxx xxxx xxxxx xxxxx xxxx xxxxx 0.0 xxxx xxxxx Shrd ConDel:xxxxx xxxx xxxxx xxxxx xxxx xxxxx xxxxx xxxx xxxxx 7.6 xxxx xxxxx Shared LOS: * * * * * * * * * A * * ApproachDel: 9.1 xxxxxx xxxxxx xxxxxx ApproachLOS: A * * * Note: Queue reported is the number of cars per lane.
156 E+PIERB PM Thu Feb 2, :58:37 Page HCM 4-Way Stop Method (Base Volume Alternative) Intersection #10 Anaheim Way & Pier B St Cycle (sec): 100 Critical Vol./Cap.(X): Loss Time (sec): 0 (Y+R=4.0 sec) Average Delay (sec/veh): 7.8 Optimal Cycle: 0 Level Of Service: A Control: Stop Sign Stop Sign Stop Sign Stop Sign Rights: Include Include Include Include Lanes: Base Vol: Initial Bse: User Adj: PHF Adj: PHF Volume: Reduced Vol: PCE Adj: MLF Adj: FinalVolume: Lanes: Final Sat.: Vol/Sat: xxxx xxxx xxxx 0.03 xxxx xxxx xxxx Crit Moves: **** **** **** Delay/Veh: Delay Adj: AdjDel/Veh: LOS by Move: * * * A * A A A * * A A ApproachDel: xxxxxx Delay Adj: xxxxx ApprAdjDel: xxxxxx LOS by Appr: * A A A AllWayAvgQ: Note: Queue reported is the number of cars per lane.
157 EXISTING (2011) PLUS PROJECT CONSTRUCTION ALTERNATIVES 1 AND 3
158 2011+Construction AM Wed Apr 18, :13:33 Page 3-1 ICU 1(Loss as Cycle Length %) Method (Base Volume Alternative) Intersection #1 Pier B St & Pico Ave Cycle (sec): 100 Critical Vol./Cap.(X): Loss Time (sec): 10 Average Delay (sec/veh): xxxxxx Optimal Cycle: 23 Level Of Service: A Street Name: Pier B St Pico Ave Control: Split Phase Split Phase Protected Protected Rights: Ignore Include Include Ignore Y+R: Lanes: Base Vol: Initial Bse: User Adj: PHF Adj: PHF Volume: Reduced Vol: PCE Adj: MLF Adj: FinalVolume: Sat/Lane: Lanes: Final Sat.: Vol/Sat: Crit Moves: **** **** **** ****
159 2011+Construction AM Wed Apr 18, :13:33 Page 4-1 ICU 1(Loss as Cycle Length %) Method (Base Volume Alternative) Intersection #2 Pico Ave & Pier C St Cycle (sec): 100 Critical Vol./Cap.(X): Loss Time (sec): 10 Average Delay (sec/veh): xxxxxx Optimal Cycle: 22 Level Of Service: A Control: Protected Protected Protected Protected Rights: Include Ignore Ovl Include Y+R: Lanes: Base Vol: Initial Bse: User Adj: PHF Adj: PHF Volume: Reduced Vol: PCE Adj: MLF Adj: FinalVolume: OvlAdjVol: 0 Sat/Lane: Lanes: Final Sat.: Vol/Sat: OvlAdjV/S: 0.00 Crit Moves: **** **** ****
160 2011+Construction AM Wed Apr 18, :13:33 Page HCM 4-Way Stop Method (Base Volume Alternative) Intersection #3 Pico Ave & Pier D St/Water St Cycle (sec): 100 Critical Vol./Cap.(X): Loss Time (sec): 0 Average Delay (sec/veh): 8.3 Optimal Cycle: 0 Level Of Service: A Control: Stop Sign Stop Sign Stop Sign Stop Sign Rights: Include Include Include Include Lanes: Base Vol: Initial Bse: User Adj: PHF Adj: PHF Volume: Reduced Vol: PCE Adj: MLF Adj: FinalVolume: Lanes: Final Sat.: Vol/Sat: xxxx Crit Moves: **** **** **** **** Delay/Veh: Delay Adj: AdjDel/Veh: LOS by Move: A A A * A A A A A A A A ApproachDel: Delay Adj: ApprAdjDel: LOS by Appr: A A A A AllWayAvgQ: Note: Queue reported is the number of cars per lane.
161 2011+Construction AM Wed Apr 18, :13:33 Page HCM 4-Way Stop Method (Base Volume Alternative) Intersection #4 Pico Ave & Pier E St/EB Ocean Ave Cycle (sec): 100 Critical Vol./Cap.(X): Loss Time (sec): 0 Average Delay (sec/veh): 9.0 Optimal Cycle: 0 Level Of Service: A Control: Stop Sign Stop Sign Stop Sign Stop Sign Rights: Include Include Include Include Lanes: Base Vol: Initial Bse: User Adj: PHF Adj: PHF Volume: Reduced Vol: PCE Adj: MLF Adj: FinalVolume: Lanes: Final Sat.: Vol/Sat: Crit Moves: **** **** **** **** Delay/Veh: Delay Adj: AdjDel/Veh: LOS by Move: A A A A A A A A A B A A ApproachDel: Delay Adj: ApprAdjDel: LOS by Appr: A A A A AllWayAvgQ: Note: Queue reported is the number of cars per lane.
162 Level of Service Workheet (Circular 212 Method) I/S #: North-South Street: Seaside Year of Count: 2011 Ambient Growth: (%): Conducted by: LR Date: 5 East-West Street: Navy Projection Year: 2011 Peak Hour: Reviewed by: Project: No. of Phases Opposed Ø'ing: N/S-1, E/W-2 or Both-3? Right Turns: FREE-1, NRTOR-2 or OLA-3? NB-- 1 SB-- NB-- 1 SB-- 0 NB-- 0 SB-- 0 NB-- 0 SB-- 0 NB-- 0 SB-- 0 EB-- 3 WB-- EB-- 3 WB-- 0 EB-- 0 WB-- 0 EB-- 0 WB-- 0 EB-- 0 WB-- 0 ATSAC-1 or ATSAC+ATCS-2? Override Capacity NORTHBOUND EXISTING CONDITION EXISTING PLUS PROJECT FUTURE CONDITION W/O PROJECT FUTURE CONDITION W/ PROJECT FUTURE W/ PROJECT W/ MITIGATION MOVEMENT No. of Project Total Added Total No. of Lane Added Total No. of Lane Added Total No. of Lane Volume Lanes Lane Volume Traffic Volume Lane Volume Volume Volume Lanes Volume Volume Volume Lanes Volume Volume Volume Lanes Volume Left Left-Through 0 0 Through Through-Right 0 0 Right Left-Through-Right 0 0 Left-Right 0 0 SOUTHBOUND EASTBOUND WESTBOUND Left Left-Through 0 0 Through Through-Right 0 0 Right Left-Through-Right 0 0 Left-Right 0 0 Left Left-Through 0 0 Through Through-Right 0 0 Right Left-Through-Right 0 0 Left-Right 0 0 Left Left-Through 0 0 Through Through-Right 0 0 Right Left-Through-Right 0 0 Left-Right 0 0 North-South: 94 North-South: 94 North-South: 0 North-South: 0 North-South: 0 CRITICAL VOLUMES East-West: 811 East-West: 811 East-West: 0 East-West: 0 East-West: 0 SUM: 905 SUM: 905 SUM: 0 SUM: 0 SUM: 0 VOLUME/CAPACITY (V/C) RATIO: V/C LESS ATSAC/ATCS ADJUSTMENT: LEVEL OF SERVICE (LOS): A A A A A 4/19/2012-5:58 PM 1 Intersection 6 CMA.xls
163 2011+Construction AM Wed Apr 18, :13:33 Page 11-1 ICU 1(Loss as Cycle Length %) Method (Base Volume Alternative) Intersection #7 Anaheim St & Farragut Av Cycle (sec): 100 Critical Vol./Cap.(X): Loss Time (sec): 10 Average Delay (sec/veh): xxxxxx Optimal Cycle: 30 Level Of Service: A Control: Protected Protected Protected Protected Rights: Include Ovl Include Ovl Y+R: Lanes: Base Vol: Initial Bse: User Adj: PHF Adj: PHF Volume: Reduced Vol: PCE Adj: MLF Adj: FinalVolume: OvlAdjVol: 0 13 Sat/Lane: Lanes: Final Sat.: Vol/Sat: OvlAdjV/S: Crit Moves: **** **** ****
164 2011+Construction AM Wed Apr 18, :13:33 Page 12-1 ICU 1(Loss as Cycle Length %) Method (Base Volume Alternative) Intersection #8 Anaheim S & 1 St/West 9th St Cycle (sec): 100 Critical Vol./Cap.(X): Loss Time (sec): 10 Average Delay (sec/veh): xxxxxx Optimal Cycle: 32 Level Of Service: A Control: Permitted Permitted Protected Protected Rights: Ignore Ignore Include Include Y+R: Lanes: Base Vol: Initial Bse: User Adj: PHF Adj: PHF Volume: Reduced Vol: PCE Adj: MLF Adj: FinalVolume: Sat/Lane: Lanes: Final Sat.: Vol/Sat: Crit Moves: **** **** **** ****
165 2011+Construction AM Wed Apr 18, :13:33 Page HCM Unsignalized Method (Base Volume Alternative) Intersection #9 Pier B St & Edison Ave Average Delay (sec/veh): 2.0 Worst Case Level Of Service: A[ 8.6] Control: Stop Sign Stop Sign Uncontrolled Uncontrolled Rights: Include Include Include Include Lanes: Base Vol: Initial Bse: User Adj: PHF Adj: PHF Volume: FinalVolume: Critical Gap Module: Critical Gp: 6.8 xxxx 6.9 xxxxx xxxx xxxxx xxxxx xxxx xxxxx 4.1 xxxx xxxxx FollowUpTim: 3.5 xxxx 3.3 xxxxx xxxx xxxxx xxxxx xxxx xxxxx 2.2 xxxx xxxxx Capacity Module: Cnflict Vol: 132 xxxx 25 xxxx xxxx xxxxx xxxx xxxx xxxxx 49 xxxx xxxxx Potent Cap.: 855 xxxx 1053 xxxx xxxx xxxxx xxxx xxxx xxxxx 1571 xxxx xxxxx Move Cap.: 845 xxxx 1053 xxxx xxxx xxxxx xxxx xxxx xxxxx 1571 xxxx xxxxx Volume/Cap: 0.00 xxxx 0.02 xxxx xxxx xxxx xxxx xxxx xxxx 0.01 xxxx xxxx Level Of Service Module: 2Way95thQ: 0.0 xxxx 0.1 xxxx xxxx xxxxx xxxx xxxx xxxxx 0.0 xxxx xxxxx Control Del: 9.3 xxxx 8.5 xxxxx xxxx xxxxx xxxxx xxxx xxxxx 7.3 xxxx xxxxx LOS by Move: A * A * * * * * * A * * Movement: LT - LTR - RT LT - LTR - RT LT - LTR - RT LT - LTR - RT Shared Cap.: xxxx xxxx xxxxx xxxx xxxx xxxxx xxxx xxxx xxxxx xxxx xxxx xxxxx SharedQueue:xxxxx xxxx xxxxx xxxxx xxxx xxxxx xxxxx xxxx xxxxx 0.0 xxxx xxxxx Shrd ConDel:xxxxx xxxx xxxxx xxxxx xxxx xxxxx xxxxx xxxx xxxxx 7.3 xxxx xxxxx Shared LOS: * * * * * * * * * A * * ApproachDel: 8.6 xxxxxx xxxxxx xxxxxx ApproachLOS: A * * * Note: Queue reported is the number of cars per lane.
166 2011+Construction AM Wed Apr 18, :13:33 Page HCM 4-Way Stop Method (Base Volume Alternative) Intersection #10 Anaheim Way & Pier B St Cycle (sec): 100 Critical Vol./Cap.(X): Loss Time (sec): 0 Average Delay (sec/veh): 7.6 Optimal Cycle: 0 Level Of Service: A Control: Stop Sign Stop Sign Stop Sign Stop Sign Rights: Include Include Include Include Lanes: Base Vol: Initial Bse: User Adj: PHF Adj: PHF Volume: Reduced Vol: PCE Adj: MLF Adj: FinalVolume: Lanes: Final Sat.: Vol/Sat: xxxx xxxx xxxx 0.04 xxxx xxxx xxxx Crit Moves: **** **** **** Delay/Veh: Delay Adj: AdjDel/Veh: LOS by Move: * * * A * A A A * * A A ApproachDel: xxxxxx Delay Adj: xxxxx ApprAdjDel: xxxxxx LOS by Appr: * A A A AllWayAvgQ: Note: Queue reported is the number of cars per lane.
167 2011+Construction MIDDAY Wed Apr 18, :13:10 Page 3-1 ICU 1(Loss as Cycle Length %) Method (Base Volume Alternative) Intersection #1 Pier B St & Pico Ave Cycle (sec): 100 Critical Vol./Cap.(X): Loss Time (sec): 10 Average Delay (sec/veh): xxxxxx Optimal Cycle: 26 Level Of Service: A Street Name: Pier B St Pico Ave Control: Split Phase Split Phase Protected Protected Rights: Ignore Include Include Ignore Y+R: Lanes: Base Vol: Initial Bse: User Adj: PHF Adj: PHF Volume: Reduced Vol: PCE Adj: MLF Adj: FinalVolume: Sat/Lane: Lanes: Final Sat.: Vol/Sat: Crit Moves: **** **** **** ****
168 2011+Construction MIDDAY Wed Apr 18, :13:10 Page 4-1 ICU 1(Loss as Cycle Length %) Method (Base Volume Alternative) Intersection #2 Pico Ave & Pier C St Cycle (sec): 100 Critical Vol./Cap.(X): Loss Time (sec): 10 Average Delay (sec/veh): xxxxxx Optimal Cycle: 22 Level Of Service: A Control: Protected Protected Protected Protected Rights: Include Ignore Ovl Include Y+R: Lanes: Base Vol: Initial Bse: User Adj: PHF Adj: PHF Volume: Reduced Vol: PCE Adj: MLF Adj: FinalVolume: OvlAdjVol: 17 Sat/Lane: Lanes: Final Sat.: Vol/Sat: OvlAdjV/S: 0.01 Crit Moves: **** **** ****
169 2011+Construction MIDDAY Wed Apr 18, :13:10 Page HCM 4-Way Stop Method (Base Volume Alternative) Intersection #3 Pico Ave & Pier D St/Water St Cycle (sec): 100 Critical Vol./Cap.(X): Loss Time (sec): 0 Average Delay (sec/veh): 8.3 Optimal Cycle: 0 Level Of Service: A Control: Stop Sign Stop Sign Stop Sign Stop Sign Rights: Include Include Include Include Lanes: Base Vol: Initial Bse: User Adj: PHF Adj: PHF Volume: Reduced Vol: PCE Adj: MLF Adj: FinalVolume: Lanes: Final Sat.: Vol/Sat: xxxx Crit Moves: **** **** **** **** Delay/Veh: Delay Adj: AdjDel/Veh: LOS by Move: A A * A A A A A A A A A ApproachDel: Delay Adj: ApprAdjDel: LOS by Appr: A A A A AllWayAvgQ: Note: Queue reported is the number of cars per lane.
170 2011+Construction MIDDAY Wed Apr 18, :13:10 Page HCM 4-Way Stop Method (Base Volume Alternative) Intersection #4 Pico Ave & Pier E St/EB Ocean Ave Cycle (sec): 100 Critical Vol./Cap.(X): Loss Time (sec): 0 Average Delay (sec/veh): 8.8 Optimal Cycle: 0 Level Of Service: A Control: Stop Sign Stop Sign Stop Sign Stop Sign Rights: Include Include Include Include Lanes: Base Vol: Initial Bse: User Adj: PHF Adj: PHF Volume: Reduced Vol: PCE Adj: MLF Adj: FinalVolume: Lanes: Final Sat.: Vol/Sat: Crit Moves: **** **** **** **** Delay/Veh: Delay Adj: AdjDel/Veh: LOS by Move: A A A A A A A A A A A A ApproachDel: Delay Adj: ApprAdjDel: LOS by Appr: A A A A AllWayAvgQ: Note: Queue reported is the number of cars per lane.
171 Level of Service Workheet (Circular 212 Method) I/S #: North-South Street: Seaside Year of Count: 2011 Ambient Growth: (%): Conducted by: LR Date: 5 East-West Street: Navy Projection Year: 2011 Peak Hour: Reviewed by: Project: No. of Phases Opposed Ø'ing: N/S-1, E/W-2 or Both-3? Right Turns: FREE-1, NRTOR-2 or OLA-3? NB-- 1 SB-- NB-- 1 SB-- 0 NB-- 0 SB-- 0 NB-- 0 SB-- 0 NB-- 0 SB-- 0 EB-- 3 WB-- EB-- 3 WB-- 0 EB-- 0 WB-- 0 EB-- 0 WB-- 0 EB-- 0 WB-- 0 ATSAC-1 or ATSAC+ATCS-2? Override Capacity NORTHBOUND MOVEMENT No. of Volume Lanes Lane Volume Left Left-Through Through 0 Through-Right Right Left-Through-Right Left-Right EXISTING CONDITION EXISTING PLUS PROJECT FUTURE CONDITION W/O PROJECT FUTURE CONDITION W/ PROJECT FUTURE W/ PROJECT W/ MITIGATION Project Traffic Total Volume Lane Volume Added Volume Total Volume No. of Lanes Lane Volume Added Volume Total Volume No. of Lanes Lane Volume Added Volume Total Volume No. of Lanes Lane Volume SOUTHBOUND Left Left-Through Through Through-Right Right Left-Through-Right Left-Right EASTBOUND WESTBOUND Left 0 Left-Through Through Through-Right Right Left-Through-Right Left-Right Left Left-Through Through Through-Right Right Left-Through-Right Left-Right 0 CRITICAL VOLUMES North-South: East-West: VOLUME/CAPACITY (V/C) RATIO: V/C LESS ATSAC/ATCS ADJUSTMENT: SUM: LEVEL OF SERVICE (LOS): A 4/19/2012-5:59 PM 1 Intersection 6 CMA.xls
172 2011+Construction MIDDAY Wed Apr 18, :13:10 Page 11-1 ICU 1(Loss as Cycle Length %) Method (Base Volume Alternative) Intersection #7 Anaheim St & Farragut Av Cycle (sec): 100 Critical Vol./Cap.(X): Loss Time (sec): 10 Average Delay (sec/veh): xxxxxx Optimal Cycle: 28 Level Of Service: A Control: Protected Protected Protected Protected Rights: Include Ovl Include Ovl Y+R: Lanes: Base Vol: Initial Bse: User Adj: PHF Adj: PHF Volume: Reduced Vol: PCE Adj: MLF Adj: FinalVolume: OvlAdjVol: 19 0 Sat/Lane: Lanes: Final Sat.: Vol/Sat: OvlAdjV/S: Crit Moves: **** **** ****
173 2011+Construction MIDDAY Wed Apr 18, :13:10 Page 12-1 ICU 1(Loss as Cycle Length %) Method (Base Volume Alternative) Intersection #8 Anaheim S & 1 St/West 9th St Cycle (sec): 100 Critical Vol./Cap.(X): Loss Time (sec): 10 Average Delay (sec/veh): xxxxxx Optimal Cycle: 29 Level Of Service: A Control: Permitted Permitted Protected Protected Rights: Ignore Ignore Include Include Y+R: Lanes: Base Vol: Initial Bse: User Adj: PHF Adj: PHF Volume: Reduced Vol: PCE Adj: MLF Adj: FinalVolume: Sat/Lane: Lanes: Final Sat.: Vol/Sat: Crit Moves: **** **** **** ****
174 2011+Construction MIDDAY Wed Apr 18, :13:10 Page HCM Unsignalized Method (Base Volume Alternative) Intersection #9 Pier B St & Edison Ave Average Delay (sec/veh): 1.8 Worst Case Level Of Service: A[ 8.7] Control: Stop Sign Stop Sign Uncontrolled Uncontrolled Rights: Include Include Include Include Lanes: Base Vol: Initial Bse: User Adj: PHF Adj: PHF Volume: FinalVolume: Critical Gap Module: Critical Gp: 6.8 xxxx 6.9 xxxxx xxxx xxxxx xxxxx xxxx xxxxx 4.1 xxxx xxxxx FollowUpTim: 3.5 xxxx 3.3 xxxxx xxxx xxxxx xxxxx xxxx xxxxx 2.2 xxxx xxxxx Capacity Module: Cnflict Vol: 158 xxxx 45 xxxx xxxx xxxxx xxxx xxxx xxxxx 89 xxxx xxxxx Potent Cap.: 823 xxxx 1022 xxxx xxxx xxxxx xxxx xxxx xxxxx 1519 xxxx xxxxx Move Cap.: 817 xxxx 1022 xxxx xxxx xxxxx xxxx xxxx xxxxx 1519 xxxx xxxxx Volume/Cap: 0.00 xxxx 0.03 xxxx xxxx xxxx xxxx xxxx xxxx 0.01 xxxx xxxx Level Of Service Module: 2Way95thQ: 0.0 xxxx 0.1 xxxx xxxx xxxxx xxxx xxxx xxxxx 0.0 xxxx xxxxx Control Del: 9.4 xxxx 8.6 xxxxx xxxx xxxxx xxxxx xxxx xxxxx 7.4 xxxx xxxxx LOS by Move: A * A * * * * * * A * * Movement: LT - LTR - RT LT - LTR - RT LT - LTR - RT LT - LTR - RT Shared Cap.: xxxx xxxx xxxxx xxxx xxxx xxxxx xxxx xxxx xxxxx xxxx xxxx xxxxx SharedQueue:xxxxx xxxx xxxxx xxxxx xxxx xxxxx xxxxx xxxx xxxxx 0.0 xxxx xxxxx Shrd ConDel:xxxxx xxxx xxxxx xxxxx xxxx xxxxx xxxxx xxxx xxxxx 7.4 xxxx xxxxx Shared LOS: * * * * * * * * * A * * ApproachDel: 8.7 xxxxxx xxxxxx xxxxxx ApproachLOS: A * * * Note: Queue reported is the number of cars per lane.
175 2011+Construction MIDDAY Wed Apr 18, :13:10 Page HCM 4-Way Stop Method (Base Volume Alternative) Intersection #10 Anaheim Way & Pier B St Cycle (sec): 100 Critical Vol./Cap.(X): Loss Time (sec): 0 Average Delay (sec/veh): 8.4 Optimal Cycle: 0 Level Of Service: A Control: Stop Sign Stop Sign Stop Sign Stop Sign Rights: Include Include Include Include Lanes: Base Vol: Initial Bse: User Adj: PHF Adj: PHF Volume: Reduced Vol: PCE Adj: MLF Adj: FinalVolume: Lanes: Final Sat.: Vol/Sat: xxxx xxxx xxxx 0.10 xxxx xxxx xxxx Crit Moves: **** **** **** Delay/Veh: Delay Adj: AdjDel/Veh: LOS by Move: * * * A * A A A * * A A ApproachDel: xxxxxx Delay Adj: xxxxx ApprAdjDel: xxxxxx LOS by Appr: * A A A AllWayAvgQ: Note: Queue reported is the number of cars per lane.
176 2011+Construction PM Wed Apr 18, :13:26 Page 3-1 ICU 1(Loss as Cycle Length %) Method (Base Volume Alternative) Intersection #1 Pier B St & Pico Ave Cycle (sec): 100 Critical Vol./Cap.(X): Loss Time (sec): 10 Average Delay (sec/veh): xxxxxx Optimal Cycle: 26 Level Of Service: A Street Name: Pier B St Pico Ave Control: Split Phase Split Phase Protected Protected Rights: Ignore Include Include Ignore Y+R: Lanes: Base Vol: Initial Bse: User Adj: PHF Adj: PHF Volume: Reduced Vol: PCE Adj: MLF Adj: FinalVolume: Sat/Lane: Lanes: Final Sat.: Vol/Sat: Crit Moves: **** **** **** ****
177 2011+Construction PM Wed Apr 18, :13:26 Page 4-1 ICU 1(Loss as Cycle Length %) Method (Base Volume Alternative) Intersection #2 Pico Ave & Pier C St Cycle (sec): 100 Critical Vol./Cap.(X): Loss Time (sec): 10 Average Delay (sec/veh): xxxxxx Optimal Cycle: 23 Level Of Service: A Control: Protected Protected Protected Protected Rights: Include Ignore Ovl Include Y+R: Lanes: Base Vol: Initial Bse: User Adj: PHF Adj: PHF Volume: Reduced Vol: PCE Adj: MLF Adj: FinalVolume: OvlAdjVol: 42 Sat/Lane: Lanes: Final Sat.: Vol/Sat: OvlAdjV/S: 0.03 Crit Moves: **** **** ****
178 2011+Construction PM Wed Apr 18, :13:26 Page HCM 4-Way Stop Method (Base Volume Alternative) Intersection #3 Pico Ave & Pier D St/Water St Cycle (sec): 100 Critical Vol./Cap.(X): Loss Time (sec): 0 Average Delay (sec/veh): 8.6 Optimal Cycle: 0 Level Of Service: A Control: Stop Sign Stop Sign Stop Sign Stop Sign Rights: Include Include Include Include Lanes: Base Vol: Initial Bse: User Adj: PHF Adj: PHF Volume: Reduced Vol: PCE Adj: MLF Adj: FinalVolume: Lanes: Final Sat.: Vol/Sat: Crit Moves: **** **** **** **** Delay/Veh: Delay Adj: AdjDel/Veh: LOS by Move: A A A A A A A A A A A A ApproachDel: Delay Adj: ApprAdjDel: LOS by Appr: A A A A AllWayAvgQ: Note: Queue reported is the number of cars per lane.
179 2011+Construction PM Wed Apr 18, :13:26 Page HCM 4-Way Stop Method (Base Volume Alternative) Intersection #4 Pico Ave & Pier E St/EB Ocean Ave Cycle (sec): 100 Critical Vol./Cap.(X): Loss Time (sec): 0 Average Delay (sec/veh): 9.0 Optimal Cycle: 0 Level Of Service: A Control: Stop Sign Stop Sign Stop Sign Stop Sign Rights: Include Include Include Include Lanes: Base Vol: Initial Bse: User Adj: PHF Adj: PHF Volume: Reduced Vol: PCE Adj: MLF Adj: FinalVolume: Lanes: Final Sat.: Vol/Sat: Crit Moves: **** **** **** **** Delay/Veh: Delay Adj: AdjDel/Veh: LOS by Move: A A A A A A A A A A A A ApproachDel: Delay Adj: ApprAdjDel: LOS by Appr: A A A A AllWayAvgQ: Note: Queue reported is the number of cars per lane.
180 Level of Service Workheet (Circular 212 Method) I/S #: North-South Street: Seaside Year of Count: 2011 Ambient Growth: (%): Conducted by: LR Date: 5 East-West Street: Navy Projection Year: 2011 Peak Hour: Reviewed by: Project: No. of Phases Opposed Ø'ing: N/S-1, E/W-2 or Both-3? Right Turns: FREE-1, NRTOR-2 or OLA-3? NB-- 1 SB-- NB-- 1 SB-- 0 NB-- 0 SB-- 0 NB-- 0 SB-- 0 NB-- 0 SB-- 0 EB-- 3 WB-- EB-- 3 WB-- 0 EB-- 0 WB-- 0 EB-- 0 WB-- 0 EB-- 0 WB-- 0 ATSAC-1 or ATSAC+ATCS-2? Override Capacity NORTHBOUND MOVEMENT No. of Volume Lanes Lane Volume Left Left-Through Through 0 0 Through-Right Right Left-Through-Right Left-Right EXISTING CONDITION EXISTING PLUS PROJECT FUTURE CONDITION W/O PROJECT FUTURE CONDITION W/ PROJECT FUTURE W/ PROJECT W/ MITIGATION Project Traffic Total Volume Lane Volume Added Volume Total Volume No. of Lanes Lane Volume Added Volume Total Volume No. of Lanes Lane Volume Added Volume Total Volume No. of Lanes Lane Volume SOUTHBOUND Left Left-Through Through Through-Right Right Left-Through-Right Left-Right EASTBOUND WESTBOUND Left 0 Left-Through Through Through-Right Right Left-Through-Right Left-Right Left Left-Through Through Through-Right Right Left-Through-Right Left-Right 0 0 CRITICAL VOLUMES North-South: East-West: VOLUME/CAPACITY (V/C) RATIO: V/C LESS ATSAC/ATCS ADJUSTMENT: SUM: LEVEL OF SERVICE (LOS): B 4/19/2012-5:59 PM 1 Intersection 6 CMA.xls
181 2011+Construction PM Wed Apr 18, :13:26 Page 11-1 ICU 1(Loss as Cycle Length %) Method (Base Volume Alternative) Intersection #7 Anaheim St & Farragut Av Cycle (sec): 100 Critical Vol./Cap.(X): Loss Time (sec): 10 Average Delay (sec/veh): xxxxxx Optimal Cycle: 32 Level Of Service: A Control: Protected Protected Protected Protected Rights: Include Ovl Include Ovl Y+R: Lanes: Base Vol: Initial Bse: User Adj: PHF Adj: PHF Volume: Reduced Vol: PCE Adj: MLF Adj: FinalVolume: OvlAdjVol: 55 0 Sat/Lane: Lanes: Final Sat.: Vol/Sat: OvlAdjV/S: Crit Moves: **** **** ****
182 2011+Construction PM Wed Apr 18, :13:26 Page 12-1 ICU 1(Loss as Cycle Length %) Method (Base Volume Alternative) Intersection #8 Anaheim S & 1 St/West 9th St Cycle (sec): 100 Critical Vol./Cap.(X): Loss Time (sec): 10 Average Delay (sec/veh): xxxxxx Optimal Cycle: 31 Level Of Service: A Control: Permitted Permitted Protected Protected Rights: Ignore Ignore Include Include Y+R: Lanes: Base Vol: Initial Bse: User Adj: PHF Adj: PHF Volume: Reduced Vol: PCE Adj: MLF Adj: FinalVolume: Sat/Lane: Lanes: Final Sat.: Vol/Sat: Crit Moves: **** **** **** ****
183 2011+Construction PM Wed Apr 18, :13:26 Page HCM Unsignalized Method (Base Volume Alternative) Intersection #9 Pier B St & Edison Ave Average Delay (sec/veh): 1.0 Worst Case Level Of Service: A[ 9.0] Control: Stop Sign Stop Sign Uncontrolled Uncontrolled Rights: Include Include Include Include Lanes: Base Vol: Initial Bse: User Adj: PHF Adj: PHF Volume: FinalVolume: Critical Gap Module: Critical Gp: 6.8 xxxx 6.9 xxxxx xxxx xxxxx xxxxx xxxx xxxxx 4.1 xxxx xxxxx FollowUpTim: 3.5 xxxx 3.3 xxxxx xxxx xxxxx xxxxx xxxx xxxxx 2.2 xxxx xxxxx Capacity Module: Cnflict Vol: 254 xxxx 95 xxxx xxxx xxxxx xxxx xxxx xxxxx 189 xxxx xxxxx Potent Cap.: 718 xxxx 950 xxxx xxxx xxxxx xxxx xxxx xxxxx 1397 xxxx xxxxx Move Cap.: 717 xxxx 950 xxxx xxxx xxxxx xxxx xxxx xxxxx 1397 xxxx xxxxx Volume/Cap: 0.01 xxxx 0.03 xxxx xxxx xxxx xxxx xxxx xxxx 0.00 xxxx xxxx Level Of Service Module: 2Way95thQ: 0.0 xxxx 0.1 xxxx xxxx xxxxx xxxx xxxx xxxxx 0.0 xxxx xxxxx Control Del: 10.1 xxxx 8.9 xxxxx xxxx xxxxx xxxxx xxxx xxxxx 7.6 xxxx xxxxx LOS by Move: B * A * * * * * * A * * Movement: LT - LTR - RT LT - LTR - RT LT - LTR - RT LT - LTR - RT Shared Cap.: xxxx xxxx xxxxx xxxx xxxx xxxxx xxxx xxxx xxxxx xxxx xxxx xxxxx SharedQueue:xxxxx xxxx xxxxx xxxxx xxxx xxxxx xxxxx xxxx xxxxx 0.0 xxxx xxxxx Shrd ConDel:xxxxx xxxx xxxxx xxxxx xxxx xxxxx xxxxx xxxx xxxxx 7.6 xxxx xxxxx Shared LOS: * * * * * * * * * A * * ApproachDel: 9.0 xxxxxx xxxxxx xxxxxx ApproachLOS: A * * * Note: Queue reported is the number of cars per lane.
184 2011+Construction PM Wed Apr 18, :13:26 Page HCM 4-Way Stop Method (Base Volume Alternative) Intersection #10 Anaheim Way & Pier B St Cycle (sec): 100 Critical Vol./Cap.(X): Loss Time (sec): 0 Average Delay (sec/veh): 7.7 Optimal Cycle: 0 Level Of Service: A Control: Stop Sign Stop Sign Stop Sign Stop Sign Rights: Include Include Include Include Lanes: Base Vol: Initial Bse: User Adj: PHF Adj: PHF Volume: Reduced Vol: PCE Adj: MLF Adj: FinalVolume: Lanes: Final Sat.: Vol/Sat: xxxx xxxx xxxx 0.03 xxxx xxxx xxxx Crit Moves: **** **** **** Delay/Veh: Delay Adj: AdjDel/Veh: LOS by Move: * * * A * A A A * * A A ApproachDel: xxxxxx Delay Adj: xxxxx ApprAdjDel: xxxxxx LOS by Appr: * A A A AllWayAvgQ: Note: Queue reported is the number of cars per lane.
185 EXISTING (2011) PLUS PROJECT CONSRUCTION ALTERNATIVE 2
186 2011+Construction Pier B AMWed Apr 18, :14:00 Page 3-1 ICU 1(Loss as Cycle Length %) Method (Base Volume Alternative) Intersection #1 Pier B St & Pico Ave Cycle (sec): 100 Critical Vol./Cap.(X): Loss Time (sec): 10 Average Delay (sec/veh): xxxxxx Optimal Cycle: 25 Level Of Service: A Street Name: Pier B St Pico Ave Control: Split Phase Split Phase Protected Protected Rights: Ignore Include Include Ignore Y+R: Lanes: Base Vol: Initial Bse: User Adj: PHF Adj: PHF Volume: Reduced Vol: PCE Adj: MLF Adj: FinalVolume: Sat/Lane: Lanes: Final Sat.: Vol/Sat: Crit Moves: **** **** **** ****
187 2011+Construction Pier B AMWed Apr 18, :14:00 Page 4-1 ICU 1(Loss as Cycle Length %) Method (Base Volume Alternative) Intersection #2 Pico Ave & Pier C St Cycle (sec): 100 Critical Vol./Cap.(X): Loss Time (sec): 10 Average Delay (sec/veh): xxxxxx Optimal Cycle: 22 Level Of Service: A Control: Protected Protected Protected Protected Rights: Include Ignore Ovl Include Y+R: Lanes: Base Vol: Initial Bse: User Adj: PHF Adj: PHF Volume: Reduced Vol: PCE Adj: MLF Adj: FinalVolume: OvlAdjVol: 0 Sat/Lane: Lanes: Final Sat.: Vol/Sat: OvlAdjV/S: 0.00 Crit Moves: **** **** ****
188 2011+Construction Pier B AMWed Apr 18, :14:00 Page HCM 4-Way Stop Method (Base Volume Alternative) Intersection #3 Pico Ave & Pier D St/Water St Cycle (sec): 100 Critical Vol./Cap.(X): Loss Time (sec): 0 Average Delay (sec/veh): 8.2 Optimal Cycle: 0 Level Of Service: A Control: Stop Sign Stop Sign Stop Sign Stop Sign Rights: Include Include Include Include Lanes: Base Vol: Initial Bse: User Adj: PHF Adj: PHF Volume: Reduced Vol: PCE Adj: MLF Adj: FinalVolume: Lanes: Final Sat.: Vol/Sat: xxxx Crit Moves: **** **** **** **** Delay/Veh: Delay Adj: AdjDel/Veh: LOS by Move: A A A * A A A A A A A A ApproachDel: Delay Adj: ApprAdjDel: LOS by Appr: A A A A AllWayAvgQ: Note: Queue reported is the number of cars per lane.
189 2011+Construction Pier B AMWed Apr 18, :14:00 Page HCM 4-Way Stop Method (Base Volume Alternative) Intersection #4 Pico Ave & Pier E St/EB Ocean Ave Cycle (sec): 100 Critical Vol./Cap.(X): Loss Time (sec): 0 Average Delay (sec/veh): 9.0 Optimal Cycle: 0 Level Of Service: A Control: Stop Sign Stop Sign Stop Sign Stop Sign Rights: Include Include Include Include Lanes: Base Vol: Initial Bse: User Adj: PHF Adj: PHF Volume: Reduced Vol: PCE Adj: MLF Adj: FinalVolume: Lanes: Final Sat.: Vol/Sat: Crit Moves: **** **** **** **** Delay/Veh: Delay Adj: AdjDel/Veh: LOS by Move: A A A A A A A A A B A A ApproachDel: Delay Adj: ApprAdjDel: LOS by Appr: A A A A AllWayAvgQ: Note: Queue reported is the number of cars per lane.
190 Level of Service Workheet (Circular 212 Method) I/S #: North-South Street: Seaside Year of Count: 2011 Ambient Growth: (%): Conducted by: LR Date: 5 East-West Street: Navy Projection Year: 2011 Peak Hour: Reviewed by: Project: No. of Phases Opposed Ø'ing: N/S-1, E/W-2 or Both-3? Right Turns: FREE-1, NRTOR-2 or OLA-3? NB-- 1 SB-- NB-- 1 SB-- 0 NB-- 0 SB-- 0 NB-- 0 SB-- 0 NB-- 0 SB-- 0 EB-- 3 WB-- EB-- 3 WB-- 0 EB-- 0 WB-- 0 EB-- 0 WB-- 0 EB-- 0 WB-- 0 ATSAC-1 or ATSAC+ATCS-2? Override Capacity NORTHBOUND MOVEMENT No. of Volume Lanes Lane Volume Left Left-Through Through 0 Through-Right Right Left-Through-Right Left-Right EXISTING CONDITION EXISTING PLUS PROJECT FUTURE CONDITION W/O PROJECT FUTURE CONDITION W/ PROJECT FUTURE W/ PROJECT W/ MITIGATION Project Traffic Total Volume Lane Volume Added Volume Total Volume No. of Lanes Lane Volume Added Volume Total Volume No. of Lanes Lane Volume Added Volume Total Volume No. of Lanes Lane Volume SOUTHBOUND Left Left-Through Through Through-Right Right Left-Through-Right Left-Right EASTBOUND WESTBOUND Left 0 Left-Through Through Through-Right Right Left-Through-Right Left-Right Left Left-Through Through Through-Right Right Left-Through-Right Left-Right 0 CRITICAL VOLUMES North-South: East-West: VOLUME/CAPACITY (V/C) RATIO: V/C LESS ATSAC/ATCS ADJUSTMENT: SUM: LEVEL OF SERVICE (LOS): A 4/19/2012-6:00 PM 1 Intersection 6 CMA.xls
191 2011+Construction Pier B AMWed Apr 18, :14:00 Page 11-1 ICU 1(Loss as Cycle Length %) Method (Base Volume Alternative) Intersection #7 Anaheim St & Farragut Av Cycle (sec): 100 Critical Vol./Cap.(X): Loss Time (sec): 10 Average Delay (sec/veh): xxxxxx Optimal Cycle: 30 Level Of Service: A Control: Protected Protected Protected Protected Rights: Include Ovl Include Ovl Y+R: Lanes: Base Vol: Initial Bse: User Adj: PHF Adj: PHF Volume: Reduced Vol: PCE Adj: MLF Adj: FinalVolume: OvlAdjVol: 0 13 Sat/Lane: Lanes: Final Sat.: Vol/Sat: OvlAdjV/S: Crit Moves: **** **** ****
192 2011+Construction Pier B AMWed Apr 18, :14:00 Page 12-1 ICU 1(Loss as Cycle Length %) Method (Base Volume Alternative) Intersection #8 Anaheim S & 1 St/West 9th St Cycle (sec): 100 Critical Vol./Cap.(X): Loss Time (sec): 10 Average Delay (sec/veh): xxxxxx Optimal Cycle: 32 Level Of Service: A Control: Permitted Permitted Protected Protected Rights: Ignore Ignore Include Include Y+R: Lanes: Base Vol: Initial Bse: User Adj: PHF Adj: PHF Volume: Reduced Vol: PCE Adj: MLF Adj: FinalVolume: Sat/Lane: Lanes: Final Sat.: Vol/Sat: Crit Moves: **** **** **** ****
193 2011+Construction Pier B AMWed Apr 18, :14:00 Page HCM Unsignalized Method (Base Volume Alternative) Intersection #9 Pier B St & Edison Ave Average Delay (sec/veh): 1.9 Worst Case Level Of Service: A[ 8.6] Control: Stop Sign Stop Sign Uncontrolled Uncontrolled Rights: Include Include Include Include Lanes: Base Vol: Initial Bse: User Adj: PHF Adj: PHF Volume: FinalVolume: Critical Gap Module: Critical Gp: 6.8 xxxx 6.9 xxxxx xxxx xxxxx xxxxx xxxx xxxxx 4.1 xxxx xxxxx FollowUpTim: 3.5 xxxx 3.3 xxxxx xxxx xxxxx xxxxx xxxx xxxxx 2.2 xxxx xxxxx Capacity Module: Cnflict Vol: 144 xxxx 30 xxxx xxxx xxxxx xxxx xxxx xxxxx 60 xxxx xxxxx Potent Cap.: 840 xxxx 1044 xxxx xxxx xxxxx xxxx xxxx xxxxx 1556 xxxx xxxxx Move Cap.: 831 xxxx 1044 xxxx xxxx xxxxx xxxx xxxx xxxxx 1556 xxxx xxxxx Volume/Cap: 0.00 xxxx 0.02 xxxx xxxx xxxx xxxx xxxx xxxx 0.01 xxxx xxxx Level Of Service Module: 2Way95thQ: 0.0 xxxx 0.1 xxxx xxxx xxxxx xxxx xxxx xxxxx 0.0 xxxx xxxxx Control Del: 9.3 xxxx 8.5 xxxxx xxxx xxxxx xxxxx xxxx xxxxx 7.3 xxxx xxxxx LOS by Move: A * A * * * * * * A * * Movement: LT - LTR - RT LT - LTR - RT LT - LTR - RT LT - LTR - RT Shared Cap.: xxxx xxxx xxxxx xxxx xxxx xxxxx xxxx xxxx xxxxx xxxx xxxx xxxxx SharedQueue:xxxxx xxxx xxxxx xxxxx xxxx xxxxx xxxxx xxxx xxxxx 0.0 xxxx xxxxx Shrd ConDel:xxxxx xxxx xxxxx xxxxx xxxx xxxxx xxxxx xxxx xxxxx 7.3 xxxx xxxxx Shared LOS: * * * * * * * * * A * * ApproachDel: 8.6 xxxxxx xxxxxx xxxxxx ApproachLOS: A * * * Note: Queue reported is the number of cars per lane.
194 2011+Construction Pier B AMWed Apr 18, :14:00 Page HCM 4-Way Stop Method (Base Volume Alternative) Intersection #10 Anaheim Way & Pier B St Cycle (sec): 100 Critical Vol./Cap.(X): Loss Time (sec): 0 Average Delay (sec/veh): 7.7 Optimal Cycle: 0 Level Of Service: A Control: Stop Sign Stop Sign Stop Sign Stop Sign Rights: Include Include Include Include Lanes: Base Vol: Initial Bse: User Adj: PHF Adj: PHF Volume: Reduced Vol: PCE Adj: MLF Adj: FinalVolume: Lanes: Final Sat.: Vol/Sat: xxxx xxxx xxxx 0.06 xxxx xxxx xxxx Crit Moves: **** **** **** Delay/Veh: Delay Adj: AdjDel/Veh: LOS by Move: * * * A * A A A * * A A ApproachDel: xxxxxx Delay Adj: xxxxx ApprAdjDel: xxxxxx LOS by Appr: * A A A AllWayAvgQ: Note: Queue reported is the number of cars per lane.
195 2011+Construction Pier B MIWed Apr 18, :14:13 Page 3-1 ICU 1(Loss as Cycle Length %) Method (Base Volume Alternative) Intersection #1 Pier B St & Pico Ave Cycle (sec): 100 Critical Vol./Cap.(X): Loss Time (sec): 10 Average Delay (sec/veh): xxxxxx Optimal Cycle: 27 Level Of Service: A Street Name: Pier B St Pico Ave Control: Split Phase Split Phase Protected Protected Rights: Ignore Include Include Ignore Y+R: Lanes: Base Vol: Initial Bse: User Adj: PHF Adj: PHF Volume: Reduced Vol: PCE Adj: MLF Adj: FinalVolume: Sat/Lane: Lanes: Final Sat.: Vol/Sat: Crit Moves: **** **** **** ****
196 2011+Construction Pier B MIWed Apr 18, :14:13 Page 4-1 ICU 1(Loss as Cycle Length %) Method (Base Volume Alternative) Intersection #2 Pico Ave & Pier C St Cycle (sec): 100 Critical Vol./Cap.(X): Loss Time (sec): 10 Average Delay (sec/veh): xxxxxx Optimal Cycle: 22 Level Of Service: A Control: Protected Protected Protected Protected Rights: Include Ignore Ovl Include Y+R: Lanes: Base Vol: Initial Bse: User Adj: PHF Adj: PHF Volume: Reduced Vol: PCE Adj: MLF Adj: FinalVolume: OvlAdjVol: 17 Sat/Lane: Lanes: Final Sat.: Vol/Sat: OvlAdjV/S: 0.01 Crit Moves: **** **** ****
197 2011+Construction Pier B MIWed Apr 18, :14:14 Page HCM 4-Way Stop Method (Base Volume Alternative) Intersection #3 Pico Ave & Pier D St/Water St Cycle (sec): 100 Critical Vol./Cap.(X): Loss Time (sec): 0 Average Delay (sec/veh): 8.2 Optimal Cycle: 0 Level Of Service: A Control: Stop Sign Stop Sign Stop Sign Stop Sign Rights: Include Include Include Include Lanes: Base Vol: Initial Bse: User Adj: PHF Adj: PHF Volume: Reduced Vol: PCE Adj: MLF Adj: FinalVolume: Lanes: Final Sat.: Vol/Sat: xxxx Crit Moves: **** **** **** **** Delay/Veh: Delay Adj: AdjDel/Veh: LOS by Move: A A * A A A A A A A A A ApproachDel: Delay Adj: ApprAdjDel: LOS by Appr: A A A A AllWayAvgQ: Note: Queue reported is the number of cars per lane.
198 2011+Construction Pier B MIWed Apr 18, :14:14 Page HCM 4-Way Stop Method (Base Volume Alternative) Intersection #4 Pico Ave & Pier E St/EB Ocean Ave Cycle (sec): 100 Critical Vol./Cap.(X): Loss Time (sec): 0 Average Delay (sec/veh): 8.8 Optimal Cycle: 0 Level Of Service: A Control: Stop Sign Stop Sign Stop Sign Stop Sign Rights: Include Include Include Include Lanes: Base Vol: Initial Bse: User Adj: PHF Adj: PHF Volume: Reduced Vol: PCE Adj: MLF Adj: FinalVolume: Lanes: Final Sat.: Vol/Sat: Crit Moves: **** **** **** **** Delay/Veh: Delay Adj: AdjDel/Veh: LOS by Move: A A A A A A A A A A A A ApproachDel: Delay Adj: ApprAdjDel: LOS by Appr: A A A A AllWayAvgQ: Note: Queue reported is the number of cars per lane.
199 Level of Service Workheet (Circular 212 Method) I/S #: North-South Street: Seaside Year of Count: 2011 Ambient Growth: (%): Conducted by: LR Date: 5 East-West Street: Navy Projection Year: 2011 Peak Hour: Reviewed by: Project: No. of Phases Opposed Ø'ing: N/S-1, E/W-2 or Both-3? Right Turns: FREE-1, NRTOR-2 or OLA-3? NB-- 1 SB-- NB-- 1 SB-- 0 NB-- 0 SB-- 0 NB-- 0 SB-- 0 NB-- 0 SB-- 0 EB-- 3 WB-- EB-- 3 WB-- 0 EB-- 0 WB-- 0 EB-- 0 WB-- 0 EB-- 0 WB-- 0 ATSAC-1 or ATSAC+ATCS-2? Override Capacity NORTHBOUND MOVEMENT No. of Volume Lanes Lane Volume Left Left-Through Through 0 Through-Right Right Left-Through-Right Left-Right EXISTING CONDITION EXISTING PLUS PROJECT FUTURE CONDITION W/O PROJECT FUTURE CONDITION W/ PROJECT FUTURE W/ PROJECT W/ MITIGATION Project Traffic Total Volume Lane Volume Added Volume Total Volume No. of Lanes Lane Volume Added Volume Total Volume No. of Lanes Lane Volume Added Volume Total Volume No. of Lanes Lane Volume SOUTHBOUND Left Left-Through Through Through-Right Right Left-Through-Right Left-Right EASTBOUND WESTBOUND Left 0 Left-Through Through Through-Right Right Left-Through-Right Left-Right Left Left-Through Through Through-Right Right Left-Through-Right Left-Right 0 CRITICAL VOLUMES North-South: East-West: VOLUME/CAPACITY (V/C) RATIO: V/C LESS ATSAC/ATCS ADJUSTMENT: SUM: LEVEL OF SERVICE (LOS): A 4/19/2012-6:01 PM 1 Intersection 6 CMA.xls
200 2011+Construction Pier B MIWed Apr 18, :14:14 Page 11-1 ICU 1(Loss as Cycle Length %) Method (Base Volume Alternative) Intersection #7 Anaheim St & Farragut Av Cycle (sec): 100 Critical Vol./Cap.(X): Loss Time (sec): 10 Average Delay (sec/veh): xxxxxx Optimal Cycle: 28 Level Of Service: A Control: Protected Protected Protected Protected Rights: Include Ovl Include Ovl Y+R: Lanes: Base Vol: Initial Bse: User Adj: PHF Adj: PHF Volume: Reduced Vol: PCE Adj: MLF Adj: FinalVolume: OvlAdjVol: 19 0 Sat/Lane: Lanes: Final Sat.: Vol/Sat: OvlAdjV/S: Crit Moves: **** **** ****
201 2011+Construction Pier B MIWed Apr 18, :14:14 Page 12-1 ICU 1(Loss as Cycle Length %) Method (Base Volume Alternative) Intersection #8 Anaheim S & 1 St/West 9th St Cycle (sec): 100 Critical Vol./Cap.(X): Loss Time (sec): 10 Average Delay (sec/veh): xxxxxx Optimal Cycle: 29 Level Of Service: A Control: Permitted Permitted Protected Protected Rights: Ignore Ignore Include Include Y+R: Lanes: Base Vol: Initial Bse: User Adj: PHF Adj: PHF Volume: Reduced Vol: PCE Adj: MLF Adj: FinalVolume: Sat/Lane: Lanes: Final Sat.: Vol/Sat: Crit Moves: **** **** **** ****
202 2011+Construction Pier B MIWed Apr 18, :14:14 Page HCM Unsignalized Method (Base Volume Alternative) Intersection #9 Pier B St & Edison Ave Average Delay (sec/veh): 1.8 Worst Case Level Of Service: A[ 8.7] Control: Stop Sign Stop Sign Uncontrolled Uncontrolled Rights: Include Include Include Include Lanes: Base Vol: Initial Bse: User Adj: PHF Adj: PHF Volume: FinalVolume: Critical Gap Module: Critical Gp: 6.8 xxxx 6.9 xxxxx xxxx xxxxx xxxxx xxxx xxxxx 4.1 xxxx xxxxx FollowUpTim: 3.5 xxxx 3.3 xxxxx xxxx xxxxx xxxxx xxxx xxxxx 2.2 xxxx xxxxx Capacity Module: Cnflict Vol: 161 xxxx 46 xxxx xxxx xxxxx xxxx xxxx xxxxx 91 xxxx xxxxx Potent Cap.: 820 xxxx 1021 xxxx xxxx xxxxx xxxx xxxx xxxxx 1517 xxxx xxxxx Move Cap.: 814 xxxx 1021 xxxx xxxx xxxxx xxxx xxxx xxxxx 1517 xxxx xxxxx Volume/Cap: 0.00 xxxx 0.03 xxxx xxxx xxxx xxxx xxxx xxxx 0.01 xxxx xxxx Level Of Service Module: 2Way95thQ: 0.0 xxxx 0.1 xxxx xxxx xxxxx xxxx xxxx xxxxx 0.0 xxxx xxxxx Control Del: 9.4 xxxx 8.6 xxxxx xxxx xxxxx xxxxx xxxx xxxxx 7.4 xxxx xxxxx LOS by Move: A * A * * * * * * A * * Movement: LT - LTR - RT LT - LTR - RT LT - LTR - RT LT - LTR - RT Shared Cap.: xxxx xxxx xxxxx xxxx xxxx xxxxx xxxx xxxx xxxxx xxxx xxxx xxxxx SharedQueue:xxxxx xxxx xxxxx xxxxx xxxx xxxxx xxxxx xxxx xxxxx 0.0 xxxx xxxxx Shrd ConDel:xxxxx xxxx xxxxx xxxxx xxxx xxxxx xxxxx xxxx xxxxx 7.4 xxxx xxxxx Shared LOS: * * * * * * * * * A * * ApproachDel: 8.7 xxxxxx xxxxxx xxxxxx ApproachLOS: A * * * Note: Queue reported is the number of cars per lane.
203 2011+Construction Pier B MIWed Apr 18, :14:14 Page HCM 4-Way Stop Method (Base Volume Alternative) Intersection #10 Anaheim Way & Pier B St Cycle (sec): 100 Critical Vol./Cap.(X): Loss Time (sec): 0 Average Delay (sec/veh): 8.4 Optimal Cycle: 0 Level Of Service: A Control: Stop Sign Stop Sign Stop Sign Stop Sign Rights: Include Include Include Include Lanes: Base Vol: Initial Bse: User Adj: PHF Adj: PHF Volume: Reduced Vol: PCE Adj: MLF Adj: FinalVolume: Lanes: Final Sat.: Vol/Sat: xxxx xxxx xxxx 0.11 xxxx xxxx xxxx Crit Moves: **** **** **** Delay/Veh: Delay Adj: AdjDel/Veh: LOS by Move: * * * A * A A A * * A A ApproachDel: xxxxxx Delay Adj: xxxxx ApprAdjDel: xxxxxx LOS by Appr: * A A A AllWayAvgQ: Note: Queue reported is the number of cars per lane.
204 2011+Construction Pier B PMWed Apr 18, :14:07 Page 3-1 ICU 1(Loss as Cycle Length %) Method (Base Volume Alternative) Intersection #1 Pier B St & Pico Ave Cycle (sec): 100 Critical Vol./Cap.(X): Loss Time (sec): 10 Average Delay (sec/veh): xxxxxx Optimal Cycle: 28 Level Of Service: A Street Name: Pier B St Pico Ave Control: Split Phase Split Phase Protected Protected Rights: Ignore Include Include Ignore Y+R: Lanes: Base Vol: Initial Bse: User Adj: PHF Adj: PHF Volume: Reduced Vol: PCE Adj: MLF Adj: FinalVolume: Sat/Lane: Lanes: Final Sat.: Vol/Sat: Crit Moves: **** **** **** ****
205 2011+Construction Pier B PMWed Apr 18, :14:07 Page 4-1 ICU 1(Loss as Cycle Length %) Method (Base Volume Alternative) Intersection #2 Pico Ave & Pier C St Cycle (sec): 100 Critical Vol./Cap.(X): Loss Time (sec): 10 Average Delay (sec/veh): xxxxxx Optimal Cycle: 22 Level Of Service: A Control: Protected Protected Protected Protected Rights: Include Ignore Ovl Include Y+R: Lanes: Base Vol: Initial Bse: User Adj: PHF Adj: PHF Volume: Reduced Vol: PCE Adj: MLF Adj: FinalVolume: OvlAdjVol: 42 Sat/Lane: Lanes: Final Sat.: Vol/Sat: OvlAdjV/S: 0.03 Crit Moves: **** **** ****
206 2011+Construction Pier B PMWed Apr 18, :14:07 Page HCM 4-Way Stop Method (Base Volume Alternative) Intersection #3 Pico Ave & Pier D St/Water St Cycle (sec): 100 Critical Vol./Cap.(X): Loss Time (sec): 0 Average Delay (sec/veh): 8.4 Optimal Cycle: 0 Level Of Service: A Control: Stop Sign Stop Sign Stop Sign Stop Sign Rights: Include Include Include Include Lanes: Base Vol: Initial Bse: User Adj: PHF Adj: PHF Volume: Reduced Vol: PCE Adj: MLF Adj: FinalVolume: Lanes: Final Sat.: Vol/Sat: Crit Moves: **** **** **** **** Delay/Veh: Delay Adj: AdjDel/Veh: LOS by Move: A A A A A A A A A A A A ApproachDel: Delay Adj: ApprAdjDel: LOS by Appr: A A A A AllWayAvgQ: Note: Queue reported is the number of cars per lane.
207 2011+Construction Pier B PMWed Apr 18, :14:07 Page HCM 4-Way Stop Method (Base Volume Alternative) Intersection #4 Pico Ave & Pier E St/EB Ocean Ave Cycle (sec): 100 Critical Vol./Cap.(X): Loss Time (sec): 0 Average Delay (sec/veh): 9.0 Optimal Cycle: 0 Level Of Service: A Control: Stop Sign Stop Sign Stop Sign Stop Sign Rights: Include Include Include Include Lanes: Base Vol: Initial Bse: User Adj: PHF Adj: PHF Volume: Reduced Vol: PCE Adj: MLF Adj: FinalVolume: Lanes: Final Sat.: Vol/Sat: Crit Moves: **** **** **** **** Delay/Veh: Delay Adj: AdjDel/Veh: LOS by Move: A A A A A A A A A A A A ApproachDel: Delay Adj: ApprAdjDel: LOS by Appr: A A A A AllWayAvgQ: Note: Queue reported is the number of cars per lane.
208 Level of Service Workheet (Circular 212 Method) I/S #: North-South Street: Seaside Year of Count: 2011 Ambient Growth: (%): Conducted by: LR Date: 5 East-West Street: Navy Projection Year: 2011 Peak Hour: Reviewed by: Project: No. of Phases Opposed Ø'ing: N/S-1, E/W-2 or Both-3? Right Turns: FREE-1, NRTOR-2 or OLA-3? NB-- 1 SB-- NB-- 1 SB-- 0 NB-- 0 SB-- 0 NB-- 0 SB-- 0 NB-- 0 SB-- 0 EB-- 3 WB-- EB-- 3 WB-- 0 EB-- 0 WB-- 0 EB-- 0 WB-- 0 EB-- 0 WB-- 0 ATSAC-1 or ATSAC+ATCS-2? Override Capacity NORTHBOUND MOVEMENT No. of Volume Lanes Lane Volume Left Left-Through Through 0 Through-Right Right Left-Through-Right Left-Right EXISTING CONDITION EXISTING PLUS PROJECT FUTURE CONDITION W/O PROJECT FUTURE CONDITION W/ PROJECT FUTURE W/ PROJECT W/ MITIGATION Project Traffic Total Volume Lane Volume Added Volume Total Volume No. of Lanes Lane Volume Added Volume Total Volume No. of Lanes Lane Volume Added Volume Total Volume No. of Lanes Lane Volume SOUTHBOUND Left Left-Through Through Through-Right Right Left-Through-Right Left-Right EASTBOUND WESTBOUND Left 0 Left-Through Through Through-Right Right Left-Through-Right Left-Right Left Left-Through Through Through-Right Right Left-Through-Right Left-Right 0 CRITICAL VOLUMES North-South: East-West: VOLUME/CAPACITY (V/C) RATIO: V/C LESS ATSAC/ATCS ADJUSTMENT: SUM: LEVEL OF SERVICE (LOS): B 4/19/2012-6:00 PM 1 Intersection 6 CMA.xls
209 2011+Construction Pier B PMWed Apr 18, :14:07 Page 11-1 ICU 1(Loss as Cycle Length %) Method (Base Volume Alternative) Intersection #7 Anaheim St & Farragut Av Cycle (sec): 100 Critical Vol./Cap.(X): Loss Time (sec): 10 Average Delay (sec/veh): xxxxxx Optimal Cycle: 32 Level Of Service: A Control: Protected Protected Protected Protected Rights: Include Ovl Include Ovl Y+R: Lanes: Base Vol: Initial Bse: User Adj: PHF Adj: PHF Volume: Reduced Vol: PCE Adj: MLF Adj: FinalVolume: OvlAdjVol: 65 0 Sat/Lane: Lanes: Final Sat.: Vol/Sat: OvlAdjV/S: Crit Moves: **** **** ****
210 2011+Construction Pier B PMWed Apr 18, :14:07 Page 12-1 ICU 1(Loss as Cycle Length %) Method (Base Volume Alternative) Intersection #8 Anaheim S & 1 St/West 9th St Cycle (sec): 100 Critical Vol./Cap.(X): Loss Time (sec): 10 Average Delay (sec/veh): xxxxxx Optimal Cycle: 31 Level Of Service: A Control: Permitted Permitted Protected Protected Rights: Ignore Ignore Include Include Y+R: Lanes: Base Vol: Initial Bse: User Adj: PHF Adj: PHF Volume: Reduced Vol: PCE Adj: MLF Adj: FinalVolume: Sat/Lane: Lanes: Final Sat.: Vol/Sat: Crit Moves: **** **** **** ****
211 2011+Construction Pier B PMWed Apr 18, :14:07 Page HCM Unsignalized Method (Base Volume Alternative) Intersection #9 Pier B St & Edison Ave Average Delay (sec/veh): 0.9 Worst Case Level Of Service: A[ 9.1] Control: Stop Sign Stop Sign Uncontrolled Uncontrolled Rights: Include Include Include Include Lanes: Base Vol: Initial Bse: User Adj: PHF Adj: PHF Volume: FinalVolume: Critical Gap Module: Critical Gp: 6.8 xxxx 6.9 xxxxx xxxx xxxxx xxxxx xxxx xxxxx 4.1 xxxx xxxxx FollowUpTim: 3.5 xxxx 3.3 xxxxx xxxx xxxxx xxxxx xxxx xxxxx 2.2 xxxx xxxxx Capacity Module: Cnflict Vol: 262 xxxx 96 xxxx xxxx xxxxx xxxx xxxx xxxxx 191 xxxx xxxxx Potent Cap.: 711 xxxx 949 xxxx xxxx xxxxx xxxx xxxx xxxxx 1395 xxxx xxxxx Move Cap.: 709 xxxx 949 xxxx xxxx xxxxx xxxx xxxx xxxxx 1395 xxxx xxxxx Volume/Cap: 0.01 xxxx 0.03 xxxx xxxx xxxx xxxx xxxx xxxx 0.00 xxxx xxxx Level Of Service Module: 2Way95thQ: 0.0 xxxx 0.1 xxxx xxxx xxxxx xxxx xxxx xxxxx 0.0 xxxx xxxxx Control Del: 10.1 xxxx 8.9 xxxxx xxxx xxxxx xxxxx xxxx xxxxx 7.6 xxxx xxxxx LOS by Move: B * A * * * * * * A * * Movement: LT - LTR - RT LT - LTR - RT LT - LTR - RT LT - LTR - RT Shared Cap.: xxxx xxxx xxxxx xxxx xxxx xxxxx xxxx xxxx xxxxx xxxx xxxx xxxxx SharedQueue:xxxxx xxxx xxxxx xxxxx xxxx xxxxx xxxxx xxxx xxxxx 0.0 xxxx xxxxx Shrd ConDel:xxxxx xxxx xxxxx xxxxx xxxx xxxxx xxxxx xxxx xxxxx 7.6 xxxx xxxxx Shared LOS: * * * * * * * * * A * * ApproachDel: 9.1 xxxxxx xxxxxx xxxxxx ApproachLOS: A * * * Note: Queue reported is the number of cars per lane.
212 2011+Construction Pier B PMWed Apr 18, :14:07 Page HCM 4-Way Stop Method (Base Volume Alternative) Intersection #10 Anaheim Way & Pier B St Cycle (sec): 100 Critical Vol./Cap.(X): Loss Time (sec): 0 Average Delay (sec/veh): 7.7 Optimal Cycle: 0 Level Of Service: A Control: Stop Sign Stop Sign Stop Sign Stop Sign Rights: Include Include Include Include Lanes: Base Vol: Initial Bse: User Adj: PHF Adj: PHF Volume: Reduced Vol: PCE Adj: MLF Adj: FinalVolume: Lanes: Final Sat.: Vol/Sat: xxxx xxxx xxxx 0.03 xxxx xxxx xxxx Crit Moves: **** **** **** Delay/Veh: Delay Adj: AdjDel/Veh: LOS by Move: * * * A * A A A * * A A ApproachDel: xxxxxx Delay Adj: xxxxx ApprAdjDel: xxxxxx LOS by Appr: * A A A AllWayAvgQ: Note: Queue reported is the number of cars per lane.
213 FUTURE BASE (YEAR 2013) PLUS PROJECT CONSTRUCTION (ALTERNATIVES 1 AND 3)
214 2013+Construction AM Thu Jan 19, :43:23 Page 3-1 ICU 1(Loss as Cycle Length %) Method (Base Volume Alternative) Intersection #1 Pier B St & Pico Ave Cycle (sec): 100 Critical Vol./Cap.(X): Loss Time (sec): 10 (Y+R=4.0 sec) Average Delay (sec/veh): xxxxxx Optimal Cycle: 23 Level Of Service: A Street Name: Pier B St Pico Ave Control: Split Phase Split Phase Protected Protected Rights: Ignore Include Include Ignore Lanes: Base Vol: Initial Bse: User Adj: PHF Adj: PHF Volume: Reduced Vol: PCE Adj: MLF Adj: FinalVolume: Sat/Lane: Lanes: Final Sat.: Vol/Sat: Crit Moves: **** **** **** ****
215 2013+Construction AM Thu Jan 19, :43:23 Page 4-1 ICU 1(Loss as Cycle Length %) Method (Base Volume Alternative) Intersection #2 Pico Ave & Pier C St Cycle (sec): 100 Critical Vol./Cap.(X): Loss Time (sec): 10 (Y+R=4.0 sec) Average Delay (sec/veh): xxxxxx Optimal Cycle: 22 Level Of Service: A Control: Protected Protected Protected Protected Rights: Include Ignore Ovl Include Lanes: Base Vol: Initial Bse: User Adj: PHF Adj: PHF Volume: Reduced Vol: PCE Adj: MLF Adj: FinalVolume: OvlAdjVol: 0 Sat/Lane: Lanes: Final Sat.: Vol/Sat: OvlAdjV/S: 0.00 Crit Moves: **** **** ****
216 2013+Construction AM Thu Jan 19, :43:23 Page HCM 4-Way Stop Method (Base Volume Alternative) Intersection #3 Pico Ave & Pier D St/Water St Cycle (sec): 100 Critical Vol./Cap.(X): Loss Time (sec): 0 (Y+R=4.0 sec) Average Delay (sec/veh): 8.3 Optimal Cycle: 0 Level Of Service: A Control: Stop Sign Stop Sign Stop Sign Stop Sign Rights: Include Include Include Include Lanes: Base Vol: Initial Bse: User Adj: PHF Adj: PHF Volume: Reduced Vol: PCE Adj: MLF Adj: FinalVolume: Lanes: Final Sat.: Vol/Sat: xxxx Crit Moves: **** **** **** **** Delay/Veh: Delay Adj: AdjDel/Veh: LOS by Move: A A A * A A A A A A A A ApproachDel: Delay Adj: ApprAdjDel: LOS by Appr: A A A A AllWayAvgQ: Note: Queue reported is the number of cars per lane.
217 2013+Construction AM Thu Jan 19, :43:23 Page HCM 4-Way Stop Method (Base Volume Alternative) Intersection #4 Pico Ave & Pier E St/EB Ocean Ave Cycle (sec): 100 Critical Vol./Cap.(X): Loss Time (sec): 0 (Y+R=4.0 sec) Average Delay (sec/veh): 9.0 Optimal Cycle: 0 Level Of Service: A Control: Stop Sign Stop Sign Stop Sign Stop Sign Rights: Include Include Include Include Lanes: Base Vol: Initial Bse: User Adj: PHF Adj: PHF Volume: Reduced Vol: PCE Adj: MLF Adj: FinalVolume: Lanes: Final Sat.: Vol/Sat: Crit Moves: **** **** **** **** Delay/Veh: Delay Adj: AdjDel/Veh: LOS by Move: A A A A A A A A A B A A ApproachDel: Delay Adj: ApprAdjDel: LOS by Appr: A A A A AllWayAvgQ: Note: Queue reported is the number of cars per lane.
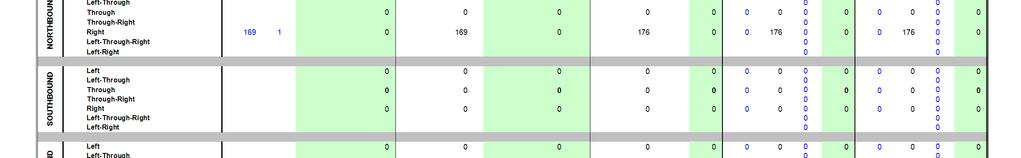
218
219 2013+Construction AM Thu Jan 19, :43:23 Page 11-1 ICU 1(Loss as Cycle Length %) Method (Base Volume Alternative) Intersection #7 Anaheim St & Farragut Av Cycle (sec): 100 Critical Vol./Cap.(X): Loss Time (sec): 10 (Y+R=4.0 sec) Average Delay (sec/veh): xxxxxx Optimal Cycle: 30 Level Of Service: A Control: Protected Protected Protected Protected Rights: Include Ovl Include Ovl Lanes: Base Vol: Initial Bse: User Adj: PHF Adj: PHF Volume: Reduced Vol: PCE Adj: MLF Adj: FinalVolume: OvlAdjVol: 0 14 Sat/Lane: Lanes: Final Sat.: Vol/Sat: OvlAdjV/S: Crit Moves: **** **** ****
220 2013+Construction AM Thu Jan 19, :43:23 Page 12-1 ICU 1(Loss as Cycle Length %) Method (Base Volume Alternative) Intersection #8 Anaheim S & 1 St/West 9th St Cycle (sec): 100 Critical Vol./Cap.(X): Loss Time (sec): 10 (Y+R=4.0 sec) Average Delay (sec/veh): xxxxxx Optimal Cycle: 32 Level Of Service: A Control: Permitted Permitted Protected Protected Rights: Ignore Ignore Include Include Lanes: Base Vol: Initial Bse: User Adj: PHF Adj: PHF Volume: Reduced Vol: PCE Adj: MLF Adj: FinalVolume: Sat/Lane: Lanes: Final Sat.: Vol/Sat: Crit Moves: **** **** **** ****
221 2013+Construction AM Thu Jan 19, :43:23 Page HCM Unsignalized Method (Base Volume Alternative) Intersection #9 Pier B St & Edison Ave Average Delay (sec/veh): 2.1 Worst Case Level Of Service: A[ 8.6] Control: Stop Sign Stop Sign Uncontrolled Uncontrolled Rights: Include Include Include Include Lanes: Base Vol: Initial Bse: User Adj: PHF Adj: PHF Volume: FinalVolume: Critical Gap Module: Critical Gp: 6.8 xxxx 6.9 xxxxx xxxx xxxxx xxxxx xxxx xxxxx 4.1 xxxx xxxxx FollowUpTim: 3.5 xxxx 3.3 xxxxx xxxx xxxxx xxxxx xxxx xxxxx 2.2 xxxx xxxxx Capacity Module: Cnflict Vol: 135 xxxx 25 xxxx xxxx xxxxx xxxx xxxx xxxxx 50 xxxx xxxxx Potent Cap.: 851 xxxx 1052 xxxx xxxx xxxxx xxxx xxxx xxxxx 1570 xxxx xxxxx Move Cap.: 840 xxxx 1052 xxxx xxxx xxxxx xxxx xxxx xxxxx 1570 xxxx xxxxx Volume/Cap: 0.00 xxxx 0.02 xxxx xxxx xxxx xxxx xxxx xxxx 0.02 xxxx xxxx Level Of Service Module: 2Way95thQ: 0.0 xxxx 0.1 xxxx xxxx xxxxx xxxx xxxx xxxxx 0.0 xxxx xxxxx Control Del: 9.3 xxxx 8.5 xxxxx xxxx xxxxx xxxxx xxxx xxxxx 7.3 xxxx xxxxx LOS by Move: A * A * * * * * * A * * Movement: LT - LTR - RT LT - LTR - RT LT - LTR - RT LT - LTR - RT Shared Cap.: xxxx xxxx xxxxx xxxx xxxx xxxxx xxxx xxxx xxxxx xxxx xxxx xxxxx SharedQueue:xxxxx xxxx xxxxx xxxxx xxxx xxxxx xxxxx xxxx xxxxx 0.0 xxxx xxxxx Shrd ConDel:xxxxx xxxx xxxxx xxxxx xxxx xxxxx xxxxx xxxx xxxxx 7.3 xxxx xxxxx Shared LOS: * * * * * * * * * A * * ApproachDel: 8.6 xxxxxx xxxxxx xxxxxx ApproachLOS: A * * * Note: Queue reported is the number of cars per lane.
222 2013+Construction AM Thu Jan 19, :43:23 Page HCM 4-Way Stop Method (Base Volume Alternative) Intersection #10 Anaheim Way & Pier B St Cycle (sec): 100 Critical Vol./Cap.(X): Loss Time (sec): 0 (Y+R=4.0 sec) Average Delay (sec/veh): 7.6 Optimal Cycle: 0 Level Of Service: A Control: Stop Sign Stop Sign Stop Sign Stop Sign Rights: Include Include Include Include Lanes: Base Vol: Initial Bse: User Adj: PHF Adj: PHF Volume: Reduced Vol: PCE Adj: MLF Adj: FinalVolume: Lanes: Final Sat.: Vol/Sat: xxxx xxxx xxxx 0.04 xxxx xxxx xxxx Crit Moves: **** **** **** Delay/Veh: Delay Adj: AdjDel/Veh: LOS by Move: * * * A * A A A * * A A ApproachDel: xxxxxx Delay Adj: xxxxx ApprAdjDel: xxxxxx LOS by Appr: * A A A AllWayAvgQ: Note: Queue reported is the number of cars per lane.
223 2013+Construction MIDDAY Thu Jan 19, :43:42 Page 3-1 ICU 1(Loss as Cycle Length %) Method (Base Volume Alternative) Intersection #1 Pier B St & Pico Ave Cycle (sec): 100 Critical Vol./Cap.(X): Loss Time (sec): 10 (Y+R=4.0 sec) Average Delay (sec/veh): xxxxxx Optimal Cycle: 26 Level Of Service: A Street Name: Pier B St Pico Ave Control: Split Phase Split Phase Protected Protected Rights: Ignore Include Include Ignore Lanes: Base Vol: Initial Bse: User Adj: PHF Adj: PHF Volume: Reduced Vol: PCE Adj: MLF Adj: FinalVolume: Sat/Lane: Lanes: Final Sat.: Vol/Sat: Crit Moves: **** **** **** ****
224 2013+Construction MIDDAY Thu Jan 19, :43:42 Page 4-1 ICU 1(Loss as Cycle Length %) Method (Base Volume Alternative) Intersection #2 Pico Ave & Pier C St Cycle (sec): 100 Critical Vol./Cap.(X): Loss Time (sec): 10 (Y+R=4.0 sec) Average Delay (sec/veh): xxxxxx Optimal Cycle: 22 Level Of Service: A Control: Protected Protected Protected Protected Rights: Include Ignore Ovl Include Lanes: Base Vol: Initial Bse: User Adj: PHF Adj: PHF Volume: Reduced Vol: PCE Adj: MLF Adj: FinalVolume: OvlAdjVol: 18 Sat/Lane: Lanes: Final Sat.: Vol/Sat: OvlAdjV/S: 0.01 Crit Moves: **** **** ****
225 2013+Construction MIDDAY Thu Jan 19, :43:42 Page HCM 4-Way Stop Method (Base Volume Alternative) Intersection #3 Pico Ave & Pier D St/Water St Cycle (sec): 100 Critical Vol./Cap.(X): Loss Time (sec): 0 (Y+R=4.0 sec) Average Delay (sec/veh): 8.3 Optimal Cycle: 0 Level Of Service: A Control: Stop Sign Stop Sign Stop Sign Stop Sign Rights: Include Include Include Include Lanes: Base Vol: Initial Bse: User Adj: PHF Adj: PHF Volume: Reduced Vol: PCE Adj: MLF Adj: FinalVolume: Lanes: Final Sat.: Vol/Sat: xxxx Crit Moves: **** **** **** **** Delay/Veh: Delay Adj: AdjDel/Veh: LOS by Move: A A * A A A A A A A A A ApproachDel: Delay Adj: ApprAdjDel: LOS by Appr: A A A A AllWayAvgQ: Note: Queue reported is the number of cars per lane.
226 2013+Construction MIDDAY Thu Jan 19, :43:42 Page HCM 4-Way Stop Method (Base Volume Alternative) Intersection #4 Pico Ave & Pier E St/EB Ocean Ave Cycle (sec): 100 Critical Vol./Cap.(X): Loss Time (sec): 0 (Y+R=4.0 sec) Average Delay (sec/veh): 8.8 Optimal Cycle: 0 Level Of Service: A Control: Stop Sign Stop Sign Stop Sign Stop Sign Rights: Include Include Include Include Lanes: Base Vol: Initial Bse: User Adj: PHF Adj: PHF Volume: Reduced Vol: PCE Adj: MLF Adj: FinalVolume: Lanes: Final Sat.: Vol/Sat: Crit Moves: **** **** **** **** Delay/Veh: Delay Adj: AdjDel/Veh: LOS by Move: A A A A A A A A A A A A ApproachDel: Delay Adj: ApprAdjDel: LOS by Appr: A A A A AllWayAvgQ: Note: Queue reported is the number of cars per lane.
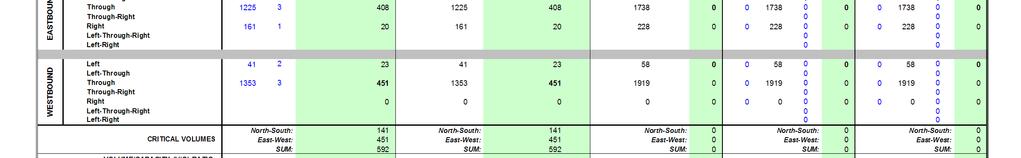
227
228 2013+Construction MIDDAY Thu Jan 19, :43:42 Page 11-1 ICU 1(Loss as Cycle Length %) Method (Base Volume Alternative) Intersection #7 Anaheim St & Farragut Av Cycle (sec): 100 Critical Vol./Cap.(X): Loss Time (sec): 10 (Y+R=4.0 sec) Average Delay (sec/veh): xxxxxx Optimal Cycle: 28 Level Of Service: A Control: Protected Protected Protected Protected Rights: Include Ovl Include Ovl Lanes: Base Vol: Initial Bse: User Adj: PHF Adj: PHF Volume: Reduced Vol: PCE Adj: MLF Adj: FinalVolume: OvlAdjVol: 19 0 Sat/Lane: Lanes: Final Sat.: Vol/Sat: OvlAdjV/S: Crit Moves: **** **** ****
229 2013+Construction MIDDAY Thu Jan 19, :43:42 Page 12-1 ICU 1(Loss as Cycle Length %) Method (Base Volume Alternative) Intersection #8 Anaheim S & 1 St/West 9th St Cycle (sec): 100 Critical Vol./Cap.(X): Loss Time (sec): 10 (Y+R=4.0 sec) Average Delay (sec/veh): xxxxxx Optimal Cycle: 30 Level Of Service: A Control: Permitted Permitted Protected Protected Rights: Ignore Ignore Include Include Lanes: Base Vol: Initial Bse: User Adj: PHF Adj: PHF Volume: Reduced Vol: PCE Adj: MLF Adj: FinalVolume: Sat/Lane: Lanes: Final Sat.: Vol/Sat: Crit Moves: **** **** **** ****
230 2013+Construction MIDDAY Thu Jan 19, :43:42 Page HCM Unsignalized Method (Base Volume Alternative) Intersection #9 Pier B St & Edison Ave Average Delay (sec/veh): 1.8 Worst Case Level Of Service: A[ 8.7] Control: Stop Sign Stop Sign Uncontrolled Uncontrolled Rights: Include Include Include Include Lanes: Base Vol: Initial Bse: User Adj: PHF Adj: PHF Volume: FinalVolume: Critical Gap Module: Critical Gp: 6.8 xxxx 6.9 xxxxx xxxx xxxxx xxxxx xxxx xxxxx 4.1 xxxx xxxxx FollowUpTim: 3.5 xxxx 3.3 xxxxx xxxx xxxxx xxxxx xxxx xxxxx 2.2 xxxx xxxxx Capacity Module: Cnflict Vol: 161 xxxx 46 xxxx xxxx xxxxx xxxx xxxx xxxxx 91 xxxx xxxxx Potent Cap.: 820 xxxx 1021 xxxx xxxx xxxxx xxxx xxxx xxxxx 1517 xxxx xxxxx Move Cap.: 814 xxxx 1021 xxxx xxxx xxxxx xxxx xxxx xxxxx 1517 xxxx xxxxx Volume/Cap: 0.00 xxxx 0.03 xxxx xxxx xxxx xxxx xxxx xxxx 0.01 xxxx xxxx Level Of Service Module: 2Way95thQ: 0.0 xxxx 0.1 xxxx xxxx xxxxx xxxx xxxx xxxxx 0.0 xxxx xxxxx Control Del: 9.4 xxxx 8.7 xxxxx xxxx xxxxx xxxxx xxxx xxxxx 7.4 xxxx xxxxx LOS by Move: A * A * * * * * * A * * Movement: LT - LTR - RT LT - LTR - RT LT - LTR - RT LT - LTR - RT Shared Cap.: xxxx xxxx xxxxx xxxx xxxx xxxxx xxxx xxxx xxxxx xxxx xxxx xxxxx SharedQueue:xxxxx xxxx xxxxx xxxxx xxxx xxxxx xxxxx xxxx xxxxx 0.0 xxxx xxxxx Shrd ConDel:xxxxx xxxx xxxxx xxxxx xxxx xxxxx xxxxx xxxx xxxxx 7.4 xxxx xxxxx Shared LOS: * * * * * * * * * A * * ApproachDel: 8.7 xxxxxx xxxxxx xxxxxx ApproachLOS: A * * * Note: Queue reported is the number of cars per lane.
231 2013+Construction MIDDAY Thu Jan 19, :43:42 Page HCM 4-Way Stop Method (Base Volume Alternative) Intersection #10 Anaheim Way & Pier B St Cycle (sec): 100 Critical Vol./Cap.(X): Loss Time (sec): 0 (Y+R=4.0 sec) Average Delay (sec/veh): 8.4 Optimal Cycle: 0 Level Of Service: A Control: Stop Sign Stop Sign Stop Sign Stop Sign Rights: Include Include Include Include Lanes: Base Vol: Initial Bse: User Adj: PHF Adj: PHF Volume: Reduced Vol: PCE Adj: MLF Adj: FinalVolume: Lanes: Final Sat.: Vol/Sat: xxxx xxxx xxxx 0.11 xxxx xxxx xxxx Crit Moves: **** **** **** Delay/Veh: Delay Adj: AdjDel/Veh: LOS by Move: * * * A * A A A * * A A ApproachDel: xxxxxx Delay Adj: xxxxx ApprAdjDel: xxxxxx LOS by Appr: * A A A AllWayAvgQ: Note: Queue reported is the number of cars per lane.
232 2013+Construction PM Thu Jan 19, :43:32 Page 3-1 ICU 1(Loss as Cycle Length %) Method (Base Volume Alternative) Intersection #1 Pier B St & Pico Ave Cycle (sec): 100 Critical Vol./Cap.(X): Loss Time (sec): 10 (Y+R=4.0 sec) Average Delay (sec/veh): xxxxxx Optimal Cycle: 27 Level Of Service: A Street Name: Pier B St Pico Ave Control: Split Phase Split Phase Protected Protected Rights: Ignore Include Include Ignore Lanes: Base Vol: Initial Bse: User Adj: PHF Adj: PHF Volume: Reduced Vol: PCE Adj: MLF Adj: FinalVolume: Sat/Lane: Lanes: Final Sat.: Vol/Sat: Crit Moves: **** **** **** ****
233 2013+Construction PM Thu Jan 19, :43:32 Page 4-1 ICU 1(Loss as Cycle Length %) Method (Base Volume Alternative) Intersection #2 Pico Ave & Pier C St Cycle (sec): 100 Critical Vol./Cap.(X): Loss Time (sec): 10 (Y+R=4.0 sec) Average Delay (sec/veh): xxxxxx Optimal Cycle: 23 Level Of Service: A Control: Protected Protected Protected Protected Rights: Include Ignore Ovl Include Lanes: Base Vol: Initial Bse: User Adj: PHF Adj: PHF Volume: Reduced Vol: PCE Adj: MLF Adj: FinalVolume: OvlAdjVol: 43 Sat/Lane: Lanes: Final Sat.: Vol/Sat: OvlAdjV/S: 0.03 Crit Moves: **** **** ****
234 2013+Construction PM Thu Jan 19, :43:32 Page HCM 4-Way Stop Method (Base Volume Alternative) Intersection #3 Pico Ave & Pier D St/Water St Cycle (sec): 100 Critical Vol./Cap.(X): Loss Time (sec): 0 (Y+R=4.0 sec) Average Delay (sec/veh): 8.6 Optimal Cycle: 0 Level Of Service: A Control: Stop Sign Stop Sign Stop Sign Stop Sign Rights: Include Include Include Include Lanes: Base Vol: Initial Bse: User Adj: PHF Adj: PHF Volume: Reduced Vol: PCE Adj: MLF Adj: FinalVolume: Lanes: Final Sat.: Vol/Sat: Crit Moves: **** **** **** **** Delay/Veh: Delay Adj: AdjDel/Veh: LOS by Move: A A A A A A A A A A A A ApproachDel: Delay Adj: ApprAdjDel: LOS by Appr: A A A A AllWayAvgQ: Note: Queue reported is the number of cars per lane.
235 2013+Construction PM Thu Jan 19, :43:32 Page HCM 4-Way Stop Method (Base Volume Alternative) Intersection #4 Pico Ave & Pier E St/EB Ocean Ave Cycle (sec): 100 Critical Vol./Cap.(X): Loss Time (sec): 0 (Y+R=4.0 sec) Average Delay (sec/veh): 9.1 Optimal Cycle: 0 Level Of Service: A Control: Stop Sign Stop Sign Stop Sign Stop Sign Rights: Include Include Include Include Lanes: Base Vol: Initial Bse: User Adj: PHF Adj: PHF Volume: Reduced Vol: PCE Adj: MLF Adj: FinalVolume: Lanes: Final Sat.: Vol/Sat: Crit Moves: **** **** **** **** Delay/Veh: Delay Adj: AdjDel/Veh: LOS by Move: A A A A A A A A A A A A ApproachDel: Delay Adj: ApprAdjDel: LOS by Appr: A A A A AllWayAvgQ: Note: Queue reported is the number of cars per lane.
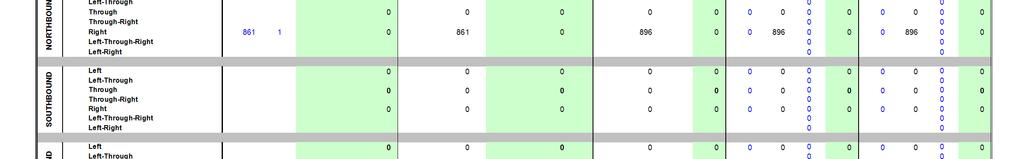
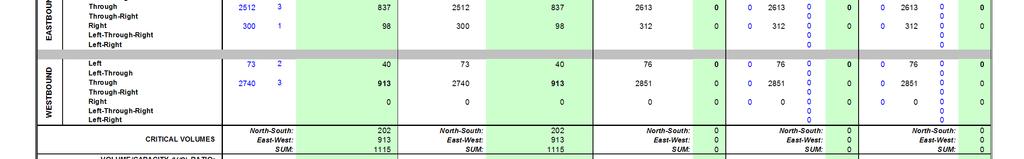
236
237 2013+Construction PM Thu Jan 19, :43:32 Page 11-1 ICU 1(Loss as Cycle Length %) Method (Base Volume Alternative) Intersection #7 Anaheim St & Farragut Av Cycle (sec): 100 Critical Vol./Cap.(X): Loss Time (sec): 10 (Y+R=4.0 sec) Average Delay (sec/veh): xxxxxx Optimal Cycle: 32 Level Of Service: A Control: Protected Protected Protected Protected Rights: Include Ovl Include Ovl Lanes: Base Vol: Initial Bse: User Adj: PHF Adj: PHF Volume: Reduced Vol: PCE Adj: MLF Adj: FinalVolume: OvlAdjVol: 56 0 Sat/Lane: Lanes: Final Sat.: Vol/Sat: OvlAdjV/S: Crit Moves: **** **** ****
238 2013+Construction PM Thu Jan 19, :43:32 Page 12-1 ICU 1(Loss as Cycle Length %) Method (Base Volume Alternative) Intersection #8 Anaheim S & 1 St/West 9th St Cycle (sec): 100 Critical Vol./Cap.(X): Loss Time (sec): 10 (Y+R=4.0 sec) Average Delay (sec/veh): xxxxxx Optimal Cycle: 32 Level Of Service: A Control: Permitted Permitted Protected Protected Rights: Ignore Ignore Include Include Lanes: Base Vol: Initial Bse: User Adj: PHF Adj: PHF Volume: Reduced Vol: PCE Adj: MLF Adj: FinalVolume: Sat/Lane: Lanes: Final Sat.: Vol/Sat: Crit Moves: **** **** **** ****
239 2013+Construction PM Thu Jan 19, :43:32 Page HCM Unsignalized Method (Base Volume Alternative) Intersection #9 Pier B St & Edison Ave Average Delay (sec/veh): 1.0 Worst Case Level Of Service: A[ 9.1] Control: Stop Sign Stop Sign Uncontrolled Uncontrolled Rights: Include Include Include Include Lanes: Base Vol: Initial Bse: User Adj: PHF Adj: PHF Volume: FinalVolume: Critical Gap Module: Critical Gp: 6.8 xxxx 6.9 xxxxx xxxx xxxxx xxxxx xxxx xxxxx 4.1 xxxx xxxxx FollowUpTim: 3.5 xxxx 3.3 xxxxx xxxx xxxxx xxxxx xxxx xxxxx 2.2 xxxx xxxxx Capacity Module: Cnflict Vol: 259 xxxx 97 xxxx xxxx xxxxx xxxx xxxx xxxxx 193 xxxx xxxxx Potent Cap.: 713 xxxx 947 xxxx xxxx xxxxx xxxx xxxx xxxxx 1392 xxxx xxxxx Move Cap.: 712 xxxx 947 xxxx xxxx xxxxx xxxx xxxx xxxxx 1392 xxxx xxxxx Volume/Cap: 0.01 xxxx 0.03 xxxx xxxx xxxx xxxx xxxx xxxx 0.00 xxxx xxxx Level Of Service Module: 2Way95thQ: 0.0 xxxx 0.1 xxxx xxxx xxxxx xxxx xxxx xxxxx 0.0 xxxx xxxxx Control Del: 10.1 xxxx 8.9 xxxxx xxxx xxxxx xxxxx xxxx xxxxx 7.6 xxxx xxxxx LOS by Move: B * A * * * * * * A * * Movement: LT - LTR - RT LT - LTR - RT LT - LTR - RT LT - LTR - RT Shared Cap.: xxxx xxxx xxxxx xxxx xxxx xxxxx xxxx xxxx xxxxx xxxx xxxx xxxxx SharedQueue:xxxxx xxxx xxxxx xxxxx xxxx xxxxx xxxxx xxxx xxxxx 0.0 xxxx xxxxx Shrd ConDel:xxxxx xxxx xxxxx xxxxx xxxx xxxxx xxxxx xxxx xxxxx 7.6 xxxx xxxxx Shared LOS: * * * * * * * * * A * * ApproachDel: 9.1 xxxxxx xxxxxx xxxxxx ApproachLOS: A * * * Note: Queue reported is the number of cars per lane.
240 2013+Construction PM Thu Jan 19, :43:32 Page HCM 4-Way Stop Method (Base Volume Alternative) Intersection #10 Anaheim Way & Pier B St Cycle (sec): 100 Critical Vol./Cap.(X): Loss Time (sec): 0 (Y+R=4.0 sec) Average Delay (sec/veh): 7.8 Optimal Cycle: 0 Level Of Service: A Control: Stop Sign Stop Sign Stop Sign Stop Sign Rights: Include Include Include Include Lanes: Base Vol: Initial Bse: User Adj: PHF Adj: PHF Volume: Reduced Vol: PCE Adj: MLF Adj: FinalVolume: Lanes: Final Sat.: Vol/Sat: xxxx xxxx xxxx 0.03 xxxx xxxx xxxx Crit Moves: **** **** **** Delay/Veh: Delay Adj: AdjDel/Veh: LOS by Move: * * * A * A A A * * A A ApproachDel: xxxxxx Delay Adj: xxxxx ApprAdjDel: xxxxxx LOS by Appr: * A A A AllWayAvgQ: Note: Queue reported is the number of cars per lane.
241 FUTURE BASE (YEAR 2013) PLUS PROJECT CONSTRUCTION (ALTERNATIVE 2)
242 2013+Construction Pier B AMWed Apr 18, :17:16 Page 3-1 ICU 1(Loss as Cycle Length %) Method (Base Volume Alternative) Intersection #1 Pier B St & Pico Ave Cycle (sec): 100 Critical Vol./Cap.(X): Loss Time (sec): 10 Average Delay (sec/veh): xxxxxx Optimal Cycle: 25 Level Of Service: A Street Name: Pier B St Pico Ave Control: Split Phase Split Phase Protected Protected Rights: Ignore Include Include Ignore Y+R: Lanes: Base Vol: Initial Bse: User Adj: PHF Adj: PHF Volume: Reduced Vol: PCE Adj: MLF Adj: FinalVolume: Sat/Lane: Lanes: Final Sat.: Vol/Sat: Crit Moves: **** **** **** ****
243 2013+Construction Pier B AMWed Apr 18, :17:16 Page 4-1 ICU 1(Loss as Cycle Length %) Method (Base Volume Alternative) Intersection #2 Pico Ave & Pier C St Cycle (sec): 100 Critical Vol./Cap.(X): Loss Time (sec): 10 Average Delay (sec/veh): xxxxxx Optimal Cycle: 22 Level Of Service: A Control: Protected Protected Protected Protected Rights: Include Ignore Ovl Include Y+R: Lanes: Base Vol: Initial Bse: User Adj: PHF Adj: PHF Volume: Reduced Vol: PCE Adj: MLF Adj: FinalVolume: OvlAdjVol: 0 Sat/Lane: Lanes: Final Sat.: Vol/Sat: OvlAdjV/S: 0.00 Crit Moves: **** **** ****
244 2013+Construction Pier B AMWed Apr 18, :17:16 Page HCM 4-Way Stop Method (Base Volume Alternative) Intersection #3 Pico Ave & Pier D St/Water St Cycle (sec): 100 Critical Vol./Cap.(X): Loss Time (sec): 0 Average Delay (sec/veh): 8.3 Optimal Cycle: 0 Level Of Service: A Control: Stop Sign Stop Sign Stop Sign Stop Sign Rights: Include Include Include Include Lanes: Base Vol: Initial Bse: User Adj: PHF Adj: PHF Volume: Reduced Vol: PCE Adj: MLF Adj: FinalVolume: Lanes: Final Sat.: Vol/Sat: xxxx Crit Moves: **** **** **** **** Delay/Veh: Delay Adj: AdjDel/Veh: LOS by Move: A A A * A A A A A A A A ApproachDel: Delay Adj: ApprAdjDel: LOS by Appr: A A A A AllWayAvgQ: Note: Queue reported is the number of cars per lane.
245 2013+Construction Pier B AMWed Apr 18, :17:16 Page HCM 4-Way Stop Method (Base Volume Alternative) Intersection #4 Pico Ave & Pier E St/EB Ocean Ave Cycle (sec): 100 Critical Vol./Cap.(X): Loss Time (sec): 0 Average Delay (sec/veh): 9.0 Optimal Cycle: 0 Level Of Service: A Control: Stop Sign Stop Sign Stop Sign Stop Sign Rights: Include Include Include Include Lanes: Base Vol: Initial Bse: User Adj: PHF Adj: PHF Volume: Reduced Vol: PCE Adj: MLF Adj: FinalVolume: Lanes: Final Sat.: Vol/Sat: Crit Moves: **** **** **** **** Delay/Veh: Delay Adj: AdjDel/Veh: LOS by Move: A A A A A A A A A B A A ApproachDel: Delay Adj: ApprAdjDel: LOS by Appr: A A A A AllWayAvgQ: Note: Queue reported is the number of cars per lane.
246 Level of Service Workheet (Circular 212 Method) I/S #: North-South Street: Seaside Year of Count: 2011 Ambient Growth: (%): Conducted by: LR Date: 5 East-West Street: Navy Projection Year: 2011 Peak Hour: Reviewed by: Project: No. of Phases Opposed Ø'ing: N/S-1, E/W-2 or Both-3? Right Turns: FREE-1, NRTOR-2 or OLA-3? NB-- 1 SB-- NB-- 1 SB-- 0 NB-- 0 SB-- 0 NB-- 0 SB-- 0 NB-- 0 SB-- 0 EB-- 3 WB-- EB-- 3 WB-- 0 EB-- 0 WB-- 0 EB-- 0 WB-- 0 EB-- 0 WB-- 0 ATSAC-1 or ATSAC+ATCS-2? Override Capacity NORTHBOUND MOVEMENT No. of Volume Lanes Lane Volume Left Left-Through Through 0 Through-Right Right Left-Through-Right Left-Right EXISTING CONDITION EXISTING PLUS PROJECT FUTURE CONDITION W/O PROJECT FUTURE CONDITION W/ PROJECT FUTURE W/ PROJECT W/ MITIGATION Project Traffic Total Volume Lane Volume Added Volume Total Volume No. of Lanes Lane Volume Added Volume Total Volume No. of Lanes Lane Volume Added Volume Total Volume No. of Lanes Lane Volume SOUTHBOUND Left Left-Through Through Through-Right Right Left-Through-Right Left-Right EASTBOUND WESTBOUND Left 0 Left-Through Through Through-Right Right Left-Through-Right Left-Right Left Left-Through Through Through-Right Right Left-Through-Right Left-Right 0 CRITICAL VOLUMES North-South: East-West: VOLUME/CAPACITY (V/C) RATIO: V/C LESS ATSAC/ATCS ADJUSTMENT: SUM: LEVEL OF SERVICE (LOS): A 4/19/2012-6:01 PM 1 Intersection 6 CMA.xls
247 2013+Construction Pier B AMWed Apr 18, :17:16 Page 11-1 ICU 1(Loss as Cycle Length %) Method (Base Volume Alternative) Intersection #7 Anaheim St & Farragut Av Cycle (sec): 100 Critical Vol./Cap.(X): Loss Time (sec): 10 Average Delay (sec/veh): xxxxxx Optimal Cycle: 31 Level Of Service: A Control: Protected Protected Protected Protected Rights: Include Ovl Include Ovl Y+R: Lanes: Base Vol: Initial Bse: User Adj: PHF Adj: PHF Volume: Reduced Vol: PCE Adj: MLF Adj: FinalVolume: OvlAdjVol: 0 14 Sat/Lane: Lanes: Final Sat.: Vol/Sat: OvlAdjV/S: Crit Moves: **** **** ****
248 2013+Construction Pier B AMWed Apr 18, :17:16 Page 12-1 ICU 1(Loss as Cycle Length %) Method (Base Volume Alternative) Intersection #8 Anaheim S & 1 St/West 9th St Cycle (sec): 100 Critical Vol./Cap.(X): Loss Time (sec): 10 Average Delay (sec/veh): xxxxxx Optimal Cycle: 32 Level Of Service: A Control: Permitted Permitted Protected Protected Rights: Ignore Ignore Include Include Y+R: Lanes: Base Vol: Initial Bse: User Adj: PHF Adj: PHF Volume: Reduced Vol: PCE Adj: MLF Adj: FinalVolume: Sat/Lane: Lanes: Final Sat.: Vol/Sat: Crit Moves: **** **** **** ****
249 2013+Construction Pier B AMWed Apr 18, :17:16 Page HCM Unsignalized Method (Base Volume Alternative) Intersection #9 Pier B St & Edison Ave Average Delay (sec/veh): 1.9 Worst Case Level Of Service: A[ 8.6] Control: Stop Sign Stop Sign Uncontrolled Uncontrolled Rights: Include Include Include Include Lanes: Base Vol: Initial Bse: User Adj: PHF Adj: PHF Volume: FinalVolume: Critical Gap Module: Critical Gp: 6.8 xxxx 6.9 xxxxx xxxx xxxxx xxxxx xxxx xxxxx 4.1 xxxx xxxxx FollowUpTim: 3.5 xxxx 3.3 xxxxx xxxx xxxxx xxxxx xxxx xxxxx 2.2 xxxx xxxxx Capacity Module: Cnflict Vol: 147 xxxx 31 xxxx xxxx xxxxx xxxx xxxx xxxxx 61 xxxx xxxxx Potent Cap.: 836 xxxx 1043 xxxx xxxx xxxxx xxxx xxxx xxxxx 1555 xxxx xxxxx Move Cap.: 826 xxxx 1043 xxxx xxxx xxxxx xxxx xxxx xxxxx 1555 xxxx xxxxx Volume/Cap: 0.00 xxxx 0.02 xxxx xxxx xxxx xxxx xxxx xxxx 0.02 xxxx xxxx Level Of Service Module: 2Way95thQ: 0.0 xxxx 0.1 xxxx xxxx xxxxx xxxx xxxx xxxxx 0.0 xxxx xxxxx Control Del: 9.4 xxxx 8.5 xxxxx xxxx xxxxx xxxxx xxxx xxxxx 7.4 xxxx xxxxx LOS by Move: A * A * * * * * * A * * Movement: LT - LTR - RT LT - LTR - RT LT - LTR - RT LT - LTR - RT Shared Cap.: xxxx xxxx xxxxx xxxx xxxx xxxxx xxxx xxxx xxxxx xxxx xxxx xxxxx SharedQueue:xxxxx xxxx xxxxx xxxxx xxxx xxxxx xxxxx xxxx xxxxx 0.0 xxxx xxxxx Shrd ConDel:xxxxx xxxx xxxxx xxxxx xxxx xxxxx xxxxx xxxx xxxxx 7.4 xxxx xxxxx Shared LOS: * * * * * * * * * A * * ApproachDel: 8.6 xxxxxx xxxxxx xxxxxx ApproachLOS: A * * * Note: Queue reported is the number of cars per lane.
250 2013+Construction Pier B AMWed Apr 18, :17:16 Page HCM 4-Way Stop Method (Base Volume Alternative) Intersection #10 Anaheim Way & Pier B St Cycle (sec): 100 Critical Vol./Cap.(X): Loss Time (sec): 0 Average Delay (sec/veh): 7.7 Optimal Cycle: 0 Level Of Service: A Control: Stop Sign Stop Sign Stop Sign Stop Sign Rights: Include Include Include Include Lanes: Base Vol: Initial Bse: User Adj: PHF Adj: PHF Volume: Reduced Vol: PCE Adj: MLF Adj: FinalVolume: Lanes: Final Sat.: Vol/Sat: xxxx xxxx xxxx 0.06 xxxx xxxx xxxx Crit Moves: **** **** **** Delay/Veh: Delay Adj: AdjDel/Veh: LOS by Move: * * * A * A A A * * A A ApproachDel: xxxxxx Delay Adj: xxxxx ApprAdjDel: xxxxxx LOS by Appr: * A A A AllWayAvgQ: Note: Queue reported is the number of cars per lane.
251 2013+Construction Pier B MIWed Apr 18, :17:34 Page 3-1 ICU 1(Loss as Cycle Length %) Method (Base Volume Alternative) Intersection #1 Pier B St & Pico Ave Cycle (sec): 100 Critical Vol./Cap.(X): Loss Time (sec): 10 Average Delay (sec/veh): xxxxxx Optimal Cycle: 27 Level Of Service: A Street Name: Pier B St Pico Ave Control: Split Phase Split Phase Protected Protected Rights: Ignore Include Include Ignore Y+R: Lanes: Base Vol: Initial Bse: User Adj: PHF Adj: PHF Volume: Reduced Vol: PCE Adj: MLF Adj: FinalVolume: Sat/Lane: Lanes: Final Sat.: Vol/Sat: Crit Moves: **** **** **** ****
252 2013+Construction Pier B MIWed Apr 18, :17:34 Page 4-1 ICU 1(Loss as Cycle Length %) Method (Base Volume Alternative) Intersection #2 Pico Ave & Pier C St Cycle (sec): 100 Critical Vol./Cap.(X): Loss Time (sec): 10 Average Delay (sec/veh): xxxxxx Optimal Cycle: 22 Level Of Service: A Control: Protected Protected Protected Protected Rights: Include Ignore Ovl Include Y+R: Lanes: Base Vol: Initial Bse: User Adj: PHF Adj: PHF Volume: Reduced Vol: PCE Adj: MLF Adj: FinalVolume: OvlAdjVol: 18 Sat/Lane: Lanes: Final Sat.: Vol/Sat: OvlAdjV/S: 0.01 Crit Moves: **** **** ****
253 2013+Construction Pier B MIWed Apr 18, :17:34 Page HCM 4-Way Stop Method (Base Volume Alternative) Intersection #3 Pico Ave & Pier D St/Water St Cycle (sec): 100 Critical Vol./Cap.(X): Loss Time (sec): 0 Average Delay (sec/veh): 8.2 Optimal Cycle: 0 Level Of Service: A Control: Stop Sign Stop Sign Stop Sign Stop Sign Rights: Include Include Include Include Lanes: Base Vol: Initial Bse: User Adj: PHF Adj: PHF Volume: Reduced Vol: PCE Adj: MLF Adj: FinalVolume: Lanes: Final Sat.: Vol/Sat: xxxx Crit Moves: **** **** **** **** Delay/Veh: Delay Adj: AdjDel/Veh: LOS by Move: A A * A A A A A A A A A ApproachDel: Delay Adj: ApprAdjDel: LOS by Appr: A A A A AllWayAvgQ: Note: Queue reported is the number of cars per lane.
254 2013+Construction Pier B MIWed Apr 18, :17:34 Page HCM 4-Way Stop Method (Base Volume Alternative) Intersection #4 Pico Ave & Pier E St/EB Ocean Ave Cycle (sec): 100 Critical Vol./Cap.(X): Loss Time (sec): 0 Average Delay (sec/veh): 8.8 Optimal Cycle: 0 Level Of Service: A Control: Stop Sign Stop Sign Stop Sign Stop Sign Rights: Include Include Include Include Lanes: Base Vol: Initial Bse: User Adj: PHF Adj: PHF Volume: Reduced Vol: PCE Adj: MLF Adj: FinalVolume: Lanes: Final Sat.: Vol/Sat: Crit Moves: **** **** **** **** Delay/Veh: Delay Adj: AdjDel/Veh: LOS by Move: A A A A A A A A A A A A ApproachDel: Delay Adj: ApprAdjDel: LOS by Appr: A A A A AllWayAvgQ: Note: Queue reported is the number of cars per lane.
255 Level of Service Workheet (Circular 212 Method) I/S #: North-South Street: Seaside Year of Count: 2011 Ambient Growth: (%): Conducted by: LR Date: 5 East-West Street: Navy Projection Year: 2011 Peak Hour: Reviewed by: Project: No. of Phases Opposed Ø'ing: N/S-1, E/W-2 or Both-3? Right Turns: FREE-1, NRTOR-2 or OLA-3? NB-- 1 SB-- NB-- 1 SB-- 0 NB-- 0 SB-- 0 NB-- 0 SB-- 0 NB-- 0 SB-- 0 EB-- 3 WB-- EB-- 3 WB-- 0 EB-- 0 WB-- 0 EB-- 0 WB-- 0 EB-- 0 WB-- 0 ATSAC-1 or ATSAC+ATCS-2? Override Capacity NORTHBOUND MOVEMENT No. of Volume Lanes Lane Volume Left Left-Through Through 0 Through-Right Right Left-Through-Right Left-Right EXISTING CONDITION EXISTING PLUS PROJECT FUTURE CONDITION W/O PROJECT FUTURE CONDITION W/ PROJECT FUTURE W/ PROJECT W/ MITIGATION Project Traffic Total Volume Lane Volume Added Volume Total Volume No. of Lanes Lane Volume Added Volume Total Volume No. of Lanes Lane Volume Added Volume Total Volume No. of Lanes Lane Volume SOUTHBOUND Left Left-Through Through Through-Right Right Left-Through-Right Left-Right EASTBOUND WESTBOUND Left 0 Left-Through Through Through-Right Right Left-Through-Right Left-Right Left Left-Through Through Through-Right Right Left-Through-Right Left-Right 0 CRITICAL VOLUMES North-South: East-West: VOLUME/CAPACITY (V/C) RATIO: V/C LESS ATSAC/ATCS ADJUSTMENT: SUM: LEVEL OF SERVICE (LOS): A 4/19/2012-6:02 PM 1 Intersection 6 CMA.xls
256 2013+Construction Pier B MIWed Apr 18, :17:34 Page 11-1 ICU 1(Loss as Cycle Length %) Method (Base Volume Alternative) Intersection #7 Anaheim St & Farragut Av Cycle (sec): 100 Critical Vol./Cap.(X): Loss Time (sec): 10 Average Delay (sec/veh): xxxxxx Optimal Cycle: 28 Level Of Service: A Control: Protected Protected Protected Protected Rights: Include Ovl Include Ovl Y+R: Lanes: Base Vol: Initial Bse: User Adj: PHF Adj: PHF Volume: Reduced Vol: PCE Adj: MLF Adj: FinalVolume: OvlAdjVol: 19 0 Sat/Lane: Lanes: Final Sat.: Vol/Sat: OvlAdjV/S: Crit Moves: **** **** ****
257 2013+Construction Pier B MIWed Apr 18, :17:34 Page 12-1 ICU 1(Loss as Cycle Length %) Method (Base Volume Alternative) Intersection #8 Anaheim S & 1 St/West 9th St Cycle (sec): 100 Critical Vol./Cap.(X): Loss Time (sec): 10 Average Delay (sec/veh): xxxxxx Optimal Cycle: 30 Level Of Service: A Control: Permitted Permitted Protected Protected Rights: Ignore Ignore Include Include Y+R: Lanes: Base Vol: Initial Bse: User Adj: PHF Adj: PHF Volume: Reduced Vol: PCE Adj: MLF Adj: FinalVolume: Sat/Lane: Lanes: Final Sat.: Vol/Sat: Crit Moves: **** **** **** ****
258 2013+Construction Pier B MIWed Apr 18, :17:34 Page HCM Unsignalized Method (Base Volume Alternative) Intersection #9 Pier B St & Edison Ave Average Delay (sec/veh): 1.8 Worst Case Level Of Service: A[ 8.7] Control: Stop Sign Stop Sign Uncontrolled Uncontrolled Rights: Include Include Include Include Lanes: Base Vol: Initial Bse: User Adj: PHF Adj: PHF Volume: FinalVolume: Critical Gap Module: Critical Gp: 6.8 xxxx 6.9 xxxxx xxxx xxxxx xxxxx xxxx xxxxx 4.1 xxxx xxxxx FollowUpTim: 3.5 xxxx 3.3 xxxxx xxxx xxxxx xxxxx xxxx xxxxx 2.2 xxxx xxxxx Capacity Module: Cnflict Vol: 163 xxxx 46 xxxx xxxx xxxxx xxxx xxxx xxxxx 92 xxxx xxxxx Potent Cap.: 817 xxxx 1020 xxxx xxxx xxxxx xxxx xxxx xxxxx 1515 xxxx xxxxx Move Cap.: 812 xxxx 1020 xxxx xxxx xxxxx xxxx xxxx xxxxx 1515 xxxx xxxxx Volume/Cap: 0.00 xxxx 0.03 xxxx xxxx xxxx xxxx xxxx xxxx 0.01 xxxx xxxx Level Of Service Module: 2Way95thQ: 0.0 xxxx 0.1 xxxx xxxx xxxxx xxxx xxxx xxxxx 0.0 xxxx xxxxx Control Del: 9.4 xxxx 8.7 xxxxx xxxx xxxxx xxxxx xxxx xxxxx 7.4 xxxx xxxxx LOS by Move: A * A * * * * * * A * * Movement: LT - LTR - RT LT - LTR - RT LT - LTR - RT LT - LTR - RT Shared Cap.: xxxx xxxx xxxxx xxxx xxxx xxxxx xxxx xxxx xxxxx xxxx xxxx xxxxx SharedQueue:xxxxx xxxx xxxxx xxxxx xxxx xxxxx xxxxx xxxx xxxxx 0.0 xxxx xxxxx Shrd ConDel:xxxxx xxxx xxxxx xxxxx xxxx xxxxx xxxxx xxxx xxxxx 7.4 xxxx xxxxx Shared LOS: * * * * * * * * * A * * ApproachDel: 8.7 xxxxxx xxxxxx xxxxxx ApproachLOS: A * * * Note: Queue reported is the number of cars per lane.
259 2013+Construction Pier B MIWed Apr 18, :17:34 Page HCM 4-Way Stop Method (Base Volume Alternative) Intersection #10 Anaheim Way & Pier B St Cycle (sec): 100 Critical Vol./Cap.(X): Loss Time (sec): 0 Average Delay (sec/veh): 8.4 Optimal Cycle: 0 Level Of Service: A Control: Stop Sign Stop Sign Stop Sign Stop Sign Rights: Include Include Include Include Lanes: Base Vol: Initial Bse: User Adj: PHF Adj: PHF Volume: Reduced Vol: PCE Adj: MLF Adj: FinalVolume: Lanes: Final Sat.: Vol/Sat: xxxx xxxx xxxx 0.11 xxxx xxxx xxxx Crit Moves: **** **** **** Delay/Veh: Delay Adj: AdjDel/Veh: LOS by Move: * * * A * A A A * * A A ApproachDel: xxxxxx Delay Adj: xxxxx ApprAdjDel: xxxxxx LOS by Appr: * A A A AllWayAvgQ: Note: Queue reported is the number of cars per lane.
260 2013+Construction Pier B PMWed Apr 18, :17:25 Page 3-1 ICU 1(Loss as Cycle Length %) Method (Base Volume Alternative) Intersection #1 Pier B St & Pico Ave Cycle (sec): 100 Critical Vol./Cap.(X): Loss Time (sec): 10 Average Delay (sec/veh): xxxxxx Optimal Cycle: 29 Level Of Service: A Street Name: Pier B St Pico Ave Control: Split Phase Split Phase Protected Protected Rights: Ignore Include Include Ignore Y+R: Lanes: Base Vol: Initial Bse: User Adj: PHF Adj: PHF Volume: Reduced Vol: PCE Adj: MLF Adj: FinalVolume: Sat/Lane: Lanes: Final Sat.: Vol/Sat: Crit Moves: **** **** **** ****
261 2013+Construction Pier B PMWed Apr 18, :17:25 Page 4-1 ICU 1(Loss as Cycle Length %) Method (Base Volume Alternative) Intersection #2 Pico Ave & Pier C St Cycle (sec): 100 Critical Vol./Cap.(X): Loss Time (sec): 10 Average Delay (sec/veh): xxxxxx Optimal Cycle: 22 Level Of Service: A Control: Protected Protected Protected Protected Rights: Include Ignore Ovl Include Y+R: Lanes: Base Vol: Initial Bse: User Adj: PHF Adj: PHF Volume: Reduced Vol: PCE Adj: MLF Adj: FinalVolume: OvlAdjVol: 43 Sat/Lane: Lanes: Final Sat.: Vol/Sat: OvlAdjV/S: 0.03 Crit Moves: **** **** ****
262 2013+Construction Pier B PMWed Apr 18, :17:25 Page HCM 4-Way Stop Method (Base Volume Alternative) Intersection #3 Pico Ave & Pier D St/Water St Cycle (sec): 100 Critical Vol./Cap.(X): Loss Time (sec): 0 Average Delay (sec/veh): 8.5 Optimal Cycle: 0 Level Of Service: A Control: Stop Sign Stop Sign Stop Sign Stop Sign Rights: Include Include Include Include Lanes: Base Vol: Initial Bse: User Adj: PHF Adj: PHF Volume: Reduced Vol: PCE Adj: MLF Adj: FinalVolume: Lanes: Final Sat.: Vol/Sat: Crit Moves: **** **** **** **** Delay/Veh: Delay Adj: AdjDel/Veh: LOS by Move: A A A A A A A A A A A A ApproachDel: Delay Adj: ApprAdjDel: LOS by Appr: A A A A AllWayAvgQ: Note: Queue reported is the number of cars per lane.
263 2013+Construction Pier B PMWed Apr 18, :17:25 Page HCM 4-Way Stop Method (Base Volume Alternative) Intersection #4 Pico Ave & Pier E St/EB Ocean Ave Cycle (sec): 100 Critical Vol./Cap.(X): Loss Time (sec): 0 Average Delay (sec/veh): 9.1 Optimal Cycle: 0 Level Of Service: A Control: Stop Sign Stop Sign Stop Sign Stop Sign Rights: Include Include Include Include Lanes: Base Vol: Initial Bse: User Adj: PHF Adj: PHF Volume: Reduced Vol: PCE Adj: MLF Adj: FinalVolume: Lanes: Final Sat.: Vol/Sat: Crit Moves: **** **** **** **** Delay/Veh: Delay Adj: AdjDel/Veh: LOS by Move: A A A A A A A A A A A A ApproachDel: Delay Adj: ApprAdjDel: LOS by Appr: A A A A AllWayAvgQ: Note: Queue reported is the number of cars per lane.
264 Level of Service Workheet (Circular 212 Method) I/S #: North-South Street: Seaside Year of Count: 2011 Ambient Growth: (%): Conducted by: LR Date: 5 East-West Street: Navy Projection Year: 2011 Peak Hour: Reviewed by: Project: No. of Phases Opposed Ø'ing: N/S-1, E/W-2 or Both-3? Right Turns: FREE-1, NRTOR-2 or OLA-3? NB-- 1 SB-- NB-- 1 SB-- 0 NB-- 0 SB-- 0 NB-- 0 SB-- 0 NB-- 0 SB-- 0 EB-- 3 WB-- EB-- 3 WB-- 0 EB-- 0 WB-- 0 EB-- 0 WB-- 0 EB-- 0 WB-- 0 ATSAC-1 or ATSAC+ATCS-2? Override Capacity NORTHBOUND MOVEMENT No. of Volume Lanes Lane Volume Left Left-Through Through 0 Through-Right Right Left-Through-Right Left-Right EXISTING CONDITION EXISTING PLUS PROJECT FUTURE CONDITION W/O PROJECT FUTURE CONDITION W/ PROJECT FUTURE W/ PROJECT W/ MITIGATION Project Traffic Total Volume Lane Volume Added Volume Total Volume No. of Lanes Lane Volume Added Volume Total Volume No. of Lanes Lane Volume Added Volume Total Volume No. of Lanes Lane Volume SOUTHBOUND Left Left-Through Through Through-Right Right Left-Through-Right Left-Right EASTBOUND WESTBOUND Left 0 Left-Through Through Through-Right Right Left-Through-Right Left-Right Left Left-Through Through Through-Right Right Left-Through-Right Left-Right 0 CRITICAL VOLUMES North-South: East-West: VOLUME/CAPACITY (V/C) RATIO: V/C LESS ATSAC/ATCS ADJUSTMENT: SUM: LEVEL OF SERVICE (LOS): C 4/19/2012-6:01 PM 1 Intersection 6 CMA.xls
265 2013+Construction Pier B PMWed Apr 18, :17:26 Page 11-1 ICU 1(Loss as Cycle Length %) Method (Base Volume Alternative) Intersection #7 Anaheim St & Farragut Av Cycle (sec): 100 Critical Vol./Cap.(X): Loss Time (sec): 10 Average Delay (sec/veh): xxxxxx Optimal Cycle: 32 Level Of Service: A Control: Protected Protected Protected Protected Rights: Include Ovl Include Ovl Y+R: Lanes: Base Vol: Initial Bse: User Adj: PHF Adj: PHF Volume: Reduced Vol: PCE Adj: MLF Adj: FinalVolume: OvlAdjVol: 65 0 Sat/Lane: Lanes: Final Sat.: Vol/Sat: OvlAdjV/S: Crit Moves: **** **** ****
266 2013+Construction Pier B PMWed Apr 18, :17:26 Page 12-1 ICU 1(Loss as Cycle Length %) Method (Base Volume Alternative) Intersection #8 Anaheim S & 1 St/West 9th St Cycle (sec): 100 Critical Vol./Cap.(X): Loss Time (sec): 10 Average Delay (sec/veh): xxxxxx Optimal Cycle: 32 Level Of Service: A Control: Permitted Permitted Protected Protected Rights: Ignore Ignore Include Include Y+R: Lanes: Base Vol: Initial Bse: User Adj: PHF Adj: PHF Volume: Reduced Vol: PCE Adj: MLF Adj: FinalVolume: Sat/Lane: Lanes: Final Sat.: Vol/Sat: Crit Moves: **** **** **** ****
267 2013+Construction Pier B PMWed Apr 18, :17:26 Page HCM Unsignalized Method (Base Volume Alternative) Intersection #9 Pier B St & Edison Ave Average Delay (sec/veh): 1.0 Worst Case Level Of Service: A[ 9.1] Control: Stop Sign Stop Sign Uncontrolled Uncontrolled Rights: Include Include Include Include Lanes: Base Vol: Initial Bse: User Adj: PHF Adj: PHF Volume: FinalVolume: Critical Gap Module: Critical Gp: 6.8 xxxx 6.9 xxxxx xxxx xxxxx xxxxx xxxx xxxxx 4.1 xxxx xxxxx FollowUpTim: 3.5 xxxx 3.3 xxxxx xxxx xxxxx xxxxx xxxx xxxxx 2.2 xxxx xxxxx Capacity Module: Cnflict Vol: 266 xxxx 97 xxxx xxxx xxxxx xxxx xxxx xxxxx 194 xxxx xxxxx Potent Cap.: 707 xxxx 947 xxxx xxxx xxxxx xxxx xxxx xxxxx 1391 xxxx xxxxx Move Cap.: 705 xxxx 947 xxxx xxxx xxxxx xxxx xxxx xxxxx 1391 xxxx xxxxx Volume/Cap: 0.01 xxxx 0.03 xxxx xxxx xxxx xxxx xxxx xxxx 0.00 xxxx xxxx Level Of Service Module: 2Way95thQ: 0.0 xxxx 0.1 xxxx xxxx xxxxx xxxx xxxx xxxxx 0.0 xxxx xxxxx Control Del: 10.1 xxxx 8.9 xxxxx xxxx xxxxx xxxxx xxxx xxxxx 7.6 xxxx xxxxx LOS by Move: B * A * * * * * * A * * Movement: LT - LTR - RT LT - LTR - RT LT - LTR - RT LT - LTR - RT Shared Cap.: xxxx xxxx xxxxx xxxx xxxx xxxxx xxxx xxxx xxxxx xxxx xxxx xxxxx SharedQueue:xxxxx xxxx xxxxx xxxxx xxxx xxxxx xxxxx xxxx xxxxx 0.0 xxxx xxxxx Shrd ConDel:xxxxx xxxx xxxxx xxxxx xxxx xxxxx xxxxx xxxx xxxxx 7.6 xxxx xxxxx Shared LOS: * * * * * * * * * A * * ApproachDel: 9.1 xxxxxx xxxxxx xxxxxx ApproachLOS: A * * * Note: Queue reported is the number of cars per lane.
268 2013+Construction Pier B PMWed Apr 18, :17:26 Page HCM 4-Way Stop Method (Base Volume Alternative) Intersection #10 Anaheim Way & Pier B St Cycle (sec): 100 Critical Vol./Cap.(X): Loss Time (sec): 0 Average Delay (sec/veh): 7.7 Optimal Cycle: 0 Level Of Service: A Control: Stop Sign Stop Sign Stop Sign Stop Sign Rights: Include Include Include Include Lanes: Base Vol: Initial Bse: User Adj: PHF Adj: PHF Volume: Reduced Vol: PCE Adj: MLF Adj: FinalVolume: Lanes: Final Sat.: Vol/Sat: xxxx xxxx xxxx 0.03 xxxx xxxx xxxx Crit Moves: **** **** **** Delay/Veh: Delay Adj: AdjDel/Veh: LOS by Move: * * * A * A A A * * A A ApproachDel: xxxxxx Delay Adj: xxxxx ApprAdjDel: xxxxxx LOS by Appr: * A A A AllWayAvgQ: Note: Queue reported is the number of cars per lane.
269 FUTURE BASE/ALTERNATIVE 4 (YEAR 2035)
270 FUTURE AM Thu Feb 2, :07:19 Page 3-1 ICU 1(Loss as Cycle Length %) Method (Base Volume Alternative) Intersection #1 Pier B St & Pico Ave Cycle (sec): 100 Critical Vol./Cap.(X): Loss Time (sec): 10 (Y+R=4.0 sec) Average Delay (sec/veh): xxxxxx Optimal Cycle: 51 Level Of Service: C Street Name: Pier B St Pico Ave Control: Split Phase Split Phase Protected Protected Rights: Ignore Include Include Include Lanes: Base Vol: Initial Bse: User Adj: PHF Adj: PHF Volume: Reduced Vol: PCE Adj: MLF Adj: FinalVolume: Sat/Lane: Lanes: Final Sat.: Vol/Sat: Crit Moves: **** **** ****
271 FUTURE AM Thu Feb 2, :07:19 Page 4-1 ICU 1(Loss as Cycle Length %) Method (Base Volume Alternative) Intersection #2 Pico Ave & Pier C St Cycle (sec): 100 Critical Vol./Cap.(X): Loss Time (sec): 10 (Y+R=4.0 sec) Average Delay (sec/veh): xxxxxx Optimal Cycle: 27 Level Of Service: A Control: Protected Protected Protected Protected Rights: Include Ignore Ovl Include Lanes: Base Vol: Initial Bse: User Adj: PHF Adj: PHF Volume: Reduced Vol: PCE Adj: MLF Adj: FinalVolume: Sat/Lane: Lanes: Final Sat.: Vol/Sat: Crit Moves: **** **** ****
272 FUTURE AM Thu Feb 2, :07:19 Page HCM Operations Method (Base Volume Alternative) Intersection #3 Pico Ave & Pier D St/Water St Cycle (sec): 100 Critical Vol./Cap.(X): Loss Time (sec): 0 (Y+R=4.0 sec) Average Delay (sec/veh): 16.3 Optimal Cycle: 21 Level Of Service: B Control: Permitted Permitted Permitted Permitted Rights: Include Include Include Include Lanes: Base Vol: Initial Bse: User Adj: PHF Adj: PHF Volume: Reduced Vol: PCE Adj: MLF Adj: FinalVolume: Sat/Lane: Adjustment: Lanes: Final Sat.: Vol/Sat: Crit Moves: **** **** Green/Cycle: Volume/Cap: Uniform Del: IncremntDel: InitQueuDel: Delay Adj: Delay/Veh: User DelAdj: AdjDel/Veh: LOS by Move: B B A A B B B A A A A A HCM2kAvgQ: Note: Queue reported is the number of cars per lane.
273 FUTURE AM Thu Feb 2, :07:19 Page HCM Operations Method (Base Volume Alternative) Intersection #4 Pico Ave & Pier E St/EB Ocean Ave Cycle (sec): 100 Critical Vol./Cap.(X): Loss Time (sec): 0 (Y+R=4.0 sec) Average Delay (sec/veh): 17.5 Optimal Cycle: 23 Level Of Service: B Control: Permitted Permitted Permitted Permitted Rights: Include Include Include Ignore Lanes: Base Vol: Initial Bse: User Adj: PHF Adj: PHF Volume: Reduced Vol: PCE Adj: MLF Adj: FinalVolume: Sat/Lane: Adjustment: Lanes: Final Sat.: Vol/Sat: Crit Moves: **** **** Green/Cycle: Volume/Cap: Uniform Del: IncremntDel: InitQueuDel: Delay Adj: Delay/Veh: User DelAdj: AdjDel/Veh: LOS by Move: C C C C C C A A A A A A HCM2kAvgQ: Note: Queue reported is the number of cars per lane.
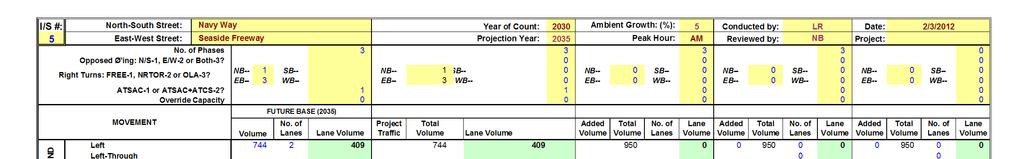
274
275 FUTURE AM Thu Feb 2, :07:19 Page 11-1 ICU 1(Loss as Cycle Length %) Method (Base Volume Alternative) Intersection #7 Anaheim St & Farragut Av Cycle (sec): 100 Critical Vol./Cap.(X): Loss Time (sec): 10 (Y+R=4.0 sec) Average Delay (sec/veh): xxxxxx Optimal Cycle: 42 Level Of Service: B Control: Protected Protected Protected Protected Rights: Include Ovl Include Ovl Lanes: Base Vol: Initial Bse: User Adj: PHF Adj: PHF Volume: Reduced Vol: PCE Adj: MLF Adj: FinalVolume: OvlAdjVol: 27 Sat/Lane: Lanes: Final Sat.: Vol/Sat: OvlAdjV/S: 0.02 Crit Moves: **** **** ****
276 FUTURE AM Thu Feb 2, :07:19 Page 12-1 ICU 1(Loss as Cycle Length %) Method (Base Volume Alternative) Intersection #8 Anaheim S & 1 St/West 9th St Cycle (sec): 100 Critical Vol./Cap.(X): Loss Time (sec): 10 (Y+R=4.0 sec) Average Delay (sec/veh): xxxxxx Optimal Cycle: 66 Level Of Service: C Control: Permitted Permitted Protected Protected Rights: Ignore Ignore Include Include Lanes: Base Vol: Initial Bse: User Adj: PHF Adj: PHF Volume: Reduced Vol: PCE Adj: MLF Adj: FinalVolume: Sat/Lane: Lanes: Final Sat.: Vol/Sat: Crit Moves: **** **** **** ****
277 FUTURE AM Thu Feb 2, :07:19 Page HCM Unsignalized Method (Base Volume Alternative) Intersection #9 Pier B St & Edison Ave Average Delay (sec/veh): 1.1 Worst Case Level Of Service: B[ 13.1] Control: Stop Sign Stop Sign Uncontrolled Uncontrolled Rights: Include Include Include Include Lanes: Base Vol: Initial Bse: User Adj: PHF Adj: PHF Volume: FinalVolume: Critical Gap Module: Critical Gp: 6.8 xxxx 6.9 xxxxx xxxx xxxxx xxxxx xxxx xxxxx 4.1 xxxx xxxxx FollowUpTim: 3.5 xxxx 3.3 xxxxx xxxx xxxxx xxxxx xxxx xxxxx 2.2 xxxx xxxxx Capacity Module: Cnflict Vol: 616 xxxx 182 xxxx xxxx xxxxx xxxx xxxx xxxxx 363 xxxx xxxxx Potent Cap.: 427 xxxx 836 xxxx xxxx xxxxx xxxx xxxx xxxxx 1207 xxxx xxxxx Move Cap.: 422 xxxx 836 xxxx xxxx xxxxx xxxx xxxx xxxxx 1207 xxxx xxxxx Volume/Cap: 0.11 xxxx 0.02 xxxx xxxx xxxx xxxx xxxx xxxx 0.02 xxxx xxxx Level Of Service Module: 2Way95thQ: 0.4 xxxx 0.1 xxxx xxxx xxxxx xxxx xxxx xxxxx 0.1 xxxx xxxxx Control Del: 14.6 xxxx 9.4 xxxxx xxxx xxxxx xxxxx xxxx xxxxx 8.0 xxxx xxxxx LOS by Move: B * A * * * * * * A * * Movement: LT - LTR - RT LT - LTR - RT LT - LTR - RT LT - LTR - RT Shared Cap.: xxxx xxxx xxxxx xxxx xxxx xxxxx xxxx xxxx xxxxx xxxx xxxx xxxxx SharedQueue:xxxxx xxxx xxxxx xxxxx xxxx xxxxx xxxxx xxxx xxxxx 0.1 xxxx xxxxx Shrd ConDel:xxxxx xxxx xxxxx xxxxx xxxx xxxxx xxxxx xxxx xxxxx 8.0 xxxx xxxxx Shared LOS: * * * * * * * * * A * * ApproachDel: 13.1 xxxxxx xxxxxx xxxxxx ApproachLOS: B * * * Note: Queue reported is the number of cars per lane.
278 FUTURE AM Thu Feb 2, :07:19 Page HCM 4-Way Stop Method (Base Volume Alternative) Intersection #10 Anaheim Way & Pier B St Cycle (sec): 100 Critical Vol./Cap.(X): Loss Time (sec): 0 (Y+R=4.0 sec) Average Delay (sec/veh): 18.8 Optimal Cycle: 0 Level Of Service: C Control: Stop Sign Stop Sign Stop Sign Stop Sign Rights: Include Include Include Include Lanes: Base Vol: Initial Bse: User Adj: PHF Adj: PHF Volume: Reduced Vol: PCE Adj: MLF Adj: FinalVolume: Lanes: Final Sat.: Vol/Sat: xxxx xxxx xxxx 0.17 xxxx 0.00 xxxx 0.62 xxxx xxxx Crit Moves: **** **** **** Delay/Veh: Delay Adj: AdjDel/Veh: LOS by Move: * * * B * * * C * * C A ApproachDel: xxxxxx Delay Adj: xxxxx ApprAdjDel: xxxxxx LOS by Appr: * B C C AllWayAvgQ: Note: Queue reported is the number of cars per lane.
279 FUTURE MIDDAY Thu Feb 2, :07:22 Page 3-1 ICU 1(Loss as Cycle Length %) Method (Base Volume Alternative) Intersection #1 Pier B St & Pico Ave Cycle (sec): 100 Critical Vol./Cap.(X): Loss Time (sec): 10 (Y+R=4.0 sec) Average Delay (sec/veh): xxxxxx Optimal Cycle: 61 Level Of Service: C Street Name: Pier B St Pico Ave Control: Split Phase Split Phase Protected Protected Rights: Ignore Include Include Include Lanes: Base Vol: Initial Bse: User Adj: PHF Adj: PHF Volume: Reduced Vol: PCE Adj: MLF Adj: FinalVolume: Sat/Lane: Lanes: Final Sat.: Vol/Sat: Crit Moves: **** **** ****
280 FUTURE MIDDAY Thu Feb 2, :07:22 Page 4-1 ICU 1(Loss as Cycle Length %) Method (Base Volume Alternative) Intersection #2 Pico Ave & Pier C St Cycle (sec): 100 Critical Vol./Cap.(X): Loss Time (sec): 10 (Y+R=4.0 sec) Average Delay (sec/veh): xxxxxx Optimal Cycle: 27 Level Of Service: A Control: Protected Protected Protected Protected Rights: Include Ignore Ovl Include Lanes: Base Vol: Initial Bse: User Adj: PHF Adj: PHF Volume: Reduced Vol: PCE Adj: MLF Adj: FinalVolume: OvlAdjVol: 0 Sat/Lane: Lanes: Final Sat.: Vol/Sat: OvlAdjV/S: 0.00 Crit Moves: **** **** ****
281 FUTURE MIDDAY Thu Feb 2, :07:22 Page HCM Operations Method (Base Volume Alternative) Intersection #3 Pico Ave & Pier D St/Water St Cycle (sec): 100 Critical Vol./Cap.(X): Loss Time (sec): 0 (Y+R=4.0 sec) Average Delay (sec/veh): 16.0 Optimal Cycle: 22 Level Of Service: B Control: Permitted Permitted Permitted Permitted Rights: Include Include Include Include Lanes: Base Vol: Initial Bse: User Adj: PHF Adj: PHF Volume: Reduced Vol: PCE Adj: MLF Adj: FinalVolume: Sat/Lane: Adjustment: Lanes: Final Sat.: Vol/Sat: Crit Moves: **** **** Green/Cycle: Volume/Cap: Uniform Del: IncremntDel: InitQueuDel: Delay Adj: Delay/Veh: User DelAdj: AdjDel/Veh: LOS by Move: B B A A B B B A B A A A HCM2kAvgQ: Note: Queue reported is the number of cars per lane.
282 FUTURE MIDDAY Thu Feb 2, :07:22 Page HCM Operations Method (Base Volume Alternative) Intersection #4 Pico Ave & Pier E St/EB Ocean Ave Cycle (sec): 100 Critical Vol./Cap.(X): Loss Time (sec): 0 (Y+R=4.0 sec) Average Delay (sec/veh): 17.5 Optimal Cycle: 22 Level Of Service: B Control: Permitted Permitted Permitted Permitted Rights: Include Include Include Ignore Lanes: Base Vol: Initial Bse: User Adj: PHF Adj: PHF Volume: Reduced Vol: PCE Adj: MLF Adj: FinalVolume: Sat/Lane: Adjustment: Lanes: Final Sat.: Vol/Sat: Crit Moves: **** **** Green/Cycle: Volume/Cap: Uniform Del: IncremntDel: InitQueuDel: Delay Adj: Delay/Veh: User DelAdj: AdjDel/Veh: LOS by Move: A C C C C C A A A A A A HCM2kAvgQ: Note: Queue reported is the number of cars per lane.
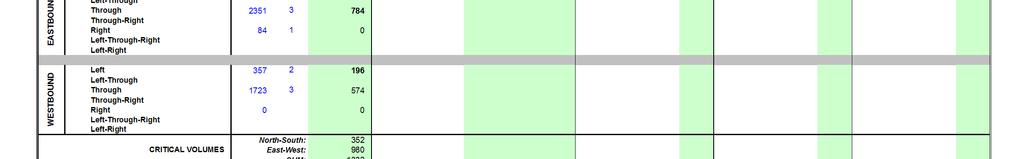
283
284 FUTURE MIDDAY Thu Feb 2, :07:22 Page 11-1 ICU 1(Loss as Cycle Length %) Method (Base Volume Alternative) Intersection #7 Anaheim St & Farragut Av Cycle (sec): 100 Critical Vol./Cap.(X): Loss Time (sec): 10 (Y+R=4.0 sec) Average Delay (sec/veh): xxxxxx Optimal Cycle: 42 Level Of Service: B Control: Protected Protected Protected Protected Rights: Include Ovl Include Ovl Lanes: Base Vol: Initial Bse: User Adj: PHF Adj: PHF Volume: Reduced Vol: PCE Adj: MLF Adj: FinalVolume: OvlAdjVol: 36 Sat/Lane: Lanes: Final Sat.: Vol/Sat: OvlAdjV/S: 0.02 Crit Moves: **** **** ****
285 FUTURE MIDDAY Thu Feb 2, :07:23 Page 12-1 ICU 1(Loss as Cycle Length %) Method (Base Volume Alternative) Intersection #8 Anaheim S & 1 St/West 9th St Cycle (sec): 100 Critical Vol./Cap.(X): Loss Time (sec): 10 (Y+R=4.0 sec) Average Delay (sec/veh): xxxxxx Optimal Cycle: 72 Level Of Service: D Control: Permitted Permitted Protected Protected Rights: Ignore Ignore Include Include Lanes: Base Vol: Initial Bse: User Adj: PHF Adj: PHF Volume: Reduced Vol: PCE Adj: MLF Adj: FinalVolume: Sat/Lane: Lanes: Final Sat.: Vol/Sat: Crit Moves: **** **** **** ****
286 FUTURE MIDDAY Thu Feb 2, :07:23 Page HCM Unsignalized Method (Base Volume Alternative) Intersection #9 Pier B St & Edison Ave Average Delay (sec/veh): 0.8 Worst Case Level Of Service: C[ 15.4] Control: Stop Sign Stop Sign Uncontrolled Uncontrolled Rights: Include Include Include Include Lanes: Base Vol: Initial Bse: User Adj: PHF Adj: PHF Volume: FinalVolume: Critical Gap Module: Critical Gp: 6.8 xxxx 6.9 xxxxx xxxx xxxxx xxxxx xxxx xxxxx 4.1 xxxx xxxxx FollowUpTim: 3.5 xxxx 3.3 xxxxx xxxx xxxxx xxxxx xxxx xxxxx 2.2 xxxx xxxxx Capacity Module: Cnflict Vol: 744 xxxx 226 xxxx xxxx xxxxx xxxx xxxx xxxxx 451 xxxx xxxxx Potent Cap.: 355 xxxx 784 xxxx xxxx xxxxx xxxx xxxx xxxxx 1120 xxxx xxxxx Move Cap.: 349 xxxx 784 xxxx xxxx xxxxx xxxx xxxx xxxxx 1120 xxxx xxxxx Volume/Cap: 0.11 xxxx 0.01 xxxx xxxx xxxx xxxx xxxx xxxx 0.02 xxxx xxxx Level Of Service Module: 2Way95thQ: 0.4 xxxx 0.0 xxxx xxxx xxxxx xxxx xxxx xxxxx 0.1 xxxx xxxxx Control Del: 16.5 xxxx 9.6 xxxxx xxxx xxxxx xxxxx xxxx xxxxx 8.3 xxxx xxxxx LOS by Move: C * A * * * * * * A * * Movement: LT - LTR - RT LT - LTR - RT LT - LTR - RT LT - LTR - RT Shared Cap.: xxxx xxxx xxxxx xxxx xxxx xxxxx xxxx xxxx xxxxx xxxx xxxx xxxxx SharedQueue:xxxxx xxxx xxxxx xxxxx xxxx xxxxx xxxxx xxxx xxxxx 0.1 xxxx xxxxx Shrd ConDel:xxxxx xxxx xxxxx xxxxx xxxx xxxxx xxxxx xxxx xxxxx 8.3 xxxx xxxxx Shared LOS: * * * * * * * * * A * * ApproachDel: 15.4 xxxxxx xxxxxx xxxxxx ApproachLOS: C * * * Note: Queue reported is the number of cars per lane.
287 FUTURE MIDDAY Thu Feb 2, :07:23 Page HCM 4-Way Stop Method (Base Volume Alternative) Intersection #10 Anaheim Way & Pier B St Cycle (sec): 100 Critical Vol./Cap.(X): Loss Time (sec): 0 (Y+R=4.0 sec) Average Delay (sec/veh): 24.4 Optimal Cycle: 0 Level Of Service: C Control: Stop Sign Stop Sign Stop Sign Stop Sign Rights: Include Include Include Include Lanes: Base Vol: Initial Bse: User Adj: PHF Adj: PHF Volume: Reduced Vol: PCE Adj: MLF Adj: FinalVolume: Lanes: Final Sat.: Vol/Sat: xxxx xxxx xxxx 0.12 xxxx 0.00 xxxx 0.72 xxxx xxxx Crit Moves: **** **** **** Delay/Veh: Delay Adj: AdjDel/Veh: LOS by Move: * * * B * * * C * * D A ApproachDel: xxxxxx Delay Adj: xxxxx ApprAdjDel: xxxxxx LOS by Appr: * B C D AllWayAvgQ: Note: Queue reported is the number of cars per lane.
288 FUTURE PM Thu Feb 2, :07:25 Page 3-1 ICU 1(Loss as Cycle Length %) Method (Base Volume Alternative) Intersection #1 Pier B St & Pico Ave Cycle (sec): 100 Critical Vol./Cap.(X): Loss Time (sec): 10 (Y+R=4.0 sec) Average Delay (sec/veh): xxxxxx Optimal Cycle: 58 Level Of Service: C Street Name: Pier B St Pico Ave Control: Split Phase Split Phase Protected Protected Rights: Ignore Include Include Include Lanes: Base Vol: Initial Bse: User Adj: PHF Adj: PHF Volume: Reduced Vol: PCE Adj: MLF Adj: FinalVolume: Sat/Lane: Lanes: Final Sat.: Vol/Sat: Crit Moves: **** **** ****
289 FUTURE PM Thu Feb 2, :07:25 Page 4-1 ICU 1(Loss as Cycle Length %) Method (Base Volume Alternative) Intersection #2 Pico Ave & Pier C St Cycle (sec): 100 Critical Vol./Cap.(X): Loss Time (sec): 10 (Y+R=4.0 sec) Average Delay (sec/veh): xxxxxx Optimal Cycle: 28 Level Of Service: A Control: Protected Protected Protected Protected Rights: Include Ignore Ovl Include Lanes: Base Vol: Initial Bse: User Adj: PHF Adj: PHF Volume: Reduced Vol: PCE Adj: MLF Adj: FinalVolume: OvlAdjVol: 0 Sat/Lane: Lanes: Final Sat.: Vol/Sat: OvlAdjV/S: 0.00 Crit Moves: **** **** ****
290 FUTURE PM Thu Feb 2, :07:25 Page HCM Operations Method (Base Volume Alternative) Intersection #3 Pico Ave & Pier D St/Water St Cycle (sec): 100 Critical Vol./Cap.(X): Loss Time (sec): 0 (Y+R=4.0 sec) Average Delay (sec/veh): 15.1 Optimal Cycle: 21 Level Of Service: B Control: Permitted Permitted Permitted Permitted Rights: Include Include Include Include Lanes: Base Vol: Initial Bse: User Adj: PHF Adj: PHF Volume: Reduced Vol: PCE Adj: MLF Adj: FinalVolume: Sat/Lane: Adjustment: Lanes: Final Sat.: Vol/Sat: Crit Moves: **** **** Green/Cycle: Volume/Cap: Uniform Del: IncremntDel: InitQueuDel: Delay Adj: Delay/Veh: User DelAdj: AdjDel/Veh: LOS by Move: B B A A B B B A B A A A HCM2kAvgQ: Note: Queue reported is the number of cars per lane.
291 FUTURE PM Thu Feb 2, :07:25 Page HCM Operations Method (Base Volume Alternative) Intersection #4 Pico Ave & Pier E St/EB Ocean Ave Cycle (sec): 100 Critical Vol./Cap.(X): Loss Time (sec): 0 (Y+R=4.0 sec) Average Delay (sec/veh): 16.4 Optimal Cycle: 30 Level Of Service: B Control: Permitted Permitted Permitted Permitted Rights: Include Include Include Ignore Lanes: Base Vol: Initial Bse: User Adj: PHF Adj: PHF Volume: Reduced Vol: PCE Adj: MLF Adj: FinalVolume: Sat/Lane: Adjustment: Lanes: Final Sat.: Vol/Sat: Crit Moves: **** **** Green/Cycle: Volume/Cap: Uniform Del: IncremntDel: InitQueuDel: Delay Adj: Delay/Veh: User DelAdj: AdjDel/Veh: LOS by Move: B B B C B B B B B B B A HCM2kAvgQ: Note: Queue reported is the number of cars per lane.
292
293 FUTURE PM Thu Feb 2, :07:25 Page 11-1 ICU 1(Loss as Cycle Length %) Method (Base Volume Alternative) Intersection #7 Anaheim St & Farragut Av Cycle (sec): 100 Critical Vol./Cap.(X): Loss Time (sec): 10 (Y+R=4.0 sec) Average Delay (sec/veh): xxxxxx Optimal Cycle: 53 Level Of Service: C Control: Protected Protected Protected Protected Rights: Include Ovl Include Ovl Lanes: Base Vol: Initial Bse: User Adj: PHF Adj: PHF Volume: Reduced Vol: PCE Adj: MLF Adj: FinalVolume: OvlAdjVol: 216 Sat/Lane: Lanes: Final Sat.: Vol/Sat: OvlAdjV/S: 0.13 Crit Moves: **** **** ****
294 FUTURE PM Thu Feb 2, :07:25 Page 12-1 ICU 1(Loss as Cycle Length %) Method (Base Volume Alternative) Intersection #8 Anaheim S & 1 St/West 9th St Cycle (sec): 100 Critical Vol./Cap.(X): Loss Time (sec): 10 (Y+R=4.0 sec) Average Delay (sec/veh): xxxxxx Optimal Cycle: 60 Level Of Service: C Control: Permitted Permitted Protected Protected Rights: Ignore Ignore Include Include Lanes: Base Vol: Initial Bse: User Adj: PHF Adj: PHF Volume: Reduced Vol: PCE Adj: MLF Adj: FinalVolume: Sat/Lane: Lanes: Final Sat.: Vol/Sat: Crit Moves: **** **** **** ****
295 FUTURE PM Thu Feb 2, :07:25 Page HCM Unsignalized Method (Base Volume Alternative) Intersection #9 Pier B St & Edison Ave Average Delay (sec/veh): 2.6 Worst Case Level Of Service: C[ 20.4] Control: Stop Sign Stop Sign Uncontrolled Uncontrolled Rights: Include Include Include Include Lanes: Base Vol: Initial Bse: User Adj: PHF Adj: PHF Volume: FinalVolume: Critical Gap Module: Critical Gp: 6.8 xxxx 6.9 xxxxx xxxx xxxxx xxxxx xxxx xxxxx 4.1 xxxx xxxxx FollowUpTim: 3.5 xxxx 3.3 xxxxx xxxx xxxxx xxxxx xxxx xxxxx 2.2 xxxx xxxxx Capacity Module: Cnflict Vol: 778 xxxx 240 xxxx xxxx xxxxx xxxx xxxx xxxxx 480 xxxx xxxxx Potent Cap.: 338 xxxx 767 xxxx xxxx xxxxx xxxx xxxx xxxxx 1093 xxxx xxxxx Move Cap.: 333 xxxx 767 xxxx xxxx xxxxx xxxx xxxx xxxxx 1093 xxxx xxxxx Volume/Cap: 0.37 xxxx 0.03 xxxx xxxx xxxx xxxx xxxx xxxx 0.02 xxxx xxxx Level Of Service Module: 2Way95thQ: 1.7 xxxx 0.1 xxxx xxxx xxxxx xxxx xxxx xxxxx 0.1 xxxx xxxxx Control Del: 22.1 xxxx 9.8 xxxxx xxxx xxxxx xxxxx xxxx xxxxx 8.4 xxxx xxxxx LOS by Move: C * A * * * * * * A * * Movement: LT - LTR - RT LT - LTR - RT LT - LTR - RT LT - LTR - RT Shared Cap.: xxxx xxxx xxxxx xxxx xxxx xxxxx xxxx xxxx xxxxx xxxx xxxx xxxxx SharedQueue:xxxxx xxxx xxxxx xxxxx xxxx xxxxx xxxxx xxxx xxxxx 0.1 xxxx xxxxx Shrd ConDel:xxxxx xxxx xxxxx xxxxx xxxx xxxxx xxxxx xxxx xxxxx 8.4 xxxx xxxxx Shared LOS: * * * * * * * * * A * * ApproachDel: 20.4 xxxxxx xxxxxx xxxxxx ApproachLOS: C * * * Note: Queue reported is the number of cars per lane.
296 FUTURE PM Thu Feb 2, :07:25 Page HCM 4-Way Stop Method (Base Volume Alternative) Intersection #10 Anaheim Way & Pier B St Cycle (sec): 100 Critical Vol./Cap.(X): Loss Time (sec): 0 (Y+R=4.0 sec) Average Delay (sec/veh): 21.2 Optimal Cycle: 0 Level Of Service: C Control: Stop Sign Stop Sign Stop Sign Stop Sign Rights: Include Include Include Include Lanes: Base Vol: Initial Bse: User Adj: PHF Adj: PHF Volume: Reduced Vol: PCE Adj: MLF Adj: FinalVolume: Lanes: Final Sat.: Vol/Sat: xxxx xxxx xxxx 0.18 xxxx 0.00 xxxx 0.71 xxxx xxxx Crit Moves: **** **** **** Delay/Veh: Delay Adj: AdjDel/Veh: LOS by Move: * * * B * * * C * * C B ApproachDel: xxxxxx Delay Adj: xxxxx ApprAdjDel: xxxxxx LOS by Appr: * B C C AllWayAvgQ: Note: Queue reported is the number of cars per lane.
297 FUTURE BASE (YEAR 2035) PLUS PROJECT (ALTERNATIVES 1 AND 3)
298 FUTURE+PROJECT AM Thu Feb 2, :07:27 Page 3-1 ICU 1(Loss as Cycle Length %) Method (Base Volume Alternative) Intersection #1 Pier B St & Pico Ave Cycle (sec): 100 Critical Vol./Cap.(X): Loss Time (sec): 10 (Y+R=4.0 sec) Average Delay (sec/veh): xxxxxx Optimal Cycle: 54 Level Of Service: C Street Name: Pier B St Pico Ave Control: Split Phase Split Phase Protected Protected Rights: Ignore Include Include Include Lanes: Base Vol: Initial Bse: User Adj: PHF Adj: PHF Volume: Reduced Vol: PCE Adj: MLF Adj: FinalVolume: Sat/Lane: Lanes: Final Sat.: Vol/Sat: Crit Moves: **** **** ****
299 FUTURE+PROJECT AM Thu Feb 2, :07:27 Page 4-1 ICU 1(Loss as Cycle Length %) Method (Base Volume Alternative) Intersection #2 Pico Ave & Pier C St Cycle (sec): 100 Critical Vol./Cap.(X): Loss Time (sec): 10 (Y+R=4.0 sec) Average Delay (sec/veh): xxxxxx Optimal Cycle: 28 Level Of Service: A Control: Protected Protected Protected Protected Rights: Include Ignore Ovl Include Lanes: Base Vol: Initial Bse: User Adj: PHF Adj: PHF Volume: Reduced Vol: PCE Adj: MLF Adj: FinalVolume: Sat/Lane: Lanes: Final Sat.: Vol/Sat: Crit Moves: **** **** ****
300 FUTURE+PROJECT AM Thu Feb 2, :07:27 Page HCM Operations Method (Base Volume Alternative) Intersection #3 Pico Ave & Pier D St/Water St Cycle (sec): 100 Critical Vol./Cap.(X): Loss Time (sec): 0 (Y+R=4.0 sec) Average Delay (sec/veh): 16.0 Optimal Cycle: 24 Level Of Service: B Control: Permitted Permitted Permitted Permitted Rights: Include Include Include Include Lanes: Base Vol: Initial Bse: User Adj: PHF Adj: PHF Volume: Reduced Vol: PCE Adj: MLF Adj: FinalVolume: Sat/Lane: Adjustment: Lanes: Final Sat.: Vol/Sat: Crit Moves: **** **** Green/Cycle: Volume/Cap: Uniform Del: IncremntDel: InitQueuDel: Delay Adj: Delay/Veh: User DelAdj: AdjDel/Veh: LOS by Move: B B A A B B B A B A A A HCM2kAvgQ: Note: Queue reported is the number of cars per lane.
301 FUTURE+PROJECT AM Thu Feb 2, :07:27 Page HCM Operations Method (Base Volume Alternative) Intersection #4 Pico Ave & Pier E St/EB Ocean Ave Cycle (sec): 100 Critical Vol./Cap.(X): Loss Time (sec): 0 (Y+R=4.0 sec) Average Delay (sec/veh): 17.5 Optimal Cycle: 23 Level Of Service: B Control: Permitted Permitted Permitted Permitted Rights: Include Include Include Ignore Lanes: Base Vol: Initial Bse: User Adj: PHF Adj: PHF Volume: Reduced Vol: PCE Adj: MLF Adj: FinalVolume: Sat/Lane: Adjustment: Lanes: Final Sat.: Vol/Sat: Crit Moves: **** **** Green/Cycle: Volume/Cap: Uniform Del: IncremntDel: InitQueuDel: Delay Adj: Delay/Veh: User DelAdj: AdjDel/Veh: LOS by Move: C C C C C C A A A A A A HCM2kAvgQ: Note: Queue reported is the number of cars per lane.
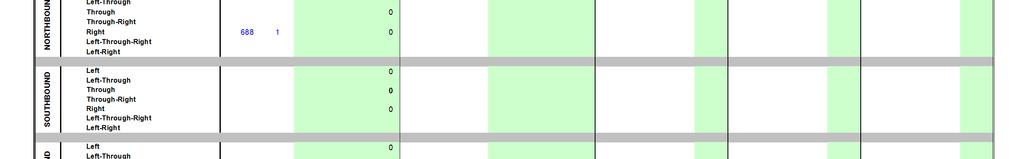
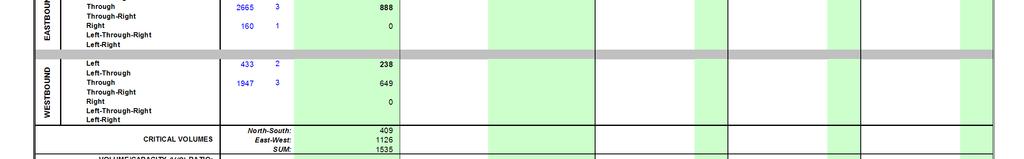
302
303 FUTURE+PROJECT AM Thu Feb 2, :07:27 Page 11-1 ICU 1(Loss as Cycle Length %) Method (Base Volume Alternative) Intersection #7 Anaheim St & Farragut Av Cycle (sec): 100 Critical Vol./Cap.(X): Loss Time (sec): 10 (Y+R=4.0 sec) Average Delay (sec/veh): xxxxxx Optimal Cycle: 42 Level Of Service: B Control: Protected Protected Protected Protected Rights: Include Ovl Include Ovl Lanes: Base Vol: Initial Bse: User Adj: PHF Adj: PHF Volume: Reduced Vol: PCE Adj: MLF Adj: FinalVolume: OvlAdjVol: 27 Sat/Lane: Lanes: Final Sat.: Vol/Sat: OvlAdjV/S: 0.02 Crit Moves: **** **** ****
304 FUTURE+PROJECT AM Thu Feb 2, :07:27 Page 12-1 ICU 1(Loss as Cycle Length %) Method (Base Volume Alternative) Intersection #8 Anaheim S & 1 St/West 9th St Cycle (sec): 100 Critical Vol./Cap.(X): Loss Time (sec): 10 (Y+R=4.0 sec) Average Delay (sec/veh): xxxxxx Optimal Cycle: 66 Level Of Service: C Control: Permitted Permitted Protected Protected Rights: Ignore Ignore Include Include Lanes: Base Vol: Initial Bse: User Adj: PHF Adj: PHF Volume: Reduced Vol: PCE Adj: MLF Adj: FinalVolume: Sat/Lane: Lanes: Final Sat.: Vol/Sat: Crit Moves: **** **** **** ****
305 FUTURE+PROJECT AM Thu Feb 2, :07:27 Page HCM Unsignalized Method (Base Volume Alternative) Intersection #9 Pier B St & Edison Ave Average Delay (sec/veh): 1.1 Worst Case Level Of Service: B[ 13.1] Control: Stop Sign Stop Sign Uncontrolled Uncontrolled Rights: Include Include Include Include Lanes: Base Vol: Initial Bse: User Adj: PHF Adj: PHF Volume: FinalVolume: Critical Gap Module: Critical Gp: 6.8 xxxx 6.9 xxxxx xxxx xxxxx xxxxx xxxx xxxxx 4.1 xxxx xxxxx FollowUpTim: 3.5 xxxx 3.3 xxxxx xxxx xxxxx xxxxx xxxx xxxxx 2.2 xxxx xxxxx Capacity Module: Cnflict Vol: 616 xxxx 182 xxxx xxxx xxxxx xxxx xxxx xxxxx 363 xxxx xxxxx Potent Cap.: 427 xxxx 836 xxxx xxxx xxxxx xxxx xxxx xxxxx 1207 xxxx xxxxx Move Cap.: 422 xxxx 836 xxxx xxxx xxxxx xxxx xxxx xxxxx 1207 xxxx xxxxx Volume/Cap: 0.11 xxxx 0.02 xxxx xxxx xxxx xxxx xxxx xxxx 0.02 xxxx xxxx Level Of Service Module: 2Way95thQ: 0.4 xxxx 0.1 xxxx xxxx xxxxx xxxx xxxx xxxxx 0.1 xxxx xxxxx Control Del: 14.6 xxxx 9.4 xxxxx xxxx xxxxx xxxxx xxxx xxxxx 8.0 xxxx xxxxx LOS by Move: B * A * * * * * * A * * Movement: LT - LTR - RT LT - LTR - RT LT - LTR - RT LT - LTR - RT Shared Cap.: xxxx xxxx xxxxx xxxx xxxx xxxxx xxxx xxxx xxxxx xxxx xxxx xxxxx SharedQueue:xxxxx xxxx xxxxx xxxxx xxxx xxxxx xxxxx xxxx xxxxx 0.1 xxxx xxxxx Shrd ConDel:xxxxx xxxx xxxxx xxxxx xxxx xxxxx xxxxx xxxx xxxxx 8.0 xxxx xxxxx Shared LOS: * * * * * * * * * A * * ApproachDel: 13.1 xxxxxx xxxxxx xxxxxx ApproachLOS: B * * * Note: Queue reported is the number of cars per lane.
306 FUTURE+PROJECT AM Thu Feb 2, :07:27 Page HCM 4-Way Stop Method (Base Volume Alternative) Intersection #10 Anaheim Way & Pier B St Cycle (sec): 100 Critical Vol./Cap.(X): Loss Time (sec): 0 (Y+R=4.0 sec) Average Delay (sec/veh): 18.8 Optimal Cycle: 0 Level Of Service: C Control: Stop Sign Stop Sign Stop Sign Stop Sign Rights: Include Include Include Include Lanes: Base Vol: Initial Bse: User Adj: PHF Adj: PHF Volume: Reduced Vol: PCE Adj: MLF Adj: FinalVolume: Lanes: Final Sat.: Vol/Sat: xxxx xxxx xxxx 0.17 xxxx 0.00 xxxx 0.62 xxxx xxxx Crit Moves: **** **** **** Delay/Veh: Delay Adj: AdjDel/Veh: LOS by Move: * * * B * * * C * * C A ApproachDel: xxxxxx Delay Adj: xxxxx ApprAdjDel: xxxxxx LOS by Appr: * B C C AllWayAvgQ: Note: Queue reported is the number of cars per lane.
307 FUTURE+PROJECT MIDDAY Thu Feb 2, :07:31 Page 3-1 ICU 1(Loss as Cycle Length %) Method (Base Volume Alternative) Intersection #1 Pier B St & Pico Ave Cycle (sec): 100 Critical Vol./Cap.(X): Loss Time (sec): 10 (Y+R=4.0 sec) Average Delay (sec/veh): xxxxxx Optimal Cycle: 64 Level Of Service: C Street Name: Pier B St Pico Ave Control: Split Phase Split Phase Protected Protected Rights: Ignore Include Include Include Lanes: Base Vol: Initial Bse: User Adj: PHF Adj: PHF Volume: Reduced Vol: PCE Adj: MLF Adj: FinalVolume: Sat/Lane: Lanes: Final Sat.: Vol/Sat: Crit Moves: **** **** ****
308 FUTURE+PROJECT MIDDAY Thu Feb 2, :07:31 Page 4-1 ICU 1(Loss as Cycle Length %) Method (Base Volume Alternative) Intersection #2 Pico Ave & Pier C St Cycle (sec): 100 Critical Vol./Cap.(X): Loss Time (sec): 10 (Y+R=4.0 sec) Average Delay (sec/veh): xxxxxx Optimal Cycle: 28 Level Of Service: A Control: Protected Protected Protected Protected Rights: Include Ignore Ovl Include Lanes: Base Vol: Initial Bse: User Adj: PHF Adj: PHF Volume: Reduced Vol: PCE Adj: MLF Adj: FinalVolume: OvlAdjVol: 0 Sat/Lane: Lanes: Final Sat.: Vol/Sat: OvlAdjV/S: 0.00 Crit Moves: **** **** ****
309 FUTURE+PROJECT MIDDAY Thu Feb 2, :07:31 Page HCM Operations Method (Base Volume Alternative) Intersection #3 Pico Ave & Pier D St/Water St Cycle (sec): 100 Critical Vol./Cap.(X): Loss Time (sec): 0 (Y+R=4.0 sec) Average Delay (sec/veh): 16.7 Optimal Cycle: 23 Level Of Service: B Control: Permitted Permitted Permitted Permitted Rights: Include Include Include Include Lanes: Base Vol: Initial Bse: User Adj: PHF Adj: PHF Volume: Reduced Vol: PCE Adj: MLF Adj: FinalVolume: Sat/Lane: Adjustment: Lanes: Final Sat.: Vol/Sat: Crit Moves: **** **** Green/Cycle: Volume/Cap: Uniform Del: IncremntDel: InitQueuDel: Delay Adj: Delay/Veh: User DelAdj: AdjDel/Veh: LOS by Move: C B A A B B B A A A A A HCM2kAvgQ: Note: Queue reported is the number of cars per lane.
310 FUTURE+PROJECT MIDDAY Thu Feb 2, :07:32 Page HCM Operations Method (Base Volume Alternative) Intersection #4 Pico Ave & Pier E St/EB Ocean Ave Cycle (sec): 100 Critical Vol./Cap.(X): Loss Time (sec): 0 (Y+R=4.0 sec) Average Delay (sec/veh): 17.5 Optimal Cycle: 22 Level Of Service: B Control: Permitted Permitted Permitted Permitted Rights: Include Include Include Ignore Lanes: Base Vol: Initial Bse: User Adj: PHF Adj: PHF Volume: Reduced Vol: PCE Adj: MLF Adj: FinalVolume: Sat/Lane: Adjustment: Lanes: Final Sat.: Vol/Sat: Crit Moves: **** **** Green/Cycle: Volume/Cap: Uniform Del: IncremntDel: InitQueuDel: Delay Adj: Delay/Veh: User DelAdj: AdjDel/Veh: LOS by Move: A C C C C C A A A A A A HCM2kAvgQ: Note: Queue reported is the number of cars per lane.
311
312 FUTURE+PROJECT MIDDAY Thu Feb 2, :07:32 Page 11-1 ICU 1(Loss as Cycle Length %) Method (Base Volume Alternative) Intersection #7 Anaheim St & Farragut Av Cycle (sec): 100 Critical Vol./Cap.(X): Loss Time (sec): 10 (Y+R=4.0 sec) Average Delay (sec/veh): xxxxxx Optimal Cycle: 42 Level Of Service: B Control: Protected Protected Protected Protected Rights: Include Ovl Include Ovl Lanes: Base Vol: Initial Bse: User Adj: PHF Adj: PHF Volume: Reduced Vol: PCE Adj: MLF Adj: FinalVolume: OvlAdjVol: 36 Sat/Lane: Lanes: Final Sat.: Vol/Sat: OvlAdjV/S: 0.02 Crit Moves: **** **** ****
313 FUTURE+PROJECT MIDDAY Thu Feb 2, :07:32 Page 12-1 ICU 1(Loss as Cycle Length %) Method (Base Volume Alternative) Intersection #8 Anaheim S & 1 St/West 9th St Cycle (sec): 100 Critical Vol./Cap.(X): Loss Time (sec): 10 (Y+R=4.0 sec) Average Delay (sec/veh): xxxxxx Optimal Cycle: 72 Level Of Service: D Control: Permitted Permitted Protected Protected Rights: Ignore Ignore Include Include Lanes: Base Vol: Initial Bse: User Adj: PHF Adj: PHF Volume: Reduced Vol: PCE Adj: MLF Adj: FinalVolume: Sat/Lane: Lanes: Final Sat.: Vol/Sat: Crit Moves: **** **** **** ****
314 FUTURE+PROJECT MIDDAY Thu Feb 2, :07:32 Page HCM Unsignalized Method (Base Volume Alternative) Intersection #9 Pier B St & Edison Ave Average Delay (sec/veh): 0.8 Worst Case Level Of Service: C[ 15.5] Control: Stop Sign Stop Sign Uncontrolled Uncontrolled Rights: Include Include Include Include Lanes: Base Vol: Initial Bse: User Adj: PHF Adj: PHF Volume: FinalVolume: Critical Gap Module: Critical Gp: 6.8 xxxx 6.9 xxxxx xxxx xxxxx xxxxx xxxx xxxxx 4.1 xxxx xxxxx FollowUpTim: 3.5 xxxx 3.3 xxxxx xxxx xxxxx xxxxx xxxx xxxxx 2.2 xxxx xxxxx Capacity Module: Cnflict Vol: 747 xxxx 227 xxxx xxxx xxxxx xxxx xxxx xxxxx 453 xxxx xxxxx Potent Cap.: 353 xxxx 783 xxxx xxxx xxxxx xxxx xxxx xxxxx 1118 xxxx xxxxx Move Cap.: 348 xxxx 783 xxxx xxxx xxxxx xxxx xxxx xxxxx 1118 xxxx xxxxx Volume/Cap: 0.11 xxxx 0.01 xxxx xxxx xxxx xxxx xxxx xxxx 0.02 xxxx xxxx Level Of Service Module: 2Way95thQ: 0.4 xxxx 0.0 xxxx xxxx xxxxx xxxx xxxx xxxxx 0.1 xxxx xxxxx Control Del: 16.6 xxxx 9.6 xxxxx xxxx xxxxx xxxxx xxxx xxxxx 8.3 xxxx xxxxx LOS by Move: C * A * * * * * * A * * Movement: LT - LTR - RT LT - LTR - RT LT - LTR - RT LT - LTR - RT Shared Cap.: xxxx xxxx xxxxx xxxx xxxx xxxxx xxxx xxxx xxxxx xxxx xxxx xxxxx SharedQueue:xxxxx xxxx xxxxx xxxxx xxxx xxxxx xxxxx xxxx xxxxx 0.1 xxxx xxxxx Shrd ConDel:xxxxx xxxx xxxxx xxxxx xxxx xxxxx xxxxx xxxx xxxxx 8.3 xxxx xxxxx Shared LOS: * * * * * * * * * A * * ApproachDel: 15.5 xxxxxx xxxxxx xxxxxx ApproachLOS: C * * * Note: Queue reported is the number of cars per lane.
315 FUTURE+PROJECT MIDDAY Thu Feb 2, :07:32 Page HCM 4-Way Stop Method (Base Volume Alternative) Intersection #10 Anaheim Way & Pier B St Cycle (sec): 100 Critical Vol./Cap.(X): Loss Time (sec): 0 (Y+R=4.0 sec) Average Delay (sec/veh): 24.5 Optimal Cycle: 0 Level Of Service: C Control: Stop Sign Stop Sign Stop Sign Stop Sign Rights: Include Include Include Include Lanes: Base Vol: Initial Bse: User Adj: PHF Adj: PHF Volume: Reduced Vol: PCE Adj: MLF Adj: FinalVolume: Lanes: Final Sat.: Vol/Sat: xxxx xxxx xxxx 0.12 xxxx 0.00 xxxx 0.72 xxxx xxxx Crit Moves: **** **** **** Delay/Veh: Delay Adj: AdjDel/Veh: LOS by Move: * * * B * * * C * * D A ApproachDel: xxxxxx Delay Adj: xxxxx ApprAdjDel: xxxxxx LOS by Appr: * B C D AllWayAvgQ: Note: Queue reported is the number of cars per lane.
316 FUTURE+PROJECT PM Thu Feb 2, :07:29 Page 3-1 ICU 1(Loss as Cycle Length %) Method (Base Volume Alternative) Intersection #1 Pier B St & Pico Ave Cycle (sec): 100 Critical Vol./Cap.(X): Loss Time (sec): 10 (Y+R=4.0 sec) Average Delay (sec/veh): xxxxxx Optimal Cycle: 61 Level Of Service: C Street Name: Pier B St Pico Ave Control: Split Phase Split Phase Protected Protected Rights: Ignore Include Include Include Lanes: Base Vol: Initial Bse: User Adj: PHF Adj: PHF Volume: Reduced Vol: PCE Adj: MLF Adj: FinalVolume: Sat/Lane: Lanes: Final Sat.: Vol/Sat: Crit Moves: **** **** ****
317 FUTURE+PROJECT PM Thu Feb 2, :07:29 Page 4-1 ICU 1(Loss as Cycle Length %) Method (Base Volume Alternative) Intersection #2 Pico Ave & Pier C St Cycle (sec): 100 Critical Vol./Cap.(X): Loss Time (sec): 10 (Y+R=4.0 sec) Average Delay (sec/veh): xxxxxx Optimal Cycle: 28 Level Of Service: A Control: Protected Protected Protected Protected Rights: Include Ignore Ovl Include Lanes: Base Vol: Initial Bse: User Adj: PHF Adj: PHF Volume: Reduced Vol: PCE Adj: MLF Adj: FinalVolume: OvlAdjVol: 0 Sat/Lane: Lanes: Final Sat.: Vol/Sat: OvlAdjV/S: 0.00 Crit Moves: **** **** ****
318 FUTURE+PROJECT PM Thu Feb 2, :07:29 Page HCM Operations Method (Base Volume Alternative) Intersection #3 Pico Ave & Pier D St/Water St Cycle (sec): 100 Critical Vol./Cap.(X): Loss Time (sec): 0 (Y+R=4.0 sec) Average Delay (sec/veh): 16.5 Optimal Cycle: 22 Level Of Service: B Control: Permitted Permitted Permitted Permitted Rights: Include Include Include Include Lanes: Base Vol: Initial Bse: User Adj: PHF Adj: PHF Volume: Reduced Vol: PCE Adj: MLF Adj: FinalVolume: Sat/Lane: Adjustment: Lanes: Final Sat.: Vol/Sat: Crit Moves: **** **** Green/Cycle: Volume/Cap: Uniform Del: IncremntDel: InitQueuDel: Delay Adj: Delay/Veh: User DelAdj: AdjDel/Veh: LOS by Move: B B A A B B B A B A A A HCM2kAvgQ: Note: Queue reported is the number of cars per lane.
319 FUTURE+PROJECT PM Thu Feb 2, :07:29 Page HCM Operations Method (Base Volume Alternative) Intersection #4 Pico Ave & Pier E St/EB Ocean Ave Cycle (sec): 100 Critical Vol./Cap.(X): Loss Time (sec): 0 (Y+R=4.0 sec) Average Delay (sec/veh): 16.4 Optimal Cycle: 30 Level Of Service: B Control: Permitted Permitted Permitted Permitted Rights: Include Include Include Ignore Lanes: Base Vol: Initial Bse: User Adj: PHF Adj: PHF Volume: Reduced Vol: PCE Adj: MLF Adj: FinalVolume: Sat/Lane: Adjustment: Lanes: Final Sat.: Vol/Sat: Crit Moves: **** **** Green/Cycle: Volume/Cap: Uniform Del: IncremntDel: InitQueuDel: Delay Adj: Delay/Veh: User DelAdj: AdjDel/Veh: LOS by Move: B B B C B B B B B B B A HCM2kAvgQ: Note: Queue reported is the number of cars per lane.
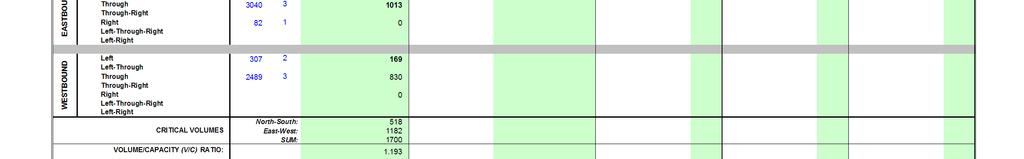
320
321 FUTURE+PROJECT PM Thu Feb 2, :07:29 Page 11-1 ICU 1(Loss as Cycle Length %) Method (Base Volume Alternative) Intersection #7 Anaheim St & Farragut Av Cycle (sec): 100 Critical Vol./Cap.(X): Loss Time (sec): 10 (Y+R=4.0 sec) Average Delay (sec/veh): xxxxxx Optimal Cycle: 53 Level Of Service: C Control: Protected Protected Protected Protected Rights: Include Ovl Include Ovl Lanes: Base Vol: Initial Bse: User Adj: PHF Adj: PHF Volume: Reduced Vol: PCE Adj: MLF Adj: FinalVolume: OvlAdjVol: 216 Sat/Lane: Lanes: Final Sat.: Vol/Sat: OvlAdjV/S: 0.13 Crit Moves: **** **** ****
322 FUTURE+PROJECT PM Thu Feb 2, :07:29 Page 12-1 ICU 1(Loss as Cycle Length %) Method (Base Volume Alternative) Intersection #8 Anaheim S & 1 St/West 9th St Cycle (sec): 100 Critical Vol./Cap.(X): Loss Time (sec): 10 (Y+R=4.0 sec) Average Delay (sec/veh): xxxxxx Optimal Cycle: 60 Level Of Service: C Control: Permitted Permitted Protected Protected Rights: Ignore Ignore Include Include Lanes: Base Vol: Initial Bse: User Adj: PHF Adj: PHF Volume: Reduced Vol: PCE Adj: MLF Adj: FinalVolume: Sat/Lane: Lanes: Final Sat.: Vol/Sat: Crit Moves: **** **** **** ****
323 FUTURE+PROJECT PM Thu Feb 2, :07:29 Page HCM Unsignalized Method (Base Volume Alternative) Intersection #9 Pier B St & Edison Ave Average Delay (sec/veh): 2.6 Worst Case Level Of Service: C[ 20.4] Control: Stop Sign Stop Sign Uncontrolled Uncontrolled Rights: Include Include Include Include Lanes: Base Vol: Initial Bse: User Adj: PHF Adj: PHF Volume: FinalVolume: Critical Gap Module: Critical Gp: 6.8 xxxx 6.9 xxxxx xxxx xxxxx xxxxx xxxx xxxxx 4.1 xxxx xxxxx FollowUpTim: 3.5 xxxx 3.3 xxxxx xxxx xxxxx xxxxx xxxx xxxxx 2.2 xxxx xxxxx Capacity Module: Cnflict Vol: 778 xxxx 240 xxxx xxxx xxxxx xxxx xxxx xxxxx 480 xxxx xxxxx Potent Cap.: 338 xxxx 767 xxxx xxxx xxxxx xxxx xxxx xxxxx 1093 xxxx xxxxx Move Cap.: 333 xxxx 767 xxxx xxxx xxxxx xxxx xxxx xxxxx 1093 xxxx xxxxx Volume/Cap: 0.37 xxxx 0.03 xxxx xxxx xxxx xxxx xxxx xxxx 0.02 xxxx xxxx Level Of Service Module: 2Way95thQ: 1.7 xxxx 0.1 xxxx xxxx xxxxx xxxx xxxx xxxxx 0.1 xxxx xxxxx Control Del: 22.1 xxxx 9.8 xxxxx xxxx xxxxx xxxxx xxxx xxxxx 8.4 xxxx xxxxx LOS by Move: C * A * * * * * * A * * Movement: LT - LTR - RT LT - LTR - RT LT - LTR - RT LT - LTR - RT Shared Cap.: xxxx xxxx xxxxx xxxx xxxx xxxxx xxxx xxxx xxxxx xxxx xxxx xxxxx SharedQueue:xxxxx xxxx xxxxx xxxxx xxxx xxxxx xxxxx xxxx xxxxx 0.1 xxxx xxxxx Shrd ConDel:xxxxx xxxx xxxxx xxxxx xxxx xxxxx xxxxx xxxx xxxxx 8.4 xxxx xxxxx Shared LOS: * * * * * * * * * A * * ApproachDel: 20.4 xxxxxx xxxxxx xxxxxx ApproachLOS: C * * * Note: Queue reported is the number of cars per lane.
324 FUTURE+PROJECT PM Thu Feb 2, :07:29 Page HCM 4-Way Stop Method (Base Volume Alternative) Intersection #10 Anaheim Way & Pier B St Cycle (sec): 100 Critical Vol./Cap.(X): Loss Time (sec): 0 (Y+R=4.0 sec) Average Delay (sec/veh): 21.2 Optimal Cycle: 0 Level Of Service: C Control: Stop Sign Stop Sign Stop Sign Stop Sign Rights: Include Include Include Include Lanes: Base Vol: Initial Bse: User Adj: PHF Adj: PHF Volume: Reduced Vol: PCE Adj: MLF Adj: FinalVolume: Lanes: Final Sat.: Vol/Sat: xxxx xxxx xxxx 0.18 xxxx 0.00 xxxx 0.71 xxxx xxxx Crit Moves: **** **** **** Delay/Veh: Delay Adj: AdjDel/Veh: LOS by Move: * * * B * * * C * * C B ApproachDel: xxxxxx Delay Adj: xxxxx ApprAdjDel: xxxxxx LOS by Appr: * B C C AllWayAvgQ: Note: Queue reported is the number of cars per lane.
325 FUTURE BASE (YEAR 2035) PLUS PROJECT (ALTERNATIVE 2)
326 FUTURE+PIER B AM Thu Feb 2, :07:34 Page 3-1 ICU 1(Loss as Cycle Length %) Method (Base Volume Alternative) Intersection #1 Pier B St & Pico Ave Cycle (sec): 100 Critical Vol./Cap.(X): Loss Time (sec): 10 (Y+R=4.0 sec) Average Delay (sec/veh): xxxxxx Optimal Cycle: 63 Level Of Service: C Street Name: Pier B St Pico Ave Control: Split Phase Split Phase Protected Protected Rights: Ignore Include Include Include Lanes: Base Vol: Initial Bse: User Adj: PHF Adj: PHF Volume: Reduced Vol: PCE Adj: MLF Adj: FinalVolume: Sat/Lane: Lanes: Final Sat.: Vol/Sat: Crit Moves: **** **** ****
327 FUTURE+PIER B AM Thu Feb 2, :07:34 Page 4-1 ICU 1(Loss as Cycle Length %) Method (Base Volume Alternative) Intersection #2 Pico Ave & Pier C St Cycle (sec): 100 Critical Vol./Cap.(X): Loss Time (sec): 10 (Y+R=4.0 sec) Average Delay (sec/veh): xxxxxx Optimal Cycle: 27 Level Of Service: A Control: Protected Protected Protected Protected Rights: Include Ignore Ovl Include Lanes: Base Vol: Initial Bse: User Adj: PHF Adj: PHF Volume: Reduced Vol: PCE Adj: MLF Adj: FinalVolume: Sat/Lane: Lanes: Final Sat.: Vol/Sat: Crit Moves: **** **** ****
328 FUTURE+PIER B AM Thu Feb 2, :07:34 Page HCM Operations Method (Base Volume Alternative) Intersection #3 Pico Ave & Pier D St/Water St Cycle (sec): 100 Critical Vol./Cap.(X): Loss Time (sec): 0 (Y+R=4.0 sec) Average Delay (sec/veh): 16.3 Optimal Cycle: 21 Level Of Service: B Control: Permitted Permitted Permitted Permitted Rights: Include Include Include Include Lanes: Base Vol: Initial Bse: User Adj: PHF Adj: PHF Volume: Reduced Vol: PCE Adj: MLF Adj: FinalVolume: Sat/Lane: Adjustment: Lanes: Final Sat.: Vol/Sat: Crit Moves: **** **** Green/Cycle: Volume/Cap: Uniform Del: IncremntDel: InitQueuDel: Delay Adj: Delay/Veh: User DelAdj: AdjDel/Veh: LOS by Move: B B A A B B B A A A A A HCM2kAvgQ: Note: Queue reported is the number of cars per lane.
329 FUTURE+PIER B AM Thu Feb 2, :07:34 Page HCM Operations Method (Base Volume Alternative) Intersection #4 Pico Ave & Pier E St/EB Ocean Ave Cycle (sec): 100 Critical Vol./Cap.(X): Loss Time (sec): 0 (Y+R=4.0 sec) Average Delay (sec/veh): 17.5 Optimal Cycle: 23 Level Of Service: B Control: Permitted Permitted Permitted Permitted Rights: Include Include Include Ignore Lanes: Base Vol: Initial Bse: User Adj: PHF Adj: PHF Volume: Reduced Vol: PCE Adj: MLF Adj: FinalVolume: Sat/Lane: Adjustment: Lanes: Final Sat.: Vol/Sat: Crit Moves: **** **** Green/Cycle: Volume/Cap: Uniform Del: IncremntDel: InitQueuDel: Delay Adj: Delay/Veh: User DelAdj: AdjDel/Veh: LOS by Move: C C C C C C A A A A A A HCM2kAvgQ: Note: Queue reported is the number of cars per lane.
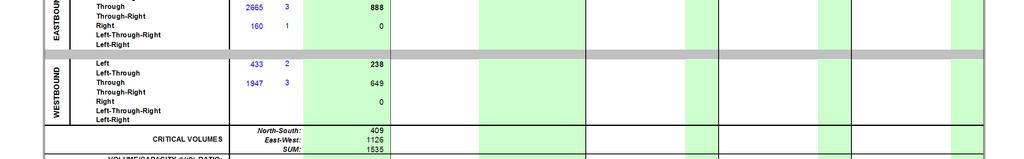
330
331 FUTURE+PIER B AM Thu Feb 2, :07:34 Page 11-1 ICU 1(Loss as Cycle Length %) Method (Base Volume Alternative) Intersection #7 Anaheim St & Farragut Av Cycle (sec): 100 Critical Vol./Cap.(X): Loss Time (sec): 10 (Y+R=4.0 sec) Average Delay (sec/veh): xxxxxx Optimal Cycle: 42 Level Of Service: B Control: Protected Protected Protected Protected Rights: Include Ovl Include Ovl Lanes: Base Vol: Initial Bse: User Adj: PHF Adj: PHF Volume: Reduced Vol: PCE Adj: MLF Adj: FinalVolume: OvlAdjVol: 27 Sat/Lane: Lanes: Final Sat.: Vol/Sat: OvlAdjV/S: 0.02 Crit Moves: **** **** ****
332 FUTURE+PIER B AM Thu Feb 2, :07:34 Page 12-1 ICU 1(Loss as Cycle Length %) Method (Base Volume Alternative) Intersection #8 Anaheim S & 1 St/West 9th St Cycle (sec): 100 Critical Vol./Cap.(X): Loss Time (sec): 10 (Y+R=4.0 sec) Average Delay (sec/veh): xxxxxx Optimal Cycle: 66 Level Of Service: C Control: Permitted Permitted Protected Protected Rights: Ignore Ignore Include Include Lanes: Base Vol: Initial Bse: User Adj: PHF Adj: PHF Volume: Reduced Vol: PCE Adj: MLF Adj: FinalVolume: Sat/Lane: Lanes: Final Sat.: Vol/Sat: Crit Moves: **** **** **** ****
333 FUTURE+PIER B AM Thu Feb 2, :07:34 Page HCM Unsignalized Method (Base Volume Alternative) Intersection #9 Pier B St & Edison Ave Average Delay (sec/veh): 1.1 Worst Case Level Of Service: B[ 13.2] Control: Stop Sign Stop Sign Uncontrolled Uncontrolled Rights: Include Include Include Include Lanes: Base Vol: Initial Bse: User Adj: PHF Adj: PHF Volume: FinalVolume: Critical Gap Module: Critical Gp: 6.8 xxxx 6.9 xxxxx xxxx xxxxx xxxxx xxxx xxxxx 4.1 xxxx xxxxx FollowUpTim: 3.5 xxxx 3.3 xxxxx xxxx xxxxx xxxxx xxxx xxxxx 2.2 xxxx xxxxx Capacity Module: Cnflict Vol: 620 xxxx 183 xxxx xxxx xxxxx xxxx xxxx xxxxx 366 xxxx xxxxx Potent Cap.: 425 xxxx 834 xxxx xxxx xxxxx xxxx xxxx xxxxx 1204 xxxx xxxxx Move Cap.: 419 xxxx 834 xxxx xxxx xxxxx xxxx xxxx xxxxx 1204 xxxx xxxxx Volume/Cap: 0.11 xxxx 0.02 xxxx xxxx xxxx xxxx xxxx xxxx 0.02 xxxx xxxx Level Of Service Module: 2Way95thQ: 0.4 xxxx 0.1 xxxx xxxx xxxxx xxxx xxxx xxxxx 0.1 xxxx xxxxx Control Del: 14.6 xxxx 9.4 xxxxx xxxx xxxxx xxxxx xxxx xxxxx 8.0 xxxx xxxxx LOS by Move: B * A * * * * * * A * * Movement: LT - LTR - RT LT - LTR - RT LT - LTR - RT LT - LTR - RT Shared Cap.: xxxx xxxx xxxxx xxxx xxxx xxxxx xxxx xxxx xxxxx xxxx xxxx xxxxx SharedQueue:xxxxx xxxx xxxxx xxxxx xxxx xxxxx xxxxx xxxx xxxxx 0.1 xxxx xxxxx Shrd ConDel:xxxxx xxxx xxxxx xxxxx xxxx xxxxx xxxxx xxxx xxxxx 8.0 xxxx xxxxx Shared LOS: * * * * * * * * * A * * ApproachDel: 13.2 xxxxxx xxxxxx xxxxxx ApproachLOS: B * * * Note: Queue reported is the number of cars per lane.
334 FUTURE+PIER B AM Thu Feb 2, :07:34 Page HCM 4-Way Stop Method (Base Volume Alternative) Intersection #10 Anaheim Way & Pier B St Cycle (sec): 100 Critical Vol./Cap.(X): Loss Time (sec): 0 (Y+R=4.0 sec) Average Delay (sec/veh): 19.0 Optimal Cycle: 0 Level Of Service: C Control: Stop Sign Stop Sign Stop Sign Stop Sign Rights: Include Include Include Include Lanes: Base Vol: Initial Bse: User Adj: PHF Adj: PHF Volume: Reduced Vol: PCE Adj: MLF Adj: FinalVolume: Lanes: Final Sat.: Vol/Sat: xxxx xxxx xxxx 0.18 xxxx 0.00 xxxx 0.62 xxxx xxxx Crit Moves: **** **** **** Delay/Veh: Delay Adj: AdjDel/Veh: LOS by Move: * * * B * * * C * * C A ApproachDel: xxxxxx Delay Adj: xxxxx ApprAdjDel: xxxxxx LOS by Appr: * B C C AllWayAvgQ: Note: Queue reported is the number of cars per lane.
335 FUTURE+PIER B MIDDAY Thu Feb 2, :07:36 Page 3-1 ICU 1(Loss as Cycle Length %) Method (Base Volume Alternative) Intersection #1 Pier B St & Pico Ave Cycle (sec): 100 Critical Vol./Cap.(X): Loss Time (sec): 10 (Y+R=4.0 sec) Average Delay (sec/veh): xxxxxx Optimal Cycle: 78 Level Of Service: D Street Name: Pier B St Pico Ave Control: Split Phase Split Phase Protected Protected Rights: Ignore Include Include Include Lanes: Base Vol: Initial Bse: User Adj: PHF Adj: PHF Volume: Reduced Vol: PCE Adj: MLF Adj: FinalVolume: Sat/Lane: Lanes: Final Sat.: Vol/Sat: Crit Moves: **** **** ****
336 FUTURE+PIER B MIDDAY Thu Feb 2, :07:36 Page 4-1 ICU 1(Loss as Cycle Length %) Method (Base Volume Alternative) Intersection #2 Pico Ave & Pier C St Cycle (sec): 100 Critical Vol./Cap.(X): Loss Time (sec): 10 (Y+R=4.0 sec) Average Delay (sec/veh): xxxxxx Optimal Cycle: 27 Level Of Service: A Control: Protected Protected Protected Protected Rights: Include Ignore Ovl Include Lanes: Base Vol: Initial Bse: User Adj: PHF Adj: PHF Volume: Reduced Vol: PCE Adj: MLF Adj: FinalVolume: OvlAdjVol: 0 Sat/Lane: Lanes: Final Sat.: Vol/Sat: OvlAdjV/S: 0.00 Crit Moves: **** **** ****
337 FUTURE+PIER B MIDDAY Thu Feb 2, :07:36 Page HCM Operations Method (Base Volume Alternative) Intersection #3 Pico Ave & Pier D St/Water St Cycle (sec): 100 Critical Vol./Cap.(X): Loss Time (sec): 0 (Y+R=4.0 sec) Average Delay (sec/veh): 16.0 Optimal Cycle: 22 Level Of Service: B Control: Permitted Permitted Permitted Permitted Rights: Include Include Include Include Lanes: Base Vol: Initial Bse: User Adj: PHF Adj: PHF Volume: Reduced Vol: PCE Adj: MLF Adj: FinalVolume: Sat/Lane: Adjustment: Lanes: Final Sat.: Vol/Sat: Crit Moves: **** **** Green/Cycle: Volume/Cap: Uniform Del: IncremntDel: InitQueuDel: Delay Adj: Delay/Veh: User DelAdj: AdjDel/Veh: LOS by Move: B B A A B B B A B A A A HCM2kAvgQ: Note: Queue reported is the number of cars per lane.
338 FUTURE+PIER B MIDDAY Thu Feb 2, :07:36 Page HCM Operations Method (Base Volume Alternative) Intersection #4 Pico Ave & Pier E St/EB Ocean Ave Cycle (sec): 100 Critical Vol./Cap.(X): Loss Time (sec): 0 (Y+R=4.0 sec) Average Delay (sec/veh): 17.5 Optimal Cycle: 22 Level Of Service: B Control: Permitted Permitted Permitted Permitted Rights: Include Include Include Ignore Lanes: Base Vol: Initial Bse: User Adj: PHF Adj: PHF Volume: Reduced Vol: PCE Adj: MLF Adj: FinalVolume: Sat/Lane: Adjustment: Lanes: Final Sat.: Vol/Sat: Crit Moves: **** **** Green/Cycle: Volume/Cap: Uniform Del: IncremntDel: InitQueuDel: Delay Adj: Delay/Veh: User DelAdj: AdjDel/Veh: LOS by Move: A C C C C C A A A A A A HCM2kAvgQ: Note: Queue reported is the number of cars per lane.

339
340 FUTURE+PIER B MIDDAY Thu Feb 2, :07:37 Page 11-1 ICU 1(Loss as Cycle Length %) Method (Base Volume Alternative) Intersection #7 Anaheim St & Farragut Av Cycle (sec): 100 Critical Vol./Cap.(X): Loss Time (sec): 10 (Y+R=4.0 sec) Average Delay (sec/veh): xxxxxx Optimal Cycle: 43 Level Of Service: B Control: Protected Protected Protected Protected Rights: Include Ovl Include Ovl Lanes: Base Vol: Initial Bse: User Adj: PHF Adj: PHF Volume: Reduced Vol: PCE Adj: MLF Adj: FinalVolume: OvlAdjVol: 37 Sat/Lane: Lanes: Final Sat.: Vol/Sat: OvlAdjV/S: 0.02 Crit Moves: **** **** ****
341 FUTURE+PIER B MIDDAY Thu Feb 2, :07:37 Page 12-1 ICU 1(Loss as Cycle Length %) Method (Base Volume Alternative) Intersection #8 Anaheim S & 1 St/West 9th St Cycle (sec): 100 Critical Vol./Cap.(X): Loss Time (sec): 10 (Y+R=4.0 sec) Average Delay (sec/veh): xxxxxx Optimal Cycle: 72 Level Of Service: D Control: Permitted Permitted Protected Protected Rights: Ignore Ignore Include Include Lanes: Base Vol: Initial Bse: User Adj: PHF Adj: PHF Volume: Reduced Vol: PCE Adj: MLF Adj: FinalVolume: Sat/Lane: Lanes: Final Sat.: Vol/Sat: Crit Moves: **** **** **** ****
342 FUTURE+PIER B MIDDAY Thu Feb 2, :07:37 Page HCM Unsignalized Method (Base Volume Alternative) Intersection #9 Pier B St & Edison Ave Average Delay (sec/veh): 0.8 Worst Case Level Of Service: C[ 15.5] Control: Stop Sign Stop Sign Uncontrolled Uncontrolled Rights: Include Include Include Include Lanes: Base Vol: Initial Bse: User Adj: PHF Adj: PHF Volume: FinalVolume: Critical Gap Module: Critical Gp: 6.8 xxxx 6.9 xxxxx xxxx xxxxx xxxxx xxxx xxxxx 4.1 xxxx xxxxx FollowUpTim: 3.5 xxxx 3.3 xxxxx xxxx xxxxx xxxxx xxxx xxxxx 2.2 xxxx xxxxx Capacity Module: Cnflict Vol: 751 xxxx 228 xxxx xxxx xxxxx xxxx xxxx xxxxx 456 xxxx xxxxx Potent Cap.: 351 xxxx 781 xxxx xxxx xxxxx xxxx xxxx xxxxx 1115 xxxx xxxxx Move Cap.: 345 xxxx 781 xxxx xxxx xxxxx xxxx xxxx xxxxx 1115 xxxx xxxxx Volume/Cap: 0.11 xxxx 0.01 xxxx xxxx xxxx xxxx xxxx xxxx 0.02 xxxx xxxx Level Of Service Module: 2Way95thQ: 0.4 xxxx 0.0 xxxx xxxx xxxxx xxxx xxxx xxxxx 0.1 xxxx xxxxx Control Del: 16.7 xxxx 9.7 xxxxx xxxx xxxxx xxxxx xxxx xxxxx 8.3 xxxx xxxxx LOS by Move: C * A * * * * * * A * * Movement: LT - LTR - RT LT - LTR - RT LT - LTR - RT LT - LTR - RT Shared Cap.: xxxx xxxx xxxxx xxxx xxxx xxxxx xxxx xxxx xxxxx xxxx xxxx xxxxx SharedQueue:xxxxx xxxx xxxxx xxxxx xxxx xxxxx xxxxx xxxx xxxxx 0.1 xxxx xxxxx Shrd ConDel:xxxxx xxxx xxxxx xxxxx xxxx xxxxx xxxxx xxxx xxxxx 8.3 xxxx xxxxx Shared LOS: * * * * * * * * * A * * ApproachDel: 15.5 xxxxxx xxxxxx xxxxxx ApproachLOS: C * * * Note: Queue reported is the number of cars per lane.
343 FUTURE+PIER B MIDDAY Thu Feb 2, :07:37 Page HCM 4-Way Stop Method (Base Volume Alternative) Intersection #10 Anaheim Way & Pier B St Cycle (sec): 100 Critical Vol./Cap.(X): Loss Time (sec): 0 (Y+R=4.0 sec) Average Delay (sec/veh): 24.7 Optimal Cycle: 0 Level Of Service: C Control: Stop Sign Stop Sign Stop Sign Stop Sign Rights: Include Include Include Include Lanes: Base Vol: Initial Bse: User Adj: PHF Adj: PHF Volume: Reduced Vol: PCE Adj: MLF Adj: FinalVolume: Lanes: Final Sat.: Vol/Sat: xxxx xxxx xxxx 0.13 xxxx 0.00 xxxx 0.73 xxxx xxxx Crit Moves: **** **** **** Delay/Veh: Delay Adj: AdjDel/Veh: LOS by Move: * * * B * * * C * * D A ApproachDel: xxxxxx Delay Adj: xxxxx ApprAdjDel: xxxxxx LOS by Appr: * B C D AllWayAvgQ: Note: Queue reported is the number of cars per lane.
344 FUTURE+PIER B PM Thu Feb 2, :07:39 Page 3-1 ICU 1(Loss as Cycle Length %) Method (Base Volume Alternative) Intersection #1 Pier B St & Pico Ave Cycle (sec): 100 Critical Vol./Cap.(X): Loss Time (sec): 10 (Y+R=4.0 sec) Average Delay (sec/veh): xxxxxx Optimal Cycle: 73 Level Of Service: D Street Name: Pier B St Pico Ave Control: Split Phase Split Phase Protected Protected Rights: Ignore Include Include Include Lanes: Base Vol: Initial Bse: User Adj: PHF Adj: PHF Volume: Reduced Vol: PCE Adj: MLF Adj: FinalVolume: Sat/Lane: Lanes: Final Sat.: Vol/Sat: Crit Moves: **** **** ****
345 FUTURE+PIER B PM Thu Feb 2, :07:39 Page 4-1 ICU 1(Loss as Cycle Length %) Method (Base Volume Alternative) Intersection #2 Pico Ave & Pier C St Cycle (sec): 100 Critical Vol./Cap.(X): Loss Time (sec): 10 (Y+R=4.0 sec) Average Delay (sec/veh): xxxxxx Optimal Cycle: 28 Level Of Service: A Control: Protected Protected Protected Protected Rights: Include Ignore Ovl Include Lanes: Base Vol: Initial Bse: User Adj: PHF Adj: PHF Volume: Reduced Vol: PCE Adj: MLF Adj: FinalVolume: OvlAdjVol: 0 Sat/Lane: Lanes: Final Sat.: Vol/Sat: OvlAdjV/S: 0.00 Crit Moves: **** **** ****
346 FUTURE+PIER B PM Thu Feb 2, :07:39 Page HCM Operations Method (Base Volume Alternative) Intersection #3 Pico Ave & Pier D St/Water St Cycle (sec): 100 Critical Vol./Cap.(X): Loss Time (sec): 0 (Y+R=4.0 sec) Average Delay (sec/veh): 15.1 Optimal Cycle: 21 Level Of Service: B Control: Permitted Permitted Permitted Permitted Rights: Include Include Include Include Lanes: Base Vol: Initial Bse: User Adj: PHF Adj: PHF Volume: Reduced Vol: PCE Adj: MLF Adj: FinalVolume: Sat/Lane: Adjustment: Lanes: Final Sat.: Vol/Sat: Crit Moves: **** **** Green/Cycle: Volume/Cap: Uniform Del: IncremntDel: InitQueuDel: Delay Adj: Delay/Veh: User DelAdj: AdjDel/Veh: LOS by Move: B B A A B B B A B A A A HCM2kAvgQ: Note: Queue reported is the number of cars per lane.
347 FUTURE+PIER B PM Thu Feb 2, :07:39 Page HCM Operations Method (Base Volume Alternative) Intersection #4 Pico Ave & Pier E St/EB Ocean Ave Cycle (sec): 100 Critical Vol./Cap.(X): Loss Time (sec): 0 (Y+R=4.0 sec) Average Delay (sec/veh): 16.4 Optimal Cycle: 30 Level Of Service: B Control: Permitted Permitted Permitted Permitted Rights: Include Include Include Ignore Lanes: Base Vol: Initial Bse: User Adj: PHF Adj: PHF Volume: Reduced Vol: PCE Adj: MLF Adj: FinalVolume: Sat/Lane: Adjustment: Lanes: Final Sat.: Vol/Sat: Crit Moves: **** **** Green/Cycle: Volume/Cap: Uniform Del: IncremntDel: InitQueuDel: Delay Adj: Delay/Veh: User DelAdj: AdjDel/Veh: LOS by Move: B B B C B B B B B B B A HCM2kAvgQ: Note: Queue reported is the number of cars per lane.
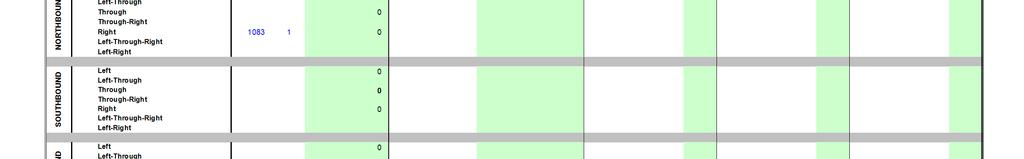
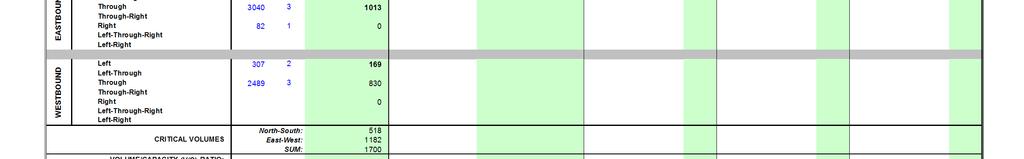
348
Section 3.12 Traffic and Transportation
 Section. Traffic and Transportation SECTION SUMMARY This section describes existing ground transportation within the Port and surrounding area associated with implementation of the proposed Project. An
APPENDIX B Traffic Analysis
 APPENDIX B Traffic Analysis Rim of the World Unified School District Reconfiguration Prepared for: Rim of the World School District 27315 North Bay Road, Blue Jay, CA 92317 Prepared by: 400 Oceangate,
Table Existing Traffic Conditions for Arterial Segments along Construction Access Route. Daily
 5.8 TRAFFIC, ACCESS, AND CIRCULATION This section describes existing traffic conditions in the project area; summarizes applicable regulations; and analyzes the potential traffic, access, and circulation
IV. ENVIRONMENTAL IMPACT ANALYSIS J. TRANSPORTATION AND TRAFFIC
 IV. ENVIRONMENTAL IMPACT ANALYSIS J. TRANSPORTATION AND TRAFFIC This Section summarizes the information provided in the Traffic Study for the Santa Monica College Bundy Campus Master Plan (Traffic Study),
EXECUTIVE SUMMARY. The following is an outline of the traffic analysis performed by Hales Engineering for the traffic conditions of this project.
 EXECUTIVE SUMMARY This study addresses the traffic impacts associated with the proposed Shopko redevelopment located in Sugarhouse, Utah. The Shopko redevelopment project is located between 1300 East and
Appendix Q Traffic Study
 Appendices Appendix Q Traffic Study Crummer Site Subdivision Draft EIR City of Malibu Appendices This page intentionally left blank. The Planning Center April 2013 TRAFFIC IMPACT ANALYSIS Photo z here
The major roadways in the study area are State Route 166 and State Route 33, which are shown on Figure 1-1 and described below:
 3.5 TRAFFIC AND CIRCULATION 3.5.1 Existing Conditions 3.5.1.1 Street Network DRAFT ENVIRONMENTAL IMPACT REPORT The major roadways in the study area are State Route 166 and State Route 33, which are shown
Appendix C. Traffic Study
 Appendix C Traffic Study TABLE OF CONTENTS SECTION Executive Summary PAGE 1.0 Introduction... 1 1.1 Scope of Work... 1 1.2 Study Area... 2 2.0 Project Description... 3 2.1 Site Access... 4 2.2 Pedestrian
TRANSPORTATION STUDY FOR THE 8899 BEVERLY BOULEVARD PROJECT
 DRAFT TRANSPORTATION STUDY FOR THE 8899 BEVERLY BOULEVARD PROJECT WEST HOLLYWOOD, CALIFORNIA NOVEMBER 2013 PREPARED FOR BEVERLY BOULEVARD ASSOCIATION PREPARED BY DRAFT TRANSPORTATION STUDY FOR THE 8899
Traffic Impact Analysis 5742 BEACH BOULEVARD MIXED USE PROJECT
 Traffic Impact Analysis 5742 BEACH BOULEVARD MIXED USE PROJECT CITY OF BUENA PARK Prepared by Project No. 14139 000 April 17 th, 2015 DKS Associates Jeffrey Heald, P.E. Rohit Itadkar, T.E. 2677 North Main
Appendix G Traffic Study Methodology
 REVISED DRAFT ENVIRONMENTAL IMPACT REPORT/ Appendix G Traffic Forecasting Model Methodology In addition to the existing/baseline condition (year 2005), a level of service (LOS) analysis was conducted for
Traffic Impact Analysis for 2171 Rosecrans Avenue
 Traffic Impact Analysis for 2171 Rosecrans Avenue Prepared for: Continental Development Corporation Revised May 2016 LA16-2831 Prepared by: Fehr & Peers 600 Wilshire Blvd, Suite 1050 Los Angeles, CA 90017
2. Valley Circle Boulevard/Andora Avenue/Baden Avenue and Lassen Street
 IV.J TRANSPORTATION 1. INTRODUCTION This section presents an overview of the existing traffic and circulation system in and surrounding the project site. This section also discusses the potential impacts
Section 5.8 Transportation and Traffic
 Section 5.8 Transportation and Traffic 5.8 TRANSPORTATION AND TRAFFIC Generous This Section is based on the Topgolf Specific Plan Traffic Impact Analysis (RK Engineering Group, Inc., October 31, 2016);
IV. ENVIRONMENTAL IMPACT ANALYSIS B. TRAFFIC AND CIRCULATION
 IV. ENVIRONMENTAL IMPACT ANALYSIS B. TRAFFIC AND CIRCULATION 1. INTRODUCTION This section is based on the technical report, Traffic Study for 10131 Constellation Boulevard Residential Project, prepared
TABLE OF CONTENTS SECTION PAGE. Executive Summary... xii
 TABLE OF CONTENTS SECTION PAGE Executive Summary... xii 1.0 Introduction... 1 1.1 Study Area... 2 1.2 Traffic Impact Analysis Scenarios... 4 1.3 Study Area - City of Orange... 4 2.0 Project Description
Date: February 7, 2017 John Doyle, Z-Best Products Robert Del Rio. T.E. Z-Best Traffic Operations and Site Access Analysis
 Memorandum Date: February 7, 07 To: From: Subject: John Doyle, Z-Best Products Robert Del Rio. T.E. Z-Best Traffic Operations and Site Access Analysis Introduction Hexagon Transportation Consultants, Inc.
Appendix B Traffic Impact Analysis, Asphalt Plant No. 1 Replacement and Modernization
 Appendix B Traffic Impact Analysis, Asphalt Plant No. 1 Replacement and Modernization REPORT Traffic Impact Analysis, Asphalt Plant No. 1 Replacement and Modernization Prepared for City of Los Angeles
Appendix B Traffic Impact Analysis, Asphalt Plant No. 1 Replacement and Modernization
 Appendix B Traffic Impact Analysis, Asphalt Plant No. 1 Replacement and Modernization DRAFT REPORT Traffic Impact Analysis, Asphalt Plant No. 1 Replacement and Modernization Prepared for City of Los Angeles
Traffic Impact Study Speedway Gas Station Redevelopment
 Traffic Impact Study Speedway Gas Station Redevelopment Warrenville, Illinois Prepared For: Prepared By: April 11, 2018 Table of Contents 1. Introduction... 1 2. Existing Conditions... 4 Site Location...
King Soopers #116 Thornton, Colorado
 Traffic Impact Study King Soopers #116 Thornton, Colorado Prepared for: Galloway & Company, Inc. T R A F F I C I M P A C T S T U D Y King Soopers #116 Thornton, Colorado Prepared for Galloway & Company
LAWRENCE TRANSIT CENTER LOCATION ANALYSIS 9 TH STREET & ROCKLEDGE ROAD / 21 ST STREET & IOWA STREET LAWRENCE, KANSAS
 LAWRENCE TRANSIT CENTER LOCATION ANALYSIS 9 TH STREET & ROCKLEDGE ROAD / 21 ST STREET & IOWA STREET LAWRENCE, KANSAS TRAFFIC IMPACT STUDY FEBRUARY 214 OA Project No. 213-542 TABLE OF CONTENTS 1. INTRODUCTION...
APPENDIX G TRAFFIC STUDY TECHNICAL MEMORANDUM
 APPENDIX G TRAFFIC STUDY TECHNICAL MEMORANDUM TECHNICAL MEMORANDUM To: From: Date: Subject: Jerry Flores - AECOM Brian A. Marchetti, AICP September 9, 5 DRAFT Traffic Study LABOE Channel 5 Studio Relocation
4.7 Construction Surface Transportation
 4.7 Construction Surface Transportation 4.7.1 Introduction The traffic analysis presented in this section addresses the construction traffic impacts specific to the proposed Project. The construction traffic
The key roadways in the project vicinity are described below. Exhibit displays the existing number of lanes on the study roadways.
 4.2 TRAFFIC AND CIRCULATION This section presents the key assumptions, methods, and results of analysis for the transportation and circulation impacts of the proposed project. This section is based on
Traffic Engineering Study
 Traffic Engineering Study Bellaire Boulevard Prepared For: International Management District Technical Services, Inc. Texas Registered Engineering Firm F-3580 November 2009 Executive Summary has been requested
Clean Harbors Canada, Inc.
 Clean Harbors Canada, Inc. Proposed Lambton Landfill Expansion Environmental Assessment Terms of Reference Transportation Assessment St. Clair Township, Ontario September 2009 itrans Consulting Inc. 260
Escondido Marriott Hotel and Mixed-Use Condominium Project TRAFFIC IMPACT ANALYSIS REPORT
 Escondido Marriott Hotel and Mixed-Use Condominium Project TRAFFIC IMPACT ANALYSIS REPORT Prepared for Phelps Program Management 420 Sixth Avenue, Greeley, CO 80632 Prepared by 5050 Avenida Encinas, Suite
INDUSTRIAL DEVELOPMENT
 INDUSTRIAL DEVELOPMENT Traffic Impact Study Plainfield, Illinois August 2018 Prepared for: Seefried Industrial Properties, Inc. TABLE OF CONTENTS Executive Summary 2 Introduction 3 Existing Conditions
2.1.5 Traffic and Circulation. Table Level of Service Criteria for Highway Segment Regulatory Setting Affected Environment
 2.1.5 Traffic and Circulation This section addresses the potential impacts to traffic and circulation associated with construction and long-term operation of the proposed project. The traffic and circulation
4.7 Construction Surface Transportation
 4.7.1 Introduction The traffic analysis presented in this section addresses the construction traffic impacts specific to the proposed Project. The construction traffic impacts were analyzed for both the
MINERVA PARK SITE TRAFFIC IMPACT STUDY M/I HOMES. September 2, 2015
 5500 New Albany Road Columbus, Ohio 43054 Phone: 614.775.4500 Fax: 614.775.4800 Toll Free: 1-888-775-EMHT emht.com 2015-1008 MINERVA PARK SITE TRAFFIC IMPACT STUDY M/I HOMES September 2, 2015 Engineers
King County Metro. Columbia Street Transit Priority Improvements Alternative Analysis. Downtown Southend Transit Study. May 2014.
 King County Metro Columbia Street Transit Priority Improvements Alternative Analysis Downtown Southend Transit Study May 2014 Parametrix Table of Contents Introduction... 1 Methodology... 1 Study Area...
APPENDIX C1 TRAFFIC ANALYSIS DESIGN YEAR TRAFFIC ANALYSIS
 APPENDIX C1 TRAFFIC ANALYSIS DESIGN YEAR TRAFFIC ANALYSIS DESIGN YEAR TRAFFIC ANALYSIS February 2018 Highway & Bridge Project PIN 6754.12 Route 13 Connector Road Chemung County February 2018 Appendix
Alpine Highway to North County Boulevard Connector Study
 Alpine Highway to North County Boulevard Connector Study prepared by Avenue Consultants March 16, 2017 North County Boulevard Connector Study March 16, 2017 Table of Contents 1 Summary of Findings... 1
Traffic Impact Analysis West Street Garden Plots Improvements and DuPage River Park Garden Plots Development Naperville, Illinois
 Traffic Impact Analysis West Street Garden Plots Improvements and DuPage River Park Garden Plots Development Naperville, Illinois Submitted by April 9, 2009 Introduction Kenig, Lindgren, O Hara, Aboona,
MEMORANDUM. Figure 1. Roundabout Interchange under Alternative D
 MEMORANDUM Date: To: Liz Diamond, Dokken Engineering From: Subject: Dave Stanek, Fehr & Peers Western Placerville Interchanges 2045 Analysis RS08-2639 Fehr & Peers has completed a transportation analysis
APPENDIX J LAKE WOHLFORD DAM REPLACEMENT PROJECT TRAFFIC IMPACT ANALYSIS (DAM REPLACEMENT) Lake Wohlford Dam Replacement Project EIR
 Lake Wohlford Dam Replacement Project EIR") APPENDIX J LAKE WOHLFORD DAM REPLACEMENT PROJECT TRAFFIC IMPACT ANALYSIS (DAM REPLACEMENT) Replacement Project EIR Appendices TRAFFIC IMPACT ANALYSIS LAKE WOHLFORD DAM Escondido, California December 19,
APPENDIX J LAKE WOHLFORD DAM REPLACEMENT PROJECT TRAFFIC IMPACT ANALYSIS (DAM REPLACEMENT) Replacement Project EIR Appendices TRAFFIC IMPACT ANALYSIS LAKE WOHLFORD DAM Escondido, California December 19,
Impacts to street segments were analyzed based on procedures detailed in the Highway Capacity Manual for levels of service related to roadways.
 4.7 Transportation and Circulation This report documents the results of a study of the potential traffic impacts created by the Whittier Main Oil Field Development Project. The study is included as Appendix
Transportation & Traffic Engineering
 Transportation & Traffic Engineering 1) Project Description This report presents a summary of findings for a Traffic Impact Analysis (TIA) performed by A+ Engineering, Inc. for the Hill Country Family
IRSCH REEN Hirsch/Green Transportation Consulting, Inc.
 IRSCH REEN Hirsch/Green Transportation Consulting, Inc. February 6, 2013 Mr. David Weil Director of Finance St. Matthew s Parish School 1031 Bienveneda Avenue Pacific Palisades, California 90272 RE: Trip
3.8 TRANSPORTATION, CIRCULATION AND PARKING
 3.8 TRANSPORTATION, CIRCULATION AND PARKING This section provides an overview of traffic, circulation and parking impacts and evaluates the construction and operational impacts associated with the Proposed
Oakbrook Village Plaza City of Laguna Hills
 Oakbrook Village Plaza City of Laguna Hills Traffic Impact Analysis Prepared by: HDR Engineering 3230 El Camino Real, Suite 200 Irvine, CA 92602 October 2012 Revision 3 D-1 Oakbrook Village Plaza Laguna
APPENDIX E. Traffic Analysis Report
 APPENDIX E Traffic Analysis Report THIS PAGE INTENTIONALLY BLANK EAGLE RIVER TRAFFIC MITIGATION PHASE I OLD GLENN HIGHWAY/EAGLE RIVER ROAD INTERSECTION IMPROVEMENTS TRAFFIC ANALYSIS Eagle River, Alaska
Appendix H TRAFFIC IMPACT ANALYSIS
 Appendix H TRAFFIC IMPACT ANALYSIS Teichert Boca Quarry Expansion Traffic Impact Analysis Prepared for Teichert Aggregates Prepared by TRANSPORTATION CONSULTANTS, INC. LSC Transportation Consultants, Inc.
West Hills Shopping Centre Lowe s Expansion Traffic Impact Study
 West Hills Shopping Centre Lowe s Expansion Traffic Impact Study Prepared for: Armel Corporation January 2015 Paradigm Transportation Solutions Ltd. 22 King Street South, Suite 300 Waterloo ON N2J 1N8
BERKELEY DOWNTOWN AREA PLAN PROGRAM ENVIRONMENTAL IMPACT REPORT TRAFFIC IMPACT ANALYSIS
 BERKELEY DOWNTOWN AREA PLAN PROGRAM ENVIRONMENTAL IMPACT REPORT TRAFFIC IMPACT ANALYSIS Prepared for: City of Berkeley Prepared by: REVISED JANUARY 9, 2009 Berkeley Downtown Area Plan Program EIR Traffic
IV. ENVIRONMENTAL IMPACT ANALYSIS N. TRANSPORTATION AND TRAFFIC
 IV. ENVIRONMENTAL IMPACT ANALYSIS N. TRANSPORTATION AND TRAFFIC The following section summarizes the information provided in the traffic report entitled Traffic Impact Analysis for a Proposed Residential
Section 5.0 Traffic Information
 Section 5.0 Traffic Information 10.0 TRANSPORTATION MDM Transportation Consultants, Inc. (MDM) has prepared an evaluation of transportation impacts for the proposed evaluation for the expansion of the
TIMBERVINE TRANSPORTATION IMPACT STUDY FORT COLLINS, COLORADO JANUARY Prepared for:
 TIMBERVINE TRANSPORTATION IMPACT STUDY FORT COLLINS, COLORADO JANUARY 2014 Prepared for: Hartford Companies 1218 W. Ash Street Suite A Windsor, Co 80550 Prepared by: DELICH ASSOCIATES 2272 Glen Haven Drive
TRAFFIC IMPACT ANALYSIS
 TRAFFIC IMPACT ANALYSIS Emerald Isle Commercial Development Prepared by SEPI Engineering & Construction Prepared for Ark Consulting Group, PLLC March 2016 I. Executive Summary A. Site Location The Emerald
Bennett Pit. Traffic Impact Study. J&T Consulting, Inc. Weld County, Colorado. March 3, 2017
 Bennett Pit Traffic Impact Study J&T Consulting, Inc. Weld County, Colorado March 3, 217 Prepared By: Sustainable Traffic Solutions, Inc. http://www.sustainabletrafficsolutions.com/ Joseph L. Henderson,
Gerald Desmond Bridge Replacement Project
 Traffic Impact Analysis Gerald Desmond Bridge Replacement Project Conducted for and By October 29 Traffic Impact Analysis Gerald Desmond Bridge Replacement Project Conducted for and October 29 By 7 Carnegie
APPENDIX C-2. Traffic Study Supplemental Analysis Memo
 APPENDIX C-2 Traffic Study Supplemental Analysis Memo The Mobility Group Transportation Strategies & Solutions Memorandum To: From: Subject: Tomas Carranza, LADOT Matthew Simons Traffic Review - Revised
Quantitative analyses of weekday a.m. and p.m. commuter hour conditions have been conducted for the following five scenarios:
 6.1 TRANSPORTATION AND CIRCULATION 6.1.1 INTRODUCTION This section of the EIR presents the results of TJKM s traffic impact analysis of the proposed Greenbriar Development. The analysis includes consideration
APPENDIX H. Transportation Impact Study
 APPENDIX H Transportation Impact Study BUENA VISTA LAGOON ENHANCEMENT PROJECT TRANSPORTATION IMPACT STUDY Prepared for: San Diego Association of Governments Prepared by: VRPA Technologies, Inc. 9520 Padgett
5.9 TRANSPORTATION AND TRAFFIC
 5.9 TRANSPORTATION AND TRAFFIC This section evaluates transportation- and traffic-related impacts that have the potential to result from the construction and operation of the Project. Information and analysis
TRAFFIC IMPACT STUDY. USD #497 Warehouse and Bus Site
 TRAFFIC IMPACT STUDY for USD #497 Warehouse and Bus Site Prepared by: Jason Hoskinson, PE, PTOE BG Project No. 16-12L July 8, 216 145 Wakarusa Drive Lawrence, Kansas 6649 T: 785.749.4474 F: 785.749.734
IV. ENVIRONMENTAL IMPACT ANALYSIS L. TRANSPORTATION/TRAFFIC
 IV. ENVIRONMENTAL IMPACT ANALYSIS L. TRANSPORTATION/TRAFFIC INTRODUCTION The following section summarizes the information provided in the traffic report entitled Traffic Impact Analysis for a Proposed
Traffic Impact Study for Proposed Olive Boulevard Development
 Traffic Impact Study for Proposed 11330 Olive Boulevard Development Creve Coeur, Missouri July 7, 2017 Prepared For: 11330 Olive Boulevard Development 11330 Olive Boulevard Creve Coeur, Missouri 63141
Appendix G Traffic and Parking Report
 Appendix G Traffic and Parking Report TABLE OF CONTENTS SECTION PAGE Executive Summary... v 1.0 Introduction... 1 1.1 Study Area... 3 2.0 Project Description... 4 2.1 Site Location... 4 2.2 Existing Project
NEWCASTLE MIDDLE SCHOOL Traffic Impact Analysis
 Gibson Traffic Consultants 2802 Wetmore Avenue Suite 220 Everett, WA 98201 425.339.8266 NEWCASTLE MIDDLE SCHOOL Traffic Impact Analysis Prepared for: Renton School District Jurisdiction: City of Newcastle
Middle Harbor Project: Draft EIS/EIR LA Chamber of Commerce June 26, 2008, APM Maersk HQ Pier 400
 Middle Harbor Project: Draft EIS/EIR LA Chamber of Commerce June 26, 2008, APM Maersk HQ Pier 400 Richard D. Cameron Director of Environmental Planning, Port of Long Beach CEQA/NEPA Process Summary The
Volume 1 Traffic Impact Analysis Turtle Creek Boulevard Dallas, Texas. Kimley-Horn and Associates, Inc. Dallas, Texas.
 Volume 1 Traffic Impact Analysis 2727 Dallas, Texas June 18, 2018 Kimley-Horn and Associates, Inc. Dallas, Texas Project #064523000 Registered Firm F-928 Traffic Impact Analysis 2727 Dallas, Texas Prepared
MEMO VIA . Ms. Amy Roth DPS Director, City of Three Rivers. To:
 MEMO To: Ms. Amy Roth DPS Director, City of Three Rivers VIA EMAIL From: Michael J. Labadie, PE Julie M. Kroll, PE, PTOE Brandon Hayes, PE, P.Eng. Fleis & VandenBrink Date: January 5, 2017 Re: Proposed
IV. ENVIRONMENTAL IMPACT ANALYSIS H. TRANSPORTATION/TRAFFIC
 IV. ENVIRONMENTAL IMPACT ANALYSIS H. TRANSPORTATION/TRAFFIC The following summarizes the information provided in the traffic report prepared by Fehr & Peers/Kaku Associates entitled, Traffic Study for
Traffic Impact Analysis. Alliance Cole Avenue Residential Site Dallas, Texas. Kimley-Horn and Associates, Inc. Dallas, Texas.
 Traffic Impact Analysis Alliance Cole Avenue Residential Site Dallas, Texas February 15, 2018 Kimley-Horn and Associates, Inc. Dallas, Texas Project #064524900 Registered Firm F-928 Traffic Impact Analysis
TRAFFIC IMPACT STUDY DERRY GREEN CORPORATE BUSINESS PARK MILTON SECONDARY PLAN MODIFICATION
 TRAFFIC IMPACT STUDY DERRY GREEN CORPORATE BUSINESS PARK MILTON SECONDARY PLAN MODIFICATION TRAFFIC IMPACT STUDY DERRY GREEN CORPORATE BUSINESS PARK MILTON SECONDARY PLAN MODIFICATION DECEMBER 24 UPDATED
Executive Summary. Draft Environmental Impact Statement/Environmental Impact Report ES-1
 Executive Summary Introduction The Eastside Transit Corridor Phase 2 Project is a vital public transit infrastructure investment that would provide a transit connection to the existing Metro Gold Line
Highway 18 BNSF Railroad Overpass Feasibility Study Craighead County. Executive Summary
 Highway 18 BNSF Railroad Overpass Feasibility Study Craighead County Executive Summary October 2014 Highway 18 BNSF Railroad Overpass Feasibility Study Craighead County Executive Summary October 2014 Prepared
1.1 Purpose of This Environmental Impact Report EIR Process Use of This Report Report Organization...
 Table of Contents SUMMARY PAGE S.1 Project Location and Project Characteristics... S-1 S.2 Project Objectives... S-9 S.3 Project Approvals... S-11 S.4 Impacts and Mitigation Measures... S-12 S.5 Alternatives...
Shirk Road at State Route 198 Interchange Analysis Tulare County, California
 Shirk Road at State Route 198 Interchange Analysis Tulare County, California DRAFT REPORT Prepared By Tulare County Association of Governments (TCAG) April 2013 Table of Contents Introduction:... 3 Project
ZINFANDEL LANE / SILVERADO TRAIL INTERSECTION TRAFFIC ANALYSIS
 ZINFANDEL LANE / SILVERADO TRAIL INTERSECTION TRAFFIC ANALYSIS UPDATED TRAFFIC STUDY FOR THE PROPOSED RAYMOND VINEYARDS WINERY USE PERMIT MODIFICATION #P11-00156 AUGUST 5, 2014 PREPARED BY: OMNI-MEANS,
Los Angeles Mission College Facilities Master Plan Draft Program Environmental Impact Report 3.13 TRANSPORTATION / TRAFFIC
 3.13 TRANSPORTATION / TRAFFIC As a result of the analysis undertaken in the Initial Study for the Los Angeles Mission College Facilities Master Plan, the (LACCD) determined that the proposed project may
Vanier Parkway and Presland Road Residential Development Transportation Impact Study
 Vanier Parkway and Presland Road Residential Development Transportation Impact Study Final Report (Revised) March 2011 Submitted to: Groupe Lépine Ottawa Project No. 09-1613 Submitted by: Groupe Lépine
Table of Contents INTRODUCTION... 3 PROJECT STUDY AREA Figure 1 Vicinity Map Study Area... 4 EXISTING CONDITIONS... 5 TRAFFIC OPERATIONS...
 Crosshaven Drive Corridor Study City of Vestavia Hills, Alabama Table of Contents INTRODUCTION... 3 PROJECT STUDY AREA... 3 Figure 1 Vicinity Map Study Area... 4 EXISTING CONDITIONS... 5 TRAFFIC OPERATIONS...
Introduction Environmental Setting. Section 3.10 Transportation/Circulation Regional and Local Access
 Section.0 Transportation/Circulation Section.0 Transportation/Circulation 0 0 0.0. Introduction This section summarizes the transportation/circulation impact analysis for the proposed Southern California
L1TILE BEARS DAY CARE TRANSPORTATION IMPACT STUDY FORT COLLINS, COLORADO MAY Prepared for:
 L1TILE BEARS DAY CARE TRANSPORTATION IMPACT STUDY FORT COLLINS, COLORADO MAY 2012 Prepared for: Hillside Construction, Inc. 216 Hemlock Street, Suite B Fort Collins, CO 80534 Prepared by: DELICH ASSOCIATES
MONTEREY BAY AQUARIUM RESEARCH INSTITUTE (MBARI) MASTER PLAN UPDATE MOSS LANDING, CALIFORNIA
 MASTER PLAN UPDATE MOSS LANDING, CALIFORNIA") MONTEREY BAY AQUARIUM RESEARCH INSTITUTE (MBARI) MASTER PLAN UPDATE MOSS LANDING, CALIFORNIA TRAFFIC IMPACT ANALYSIS Administrative Draft Report Prepared For Monterey Bay Aquarium Research Institute Moss
MONTEREY BAY AQUARIUM RESEARCH INSTITUTE (MBARI) MASTER PLAN UPDATE MOSS LANDING, CALIFORNIA TRAFFIC IMPACT ANALYSIS Administrative Draft Report Prepared For Monterey Bay Aquarium Research Institute Moss
4.14 TRANSPORTATION AND CIRCULATION
 4.14 TRANSPORTATION AND CIRCULATION 4.14.1 Summary Table 4.14-1 summarizes the identified environmental impacts, proposed mitigation measures, and residual impacts of the proposed project with regard to
TRANSPORTATION 1. INTRODUCTION
 IV.F TRANSPORTATION 1. INTRODUCTION This section evaluates potential impacts associated with Project-related traffic, circulation, and access. The analysis summarizes the findings of the traffic study
Diablo Vista Pumping Plant Replacement
 Diablo Vista Pumping Plant Replacement Traffic Study PHA Transportation Consultants 12-05-359 October 2012 Diablo Vista Pumping Plant Replacement Traffic Study For EBMUD October 2012 PHA Transportation
TRAFFIC IMPACT STUDY FOR SONIC DRIVE-IN RESTAURANT. Vallejo, CA. Prepared For:
 TRAFFIC IMPACT STUDY FOR SONIC DRIVE-IN RESTAURANT Vallejo, CA Prepared For: ELITE DRIVE-INS, INC. 2190 Meridian Park Blvd, Suite G Concord, CA 94520 Prepared By: KD Anderson & Associates 3853 Taylor Road,
MEMORANDUM. Project Description. Operational Trip Generation. Construction Trip Generation. Date: August 12, 2014 TG: To: From: Subject:
 MEMORANDUM Date: August 12, 2014 TG: 13329.01 To: From: Subject: Jeremy Krout EPD Solutions Inc. Rafik Albert EPD Solutions Inc. Rawad Hani Transpo Group AP North Lake Solar Project Traffic Scoping The
Prepared For: Toronto Transit Commission 1138 Bathurst Street Toronto, Ontario M5R 3H2. Prepared By:
 TRAFFIC IMPACT STUDY FOR THE TTC MCNICOLL BUS GARAGE CITY OF TORONTO Prepared For: Toronto Transit Commission 1138 Bathurst Street Toronto, Ontario M5R 3H2 Prepared By: Canada Inc. 4th Floor, 3 Leek Crescent
BROWARD BOULEVARD CORRIDOR TRANSIT STUDY
 BROWARD BOULEVARD CORRIDOR TRANSIT STUDY FM # 42802411201 EXECUTIVE SUMMARY July 2012 GOBROWARD Broward Boulevard Corridor Transit Study FM # 42802411201 Executive Summary Prepared For: Ms. Khalilah Ffrench,
PROJECT: Wilkinson Road Corridor Improvement Traffic Management Planning Project SUBJECT: Traffic Analysis
 TECHNICAL MEMORANDUM DATE: September 10, 2014 PROJECT 5861.03 NO: PROJECT: Wilkinson Road Corridor Improvement Traffic Management Planning Project SUBJECT: Traffic Analysis TO: Steve Holroyd - District
Subarea Study. Manning Avenue (CSAH 15) Corridor Management and Safety Improvement Project. Final Version 1. Washington County.
 Corridor Management and Safety Improvement Project. Final Version 1. Washington County.") Subarea Study Manning Avenue (CSAH 15) Corridor Management and Safety Improvement Project Final Version 1 Washington County June 12, 214 SRF No. 138141 Table of Contents Introduction... 1 Forecast Methodology
Subarea Study Manning Avenue (CSAH 15) Corridor Management and Safety Improvement Project Final Version 1 Washington County June 12, 214 SRF No. 138141 Table of Contents Introduction... 1 Forecast Methodology
Parks and Transportation System Development Charge Methodology
 City of Sandy Parks and Transportation System Development Charge Methodology March, 2016 Background In order to implement a City Council goal the City of Sandy engaged FCS Group in January of 2015 to update
MILLERSVILLE PARK TRAFFIC IMPACT ANALYSIS ANNE ARUNDEL COUNTY, MARYLAND
 MILLERSVILLE PARK TRAFFIC IMPACT ANALYSIS ANNE ARUNDEL COUNTY, MARYLAND Prepared for: Department of Public Works Anne Arundel County Prepared by: URS Corporation 4 North Park Drive, Suite 3 Hunt Valley,
DRAFT TRANSPORTATION IMPACT STUDY CASTILIAN REDEVELOPMENT PROJECT
 DRAFT TRANSPORTATION IMPACT STUDY CASTILIAN REDEVELOPMENT PROJECT Prepared for: Submitted by: 299 Lava Ridge Ct. Suite 2 Roseville, CA. 95661 June 212 TABLE OF CONTENTS 1. Introduction... 1 Project Location
MERIVALE PRIORITY SQUARE 2852 MERIVALE ROAD CITY OF OTTAWA TRANSPORTATION BRIEF. Prepared for: ONT Inc. 25 Winding Way Nepean, Ontario K2C 3H1
 MERIVALE PRIORITY SQUARE 2852 MERIVALE ROAD CITY OF OTTAWA TRANSPORTATION BRIEF Prepared for: 2190986ONT Inc. 25 Winding Way Nepean, Ontario K2C 3H1 October 6, 2010 110-502 Report_1.doc D. J. Halpenny
TRAFFIC PARKING ANALYSIS
 TRAFFIC PARKING ANALYSIS NAPA FLEA MARKET COUNTY OF NAPA Prepared for: Tom Harding Napa-Vallejo Flea Market 33 Kelly Road American Canyon, CA 9453 Prepared by: 166 Olympic Boulevard, Suite 21 Walnut Creek,
IV. REVISIONS TO THE DRAFT IS/MND
 IV. REVISIONS TO THE DRAFT IS/MND 1. REVISIONS TO THE DRAFT IS/MND This section presents corrections and clarifications that have been made to the text of the Draft IS/MND. These changes include revisions
Revised Report. Traffic Study for Safeway Fuel Center at Washington Square Shopping Center. In The City of Petaluma.
 Revised Report Traffic Study for Safeway Fuel Center at Washington Square Shopping Center In The Pleasanton Fresno Sacramento Santa Rosa TJKM www.tjkm.com Revised Report Traffic Study for Safeway Fuel
IV. ENVIRONMENTAL IMPACT ANALYSIS M. TRANSPORTATION AND TRAFFIC
 IV. ENVIRONMENTAL IMPACT ANALYSIS M. TRANSPORTATION AND TRAFFIC INTRODUCTION This section of the (Draft EIR) addresses the subject of traffic and transportation with respect to the proposed (Project or
Downtown One Way Street Conversion Technical Feasibility Report
 Downtown One Way Street Conversion Technical Feasibility Report As part of the City s Transportation Master Plan, this report reviews the technical feasibility of the proposed conversion of the current
TRAFFIC AND TRANSPORTATION TECHNICAL MEMORANDUM
 TRAFFIC AND TRANSPORTATION TECHNICAL MEMORANDUM for ENVIRONMENTAL ASSESSMENT US 460 Bypass Interchange and Southgate Drive Relocation State Project No.: 0460-150-204, P101, R201, C501, B601; UPC 99425
TALMONT TOWNHOMES MADISON KENNETH SPA TRAFFIC IMPACT STUDY. Sacramento, CA. Prepared For: MBK Homes. Prepared By:
 TALMONT TOWNHOMES MADISON KENNETH SPA TRAFFIC IMPACT STUDY Sacramento, CA Prepared For: MBK Homes Prepared By: KD Anderson & Associates 3853 Taylor Road, Suite G Loomis, California 95650 (916) 660-1555
April 7, Mr. Blake Shutler Compass Homes Development LLC Summit Homes Construction, LLC PO Box 6539 Dillon, CO 80435
 Compass Homes Development LLC Summit Homes Construction, LLC PO Box 6539 Dillon, CO 80435 Re: Trip Generation Comparison West Hills Townhomes Keystone, Colorado FHU Reference No. 116388-01 Dear Mr. Shutler: