MURRIETA APARTMENTS TRAFFIC IMPACT ANALYSIS CITY OF MURRIETA, CALIFORNIA
|
|
|
- Hollie Thompson
- 5 years ago
- Views:
Transcription

1 MURRIETA APARTMENTS TRAFFIC IMPACT ANALYSIS CITY OF MURRIETA, CALIFORNIA SEPTEMBER 20, 2012 Prepared for: Golden Eagle Multi-Family Properties, LLC 6201 Oak Canyon Rd., Suite 250 Irvine, CA Prepared by: Scott Sato, P.E. 100 E. San Marcos Boulevard, Suite 400 San Marcos, CA TRAMES SOLUTIONS INC. ( )
2 TABLE OF CONTENTS SECTION PAGE 1.0 INTRODUCTION AND SUMMARY... 1 A. Purpose of the TIA and Study Objectives B. Site Location and Study Area C. Development Project Identification 1. Project Size and Description 2. Existing Land Use 3. Proposed Land Use 4. Site Plan of Proposed Project 5. Proposed Project Opening Year 6. Proposed Project Phasing 2.0 AREA CONDITIONS... 6 A. Study Area and Intersections B. Existing Traffic Controls and Intersection Geometrics C. Existing Traffic Volumes D. Existing Delay and Level of Service E. Transit Service 3.0 PROJECTED FUTURE TRAFFIC A. Project Traffic 1. Ambient Growth Rate 2. Project Trip Generation 3. Project Trip Distribution and Assignment 4. Other Trip Generation Factors 5. Project Peak Hour Turning Movement Traffic B. Cumulative Traffic (Background) 1. Ambient Growth Rate 2. Other Approved or Proposed Development Projects 3. Other Approved Projects Trip Generation 4. Other Approved Development Trip Distribution and Assignment 5. Total Background Peak Hour Turning Movement Volumes 4.0 TRAFFIC ANALYSIS A. Delay and Level of Service for Existing With Project Conditions B. Delay and Level of Service Under Cumulative Conditions With Project Conditions MURRIETA APARTMENTS TRAFFIC IMPACT ANALYSIS CITY OF MURRIETA TRAMES SOLUTIONS, INC. (JN _REPORT)
3 TABLE OF CONTENTS (Continued) SECTION PAGE 5.0 FINDINGS AND RECOMMENDATIONS A. Traffic Impacts and Level of Service Analysis 1. Existing Conditions 2. Existing plus Ambient plus Project Conditions 3. Existing plus Ambient plus Project plus Cumulative Conditions B. Circulation Recommendations 1. On-Site MURRIETA APARTMENTS TRAFFIC IMPACT ANALYSIS CITY OF MURRIETA TRAMES SOLUTIONS, INC. (JN _REPORT)
4 LIST OF FIGURES FIGURE PAGE 1-A LOCATION MAP B SITE PLAN A EXISTING NUMBER OF THROUGH LANES AND INTERSECTION CONTROLS B EXISTING (2012) TRAFFIC VOLUMES A PROJECT TRIP DISTRIBUTION B PROJECT ONLY TRAFFIC VOLUMES C CUMULATIVE DEVELOPMENT LOCATION MAP AND TRIP DISTRIBUTION D CUMULATIVE DEVELOPMENT PM PEAK HOUR INTERSECTION VOLUMES E EXISTING PLUS AMBIENT PLUS PROJECT PEAK HOUR INTERSECTION VOLUMES F EXISTING PLUS AMBIENT PLUS PROJECT PLUS CUMULATIVE PEAK HOUR INTERSECTION VOLUMES A CIRCULATION RECOMMENDATIONS MURRIETA APARTMENTS TRAFFIC IMPACT ANALYSIS CITY OF MURRIETA TRAMES SOLUTIONS, INC. (JN _REPORT)
5 LIST OF TABLES TABLE PAGE 2-1 INTERSECTION ANALYSIS FOR EXISTING CONDITIONS TRIP GENERATION RATES TRIP GENERATION SUMMARY CUMULATIVE DEVELOPMENT TRIP GENERATION RATES CUMULATIVE DEVELOPMENT TRIP GENERATION SUMMARY INTERSECTION ANALYSIS FOR EXISTING PLUS AMBIENT PLUS PROJECT CONDITIONS INTERSECTION ANALYSIS FOR EXISTING PLUS AMBIENT PLUS PROJECT PLUS CUMULATIVE CONDITIONS MURRIETA APARTMENTS TRAFFIC IMPACT ANALYSIS CITY OF MURRIETA TRAMES SOLUTIONS, INC. (JN _REPORT)
6 LIST OF APPENDICES SCOPING AGREEMENT... TRAFFIC COUNT WORKSHEETS... EXISTING ANALYSIS CALCULATION WORKSHEETS... EXISTING PLUS AMBIENT PLUS PROJECT CONDITIONS INTERSECTION ANALYSIS CALCULATION WORKSHEETS... EXISTING PLUS AMBIENT PLUS PROJECT PLUS CUMULATIVE CONDITIONS INTERSECTION ANALYSIS CALCULATION WORKSHEETS... A B C D E MURRIETA APARTMENTS TRAFFIC IMPACT ANALYSIS CITY OF MURRIETA TRAMES SOLUTIONS, INC. (JN _REPORT)
7 THIS PAGE IS LEFT INTENTIONALLY BLANK
8 MURRIETA APARTMENTS TRAFFIC IMPACT ANALYSIS CITY OF MURRIETA, CALIFORNIA 1.0 INTRODUCTION AND SUMMARY A. Purpose of the TIA and Study Objectives The purpose of this traffic impact analysis (TIA) is to evaluate the traffic impacts of the proposed Murrieta Apartments development. The project is proposed to be developed with approximately 112 apartment dwelling units. The site is located north of Murrieta Hot Springs Road and east of Via Princesa in the City of Murrieta. Study objectives include the following: Existing Traffic. Existing traffic will be counted to determine current conditions. This constitutes the environmental setting for a CEQA analysis at the time that the hearing body reviews the project. Traffic count data shall be new or recent. In some cases, data up to one year old may be acceptable with the approval of the City of Murrieta Engineering Department. Any exception to this must be requested prior to approval of the scoping agreement Project Completion (existing + ambient + project). Traffic conditions prior to the time that the proposed development is completed will be estimated by increasing the existing traffic counts by an appropriate growth rate to be provided by City of Murrieta Engineering Department staff, projected to the year that the project is estimated to be completed. Traffic generated by the proposed project will then be added, and the impacts on the circulation system will be analyzed. This will be the basis for determining project-specific impacts, mitigation, and conditions of approval. Cumulative (existing + ambient + project + cumulative). Traffic generated by other approved projects in the study area shall be identified and added to the Project Completion traffic identified in Scenario 2. This may also include projects that are proposed and in the review process, but not yet fully approved. This scenario will be analyzed, and a determination made if improvements funded through an approved funding mechanism (TUMF, DIF, CFD, etc.) can accommodate the cumulative traffic at the target Level of Service (LOS) identified in the General Plan. If the funded improvements can provide the target LOS, payment into the fee program will be considered as cumulative mitigation through the conditions of approval. Other improvements needed beyond the funded improvements (such as localized improvements to non-tumf facilities) should be identified as such. MURRIETA APARTMENTS TRAFFIC IMPACT ANALYSIS CITY OF MURRIETA TRAMES SOLUTIONS, INC. (JN _REPORT) 1
9 2
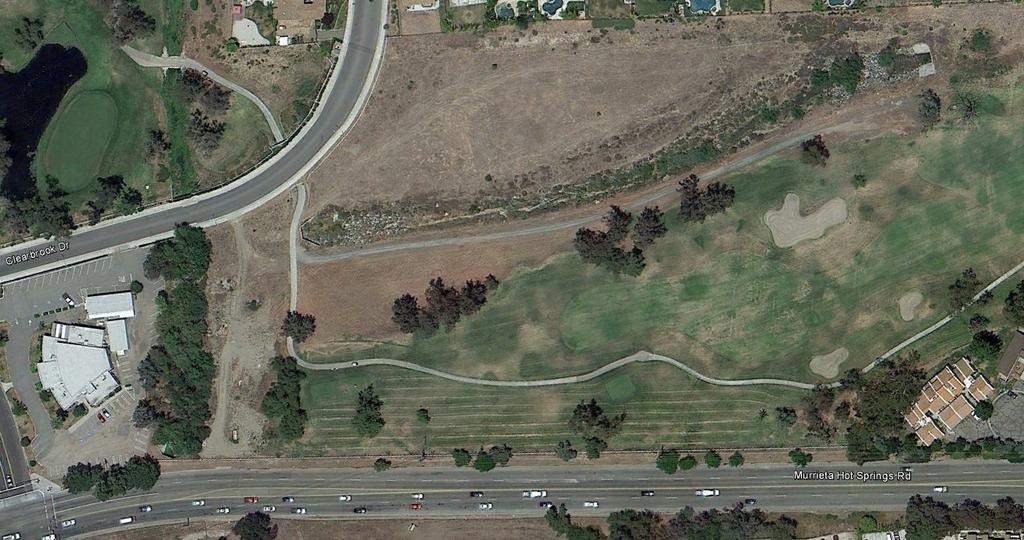
10 B. Site Location and Study Area The project site is generally located north of Murrieta Hot Springs Road and east of Via Princesa in the City of Murrieta. Figure 1-A illustrates the site location and the traffic analysis study area. In general, the study area shall include any intersection of Collector or higher classification street with another Collector roadway or higher classification street, at which the proposed project will add 50 or more peak hour trips, not exceeding a 5-mile radius from the project site. Pursuant to the attached scoping agreement (see Appendix A ) and discussions with City of Murrieta staff, the study area includes the following existing intersections: ID STUDY AREA INTERSECTIONS 1 Via Princesa (NS) / Clearbrook Dr. (EW) 2 Via Princesa (NS) / Murrieta Hot Springs Road (EW) 3 Project Driveway 1 (NS) / Clearbrook Dr. (EW) Future Roadway 4 Project Driveway 2 (NS) / Murrieta Hot Springs Road (EW) Future Roadway NOTE: NS = North-South Roadway; EW = East-West Roadway C. Development Project Identification 1. Project Size and Description The Murrieta Apartments Site is proposed to be developed with approximately 112 apartment dwelling units. It is anticipated that the project will be built by Existing Land Use The project site is currently vacant. Adjacent uses include the following: North Residential South Vacant East Residential West Synagogue 3. Proposed Land Use Proposed Land Use: Apartments MURRIETA APARTMENTS TRAFFIC IMPACT ANALYSIS CITY OF MURRIETA TRAMES SOLUTIONS, INC. (JN _REPORT) 3
11 4. Site Plan of Proposed Project Figure 1-B illustrates the conceptual land use plan. The project is proposed to have one full access point along Clearbrook Drive and one restricted right-in/right-out/leftin access point along Murrieta Hot Springs Road. In addition, the project is proposed to have a dedicated eastbound left turn lane and a westbound right turn lane along Murrieta Hot Springs Road. 5. Proposed Project Opening Year The proposed project is anticipated to be completed in Future traffic analysis has been based upon one year of background (ambient) growth, at 2% per year, along with traffic generated by other future developments in the surrounding area. The total ambient growth rate is 2% for 2013 conditions. 6. Proposed Project Phasing The project is expected to be completed in a single phase. Therefore, all traffic recommendations included in this report have not been separated into different development phases. MURRIETA APARTMENTS TRAFFIC IMPACT ANALYSIS CITY OF MURRIETA TRAMES SOLUTIONS, INC. (JN _REPORT) 4
12 5
13 2.0 AREA CONDITIONS A. Study Area and Intersections In general, the minimum area to be studied shall include any intersection of Collector or higher classification street, with Collector or higher classification streets, at which the proposed project will add 50 or more peak hour trips, not exceeding a 5-mile radius from the project site. The City of Murrieta Engineering Department may require deviation from these requirements based on area conditions. The study area includes the following existing intersections (shown previously on Figure 1-A): ID STUDY AREA INTERSECTIONS 1 Via Princesa (NS) / Clearbrook Dr. (EW) 2 Via Princesa (NS) / Murrieta Hot Springs Road (EW) 3 Project Driveway 1 (NS) / Clearbrook Dr. (EW) Future Roadway 4 Project Driveway 2 (NS) / Murrieta Hot Springs Road (EW) Future Roadway NOTE: NS = North-South Roadway; EW = East-West Roadway B. Existing Traffic Controls and Intersection Geometrics Figure 2-A identifies the existing roadway conditions for study area roadways. The existing intersection traffic controls and geometrics are identified. The site is bounded by Clearbrook Drive to the north and Murrieta Hot Springs Road to the south. C. Existing Traffic Volumes Existing intersection level of service calculations are based upon manual AM and PM peak hour turning movement counts made for Trames Solutions, Inc. in August Existing AM and PM peak hour intersection turning movements are shown on Figure 2-B. Existing daily count along Clearbrook Drive, east of Via Princesa is also shown in Figure 2-B. The traffic count worksheets are included in Appendix "B". D. Existing Delay and Level of Service The City of Murrieta has established Level of Service (LOS) D as the maximum allowable threshold for the intersection operations. Therefore, LOS E or F is considered unacceptable and requires improvements measures. MURRIETA APARTMENTS TRAFFIC IMPACT ANALYSIS CITY OF MURRIETA TRAMES SOLUTIONS, INC. (JN _REPORT) 6
14 7
15 8
16 Operations Analysis Methodology The City of Murrieta Engineering Department requires the use of the Transportation Research Board - Highway Capacity Manual (HCM), 2000 Update, or most recent release. Unsignalized intersections are analyzed using Chapter 17 of the Highway Capacity Manual. Signalized intersection Level of Service are analyzed using the Operational Method as described in Chapter 16, Section II. The results of the existing conditions intersection analysis are summarized in Table 2-1. The existing condition operations analysis worksheets are provided in Appendix "C". The study area intersections are currently operating at an acceptable level of service (LOS D or better) during the peak hours with the existing geometry and traffic controls: E. Transit Service The Riverside Transit Agency (RTA) Route 23 passes by Murrieta Hot Springs Road adjacent to the site. MURRIETA APARTMENTS TRAFFIC IMPACT ANALYSIS CITY OF MURRIETA TRAMES SOLUTIONS, INC. (JN _REPORT) 9
17 TABLE 2-1 INTERSECTION ANALYSIS FOR EXISTING CONDITIONS ID Intersection Intersection Approach Lanes 2 DELAY 3 LEVEL OF Traffic Northbound Southbound Eastbound Westbound (SECS.) SERVICE Control 1 L T R L T R L T R L T R AM PM AM PM 1 Via Princesa/Clearbrook Dr. CSS ! B B 2 Via Princesa/Murrieta Hot Springs Rd. TS B C CSS = Cross Street Stop; TS = Traffic Signal When a right turn is designated, the lane can either be striped or unstriped. To function as a right turn lane there must be sufficient width for right turning vehicles to travel outside the through lanes. L = Left; T = Through; R = Right; 1! = Shared Left-Through-Right Lane Delay and level of service calculated using the following analysis software: Synchro 8.0, build 801, revision 563 C:\TRAMES\ \Excel\0070_0001-Report 02/2-1 10
18 3.0 PROJECTED FUTURE TRAFFIC This section of the report quantifies the number of trips generated by the proposed project and other known developments in the area. A. Project Traffic 1. Ambient Growth Rate Some traffic volume increases on roadways can be attributed to vehicles originating outside of the study area. These types of trips either end up within the study area or pass-through onto an outside destination. Therefore, to account for these trips (termed ambient growth ), a growth rate can be applied to existing traffic volumes. A 2% ambient growth rate that has been used in this study to account for traffic not attributed to the project or other planned developments within the study area. The City of Murrieta Transportation Department staff has previously reviewed and approved this rate. 2. Project Trip Generation Trip generation represents the amount of traffic which is attracted and produced by a development. The trip generation for the project is based upon the specific land use which has been planned for this development. For the purpose of this analysis, the following land use assumption is evaluated: 112 apartment dwelling units Trip generation rates for the proposed development are shown in Table 3-1. The trip generation rates are based upon data collected by the Institute of Transportation Engineers (ITE). The daily and peak hour trip generations for the proposed project are shown on Table 3-2. The proposed development is projected to generate a total of approximately 745 trip-ends per day with 57 vehicles per hour during the AM peak hour and 70 vehicles per hour during the PM peak hour. MURRIETA APARTMENTS TRAFFIC IMPACT STUDY CITY OF MURRIETA TRAMES SOLUTIONS, INC. (JN _REPORT) 11
19 TABLE 3-1 PROJECT TRIP GENERATION RATES 1 PEAK HOUR TRIP RATES ITE AM PM LAND USE CODE QUANTITY UNITS 2 IN OUT TOTAL IN OUT TOTAL DAILY Apartment OCCUPIED DU Source: ITE (Institute of Transportation Engineers) Trip Generation Manual, 8th Edition, DU = Dwelling Units C:\TRAMES\ \Excel\0070_0001-Report 02/3-1 12
20 TABLE 3-2 PROJECT TRIP GENERATION SUMMARY PEAK HOUR AM PM LAND USE QUANTITY UNITS 1 IN OUT TOTAL IN OUT TOTAL DAILY Apartment 112 OCCUPIED DU TOTAL DU = Dwelling Units C:\TRAMES\ \Excel\0070_0001-Report 02/3-2 13
21 3. Project Trip Distribution and Assignment Trip distribution represents the directional orientation of traffic to and from the project site. The project s trip distribution patterns are based on the proximity of the residential units to the proposed driveway locations, the surrounding trip attractors (employment bases, commercial opportunities, schools, recreation centers, etc.), and the regional freeway interchanges. The trip distribution pattern for the project is illustrated on Figure 3-A. 4. Other Trip Generation Factors The project consists of residential units that do not generate a significant amount of pass-by trips. Furthermore, it is unlikely that trips will be reduced to/from the site by non-motorized modes of travel due to the lack of; 1) convenient transit opportunities, 2) bike lanes, and 3) pedestrian trails. 5. Project Peak Hour Turning Movement Traffic The assignment of traffic from the site to the adjoining roadway system has been based upon the site's trip generation, trip distribution, proposed arterial highway and local street systems, which would be in place by the time of initial occupancy of the site. Based on the identified project traffic generation and distribution, project peak hour intersection traffic volumes and average daily traffic (ADT) volumes are shown on Figure 3-B. B. Cumulative Traffic (Background) 1. Ambient Growth Rates To assess existing plus ambient plus cumulative plus project traffic conditions, project traffic is combined with existing traffic, area-wide growth and other future developments which are approved or being processed concurrently in the study area. Developments which are being processed concurrently in the study area have been provided by City staff. 2. Other Approved or Proposed Development Projects The cumulative developments have been included along with the land use associated with each project. The location of the cumulative projects provided by the City are shown on Figure 3-C. MURRIETA APARTMENTS TRAFFIC IMPACT STUDY CITY OF MURRIETA TRAMES SOLUTIONS, INC. (JN _REPORT) 14
22 15
23 16
24 17
25 3. Other Approved Projects Trip Generation For cumulative projects, ITE Trip Generation Rates (8 th Edition) were used. Table 3-3 presents the cumulative trip generation rates. Table 3-4 presents the cumulative development land uses and trip generation summary. As presented in Table 3-4 Cumulative developments are projected to generate a total of approximately 70 vehicle trips per hour during the PM peak hour. 4. Other Approved Development Trip Distribution and Assignments Figure 3-C contains the directional distribution and assignment of the cumulative development traffic. 5. Total Background Peak Hour Turning Movement Volumes Based on the identified trip distribution for the cumulative development on arterial highways throughout the study area, cumulative development PM peak hour intersection turning movement volumes are shown on Figures 3-D. Existing plus Ambient plus Project (E+A+P) AM and PM peak hour intersection turning movement volumes are shown on Figures 3-E. Existing plus Ambient plus Project plus Cumulative (E+A+P+C) AM and PM peak hour intersection turning movement volumes are shown on Figures 3-F. MURRIETA APARTMENTS TRAFFIC IMPACT STUDY CITY OF MURRIETA TRAMES SOLUTIONS, INC. (JN _REPORT) 18
26 TABLE 3-3 CUMULATIVE TRIP GENERATION RATES 1 PEAK HOUR TRIP RATES ITE AM PM LAND USE CODE QUANTITY UNITS 2 IN OUT TOTAL IN OUT TOTAL Automated Car Wash TSF Source: ITE (Institute of Transportation Engineers) Trip Generation Manual, 8th Edition, DU = Dwelling Units 3 -- = Nominal amount of trips C:\TRAMES\ \Excel\0070_0001-Report 02/3-3 19
27 TABLE 3-4 AM PM PROJECT NAME LAND USE QUANTITY UNITS 1 IN OUT TOTAL IN OUT TOTAL Fast 5 Xpress Car Wash (Southeast corner of MHSR/Jackson) Automated Car Wash 5 TSF TOTAL 1 DU = Dwelling Units 2 -- = Nominal amount of trips CUMULATIVE TRIP GENERATION SUMMARY PEAK HOUR C:\TRAMES\ \Excel\0070_0001-Report 02/3-4 20
28 21
29 22
30 23
31 4.0 TRAFFIC ANALYSIS Peak hour intersection analysis has been performed at the study area intersections for each of the project scenarios and for projected future conditions. Improvements are recommended to satisfy the level of service requirements of the City of Murrieta and if the following impacts are identified: 1) When existing traffic conditions (Analysis Scenario 1) exceed the General Plan target LOS. 2) When project traffic, when added to existing traffic (Analysis Scenario 2), will deteriorate the LOS to below the target LOS, and impacts cannot be mitigated through project conditions of approval. 3) When cumulative traffic (Analysis Scenario 3) exceeds the target LOS, and impacts cannot be mitigated through existing infrastructure funding mechanisms. It is important to note that the General Plan allows the City Council to approve development projects even in instances where the target LOS is exceeded, if the project has overriding benefits. Examples include projects that provide jobs in a local area, projects that provide needed transportation improvements that otherwise would not be constructed, projects that provide habitat conservations, projects that implement nonmotorized transportation systems, or projects that provide some unique benefits to the City which outweigh the traffic impacts. These projects are required to mitigate traffic impacts to the extent that it is economically feasible as determined by the Engineering Department, based on a value engineering analysis. Projects that have a significant traffic impact and require a finding of overriding benefits may be required to prepare an Environmental Impact Report. The need to prepare an EIR shall be determined through consultation between the Engineering Department, Planning Department, and the City Attorney. A. Delay and Level of Service for Existing with Project Conditions Intersection levels of service for the E+A+P traffic conditions are shown in Table 4-1. Table 4-1 shows HCM calculations based on the geometrics at the study area intersections. The operation analysis worksheets for E+A+P traffic conditions are provided in Appendix D. For E+A+P traffic conditions, the study area intersections are projected to operate at an acceptable levels of service during the peak hours with existing geometry. MURRIETA APARTMENTS TRAFFIC IMPACT STUDY CITY OF MURRIETA TRAMES SOLUTIONS, INC. (JN _REPORT) 24
32 TABLE 4-1 INTERSECTION ANALYSIS FOR EXISTING PLUS AMBIENT PLUS PROJECT CONDITIONS Intersection Approach Lanes 2 DELAY 3 LEVEL OF Traffic Northbound Southbound Eastbound Westbound (SECS.) SERVICE ID Intersection Control 1 L T R L T R L T R L T R AM PM AM PM 1 Via Princesa/Clearbrook Dr. CSS ! B B 2 Via Princesa/Murrieta Hot Springs Rd. TS B C 3 Project Dwy. 1/Clearbrook Dr. CSS 0 1! B B 4 Project Dwy. 2/Murrieta Hot Springs Rd. CSS B B CSS = Cross Street Stop; TS = Traffic Signal When a right turn is designated, the lane can either be striped or unstriped. To function as a right turn lane there must be sufficient width for right turning vehicles to travel outside the through lanes. L = Left; T = Through; R = Right; 1! = Shared Left-Through-Right Lane; 1 = Project Proposed Improvement Delay and level of service calculated using the following analysis software: Synchro 8.0, build 801, revision 563 C:\TRAMES\ \Excel\0070_0001-Report 02/4-1 25
33 B. Delay and Level of Service Analysis Under Cumulative With Project Conditions Intersection levels of service for the E+A+P+C traffic conditions are shown in Table 4-2. Table 4-2 shows HCM calculations based on the geometrics at the study area intersections. The operation analysis worksheets for E+A+P+C traffic conditions are provided in Appendix E. For E+A+P+C traffic conditions, the study area intersections are projected to continue to operate at an acceptable levels of service during the peak hours with existing geometry. MURRIETA APARTMENTS TRAFFIC IMPACT STUDY CITY OF MURRIETA TRAMES SOLUTIONS, INC. (JN _REPORT) 26
34 TABLE 4-2 INTERSECTION ANALYSIS FOR EXISTING PLUS AMBIENT PLUS PROJECT PLUS CUMULATIVE CONDITIONS ID Intersection Intersection Approach Lanes 2 DELAY 3 LEVEL OF Traffic Northbound Southbound Eastbound Westbound (SECS.) SERVICE Control 1 L T R L T R L T R L T R AM PM AM PM 1 Via Princesa/Clearbrook Dr. CSS ! B B 2 Via Princesa/Murrieta Hot Springs Rd. TS B C 3 Project Dwy. 1/Clearbrook Dr. CSS 0 1! B B 4 Project Dwy. 2/Murrieta Hot Springs Rd. CSS B B CSS = Cross Street Stop; TS = Traffic Signal When a right turn is designated, the lane can either be striped or unstriped. To function as a right turn lane there must be sufficient width for right turning vehicles to travel outside the through lanes. L = Left; T = Through; R = Right; 1! = Shared Left-Through-Right Lane; 1 = Project Proposed Improvement Delay and level of service calculated using the following analysis software: Synchro 8.0, build 801, revision 563 C:\TRAMES\ \Excel\0070_0001-Report 02/4-2 27
35 5.0 FINDINGS AND RECOMMENDATIONS A. Traffic Impacts and Level of Service Analysis 1. Existing Conditions For Existing traffic conditions, the study area intersections are currently operating at an acceptable level of service during the peak hours with existing geometry. 2. Existing + Ambient + Project Conditions For E+A+P traffic conditions, the study area intersections are projected to operate at an acceptable levels of service during the peak hours with existing geometry. 3. Existing + Ambient + Project + Cumulative Conditions For E+A+P+C traffic conditions, the study area intersections are projected to operate at an acceptable levels of service during the peak hours with existing geometry. B. Circulation Recommendations 1. On-Site Figure 5-A illustrates the on-site recommended roadway and intersection lane improvements. Construction of on-site improvements shall occur in conjunction with adjacent project development activity or as needed for project access purposes. The recommended on-site roadway improvements are described below. Provide stop sign control at the project driveways. Provide a dedicated eastbound left turn lane (approximately 100 ft. turn pocket length) at Driveway 2 and Murrieta Hot Springs Road. Provide a dedicated westbound right turn lane (approximately 100 ft. turn pocket length) at Driveway 2 and Murrieta Hot Springs Road. On-site traffic signing and striping should be implemented in conjunction with detailed construction plans for the project. Verify that minimum sight distance is provided at the project access points. MURRIETA APARTMENTS TRAFFIC IMPACT STUDY CITY OF MURRIETA TRAMES SOLUTIONS, INC. (JN _REPORT) 28
36 29
37 THIS PAGE IS LEFT INTENTIONALLY BLANK 30
38 APPENDIX A SCOPING AGREEMENT
39 SCOPING AGREEMENT FOR TRAFFIC IMPACT STUDY This letter acknowledges the City of Murrieta Transportation Department requirements for the traffic impact analysis of the following project. Case No. Related Cases - SP No. EIR No. GPA No. CZ No. Project Name: Project Address: Project Description: n/a n/a n/a n/a Murrieta Apartments East of Via Princessa and north of Murrieta Hot Springs Road 120 Multi Family Residential Dwelling Units Consultant Name: Trames Solutions, Inc. Address: Scott Sato 100 E. San Marcos Blvd., Ste. 400 San Marcos, CA Phone No: (760) Date: 11/29/2011 A. Trip Generation Source: Developer Tierra Rey Developments 2100 Main Street Irvine, CA ITE 8th Edition (See Tables 1 & 2) Proposed Land Use: MFDU Existing Zoning: Previous Land Use: Proposed Zoning: Vacant In Out Total In Out Total AM Trips PM Trips Internal Trip Allowance No ( 0 % Trip Discount) Pass-By Trip Allowance No ( 0 % Trip Discount) B. Trip Geographic Distribution: (See attached exhibit for detailed assignment). See Figure C N 10% S 0% E 30% W 60% C. Background Traffic Project Build-out Year 2013 Annual Ambient Growth Rate: 2.0 % Other projects to be analyzed: Model/Forecast methodology: To be provided by the City of Murrieta D. Study Intersections: (NOTE: Subject to revision after other projects, trip generation and distribution are determined, or comments form other agencies). See Figure A 1 Via Princesa (NS)/ Clearbrook Dr. (EW) 6 2 Via Princesa (NS)/ Murrieta Hot Springs Rd. (EW) 7 3 All Project Access Driveways E. Study Roadway Segments: C:\TRAMES\0070\Excel\0070_0001_Scoping_Agreement\Scope A-1
40 F. Other Jurisdictional Impacts Is this project within a City's Sphere of influence or one mile radius of City boundaries? Yes If so, name of City jurisdiction: Riverside County G. Site Plan See Figure B H. Specific issues to be addressed in the Study (in addition to the standard analysis described in the Guideline) (To be filled out by Transportation Department) Existing Existing+Ambient Growth+Project Existing+Ambient Growth+Project+Cumulative Recommended by: Approved By: 8/15/12 Consultant's Representative Date City of Murrieta Transportation Department Date Department - Traffic Staff C:\TRAMES\0070\Excel\0070_0001_Scoping_Agreement\Scope A-2
41 A-3
42 A-4
43 A-5
44 TABLE 1 PROJECT TRIP GENERATION RATES 1 PEAK HOUR TRIP RATES ITE AM PM 3 LAND USE CODE QUANTITY UNITS 2 IN OUT TOTAL IN OUT TOTAL DAILY Apartment OCCUPIED DU Source: ITE (Institute of Transportation Engineers) Trip Generation Manual, 8th Edition, DU = Dwelling Units Murrieta Apartments Traffic Impact Study (C:\TRAMES\0070\Excel\0070_0001-TG\1) A-6
45 TABLE 2 PROJECT TRIP GENERATION SUMMARY PEAK HOUR AM PM LAND USE QUANTITY UNITS 1 IN OUT TOTAL IN OUT TOTAL DAILY Apartment 120 OCCUPIED DU TOTAL DU = Dwelling Units Murrieta Apartments Traffic Impact Study (C:\TRAMES\0070\Excel\0070_0001-TG\2) A-7
46 THIS PAGE IS LEFT INTENTIONALLY BLANK A-8
47 APPENDIX B TRAFFIC COUNT WORKSHEETS
48 Counts Unlimited, Inc. PO Box 1178 Corona, CA (951) City of Murrieta N/S: Via Princessa E/W: Clearbrook Drive Weather: Clear File Name : MURVPCBAM Site Code : Start Date : 8/30/2012 Page No : 1 Groups Printed- Total Volume Via Princessa Southbound Clearbrook Drive Westbound Via Princessa Northbound Start Time Left Thru App. Total Left Right App. Total Thru Right App. Total Int. Total 07:00 AM :15 AM :30 AM :45 AM Total :00 AM :15 AM :30 AM :45 AM Total Grand Total Apprch % Total % Via Princessa Southbound Clearbrook Drive Westbound Via Princessa Northbound Start Time Left Thru App. Total Left Right App. Total Thru Right App. Total Int. Total Peak Hour Analysis From 07:00 AM to 08:45 AM - Peak 1 of 1 Peak Hour for Entire Intersection Begins at 07:00 AM 07:00 AM :15 AM :30 AM :45 AM Total Volume % App. Total PHF B-1
49 Counts Unlimited, Inc. PO Box 1178 Corona, CA (951) City of Murrieta N/S: Via Princessa E/W: Clearbrook Drive Weather: Clear File Name : MURVPCBAM Site Code : Start Date : 8/30/2012 Page No : 2 Via Princessa Out In Total Thru 8 Left Peak Hour Data Peak Hour Begins at 07:00 AM Total Volume North Right 2 Left 191 Out In Total Clearbrook Drive Thru 10 Right Out In Total Via Princessa Peak Hour Analysis From 07:00 AM to 08:45 AM - Peak 1 of 1 Peak Hour for Each Approach Begins at: 07:30 AM 08:00 AM 07:15 AM +0 mins mins mins mins Total Volume % App. Total PHF B-2
50 Counts Unlimited, Inc. PO Box 1178 Corona, CA (951) City of Murrieta N/S: Via Princessa E/W: Clearbrook Drive Weather: Clear File Name : MURVPCBPM Site Code : Start Date : 9/5/2012 Page No : 1 Groups Printed- Total Volume Via Princessa Southbound Clearbrook Drive Westbound Via Princessa Northbound Start Time Left Thru App. Total Left Right App. Total Thru Right App. Total Int. Total 04:00 PM :15 PM :30 PM :45 PM Total :00 PM :15 PM :30 PM :45 PM Total Grand Total Apprch % Total % Via Princessa Southbound Clearbrook Drive Westbound Via Princessa Northbound Start Time Left Thru App. Total Left Right App. Total Thru Right App. Total Int. Total Peak Hour Analysis From 04:00 PM to 05:45 PM - Peak 1 of 1 Peak Hour for Entire Intersection Begins at 04:30 PM 04:30 PM :45 PM :00 PM :15 PM Total Volume % App. Total PHF B-3
51 Counts Unlimited, Inc. PO Box 1178 Corona, CA (951) City of Murrieta N/S: Via Princessa E/W: Clearbrook Drive Weather: Clear File Name : MURVPCBPM Site Code : Start Date : 9/5/2012 Page No : 2 Via Princessa Out In Total Thru 7 Left Peak Hour Data Peak Hour Begins at 04:30 PM Total Volume North Right 4 Left 149 Out In Total Clearbrook Drive Thru 79 Right Out In Total Via Princessa Peak Hour Analysis From 04:00 PM to 05:45 PM - Peak 1 of 1 Peak Hour for Each Approach Begins at: 04:15 PM 04:45 PM 04:30 PM +0 mins mins mins mins Total Volume % App. Total PHF B-4
52 Counts Unlimited, Inc. PO Box 1178 Corona, CA (951) City of Murrieta N/S: Via Princessa E/W: Murrieta Hot Springs Road Weather: Clear File Name : MURVPMHSAM Site Code : Start Date : 8/30/2012 Page No : 1 Groups Printed- Total Volume Via Princessa Southbound Murrieta Hot Springs Road Westbound Via Princessa Northbound Murrieta Hot Springs Road Eastbound Start Time Left Thru Right App. Total Left Thru Right App. Total Left Thru Right App. Total Left Thru Right App. Total Int. Total 07:00 AM :15 AM :30 AM :45 AM Total :00 AM :15 AM :30 AM :45 AM Total Grand Total Apprch % Total % Via Princessa Southbound Murrieta Hot Springs Road Westbound Via Princessa Northbound Murrieta Hot Springs Road Eastbound Start Time Left Thru Right App. Total Left Thru Right App. Total Left Thru Right App. Total Left Thru Right App. Total Int. Total Peak Hour Analysis From 07:00 AM to 08:45 AM - Peak 1 of 1 Peak Hour for Entire Intersection Begins at 08:00 AM 08:00 AM :15 AM :30 AM :45 AM Total Volume % App. Total PHF B-5
53 Counts Unlimited, Inc. PO Box 1178 Corona, CA (951) City of Murrieta N/S: Via Princessa E/W: Murrieta Hot Springs Road Weather: Clear File Name : MURVPMHSAM Site Code : Start Date : 8/30/2012 Page No : 2 Via Princessa Out In Total Right 18 Thru 20 Left Peak Hour Data Murrieta Hot Springs Road Out In Total Left 843 Thru 42 Right Peak Hour Begins at 08:00 AM Total Volume North Right Thru Left Out In Total Murrieta Hot Springs Road Left 79 Thru 8 Right Out In Total Via Princessa Peak Hour Analysis From 07:00 AM to 08:45 AM - Peak 1 of 1 Peak Hour for Each Approach Begins at: 07:45 AM 07:00 AM 07:15 AM 07:45 AM +0 mins mins mins mins Total Volume % App. Total PHF B-6
54 Counts Unlimited, Inc. PO Box 1178 Corona, CA (951) City of Murrieta N/S: Via Princessa E/W: Murrieta Hot Springs Road Weather: Clear File Name : MURVPMHSPM Site Code : Start Date : 9/5/2012 Page No : 1 Groups Printed- Total Volume Via Princessa Southbound Murrieta Hot Springs Road Westbound Via Princessa Northbound Murrieta Hot Springs Road Eastbound Start Time Left Thru Right App. Total Left Thru Right App. Total Left Thru Right App. Total Left Thru Right App. Total Int. Total 04:00 PM :15 PM :30 PM :45 PM Total :00 PM :15 PM :30 PM :45 PM Total Grand Total Apprch % Total % Via Princessa Southbound Murrieta Hot Springs Road Westbound Via Princessa Northbound Murrieta Hot Springs Road Eastbound Start Time Left Thru Right App. Total Left Thru Right App. Total Left Thru Right App. Total Left Thru Right App. Total Int. Total Peak Hour Analysis From 04:00 PM to 05:45 PM - Peak 1 of 1 Peak Hour for Entire Intersection Begins at 04:30 PM 04:30 PM :45 PM :00 PM :15 PM Total Volume % App. Total PHF B-7
55 Counts Unlimited, Inc. PO Box 1178 Corona, CA (951) City of Murrieta N/S: Via Princessa E/W: Murrieta Hot Springs Road Weather: Clear File Name : MURVPMHSPM Site Code : Start Date : 9/5/2012 Page No : 2 Via Princessa Out In Total Right 15 Thru 26 Left Peak Hour Data Murrieta Hot Springs Road Out In Total Left 1360 Thru 62 Right Peak Hour Begins at 04:30 PM Total Volume North Right Thru Left Out In Total Murrieta Hot Springs Road Left 77 Thru 16 Right Out In Total Via Princessa Peak Hour Analysis From 04:00 PM to 05:45 PM - Peak 1 of 1 Peak Hour for Each Approach Begins at: 04:15 PM 04:45 PM 05:00 PM 04:30 PM +0 mins mins mins mins Total Volume % App. Total PHF B-8
56 City of Murrieta Clearbrook Drive E/ Via Princesa 24 Hour Directional Volume Count 06-Sep- Start Counts Unlimited, Inc PO Box 1178 Corona, CA (951) Page 1 MURCLEVP Site Code: Date Start: 06-Sep-12 Date End: 06-Sep-12 Eastbound Hour Totals Westbound Hour Totals Combined Totals 12 Time Thu Morning Afternoon Morning Afternoon Morning Afternoon Morning Afternoon Morning Afternoon 12: : : : : : : : : : : : : : : : : : : : : : : : : : : : : : : : : : : : : : : : : : : : : : : : Total Combined Total AM Peak 07:00 06:30 Vol P.H.F PM Peak 04:45 04:30 Vol P.H.F Percentag e ADT/AAD T 22.6% 77.4% 48.4% 51.6% ADT 4,621 AADT 4,621 B-9
57 THIS PAGE IS LEFT INTENTIONALLY BLANK B-10
58 APPENDIX C EXISTING CONDITIONS INTERSECTION ANALYSIS CALCULATION WORKSHEETS
59
60 HCM Unsignalized Intersection Capacity Analysis Existing (2012) AM Peak Hour 1: Via Princesa (NS) & Clearbrook Dr. (EW) 9/19/2012 Movement WBL WBR NBT NBR SBL SBT Lane Configurations Volume (veh/h) Sign Control Stop Free Free Grade 0% 0% 0% Peak Hour Factor Hourly flow rate (vph) Pedestrians Lane Width (ft) Walking Speed (ft/s) Percent Blockage Right turn flare (veh) Median type None None Median storage veh) Upstream signal (ft) 334 px, platoon unblocked vc, conflicting volume vc1, stage 1 conf vol vc2, stage 2 conf vol vcu, unblocked vol tc, single (s) tc, 2 stage (s) tf (s) p0 queue free % cm capacity (veh/h) Direction, Lane # WB 1 NB 1 SB 1 Volume Total Volume Left Volume Right csh Volume to Capacity Queue Length 95th (ft) Control Delay (s) Lane LOS B A Approach Delay (s) Approach LOS B Intersection Summary Average Delay 5.9 Intersection Capacity Utilization 26.2% ICU Level of Service A Analysis Period (min) 15 Murrieta Apartments Traffic Impact Study C:\TRAMES\ \SYNCHRO\01 Existing AM.syn Trames Solutions, Inc. Synchro 8 Report C-1
61 HCM Signalized Intersection Capacity Analysis Existing (2012) AM Peak Hour 2: Via Princesa (NS) & Murrieta Hot Springs Rd. (EW) 9/19/2012 Movement EBL EBT EBR WBL WBT WBR NBL NBT NBR SBL SBT SBR Lane Configurations Volume (vph) Ideal Flow (vphpl) Total Lost time (s) Lane Util. Factor Frt Flt Protected Satd. Flow (prot) Flt Permitted Satd. Flow (perm) Peak-hour factor, PHF Adj. Flow (vph) RTOR Reduction (vph) Lane Group Flow (vph) Turn Type Prot NA Perm Prot NA Perm NA Perm NA Perm Protected Phases Permitted Phases Actuated Green, G (s) Effective Green, g (s) Actuated g/c Ratio Clearance Time (s) Vehicle Extension (s) Lane Grp Cap (vph) v/s Ratio Prot c c v/s Ratio Perm 0.02 c v/c Ratio Uniform Delay, d Progression Factor Incremental Delay, d Delay (s) Level of Service E B A E B D D D D D Approach Delay (s) Approach LOS B B D D Intersection Summary HCM Average Control Delay 19.0 HCM Level of Service B HCM Volume to Capacity ratio 0.47 Actuated Cycle Length (s) Sum of lost time (s) 12.0 Intersection Capacity Utilization 55.8% ICU Level of Service B Analysis Period (min) 15 c Critical Lane Group Murrieta Apartments Traffic Impact Study C:\TRAMES\ \SYNCHRO\01 Existing AM.syn Trames Solutions, Inc. Synchro 8 Report C-2
62 HCM Unsignalized Intersection Capacity Analysis Existing (2012) PM Peak Hour 1: Via Princesa (NS) & Clearbrook Dr. (EW) 9/19/2012 Movement WBL WBR NBT NBR SBL SBT Lane Configurations Volume (veh/h) Sign Control Stop Free Free Grade 0% 0% 0% Peak Hour Factor Hourly flow rate (vph) Pedestrians Lane Width (ft) Walking Speed (ft/s) Percent Blockage Right turn flare (veh) Median type None None Median storage veh) Upstream signal (ft) 334 px, platoon unblocked vc, conflicting volume vc1, stage 1 conf vol vc2, stage 2 conf vol vcu, unblocked vol tc, single (s) tc, 2 stage (s) tf (s) p0 queue free % cm capacity (veh/h) Direction, Lane # WB 1 NB 1 SB 1 Volume Total Volume Left Volume Right csh Volume to Capacity Queue Length 95th (ft) Control Delay (s) Lane LOS B A Approach Delay (s) Approach LOS B Intersection Summary Average Delay 3.5 Intersection Capacity Utilization 33.5% ICU Level of Service A Analysis Period (min) 15 Murrieta Apartments Traffic Impact Study C:\TRAMES\ \SYNCHRO\01 Existing PM.syn Trames Solutions, Inc. Synchro 8 Report C-3
63 HCM Signalized Intersection Capacity Analysis Existing (2012) PM Peak Hour 2: Via Princesa (NS) & Murrieta Hot Springs Rd. (EW) 9/19/2012 Movement EBL EBT EBR WBL WBT WBR NBL NBT NBR SBL SBT SBR Lane Configurations Volume (vph) Ideal Flow (vphpl) Total Lost time (s) Lane Util. Factor Frt Flt Protected Satd. Flow (prot) Flt Permitted Satd. Flow (perm) Peak-hour factor, PHF Adj. Flow (vph) RTOR Reduction (vph) Lane Group Flow (vph) Turn Type Prot NA Perm Prot NA Perm NA Perm NA Perm Protected Phases Permitted Phases Actuated Green, G (s) Effective Green, g (s) Actuated g/c Ratio Clearance Time (s) Vehicle Extension (s) Lane Grp Cap (vph) v/s Ratio Prot c0.16 c v/s Ratio Perm 0.03 c v/c Ratio Uniform Delay, d Progression Factor Incremental Delay, d Delay (s) Level of Service E A A E B D D D D D Approach Delay (s) Approach LOS B C D D Intersection Summary HCM Average Control Delay 21.5 HCM Level of Service C HCM Volume to Capacity ratio 0.57 Actuated Cycle Length (s) Sum of lost time (s) 8.0 Intersection Capacity Utilization 66.7% ICU Level of Service C Analysis Period (min) 15 c Critical Lane Group Murrieta Apartments Traffic Impact Study C:\TRAMES\ \SYNCHRO\01 Existing PM.syn Trames Solutions, Inc. Synchro 8 Report C-4
64 APPENDIX D EXISTING PLUS AMBIENT PLUS PROJECT CONDITIONS INTERSECTION ANALYSIS CALCULATION WORKSHEETS
65
66 HCM Unsignalized Intersection Capacity Analysis EAP (2013) AM Peak Hour 1: Via Princesa (NS) & Clearbrook Dr. (EW) 9/19/2012 Movement WBL WBR NBT NBR SBL SBT Lane Configurations Volume (veh/h) Sign Control Stop Free Free Grade 0% 0% 0% Peak Hour Factor Hourly flow rate (vph) Pedestrians Lane Width (ft) Walking Speed (ft/s) Percent Blockage Right turn flare (veh) Median type None None Median storage veh) Upstream signal (ft) 334 px, platoon unblocked vc, conflicting volume vc1, stage 1 conf vol vc2, stage 2 conf vol vcu, unblocked vol tc, single (s) tc, 2 stage (s) tf (s) p0 queue free % cm capacity (veh/h) Direction, Lane # WB 1 NB 1 SB 1 Volume Total Volume Left Volume Right csh Volume to Capacity Queue Length 95th (ft) Control Delay (s) Lane LOS B A Approach Delay (s) Approach LOS B Intersection Summary Average Delay 6.3 Intersection Capacity Utilization 27.5% ICU Level of Service A Analysis Period (min) 15 Murrieta Apartments Traffic Impact Study C:\TRAMES\ \SYNCHRO\02 EAP AM.syn Trames Solutions, Inc. Synchro 8 Report D-1
67 HCM Signalized Intersection Capacity Analysis EAP (2013) AM Peak Hour 2: Via Princesa (NS) & Murrieta Hot Springs Rd. (EW) 9/19/2012 Movement EBL EBT EBR WBL WBT WBR NBL NBT NBR SBL SBT SBR Lane Configurations Volume (vph) Ideal Flow (vphpl) Total Lost time (s) Lane Util. Factor Frt Flt Protected Satd. Flow (prot) Flt Permitted Satd. Flow (perm) Peak-hour factor, PHF Adj. Flow (vph) RTOR Reduction (vph) Lane Group Flow (vph) Turn Type Prot NA Perm Prot NA Perm NA Perm NA Perm Protected Phases Permitted Phases Actuated Green, G (s) Effective Green, g (s) Actuated g/c Ratio Clearance Time (s) Vehicle Extension (s) Lane Grp Cap (vph) v/s Ratio Prot c c v/s Ratio Perm 0.02 c v/c Ratio Uniform Delay, d Progression Factor Incremental Delay, d Delay (s) Level of Service E B A E B D D D D D Approach Delay (s) Approach LOS B B D D Intersection Summary HCM Average Control Delay 19.7 HCM Level of Service B HCM Volume to Capacity ratio 0.49 Actuated Cycle Length (s) Sum of lost time (s) 12.0 Intersection Capacity Utilization 57.7% ICU Level of Service B Analysis Period (min) 15 c Critical Lane Group Murrieta Apartments Traffic Impact Study C:\TRAMES\ \SYNCHRO\02 EAP AM.syn Trames Solutions, Inc. Synchro 8 Report D-2
68 HCM Unsignalized Intersection Capacity Analysis EAP (2013) AM Peak Hour 3: Driveway 1 (NS) & Clearbrook Dr. (EW) 9/19/2012 Movement EBT EBR WBL WBT NBL NBR Lane Configurations Volume (veh/h) Sign Control Free Free Stop Grade 0% 0% 0% Peak Hour Factor Hourly flow rate (vph) Pedestrians Lane Width (ft) Walking Speed (ft/s) Percent Blockage Right turn flare (veh) Median type None None Median storage veh) Upstream signal (ft) px, platoon unblocked vc, conflicting volume vc1, stage 1 conf vol vc2, stage 2 conf vol vcu, unblocked vol tc, single (s) tc, 2 stage (s) tf (s) p0 queue free % cm capacity (veh/h) Direction, Lane # EB 1 WB 1 NB 1 Volume Total Volume Left Volume Right csh Volume to Capacity Queue Length 95th (ft) Control Delay (s) Lane LOS A B Approach Delay (s) Approach LOS B Intersection Summary Average Delay 0.8 Intersection Capacity Utilization 21.2% ICU Level of Service A Analysis Period (min) 15 Murrieta Apartments Traffic Impact Study C:\TRAMES\ \SYNCHRO\02 EAP AM.syn Trames Solutions, Inc. Synchro 8 Report D-3
69 HCM Unsignalized Intersection Capacity Analysis EAP (2013) AM Peak Hour 4: Murrieta Hot Springs Rd. (EW) & Driveway 2 9/19/2012 Movement EBL EBT WBT WBR SBL SBR Lane Configurations Volume (veh/h) Sign Control Free Free Stop Grade 0% 0% 0% Peak Hour Factor Hourly flow rate (vph) Pedestrians Lane Width (ft) Walking Speed (ft/s) Percent Blockage Right turn flare (veh) Median type None None Median storage veh) Upstream signal (ft) 806 px, platoon unblocked 0.88 vc, conflicting volume vc1, stage 1 conf vol vc2, stage 2 conf vol vcu, unblocked vol tc, single (s) tc, 2 stage (s) tf (s) p0 queue free % cm capacity (veh/h) Direction, Lane # EB 1 EB 2 EB 3 WB 1 WB 2 WB 3 SB 1 Volume Total Volume Left Volume Right csh Volume to Capacity Queue Length 95th (ft) Control Delay (s) Lane LOS B B Approach Delay (s) Approach LOS B Intersection Summary Average Delay 0.2 Intersection Capacity Utilization 41.3% ICU Level of Service A Analysis Period (min) 15 Murrieta Apartments Traffic Impact Study C:\TRAMES\ \SYNCHRO\02 EAP AM.syn Trames Solutions, Inc. Synchro 8 Report D-4
70 HCM Unsignalized Intersection Capacity Analysis EAP (2013) PM Peak Hour 1: Via Princesa (NS) & Clearbrook Dr. (EW) 9/19/2012 Movement WBL WBR NBT NBR SBL SBT Lane Configurations Volume (veh/h) Sign Control Stop Free Free Grade 0% 0% 0% Peak Hour Factor Hourly flow rate (vph) Pedestrians Lane Width (ft) Walking Speed (ft/s) Percent Blockage Right turn flare (veh) Median type None None Median storage veh) Upstream signal (ft) 334 px, platoon unblocked vc, conflicting volume vc1, stage 1 conf vol vc2, stage 2 conf vol vcu, unblocked vol tc, single (s) tc, 2 stage (s) tf (s) p0 queue free % cm capacity (veh/h) Direction, Lane # WB 1 NB 1 SB 1 Volume Total Volume Left Volume Right csh Volume to Capacity Queue Length 95th (ft) Control Delay (s) Lane LOS B A Approach Delay (s) Approach LOS B Intersection Summary Average Delay 3.7 Intersection Capacity Utilization 34.9% ICU Level of Service A Analysis Period (min) 15 Murrieta Apartments Traffic Impact Study C:\TRAMES\ \SYNCHRO\02 EAP PM.syn Trames Solutions, Inc. Synchro 8 Report D-5
71 HCM Signalized Intersection Capacity Analysis EAP (2013) PM Peak Hour 2: Via Princesa (NS) & Murrieta Hot Springs Rd. (EW) 9/19/2012 Movement EBL EBT EBR WBL WBT WBR NBL NBT NBR SBL SBT SBR Lane Configurations Volume (vph) Ideal Flow (vphpl) Total Lost time (s) Lane Util. Factor Frt Flt Protected Satd. Flow (prot) Flt Permitted Satd. Flow (perm) Peak-hour factor, PHF Adj. Flow (vph) RTOR Reduction (vph) Lane Group Flow (vph) Turn Type Prot NA Perm Prot NA Perm NA Perm NA Perm Protected Phases Permitted Phases Actuated Green, G (s) Effective Green, g (s) Actuated g/c Ratio Clearance Time (s) Vehicle Extension (s) Lane Grp Cap (vph) v/s Ratio Prot c0.16 c v/s Ratio Perm 0.03 c v/c Ratio Uniform Delay, d Progression Factor Incremental Delay, d Delay (s) Level of Service E B A E B D D D D D Approach Delay (s) Approach LOS B C D D Intersection Summary HCM Average Control Delay 22.0 HCM Level of Service C HCM Volume to Capacity ratio 0.59 Actuated Cycle Length (s) Sum of lost time (s) 8.0 Intersection Capacity Utilization 68.3% ICU Level of Service C Analysis Period (min) 15 c Critical Lane Group Murrieta Apartments Traffic Impact Study C:\TRAMES\ \SYNCHRO\02 EAP PM.syn Trames Solutions, Inc. Synchro 8 Report D-6
72 HCM Unsignalized Intersection Capacity Analysis EAP (2013) PM Peak Hour 3: Driveway 1 (NS) & Clearbrook Dr. (EW) 9/19/2012 Movement EBT EBR WBL WBT NBL NBR Lane Configurations Volume (veh/h) Sign Control Free Free Stop Grade 0% 0% 0% Peak Hour Factor Hourly flow rate (vph) Pedestrians Lane Width (ft) Walking Speed (ft/s) Percent Blockage Right turn flare (veh) Median type None None Median storage veh) Upstream signal (ft) px, platoon unblocked vc, conflicting volume vc1, stage 1 conf vol vc2, stage 2 conf vol vcu, unblocked vol tc, single (s) tc, 2 stage (s) tf (s) p0 queue free % cm capacity (veh/h) Direction, Lane # EB 1 WB 1 NB 1 Volume Total Volume Left Volume Right csh Volume to Capacity Queue Length 95th (ft) Control Delay (s) Lane LOS A B Approach Delay (s) Approach LOS B Intersection Summary Average Delay 0.4 Intersection Capacity Utilization 23.0% ICU Level of Service A Analysis Period (min) 15 Murrieta Apartments Traffic Impact Study C:\TRAMES\ \SYNCHRO\02 EAP PM.syn Trames Solutions, Inc. Synchro 8 Report D-7
73 HCM Unsignalized Intersection Capacity Analysis EAP (2013) PM Peak Hour 4: Murrieta Hot Springs Rd. (EW) & Driveway 2 9/19/2012 Movement EBL EBT WBT WBR SBL SBR Lane Configurations Volume (veh/h) Sign Control Free Free Stop Grade 0% 0% 0% Peak Hour Factor Hourly flow rate (vph) Pedestrians Lane Width (ft) Walking Speed (ft/s) Percent Blockage Right turn flare (veh) Median type None None Median storage veh) Upstream signal (ft) 806 px, platoon unblocked 0.77 vc, conflicting volume vc1, stage 1 conf vol vc2, stage 2 conf vol vcu, unblocked vol tc, single (s) tc, 2 stage (s) tf (s) p0 queue free % cm capacity (veh/h) Direction, Lane # EB 1 EB 2 EB 3 WB 1 WB 2 WB 3 SB 1 Volume Total Volume Left Volume Right csh Volume to Capacity Queue Length 95th (ft) Control Delay (s) Lane LOS B B Approach Delay (s) Approach LOS B Intersection Summary Average Delay 0.2 Intersection Capacity Utilization 43.4% ICU Level of Service A Analysis Period (min) 15 Murrieta Apartments Traffic Impact Study C:\TRAMES\ \SYNCHRO\02 EAP PM.syn Trames Solutions, Inc. Synchro 8 Report D-8
74 APPENDIX E EXISTING PLUS AMBIENT PLUS PROJECT PLUS CUMULATIVE CONDITIONS INTERSECTION ANALYSIS CALCULATION WORKSHEETS
75
76 HCM Unsignalized Intersection Capacity Analysis EAPC (2013) AM Peak Hour 1: Via Princesa (NS) & Clearbrook Dr. (EW) 9/19/2012 Movement WBL WBR NBT NBR SBL SBT Lane Configurations Volume (veh/h) Sign Control Stop Free Free Grade 0% 0% 0% Peak Hour Factor Hourly flow rate (vph) Pedestrians Lane Width (ft) Walking Speed (ft/s) Percent Blockage Right turn flare (veh) Median type None None Median storage veh) Upstream signal (ft) 334 px, platoon unblocked vc, conflicting volume vc1, stage 1 conf vol vc2, stage 2 conf vol vcu, unblocked vol tc, single (s) tc, 2 stage (s) tf (s) p0 queue free % cm capacity (veh/h) Direction, Lane # WB 1 NB 1 SB 1 Volume Total Volume Left Volume Right csh Volume to Capacity Queue Length 95th (ft) Control Delay (s) Lane LOS B A Approach Delay (s) Approach LOS B Intersection Summary Average Delay 6.3 Intersection Capacity Utilization 27.5% ICU Level of Service A Analysis Period (min) 15 Murrieta Apartments Traffic Impact Study C:\TRAMES\ \SYNCHRO\03 EAPC AM.syn Trames Solutions, Inc. Synchro 8 Report E-1
77 HCM Signalized Intersection Capacity Analysis EAPC (2013) AM Peak Hour 2: Via Princesa (NS) & Murrieta Hot Springs Rd. (EW) 9/19/2012 Movement EBL EBT EBR WBL WBT WBR NBL NBT NBR SBL SBT SBR Lane Configurations Volume (vph) Ideal Flow (vphpl) Total Lost time (s) Lane Util. Factor Frt Flt Protected Satd. Flow (prot) Flt Permitted Satd. Flow (perm) Peak-hour factor, PHF Adj. Flow (vph) RTOR Reduction (vph) Lane Group Flow (vph) Turn Type Prot NA Perm Prot NA Perm NA Perm NA Perm Protected Phases Permitted Phases Actuated Green, G (s) Effective Green, g (s) Actuated g/c Ratio Clearance Time (s) Vehicle Extension (s) Lane Grp Cap (vph) v/s Ratio Prot c c v/s Ratio Perm 0.02 c v/c Ratio Uniform Delay, d Progression Factor Incremental Delay, d Delay (s) Level of Service E B A E B D D D D D Approach Delay (s) Approach LOS B B D D Intersection Summary HCM Average Control Delay 19.7 HCM Level of Service B HCM Volume to Capacity ratio 0.49 Actuated Cycle Length (s) Sum of lost time (s) 12.0 Intersection Capacity Utilization 57.7% ICU Level of Service B Analysis Period (min) 15 c Critical Lane Group Murrieta Apartments Traffic Impact Study C:\TRAMES\ \SYNCHRO\03 EAPC AM.syn Trames Solutions, Inc. Synchro 8 Report E-2
78 HCM Unsignalized Intersection Capacity Analysis EAPC (2013) AM Peak Hour 3: Driveway 1 (NS) & Clearbrook Dr. (EW) 9/19/2012 Movement EBT EBR WBL WBT NBL NBR Lane Configurations Volume (veh/h) Sign Control Free Free Stop Grade 0% 0% 0% Peak Hour Factor Hourly flow rate (vph) Pedestrians Lane Width (ft) Walking Speed (ft/s) Percent Blockage Right turn flare (veh) Median type None None Median storage veh) Upstream signal (ft) px, platoon unblocked vc, conflicting volume vc1, stage 1 conf vol vc2, stage 2 conf vol vcu, unblocked vol tc, single (s) tc, 2 stage (s) tf (s) p0 queue free % cm capacity (veh/h) Direction, Lane # EB 1 WB 1 NB 1 Volume Total Volume Left Volume Right csh Volume to Capacity Queue Length 95th (ft) Control Delay (s) Lane LOS A B Approach Delay (s) Approach LOS B Intersection Summary Average Delay 0.8 Intersection Capacity Utilization 21.2% ICU Level of Service A Analysis Period (min) 15 Murrieta Apartments Traffic Impact Study C:\TRAMES\ \SYNCHRO\03 EAPC AM.syn Trames Solutions, Inc. Synchro 8 Report E-3
79 HCM Unsignalized Intersection Capacity Analysis EAPC (2013) AM Peak Hour 4: Murrieta Hot Springs Rd. (EW) & Driveway 2 9/19/2012 Movement EBL EBT WBT WBR SBL SBR Lane Configurations Volume (veh/h) Sign Control Free Free Stop Grade 0% 0% 0% Peak Hour Factor Hourly flow rate (vph) Pedestrians Lane Width (ft) Walking Speed (ft/s) Percent Blockage Right turn flare (veh) Median type None None Median storage veh) Upstream signal (ft) 806 px, platoon unblocked 0.88 vc, conflicting volume vc1, stage 1 conf vol vc2, stage 2 conf vol vcu, unblocked vol tc, single (s) tc, 2 stage (s) tf (s) p0 queue free % cm capacity (veh/h) Direction, Lane # EB 1 EB 2 EB 3 WB 1 WB 2 WB 3 SB 1 Volume Total Volume Left Volume Right csh Volume to Capacity Queue Length 95th (ft) Control Delay (s) Lane LOS B B Approach Delay (s) Approach LOS B Intersection Summary Average Delay 0.2 Intersection Capacity Utilization 41.3% ICU Level of Service A Analysis Period (min) 15 Murrieta Apartments Traffic Impact Study C:\TRAMES\ \SYNCHRO\03 EAPC AM.syn Trames Solutions, Inc. Synchro 8 Report E-4
80 HCM Unsignalized Intersection Capacity Analysis EAPC (2013) PM Peak Hour 1: Via Princesa (NS) & Clearbrook Dr. (EW) 9/19/2012 Movement WBL WBR NBT NBR SBL SBT Lane Configurations Volume (veh/h) Sign Control Stop Free Free Grade 0% 0% 0% Peak Hour Factor Hourly flow rate (vph) Pedestrians Lane Width (ft) Walking Speed (ft/s) Percent Blockage Right turn flare (veh) Median type None None Median storage veh) Upstream signal (ft) 334 px, platoon unblocked vc, conflicting volume vc1, stage 1 conf vol vc2, stage 2 conf vol vcu, unblocked vol tc, single (s) tc, 2 stage (s) tf (s) p0 queue free % cm capacity (veh/h) Direction, Lane # WB 1 NB 1 SB 1 Volume Total Volume Left Volume Right csh Volume to Capacity Queue Length 95th (ft) Control Delay (s) Lane LOS B A Approach Delay (s) Approach LOS B Intersection Summary Average Delay 3.7 Intersection Capacity Utilization 34.9% ICU Level of Service A Analysis Period (min) 15 Murrieta Apartments Traffic Impact Study C:\TRAMES\ \SYNCHRO\03 EAPC PM.syn Trames Solutions, Inc. Synchro 8 Report E-5
81 HCM Signalized Intersection Capacity Analysis EAPC (2013) PM Peak Hour 2: Via Princesa (NS) & Murrieta Hot Springs Rd. (EW) 9/19/2012 Movement EBL EBT EBR WBL WBT WBR NBL NBT NBR SBL SBT SBR Lane Configurations Volume (vph) Ideal Flow (vphpl) Total Lost time (s) Lane Util. Factor Frt Flt Protected Satd. Flow (prot) Flt Permitted Satd. Flow (perm) Peak-hour factor, PHF Adj. Flow (vph) RTOR Reduction (vph) Lane Group Flow (vph) Turn Type Prot NA Perm Prot NA Perm NA Perm NA Perm Protected Phases Permitted Phases Actuated Green, G (s) Effective Green, g (s) Actuated g/c Ratio Clearance Time (s) Vehicle Extension (s) Lane Grp Cap (vph) v/s Ratio Prot c0.16 c v/s Ratio Perm 0.03 c v/c Ratio Uniform Delay, d Progression Factor Incremental Delay, d Delay (s) Level of Service E B A E C D D D D D Approach Delay (s) Approach LOS B C D D Intersection Summary HCM Average Control Delay 22.1 HCM Level of Service C HCM Volume to Capacity ratio 0.59 Actuated Cycle Length (s) Sum of lost time (s) 8.0 Intersection Capacity Utilization 68.6% ICU Level of Service C Analysis Period (min) 15 c Critical Lane Group Murrieta Apartments Traffic Impact Study C:\TRAMES\ \SYNCHRO\03 EAPC PM.syn Trames Solutions, Inc. Synchro 8 Report E-6
82 HCM Unsignalized Intersection Capacity Analysis EAPC (2013) PM Peak Hour 3: Driveway 1 (NS) & Clearbrook Dr. (EW) 9/19/2012 Movement EBT EBR WBL WBT NBL NBR Lane Configurations Volume (veh/h) Sign Control Free Free Stop Grade 0% 0% 0% Peak Hour Factor Hourly flow rate (vph) Pedestrians Lane Width (ft) Walking Speed (ft/s) Percent Blockage Right turn flare (veh) Median type None None Median storage veh) Upstream signal (ft) px, platoon unblocked vc, conflicting volume vc1, stage 1 conf vol vc2, stage 2 conf vol vcu, unblocked vol tc, single (s) tc, 2 stage (s) tf (s) p0 queue free % cm capacity (veh/h) Direction, Lane # EB 1 WB 1 NB 1 Volume Total Volume Left Volume Right csh Volume to Capacity Queue Length 95th (ft) Control Delay (s) Lane LOS A B Approach Delay (s) Approach LOS B Intersection Summary Average Delay 0.4 Intersection Capacity Utilization 23.0% ICU Level of Service A Analysis Period (min) 15 Murrieta Apartments Traffic Impact Study C:\TRAMES\ \SYNCHRO\03 EAPC PM.syn Trames Solutions, Inc. Synchro 8 Report E-7
83 HCM Unsignalized Intersection Capacity Analysis EAPC (2013) PM Peak Hour 4: Murrieta Hot Springs Rd. (EW) & Driveway 2 9/19/2012 Movement EBL EBT WBT WBR SBL SBR Lane Configurations Volume (veh/h) Sign Control Free Free Stop Grade 0% 0% 0% Peak Hour Factor Hourly flow rate (vph) Pedestrians Lane Width (ft) Walking Speed (ft/s) Percent Blockage Right turn flare (veh) Median type None None Median storage veh) Upstream signal (ft) 806 px, platoon unblocked 0.77 vc, conflicting volume vc1, stage 1 conf vol vc2, stage 2 conf vol vcu, unblocked vol tc, single (s) tc, 2 stage (s) tf (s) p0 queue free % cm capacity (veh/h) Direction, Lane # EB 1 EB 2 EB 3 WB 1 WB 2 WB 3 SB 1 Volume Total Volume Left Volume Right csh Volume to Capacity Queue Length 95th (ft) Control Delay (s) Lane LOS B B Approach Delay (s) Approach LOS B Intersection Summary Average Delay 0.2 Intersection Capacity Utilization 43.7% ICU Level of Service A Analysis Period (min) 15 Murrieta Apartments Traffic Impact Study C:\TRAMES\ \SYNCHRO\03 EAPC PM.syn Trames Solutions, Inc. Synchro 8 Report E-8
. -. ~. -\"'-l'\".")
84 r! I 1 If l-1 '/ / (/) m ("). -. ~. -"'-l'". _I
886 March Road McDonald's Transportation Study
 McDonald's Restaurants of Canada Limited March 2013 886 March Road McDonald's Transportation Study Submitted by: HDR Corporation 100 York Boulevard, Suite 300 Richmond Hill, ON L4B 1J8 (905) 882-4100 www.hdrinc.com
L1TILE BEARS DAY CARE TRANSPORTATION IMPACT STUDY FORT COLLINS, COLORADO MAY Prepared for:
 L1TILE BEARS DAY CARE TRANSPORTATION IMPACT STUDY FORT COLLINS, COLORADO MAY 2012 Prepared for: Hillside Construction, Inc. 216 Hemlock Street, Suite B Fort Collins, CO 80534 Prepared by: DELICH ASSOCIATES
Sugarland Crossing Gwinnett County, Georgia
 Sugarland Crossing Gwinnett County, Georgia S IGNAL W ARRANT A NALYSIS For the Intersection of: Sugarloaf Parkway / Richards Middle School Driveway / Sugarland Crossing Main Site Driveway Prepared for:
ZINFANDEL LANE / SILVERADO TRAIL INTERSECTION TRAFFIC ANALYSIS
 ZINFANDEL LANE / SILVERADO TRAIL INTERSECTION TRAFFIC ANALYSIS UPDATED TRAFFIC STUDY FOR THE PROPOSED RAYMOND VINEYARDS WINERY USE PERMIT MODIFICATION #P11-00156 AUGUST 5, 2014 PREPARED BY: OMNI-MEANS,
HCM Unsignalized Intersection Capacity Analysis 6: Brian Street & LC 111 5/26/2009
 6: Brian Street & LC 111 5/26/2009 Movement EBL EBR NBL NBT SBT SBR Volume (veh/h) 116 20 8 405 137 56 Sign Control Stop Free Free Grade 0% 0% 0% Peak Hour Factor 0.81 0.81 0.67 0.67 0.89 0.89 Hourly flow
 Traffic Analysis For Approved Uses within the St. Lucie West DRI Aldi Port St. Lucie, FL Prepared for: Bohler Engineering, LLC 1000 Corporate Drive Suite 250 Fort Lauderdale, FL 33334 Prepared by: 10795
MEMORANDUM. Date: November 4, Cheryl Burrell, Pebble Beach Company. Rob Rees, P.E. Inclusionary Housing Transportation Analysis WC
 MEMORANDUM Date: November 4, 2013 To: From: Subject: Cheryl Burrell, Pebble Beach Company Rob Rees, P.E. Inclusionary Housing Transportation Analysis As requested, Fehr & Peers is providing clarification
Village of Richmond Transportation Brief
 Village of Richmond Transportation Brief GENIVAR Project Number 111-18482-00 June 21 st, 2011 www.genivar.com GENIVAR 15 Fitzgerald Road, Suite 100 Ottawa, Ontario, CANADA K2H 9G1 Telephone: 613-829-2800
Provide an overview of the development proposal including projected site traffic volumes;
 December 19, 2013 File: 163600935 Attention: Troy Elliott Carl Elliott Limited 15-1831 Robertson Road PO Box 11117 Nepean, Ontario K1H 7T8 Dear Mr. Elliott, Reference: 2235 and 2265 Robertson Road Transportation
RESPONSE TO TRAFFIC IMPACT STUDY COMMENTS
 RESPONSE TO TRAFFIC IMPACT STUDY COMMENTS Proposed Gas Station 40 Arthur Street (Highway 26), Town of the Blue Mountains (Thornbury), County of Grey, Ontario AUGUST 2013 August 27, 2013 MR. REG RUSSWURM
ARVADA TRIANGLE REDEVELOPMENT TRAFFIC IMPACT ANALYSIS
 ARVADA TRIANGLE REDEVELOPMENT TRAFFIC IMPACT ANALYSIS Prepared for: Arvada Urban Renewal Authority 5601 Olde Wadsworth Boulevard, Suite 210 Arvada, Colorado 80002 (720) 898-7062 Prepared by: Felsburg Holt
Barrhaven Honda Dealership. Dealership Drive, Ottawa, ON. Transportation Brief
 Barrhaven Honda Dealership Dealership Drive, Ottawa, ON Transportation Brief Prepared By: NOVATECH Suite 200, 240 Michael Cowpland Drive Ottawa, Ontario K2M 1P6 September, 2015 File: 115136 Ref: R-2015-152
Traffic Impact Study Proposed Commercial Development Ballwin, Missouri. Technical Memorandum for Traffic Impact Study
 Traffic Impact Study Proposed Commercial Development Ballwin, Missouri Technical Memorandum for Traffic Impact Study Crawford, Bunte, Brammeier May 1, 2009 MEMORANDUM Date: April 24, 2009 To: From: Subject:
TRAFFIC IMPACT STUDY DERRY GREEN CORPORATE BUSINESS PARK MILTON SECONDARY PLAN MODIFICATION
 TRAFFIC IMPACT STUDY DERRY GREEN CORPORATE BUSINESS PARK MILTON SECONDARY PLAN MODIFICATION TRAFFIC IMPACT STUDY DERRY GREEN CORPORATE BUSINESS PARK MILTON SECONDARY PLAN MODIFICATION DECEMBER 2014 UPDATED
Oakbrook Village Plaza City of Laguna Hills
 Oakbrook Village Plaza City of Laguna Hills Traffic Impact Analysis Prepared by: HDR Engineering 3230 El Camino Real, Suite 200 Irvine, CA 92602 October 2012 Revision 3 D-1 Oakbrook Village Plaza Laguna
KUM & GO 6400 WESTOWN PARKWAY WEST DES MOINES, IOWA 50266
 KUM & GO #300 PECOS STREET & 88 TH AVENUE THORNTON, COLORADO TRAFFIC IMPACT STUDY REVISION 1 PREPARED FOR KUM & GO 6400 WESTOWN PARKWAY WEST DES MOINES, IOWA 50266 JANUARY 23, 2014 OA PROJECT NO. 013-1721
Traffic Impact Study Hudson Street Parking Garage MC Project No.: A Table of Contents
 Traffic Impact Study Hudson Street Parking Garage MC Project No.: 15001714A Table of Contents Table of Contents I. INTRODUCTION... 1 II. EXISTING CONDITIONS... 4 III. 2015 EXISTING TRAFFIC CONDITIONS...
TRAFFIC AND TRANSPORTATION TECHNICAL MEMORANDUM
 TRAFFIC AND TRANSPORTATION TECHNICAL MEMORANDUM for ENVIRONMENTAL ASSESSMENT US 460 Bypass Interchange and Southgate Drive Relocation State Project No.: 0460-150-204, P101, R201, C501, B601; UPC 99425
STANDARD LIMITATIONS
 STANDARD LIMITATIONS This report was prepared by MMM Group (MMM) for the account of Spire Construction Inc. (the Client). The disclosure of any information contained in this report is the sole responsibility
APPENDIX G. Traffic Data
 APPENDIX G Traffic Data HCM Signalized Intersection Capacity Analysis 2: Duanesburg Road & I-88 Ramps 10/7/2004 Movement EBL EBT EBR WBL WBT WBR NBL NBT NBR SBL SBT SBR Lane Configurations Ideal Flow (vphpl)
April Salvation Army Barrhaven Church 102 Bill Leathem Drive Transportation Brief
 April 26 Salvation Army Barrhaven Church 2 Bill Leathem Drive Transportation Brief Salvation Army Barrhaven Church 2 Bill Leathem Drive Transportation Brief prepared for: The Salvation Army 2 Overlea Blvd.
One Harbor Point Residential
 Residential Gig Harbor, WA Transportation Impact Analysis January 23, 2017 Prepared for: Neil Walter Company PO Box 2181 Tacoma, WA 98401 Prepared by: TENW Transportation Engineering NorthWest 11400 SE
Bennett Pit. Traffic Impact Study. J&T Consulting, Inc. Weld County, Colorado. March 3, 2017
 Bennett Pit Traffic Impact Study J&T Consulting, Inc. Weld County, Colorado March 3, 217 Prepared By: Sustainable Traffic Solutions, Inc. http://www.sustainabletrafficsolutions.com/ Joseph L. Henderson,
Lakeside Terrace Development
 Lakeside Terrace Development City of Barrie, County of Simcoe Traffic Brief for: Type of Document: Final Report Project Number: JDE 1617 Date Submitted: April 29 th, 216 4/29/16 John Northcote, P.Eng.
(A) Project Manager, Infrastructure Approvals
 Project Manager, Infrastructure Approvals") February 14th, 2014 BY E-MAIL: wally.dubyk@ottawa.ca City of Ottawa Planning and Growth Management Branch 110 Laurier Ave. W., 4 th Floor, Ottawa, Ontario K1P 1J1 Attention: Wally Dubyk, C.E.T (A) Project
February 14th, 2014 BY E-MAIL: wally.dubyk@ottawa.ca City of Ottawa Planning and Growth Management Branch 110 Laurier Ave. W., 4 th Floor, Ottawa, Ontario K1P 1J1 Attention: Wally Dubyk, C.E.T (A) Project
TECHNICAL MEMORANDUM Upper Broadway Road Diet Summary of Findings
 TECHNICAL MEMORANDUM Summary of Findings Date: June 17, 2014 Project #: 17121.15 To: Si Lau, P.E.; City of Oakland, CA From: Erin Ferguson, P.E.; Aaron Elias, P.E.; Daphne Dethier; and Mark Bowman, P.E.;
Table 1 - Land Use Comparisons - Proposed King s Wharf Development. Retail (SF) Office (SF) 354 6,000 10, Land Uses 1
 Office (SF) 354 6,000 10, Land Uses 1") Ref. No. 171-6694 Phase 2 November 23, 217 Mr. David Quilichini, Vice President Fares & Co. Developments Inc. 31 Place Keelson Sales Centre DARTMOUTH NS B2Y C1 Sent Via Email to David@faresinc.com RE:
Ref. No. 171-6694 Phase 2 November 23, 217 Mr. David Quilichini, Vice President Fares & Co. Developments Inc. 31 Place Keelson Sales Centre DARTMOUTH NS B2Y C1 Sent Via Email to David@faresinc.com RE:
LOST LAKE CORRIDOR REVIEW
 LOST LAKE CORRIDOR REVIEW Prepared for: Prepared by: Broadview Developments Inc. c/o Westbrook Consulting Watt Consulting Group Our File: 2064.B01 Date: October 31, 2016 TABLE OF CONTENTS 1.0 INTRODUCTION...
Weaver Road Senior Housing Traffic Impact Analysis
 Gibson Traffic Consultants, Inc. 2813 Rockefeller Avenue Suite B Everett, WA 9821 425.339.8266 Weaver Road Senior Housing Traffic Impact Analysis Jurisdiction: City of Snohomish January 218 GTC #17-37
MERIVALE PRIORITY SQUARE 2852 MERIVALE ROAD CITY OF OTTAWA TRANSPORTATION BRIEF. Prepared for: ONT Inc. 25 Winding Way Nepean, Ontario K2C 3H1
 MERIVALE PRIORITY SQUARE 2852 MERIVALE ROAD CITY OF OTTAWA TRANSPORTATION BRIEF Prepared for: 2190986ONT Inc. 25 Winding Way Nepean, Ontario K2C 3H1 October 6, 2010 110-502 Report_1.doc D. J. Halpenny
LATSON INTERCHANGE DEVELOPMENT TRAFFIC STUDIES. Genoa Township, Livingston County, MI
 LATSON INTERCHANGE DEVELOPMENT TRAFFIC STUDIES Genoa Township, Livingston County, MI DRAFT TRAFFIC STUDY FOR I-96 AT LATSON RD INTERCHANGE Livingston County CS 47065 JN 101622C Submitted to: Michigan Department
LAWRENCE TRANSIT CENTER LOCATION ANALYSIS 9 TH STREET & ROCKLEDGE ROAD / 21 ST STREET & IOWA STREET LAWRENCE, KANSAS
 LAWRENCE TRANSIT CENTER LOCATION ANALYSIS 9 TH STREET & ROCKLEDGE ROAD / 21 ST STREET & IOWA STREET LAWRENCE, KANSAS TRAFFIC IMPACT STUDY FEBRUARY 214 OA Project No. 213-542 TABLE OF CONTENTS 1. INTRODUCTION...
JRL consulting. March Hartland Developments Limited 1993 Hammonds Plains Road Hammonds Plains, NS B4B 1P3
 March 2015 Prepared for Hartland Developments Limited 1993 Hammonds Plains Road Hammonds Plains, NS B4B 1P3 JRL consulting JRL consulting TABLE OF CONTENTS 1 INTRODUCTION... 2 1.1 BACKGROUND... 2 2 EXISTING
Interstate 80 Corridor Study
 Interstate 80 Corridor Study Final Technical Memorandum 5: Traffic Volumes, Accident Locations and Operational Deficiencies West Verdi (SR 425) Interchange to West McCarran Boulevard (SR 651) and East
Traffic Impact Analysis Update
 Willow Bend Traffic Impact Analysis Update TABLE OF CONTENTS Page I. INTRODUCTION -------------------------------------------------------------------------------------------- 1 II. EXISTING CONDITIONS
MEMO. McCORMICK RANKIN CORPORATION. File FROM: Keyur Shah DATE: February 1, 2010 COPIES: OUR FILE: SUBJECT: TO:
 McCORMICK RANKIN CORPORATION 2655 North Sheridan Way Mississauga, Ontario, L5K 2P8 Tel: (905)823-8500 Fax: (905) 823-8503 E-mail: mrc@mrc.ca Website: www.mrc.ca MEMO TO: File FROM: Keyur Shah DATE: February
Appendix B: Traffic Reports
 Appendix B: Traffic Reports 407 TRANSITWAY - KENNEDY ROAD TO BROCK ROAD MINISTRY OF TRANSPORTATION - CENTRAL REGION Report Markham Road Station Traffic Study Prepared for Ministry of Transportation, Ontario
Zachary Bugg, PhD, Diego Arguea, PE, and Phill Worth University of Oregon North Campus Conditional Use Permit Application Transportation Assessment
 MEMORANDUM Date: June 22, 2018 Project #: 21562 To: Colin McArthur, AICP From: Project: Subject: Zachary Bugg, PhD, Diego Arguea, PE, and Phill Worth University of Oregon North Campus Conditional Use Permit
Traffic Impact Study Morgan Road Commerce Park Pasco County, Florida
 Traffic Impact Study Morgan Road Commerce Park Pasco County, Florida Summary Report June 2008 Prepared by: 12909 N 56 th Street # 201 Tampa, FL 33617 Ph: (813) 988-3180 Fax: (813) 343-6854 Morgan Road
Re: Residential Development - Ogilvie/Cummings Transportation Overview
 1223 Michael Street, Suite 100, Ottawa, ON K1J 7T2 Tel: 613.738.4160 Fax: 613.739.7105 www.delcan.com March 28, 2012 OUR REF: TO3088TOY Barry J. Hobin & Architects 63 Pamilla Street Ottawa, ON K1S 3K7
June 21, Mr. Jeff Mark The Landhuis Company 212 North Wahsatch Avenue, Suite 301. Colorado Springs, CO 80903
 LSC TRANSPORTATION CONSULTANTS, INC. 545 East Pikes Peak Avenue, Suite 210 Colorado Springs, CO 80903 (719) 633-2868 FAX (719) 633-5430 E-mail: lsc@lsctrans.com Website: http://www.lsctrans.com June 21,
Traffic Impact Analysis Farmington Center Village
 Traffic Impact Analysis Farmington Center Village Route 4 (Farmington Avenue) Farmington, Connecticut Prepared for: The Town of Farmington, CT Prepared By: BL Companies Meriden, Connecticut December 2016
Wellington Street West
 Transportation Brief prepared for: 185 Davenport Road Suite 300 Toronto, ON M5R 1J1 prepared by: 1223 Michael Street Suite 100 Ottawa, ON K1J 7T2 November 5, 2013 TO3131TOH Transportation Brief November
Re: Cyrville Road Car Dealership
 1223 Michael Street, Suite 100, Ottawa, ON K1J 7T2 Tel: 613.738.4160 Fax: 613.739.7105 www.delcan.com February 25, 2013 OUR REF: TO3098TOE Mark Motors of Ottawa 611 Montreal Road Ottawa, ON K1K 0T8 Attention:
BUCKLEY ANNEX REDEVELOPMENT PLAN TRANSPORTATION ANALYSIS ADDENDUM
 BUCKLEY ANNEX REDEVELOPMENT PLAN TRANSPORTATION ANALYSIS ADDENDUM Prepared for: City and County of Denver Prepared by: Contact: Brian Bern, P.E., PTOE 303.572.0200 On Behalf of: Lowry Redevelopment Authority
Paisley & Whitelaw - Paisley Park OPA / ZBA for Mixed Density Residential Use
 Paisley & Whitelaw - Paisley Park OPA / ZBA for Mixed Density Residential Use Transportation Impact Study City of Guelph Prepared for: Armel Corporation August 2018 Table of Contents 1 Introduction...
LEMON FLATS SECOND ACCESS
 LEMON FLATS SECOND ACCESS RECONNAISSANCE STUDY SEPTEMBER 2007 APPENDIX A Synchro Analysis Worksheets HCM Signalized Intersection Capacity Analysis 2005 - Background 3: Anka Street & Lemon Flats Second
Addendum to Traffic Impact Analysis for Port Marigny Site Mandeville, LA
 Addendum to Traffic Impact Analysis for Port Marigny Site Mandeville, LA (St. Tammany Parish Mandeville, LA) Prepared For The Pittman Companies Michael N Pittman, MD 328 East Boston St Covington, LA 70433
267 O Connor Street Residential Development
 M a y 2014 267 O Connor Street Residential Development Transportation Brief Google 2014 Bing 2014 Prepared for: MASTERCRAFT STARWOOD Prepared by: Study 267 O'Connor Type Street May 2014 Study Residential
APPENDICES. APPENDIX D Synchro Level of Service Output Sheets
 APPENDICES APPENDIX D Synchro Level of Service Output Sheets Lanes, Volumes, Timings NO BUILD 2016 PM 8: 10th St & Thain Rd 10/05/2016 Lane Group NBL NBT NBR SBL SBT SBR SEL SET SER NWL NWT NWR
Lacey Gateway Residential Phase 1
 Lacey Gateway Residential Phase Transportation Impact Study April 23, 203 Prepared for: Gateway 850 LLC 5 Lake Bellevue Drive Suite 02 Bellevue, WA 98005 Prepared by: TENW Transportation Engineering West
CastleGlenn Consultants Inc.
 CastleGlenn Consultants Inc. Engineers, Project Managers & Planners March 11 th, 2013 Domenic Idone, P. Eng Planning Manager R.W. Tomlinson Ltd. 5597 Power Road Ottawa, Ontario K1G 3N4 Dear Mr. Idone:
MMM Group Limited. Communities. Transportation. Buildings. Infrastructure
 MMM Group Limited Traffic Study CASA MIA Community Care Facility Vancouver, BC Communities Transportation Buildings Infrastructure February 2013 5011001-033 STANDARD LIMITATIONS This report was prepared
APPENDIX C1 TRAFFIC ANALYSIS DESIGN YEAR TRAFFIC ANALYSIS
 APPENDIX C1 TRAFFIC ANALYSIS DESIGN YEAR TRAFFIC ANALYSIS DESIGN YEAR TRAFFIC ANALYSIS February 2018 Highway & Bridge Project PIN 6754.12 Route 13 Connector Road Chemung County February 2018 Appendix
TRANSPORTATION ANALYSIS. Wawa US 441 and Morningside Drive. Prepared for: Brightwork Real Estate, Inc.
 TRANSPORTATION ANALYSIS Wawa US 441 and Morningside Drive Prepared for: Brightwork Real Estate, Inc. TABLE OF CONTENTS Introduction... 1 Project Description... 1 Estimated Daily Project Traffic... 3 Estimated
Ref. No Task 3. April 28, Mr. Cesar Saleh, P. Eng. VP Planning and Design W.M. Fares Group th
 Ref. No. 151-00564 Task 3 April 28, 2015 Mr. Cesar Saleh, P. Eng. VP Planning and Design W.M. Fares Group th 3480 Joseph Howe Drive, 5 Floor HALIFAX NS B3L 4H7 Sent via Email to ceasr.saleh@wmfares.com
Traffic Impact Analysis 5742 BEACH BOULEVARD MIXED USE PROJECT
 Traffic Impact Analysis 5742 BEACH BOULEVARD MIXED USE PROJECT CITY OF BUENA PARK Prepared by Project No. 14139 000 April 17 th, 2015 DKS Associates Jeffrey Heald, P.E. Rohit Itadkar, T.E. 2677 North Main
Perris Apartments Traffic Impact Analysis City of Perris, California
 Perris Apartments Traffic Impact Analysis City of Perris, California Prepared for: JD Pierce Company, Inc. 2222 Martin St., Suite 100 Irvine, CA 92612 Prepared by: TJW ENGINEERING, INC. 540 N. Golden Circle
TRAFFIC DATA. Existing Derousse Ave./River Rd. AM LOS Analysis Existing Derousse Ave./River Rd. PM LOS Analysis
 Appendix E NJ TRANSIT Pennsauken Junction Transit Center and Park & Ride RiverLINE and Atlantic City Line Pennsauken Township, Camden County, New Jersey TRAFFIC DATA Background Traffic Information for
DEVELOPMENT PROPERTY 1627 MAXIME STREET CITY OF OTTAWA TRANSPORTATION OVERVIEW. Prepared for: Subhas Bhargava. July 9, Overview_1.
 DEVELOPMENT PROPERTY 1627 MAXIME STREET CITY OF OTTAWA TRANSPORTATION OVERVIEW Prepared for: Subhas Bhargava July 9, 2015 115-620 Overview_1.doc D. J. Halpenny & Associates Ltd. Consulting Transportation
Wellings Communities Holding Inc and Extendicare (Canada) Inc Hazeldean Road. Transportation Impact Study. Ottawa, Ontario. Project ID
 Inc Hazeldean Road. Transportation Impact Study. Ottawa, Ontario. Project ID") Wellings Communities Holding Inc and Extendicare (Canada) Inc. 5731 Hazeldean Road Transportation Impact Study Ottawa, Ontario Project ID 160401195 Prepared by: Stantec Consulting Ltd. March 2016 WELLINGS
Wellings Communities Holding Inc and Extendicare (Canada) Inc. 5731 Hazeldean Road Transportation Impact Study Ottawa, Ontario Project ID 160401195 Prepared by: Stantec Consulting Ltd. March 2016 WELLINGS
Salvini Consulting Inc. 459 Deer Ridge Drive Kitchener, ON N2P 0A November 8, 2017 Revised December 20, 2017
 Salvini Consulting Inc. 459 Deer Ridge Drive Kitchener, ON N2P 0A7 519-591-0426 November 8, 2017 Revised December 20, 2017 Laurie Wills, PEng Deputy Director of Public Works Town of Cobourg 740 Division
10 th Street Residences Development Traffic Impact Analysis
 Gibson Traffic Consultants, Inc. 2813 Rockefeller Avenue Suite B Everett, WA 98201 425.339.8266 10 th Street Residences Development Traffic Impact Analysis Jurisdiction: City of Snohomish September 2018
King Soopers #116 Thornton, Colorado
 Traffic Impact Study King Soopers #116 Thornton, Colorado Prepared for: Galloway & Company, Inc. T R A F F I C I M P A C T S T U D Y King Soopers #116 Thornton, Colorado Prepared for Galloway & Company
INTERCHANGE OPERTIONS STUDY Interstate 77 / Wallings Road Interchange
 INTERCHANGE OPERTIONS STUDY Interstate 77 / Wallings Road Interchange City of Broadview Heights, Cuyahoga County, Ohio Prepared For: City of Broadview Heights Department of Engineering 9543 Broadview Road
Rockingham Ridge Plaza Commercial Development Halifax Regional Municipality
 Rockingham Ridge Plaza Commercial Development Halifax Regional Municipality Traffic Impact Study Final Draft Report Prepared by: GRIFFIN transportation group inc. 30 Bonny View Drive Fall River, NS B2T
TRAFFIC SIGNAL DESIGN REPORT KING OF PRUSSIA ROAD & RAIDER ROAD RADNOR TOWNSHIP PENNSYLVANIA
 TRAFFIC SIGNAL DESIGN REPORT KING OF PRUSSIA ROAD & RAIDER ROAD RADNOR TOWNSHIP PENNSYLVANIA PREPARED FOR: UNIVERSITY OF PENNSYLVANIA HEALTH SYSTEM 34 CIVIC CENTER BOULEVARD PHILADELPHIA, PA 1987 (61)
Traffic Impact Study. Eastern Springs. A Proposed Development in Manorville, NY. April Haas Group Inc Transportation Planners and Engineers
 Traffic Impact Study For Eastern Springs A Proposed Development in Manorville, NY April 2018 Haas Group Inc Transportation Planners and Engineers Table of Contents 1) Executive Summary... 2 2) Study Purpose...
Appendix I: The Project Traffic Impact Study report by TJKM Transportation Consultants
 Appendix I: The Project Traffic Impact Study report by TJKM Transportation Consultants TJKM Transportation Consultants Draft Report Traffic Impact Study for the Residential Development at 4659 Proctor
Alpine Highway to North County Boulevard Connector Study
 Alpine Highway to North County Boulevard Connector Study prepared by Avenue Consultants March 16, 2017 North County Boulevard Connector Study March 16, 2017 Table of Contents 1 Summary of Findings... 1
Traffic Impact Statement (TIS)
") Traffic Impact Statement (TIS) Vincentian PUDA Collier County, FL 10/18/2013 Prepared for: Global Properties of Naples Prepared by: Trebilcock Consulting Solutions, PA 2614 Tamiami Trail N, Suite 615 1205
Traffic Impact Statement (TIS) Vincentian PUDA Collier County, FL 10/18/2013 Prepared for: Global Properties of Naples Prepared by: Trebilcock Consulting Solutions, PA 2614 Tamiami Trail N, Suite 615 1205
Traffic Impact Analysis. Alliance Cole Avenue Residential Site Dallas, Texas. Kimley-Horn and Associates, Inc. Dallas, Texas.
 Traffic Impact Analysis Alliance Cole Avenue Residential Site Dallas, Texas February 15, 2018 Kimley-Horn and Associates, Inc. Dallas, Texas Project #064524900 Registered Firm F-928 Traffic Impact Analysis
APPENDICES. No Cumulative Impact Project Alternative Traffic Analysis Memorandum (May 2016)
") APPENDICES Appendix T No Cumulative Impact Project Alternative Traffic Analysis Memorandum (May 2016) 661 Bear Valley Parkway EIR March 2017 APPENDICES This page intentionally left blank 661 Bear Valley
APPENDICES Appendix T No Cumulative Impact Project Alternative Traffic Analysis Memorandum (May 2016) 661 Bear Valley Parkway EIR March 2017 APPENDICES This page intentionally left blank 661 Bear Valley
C. iv) Analysis/Results
 Analysis/Results") The Pettengill Road project is located outside the borders of the model in an external zone. As a result, inserting all Pettengill Road trip generation assumptions into the NRPC model and running a new
The Pettengill Road project is located outside the borders of the model in an external zone. As a result, inserting all Pettengill Road trip generation assumptions into the NRPC model and running a new
Date: December 20, Project #:
 To: Craig Rottenberg Long s Jewelers 60A South Avenue Burlington, MA 01803 From: Patrick Dunford, P.E. Senior Project Manager Date: December 20, 2018 Project #: 14416.00 Re: Burlington Mall Proposed Long
Transportation & Traffic Engineering
 Transportation & Traffic Engineering 1) Project Description This report presents a summary of findings for a Traffic Impact Analysis (TIA) performed by A+ Engineering, Inc. for the Hill Country Family
TRAFFIC IMPACT ANALYSIS FOR. McDONALD S RESTAURANT IN CARMICAEL Sacramento County, CA. Prepared For:
 TRAFFIC IMPACT ANALYSIS FOR McDONALD S RESTAURANT IN CARMICAEL Sacramento County, CA Prepared For: McDonald s USA, LLC Pacific Sierra Region 2999 Oak Road, Suite 900 Walnut Creek, CA 94597 Prepared By:
4.14 TRANSPORTATION AND CIRCULATION
 4.14 TRANSPORTATION AND CIRCULATION 4.14.1 Summary Table 4.14-1 summarizes the identified environmental impacts, proposed mitigation measures, and residual impacts of the proposed project with regard to
Traffic Engineering Study
 Traffic Engineering Study Bellaire Boulevard Prepared For: International Management District Technical Services, Inc. Texas Registered Engineering Firm F-3580 November 2009 Executive Summary has been requested
Traffic Impact Study Speedway Gas Station Redevelopment
 Traffic Impact Study Speedway Gas Station Redevelopment Warrenville, Illinois Prepared For: Prepared By: April 11, 2018 Table of Contents 1. Introduction... 1 2. Existing Conditions... 4 Site Location...
Proposed Hotel and Restaurant Development
 Traffic Impact Study Proposed Hotel and Restaurant Development Marbledale Road Tuckahoe, NY PREPARED FOR BILLWIN DEVELOPMENT AFFILIATES, LLC 365 WHITE PLAINS ROAD EASTCHESTER, NY. 10709 PREPARED BY Engineering
Sweetwater Landing Traffic Impact Analysis
 Gibson Traffic Consultants, Inc. 8 Rockefeller Avenue Suite B Everett, WA 98 45.9.8 Sweetwater Landing Traffic Impact Analysis Jurisdiction: City of Snohomish February 8 GTC #7-87 Sweetwater Landing Traffic
MEMO VIA . Ms. Amy Roth DPS Director, City of Three Rivers. To:
 MEMO To: Ms. Amy Roth DPS Director, City of Three Rivers VIA EMAIL From: Michael J. Labadie, PE Julie M. Kroll, PE, PTOE Brandon Hayes, PE, P.Eng. Fleis & VandenBrink Date: January 5, 2017 Re: Proposed
Final Technical Report US 17 Corridor Study Update (Market Street Road Diet)
") Market Street Road Diet Wilmington, NC 2016 Final Technical Report US 17 Corridor Study Update (Market Street Road Diet) Wilmington, NC Parsons Brinckerhoff January 2016 FINAL TECHNICAL REPORT US 17 Corridor
Market Street Road Diet Wilmington, NC 2016 Final Technical Report US 17 Corridor Study Update (Market Street Road Diet) Wilmington, NC Parsons Brinckerhoff January 2016 FINAL TECHNICAL REPORT US 17 Corridor
TIMBERVINE TRANSPORTATION IMPACT STUDY FORT COLLINS, COLORADO JANUARY Prepared for:
 TIMBERVINE TRANSPORTATION IMPACT STUDY FORT COLLINS, COLORADO JANUARY 2014 Prepared for: Hartford Companies 1218 W. Ash Street Suite A Windsor, Co 80550 Prepared by: DELICH ASSOCIATES 2272 Glen Haven Drive
Proposed Office Building Traffic Impact Study Chicago Avenue Evanston, Illinois
 Proposed Office Building Traffic Impact Study 1714-1720 Chicago Avenue Evanston, Illinois Prepared For: HOLABIRD & ROOT, LLC Prepared by: Eriksson Engineering Associates, Ltd. 145 Commerce Drive, Ste A,
EXECUTIVE SUMMARY. The following is an outline of the traffic analysis performed by Hales Engineering for the traffic conditions of this project.
 EXECUTIVE SUMMARY This study addresses the traffic impacts associated with the proposed Shopko redevelopment located in Sugarhouse, Utah. The Shopko redevelopment project is located between 1300 East and
BARRHAVEN FELLOWSHIP CRC 3058 JOCKVALE ROAD OTTAWA, ONTARIO TRANSPORTATION BRIEF. Prepared for:
 BARRHAVEN FELLOWSHIP CRC 3058 JOCKVALE ROAD OTTAWA, ONTARIO TRANSPORTATION BRIEF Prepared for: Barrhaven Fellowship CRC 3058 Jockvale Road Ottawa, ON K2J 2W7 December 7, 2016 116-649 Report_1.doc D. J.
MEMORANDUM November 19, 2012
 COUNCIL OF GOVERNMENTS CENTRAL NAUGATUCK VALLEY 60 NORTH MAIN ST 3RD Floor WATERBURY, CT 06702-1403 (203)757-0535 Web Site: www.cogcnv.org E-Mail: cogcnv@cogcnv.org November 19, 2012 MEMORANDUM 111912
Quantitative analyses of weekday a.m. and p.m. commuter hour conditions have been conducted for the following five scenarios:
 6.1 TRANSPORTATION AND CIRCULATION 6.1.1 INTRODUCTION This section of the EIR presents the results of TJKM s traffic impact analysis of the proposed Greenbriar Development. The analysis includes consideration
Escondido Marriott Hotel and Mixed-Use Condominium Project TRAFFIC IMPACT ANALYSIS REPORT
 Escondido Marriott Hotel and Mixed-Use Condominium Project TRAFFIC IMPACT ANALYSIS REPORT Prepared for Phelps Program Management 420 Sixth Avenue, Greeley, CO 80632 Prepared by 5050 Avenida Encinas, Suite
Appendix Q Traffic Study
 Appendices Appendix Q Traffic Study Crummer Site Subdivision Draft EIR City of Malibu Appendices This page intentionally left blank. The Planning Center April 2013 TRAFFIC IMPACT ANALYSIS Photo z here
Appendix C-5: Proposed Refinements Rail Operations and Maintenance Facility (ROMF) Traffic Impact Analysis. Durham-Orange Light Rail Transit Project
 Traffic Impact Analysis. Durham-Orange Light Rail Transit Project") Appendix C-5: Proposed Refinements Rail Operations and Maintenance Facility (ROMF) Traffic Impact Analysis Durham-Orange Light Rail Transit Project July 25, 218 ROMF Transportation Impact Analysis Version
Appendix C-5: Proposed Refinements Rail Operations and Maintenance Facility (ROMF) Traffic Impact Analysis Durham-Orange Light Rail Transit Project July 25, 218 ROMF Transportation Impact Analysis Version
D & B COMMERCIAL TRAFFIC IMPACT ANALYSIS
 D & B COMMERCIAL TRAFFIC IMPACT ANALYSIS TABLE OF CONTENTS I. Introduction...3 II. Project Description...3 III. Existing Conditions...3 IV. Future Traffic Conditions...8 V. Conclusions and Mitigation...14
1012 & 1024 McGarry Terrace
 December 217 112 & 124 McGarry Terrace Transportation Impact Study 112 & 124 McGarry Terrace Transportation Impact Study prepared for: Lépine Corporation 32 March Road Kanata, ON K2K 2E3 prepared by: 1223
JOHNSON RANCH RAPID CITY, SOUTH DAKOTA TRAFFIC IMPACT ANALYSIS
 JOHNSON RANCH RAPID CITY, SOUTH DAKOTA TRAFFIC IMPACT ANALYSIS Prepared for: KTM Design Solutions 528 Kansas City Street, Suite 1 Rapid City, SD 57701 Prepared by: Felsburg Holt & Ullevig 6300 South Syracuse
700 Hunt Club Road. Transportation Impact Study - Addendum #1. Submitted by:
 700 Hunt Club Road Transportation Impact Study - Addendum #1 Submitted by: 14 June 2013 1223 Michael Street, Suite 100, Ottawa, ON K1J 7T2 Tel: 613.738.4160 Fax: 613.739.7105 www.delcan.com 14 June 2013
The major roadways in the study area are State Route 166 and State Route 33, which are shown on Figure 1-1 and described below:
 3.5 TRAFFIC AND CIRCULATION 3.5.1 Existing Conditions 3.5.1.1 Street Network DRAFT ENVIRONMENTAL IMPACT REPORT The major roadways in the study area are State Route 166 and State Route 33, which are shown
Ingraham High School Parking and Traffic Analysis
 Parking and Traffic Analysis Seattle, WA Prepared for: URS Corporation 1501 4th Avenue, Suite 1400 Seattle, WA 98101-1616 Mirai Transportation Planning & Engineering 11410 NE 122nd Way, Suite 320 Kirkland,
SUBJECT: EMERALD NECKLACE IMPLEMENTATION PLAN PHASE 1 TRAFFIC ASSESSMENT SUMMARY OF FINDINGS. May 9, 2016
 May 9, 2016 Mr. Jesus "Freddie" Olmos ECORP CONSULTING, INC. 215 North 5 th Street Redlands, CA 92374 SUBJECT: EMERALD NECKLACE IMPLEMENTATION PLAN PHASE 1 TRAFFIC ASSESSMENT Dear Mr. Jesus "Freddie" Olmos: