IV. ENVIRONMENTAL IMPACT ANALYSIS J. TRANSPORTATION AND TRAFFIC
|
|
|
- Helena Holmes
- 5 years ago
- Views:
Transcription
1 IV. ENVIRONMENTAL IMPACT ANALYSIS J. TRANSPORTATION AND TRAFFIC This Section summarizes the information provided in the Traffic Study for the Santa Monica College Bundy Campus Master Plan (Traffic Study), prepared by Kaku Associates in September The Traffic Study, which is provided as Appendix G to this Draft EIR, evaluated traffic impacts related to the Bundy Campus Master Plan (Master Plan) based on the following traffic scenarios: Existing (2005) Conditions The analysis of existing peak hour traffic conditions provides the basis for the assessment of future traffic conditions. The existing conditions analysis includes a description of key streets and highways in the project area, traffic volumes, and current intersection and roadway operating conditions. Cumulative Base (2010) Conditions This scenario projects the future traffic growth and intersection operating conditions that could be expected from regional growth and known projects in the vicinity of the Bundy Campus by the year This analysis provides the baseline conditions against which the Master Plan s impacts are evaluated. The cumulative base (No Project) scenario assumed that no access to Airport Avenue would be provided, no traffic signal would be installed at the existing Bundy Driveway, and no new Northeast Bundy Driveway would be constructed. Cumulative Plus Master Plan (2010) Conditions The analysis identified the potential incremental impacts of the Master Plan on future traffic operating conditions by adding the Master Plan s expected traffic to the cumulative base traffic conditions. This analysis was conducted for each of the 16 potential Access Alternatives plus the No Project Access Alternative. ENVIRONMENTAL SETTING Freeway and Street Characteristics Primary regional access to the Bundy Campus is provided via the Santa Monica Freeway (I-10), which runs east-west approximately one mile north of the site, and the San Diego Freeway (I-405), which runs north-south approximately one mile east of the Bundy Campus. Local access to and from the Bundy Campus is primarily provided via Bundy Drive (which becomes Centinela Avenue south of Airport Avenue), Airport Avenue, and 23 rd Street/Walgrove Avenue. Bundy Drive is a four-lane north-south arterial classified as a major highway by the City of Los Angeles. Airport Avenue is a two-lane east-west street and is not classified in the City of Santa Monica Circulation Element; it is treated as a collector street in this study. Walgrove Avenue (in the City of Los Angeles) and 23 rd Street (in the City of Santa Monica) serve as collector streets, providing access to Airport Avenue from the west. Page IV.J-1
2 Transit Service The Bundy Campus is served by the two Santa Monica Big Blue Bus routes described below: Big Blue Bus Line 8 (Ocean Park Boulevard) - Line 8 runs from downtown Santa Monica to UCLA via Second Street, Main Street, Ocean Park Boulevard, National Boulevard and Westwood Boulevard. In the vicinity of the Bundy Campus, Line 8 operates on Ocean Park Boulevard. Weekday peak period headways are approximately 15 minutes in both directions. Weekday service is provided from about 6:00 a.m. until after 11:00 p.m. Big Blue Bus Line 14 (Bundy-Centinela) - Line 14 runs from Culver Boulevard in Culver City to Brentwood generally along Centinela Avenue, Bundy Drive, Barrington Avenue and Sunset Boulevard. In the vicinity of the Bundy Campus, Line 14 operates on Centinela Avenue and Bundy Drive. Peak period headways are approximately 15 minutes in both directions. Weekday service is provided from about 6:00 a.m. until about 9:00 p.m. Study Locations The Traffic Study evaluated potential peak hour traffic impacts at 27 study intersections and neighborhood traffic impacts on 22 street segments in the vicinity of the Bundy Campus. These locations were selected based on consultation with City of Los Angeles and City of Santa Monica staff as well as comments received from the public in the initial stages of the Draft EIR process. Study Intersections New traffic counts were collected during the typical weekday morning and afternoon peak periods (from 7:00 to 9:00 a.m. and 4:00 to 6:00 p.m.) at all 27 study intersections in September 2005, during the third week of the Fall 2005 semester. The study intersections that were selected for evaluation of potential peak hour traffic impacts are listed below. Eighteen of the following intersections are entirely within the City of Los Angeles (marked with a single asterisk * ); seven intersections are entirely within the City of Santa Monica (marked with a double asterisk ** ). Jurisdiction over two study intersections is shared by the Cities of Los Angeles and Santa Monica (marked with a triple asterisk *** ). Of the 27 intersections listed, 24 intersections are controlled by traffic signals and three intersections (indicated) are controlled by stop-signs. A map showing the locations of the following study intersections is provided in Figure IV.J th Street and Pico Boulevard** 2. Cloverfield Boulevard and Pico Boulevard** 3. I-10 eastbound off-ramp at Centinela and Pico Boulevard** 4. Bundy Drive and Pico Boulevard* 5. Bundy Drive and I-10 eastbound on-ramp* Page IV.J-2
3 6. 20 th Street and Ocean Park Boulevard** rd Street and Ocean Park Boulevard** 8. Cloverfield Boulevard and Ocean Park Boulevard** 9. Bundy Drive and Ocean Park Boulevard* 10. Bundy Drive and National Boulevard* 11. Sawtelle Boulevard and National Boulevard* 12. I-405 southbound on-ramp and National Boulevard* 13. I-405 northbound off-ramp and National Boulevard* 14. Sepulveda Boulevard and National Boulevard* rd Street/Walgrove Avenue and Airport Avenue (two-way stop-controlled)*** 16. Donald Douglas Loop South and Airport Avenue (all-way stop-controlled)** 17. Bundy Drive and Airport Avenue*** 18. Bundy Drive and Bundy Driveway (two-way stop-controlled) * 19. Walgrove Avenue and Rose Avenue* 20. Centinela Avenue and Rose Avenue* 21. Walgrove Avenue and Palms Boulevard* 22. Centinela Avenue and Palms Boulevard* 23. Sawtelle Boulevard and Palms Boulevard* 24. Walgrove Avenue and Venice Boulevard* 25. Beethoven Street and Venice Boulevard* 26. Centinela Avenue and Venice Boulevard* 27. Inglewood Boulevard and Venice Boulevard* Analyzed Segments New weekday ADT volume data was collected at the 22 street segments in September and October The street segments that were selected for evaluation of potential neighborhood traffic impacts are listed below. Street segments 1 through 12 are located in the City of Los Angeles (marked with a single asterisk ( * ); street segments 13 through 22 are located in the City of Santa Monica (marked with a double asterisk ( * ). A map showing the locations of the following street segments is provided in Figure IV.J Beethoven Street south of Rose Avenue* 2. Cabrillo Boulevard south of Rose Avenue* Page IV.J-3
4 3. Dewey Street between Walgrove Avenue and Maplewood Avenue* 4. Grand View Boulevard north of Palms Boulevard* 5. Inglewood Boulevard north of Palms Boulevard* 6. Rose Avenue east of Walgrove Avenue* 7. Rose Avenue east of Warren Avenue* 8. Rose Avenue west of Centinela Avenue* 9. Stanwood Drive between Bundy Drive and Grand View Boulevard* 10. Stewart Street south of Rose Avenue* 11. Walgrove Avenue south of Rose Avenue* 12. Warren Avenue between Walgrove Avenue and Maplewood Avenue* rd Street north of Airport Avenue** 14. Airport Avenue east of 23 rd Street/Walgrove Avenue** 15. Airport Avenue west of Centinela Avenue** 16. Ashland Avenue between 21 st Street and 23 rd Street** 17. Dewey Street between 21 st Street and 23 rd Street** 18. Hill Street between 21 st Street and 23 rd Street** 19. Marine Street between 21 st Street and 23 rd Street** 20. Navy Street between 21 st Street and 23 rd Street** 21. Oak Street between 21 st Street and 23 rd Street** 22. Pier Avenue between 21 st Street and 23 rd Street** Page IV.J-4
5 Venice Bl Source: Kaku Associates, September Figure IV.J-1 Locations of Study Intersections and Street Segments National Bl S Centinela Av Donald Douglas Lp S Stewart St Cabrillo Bl Beethoven St Rose Av Dewey St Walgrove Av S Centinela Av SANTA MONICA MUNICIPAL AIRPORT Sepulveda Bl Sawtelle Bl Palms Bl Stanwood Dr Moore Av Bundy Dr Rose Av Airport Av rd St Warren Av Palms Bl Inglewood Bl McLaughlin Av Matteson Av Grand View Bl Barrington Av 3 Pearl St Stewart St 8 Navy St Olympic Bl I-10 FWY 20th St CloverfieldBl 23rdSt 1 2 Pico Bl 21st St 6 LEGEND: - Project Site # - Analyzed Intersections - Analyzed Segments Marine St Ocean Park Bl Dewey St Ashland Av Pier Av Oak St Hill St Lincoln Bl Rose Av
6 Level of Service Methodology Level of service (LOS) is a qualitative measure used to describe the condition of traffic flow, ranging from excellent conditions at LOS A to overloaded conditions at LOS F. In urban environments, LOS D is typically considered the minimum desirable LOS. The methodologies specified by each city for the analysis of signalized intersections have been used as appropriate. At the two shared intersections, existing operating conditions have been evaluated in accordance with procedures adopted by each city. For intersections in the City of Los Angeles, the Los Angeles Department of Transportation (LADOT) requires that the Transportation Research Board s Critical Movement Analysis (CMA) method of intersection capacity analysis be used to determine the intersection volume-to-capacity (V/C) ratio and corresponding LOS for the given turning movements and intersection characteristics at signalized intersections. 1 The CALCADB software package developed by LADOT was used to implement the CMA methodology in this study. Table IV.J-1 defines the ranges of V/C ratios and their corresponding LOS using the CMA method. The 18 signalized intersections wholly or partially within Los Angeles are currently controlled by the city s Automated Traffic Surveillance and Control System (ATSAC). In accordance with LADOT procedures, a capacity increase of seven percent (0.07 V/C adjustment) was applied to reflect the benefits of ATSAC at these intersections. Table IV.J-1 LOS Definitions for Signalized Intersections Using CMA Method LOS V/C Ratio Operating Conditions A EXCELLENT. No vehicle waits longer than one red light and no approach phase is fully used. B > VERY GOOD. An occasional approach phase is fully utilized; many drivers begin to feel somewhat what restricted within groups of vehicles. C > D > E > GOOD. Occasionally drivers may have to wait through more than one red light; backups may develop behind turning vehicles. FAIR. Delays may be substantial during portions of the rush hours, but enough lower volume periods occur to permit clearing of developing lines, preventing excessive backups. POOR. Represents the most vehicles intersection approaches can accommodate; may be long lines of waiting vehicles through several signal cycles. F >1.00 FAILURE. Backups from nearby locations or on cross streets may restrict or prevent movement of vehicles out of the intersection approaches. Tremendous delays with continuously increasing queue lengths. Source: Transportation Research Board, Transportation Research Circular No. 212, Interim Materials on Highway Capacity, Transportation Research Board, Critical Movement Analysis, Page IV.J-6
7 The City of Santa Monica employs the Operational Analysis method from the Transportation Research Board s Highway Capacity Manual (HCM), to perform the intersection LOS analysis for each of the signalized locations. 2 This method determines the average control delay per vehicle and the V/C ratio at intersections based on the amount of traffic traveling through the intersection, the travel lane geometries, and other factors affecting capacity. The calculated level of delay is related to the LOS at the intersection, as shown in Table IV.J-2. Table IV.J-2 LOS Definitions for Signalized Intersections Using 2000 HCM Operational Method LOS Average Control Delay per Vehicle (seconds) Operating Conditions A < 10.0 EXCELLENT. No vehicle waits longer than one red light and no approach phase is fully used. B > 10.0 < 20.0 VERY GOOD. An occasional approach phase is fully utilized; many drivers begin to feel somewhat what restricted within groups of vehicles. C > 20.0 < 35.0 GOOD. Occasionally drivers may have to wait through more than one red light; backups may develop behind turning vehicles. D > 35.0 < 55.0 FAIR. Delays may be substantial during portions of the rush hours, but enough lower volume periods occur to permit clearing of developing lines, preventing excessive backups. E > 55.0 < 80.0 POOR. Represents the most vehicles intersection approaches can accommodate; may be long lines of waiting vehicles through several signal cycles. F >80.0 FAILURE. Backups from nearby locations or on cross streets may restrict or prevent movement of vehicles out of the intersection approaches. Tremendous delays with continuously increasing queue lengths. Source: Transportation Research Board, Highway Capacity Manual, The Two-Way Stop-Controlled and Unsignalized methodologies from the HCM were used, respectively, to determine the average vehicle control delay (in seconds) for the two-way stop-controlled study intersections of 23 rd Street/Walgrove Avenue and Airport Avenue, Bundy Drive and the Bundy Driveway, and the all-way stop-controlled intersection of Donald Douglas Loop South and Airport Avenue. It should be noted that the two-way stop-controlled methodology relates intersection LOS to the delay experienced by the most constrained approach (either the southbound left-turn or the westbound approach to 23 rd Street/Walgrove Avenue and Airport Avenue), rather than to the intersection as a whole. The corresponding levels of service are defined by the list in Table IV.J-3. 2 Transportation Research Board, Highway Capacity Manual, Page IV.J-7
8 Table IV.J-3 Level of Service Definitions for Unsignalized Intersections Average Total Delay LOS (seconds/vehicles) A < 10.0 B > 10.0 < 15.0 C > 15.0 < 25.0 D > 25.0 < 35.0 E > 35.0 < 50.0 F >50.0 Source: Transportation Research Board, Highway Capacity Manual, Freeway segment LOSs are determined based on V/C ratios and the definitions shown in Table IV.J-4. In accordance with values established in the Transportation Research Board s 2000 HCM, a LOS E service capacity of approximately 2,200 vehicles per hour per lane (vphpl) is used for freeway mixed-flow lanes. Table IV.J-4 LOS Definitions for Freeway Mainline Segments Level of Service Demand/Capacity Ratio A B > C > D > E > F(0) > F(1) > F(2) > F(3) >1.45 Source: Los Angeles County Metropolitan Transportation Authority, 2004 Congestion Management Program for Los Angeles County, June Existing (2005) Conditions Existing Traffic Volumes As discussed above, in September 2005 during the third week of the Fall 2005 semester, new traffic counts were collected during the typical weekday morning and afternoon peak periods (from 7:00 to 9:00 a.m. and 4:00 to 6:00 p.m.) at the 27 study intersections. Traffic count data sheets are contained in the Traffic Study, included as Appendix G to this Draft EIR. Page IV.J-8
9 Existing Peak Hour Intersection Levels of Service The existing peak hour traffic volumes were analyzed using the intersection capacity analysis methodologies described above to determine the current operating conditions at the selected intersections. Tables IV.J-5 and IV.J-6 summarize the existing weekday a.m. and p.m. peak hour LOS at the analyzed intersections. As shown in Table IV.J-5, using the City of Los Angeles methodology, 12 of the 20 intersections entirely or partially within that City of Los Angeles are currently operating at LOS E or F during one or both peak hours. As shown in Table IV.J-6, using the City of Santa Monica s methodology, one of the nine intersections entirely or partially within that City of Santa Monica is currently operating at LOS E or F during one or both peak hours. As is demonstrated in Tables IV.J-5 and IV.J-6, the use of two methodologies to analyze a single intersection does not in every case result in the calculation of the same operating LOS. Cumulative Base (2010) Conditions To evaluate the potential impacts of the Master Plan on the surrounding street system, it was necessary to develop estimates of future (2010) traffic conditions in the project area both without and with the Master Plan. Future traffic volumes were first estimated for the study intersections without the addition of Master Plan generated traffic. Cumulative Base Traffic Projections The cumulative base traffic projections reflect anticipated future traffic increases that can be expected from two sources. The first is ambient growth in traffic, which reflects general increases in traffic due to regional growth and development. The second source is traffic generated by specific future projects located in the vicinity of the study area, which includes all of the related projects identified in Table III-9 in Section III (Environmental Setting). The methods and assumptions used to develop the cumulative base traffic projections are described below. Page IV.J-9
10 Table IV.J-5 Existing LOS at Study Intersections in City of Los Angeles Weekday AM Peak Hour Weekday PM Peak Hour No. Intersection a Delay V/C LOS Delay V/C LOS 4 Bundy Drive and Pico Boulevard N/C B N/C F 5 Bundy Drive and I-10 eastbound on-ramp N/C E N/C C 9 Bundy Drive and Ocean Park Boulevard N/C F N/C F 10 Bundy Drive and National Boulevard N/C F N/C D 11 Sawtelle Boulevard and National Boulevard N/C F N/C F I-405 southbound on-ramp and National Boulevard I-405 northbound off-ramp and National Boulevard N/C D N/C C N/C C N/C C 14 Sepulveda Boulevard and National Boulevard N/C F N/C F rd Street/Walgrove Avenue and Airport Avenue (two-way stop-controlled) b, c 41 N/C E 14 N/C B 17 Bundy Drive and Airport Avenue b N/C C N/C D 18 Bundy Drive and Bundy Driveway (two-way stop-controlled) c 14 N/C B 28 N/C D 19 Walgrove Avenue and Rose Avenue N/C F N/C F 20 Centinela Avenue and Rose Avenue N/C C N/C D 21 Walgrove Avenue and Palms Boulevard N/C A N/C B 22 Centinela Avenue and Palms Boulevard N/C E N/C F 23 Sawtelle Boulevard and Palms Boulevard N/C F N/C F 24 Walgrove Avenue and Venice Boulevard N/C C N/C C 25 Beethoven Street and Venice Boulevard N/C D N/C C 26 Centinela Avenue and Venice Boulevard N/C F N/C E 27 Inglewood Boulevard and Venice Boulevard N/C D N/C F Note: The 12 intersections operating at LOS E or F during one or both peak hours are shown in bold. N/C = No delay is calculated for these intersections. a Except for intersections 15 and 18, all intersections currently operate under ATSAC system. b These intersections are located partially within the City of Santa Monica. c Intersection is two-way stop controlled. Level of service is based on the.average vehicular delay in seconds per vehicle for the most constrained approach. Source: Kaku Associates, September Page IV.J-10
11 Table IV.J-6 Existing LOS at Study Intersections in City of Santa Monica Weekday AM Peak Hour Weekday PM Peak Hour No. Intersection Delay V/C LOS Delay V/C LOS 1 20 th Street and Pico Boulevard B B 2 Cloverfield Boulevard and Pico Boulevard C B 3 I-10 eastbound off-ramp at Centinela and Pico Boulevard B A 6 20 th Street and Ocean Park Boulevard A B 7 23 rd Street and Ocean Park Boulevard C C 8 Cloverfield Boulevard and Ocean Park Boulevard A A rd Street/Walgrove Avenue and Airport Avenue (two-way stop-controlled) a, b 41 N/A E 14 N/A B Donald Douglas Loop South and Airport Avenue (all-way stop-controlled) c A A 17 Bundy Drive and Airport Avenue a C A Note: The one intersection operating at LOS E during one of the peak hours is shown in bold. N/C = No V/C is calculated for this intersection. a These intersections are located partially within the City of Los Angeles. b Intersection is two-way stop controlled. Level of service is based on the average vehicular delay in seconds per vehicle for the most constrained approach. c Intersection is all-way stop controlled. Level of service is based on the average vehicular delay in seconds per vehicle for the most constrained approach. Source: Kaku Associates, September Areawide Traffic Growth An ambient growth factor of one percent per year was used to adjust the existing year 2005 traffic volumes to reflect the effects of regional growth and development by This rate of growth was applied to all study intersections. It should be noted that this is slightly more conservative than the ambient growth rate typically used by the City of Santa Monica (0.8 percent per year). Traffic Generation for Related Projects Information regarding potential future projects either under construction, planned, or proposed for development in the project area was obtained from several sources, including previous studies recently conducted in the area and information obtained from the Cities of Los Angeles and Santa Monica. A list of related projects is provided Table III-9 in Section III (Environmental Setting). Detailed trip generation estimates for related projects in the City of Los Angeles and City of Santa Monica are presented in the Traffic Study included in Appendix G to this Draft EIR. Page IV.J-11
12 Traffic Distribution of Related Projects The geographic distribution of traffic generated by developments such as the related projects included in this analysis depends on several factors. These factors include the type and density of the proposed land uses, the geographic distribution of the population from which the employees and/or patrons of the proposed developments may be drawn, the geographic distribution of activity centers (employment, commercial, and other) to which residents of proposed residential projects may be drawn, and the location of the project in relation to the surrounding street system. The traffic distribution for the related projects in the City of Santa Monica was obtained from the City of Santa Monica s Traffix database and the anticipated travel paths of that traffic were extended throughout the study area. The assignment of related projects in the City of Santa Monica was based on the factors cited above. Baseline Street Improvements Several key roadway improvements in or near the project area are anticipated by the year These improvements, whether the result of local or regional Capital Improvement Programs or mitigations for ongoing or entitled cumulative projects, would result in additional capacity at various locations throughout the study area. The street network improvements listed below are assumed to be completed by the study horizon year of 2010: 20 th Street and Pico Boulevard (Study Intersection 1) - The traffic signal will be modified to provide protected-permitted phasing for the eastbound left-turn movements. Bundy Drive and Pico Boulevard (Study Intersection 4) - The traffic signal will be modified to provide protected-permitted phasing for the northbound, southbound, eastbound and westbound left-turn movements. Sawtelle Boulevard and National Boulevard (Study Intersection 11) The southbound approach will be modified to provide two lefts, one through, and one shared through/right-turn lane. I-405 Southbound On-Ramp and National Boulevard (Study Intersection 12) The westbound approach will be modified to provide two lefts and two through lanes. I-405 Northbound Off-Ramp and National Boulevard (Study Intersection 13) The northbound approach will be modified to provide one left, one shared left/right, and one right-turn lane. Sepulveda Boulevard and National Boulevard (Study Intersection 14) The eastbound approach will be modified to provide two lefts, one through, and one through/right-turn lane. Centinela Avenue and Venice Boulevard (Study Intersection 26) - The traffic signal will be modified to provide protected-permitted phasing for the southbound left-turn movements. Page IV.J-12
13 Cumulative Base Traffic Volumes Forecasts of cumulative base traffic volumes were developed by adding traffic generated by the cumulative development projects to the background existing volumes adjusted by areawide traffic growth. In addition, the existing (September 2005) traffic volumes at the Bundy Campus were updated to reflect the changes in vehicular access to the campus between Fall 2005 and Spring For a detailed explanation of modifications to the baseline traffic data, refer to the Traffic Study included as Appendix G to this Draft EIR. The resulting cumulative base (2010) traffic volumes at the 27 analyzed intersections represent future conditions without the traffic from the Master Plan. Tables IV.J-7 and IV.J-8 summarize the cumulative base weekday a.m. and p.m. peak hour LOS at the analyzed intersections in the City of Los Angeles and the City of Santa Monica, respectively. As shown in Table IV.J-7, using the City of Los Angeles methodology, 15 of the 20 intersections entirely or partially within the City of Los Angeles would operate at LOS E or F during one or both peak hours in 2010, prior to the implementation of the Master Plan. As shown in Table IV.J-8, using the City of Santa Monica s methodology, two of the nine intersections entirely or partially within that City of Santa Monica would operate at LOS E or F during one or both peak hours in 2010, prior to implementation of the Master Plan. The remaining intersections would operate at LOS D or better during both peak hours in 2010, prior to implementation of the Master Plan. As is demonstrated in Tables IV.J-7 and IV.J-8, the use of two methodologies to analyze a single intersection does not in every case result in the calculation of the same operating LOS. Page IV.J-13
14 Table IV.J-7 Cumulative Base LOS at Study Intersections in City of Los Angeles Weekday AM Peak Hour Weekday PM Peak Hour No. Intersection a Delay V/C LOS Delay V/C LOS 4 Bundy Drive and Pico Boulevard N/C D N/C F 5 Bundy Drive and I-10 eastbound on-ramp N/C F N/C D 9 Bundy Drive and Ocean Park Boulevard N/C F N/C F 10 Bundy Drive and National Boulevard N/C F N/C E 11 Sawtelle Boulevard and National Boulevard N/C E N/C F I-405 southbound on-ramp and National Boulevard I-405 northbound off-ramp and National Boulevard N/C A N/C A N/C A N/C A 14 Sepulveda Boulevard and National Boulevard N/C F N/C F rd Street/Walgrove Avenue and Airport b Avenue (two-way stop-controlled) * F C 17 Bundy Drive and Airport Avenue N/C D N/C D 18 Bundy Drive and Bundy Driveway (two-way b * F * F stop-controlled) 19 Walgrove Avenue and Rose Avenue N/C F N/C F 20 Centinela Avenue and Rose Avenue N/C C N/C E 21 Walgrove Avenue and Palms Boulevard N/C A N/C C 22 Centinela Avenue and Palms Boulevard N/C F N/C F 23 Sawtelle Boulevard and Palms Boulevard N/C F N/C F 24 Walgrove Avenue and Venice Boulevard N/C E N/C E 25 Beethoven Street and Venice Boulevard N/C D N/C C 26 Centinela Avenue and Venice Boulevard N/C F N/C F 27 Inglewood Boulevard and Venice Boulevard N/C D N/C F Note: The 15 intersections operating at LOS E or F during one or both peak hours are shown in bold. * = Indicates oversaturated conditions; delay cannot be calculated. N/C = No delay is calculated for these intersections. a Except for intersections 15 and 18, all intersections currently operate under ATSAC system. b Intersection is controlled by stop signs. The Delay column shows the analysis using HCM stop-controlled methodology, for the purpose of evaluating the operating condition of the intersection. Average vehicular delay in seconds is reported rather than V/C ratio. The V/C column shows the analysis using the CMA methodology, for the purpose of application of the City of Los Angeles significance criteria. V/C ratio is reported. Source: Kaku Associates, September Page IV.J-14
15 Table IV.J-8 Cumulative Base LOS at Study Intersections in City of Santa Monica Weekday AM Peak Hour Weekday PM Peak Hour No. Intersection Delay V/C LOS Delay V/C LOS 1 20 th Street and Pico Boulevard B B 2 Cloverfield Boulevard and Pico Boulevard C C 3 I-10 eastbound off-ramp at Centinela and Pico Boulevard B B 6 20 th Street and Ocean Park Boulevard A B 7 23 rd Street and Ocean Park Boulevard D * F 8 Cloverfield Boulevard and Ocean Park Boulevard A A rd Street/Walgrove Avenue and Airport Avenue (two-way stop-controlled) a * N/C F 17 N/C C Donald Douglas Loop South and Airport Avenue (all-way stop-controlled) b A A 17 Bundy Drive and Airport Avenue C A Note: The two intersections operating at LOS F during one of the peak hours are shown in bold. * = Indicates oversaturated conditions; delay cannot be calculated. N/C = No V/C is calculated for this intersection. a Intersection is two-way stop controlled. LOS is based on average vehicular delay in seconds per vehicle for the most constrained approach. b Intersection is all-way stop controlled. LOS is based on average vehicular delay in seconds per vehicle. Source: Kaku Associates, September Existing Access The Bundy Campus currently provides approximately 609 parking spaces in surface parking lots. When baseline traffic data was collected for the Traffic Study in Fall 2005, vehicular access to the Bundy Campus was limited to the Bundy Driveway and parking on the campus itself was restricted to faculty, staff and those requiring American Disability Act (ADA) access. No direct vehicular access was available from the Bundy Campus to Airport Avenue through Donald Douglas Loop South. Bundy Campus students parked in a former remote shuttle parking lot on the northeast corner of Airport Avenue and Donald Douglas Loop South and walked across Airport Avenue to and from the campus. The parking lot had been in use for approximately a decade as remote parking for SMC students until Fall 2005 when the start of construction on the City of Santa Monica s Airport Park forced its relocation to another site elsewhere in the City of Santa Monica. Vehicular access to the Bundy Campus is currently provided at the following locations: Page IV.J-15
16 Bundy Driveway - allows for left turn and right turn ingress as well as right turn egress onto Bundy Drive. Donald Douglas Loop South Driveway allows for outbound right turn-only egress onto Airport Avenue at Donald Douglas Loop South. ENVIRONMENTAL IMPACTS Thresholds of Significance Thresholds of Significance Intersection Traffic Impacts City of Los Angeles Significance Criteria LADOT has established threshold criteria to determine if a proposed project has a significant traffic impact at a specific intersection. According to the LADOT criteria, a project impact would be considered significant if the conditions provided in Table IV.J-9 are met. Table IV.J-9 City of Los Angeles Significance Thresholds Intersection Conditions with Project Traffic LOS V/C Ratio Project Increase in V/C Ratio C > D > E, F > > Source: City of Los Angeles Department of Transportation, Traffic Study Policies and Procedures, March The intersection of 23 rd Street/Walgrove Avenue and Airport Avenue is two-way stop-controlled. For the purpose of calculating the V/C ratio and applying the City of Los Angeles significance criteria, this intersection was analyzed using the CMA methodology. City of Santa Monica Significance Criteria The City of Santa Monica determines a proposed project s intersection traffic impacts through the application of significance criteria summarized in Table IV.J-10. Page IV.J-16
17 Table IV.J-10 City of Santa Monica Significance Thresholds Future Base Scenario Future Plus Project Scenario If LOS = Intersection Street Type Significant Impact If: A, B, or C D E F collector street intersection arterial intersection collector street intersection arterial intersection collector or arterial street intersection collector or arterial street intersection average vehicle delay increase > 15 seconds or LOS becomes to D, E, or F average vehicle delay increase > 15 seconds or LOS becomes to E or F any net increase in average seconds of delay per vehicle average delay increase > 15 seconds or LOS becomes to E or F any net increase in average seconds of delay per vehicle HCM V/C ratio net increase > Source: City of Santa Monica, Transportation Management Division, Traffic Study Guidelines, As indicated in Table IV.J-10, the significance criteria to be used depend on whether the subject location is an arterial or collector street and on the projected base operating conditions prior to the addition of project traffic. The significance of an impact is measured by either a change in the LOS to an unacceptable condition or a change in the average vehicular delay of a given amount dependent on the projected LOS. If the projected LOS is F, significance is defined in terms of a change in V/C ratio (as calculated by the HCM operational method), not average vehicular delay, as average vehicular delay cannot be calculated using the HCM operational method under oversaturated conditions. Thresholds of Significance - Street Segment Impacts City of Los Angeles Significance Criteria The City of Los Angeles has established threshold criteria which are used to determine if a proposed project has a significant traffic impact on the street system based on an increase in the projected final average daily traffic volumes, as indicated in Table IV.J-11. City of Santa Monica Significance Criteria The City of Santa Monica impact criteria applied to evaluate potential traffic impacts on street segments are based on the existing daily traffic on collector, feeder, and local streets, and the projected level of increase that can be attributed to a proposed project, as provided in Table IV.J-12. For the purpose of applying these criteria, Airport Avenue was treated as a collector street. Page IV.J-17
18 Table IV.J-11 City of Los Angeles Significance Thresholds (Street Segment Impact) Projected Average Daily Traffic with Project (Final ADT) Less than 1,000 Project-Related Increase in ADT 120 trips or more 1,000 or more 12 percent or more of final ADT 2,000 or more 10 percent or more of final ADT 3,000 or more 8 percent or more of final ADT Source: Transportation Research Board, Highway Capacity Manual, Table IV.J-12 City of Santa Monica Significance Thresholds (Street Segment Impact) Collector Streets A transportation impact is significant if the Base Average Daily Traffic Volume (ADT) is: greater than 13,500 and there is a net increase of one trip or more in ADT due to project related traffic greater than 7,500 but less than 13,500 and the project related traffic increases the ADT by 12.5% or the ADT becomes 13,500 or more less than 7,500 and the project related traffic increases the ADT by 25% Feeder Streets A transportation impact is significant if the Base Average Daily Traffic Volume (ADT) is: greater than 6,750 and there is a net increase of one trip or more in ADT due to project related traffic greater than 3,750 but less than 6,750 and the project related traffic increases the ADT by 12.5% or the ADT becomes 6,750 or more less than 3,750 and the project related traffic increases the ADT by 25% Local Streets A transportation impact is significant if the Base Average Daily Traffic Volume (ADT) is: greater than 2,250 and there is a net increase of one trip or more in ADT due to project related traffic greater than 1,250 but less than 2,250 and the project related traffic increases the ADT by 2.5% or the ADT becomes 2,250 or more less than 1,250 and the project related traffic increases the ADT by 25% Note: Average Daily Traffic Volume increase denotes adverse impacts; decrease denotes beneficial impacts. Source: City of Santa Monica, Transportation Management Division, Traffic Study Guidelines, Page IV.J-18
19 Thresholds of Significance Regional Transportation System Impacts The Los Angeles County Metropolitan Transportation Authority s (LACMTA) Congestion Management Program (CMP) for Los Angeles County 3 requires that when an environmental impact report is prepared for a proposed project, traffic impact analyses be conducted for select CMP arterial monitoring intersections and freeway monitoring locations based on the following criteria: All CMP arterial monitoring intersections where a proposed project will add 50 or more trips during either the a.m. or p.m. weekday peak hours of adjacent street traffic. All CMP mainline freeway monitoring locations where a proposed project will add 150 or more trips, in either direction, during either the a.m. or p.m. weekday peak hours. The CMP guidelines establish that a proposed project would have a significant impact when the following threshold is exceeded: A proposed project increases traffic demand on a CMP facility by 2 percent of capacity (V/C 0.02), causing LOS F (V/C > 1.00) If the facility is already at LOS F, a significant impact occurs when a proposed project increases traffic demand on a CMP facility by 2 percent of capacity (V/C 0.02). Project Characteristics Interim Phase As discussed in Section II (Project Description), the Interim Phase of the Master Plan would involve expanded use of the four-story West Building from 16 to up to 20 classrooms and potential use of the existing two-story East Building for offices, student services, community education, storage or leased for other purposes consistent with current zoning. The Interim Phase would provide a new Northeast Bundy Driveway to accommodate the new traffic signal at the northeast corner of the campus, with a new internal drive that would turn sharply to the south upon entering the Bundy Campus and connect to the existing drive along the south side of the campus. Fourteen onsite parking spaces near Bundy Drive would be eliminated to accommodate the Northeast Bundy Driveway, with 594 parking spaces remaining. During the Interim Phase, SMC programs will be scheduled to insure that adequate on-site parking will be provided at all times. Because the Interim Phase would involve the same uses that would ultimately occur under Master Plan buildout, it is assumed that impacts that would occur in the Interim Phase would be less than or equal to those evaluated for Master Plan buildout. As such, the Interim Phase is not discussed in detail in this Section. 3 Los Angeles County Metropolitan Transportation Authority, Congestion Management Program for Los Angeles County, June Page IV.J-19
20 Master Plan Buildout As discussed in Section II (Project Description), buildout of the Master Plan calls for the retention of the existing four-story (approximately 64,000-square-foot (sf)) West Building, and proposes the eventual demolition of the two-story East Building (approximately 33,055 sf) and its replacement with a building of similar size to be located to the immediate east of the West Building. The New Building will be located within the center of the Bundy Campus, east of the existing West Building, creating a pedestrianfriendly campus green space in between the two buildings. The total developed floor area envisioned for the Bundy Campus would be approximately 100,000 sf. The proposed Site Plan depicting this vision is provided in Figure II-3 in Section II (Project Description). Buildout of the Master Plan is anticipated to occur by Project Impacts Access Alternatives The Traffic Study evaluated 16 different potential vehicular Access Alternatives (excluding the No Project Access Alternative), based on combinations of the six potential access locations to and from the Bundy Campus. These Access Alternatives were selected to respond to the input received from agencies and from the public early in the EIR process. Consistent with the Master Plan document, these locations are labeled 1 through 6 on the Proposed Site Plan shown in Figure II-3 in Section II (Project Description). Under every Access Alternative, vehicular access to Stewart Street would be limited to emergency use and necessary wall maintenance. For the purpose of this discussion, the term full access is used to describe accesses where both left and right ingress and egress are allowed. The Access Alternatives evaluated are summarized in Table IV.J-13 and Figures IV.J-2 through IV.J-5 and are described below: Access Alternative A1 The existing Bundy Driveway would have full access and would be signalized. There would also be full access at the stop-controlled intersection of Donald Douglas Loop South and Airport Avenue. Access Alternative A2 The existing Bundy Driveway would have full access and would be signalized. There would also be left-in/right-out/right-in access at the stop-controlled intersection of Donald Douglas Loop South and Airport Avenue. Access Alternative A3 The existing Bundy Driveway would have full access and would be signalized. There would also be right-out only access at the stop-controlled intersection of Donald Douglas Loop South and Airport Avenue. Access Alternative A4 The existing Bundy Driveway would have full access and would be signalized. This would be the only access location for the site. There would be no access at the intersection of Donald Douglas Loop South and Airport Avenue. Access Alternative A5 The existing Bundy Driveway would have full access and would be signalized. There would be no access at the intersection of Donald Douglas Loop South and Page IV.J-20
21 Airport Avenue but full access between the site and Airport Avenue would be available at the Spitfire Grill Driveway and the 3400 Airport Avenue Building Driveway. Access Alternative A6 The existing Bundy Driveway would be configured for inbound-only access and would be controlled by a half traffic signal (that would not affect the movement of northbound through vehicles). There would also be full access at the stop-controlled intersection of Donald Douglas Loop South and Airport Avenue. Access Alternative A7 The existing Bundy Driveway would be configured for inbound-only access and would be controlled by a half traffic signal (that would not affect the movement of northbound through vehicles). There would also be right-out only access at the stop-controlled intersection of Donald Douglas Loop South and Airport Avenue. Access Alternative A8 The existing Bundy Driveway would be configured to allow right turns and left turns into the site and right turns out of the site and would be controlled by a half traffic signal (that would not affect the movement of northbound through vehicles). There would also be right-out only access at the stop-controlled intersection of Donald Douglas Loop South and Airport Avenue. Access Alternative A9 The existing Bundy Driveway would have right-in/left-in/right-out access and would be unsignalized. There would also be full access at the stop-controlled intersection of Donald Douglas Loop South and Airport Avenue. Access Alternative A10 The existing Bundy Driveway would have right-in/left-in/right-out access and would be unsignalized. There would be no access at the intersection of Donald Douglas Loop South and Airport Avenue but full access between the site and Airport Avenue would be available at the Spitfire Grill Driveway and the 3400 Airport Avenue Building Driveway. Access Alternative B1 This Access Alternative is similar to Alternative A1, except that the existing Bundy Driveway would be closed and a new driveway (i.e., Northeast Bundy Driveway) would be constructed at the northeast corner of the campus. The Northeast Bundy Driveway would have full access and would be signalized. There would also be full access at the stopcontrolled intersection of Donald Douglas Loop South and Airport Avenue. Access Alternative B2 This Access Alternative is similar to Alternative A6, except that the existing Bundy Driveway would be closed and a new driveway (i.e., Northeast Bundy Driveway) would be constructed at the northeast corner of the campus. The Northeast Bundy Driveway would be configured for inbound-only access and would be controlled by a half traffic signal (that would not affect the movement of northbound-through vehicles). There would also be full access at the stop-controlled intersection of Donald Douglas Loop South and Airport Avenue. Access Alternative B3 This Access Alternative is similar to Alternative A8, except that the existing Bundy Driveway would be limited to right-out only and a new driveway (i.e., Northeast Bundy Driveway) would be constructed at the northeast corner of the campus. The Northeast Bundy Driveway would be configured for inbound-only access and would be controlled by a half Page IV.J-21
22 traffic signal (that would not affect the movement of northbound-through vehicles). There would also be right-out only access at the stop-controlled intersection of Donald Douglas Loop South and Airport Avenue. Access Alternative B4 This Access Alternative is similar to Alternative B3, except that outbound only traffic at Donald Douglas Loop South would be permitted to turn either left or right onto Airport Avenue. The existing Bundy Driveway would be limited to right-out only and a new driveway (i.e., Northeast Bundy Driveway) would be constructed at the northeast corner of the campus. The Northeast Bundy Driveway would be configured for inbound-only access and would be controlled by a half traffic signal (which would not affect the movement of northbound through vehicles). Access Alternative C1 This Access Alternative is similar to Alternative A2, except that it envisions the realignment of Airport Avenue southward to run along the northern edge of the campus near Bundy Drive. The existing full traffic signal at Bundy Drive and Airport Avenue would be relocated to this location and college-related traffic would have direct access to Airport Avenue. In addition, there would be left-in/right-out/right-in access at the stop-controlled intersection of Donald Douglas Loop South and Airport Avenue. The existing Bundy Driveway would be closed under this Access Alternative. Access Alternative C2 This Access Alternative is similar to Alternative A5, except that it envisions the realignment of Airport Avenue southward to run along the northern edge of the campus near Bundy Drive. The existing traffic signal at Bundy Drive and Airport Avenue would be relocated to this location and college-related traffic would have full access to Airport Avenue at the Spitfire Grill Driveway and the 3400 Airport Avenue Building Driveway. The existing Bundy Driveway would be closed under this Access Alternative. No Project Access Alternative The existing Bundy Driveway would continue to provide rightin/left-in/right-out access and would remain unsignalized. There would be no access from the site to or from Airport Avenue through Donald Douglas Loop South as was provided in Fall Page IV.J-22
23 Table IV.J-13 Master Plan Access Alternatives Bundy Driveway Location Existing Bundy Driveway (at Current Location) Proposed Northeast Bundy Driveway Consolidated with Airport Avenue Driveway Access Schemes A1 A2 A3 A4 A5 A6 A7 A8 A9 A10 B1 B2 B3 B4 C1 C2 Bundy Driveway/Northeast Bundy Driveway/Consolidated Driveway Full access with traffic signal X X X X X X X X Inbound only access with half signal X X X Inbound and right-turn out access with half signal X X X Right-in/left-in/right-out with stop sign X X Right-in/right-out only with stop sign Airport Avenue via Donald Douglas Loop South Full access X X X X X Right-in/left-in/right-out X X Right-out/left-out only X Right-out only X X X X No access X X X X Airport Avenue via Other Access Spitfire Grill Driveway X X X 3400 Airport Avenue Building Driveway X X X Note: The X identifies the locations where access to/from the Bundy Campus would be provided under each Access Alternative. Source: Kaku Associates, September Page IV.J-23
24 ALTERNATIVE A1 SIGNALIZED ALTERNATIVE A2 SIGNALIZED ALTERNATIVE A3 SIGNALIZED ALTERNATIVE A4 Note: Assumed access points and allowable turning movements under each access alternative are shown within the circles above. For reference, the project site plan is shown. SIGNALIZED Source: Kaku and Associates, September Figure IV.J-2 Locations of Access Alternatives Alternatives A1 through A4
25 ALTERNATIVE A5 SIGNALIZED ALTERNATIVE A6 SIGNALIZED ALTERNATIVE A7 SIGNALIZED ALTERNATIVE A8 Note: Assumed access points and allowable turning movements under each access alternative are shown within the circles above. For reference, the project site plan is shown. Source: Kaku Associates, September SIGNALIZED Figure IV.J-3 Locations of Access Alternatives Alternatives A5 through A8
26 ALTERNATIVE A9 ALTERNATIVE A10 ALTERNATIVE B1 SIGNALIZED ALTERNATIVE B2 SIGNALIZED Note: Assumed access points and allowable turning movements under each access alternative are shown within the circles above. For reference, the project site plan is shown. Source: Kaku Associates, September Figure IV.J-4 Locations of Access Alternatives Alternatives A9 through B2

27 ALTERNATIVE B3 SIGNALIZED ALTERNATIVE B4 SIGNALIZED ALTERNATIVE C1 SIGNALIZED REALIGN AIRPORT AVENUE WITH NORTH EDGE OF BUNDY CAMPUS AND CLOSE EXISTING BUNDY DRIVE DRIVEWAY ALTERNATIVE C2 Note: Assumed access points and allowable turning movements under each access alternative are shown within the circles above. For reference, the project site plan is shown. Source: Kaku Associates, September SIGNALIZED REALIGN AIRPORT AVENUE WITH NORTH EDGE OF BUNDY CAMPUS AND CLOSE EXISTING BUNDY DRIVE DRIVEWAY Figure IV.J-5 Locations of Access Alternatives Alternatives B3 through C2
28 Intersection Traffic Impacts The traffic projections for the Master Plan were developed using the following three steps: estimating the trip generation of the Master Plan, determining the trip distribution, and assigning the Master Plan traffic to the roadway system. Master Plan Trip Generation Estimates Trip generation estimates for the proposed Master Plan, which involves the development of additional classrooms, faculty offices, and support service space, were based on observations and counts at the existing campus in September 2005, late February 2006, and early March In September 2005, the former shuttle parking lot that had been operating on the north side of Airport Avenue for over a decade was formally relocated elsewhere in Santa Monica. Therefore, the majority of Bundy Campus users parked there due to the fact that vehicular access to the Bundy Campus itself was restricted to ingress and right-turn egress only at the Bundy Driveway, and onsite parking was restricted to faculty, staff and those requiring ADA access. When a review of the September 2005 data revealed that, to a certain extent, the former shuttle parking lot was still being used at that time as remote parking for the Main Campus, it was decided to take new counts at the site early in the Spring 2006 semester (late February and early March 2006). The newer data showed that the former shuttle parking lot was generally no longer used as remote parking; therefore, the data collected in early 2006 better reflects the level of traffic generated by the Bundy Campus itself. Peak period data from between 7:00 and 9:00 a.m. and between 4:00 and 6:00 p.m. was collected on the campus in September 2005 concurrently with the baseline traffic counts in the surrounding area. These counts were used to identify the level of peak hour traffic at the campus at that time. The counts taken at the campus in February and March 2006 were collected on three separate days between 7:00 and 10:00 a.m. and between 4:00 and 7:00 p.m. It was found that the peak hours of college-related traffic occur between 9:00 and 10:00 a.m. and between 5:45 and 6:45 p.m. A review of daily traffic volume data on several nearby arterial streets indicated that while background traffic volumes between 6:00 and 7:00 p.m. are similar to those occurring in the peak one hour between 4:00 and 6:00 p.m., the background traffic volumes between 9:00 and 10:00 a.m. are considerably lower than the peak one-hour volumes occurring between 7:00 and 9:00 a.m. To provide a conservative projection of potential future traffic impacts, the highest hourly traffic volumes associated with the campus between 7:00 and 9:00 a.m. and between 6:00 and 7:00 p.m. were projected onto the peak hour volumes at the study intersections. The average traffic volumes observed at the campus in late February and early March 2006 were increased in proportion to the proposed increase in classroom space (from 16 existing classrooms in use in Fall 2005 to 30 classrooms in use in 2010). Table IV.J-14 presents the trip generation estimates developed for the Master Plan. The Bundy Campus is estimated to generate a total of approximately 5,317 trips per day, including approximately 360 trips during the a.m. peak hour and 452 trips during the p.m. peak hour. This represents a net increase of approximately 2,877 daily trips, of which about 121 Page IV.J-28
29 trips would occur during the a.m. peak hour and 203 trips would occur during the p.m. peak hour, which can be attributed to the increase in classrooms provided under the Master Plan. Table IV.J-14 Master Plan Trip Generation Estimates Estimated Trip Generation Size AM Peak Hour PM Peak Hour Land Use (classrooms) Daily Trips In Out Total In Out Total Existing Bundy Campus (September 2005) a 16 2, Existing Bundy Campus (Spring 2006) b 16 2, Master Plan Buildout (Fall 2010) b 30 5, Net New Trips c 2, a Peak hour trip generation based on counts taken during the week of September 15, 2005, at which time the site across Airport Avenue was still used, in part, for remote parking for the Main Campus. b Peak hour trip generation based on counts taken during the weeks of February 7 and March 6, 2006; increase in future trip estimated to be proportional to increase in classrooms. c Net new trips calculated relative to September 2005 existing baseline conditions. Source: Kaku Associates, September Comparison to Trip Generation Estimates for Previous Land Uses For information purposes only, additional trip generation estimates were prepared to illustrate the magnitude of trips that were generated by the previous site occupant, BAE Systems, combined with the traffic generated by the former shuttle parking lot across Airport Avenue, when both of these sites were in full operation. During the time when BAE Systems, an aerospace research, development, and manufacturing firm, was actively using the site, estimated trip generation was approximately 283 trips in the a.m. peak hour and 272 trips in the p.m. peak hour. Observations at the former shuttle parking lot conducted prior to the opening of the Bundy Campus showed that the shuttle lot generated approximately 265 trips in the a.m. peak hour and 141 trips in the p.m. peak hour. Therefore, together, these two previously existing uses generated approximately 548 trips in the a.m. peak hour and 413 trips in the p.m. peak hour. At buildout, the Master Plan is estimated to generate a total of approximately 360 trips in the a.m. peak hour and 452 trips in the p.m. peak hour. This comparison indicates that the Master Plan would generate approximately two-thirds as much traffic (66 percent) as the previous uses in the a.m. peak hour and slightly more traffic (109 percent) as compared to the previous uses in the p.m. peak hour. Page IV.J-29
30 Bundy Campus Traffic Distribution The geographic distribution of traffic generated by the Bundy Campus is dependent on several factors, including the geographic distribution of the population from which students and employees are drawn and the location of the Bundy Campus in relation to the surrounding street system. Detailed data on students home zip codes was provided by SMC for the Fall 2005 semester and was found to be virtually identical to similar data for the academic year. It is anticipated that future students will continue to closely mirror the geographic distribution of existing students. Because the number of students is far greater than the number of faculty and staff, this data is considered to adequately represent the geographic distribution of all trips to and from the college. It was found that the most heavily represented zip codes are located within approximately ten miles of SMC, although some students travel greater distances to attend classes. The zip code, which includes the Bundy Campus, is the second highest zip code from which existing students are drawn, with 5.1 percent of all students. The zip code, in West Los Angeles, has the highest representation of students (6.2 percent). Based on available street and freeway routes in the vicinity and the zip code distribution of SMC students, the general distribution of trips to and from the Bundy Campus was developed, as listed below and illustrated in Figure IV.J-6: North via I-405 = 16 percent South via = 13 percent East via I-10 = 26 percent West via I-10 = 5 percent Northeast via local streets = 9 percent Northwest via local streets = 12 percent Southeast via local streets = 12 percent Southwest via local streets = 7 percent Page IV.J-30
31 16% 26% 5% 12% 9% 12% 7% LEGEND 13% #% #% = Trips Via Freeways (I-10 & I-405) = Trips Via Surface Streets = Bundy Campus T e n - M i l e R a d i u s Source: Kaku Associates, September Figure IV.J-6 Master Plan Trip Distribution
32 Master Plan Trip Assignment The peak hour college-related trips observed in September 2005 were unassigned from the surrounding street network and the estimated total future college-related trips were then assigned in accordance with each of the analyzed Access Alternatives. While the overall geographic distribution of college-related trips is consistent, the assignment of these trips to the surrounding street network differs with each Access Alternative. Under each Access Alternative, the existing peak period left-turn prohibition on westbound Airport Avenue at Walgrove Avenue/23 rd Street was taken into consideration. The Traffic Study included in Appendix G to this Draft EIR contains the Master Plan s estimated peak hour traffic volumes under each Access Alternative at each of the study intersections during the weekday a.m. and p.m. peak hours for Cumulative Plus Master Plan Traffic Projections This section presents the analysis of the potential impacts of the Master Plan on the surrounding street system. The analysis compares the projected LOS at each study intersection with the Master Plan to the cumulative base (2010) scenario to determine potential Master Plan impacts, using the significance criteria established by the City of Los Angeles and the City of Santa Monica. Cumulative Base Traffic Conditions As discussed previously, using the City of Los Angeles methodology, 15 of the 20 study intersections entirely or partly within that city are projected to operate at LOS E or F during one or both peak hours. Using the City of Santa Monica analysis methodology, two of the nine intersections entirely or partly within that city are projected to operate at LOS E or F during one or both peak hours for The remaining study intersections are projected to continue to operate at acceptable levels of service (LOS D or better) during both peak hours. Cumulative Plus Master Plan Traffic Impact Analysis The Master Plan traffic volumes were then added to the cumulative base (2010) traffic volumes, resulting in the cumulative plus Master Plan traffic volumes for the weekday a.m. and p.m. peak hour in 2010 (see Traffic Study included in Appendix G to this Draft EIR). Application of the corresponding significance criteria for each city shows that the Master Plan could significantly impact traffic conditions at up to six of the analyzed intersections during one or both of the peak hours under the cumulative plus Master Plan conditions. Table IV.J-15 presents a summary of Master Plan impacts under each Access Alternative. As shown in Table IV.J-15, under Access Alternatives A1, A5, A9, A10, B1 and B4, the Master Plan would result in a significant impact at the following six study intersections in 2010: Bundy Drive and I-10 eastbound on-ramp Page IV.J-32
33 Bundy Drive and Ocean Park Boulevard Bundy Drive and National Boulevard 23 rd Street/Walgrove Avenue and Airport Avenue Bundy Drive and Airport Avenue Bundy Drive and Bundy Driveway Under Access Alternatives A2, A3, A4, A7, A8 and B3, the Master Plan would result in significant traffic impacts at the following five study intersections in 2010: Bundy Drive and I-10 eastbound on-ramp Bundy Drive and Ocean Park Boulevard Bundy Drive and National Boulevard Bundy Drive and Airport Avenue Bundy Drive and Bundy Driveway Under Access Alternatives A6, B2 and C2 (under which the existing Bundy Driveway would not be used), the Master Plan would result in significant traffic impacts at the following five study intersections in 2010: Bundy Drive and I-10 eastbound on-ramp Bundy Drive and Ocean Park Boulevard Bundy Drive and National Boulevard 23 rd Street/Walgrove Avenue and Airport Avenue Bundy Drive and Airport Avenue Page IV.J-33
34 Table IV.J-15 Summary of Intersections Impacted Under Each Access Alternative Access Alternatives No. Intersection A1 A2 A3 A4 A5 A6 A7 A8 A9 A10 B1 B2 B3 B4 C1 C th Street and Pico Boulevard 2 Cloverfield Boulevard and Pico Boulevard 3 I-10 eastbound off-ramp at Centinela and Pico Blvd. 4 Bundy Drive and Pico Boulevard 5 Bundy Drive and I-10 eastbound on-ramp I I I I I I I I I I I I I I I I 6 20 th Street and Ocean Park Boulevard 7 23 rd Street and Ocean Park Boulevard 8 Cloverfield Boulevard and Ocean Park Boulevard 9 Bundy Drive and Ocean Park Boulevard I I I I I I I I I I I I I I I I 10 Bundy Drive and National Boulevard I I I I I I I I I I I I I I I I 11 Sawtelle Boulevard and National Boulevard 12 I-405 southbound on-ramp and National Boulevard 13 I-405 northbound off-ramp and National Boulevard 14 Sepulveda Boulevard and National Boulevard rd Street/Walgrove Avenue and Airport Avenue (two-way stop-controlled) Donald Douglas Loop South and Airport Avenue (all-way stop-controlled) M M M M M M M M M 17 Bundy Drive and Airport Avenue I I I I I I I I I I I I I I I I 18 Bundy Drive and Bundy Driveway (two-way stopcontrolled) M M M M M M M M M M M M N/A N/A Page IV.J-34
35 Table IV.J-15 (Continued) Summary of Intersections Impacted Under Each Access Alternative Access Alternatives No. Intersection A1 A2 A3 A4 A5 A6 A7 A8 A9 A10 B1 B2 B3 B4 C1 C2 19 Walgrove Avenue and Rose Avenue 20 Centinela Avenue and Rose Avenue 21 Walgrove Avenue and Palms Boulevard 22 Centinela Avenue and Palms Boulevard 23 Sawtelle Boulevard and Palms Boulevard 24 Walgrove Avenue and Venice Boulevard 25 Beethoven Street and Venice Boulevard 26 Centinela Avenue and Venice Boulevard 27 Inglewood Boulevard and Venice Boulevard Total Intersections Impacted (Without Mitigation) Total Intersections Impacted (With Mitigation) Note: I = Denotes intersections where a significant impact would occur. M = Denotes intersections where a significant impact would occur but can be fully mitigated. N/A =The Bundy Driveway would be merged with Airport Avenue under Alternatives C1 and C2. Source: Kaku Associates, September Page IV.J-35
36 Under Access Alternatives C1 (under which the existing Bundy Driveway would not be used), the Master Plan would result in significant traffic impacts at the following four study intersections in 2010: Bundy Drive and I-10 eastbound on-ramp Bundy Drive and Ocean Park Boulevard Bundy Drive and National Boulevard Bundy Drive and Airport Avenue To provide additional information on the magnitude of the identified Master Plan impacts, Figures IV.J-7 and IV.J-8 have been prepared, which illustrate the relative proportions of peak hour traffic volumes at each of the impacted intersections under Access Alternatives A6 and B4. Traffic volumes shown in Figures IV.J-7 and IV.J-8 include existing traffic, cumulative base (ambient and related project) traffic, and traffic attributable to the Master Plan. Access Alternative A6 would provide inbound only access with a half signal at the Bundy Driveway (in its existing location) and full access to Airport Avenue at Donald Douglas Loop South. Access Alternative B4 would provide full inbound access with a half signal at a new Northeast Bundy Driveway, right-out only access at the existing Bundy Driveway, and right-out, left-out only access to Airport Avenue at Donald Douglas Loop South. These Access Alternatives were chosen to provide an overview of traffic impacts under two of the access scenarios most likely to be implemented under the Master Plan. As shown, under either Access Alternative A6 or B4, the increase in college-related traffic would represent a maximum of approximately 8.5 percent or less of the total projected peak hour volumes at Bundy Drive and the Bundy Driveway, and lesser amounts at the four other impacted intersections on Bundy Drive. The increase in SMC-related traffic would represent less than 2 percent of the total projected peak hour volumes at the intersection of 23 rd Street/Walgrove Avenue and Airport Avenue. The other 91 to 98 percent of the traffic experienced at impacted intersections would be either existing traffic or traffic attributable to ambient growth or related projects. Street Segment Impacts The Traffic Study included an analysis of impacts on street segments in the Bundy Campus vicinity. The analysis was conducted for 22 street segments, which are illustrated in Figure IV.J-1. New weekday average daily traffic (ADT) volume data was collected at these street segments in September and October 2005 and is provided in the Traffic Study included in Appendix G. The estimated daily college-related traffic that was present at the time this data was collected (Fall 2005, when most of the college-related parking and associated traffic was focused on the north side of Airport Avenue west of Bundy Drive) was subtracted from the baseline daily traffic volumes. Total future daily Master Plan-generated trips were assigned to the street network for each of the Access Alternatives using the same geographic distribution patterns previously discussed. The existing and forecasted daily street segment traffic volumes are presented in the Traffic Study included in Appendix G. As shown in Table IV.J-16, based on application Page IV.J-36
37 of the appropriate significance criteria for neighborhood traffic impacts, the Master Plan would create a significant traffic impact on up to three of the following street segments: 23 rd Street north of Airport Avenue (under all Access Alternatives) Airport Avenue west of Centinela Avenue (under Access Alternatives C1 and C2) Dewey Street between 21 st Street and 23 rd Street (under all Access Alternatives) The segment of 23 rd north of Airport Avenue is classified as a collector street. The segment of Dewey Street between 21 st Street and 23 rd Street is classified as a local street. For collector streets with a current ADT of greater than 13,500 and for local streets with a current ADT of greater than 2,250, a proposed project is considered to create a significant impact if there is a net increase in ADT of one trip or more. The existing traffic level at both of these locations is such that the addition of even a single daily trip is considered significant. Page IV.J-37
38 % 4.1% Master Plan Traffic Cumulative Base (2010) Traffic Peak Hour Intersection Volumes % 6.2% 8.0% 4.2% 6.4% 7.7% 7.5% 6.2% 1.7% 1.8% Existing (2005) Traffic AM PM AM PM AM PM AM PM AM PM AM PM Bundy Dr & I-10 EB On-Ramp Bundy Dr & Ocean Park Bl Bundy Dr & National Bl 23rd St/ Walgrove Av & Airport Av Bundy Dr & Airport Av Bundy Dr & Project Driveway Time Period & Intersection Source: Kaku Associates, September Figure IV.J-7 Cumulative Traffic Volumes at Impacted Intersections Alternative A6
39 % 4.1% Master Plan Traffic Cumulative Base (2010) Traffic Peak Hour Intersection Volumes % 6.2% 4.9% 6.2% 1.7% 1.8% 6.7% 8.0% 8.4% Existing (2005) Traffic 8.5% AM PM AM PM AM PM AM PM AM PM AM PM Bundy Dr & I-10 EB On-Ramp Bundy Dr & Ocean Park Bl Bundy Dr & National Bl 23rd St/ Walgrove Av & Airport Av Bundy Dr & Airport Av Bundy Dr & Project Driveway Time Period & Intersection Source: Kaku Associates, September Figure IV.J-8 Cumulative Traffic Volumes at Impacted Intersections Alternative B4
40 Table IV.J-16 Street Segment Impacts for Each Access Alternative Access Alternatives No. Street Segment a A1 A2 A3 A4 A5 A6 A7 A8 A9 A10 B1 B2 B3 B4 C1 C2 1 Beethoven Street south of Rose Avenue 2 Cabrillo Boulevard south of Rose Avenue 3 Dewey Street between Walgrove Avenue and Maplewood Ave. 4 Grand View Boulevard north of Palms Boulevard 5 Inglewood Boulevard north of Palms Boulevard 6 Rose Avenue east of Walgrove Avenue 7 Rose Avenue east of Warren Avenue 8 Rose Avenue west of Centinela Avenue 9 Stanwood Drive between Bundy Drive and Grand View Boulevard 10 Stewart Street south of Rose Avenue 11 Walgrove Avenue south of Rose Avenue 12 Warren Ave. between Walgrove Avenue and Maplewood Ave rd Street north of Airport Avenue I I I I I I I I I I I I I I I I 14 Airport Avenue east of 23 rd Street/Walgrove Avenue 15 Airport Avenue west of Centinela Avenue I I 16 Oak Street between 21 st Street and 23 rd Street 17 Hill Street between 21 st Street and 23 rd Street 18 Ashland Avenue between 21 st Street and 23 rd Street 19 Pier Avenue between 21 st Street and 23 rd Street 20 Marine Street between 21 st Street and 23 rd Street 21 Navy Street between 21 st Street and 23 rd Street 22 Dewey Street between 21 st Street and 23 rd Street I I I I I I I I I I I I I I I I Total Street Segments Impacted Note: No feasible and effective mitigation measures were available to mitigate any of significant impacts at the street segments studied. Source: Kaku Associates, September Page IV.J-40
41 The segment of Airport Avenue east of Centinela Avenue is treated as a collector street in this study, which is consistent with previous studies for other projects in the area. For collector streets in the City of Santa Monica with a current ADT of between 7,500 and 12,500, a proposed project is considered to create a significant impact if there is a net increase in ADT of 12.5 percent or more. Under Access Alternatives C1 and C2, the impact identified on Airport Avenue west of Centinela Avenue would occur because these Access Alternatives assume that this segment of Airport Avenue, and the associated traffic signal there, would be shifted southward to the northern edge of the Bundy Campus. With this change, nearly all of the traffic generated by the campus would utilize this segment of Airport Avenue to access the site, resulting in a significant increase in daily traffic volumes. Regional Transportation System Impacts Selection of Regional Analysis Locations Three CMP arterial monitoring intersections were identified in the vicinity of the Bundy Campus: Venice Boulevard and Centinela Avenue; Venice Boulevard and Lincoln Boulevard; and Santa Monica Boulevard and Bundy Drive. Based on the trip generation estimates previously presented and a review of the Master Plan traffic volumes shown in the Traffic Study provided in Appendix G, the Master Plan would add up to 78 vehicles in either the weekday a.m. or weekday p.m. peak hour to the intersection of Venice Boulevard and Centinela Avenue. Therefore, based on the CMP guidelines described previously in this Section, further CMP analysis is required at this intersection. Fewer than 50 new trips per hour would be added to the intersections of Venice Boulevard and Lincoln Boulevard, and Santa Monica Boulevard and Bundy Drive; therefore, no further analysis of either of those two monitoring locations is required. The mainline freeway monitoring locations nearest to the Bundy Campus are on the I-10 Freeway at Lincoln Boulevard to the west of the site and at Overland Avenue to the east of the site. The mainline freeway monitoring location closest to the Bundy Campus on the I-405 is located near Venice Boulevard. CMP Arterial Monitoring Intersection Impact Analysis The intersection of Venice Boulevard and Centinela Avenue was fully evaluated in the Traffic Study and was assessed using the CMA methodology, as permitted under the CMP guidelines. The results of that analysis are provided in detail for each of the 16 potential Access Alternatives in the Traffic Study included as Appendix G to this Draft EIR. The Traffic Study concluded that there would not be a significant CMP impact at this intersection. Page IV.J-41
42 Freeway Impact Analysis Existing freeway mainline volume data (2003) was obtained from the CMP and from Caltrans 2005 Traffic Volumes on California State Highways database and were compared to the LOS thresholds provided in Table IV.J-4. A regional growth factor (one percent per year) was applied to forecast cumulative base freeway volumes to the year Based on the Master Plan trip generation estimates and the Master Plan trip assignment assumptions, the Master Plan is not expected to add more than 150 peak hour trips in either direction at these locations. The detailed results of this analysis are provided in the Traffic Study included as Appendix G to this Draft EIR. The Traffic Study concluded that the addition of Master Plan traffic to the cumulative conditions on the analyzed freeway segments would increase the V/C ratio by less than one percent of the available capacity. At this level, the impact on the freeway system would be less than significant. CMP Transit Impact Analysis Based on the CMP methodology provided in Section D.8.4 of the CMP, an average vehicle ridership (AVR) of 1.4 was used in order to estimate the number of person trips to and from the Bundy Campus. Based on the CMP guidelines, it was estimated that 3.5 percent of person trips to and from the Bundy Campus may use public transit. As shown in Table IV.J-13, the Master Plan is expected to generate a net increase of 121 a.m. peak hour trips and 203 p.m. peak hour trips. The application of the CMP guidelines results in the conclusion that the Master Plan would add approximately 10 or fewer new transit trips during either peak hour. The project area is currently served directly by the City of Santa Monica Big Blue Bus Line 14 and indirectly by Big Blue Bus Line 8. With approximately eight buses per hour (in both directions), these lines should be adequate to accommodate the modest estimated increase in transit ridership and no significant transit impact would occur. SMC has been successful in promoting the use of transit, particularly at the Main Campus on Pico Boulevard. Among the reasons for this are the constrained parking supply and the high level of transit service provided by the Big Blue Bus, augmented by the SMC s intercampus shuttle system. While the intent of the Master Plan is to provide sufficient parking on-site to meet its needs, SMC supports the use of transit at all its facilities and operates an inter-campus shuttle (between the Bundy Campus and the Main Campus) until after the last class ends at the Bundy Campus, with the final run occurring Mondays through Thursdays at 10:10 p.m. The Big Blue Bus Line 14 is the only public bus line that serves the campus directly. Weekday service on this bus line ends at approximately 9:00 p.m., making it impractical for some students and staff to utilize. To further promote the use of transit at the Bundy Campus, SMC may coordinate with the Big Blue Bus to extend the hours of operation on Line 14. Under the Master Plan, it is anticipated that a bus stop on Bundy Drive will be relocated to the north of the Bundy Campus and remain in close proximity to the site, with pedestrian access provided by way of a staircase and accessible lift. Page IV.J-42
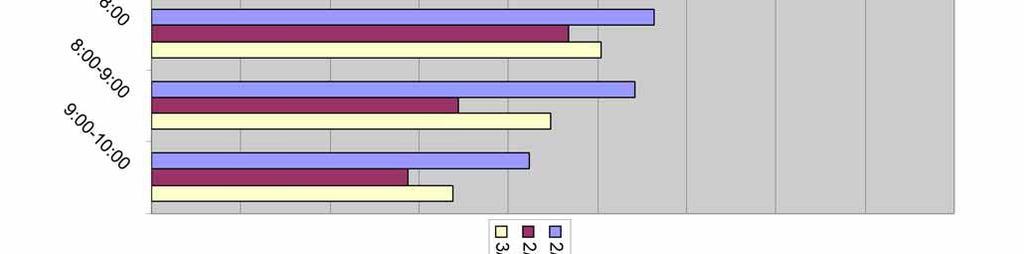
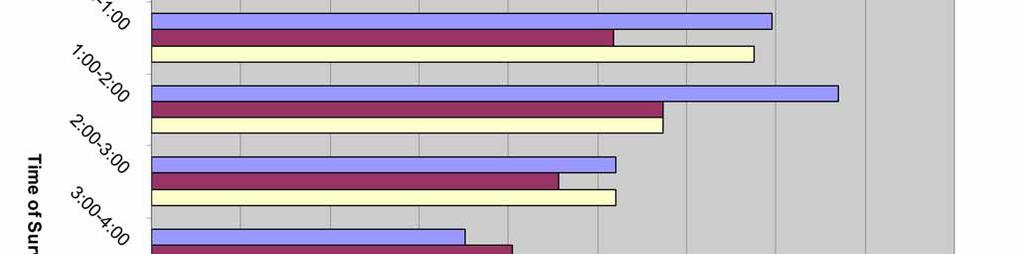
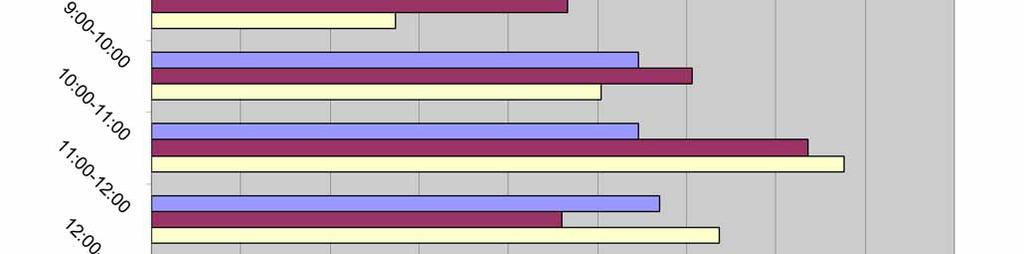
43 Parking Impacts The Master Plan will provide a total of approximately 780 on-site parking spaces in a combination of surface parking lots and a one-level subterranean parking structure. As discussed in Section IV.F (Land Use and Planning) of this Draft EIR, the City of Los Angeles Municipal Code (LAMC) does not specify a parking standard for the defined term educational institutions nor for community colleges. As such, the Traffic Study included an analysis of the Master Plan s proposed parking supply and its ability to satisfy the estimated parking demand. The analysis projected future demand on the basis of empirical data collected at the Bundy Campus early in the Spring 2006 semester. The campus currently provides a total supply of approximately 609 spaces in surface parking lots. Parking utilization surveys were conducted on Monday, February 27, 2006, Tuesday, February 28, 2006 and Wednesday, March 6, Occupancy of the existing parking lots was observed hourly between 8:00 a.m. and 10:00 p.m. The peak utilization of 388 spaces (64 percent or just under two-thirds of the available supply) was observed to occur in the late morning and early afternoon hours between 11:00 a.m. and 2:00 p.m.). Hourly utilization for each of the survey days is illustrated in Figure IV.J-9. Detailed parking occupancy data for each day is provided in the Traffic Study included as Appendix G to this Draft EIR. The observed peak demand of 388 spaces was increased in proportion to the proposed increase in educational facilities on the site (expansion from 16 classrooms to 30 classrooms) to estimate a future parking demand of approximately 728 spaces at the Bundy Campus at Master Plan buildout. Adding a circulation factor to the estimated future parking demand provides an extra margin of spaces in the supply so that people can find parking with a reasonable amount of convenience. For the college use, a circulation factor of approximately 5 percent is appropriate, resulting in an estimated parking need of approximately 765 spaces. The Master Plan would provide approximately 780 on-site parking spaces on the site in a combination of surface and subterranean parking. With an estimated peak parking demand of approximately 728 parking spaces and an estimated peak need of approximately 765 spaces, the proposed supply of approximately 780 spaces would be sufficient to meet the parking demand anticipated under the Master Plan at buildout. It should be further noted that during the Interim Phase, SMC programs will be scheduled to insure that adequate on-site parking will be provided at all times. Page IV.J-43


44 Source: Kaku Associates, September Figure IV.J-9 Master Plan Parking Demand
III. CORRECTIONS AND ADDITIONS TO THE DRAFT EIR
 III. CORRECTIONS AND ADDITIONS TO THE DRAT EIR DRAT EIR I. INTRODUCTION/SUMMARY In response to Comment No. 2.1 on the Draft EIR, the following mitigation measure is added to Table I- 1, Summary of Environmental
IV. ENVIRONMENTAL IMPACT ANALYSIS B. TRAFFIC AND CIRCULATION
 IV. ENVIRONMENTAL IMPACT ANALYSIS B. TRAFFIC AND CIRCULATION 1. INTRODUCTION This section is based on the technical report, Traffic Study for 10131 Constellation Boulevard Residential Project, prepared
TRANSPORTATION STUDY FOR THE 8899 BEVERLY BOULEVARD PROJECT
 DRAFT TRANSPORTATION STUDY FOR THE 8899 BEVERLY BOULEVARD PROJECT WEST HOLLYWOOD, CALIFORNIA NOVEMBER 2013 PREPARED FOR BEVERLY BOULEVARD ASSOCIATION PREPARED BY DRAFT TRANSPORTATION STUDY FOR THE 8899
IV. ENVIRONMENTAL IMPACT ANALYSIS N. TRANSPORTATION AND TRAFFIC
 IV. ENVIRONMENTAL IMPACT ANALYSIS N. TRANSPORTATION AND TRAFFIC The following section summarizes the information provided in the traffic report entitled Traffic Impact Analysis for a Proposed Residential
2. Valley Circle Boulevard/Andora Avenue/Baden Avenue and Lassen Street
 IV.J TRANSPORTATION 1. INTRODUCTION This section presents an overview of the existing traffic and circulation system in and surrounding the project site. This section also discusses the potential impacts
Escondido Marriott Hotel and Mixed-Use Condominium Project TRAFFIC IMPACT ANALYSIS REPORT
 Escondido Marriott Hotel and Mixed-Use Condominium Project TRAFFIC IMPACT ANALYSIS REPORT Prepared for Phelps Program Management 420 Sixth Avenue, Greeley, CO 80632 Prepared by 5050 Avenida Encinas, Suite
APPENDIX B Traffic Analysis
 APPENDIX B Traffic Analysis Rim of the World Unified School District Reconfiguration Prepared for: Rim of the World School District 27315 North Bay Road, Blue Jay, CA 92317 Prepared by: 400 Oceangate,
Traffic Impact Analysis 5742 BEACH BOULEVARD MIXED USE PROJECT
 Traffic Impact Analysis 5742 BEACH BOULEVARD MIXED USE PROJECT CITY OF BUENA PARK Prepared by Project No. 14139 000 April 17 th, 2015 DKS Associates Jeffrey Heald, P.E. Rohit Itadkar, T.E. 2677 North Main
Traffic Impact Study Speedway Gas Station Redevelopment
 Traffic Impact Study Speedway Gas Station Redevelopment Warrenville, Illinois Prepared For: Prepared By: April 11, 2018 Table of Contents 1. Introduction... 1 2. Existing Conditions... 4 Site Location...
The major roadways in the study area are State Route 166 and State Route 33, which are shown on Figure 1-1 and described below:
 3.5 TRAFFIC AND CIRCULATION 3.5.1 Existing Conditions 3.5.1.1 Street Network DRAFT ENVIRONMENTAL IMPACT REPORT The major roadways in the study area are State Route 166 and State Route 33, which are shown
4.7 Construction Surface Transportation
 4.7 Construction Surface Transportation 4.7.1 Introduction The traffic analysis presented in this section addresses the construction traffic impacts specific to the proposed Project. The construction traffic
IRSCH REEN Hirsch/Green Transportation Consulting, Inc.
 IRSCH REEN Hirsch/Green Transportation Consulting, Inc. February 6, 2013 Mr. David Weil Director of Finance St. Matthew s Parish School 1031 Bienveneda Avenue Pacific Palisades, California 90272 RE: Trip
Date: February 7, 2017 John Doyle, Z-Best Products Robert Del Rio. T.E. Z-Best Traffic Operations and Site Access Analysis
 Memorandum Date: February 7, 07 To: From: Subject: John Doyle, Z-Best Products Robert Del Rio. T.E. Z-Best Traffic Operations and Site Access Analysis Introduction Hexagon Transportation Consultants, Inc.
INDUSTRIAL DEVELOPMENT
 INDUSTRIAL DEVELOPMENT Traffic Impact Study Plainfield, Illinois August 2018 Prepared for: Seefried Industrial Properties, Inc. TABLE OF CONTENTS Executive Summary 2 Introduction 3 Existing Conditions
King Soopers #116 Thornton, Colorado
 Traffic Impact Study King Soopers #116 Thornton, Colorado Prepared for: Galloway & Company, Inc. T R A F F I C I M P A C T S T U D Y King Soopers #116 Thornton, Colorado Prepared for Galloway & Company
LAWRENCE TRANSIT CENTER LOCATION ANALYSIS 9 TH STREET & ROCKLEDGE ROAD / 21 ST STREET & IOWA STREET LAWRENCE, KANSAS
 LAWRENCE TRANSIT CENTER LOCATION ANALYSIS 9 TH STREET & ROCKLEDGE ROAD / 21 ST STREET & IOWA STREET LAWRENCE, KANSAS TRAFFIC IMPACT STUDY FEBRUARY 214 OA Project No. 213-542 TABLE OF CONTENTS 1. INTRODUCTION...
IV. ENVIRONMENTAL IMPACT ANALYSIS L. TRAFFIC, TRANSPORTATION, AND PARKING
 IV. NVIRONMNTAL IMPACT ANALYSIS L. TRAFFIC, TRANSPORTATION, AND PARKING INTRODUCTION The following summarizes the information provided in the traffic report prepared by Hirsch/Green Transportation Consulting,
Traffic Impact Analysis West Street Garden Plots Improvements and DuPage River Park Garden Plots Development Naperville, Illinois
 Traffic Impact Analysis West Street Garden Plots Improvements and DuPage River Park Garden Plots Development Naperville, Illinois Submitted by April 9, 2009 Introduction Kenig, Lindgren, O Hara, Aboona,
Appendix C. Traffic Impact Study
 Appendix C Traffic Impact Study TRAFFIC STUDY FOR THE EAGLE ROCK AGGREGATE TERMINAL Prepared by: FEHR & PEERS 201 Santa Monica Blvd. Suite 500 Santa Monica, CA 90401-2213 T. (310) 458-9916 F. (310) 394-7663
Appendix G Traffic and Parking Report
 Appendix G Traffic and Parking Report TABLE OF CONTENTS SECTION PAGE Executive Summary... v 1.0 Introduction... 1 1.1 Study Area... 3 2.0 Project Description... 4 2.1 Site Location... 4 2.2 Existing Project
TRANSPORTATION 1. INTRODUCTION
 IV.F TRANSPORTATION 1. INTRODUCTION This section evaluates potential impacts associated with Project-related traffic, circulation, and access. The analysis summarizes the findings of the traffic study
4.1 Traffic, Circulation, and Parking
 4.1 Traffic, This section describes the existing transportation and parking conditions within and adjacent to the project area. A traffic report describing the potential impacts of the proposed project
TABLE OF CONTENTS SECTION PAGE. Executive Summary... xii
 TABLE OF CONTENTS SECTION PAGE Executive Summary... xii 1.0 Introduction... 1 1.1 Study Area... 2 1.2 Traffic Impact Analysis Scenarios... 4 1.3 Study Area - City of Orange... 4 2.0 Project Description
Section 3.12 Traffic and Transportation
 Section. Traffic and Transportation SECTION SUMMARY This section describes existing ground transportation within the Port and surrounding area associated with implementation of the proposed Project. An
IV. ENVIRONMENTAL IMPACT ANALYSIS M. TRANSPORTATION AND TRAFFIC
 IV. ENVIRONMENTAL IMPACT ANALYSIS M. TRANSPORTATION AND TRAFFIC INTRODUCTION This section of the (Draft EIR) addresses the subject of traffic and transportation with respect to the proposed (Project or
Appendix Q Traffic Study
 Appendices Appendix Q Traffic Study Crummer Site Subdivision Draft EIR City of Malibu Appendices This page intentionally left blank. The Planning Center April 2013 TRAFFIC IMPACT ANALYSIS Photo z here
King County Metro. Columbia Street Transit Priority Improvements Alternative Analysis. Downtown Southend Transit Study. May 2014.
 King County Metro Columbia Street Transit Priority Improvements Alternative Analysis Downtown Southend Transit Study May 2014 Parametrix Table of Contents Introduction... 1 Methodology... 1 Study Area...
EXECUTIVE SUMMARY. The following is an outline of the traffic analysis performed by Hales Engineering for the traffic conditions of this project.
 EXECUTIVE SUMMARY This study addresses the traffic impacts associated with the proposed Shopko redevelopment located in Sugarhouse, Utah. The Shopko redevelopment project is located between 1300 East and
Oakbrook Village Plaza City of Laguna Hills
 Oakbrook Village Plaza City of Laguna Hills Traffic Impact Analysis Prepared by: HDR Engineering 3230 El Camino Real, Suite 200 Irvine, CA 92602 October 2012 Revision 3 D-1 Oakbrook Village Plaza Laguna
4.7 Construction Surface Transportation
 4.7.1 Introduction The traffic analysis presented in this section addresses the construction traffic impacts specific to the proposed Project. The construction traffic impacts were analyzed for both the
TIMBERVINE TRANSPORTATION IMPACT STUDY FORT COLLINS, COLORADO JANUARY Prepared for:
 TIMBERVINE TRANSPORTATION IMPACT STUDY FORT COLLINS, COLORADO JANUARY 2014 Prepared for: Hartford Companies 1218 W. Ash Street Suite A Windsor, Co 80550 Prepared by: DELICH ASSOCIATES 2272 Glen Haven Drive
Los Angeles Mission College Facilities Master Plan Draft Program Environmental Impact Report 3.13 TRANSPORTATION / TRAFFIC
 3.13 TRANSPORTATION / TRAFFIC As a result of the analysis undertaken in the Initial Study for the Los Angeles Mission College Facilities Master Plan, the (LACCD) determined that the proposed project may
Section 5.8 Transportation and Traffic
 Section 5.8 Transportation and Traffic 5.8 TRANSPORTATION AND TRAFFIC Generous This Section is based on the Topgolf Specific Plan Traffic Impact Analysis (RK Engineering Group, Inc., October 31, 2016);
Volume 1 Traffic Impact Analysis Turtle Creek Boulevard Dallas, Texas. Kimley-Horn and Associates, Inc. Dallas, Texas.
 Volume 1 Traffic Impact Analysis 2727 Dallas, Texas June 18, 2018 Kimley-Horn and Associates, Inc. Dallas, Texas Project #064523000 Registered Firm F-928 Traffic Impact Analysis 2727 Dallas, Texas Prepared
Appendix C. Traffic Study
 Appendix C Traffic Study TABLE OF CONTENTS SECTION Executive Summary PAGE 1.0 Introduction... 1 1.1 Scope of Work... 1 1.2 Study Area... 2 2.0 Project Description... 3 2.1 Site Access... 4 2.2 Pedestrian
Table Existing Traffic Conditions for Arterial Segments along Construction Access Route. Daily
 5.8 TRAFFIC, ACCESS, AND CIRCULATION This section describes existing traffic conditions in the project area; summarizes applicable regulations; and analyzes the potential traffic, access, and circulation
Traffic Impact Analysis for 2171 Rosecrans Avenue
 Traffic Impact Analysis for 2171 Rosecrans Avenue Prepared for: Continental Development Corporation Revised May 2016 LA16-2831 Prepared by: Fehr & Peers 600 Wilshire Blvd, Suite 1050 Los Angeles, CA 90017
4.14 TRANSPORTATION AND CIRCULATION
 4.14 TRANSPORTATION AND CIRCULATION 4.14.1 Summary Table 4.14-1 summarizes the identified environmental impacts, proposed mitigation measures, and residual impacts of the proposed project with regard to
IV. ENVIRONMENTAL IMPACT ANALYSIS L. TRANSPORTATION/TRAFFIC
 IV. ENVIRONMENTAL IMPACT ANALYSIS L. TRANSPORTATION/TRAFFIC INTRODUCTION The following section summarizes the information provided in the traffic report entitled Traffic Impact Analysis for a Proposed
Appendix B Traffic Impact Analysis, Asphalt Plant No. 1 Replacement and Modernization
 Appendix B Traffic Impact Analysis, Asphalt Plant No. 1 Replacement and Modernization REPORT Traffic Impact Analysis, Asphalt Plant No. 1 Replacement and Modernization Prepared for City of Los Angeles
Proposed location of Camp Parkway Commerce Center. Vicinity map of Camp Parkway Commerce Center Southampton County, VA
 Proposed location of Camp Parkway Commerce Center Vicinity map of Camp Parkway Commerce Center Southampton County, VA Camp Parkway Commerce Center is a proposed distribution and industrial center to be
TRAFFIC IMPACT ANALYSIS
 TRAFFIC IMPACT ANALYSIS Emerald Isle Commercial Development Prepared by SEPI Engineering & Construction Prepared for Ark Consulting Group, PLLC March 2016 I. Executive Summary A. Site Location The Emerald
DRAFT TRANSPORTATION IMPACT STUDY CASTILIAN REDEVELOPMENT PROJECT
 DRAFT TRANSPORTATION IMPACT STUDY CASTILIAN REDEVELOPMENT PROJECT Prepared for: Submitted by: 299 Lava Ridge Ct. Suite 2 Roseville, CA. 95661 June 212 TABLE OF CONTENTS 1. Introduction... 1 Project Location
Appendix B Traffic Impact Analysis, Asphalt Plant No. 1 Replacement and Modernization
 Appendix B Traffic Impact Analysis, Asphalt Plant No. 1 Replacement and Modernization DRAFT REPORT Traffic Impact Analysis, Asphalt Plant No. 1 Replacement and Modernization Prepared for City of Los Angeles
Alpine Highway to North County Boulevard Connector Study
 Alpine Highway to North County Boulevard Connector Study prepared by Avenue Consultants March 16, 2017 North County Boulevard Connector Study March 16, 2017 Table of Contents 1 Summary of Findings... 1
APPENDIX C1 TRAFFIC ANALYSIS DESIGN YEAR TRAFFIC ANALYSIS
 APPENDIX C1 TRAFFIC ANALYSIS DESIGN YEAR TRAFFIC ANALYSIS DESIGN YEAR TRAFFIC ANALYSIS February 2018 Highway & Bridge Project PIN 6754.12 Route 13 Connector Road Chemung County February 2018 Appendix
3.8 TRANSPORTATION, CIRCULATION AND PARKING
 3.8 TRANSPORTATION, CIRCULATION AND PARKING This section provides an overview of traffic, circulation and parking impacts and evaluates the construction and operational impacts associated with the Proposed
Traffic Engineering Study
 Traffic Engineering Study Bellaire Boulevard Prepared For: International Management District Technical Services, Inc. Texas Registered Engineering Firm F-3580 November 2009 Executive Summary has been requested
Clean Harbors Canada, Inc.
 Clean Harbors Canada, Inc. Proposed Lambton Landfill Expansion Environmental Assessment Terms of Reference Transportation Assessment St. Clair Township, Ontario September 2009 itrans Consulting Inc. 260
The key roadways in the project vicinity are described below. Exhibit displays the existing number of lanes on the study roadways.
 4.2 TRAFFIC AND CIRCULATION This section presents the key assumptions, methods, and results of analysis for the transportation and circulation impacts of the proposed project. This section is based on
5.9 TRANSPORTATION AND TRAFFIC
 5.9 TRANSPORTATION AND TRAFFIC This section evaluates transportation- and traffic-related impacts that have the potential to result from the construction and operation of the Project. Information and analysis
APPENDIX G TRAFFIC STUDY TECHNICAL MEMORANDUM
 APPENDIX G TRAFFIC STUDY TECHNICAL MEMORANDUM TECHNICAL MEMORANDUM To: From: Date: Subject: Jerry Flores - AECOM Brian A. Marchetti, AICP September 9, 5 DRAFT Traffic Study LABOE Channel 5 Studio Relocation
TALMONT TOWNHOMES MADISON KENNETH SPA TRAFFIC IMPACT STUDY. Sacramento, CA. Prepared For: MBK Homes. Prepared By:
 TALMONT TOWNHOMES MADISON KENNETH SPA TRAFFIC IMPACT STUDY Sacramento, CA Prepared For: MBK Homes Prepared By: KD Anderson & Associates 3853 Taylor Road, Suite G Loomis, California 95650 (916) 660-1555
APPENDIX C-2. Traffic Study Supplemental Analysis Memo
 APPENDIX C-2 Traffic Study Supplemental Analysis Memo The Mobility Group Transportation Strategies & Solutions Memorandum To: From: Subject: Tomas Carranza, LADOT Matthew Simons Traffic Review - Revised
Section 5.0 Traffic Information
 Section 5.0 Traffic Information 10.0 TRANSPORTATION MDM Transportation Consultants, Inc. (MDM) has prepared an evaluation of transportation impacts for the proposed evaluation for the expansion of the
Transportation & Traffic Engineering
 Transportation & Traffic Engineering 1) Project Description This report presents a summary of findings for a Traffic Impact Analysis (TIA) performed by A+ Engineering, Inc. for the Hill Country Family
TRAFFIC IMPACT ANALYSIS FOR. McDONALD S RESTAURANT IN CARMICAEL Sacramento County, CA. Prepared For:
 TRAFFIC IMPACT ANALYSIS FOR McDONALD S RESTAURANT IN CARMICAEL Sacramento County, CA Prepared For: McDonald s USA, LLC Pacific Sierra Region 2999 Oak Road, Suite 900 Walnut Creek, CA 94597 Prepared By:
BERKELEY DOWNTOWN AREA PLAN PROGRAM ENVIRONMENTAL IMPACT REPORT TRAFFIC IMPACT ANALYSIS
 BERKELEY DOWNTOWN AREA PLAN PROGRAM ENVIRONMENTAL IMPACT REPORT TRAFFIC IMPACT ANALYSIS Prepared for: City of Berkeley Prepared by: REVISED JANUARY 9, 2009 Berkeley Downtown Area Plan Program EIR Traffic
APPENDIX F-IV.K Updated Transportation Impact Analysis (June 2010)
") APPENDIX F-IV.K Updated Transportation Impact Analysis (June 2010) TRANSPORTATION IMPACT ANALYSIS FOR THE LOYOLA MARYMOUNT UNIVERSITY MASTER PLAN PROJECT JUNE 2010 PREPARED FOR AECOM Design PREPARED BY
APPENDIX F-IV.K Updated Transportation Impact Analysis (June 2010) TRANSPORTATION IMPACT ANALYSIS FOR THE LOYOLA MARYMOUNT UNIVERSITY MASTER PLAN PROJECT JUNE 2010 PREPARED FOR AECOM Design PREPARED BY
Traffic Impact Analysis. Alliance Cole Avenue Residential Site Dallas, Texas. Kimley-Horn and Associates, Inc. Dallas, Texas.
 Traffic Impact Analysis Alliance Cole Avenue Residential Site Dallas, Texas February 15, 2018 Kimley-Horn and Associates, Inc. Dallas, Texas Project #064524900 Registered Firm F-928 Traffic Impact Analysis
Project Scoping Report Appendix B Project Web Site. APPENDIX B Project Web Site
 Project Scoping Report Appendix B Project Web Site APPENDIX B Project Web Site WESTSIDE EXTENSION TRANSIT CORRIDOR STUDY February 4, 2008 News and Info of 1 http://metro.net/projects_programs/westside/news_info.htm#topofpage
APPENDIX E. Traffic Analysis Report
 APPENDIX E Traffic Analysis Report THIS PAGE INTENTIONALLY BLANK EAGLE RIVER TRAFFIC MITIGATION PHASE I OLD GLENN HIGHWAY/EAGLE RIVER ROAD INTERSECTION IMPROVEMENTS TRAFFIC ANALYSIS Eagle River, Alaska
NEWCASTLE MIDDLE SCHOOL Traffic Impact Analysis
 Gibson Traffic Consultants 2802 Wetmore Avenue Suite 220 Everett, WA 98201 425.339.8266 NEWCASTLE MIDDLE SCHOOL Traffic Impact Analysis Prepared for: Renton School District Jurisdiction: City of Newcastle
Madison BRT Transit Corridor Study Proposed BRT Operations Plans
 Madison BRT Transit Corridor Study Proposed BRT Operations Plans This paper presents a description of the proposed BRT operations plan for use in the Madison BRT Transit Corridor Study. The objective is
IV. ENVIRONMENTAL IMPACT ANALYSIS C. TRAFFIC CIRCULATION AND PARKING
 IV. ENVIRONMENTAL IMPACT ANALYSIS C. TRAFFIC CIRCULATION AND PARKING 1. INTRODUCTION This section is based on the technical report Traffic Impact Study Health Sciences Campus Project, City of Los Angeles,
Impacts to street segments were analyzed based on procedures detailed in the Highway Capacity Manual for levels of service related to roadways.
 4.7 Transportation and Circulation This report documents the results of a study of the potential traffic impacts created by the Whittier Main Oil Field Development Project. The study is included as Appendix
MONTEREY BAY AQUARIUM RESEARCH INSTITUTE (MBARI) MASTER PLAN UPDATE MOSS LANDING, CALIFORNIA
 MASTER PLAN UPDATE MOSS LANDING, CALIFORNIA") MONTEREY BAY AQUARIUM RESEARCH INSTITUTE (MBARI) MASTER PLAN UPDATE MOSS LANDING, CALIFORNIA TRAFFIC IMPACT ANALYSIS Administrative Draft Report Prepared For Monterey Bay Aquarium Research Institute Moss
MONTEREY BAY AQUARIUM RESEARCH INSTITUTE (MBARI) MASTER PLAN UPDATE MOSS LANDING, CALIFORNIA TRAFFIC IMPACT ANALYSIS Administrative Draft Report Prepared For Monterey Bay Aquarium Research Institute Moss
Quantitative analyses of weekday a.m. and p.m. commuter hour conditions have been conducted for the following five scenarios:
 6.1 TRANSPORTATION AND CIRCULATION 6.1.1 INTRODUCTION This section of the EIR presents the results of TJKM s traffic impact analysis of the proposed Greenbriar Development. The analysis includes consideration
Vanier Parkway and Presland Road Residential Development Transportation Impact Study
 Vanier Parkway and Presland Road Residential Development Transportation Impact Study Final Report (Revised) March 2011 Submitted to: Groupe Lépine Ottawa Project No. 09-1613 Submitted by: Groupe Lépine
West Hills Shopping Centre Lowe s Expansion Traffic Impact Study
 West Hills Shopping Centre Lowe s Expansion Traffic Impact Study Prepared for: Armel Corporation January 2015 Paradigm Transportation Solutions Ltd. 22 King Street South, Suite 300 Waterloo ON N2J 1N8
IV. ENVIRONMENTAL IMPACT ANALYSIS C. TRAFFIC, CIRCULATION AND PARKING
 IV. ENVIRONMENTAL IMPACT ANALYSIS C. TRAFFIC, CIRCULATION AND PARKING 1. INTRODUCTION This section is based on the technical report Traffic Study for the Villa Marina Residential Project, prepared by Kaku
700 University Avenue Mixed-Use Development. Traffic Impact Analysis
 700 University Avenue Mixed-Use Development Traffic Impact Analysis January 20, 2006 Prepared by 700 UNIVERSITY AVENUE MIXED- USE DEVELOPMENT TRAFFIC IMPACT STUDY Table of Contents 1.0 Executive Summary...
TRANSPORTATION 1. INTRODUCTION 2. METHODOLOGY
 IV.K TRANSPORTATION 1. INTRODUCTION This section provides an analysis of potential impacts associated with traffic, parking, and access. The analysis provides an overview of existing traffic conditions
Table of Contents. Traffic Impact Analysis Capital One Building at Schilling Place
 Traffic Impact Analysis Capital One Building at Schilling Place Table of Contents Executive Summary... 1 1. Introduction... 4 2. Project Description... 4 3. Background Information... 4 4. Study Scope...
2.0 Development Driveways. Movin Out June 2017
 Movin Out June 2017 1.0 Introduction The proposed Movin Out development is a mixed use development in the northeast quadrant of the intersection of West Broadway and Fayette Avenue in the City of Madison.
Trafalgar Road & Lower Base Line Transportation Study Ontario Inc.
 Trafalgar Road & Lower Base Line Transportation Study 1255723 Ontario Inc. Trafalgar Road & Lower Base Line Transportation Study 1255723 Ontario Inc. 1465 Pickering Parkway Suite 200 Pickering ON L1V 7G7
IV. Environmental Impact Analysis J. Traffic, Access, and Parking
 IV. Environmental Impact Analysis J. Traffic, Access, and Parking 1. Introduction This section of the Draft EIR analyzes the proposed Project s potential impacts on traffic, access, and parking. This section
Table of Contents INTRODUCTION... 3 PROJECT STUDY AREA Figure 1 Vicinity Map Study Area... 4 EXISTING CONDITIONS... 5 TRAFFIC OPERATIONS...
 Crosshaven Drive Corridor Study City of Vestavia Hills, Alabama Table of Contents INTRODUCTION... 3 PROJECT STUDY AREA... 3 Figure 1 Vicinity Map Study Area... 4 EXISTING CONDITIONS... 5 TRAFFIC OPERATIONS...
Traffic Impact Study for Proposed Olive Boulevard Development
 Traffic Impact Study for Proposed 11330 Olive Boulevard Development Creve Coeur, Missouri July 7, 2017 Prepared For: 11330 Olive Boulevard Development 11330 Olive Boulevard Creve Coeur, Missouri 63141
TRAFFIC IMPACT STUDY. USD #497 Warehouse and Bus Site
 TRAFFIC IMPACT STUDY for USD #497 Warehouse and Bus Site Prepared by: Jason Hoskinson, PE, PTOE BG Project No. 16-12L July 8, 216 145 Wakarusa Drive Lawrence, Kansas 6649 T: 785.749.4474 F: 785.749.734
MILLERSVILLE PARK TRAFFIC IMPACT ANALYSIS ANNE ARUNDEL COUNTY, MARYLAND
 MILLERSVILLE PARK TRAFFIC IMPACT ANALYSIS ANNE ARUNDEL COUNTY, MARYLAND Prepared for: Department of Public Works Anne Arundel County Prepared by: URS Corporation 4 North Park Drive, Suite 3 Hunt Valley,
ENVIRONMENTAL IMPACT ANALYSIS D. TRANSPORTATION AND CIRCULATION 1. INTRODUCTION
 IV. ENVIRONMENTAL IMPACT ANALYSIS 1. INTRODUCTION This section is based on a traffic and parking impact study that was prepared for the proposed CSMC West Tower Project by Linscott, Law & Greenspan, Engineers,
Exposition Corridor Transit Project
 Exposition Corridor Transit Project Phase 2 Environmental Planning Community Meeting June 9, 2008 Exposition Corridor Transit Project Phase 2 AGENDA Remaining Grade Crossing Recommendations June 9, 2008
TRAFFIC IMPACT ANALYSIS SHORTBREAD LOFTS 2009 MODIFICATION Chapel Hill, North Carolina
 TRAFFIC IMPACT ANALYSIS SHORTBREAD LOFTS 2009 MODIFICATION Chapel Hill, North Carolina Prepared for: The Town of Chapel Hill, NC Prepared by: Architects-Engineers-Planners, Inc. November 2009 Traffic Impact
V. ENVIRONMENTAL IMPACT ANALYSIS F. TRANSPORTATION/CIRCULATION
 V. ENVIRONMENTAL IMPACT ANALYSIS F. TRANSPORTATION/CIRCULATION The following Section presents a summary of the Traffic Study for the Proposed Civic Center/Metlox Development Project in the City of Manhattan
3.14 Parks and Community Facilities
 3.14 Parks and Community Facilities 3.14.1 Introduction This section identifies the park and community facility resources in the study area and examines the potential impacts that the proposed Expo Phase
Craig Scheffler, P.E., PTOE HNTB North Carolina, P.C. HNTB Project File: Subject
 TECHNICAL MEMORANDUM To Kumar Neppalli Traffic Engineering Manager Town of Chapel Hill From Craig Scheffler, P.E., PTOE HNTB North Carolina, P.C. Cc HNTB Project File: 38435 Subject Obey Creek TIS 2022
Traffic Impact Statement (TIS)
") Traffic Impact Statement (TIS) Vincentian PUDA Collier County, FL 10/18/2013 Prepared for: Global Properties of Naples Prepared by: Trebilcock Consulting Solutions, PA 2614 Tamiami Trail N, Suite 615 1205
Traffic Impact Statement (TIS) Vincentian PUDA Collier County, FL 10/18/2013 Prepared for: Global Properties of Naples Prepared by: Trebilcock Consulting Solutions, PA 2614 Tamiami Trail N, Suite 615 1205
4.4 Transportation and Circulation
 4.4.1 Introduction This section evaluates the potential for construction traffic and operational impacts to result from implementation of the proposed project. This includes the potential for the project
TRAFFIC IMPACT STUDY DERRY GREEN CORPORATE BUSINESS PARK MILTON SECONDARY PLAN MODIFICATION
 TRAFFIC IMPACT STUDY DERRY GREEN CORPORATE BUSINESS PARK MILTON SECONDARY PLAN MODIFICATION TRAFFIC IMPACT STUDY DERRY GREEN CORPORATE BUSINESS PARK MILTON SECONDARY PLAN MODIFICATION DECEMBER 24 UPDATED
TRAFFIC IMPACT ANALYSIS RIZZO CONFERENCE CENTER EXPANSION FINAL REPORT
 TRAFFIC IMPACT ANALYSIS RIZZO CONFERENCE CENTER EXPANSION Chapel Hill, North Carolina FINAL REPORT Prepared for: The Town of Chapel Hill, NC Prepared by: Architects-Engineers-Planners, Inc. December 2010
IV. ENVIRONMENTAL IMPACT ANALYSIS H. TRANSPORTATION/TRAFFIC
 IV. ENVIRONMENTAL IMPACT ANALYSIS H. TRANSPORTATION/TRAFFIC The following summarizes the information provided in the traffic report prepared by Fehr & Peers/Kaku Associates entitled, Traffic Study for
TRAFFIC IMPACT ANALYSIS SAFARI HIGHLANDS RANCH
 TRAFFIC IMPACT ANALYSIS SAFARI HIGHLANDS RANCH, California November 11, 2016 LLG Ref. 3-14-2334 EXECUTIVE SUMMARY The Project proposes the development of 550 luxury residential dwelling units, public trails,
TRAFFIC PARKING ANALYSIS
 TRAFFIC PARKING ANALYSIS NAPA FLEA MARKET COUNTY OF NAPA Prepared for: Tom Harding Napa-Vallejo Flea Market 33 Kelly Road American Canyon, CA 9453 Prepared by: 166 Olympic Boulevard, Suite 21 Walnut Creek,
Draft Report: West Berkeley Bowl Project
 Draft Report: West Berkeley Bowl Project July 2004 Prepared for: The City of Berkeley 1031-1925 F EHR & PEERS TRANSPORTATION CONSULTANTS 3685 Mt. Diablo Blvd. #301 Lafayette, CA 94549 925-284-3200 Fax:
TRAFFIC IMPACT STUDY FOR SONIC DRIVE-IN RESTAURANT. Vallejo, CA. Prepared For:
 TRAFFIC IMPACT STUDY FOR SONIC DRIVE-IN RESTAURANT Vallejo, CA Prepared For: ELITE DRIVE-INS, INC. 2190 Meridian Park Blvd, Suite G Concord, CA 94520 Prepared By: KD Anderson & Associates 3853 Taylor Road,
Appendix G: Transportation/Traffic
 City of Irvine - William Lyon Homes: Vista Verde Draft EIR Appendix G: Transportation/Traffic Michael Brandman Associates H:\Client (PN-JN)\0006\00060034\EIR\3 - DEIR\00060034 Sec99-00 Appendix Dividers
MEMO VIA . Ms. Amy Roth DPS Director, City of Three Rivers. To:
 MEMO To: Ms. Amy Roth DPS Director, City of Three Rivers VIA EMAIL From: Michael J. Labadie, PE Julie M. Kroll, PE, PTOE Brandon Hayes, PE, P.Eng. Fleis & VandenBrink Date: January 5, 2017 Re: Proposed
HIGHWAY 28 FUNCTIONAL DESIGN
 HIGHWAY 28 FUNCTIONAL DESIGN PUBLIC OPEN HOUSE #1 WEDNESDAY, MARCH 12, 2014 Stantec Presenters: Brad Vander Heyden, Project Engineer Neal Cormack, Project Manager Dave Parker, Project Engineer Beth Thola,
Executive Summary. Draft Environmental Impact Statement/Environmental Impact Report ES-1
 Executive Summary Introduction The Eastside Transit Corridor Phase 2 Project is a vital public transit infrastructure investment that would provide a transit connection to the existing Metro Gold Line