700 University Avenue Mixed-Use Development. Traffic Impact Analysis
|
|
|
- Godwin Richard
- 5 years ago
- Views:
Transcription
1 700 University Avenue Mixed-Use Development Traffic Impact Analysis January 20, 2006 Prepared by
2 700 UNIVERSITY AVENUE MIXED- USE DEVELOPMENT TRAFFIC IMPACT STUDY Table of Contents 1.0 Executive Summary Traffic Analysis/Impacts Parking Analysis/Impacts Congestion Management Program Analysis Introduction Setting Project Description Transit Service Bicycle and Pedestrian Facilities Existing Parking Local Roadway Facilities Significance Criteria Existing Traffic Conditions Baseline Traffic Conditions Baseline plus Project Site Access/Circulation/Hazards/Alternative Transportation Traffic Analysis Project Trip Generation Project Trip Distribution and Assignment Intersection Operations Parking Analysis Cumulative Conditions Traffic Analysis Intersection Operations Cumulative Conditions plus Project Traffic Analysis Intersection Operations Congestion Management Program Analysis Project Impacts Traffic Impact Significance Criteria Traffic Impacts/Mitigation Measures Baseline plus Project Cumulative plus Project Parking Impacts/Mitigation Measures Congestion Management Program Analysis Conclusion...44 KORVE ENGINEERING, INC. 1/20/06 i
3 700 UNIVERSITY AVENUE MIXED- USE DEVELOPMENT TRAFFIC IMPACT STUDY List of Tables Table 1: Intersection Level of Service Summary...4 Table 2: Critical Volume-Capacity Ratio Cumulative Scenario...5 Table 3: Intersection Level of Service Definitions...11 Table 4: Existing Conditions Intersection Level of Service Summary...13 Table 5: Volume Comparison PM Peak Hour...13 Table 6: Baseline Conditions Intersection Level of Service...16 Table 7: Trip Generation Lots #1, #2, and # Table 8: Trip Generation Lot # Table 9: Intersection Level of Service Summary Baseline plus Project...29 Table 10: Off-Street Parking Requirement Scenario A...31 Table 11: Off-Street Parking Requirement Scenario B...31 Table 12: Potential Parking Demand Scenario A...31 Table 13: Potential Parking Demand Scenario B...31 Table 14: Intersection Level of Service Summary Cumulative Conditions without Project...32 Table 15: Intersection Level of Service Summary Cumulative + Project...34 Table 16: Critical Volume-Capacity Ratio Cumulative Scenario...35 Table 17: 2005 Peak Hour Freeway Level of Service...38 Table 18: 2010 Peak Hour Freeway Level of Service...38 Table 19: 2025 Peak Hour Freeway Level of Service...39 Table 20: 2005 Peak Hour Roadway Segment Level of Service...40 Table 21: 2010 Peak Hour Roadway Segment Level of Service...41 Table 22: 2025 Peak Hour Roadway Segment Level of Service...42 List of Figures Figure 1: Site Plan...3 Figure 2: Study Area...14 Figure 3: Existing Traffic Volumes...15 Figure 4: Baseline Traffic Volumes...17 Figure 5: Project Trip Distribution South Building, Retail, and Lot 4 Inbound...21 Figure 6: Project Trip Distribution South Building, Retail, and Lot 4 Outbound...22 Figure 7: Project Trip Distribution North Building Inbound...23 Figure 8: Project Trip Distribution North Building Outbound...24 Figure 9: Baseline Plus Project Traffic Volumes...25 Figure 10A: Current Site Traffic Volumes...26 Figure 10B: Proposed Project Traffic Volumes Figure 11: Cumulative Traffic Volumes...33 Figure 12: Cumulative Plus Project Traffic Volumes...36 Appendix A Appendix B Appendix C Appendix D Appendices Traffic Counts Bicycle and Pedestrian Counts Level of Service Calculation Worksheets Read Building Traffic Report KORVE ENGINEERING, INC. ii 1/20/06
4 700 UNIVERSITY AVENUE MIXED- USE DEVELOPMENT TRAFFIC IMPACT STUDY 1.0 Executive Summary This study evaluates potential transportation impacts of the proposed 700 University Avenue mixed-use development occupying the block west of 4 th Street between University Avenue and Addison Street in the City of Berkeley, California. The site is currently occupied by parking (lot 1) two restaurants (lots 2 and 3), and a former train station (lot 4), which most recently has been a restaurant but is now vacant. The existing restaurants are Brennan s (6,000 sq. ft.) and Celia s (5,000 sq. ft). In total, the existing parking consists of 165 parking spaces, including 5 handicapped-accessible spaces. The project applicant proposes to replace two existing restaurant buildings on the site with two mixed-use buildings, and to refurbish the existing train station on the site. The proposed project includes 173 residential units (133 one-bedroom and 40 twobedroom), as well as 1,500 square feet of café uses and up to 12,040 square feet of retail uses and a 500 square foot leasing center that is analyzed as retail space units in the two new buildings on merged lots 1, 2 and 3. The proposed project also includes relocating Brennan's restaurant to the train station on lot 4 (5,490 square feet) and including 600 square feet of patio restaurant seating and 500 square feet of pavilion retail (newspaper/coffee service) on lot 4. As illustrated in Figure 1, the Site Plan shows a total of 214 vehicle parking spaces, including 6 spaces accessible to persons with disabilities, in both internal garages and surface spaces. 1 The project description provides that up to 32 bicycle parking spaces would be provided. This analysis evaluates both the traffic and parking related impacts of the proposed development project. Traffic impacts are assessed at nine critical intersections in the study area for the following five scenarios: 1. Existing; 2. Baseline (Existing plus Approved projects); 3. Baseline plus Project; 4. Cumulative (year 2025); and 5. Cumulative (year 2025) plus Project. It was determined by the City of Berkeley that the approved Read Building 2 on the other side of Fourth Street was the only approved but undeveloped project in the vicinity that would affect the level of service of any of the study intersections. Therefore, projected traffic from that project has been added to the existing counts to determine the baseline (existing plus approved projects) traffic volumes. The Cumulative scenario uses a combination of information from the UC Berkeley Long Range Development Plan and the Alameda County Congestion Management Agency s (ACCMA) traffic forecasts to grow the existing traffic to year 2025 volumes. For 1 Note that this analysis assumes up to 20,630 square feet of commercial/leasing/restaurant space on the project site, with up to 14,040 square feet on the merged lots and up to 6,590 square feet on the train station lot. The July 11, 2005 site plan depicts a total of 8,400 square feet of non-residential space on the merged lots and 6,590 square feet on the train station lot. For purposes of the parking analysis, this report examines both scenarios: 8,400 square feet of non-residential use on the merged lots as Scenario A and 14,040 square feet of non-residential use on the merged lots as Scenario B. 2 The Read Building consists of 7,747 gross square feet of general office space, 8,540 gross square feet of retail space, and a 2,962 square foot dwelling unit. KORVE ENGINEERING, INC. 1/20/06 1
5 700 UNIVERSITY AVENUE MIXED- USE DEVELOPMENT TRAFFIC IMPACT STUDY consistency, cumulative traffic volumes are based on those used by the traffic study for the approved Read Building project. Existing year traffic counts from the Long Range Development Plan, taken in November during the UC Berkeley fall semester, were also compared to the counts performed for this study and the Read Building Study, taken in July, during the UC Berkeley summer semester, to confirm that counts collected at different times of year relative to school being in session would not significantly impact the results of the analysis. The proposed change in land use at the site results in a net increase in vehicular trips generated by the site, and in the corresponding traffic levels in the surrounding area. The traffic analysis evaluates the effect of the net new trips in the project area; these net new trips are included in the Baseline plus Project and in the Cumulative plus Project scenarios. Existing trips from the two operating restaurants have been deducted from new trips to obtain net new trips. Traffic impacts are assessed for weekday morning and evening peak hours. Table 1 summarizes the results of the traffic analysis conducted for the proposed project. A Congestion Management Plan analysis is required for this project since it generates more than 100 peak hour vehicle trips. This analysis will be prepared and submitted as a supplement to the traffic impact study. 1.1 Traffic Analysis/Impacts For purposes of traffic analysis, we assumed that the existing uses on lots 1, 2, and 3 will be replaced by 173 residential units, up to 12,040 square feet of retail space, 1,500 square feet of café, and 500 square feet of retail space for the leasing center. The existing uses on lot 4 (former train station) will be replaced by Brennan s Restaurant (5,490 square feet), up to 600 square feet of outdoor patio restaurant seating, and 500 square feet of pavilion retail. Based on industry standards, information from City staff, and the Urban Housing Group, the following assumptions were used throughout this traffic study: For the land uses presented in Trip Generation (Institute of Transportation Engineers, 7 th Edition, 2003), Apartment (Code 220), High-Turnover (Sit Down) Restaurant (Code 832), and Shopping Center (Code 820) were chosen to represent the residential, restaurant, and retail uses, respectively; The ITE Trip Generation rates assume non-auto trips that occur in a suburban environment. A 5% reduction was applied to the number of trips generated by the Project to account for the relatively high percentage of non-auto trips in the study area where good public transit service is readily available; Brennan s Restaurant, a 6,000-square foot restaurant, is proposed to be relocated the north lot to the train station building. For the purpose of trip generation calculation, the restaurant was regarded as being removed from the north lot and added to the train station site. Brennan s Restaurant opens for business at 11:00 AM, so it will generate no trips during the AM peak hour. Celia s Restaurant, a 5,000-square foot restaurant, is proposed to be completely removed from the project site. The reduction of traffic due to its removal is taken into account in the trip generation calculation. It is not open during the AM peak hours. KORVE ENGINEERING, INC. 1/20/06 2

6 Site Plan.cdr 700 UNIVERSITY MIXED USE DEVELOPMENT Figure 1 PROJECT SITE PLAN
7 700 UNIVERSITY AVENUE MIXED- USE DEVELOPMENT TRAFFIC IMPACT STUDY Table 1: Intersection Level of Service Summary Intersection 4 th St / Hearst Ave 4 th St / Univ Frontage North 4 th St / Univ Frontage South 4 th St / Addison St 6 th St / Hearst Ave 6 th St/ Univ. Ave 6 th St / Addison St Univ. Ave / San Pablo Ave Traffic Control Peak Hour Existing Baseline Baseline plus Project Level of Service (Delay) 1 Cumulative plus Project All-Way AM B (11.0) B (11.1) B (11.6) C (25.4) Stop PM B (14.2) C (15.5) C (17.0) F (82.3) All-Way AM A (7.7) A (7.8) A (8.0) A (8.6) Stop PM A (9.0) A (9.5) A (10.3) B (13.7) All-Way AM A (7.8) A (7.8) A (8.1) A (8.7) Stop PM A (8.7) A (9.3) A (9.8) B (12.1) 2-way AM A (8.4) A (8.5) A (8.6) A (10.2) Stop PM A (9.3) A (9.6) A (9.7) B (12.8) Signal Signal AM B (12.2) B (12.2) B (13.4) B (15.8) PM B (18.8) B (19.7) C (21.8) D (47.3) AM C (31.9) C (32.0) C (33.3) D (51.4) PM D (49.3) D (49.7) D (54.1) F (105.9) 2-way AM B (14.8) B (14.9) B (15.2) C (17.2) Stop PM C (16.7) C (16.9) C (16.9) D (29.2) Signal AM D (38.9) D (38.9) D (39.0) D (48.1) PM D (49.8) D (50.3) D (50.9) F (107.8) 6 th St / AM A (7.6) A (7.7) A (7.7) B (12.1) Signal Allston Way PM A (9.8) A (9.9) A (10.0) B (11.8) Notes: 1 Delay shown in seconds per vehicle. Average delay for the worst minor approach is shown for twoway stop controlled intersections. Source: Korve Engineering, 2005 For the Baseline plus Project scenario, the proposed project was not found to have any significant impact. Although project-generated traffic added to average delays at all study intersections, the project resulted in only one LOS change from B to C a the 6 th Street / Hearst Avenue intersection, and LOS C is still considered an acceptable level of service. The project would not cause any intersection to deteriorate from LOS D or better to LOS E or F, nor would it cause the critical movement volume-to-capacity ratio at any of the study intersection to increase by 0.01 or more. For the Cumulative plus Project scenario, the proposed project was found to have one potentially significant impact. Although the intersections of University Avenue / San Pablo Avenue, 6 th Street / University Avenue, and Fourth Street / Hearst Avenue operate at LOS E or F in both the future scenarios, it has been determined that only the Fourth Street/Hearst Avenue intersection would experience an increase in the critical movement volume-to-capacity ratio of 0.01 or more as a result of the project. The changes in critical movement volume-capacity ratio for intersections operating at LOS E or F in the Cumulative scenarios are summarized in Table 2. KORVE ENGINEERING, INC. 1/20/06 4
8 700 UNIVERSITY AVENUE MIXED- USE DEVELOPMENT TRAFFIC IMPACT STUDY Table 2: Critical Volume-Capacity Ratio Cumulative Scenario Intersection Critical Movement V/C Ratio Peak Significant Hour Cumulative + Cumulative Total Increase Impact? Project 4 th St / AM N/A N/A N/A No Hearst Ave PM Yes 6 th St / AM N/A N/A N/A No University Ave PM No Univ. Ave / AM N/A N/A N/A No San Pablo Ave PM No 1.2 Parking Analysis/Impacts The project proposes a total of 214 new parking spaces, including 6 handicappedaccessible spaces and 32 bicycle spaces. The garages are designated for residential parking and surface spaces are for commercial parking. City zoning guidelines require one (1) parking space per dwelling unit, one (1) parking space per 300 sq. ft. restaurant use, and two (2) parking spaces per 1,000 sq. ft. of other commercial use. City zoning guidelines also require one (1) bicycle parking space per 2,000 sq. ft. non-residential use. Additionally, where a project can reasonably expect a demand for bicycle parking and will not result in an undue shortage of parking spaces, City zoning guidelines permit the designation of up to ten percent (10%) of automobile parking required for a use for bicycle parking. This project reasonably expects high bicycle usage, as it is adjacent to City bicycle routes along Fourth Street and Addison Street and the necessary use permit is part of the project application. Per the July 11, 2005 site plan, which provides for 8,400 square feet of non-residential uses on merged lots 1, 2 and 3, versus the 14,040 square feet analyzed here, and using the 10% bicycle parking substitution discussed above, 192 parking spaces are required (Scenario A). If an additional 6,940 square feet of non-residential uses were added bringing the total non-residential square footage on merged lots 1, 2 and 3 to 14,040 square feet, then 202 parking spaces would be required (Scenario B). In addition, for Scenario A, the project would need to provide at least 28 bicycle parking spaces, and for Scenario B, the project would need to provide 32 bicycle parking spaces. In order to evaluate the worst case scenario, Scenario B is being assumed. The project provides 214 vehicle parking spaces and 32 bicycle parking spaces; and therefore, meets the requirements of the zoning code. 1.3 Congestion Management Program Analysis The Alameda County Congestion Management Program (CMP) requires the assessment of development-driven impacts to regional roadways. Because the project would generate more than 100 PM peak hour trips, the CMP requires the use of the Countywide Travel Demand Forecasting Model to assess the impacts on regional roadways near the project site during the PM peak hour. For the purposes of this report, we have assumed the standard of significance for determining project impacts to be the following: KORVE ENGINEERING, INC. 1/20/06 5
9 700 UNIVERSITY AVENUE MIXED- USE DEVELOPMENT TRAFFIC IMPACT STUDY On CMA designated roadway segments that are projected to meet the CMA standard in the future without the project, the impact is significant if the project causes the segment to exceed the standard and adds at least one percent to the future hour peak traffic volume; or On CMA designated roadway segments that are projected to exceed the standard in the future without the project, the impact is significant if the project adds at least one percent to the future peak-hour traffic volume. The Countywide Model is a regional travel demand model that uses socio-economic data and roadway and transit network assumptions to forecast traffic volumes and transit ridership using a four-step modeling process that includes trip generation, trip distribution, mode split, and trip assignment. This process takes into account changes in travel patterns due to future growth and balances trip productions and attractions. For the purposes of the CMP Analysis, the land uses of the proposed project were added to the base assumptions in the Countywide Model for each of the forecast years; the land use assumptions in the Countywide Model for the rest of the region were not modified. Based on the assumed standards of significance, it has been determined that the project would not create a significant freeway impact because it would represent less than one percent of the total freeway volume. Since all roadway segments are expected to remain at acceptable levels of service with the addition of project related traffic, the project would not create any significant roadway segment impacts. 2.0 Introduction This traffic study evaluates potential transportation impacts resulting from the development of the proposed mixed-use project on the west side of Fourth Street between Addison Street and University Avenue in the City of Berkeley, California. The project site is currently occupied by two restaurants and a former train depot, which was most recently a restaurant and is now vacant. Brennan s Restaurant is a 6,000 square foot restaurant on the north lot and Celia s Restaurant is a 5,000 square foot restaurant on the south lot. There are currently 99 parking spaces shared by the existing restaurants and 66 public parking spaces in the parking lot on the southwest portion of the site that is currently leased for grocery store employee parking. This analysis evaluates the traffic related impacts of the proposed development project. Traffic impacts are assessed at nine critical intersections in the study area for the five following scenarios: 1. Existing; 2. Baseline (Existing plus Approved projects); 3. Baseline plus Project; 4. Cumulative (year 2025); and 5. Cumulative (year 2025) plus Project. Traffic impacts are assessed for weekday morning and evening peak hours, which are the peak hours of operation for the proposed project. The Cumulative scenario reflects traffic conditions forecast to prevail in the year 2025 with approved and foreseeable KORVE ENGINEERING, INC. 1/20/06 6
10 700 UNIVERSITY AVENUE MIXED- USE DEVELOPMENT TRAFFIC IMPACT STUDY projects. As instructed by the City, future cumulative traffic volumes for this scenario have been generated using information from the UC Berkeley Long Range Development Plan, which was recently approved, and the ACCMA traffic forecasts for 2025 as incorporated into the approved Read Building Traffic Study cumulative analysis. The Read Building project Traffic Study included cumulative traffic estimates for this project, 700 University Avenue. For this analysis, therefore, those estimates were subtracted out in order to identify traffic volumes for the cumulative no project scenario in this study. 3.0 Setting 3.1 Project Description The project involves the demolition of two existing restaurant buildings, reuse of the former train station, and the construction of a transit- and pedestrian-oriented mixed-use development with retail and restaurant uses as well as internal parking garages and surface parking. The new north and south buildings will include internal garages with 176 spaces, the project also includes a surface parking area behind the south building and along the internal street that provides for an additional 38 surface parking spaces. The north building garage spaces are accessible from the University Avenue frontage loop west of 4 th Street. The south building's garage as well as all surface parking spaces are accessible from either of the two driveways located on 4 th Street (mid-block) and Addison Street (at the west end of the property). 3.2 Transit Service Berkeley is well-served by public transportation, including services provided by BART, AC Transit, and Amtrak. This project is transit-oriented as it is adjacent to the turnaround for bus service on University Avenue and Capitol Connection train service. The roadway west of Fourth Street under the University Avenue underpass includes bus staging along the north side of the University Frontage road, bus stops along the south side of the University Frontage road, two taxi parking spaces, and 15 two-hour public parking spaces. BART links Berkeley with San Francisco, Richmond, Fremont and most of the urbanized communities of the East Bay. The Downtown Berkeley BART Station is located approximately 1.9 miles from the project site at the intersection of Shattuck and Center Avenues, and the North Berkeley BART Station is located 1.2 miles away from the project site at the intersection of Sacramento and Virginia Streets. Regular BART service to the station runs on 15 to 20 minute headways. AC Transit routes serve University Avenue, Sixth Street, and San Pablo Avenue in the study area. Route 51 provides service on University Avenue to downtown Berkeley and the downtown BART station from in front of the project. From 6 th Street south of University, Route 15 provides access to the North Berkeley station via University and Sacramento Street. The third University Avenue local route is 52L, which provides service between University Village and downtown Berkeley. Transbay routes from the adjacent area include Routes G and FS on University Avenue and Z on 6 th Street. San Pablo Avenue includes Route 72 Rapid Bus (72R) as well as local service (72). KORVE ENGINEERING, INC. 1/20/06 7
11 700 UNIVERSITY AVENUE MIXED- USE DEVELOPMENT TRAFFIC IMPACT STUDY The Capitol Corridor Amtrak route links the project site with Auburn, Sacramento, Emeryville, Oakland, and San Jose. Currently, this route is the only Amtrak service that stops at the Berkeley station. All Amtrak routes stop at the Emeryville and Oakland stations. 3.3 Bicycle and Pedestrian Facilities The proposed Project is located at the intersection of planned bicycle routes on Addison Street and Fourth Street. These bike routes will serve as primary connections to the bike/pedestrian bridge over I-80 at Aquatic Park. Pedestrian sidewalks are provided on all of the roadways in the immediate study area. Pedestrian crosswalks and pedestrian signal heads are provided at all of the signalized study intersections. To assess the level of pedestrian and bicycle activity occurring at study intersections bicycle and pedestrian counts were conducted concurrently with the vehicular traffic counts conducted as part of the study. Summaries of the counts, performed on Wednesday June 15, 2004, are attached in Technical Appendix B. Additionally, the bike and pedestrian volumes were incorporated into the intersection operation analysis along with the vehicular traffic volumes. 3.4 Existing Parking The existing site layout contains 165 parking spaces. However, 66 of these spaces are in a fenced off area located on the southwest quadrant of the site leased for grocery store employee parking. 3 The former train station, Celia s, and Brennan s Restaurant share the remaining parking of 99 spaces. There are currently two handicappedaccessible spaces in front of each restaurant and one in front of the train station. There are 94 regular parking spaces shared between the three buildings. On the north side of the lot, there is an enter-only and an exit-only driveway. On the east side of the lot, there are two-way driveways. On the southeast end of the lot there is a two-way driveway accessing the restaurants and on the southwest there is a two-way driveway accessing the lot. 3.5 Local Roadway Facilities The Project is located near the Interstate 80 / University Avenue intersection. It is also adjacent to two arterials: University Avenue is one block to the north and San Pablo Avenue is seven blocks to the east. The characteristics of these major roadways are described below. Interstate 80 is a freeway connecting San Francisco and Sacramento. Beginning in San Francisco, it crosses the San Francisco Bay Bridge and continues northward to the Carquinez Bridge and then to Vallejo, Fairfield, Sacramento, and east as far as New York. In the vicinity of the project site, Interstate 80 is a north-south freeway 3 As noted in the Read Building Study, the grocery store has made arrangements to lease replacement spaces from Spenger s Restaurant (one block north of Fourth Street) in the future. KORVE ENGINEERING, INC. 1/20/06 8
12 700 UNIVERSITY AVENUE MIXED- USE DEVELOPMENT TRAFFIC IMPACT STUDY that also serves as part of interstate 580 and has four mixed-flow lanes and an HOV lane in each direction. University Avenue is a major east-west arterial roadway connecting downtown Berkeley with Interstate 80 and the Berkeley Marina. University Avenue has two through lanes in each direction divided by a narrow median. The speed limit is 25 mph and dedicated left turn lanes are provided at major intersections. In the project vicinity, University Avenue is an elevated structure west of Sixth Street that crosses over railroad tracks and the freeway. Just west of Sixth Street/University intersection, there are two frontage roads, one on each side of the University overpass, that extend to a turn-around east of the mainline railroad tracks on 3 rd Street. These frontage roads provide access to the existing project site as well as other existing restaurants and retail zones. San Pablo Avenue is a north-south arterial roadway designated as State Route 123 extending from Oakland in the south to Rodeo in the north. San Pablo Avenue has two lanes in each direction with a 30 mph speed limit in the vicinity of the project. The project site is connected to these major roadways primarily through Addison Street, Allston Way, Fourth Street, Sixth Street and Hearst Street. The following paragraphs describe their characteristics. Addison Street is a collector with one lane in each direction. It extends east to Sixth Street and ends one block east of San Pablo Avenue. It begins again one block to the east and eventually reaches downtown Berkeley. All eastbound traffic on Addison Street must turn right at Sixth Street. This restriction has been imposed because of frequent northbound queues on Sixth Street at University Avenue spilling back to or past Addison Street. Allowing Addison Street eastbound left turns at this location would run the risk of cars turning part way into queued northbound traffic and blocking southbound traffic on Sixth Street, thus creating gridlock. Traffic wishing to turn left on Sixth Street may do so at either Allston Way or Hearst Street. Fourth Street is a collector with one lane in each direction. It connects to a shopping area two blocks north of the project site. It runs from Gilman Street on the north to Dwight Way on the south. Sixth Street is a collector with two lanes in each direction in the vicinity of the project site (i.e., the first block north and south of University Avenue). Further away from the project, Sixth Street generally has one lane in each direction with left turn lanes at intersections. North of Hearst Street it has a continuous-two-way-left-turn-lane and bike lanes. As a collector, it extends from Gilman Street in the north and merges with Seventh Street in the south at Dwight Way. Hearst Street is a local street with one lane in each direction that runs parallel to University Avenue. It begins on the west at the Eastshore Highway and extends east to the north side of the UC Berkeley campus. Allston Way is a collector with one lane in each direction. It connects to Sixth Street, San Pablo Avenue, and downtown Berkeley to the east. It has a signal controlled intersection at Sixth Street. KORVE ENGINEERING, INC. 1/20/06 9
13 700 UNIVERSITY AVENUE MIXED- USE DEVELOPMENT TRAFFIC IMPACT STUDY 3.6 Significance Criteria Traffic conditions in the study area are assessed through the evaluation of peak hour Levels of Service (LOS) at critical intersections. The LOS concept qualitatively characterizes traffic conditions associated with varying levels of traffic. An LOS determination is a measure of congestion, which is the principle measure of roadway service. Levels of Service for signalized and unsignalized intersections are defined in Table 3. These range from LOS A which indicates a free-flow condition to LOS F which indicates a jammed condition. LOS A, B and C are generally considered to be satisfactory service levels, LOS D is acceptable, LOS E is undesirable and LOS F conditions are unacceptable. Below is the wording contained in the City s recently developed memorandum regarding significance criteria for the preparation of traffic impact studies. Signalized intersections: The Highway Capacity Manual (2000) defines levels of service based on average seconds of delay per vehicle. The upper threshold for LOS D is 55 sec/veh and for LOS E is 80 seconds/vehicle. The average delay can be significantly affected by signal timing at a signalized intersection. In general, traffic impact analyses should retain cycle lengths, phase minimums, and phasing that occur for existing conditions. Phase lengths can be adjusted but should not adversely affect signal coordination. Any major changes need to be documented and fully justified. The City has established significance thresholds based on the fact that for a given level of traffic on critical movements, the delay increases at a greater rate as LOS F is approached. The following average delay thresholds have been established: LOS D to E=2 seconds; LOS E to LOS E or F=3 seconds. The volume-to-capacity ratio (v/c) is also an important indicator of capacity and should be included as part of all Level of Service tables. It can indicate the extent to which the signal timing is optimal and provides a useful indicator for oversaturated conditions. However, v/c s are not utilized for identifying level of service. As the delay can increase dramatically with small increases of traffic after LOS F has been reached, a threshold of an increase of 0.01 in the volumeto-capacity ratio will be used. Intersection level of service is dependent on a variety of factors. In general, existing timing and phasing should be retained for scenarios with and without the project. In this way, the only variable is the traffic volume, which ensures a valid comparison of project impacts. Nevertheless, with the approval of City staff, mitigations can include changes in signal timing; but care must be taken to ensure that these changes do not affect operations at adjacent signals. Finally, where closely spaced signals exist, estimated queue lengths should be provided to demonstrate whether or not there are potential impacts on upstream intersections or on access to turn lanes. Unsignalized intersections: The level of service thresholds for LOS D and E, respectively, are 35 and 50 seconds, for unsignalized intersections. For all-way stop intersections, the results of the level of service analysis provide a meaningful overall delay that can be presented similar to that for a signalized KORVE ENGINEERING, INC. 1/20/06 10
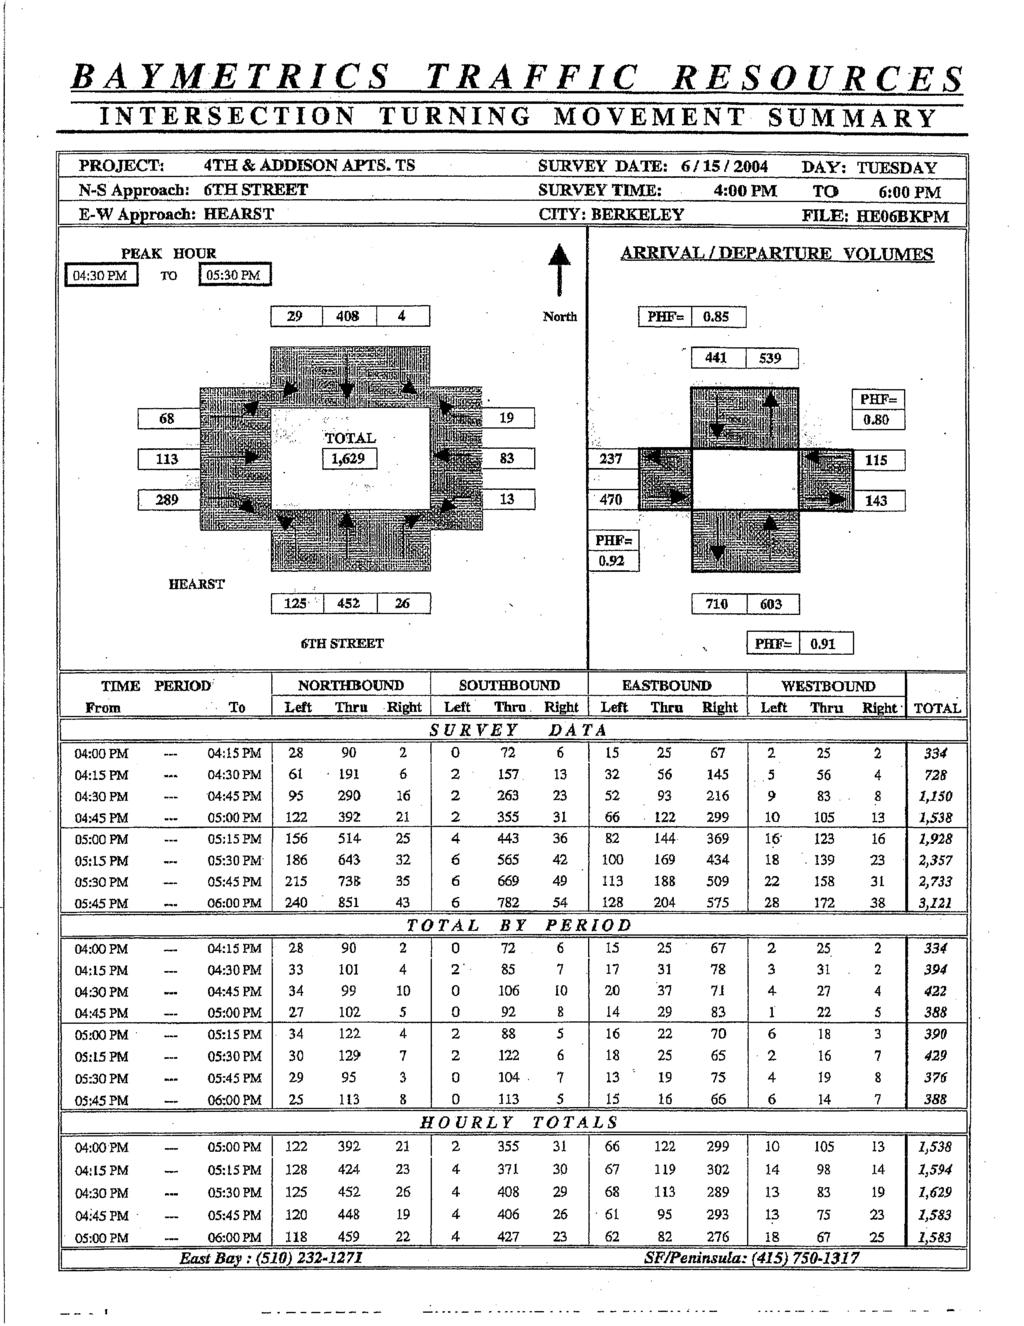
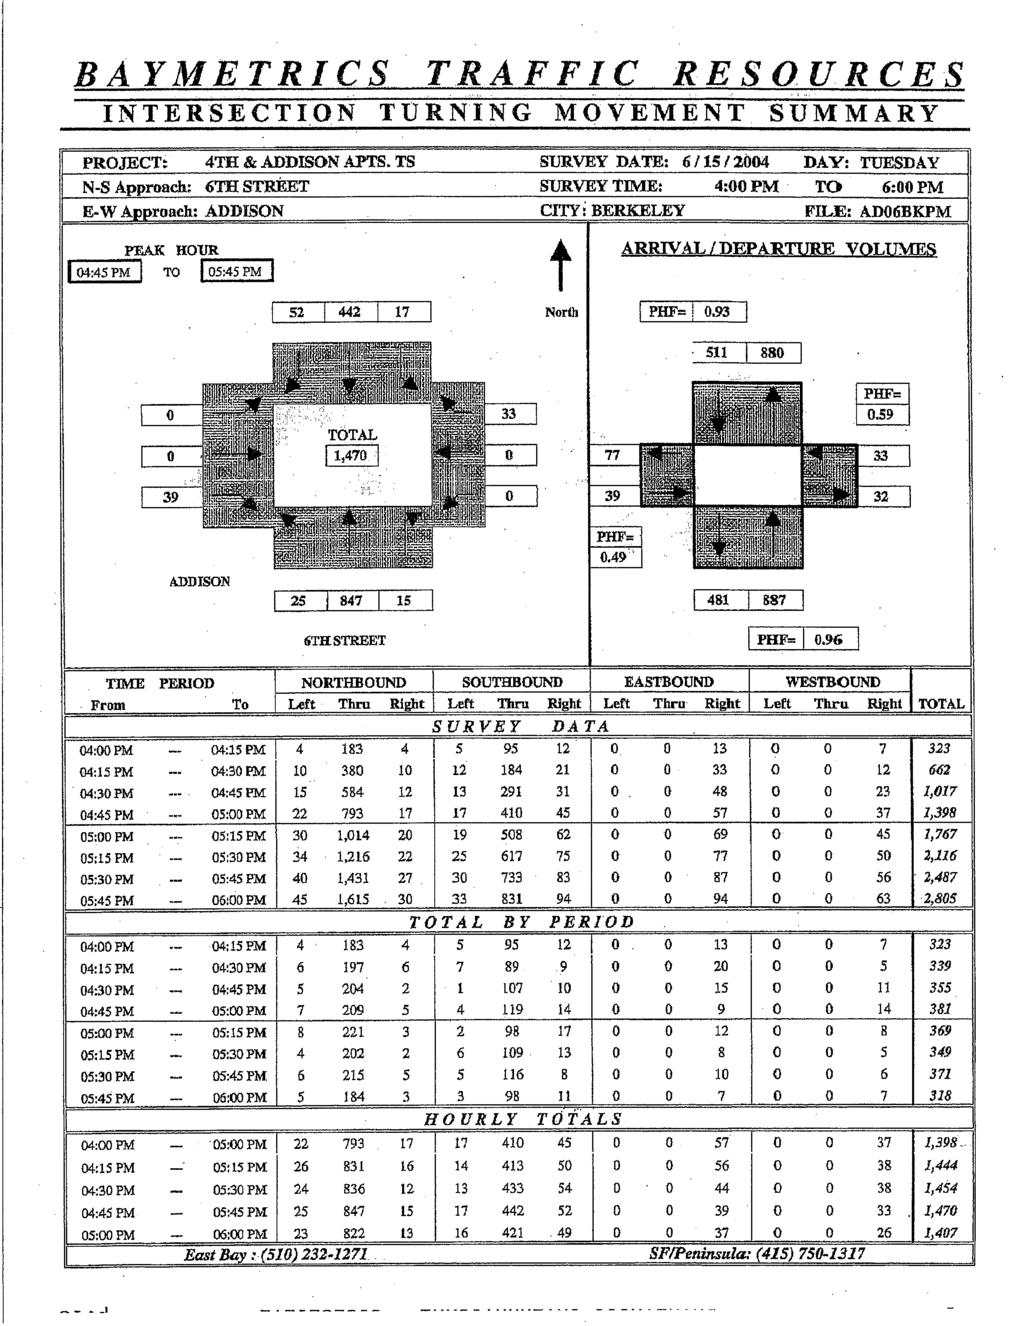
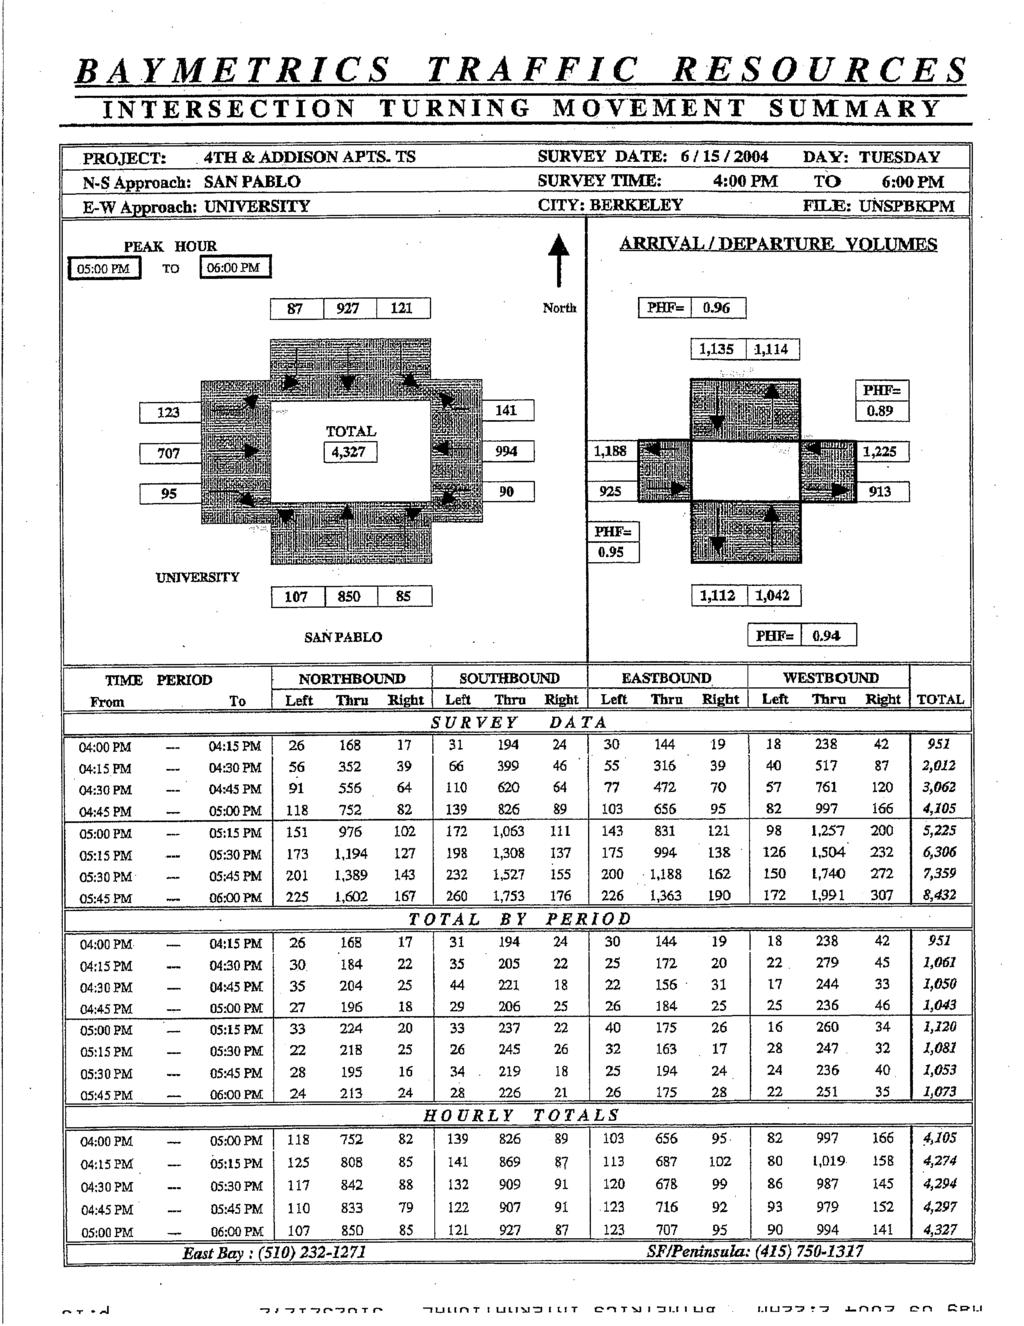
14 700 UNIVERSITY AVENUE MIXED- USE DEVELOPMENT TRAFFIC IMPACT STUDY intersection. However, for two-way stop intersections, levels of service are established separately for each movement with conflicting movements that pass through the intersection. As a result, an unfavorable level of service can occur for a small number of vehicles, and a large increase in delay can occur for a small increase in traffic volume. Unlike for signalized intersections, it is difficult to establish fixed significance thresholds for unsignalized intersections, particularly those with only side-street stop control. In general, mitigations are required if a movement is at LOS F, the peak hour signal warrant is met, and a minimum of 10 vehicles is added to the critical movement. Nevertheless, as delays increase dramatically once LOS F is reached, consideration should be given to the number of new trips added by a project and other factors, such as the feasibility of alternative routes and the proximity of adjacent traffic signals. Table 3: Intersection Level of Service Definitions Average Total Delay (seconds/vehicle) Level of Description Service Unsignalized Signalized Intersections Intersections A Little or no delay < 10.0 < 10.0 B Short traffic delay > 10.0 and < 15.0 > 10.0 and < 20.0 C Average traffic delay > 15.0 and < 25.0 > 20.0 and < 35.0 D Long traffic delay > 25.0 and < 35.0 > 35.0 and < 55.0 E Very long traffic delay > 35.0 and < 50.0 > 55.0 and < 80.0 F Extreme traffic delay > 50.0 > 80.0 Source: 2000 Highway Capacity Manual, Transportation Research Board. Traffic conditions at study intersections are evaluated for morning and evening peak hours using the methodology of the Transportation Research Board s 2000 Highway Capacity Manual. A level of service is assigned based on average delay per vehicle. 3.7 Existing Traffic Conditions The following nine intersections were identified as being inclusive of all the facilities on which the project may have a traffic impact: 1. 4 th Street / Hearst Avenue (All-way Stop); 2. 4 th Street / University North Frontage Road (All-way Stop); 3. 4 th Street / University South Frontage Road (All-way Stop); 4. 4 th Street / Addison Street (All-way Stop); 5. 6 th Street / Hearst Avenue (Signalized); 6. 6 th Street / University Avenue (Signalized); 7. 6 th Street / Addison Street (2-way Stop); 8. San Pablo Avenue / University Avenue (Signalized); and 9. 6 th Street / Allston Way (Signalized). Figure 2 illustrates the locations of each of the nine study intersections and the project site. Consistent with the traffic study completed for the approved Read Building project, the traffic counts included counts at eight of the study intersections, which were conducted during the morning and evening peak hours on Wednesday, June 15, 2004 before the end of the Berkeley Unified School District academic calendar and during the KORVE ENGINEERING, INC. 1/20/06 11
15 700 UNIVERSITY AVENUE MIXED- USE DEVELOPMENT TRAFFIC IMPACT STUDY U.C. Berkeley summer semester, as well as counts at the 6 th Street / Allston Way intersection, which were week day counts from February 2005, when Berkeley Unified School District and the U.C. Berkeley Spring semester were in session, conducted as part of the Read Building project's Traffic Study. Weekday counts are appropriate in this location since the residential component of the project leads to a midweek traffic generation peak for the project. Thus any measure of potential project related traffic impacts would be most appropriately focused on the midweek peak hours. Traffic counts for all study intersections are shown in Figure 3. Summaries of these counts are attached in the report s Technical Appendix A. Using these traffic counts along with lane geometry, signal phasing, and signal timing collected as part of this analysis, each of the nine study intersections has been assessed using the methodology of the 2000 Highway Capacity Manual. The results of this analysis are presented in Table 4. Level of Service calculation worksheets for each intersection are also attached in Technical Appendix C. Because the June 2004 counts were performed during the less heavily attending U.C. Berkeley summer semester, the counts were compared to those obtained through the UC Berkeley Long Range Development Plan (LRDP) in November Summaries of these counts are attached in the report s Technical Appendix A. The two intersections common to both studies are Sixth Street at University Avenue and University Avenue at San Pablo Avenue. As shown in Table 5, a comparison of volumes at these two locations showed no statistically significant difference in the total PM peak hour volumes at each intersection. Although the LRDP counts showed measurably higher volumes for the AM peak hour, these numbers were still on the order of 20 percent lower than the PM peak hour traffic counts. The PM peak hour represents the critical analysis scenario for measurement of any potential project related traffic impacts. Thus, since the total volume at each intersection was essentially the same for this project and the LRDP there is no need to use different counts. Additionally, cumulative volume projections for this study were compared to those projected in the LRDP. At both the 6 th Street / University Avenue and San Pablo Avenue / University Avenue intersections, cumulative volumes were projected to be higher in this study than in the LRDP. Therefore, this study provides a more conservative analysis of cumulative conditions. KORVE ENGINEERING, INC. 1/20/06 12
16 700 UNIVERSITY AVENUE MIXED- USE DEVELOPMENT TRAFFIC IMPACT STUDY Table 4: Existing Conditions Intersection Level of Service Summary Intersection Signal Type Peak Hour Existing Conditions LOS (Delay) 1 4 th Street / Hearst Avenue All-way stop AM B (11.0) PM B (14.2) 4 th Street / University Frontage North All-way stop AM A (7.7) PM A (9.0) 4 th Street / University Frontage South All-way stop AM A (7.8) PM A (8.7) 4 th Street / Addison Street All-way stop AM A (8.4) PM A (9.3) 6 th Street / Hearst Avenue Signalized AM B (12.2) PM B (18.8) 6 th Street / University Avenue Signalized AM C (31.9) PM D (49.3) 6 th Street / Addison Street 2-way stop AM B (14.8) PM C (16.7) University Avenue / San Pablo Avenue Signalized AM D (38.9) PM D (49.8) 6 th Street / Allston Way Signalized AM A (7.6) PM A (9.8) Notes: 1 Delay shown in seconds per vehicle. Average delay for the worst minor approach is shown for twoway stop controlled intersections. As illustrated in Table 4, each of the study intersections was identified as operating within the target LOS range of the City of Berkeley (LOS D or better). Table 5: Volume Comparison PM Peak Hour 700 University Volume LRDP Volume Intersection Existing Cumulative Existing Cumulative 6 th Street / University Avenue 4,033 5,233 4,031 4,370 University Ave / San Pablo Ave 4,327 5,541 4,457 4,888 As shown in Table 5, existing volumes at the Sixth Street / University Avenue and University Avenue / San Pablo Avenue intersections are similar in both this study and the LRDP. Cumulative volumes are projected to be higher in this study than in the LRDP. KORVE ENGINEERING, INC. 1/20/06 13
17 HEARST ADDISON UNIVERSITY SAN PABLO AV TENTH NINTH EIGHTH AV ST ST ST AV ST WAY SEVENTH ST SIXTH ST ALLSTON FIFTH ST FOURTH ST LOT #4 SECOND ST BOLIVAR DR EASTSHORE HWY LOTS #1 #2 and #3 Study Intersection 700 UNIVERSITY AVENUE MIXED USE DEVELOPMENT Figure 2 STUDY AREA W. FRONTAGE RD Traffic Volumes.cdr
18 16 (19) 71 (83) 12 (13) SAN PABLO AV TENTH NINTH EIGHTH AV 13 (26) 163 (452) 59 (125) ST ST ST AV 32 (38) 775(1129) 29 (33) 45 (76) 222(264) 241(385) 89 (139) 769(843) 230(227) ST 85 (141) 652(994) 73 (90) 10 (39) 90(455) 179(405) 112(121) 766(927) 88 (87) 45 (123) 787(707) 86 (95) 64 (85) 334(850) 95 (107) WAY 37 (33) 27 (17) 475(442) 25 (52) 161(223) 98 (15) 237(847) 10 (25) SEVENTH ST UNIVERSITY SIXTH ST ALLSTON FIFTH HEARST ST SECOND FOURTH EASTSHORE ST ST HWY LOT #4 ADDISON LOTS #1 #2 and #3 BOLIVAR 580 DR UNIVERSITY AVENUE MIXED USE DEVELOPMENT Figure 3 EXISTING TRAFFIC VOLUMES AM (PM) Peak Hour 8 (4) 301 (408) 34 (29) 29 (68) 89 (113) 214 (289) 43 (52) 20 (15) 37 (49) 10 (55) 282(796) 11 (45) 65 (61) 82 (68) 30 (54) 46 (59) 41 (41) 19 (5) 55 (54) 234 (221) 16 (156) 42 (111) 27 (64) 32 (56) 8 (18) 24 (27) 86 (84) 46 (240) 3 (1) 8 (8) 47 (212) 26 (42) 581(561) 29 (62) 6 (24) 9 (18) 2 (15) 24 (11) 102 (171) 11 (4) 19 (21) 60 (45) 144 (76) 20 (39) 9 (40) 25 (36) 4 (8) 29 (177) 10 (31) 131 (166) 7 (11) 16 (18) 137 (176) 4 (23) 10 (13) 0 (8) W. FRONTAGE RD Traffic Volumes.cdr
19 700 UNIVERSITY AVENUE MIXED- USE DEVELOPMENT TRAFFIC IMPACT STUDY 3.8 Baseline Traffic Conditions It was determined by the City of Berkeley that the approved Read Building Project 4 on the other side of Fourth Street was the only approved but undeveloped project in the vicinity that would affect the level of service of any of the study intersections. Since that project has been approved, projected traffic from that project has been added to the existing counts to determine the baseline (existing plus approved projects) traffic volumes. Table 6 summarizes the Level of Service for the Baseline Conditions. Traffic counts for all study intersections including traffic generated by the Read Building Project are shown in Figure 4. Table 6: Baseline Conditions Intersection Level of Service Intersection Signal Type Peak Hour Baseline Conditions LOS (Delay) 1 4 th Street / Hearst Avenue All-way stop AM B (11.1) PM C (15.5) 4 th Street / University Frontage North All-way stop AM A (7.8) PM A (9.5) 4 th Street / University Frontage South All-way stop AM A (7.8) PM A (9.3) 4 th Street / Addison Street All-way stop AM A (8.5) PM A (9.6) 6 th Street / Hearst Avenue Signalized AM B (12.2) PM B (19.7) 6 th Street / University Avenue Signalized AM C (32.0) PM D (49.7) 6 th Street / Addison Street 2-way stop AM B (14.9) PM C (16.9) University Avenue / San Pablo Avenue Signalized AM D (38.9) PM D (50.3) 6 th Street / Allston Way Signalized AM A (7.7) PM A (9.9) Notes: 1 Delay shown in seconds per vehicle. Average delay for the worst minor approach is shown for twoway stop controlled intersections. 4 The Read Building consists of 7,747 gross square feet of general office space, 8,540 gross square feet of retail space, and a 2,962 square foot dwelling unit. KORVE ENGINEERING, INC. 1/20/06 16
20 16 (19) 71 (83) 12 (13) SAN PABLO AV TENTH NINTH EIGHTH AV 13 (26) 163 (452) 59 (125) ST ST ST AV 32 (38) 783(1138) 29 (33) 45 (76) 223(265) 242(394) 89 (139) 771(868) 232(235) ST 85 (141) 657(1000) 73 (90) 10 (39) 90(455) 180(414) 112(121) 766(927) 89 (88) 45 (127) 788(724) 86 (99) 64 (85) 334(850) 96 (108) WAY 37 (33) 27 (17) 475(445) 31 (59) 161(229) 98 (15) 238(856) 13 (28) SEVENTH ST UNIVERSITY SIXTH ST ALLSTON FIFTH HEARST ST SECOND FOURTH EASTSHORE ST ST HWY LOT #4 ADDISON LOTS #1 #2 and #3 BOLIVAR 580 DR UNIVERSITY AVENUE MIXED USE DEVELOPMENT Figure 4 BASELINE TRAFFIC VOLUMES AM (PM) Peak Hour 8 (4) 302 (409) 35 (30) 30 (72) 89 (113) 214 (298) 43 (52) 20 (15) 37 (49) 10 (55) 285(799) 11 (45) 65 (61) 82 (68) 31 (55) 46 (59) 41 (41) 19 (5) 55 (54) 234 (221) 17 (169) 42 (111) 29 (92) 32 (56) 8 (18) 32 (36) 88 (87) 49 (281) 3 (1) 10 (36) 50 (253) 26 (42) 590(574) 29 (62) 14 (34) 9 (18) 2 (15) 24 (17) 103 (180) 11 (4) 25 (28) 60 (45) 144 (76) 21 (48) 9 (40) 25 (36) 4 (8) 29 (177) 10 (31) 134 (169) 7 (11) 16 (18) 147 (188) 4 (23) 10 (13) 0 (8) W. FRONTAGE RD Traffic Volumes.cdr
21 700 UNIVERSITY AVENUE MIXED- USE DEVELOPMENT TRAFFIC IMPACT STUDY 4.0 Baseline plus Project 4.1 Site Access/Circulation/Hazards/Alternative Transportation Access and Circulation. The proposed project would have one driveway on the north, one driveway on the east, and one driveway on the south. The project would also have a two-way internal street that bisects the site from Fourth Street, and turns south behind the South Building connecting to Addison Street. Both the south and east driveways would provide access to the primary public surface parking and resident-only South Building garage parking, including 34 parking lift spaces for maximized parking storage. The North Building garage is also for residents only. The north driveway is the sole access to 61 parking spaces consisting primarily of lift parking. The parking lifts would be in a secure area for use by residents only. All parking spaces in both garages measure 18 feet long and either eight feet or eight feet six inches wide. The ADA accessible spaces are 9 feet wide, as required.. The project would also provide 24 bicycle parking spaces, which meets bicycle parking requirements. Hazards and Emergency Access. The design of internal circulation and the placement of project driveways would not create any unsafe conditions within the project site or on neighboring streets. With respect to driveways, the reduction in number of driveways proposed by the current project reduces the number of potential conflict points between project automobile trips and passing bicycles or pedestrians. The driveways would not encroach on public right of way. Additionally, due to the fact that bus staging would occur along the north side of the University Frontage road, bus queuing would not interfere with the function of the north driveway. With respect to internal circulation, the internal street includes 8-foot wide parallel parking spaces between the North and South Buildings, which are designed outside of the 20-foot drive aisle of the street and provide adequate space for safe parking. The internal street also passes perpendicular parking by the train station and along the western property line. Along the perpendicular parking spaces, there is a 24-foot drive aisle, meeting the City requirements and providing adequate space for safe parking and maneuvering. Although the internal street bisects the site, the project plans includes a marked pedestrian crossing area from the train station plaza and southwest corner of the North Building to the South Building, which adequately protect pedestrian safety. Additionally, this drive aisle is a through route that serves as a fire lane to provide access to all buildings on the site. The minimum width along the drive aisle is 20 feet, which satisfies the requirement for a fire lane. Thus, this internal circulation system does not present any on-site hazards, and the driveway provides adequate on-site emergency access. Alternative Transportation. This project is extremely transit-oriented. The design incorporates in-building garages, public plazas, transit-oriented retail, and public walkways that maximize use of the adjacent bus stop/staging area and train station and provides pedestrian connection to the transit plaza and Addison Street to the City's Aquatic Park. The project does not conflict with the Bicycle Plan, as it incorporates adequate bicycle parking and does not interfere with established bicycle routes along Fourth Street and along Addison. KORVE ENGINEERING, INC. 1/20/06 18
22 700 UNIVERSITY AVENUE MIXED- USE DEVELOPMENT TRAFFIC IMPACT STUDY 4.2 Traffic Analysis Project Trip Generation Traffic volumes to be generated by the project were estimated based on the number of residential units, square footages of commercial spaces, and historical information presented in Trip Generation (Institute of Transportation Engineers, 7 th Edition, 2003). With trip reductions due to transit usage and the removal of existing land use (see Section 1.1), the Project is expected to generate 112 net new vehicle trips during the AM peak hour and 39 net new vehicle trips during the PM peak hour at Lots 1, 2, and 3. The Project is also expected to generate 1 net new vehicle trip during the AM peak hour and 66 net new vehicle trips during the PM peak hour at Lot 4. Thus, the project would generate a total of 113 net new trips during the AM peak hour and 105 net new trips during the PM peak hour. Tables 7 and 8 show the results of the trip generation forecast. Table 7: Trip Generation Lots #1, #2, and #3 Land Use Size AM PM Entering Exiting Total Entering Exiting Total Residential 173 units Retail 12,040 sf Café 1,500 sf Leasing Center 500 sf Subtotal % Transit trip reduction (transit usage plus linked trips) Removal of Existing Restaurant (Celia s) Removal of Existing Restaurant (Brennan s) ,000 sf ,000 sf Grand Total Table 8: Trip Generation Lot #4 Land Use Restaurant (Brennan s + patio seating) Size AM PM Entering Exiting Total Entering Exiting Total 6,090 sf Newsstand 500 sf Subtotal % Transit trip reduction (transit usage plus linked trips) Grand Total KORVE ENGINEERING, INC. 1/20/06 19
23 700 UNIVERSITY AVENUE MIXED- USE DEVELOPMENT TRAFFIC IMPACT STUDY Project Trip Distribution and Assignment Figure 9 shows the expected traffic volumes for the Baseline plus Project condition after the build out of all four lots. This is based on subtracting the current site traffic volumes (Celia's and Brennan's), as shown in Figure 10A, from the Baseline and adding the traffic volume that will be generated by the proposed project as shown in Figure 10B. The directional distribution of the project-generated traffic onto the roadway network was estimated based on existing travel patterns in the area, as shown in Figures 5 through 8. KORVE ENGINEERING, INC. 1/20/06 20
24 EIGHTH SEVENTH SIXTH [5%] FIFTH FOURTH HEARST SECOND EASTSHORE ADDISON AV ST ST ST HWY ST ST UNIVERSITY ST AV BOLIVAR 580 ALLSTON WAY DR 80 15% 15% 15% 37% 15% 20% 5% 15% 35% 50% 25% 40% 15% 30% [30%] 15% 5% LOT #4 20% 35% 15% 10% [10%] [20%] [35%] KEY XX% [XX%] LOTS #1 #2 and #3 Percentage of trips using this road segment Direction of project traffic Trip distribution on major arterials 700 UNIVERSITY MIXED USE DEVELOPMENT Figure 5 PROJECT TRIP DISTRIBUTION - SOUTH BUILDING, RETAIL AND LOT 4 INBOUND W. FRONTAGE RD Trips In Rev 1.cdr
25 EIGHTH SEVENTH SIXTH FIFTH FOURTH HEARST SECOND EASTSHORE ADDISON AV ST ST ST HWY ST ST UNIVERSITY ST AV BOLIVAR 580 ALLSTON WAY DR 2% 3% 80 2% 88% 10% 5% [5%] 20% 58% [30%] 35% 55% 30% [20%] [35%] KEY XX% [XX%] Percentage of trips using this road segment [10%] Direction of project traffic Trip distribution on major arterials 30% 55% LOT #4 LOTS #1 #2 and #3 10% 700 UNIVERSITY MIXED USE DEVELOPMENT Figure 6 PROJECT TRIP DISTRIBUTION - SOUTH BUILDING, RETAIL AND LOT 4 OUTBOUND W. FRONTAGE RD Trips Out Rev 1.cdr
26 EIGHTH SEVENTH SIXTH [5%] FIFTH FOURTH HEARST AV ST ST ST ST UNIVERSITY AV ADDISON ST ALLSTON WAY DR SECOND ST BOLIVAR EASTSHORE HWY 20% % 20% 15% 15% 12% 2% 20% 32% 3% 10% 100% 33% 30% [30%] 35% 10% LOT #4 LOTS #1 #2 and #3 20% 15% XX% 10% [10%] KEY Percentage of trips using this road segment Direction of project traffic [XX%] Trip distribution on major arterials 700 UNIVERSITY MIXED USE DEVELOPMENT Figure 7 PROJECT TRIP DISTRIBUTION - NORTH BUILDING INBOUND [20%] [35%] W. FRONTAGE RD Trips In #2 Rev 1.cdr
27 EIGHTH SEVENTH SIXTH HEARST AV FIFTH FOURTH SECOND ST ST ST ST ST UNIVERSITY AV ADDISON ST BOLIVAR ALLSTON WAY DR EASTSHORE HWY 3% 20% % 2% [5%] 35% 3% 60% 57% 55% [30%] 55% 30% 32% 10% LOT #4 LOTS #1 #2 and #3 10% 10% KEY XX% [10%] [XX%] Percentage of trips using this road segment Direction of project traffic Trip distribution on major arterials 700 UNIVERSITY MIXED USE DEVELOPMENT Figure 8 PROJECT TRIP DISTRIBUTION - NORTH BUILDING OUTBOUND [20%] [35%] W. FRONTAGE RD Trips Out #2 Rev 1.cdr
28 8 (4) 302(411) 36 (31) SAN PABLO AV TENTH NINTH EIGHTH SEVENTH 32 (73) 89 (113) 257(321) 16 (19) 71 (83) 12 (13) SIXTH FIFTH HEARST UNIVERSITY AV 13 (26) 165 (453) 61 (132) ST ST ST ST ST ST AV 32 (38) 791(1158) 32 (32) 45 (76) 223(265) 286(419) 92 (147) 795(881) 238(241) ADDISON ST 85 (141) 667(1019) 73 (90) 10 (39) 90(455) 181(417) 112(121) 766(927) 89 (88) 45 (127) 812(737) 86 (99) 64 (85) 334(850) 96 (108) WAY ALLSTON 27 (17) 475(445) 39 (64) 43 (52) 20 (15) 37 (49) 169(233) 37 (33) 98 (15) 239(859) 16 (31) 10 (55) 288(805) 11 (45) SECOND FOURTH EASTSHORE ST ST HWY LOT #4 LOTS #1 #2 and #3 BOLIVAR 580 DR UNIVERSITY AVENUE MIXED USE DEVELOPMENT Figure 9 BASELINE PLUS PROJECT TRAFFIC VOLUMES AM (PM) Peak Hour 65 (61) 82 (68) 34 (63) 46 (59) 41 (41) 19 (5) 55 (54) 234 (221) 62 (193) 42 (111) 29 (92) 32 (56) 14 (43) 35 (35) 94 (100) 94 (305) 8 (21) 14 (38) 62 (277) 26 (42) 598(578) 29 (62) 17 (44) 17 (16) 2 (15) 31 (21) 103 (180) 11 (4) 28 (38) 61 (45) 144 (76) 21 (48) 9 (40) 25 (36) 4 (8) 29 (177) 10 (31) 137 (168) 13 (33) 16 (18) 153 (187) 43 (43) 32 (24) 7 (12) W. FRONTAGE RD Traffic Volumes.cdr
29 W. FR ON TAG E R D ST ST ST HWY ST ST 0 ( 0 ) 0 (4) 0 ( 4 ) 0 ( 0 ) NINTH TE N TH 0 ( 15 ) EAS TS HORE 0 (3) 0 (12) 0 ( 0) 0 (11) SECOND 0 (27) 0 ( 0 ) FOU R TH FIFTH HEARST SIXTH S E V ENTH 0 (1) 0 (26) 0 ( 0 ) EIGHTH A V ST ST SAN PABLO AV 0 (27) ST A V UNIVERSITY 0 (2 6 ) 0 (1 4 ) 0 (23 ) BOLIVAR LOT #4 LOTS #1 #2 and #3 ADDISON 0 ( 26 ) 0 (14) 0 (18) 0 ( 3 ) S T 0 ( 11) 0 (12) 0 (0 ) 0 ( 22) 580 ALTO LS N WAY 0 (14) 0 (0 ) 80 0 (2) DR 0 (1) 0 (33) 0( 0) 0 (0 ) 0 (5) 0 (0 ) 0 ( 30) Traffic Volumes.cdr 0( 3) 0 (0 ) 0 (8) 0 ( 0 ) 0 (5) 0 (3 ) 0 (4) 700 UNIVERSITY AVENUE MIXED USE DEVELOPMENT Figure 10A CURRENT PROJECT SITE TRAFFIC VOLUMES AM (PM) Peak Hour
30 W. FR ON TAG E R D ST ST ST HWY ST ST 0 ( 0 ) 3 (12) 0 (2) 1 ( 5 ) 0 ( 0 ) NINTH TE N TH 3 ( 14 ) 6 (22 ) EAS TS HORE 6 (25) 3 (11) 0 ( 0) 6 (24) SECOND 4 5 (51) 0 ( 0 ) FOU R TH FIFTH HEARST SIXTH S E V ENTH 2 (2) 43 (49) 2 (1) 2 (7) EIGHTH A V ST ST 4 5 (5 1) 5 (23) ST A V UNIVERSITY SAN PABLO AV 6 (2 5 ) 39 (20) 22 (11) 7 (4) 4 (1 6 ) 1 2 (51 ) BOLIVAR LOT #4 LOTS #1 #2 and #3 ADDISON 4 4 ( 51 ) 3 (8) 24 (27) 6 (24) 1 ( 3 ) S T 8 ( 31) 3 (11) 0 (0 ) 10 (41) 580 ALTO LS N WAY 24 (27) 0 (0 ) 80 7 (6) DR 3 (14) 8 (31) 0( 0) 0 (0 ) 8 (9) 0 (0 ) 8 ( 35) Traffic Volumes.cdr Project Driveways 3 (10) 1( 3) 0 (0 ) 3 (14) 0 ( 0 ) 8 (9) 0 (0 ) 1 (3) 3 (10 ) 700 UNIVERSITY AVENUE MIXED USE DEVELOPMENT Figure 10B PROPOSED PROJECT TRAFFIC VOLUMES AM (PM) Peak Hour
31 700 UNIVERSITY AVENUE MIXED- USE DEVELOPMENT TRAFFIC IMPACT STUDY As shown in Figures 6 and 8, traffic exiting the project area via the freeway will exit by traveling north along Fourth Street, turning right (eastbound) on Hearst Avenue, turning right (southbound) on Sixth Street, and finally turning right (westbound) on University Avenue where on-ramps to I-80 can be accessed. However, should this route become congested, an alternate route can be used. The alternate route to the freeway would have project traffic travel south along Fourth Street, turning left (eastbound) on Allston Way, turning left (northbound) on Sixth Street, and finally turning left (westbound) on University Avenue. Although this alternate route exists and could be used by vehicles wishing to travel a potentially less congested route, in order to take a conservative approach, it was not used in the analysis of the proposed project. As shown in Figures 5 and 7, traffic entering the project area via southbound I-80 would likely take one path to project site. Conversely, traffic entering the project area via northbound I-80 would have two options to reach the project site. Frequent users would likely find the least congested path; however, our analysis does not take advantage of such traffic behavior, making our analysis of the movements of project-generated traffic a more conservative estimate. Twenty percent of inbound traffic for the north building is assumed to use the Eastshore Highway to Hearst Street to Fourth Street route to reach the project while 15 percent of inbound traffic to the north building is assumed to take the Second Street to Addison Street to Fourth Street route. All other inbound traffic is assumed to split an equal 15 percent between these two routes with another five percent using the University Avenue to Sixth Street to Addison Street route. 4.3 Intersection Operations All intersections would continue to operate at acceptable levels of service with the addition of project-related traffic. Table 9 summarizes the LOS for the Baseline plus Project condition. KORVE ENGINEERING, INC. 1/20/06 28
32 700 UNIVERSITY AVENUE MIXED- USE DEVELOPMENT TRAFFIC IMPACT STUDY Table 9: Intersection Level of Service Summary Baseline plus Project Intersection Baseline plus Traffic Peak Existing Baseline Project Control Hour Level of Service (Delay) 1 4 th St / All-Way AM B (11.0) B (11.1) B (11.6) Hearst Ave Stop PM B (14.2) C (15.5) C (17.0) 4 th St /Univ. All-Way AM A (7.7) A (7.8) A (8.0) Frontage North Stop PM A (9.0) A (9.5) A (10.3) 4 th St /Univ. All-Way AM A (7.8) A (7.8) A (8.1) Frontage South Stop PM A (8.7) A (9.3) A (9.8) 4 th St / 2-way AM A (8.4) A (8.5) A (8.6) Addison St Stop PM A (9.3) A (9.6) A (9.7) 6 th St / AM B (12.2) B (12.2) B (13.4) Signal Hearst Ave PM B (18.8) B (19.7) C (21.8) 6 th St/ AM C (31.9) C (32.0) C (33.3) Signal Univ. Ave PM D (49.3) D (49.7) D (54.1) 6 th St / 2-way AM B (14.8) B (14.9) B (15.2) Addison St Stop PM C (16.7) C (16.9) C (16.9) San Pablo Ave AM D (38.9) D (38.9) D (39.0) Signal / Univ. Ave PM D (49.8) D (50.3) D (50.9) 6 th St / AM A (7.6) A (7.7) A (7.7) Signal Allston Way PM A (9.8) A (9.9) A (10.0) Notes: 1 Delay shown in seconds per vehicle. Average delay for the worst minor approach is shown for twoway stop controlled intersections. It is important to note the level of service at the project driveway on Fourth Street. This driveway is expected to carry a significant amount of project-related traffic. In the Baseline plus Project condition, this driveway operates at LOS A and B in the AM and PM peak hours, respectively. In the Cumulative plus Project condition, this driveway operates at LOS B and C in the AM and PM peak hours, respectively. Level of Service calculation worksheets for this driveway are attached in Technical Appendix C. 4.4 Parking Analysis The City of Berkeley has off-street parking requirements for new development based on the City of Berkeley Zoning Ordinance (Section 23E : Off-Street Parking and Loading Requirements). The site is located in the West Berkeley Commercial Zoning District (C-W). The project proposes a total of 214 new parking spaces, including 6 handicapped-accessible spaces and 32 bicycle spaces. The garages are designated for residential parking and surface spaces are for commercial parking. City zoning guidelines require one (1) parking space per dwelling unit, one (1) parking space per 300 sq. ft. restaurant use, and two (2) parking spaces per 1,000 sq. ft. of other commercial use. City zoning guidelines also require one (1) bicycle parking space per 2,000 sq. ft. non-residential use. Additionally, where a project can reasonably expect a demand for bicycle parking and will not result in an undue shortage of parking spaces, City zoning guidelines permit the designation of up to ten percent (10%) of automobile parking required for a use for bicycle parking. This project reasonably expects high bicycle usage, as it is adjacent to City bicycle routes along Fourth Street and Addison Street and the necessary use permit is part of the project application. KORVE ENGINEERING, INC. 1/20/06 29
33 700 UNIVERSITY AVENUE MIXED- USE DEVELOPMENT TRAFFIC IMPACT STUDY Per the July 11, 2005 site plan, which provides for 8,400 square feet of non-residential uses on merged lots 1, 2 and 3, with the 10% parking substitution discussed above, 192 parking spaces are required (Scenario A). If 6,940 square feet of non-residential uses were added (bringing the total retail on merged lots 1, 2 and 3 to 14,040 square feet), then under Scenario B, 202 parking spaces would be required (Scenario B). Without the 10% substitution, no additional parking spaces would be required for Scenario A, and 10 additional parking spaces would be required for Scenario B. The addition of 10 lifts in the garages would meet this requirement.. Tables 10 and 11 show the calculations for the number of parking spaces required for the proposed Project under the zoning ordinance for both Scenarios. KORVE ENGINEERING, INC. 1/20/06 30
34 700 UNIVERSITY AVENUE MIXED- USE DEVELOPMENT TRAFFIC IMPACT STUDY Table 10: Off-Street Parking Requirement Scenario A Land Use Size Required Parking Vehicle Parking Bicycle Rate Spaces Rate Spaces Lots 1, 2, and 3 Residential 173 units 1/unit Retail/Leasing 6,900 sf 2/1000sf 14 1/2000sf 3 Café 1,500 sf 1/300sf 5 1/2000sf 1 Subtotal Lot 4 Restaurant 6,090 sf 1/300sf 20 1/2000sf 3 Newsstand 500 sf 2/1000sf 1 1/2000sf 0 Subtotal 21 3 Scenario A Subtotal % Bicycle Substitution Scenario A Total Available Spaces Per Plan Table 11: Off-Street Parking Requirement Scenario B Land Use Size Required Parking Vehicle Parking Bicycle Rate Spaces Rate Spaces Lots 1, 2, and 3 Residential 173 units 1/unit Retail/Leasing 12,540 sf 2/1000sf 25 1/2000sf 6 Café 1,500 sf 1/300sf 5 1/2000sf 1 Subtotal Lot 4 Restaurant 6,090 sf 1/300sf 20 1/2000sf 3 Newsstand 500 sf 2/1000sf 1 1/2000sf 0 Subtotal 21 3 Scenario B Subtotal % Bicycle Substitution Scenario B Total Available Spaces Per Plan The proposed plan will supply 214 vehicular parking spaces, which exceeds the total required automobile parking spaces, as shown in Tables 10 and 11. KORVE ENGINEERING, INC. 1/20/06 31
35 700 UNIVERSITY AVENUE MIXED- USE DEVELOPMENT TRAFFIC IMPACT STUDY 5.0 Cumulative Conditions 5.1 Traffic Analysis The Existing Conditions scenario traffic volumes were adjusted using a combination of ACCMA traffic forecasts for the year 2025 and the UC Berkeley Long Range Development Plan, consistent with the approved Traffic Study for the Read Building project. Non-compounded growth rates were then determined for each intersection approach. These rates varied from 11 percent to 51 percent in the AM peak hour and from 10 percent to 59 percent in the PM peak hour over 20 years. Expected Cumulative Conditions traffic volumes are presented in Table 14, and illustrated in Figure Intersection Operations Two signalized intersections will deteriorate to LOS F for this future baseline condition during the PM peak hour. With normal growth, these intersections will need improvements to operate more efficiently. The all-way stop controlled intersection of Fourth Street / Hearst Avenue will also operate at LOS F. With anticipated growth, a stop sign is not adequate to carry such large traffic volumes. Table 14 summarizes the level of service for the Cumulative scenario. Table 12: Intersection Level of Service Summary Cumulative Conditions without Project Intersection 4 th St / Hearst Ave 4 th St /Univ. Frontage North 4 th St /Univ. Frontage South 4 th St / Addison St 6 th St / Hearst Ave 6 th St/ Univ. Ave 6 th St / Addison St Univ. Ave / San Pablo Ave Traffic Control All-Way Stop All-Way Stop All-Way Stop 2-way Stop Signal Signal 2-way Stop Signal Cumulative Existing Conditions Peak Hour Conditions Level of Service (Delay) 1 AM B (11.0) C (21.9) PM B (14.2) F (72.0) AM A (7.7) A (8.4) PM A (9.0) B (11.9) AM A (7.8) A (8.4) PM A (8.7) B (11.2) AM A (8.4) B (10.0) PM A (9.3) B (12.5) AM B (12.2) B (13.8) PM B (18.8) D (41.4) AM C (31.9) D (45.9) PM D (49.3) F (99.2) AM B (14.8) C (16.8) PM C (16.7) D (29.2) AM D (38.9) D (47.7) PM D (49.8) F (105.9) AM A (7.6) B (11.9) 6 th St / Signal Allston Way PM A (9.8) B (11.7) Notes: 1 Delay shown in seconds per vehicle. Average delay for the worst minor approach is shown for twoway stop controlled intersections. Values in bold indicate locations that do not meet the City s target LOS. KORVE ENGINEERING, INC. 1/20/06 32
36 11 (5) 413(548) 48 (37) SAN PABLO AV TENTH NINTH EIGHTH SEVENTH 36 (93) 123(151) 249(373) 22 (25) 97 (111) 16 (17) SIXTH UNIVERSITY AV 17 (35) 217(606) 79 (168) ST ST ST ST ST AV 45 (51) 980(1296) 42 (59) 58 (207) 236(436) 347(525) 101(165) 846(1128) 288(261) ALLSTON ADDISON ST 216(167) 815(1079) 86 (103) 27 (95) 169(547) 377(453) 191(147) 805(1216) 115(167) 58 (245) 867(973) 99 (204) 117(98) 597(968) 162(174) WAY 53 (48) 39 (24) 684(639) 42 (82) 83 (65) 12 (22) 342(1229) 17 (39) FIFTH HEARST ST SECOND FOURTH EASTSHORE ST ST HWY LOT #4 LOTS #1 #2 and #3 BOLIVAR 580 DR UNIVERSITY AVENUE MIXED USE DEVELOPMENT Figure 11 CUMULATIVE BASELINE TRAFFIC VOLUMES AM (PM) Peak Hour 62 (75) 29 (22) 53 (71) 14 (79) 409(754) 16 (65) 94 (88) 118(98) 44 (76) 66 (85) 59 (59) 27 (7) 79 (78) 337(318) 25 (238) 60 (160) 41 (120) 46 (81) 12 (26) 43 (48) 126(124) 70 (387) 4 (1) 9 (37) 71 (346) 46 (63) 809(820) 37 (89) 17 (45) 13 (26) 3 (22) 35 (22) 148(255) 16 (6) 29 (34) 90 (67) 207(109) 37 (65) 13 (58) 29 (52) 6 (12) 42 (255) 14 (45) 192(242) 10 (16) 23 (26) 207(265) 7 (34) 13 (19) 0 (12) W. FRONTAGE RD Traffic Volumes.cdr
37 700 UNIVERSITY AVENUE MIXED- USE DEVELOPMENT TRAFFIC IMPACT STUDY 6.0 Cumulative Conditions plus Project 6.1 Traffic Analysis Figure 12 shows the expected traffic volumes of the Cumulative scenario with the addition of project traffic. 6.2 Intersection Operations As shown in Table 14, above, under Cumulative Conditions three of the nine intersections in the study area are projected to operate at LOS F. The project will not cause the LOS of any intersection to deteriorate from D or better to E or F; however the 4 th Street/Hearst Avenue intersection would experience an increase of over 0.01 to their volume-to-capacity ratios, thus resulting in a potentially significant impact. Table 15 summarizes the level of service for the Cumulative plus Project scenario, and Table 16 summarizes the change in critical movement volume/capacity ratio for intersections operating at LOS E or F. Table 13: Intersection Level of Service Summary Cumulative + Project Existing Conditions Cumulative plus Project Intersection Traffic Cumulative Peak Hour Control Level of Service (Delay) 1 4 th St / All-Way AM B (11.0) C (21.9) C (25.4) Hearst Ave Stop PM B (14.2) F (72.0) F (82.3) 4 th St /Univ. All-Way AM A (7.7) A (8.4) A (8.6) Frontage North Stop PM A (9.0) B (11.9) B (13.7) 4 th St /Univ. All-Way AM A (7.8) A (8.4) A (8.7) Frontage South Stop PM A (8.7) B (11.2) B (12.1) 4 th St / 2-way AM A (8.4) B (10.0) A (10.2) Addison St Stop PM A (9.3) B (12.5) B (12.8) 6 th St / AM B (12.2) B (13.8) B (15.8) Signal Hearst Ave PM B (18.8) D (41.4) D (47.3) 6 th St/ AM C (31.9) D (45.9) D (51.4) Signal Univ. Ave PM E (49.3) F (99.2) F (105.9) 6 th St / 2-way AM B (14.8) C (16.8) C (17.2) Addison St Stop PM C (16.7) D (29.2) D (29.2) Univ. Ave / AM D (38.9) D (47.7) D (48.1) Signal San Pablo Ave PM D (49.8) F (105.9) F (107.8) 6 th St / AM A (7.6) B (11.9) B (12.1) Signal Allston Way PM A (9.8) B (11.7) B (11.8) Notes: 1 Delay shown in seconds per vehicle. Average delay for the worst minor approach is shown for twoway stop controlled intersections. Values in bold indicate locations that do not meet the City s target LOS. KORVE ENGINEERING, INC. 1/20/06 34
38 700 UNIVERSITY AVENUE MIXED- USE DEVELOPMENT TRAFFIC IMPACT STUDY Table 14: Critical Volume-Capacity Ratio Cumulative Scenario Intersection Critical Movement V/C Ratio Peak Significant Hour Cumulative + Cumulative Total Increase Impact? Project 4 th St / AM N/A N/A N/A No Hearst Ave PM Yes 6 th St / AM N/A N/A N/A No University Ave PM No Univ. Ave / AM N/A N/A N/A No San Pablo Ave PM No KORVE ENGINEERING, INC. 1/20/06 35
39 11 (5) 413(550) 49 (38) SAN PABLO AV TENTH NINTH EIGHTH SEVENTH 38 (94) 123(151) 292(396) 22 (25) 97 (111) 16 (17) SIXTH FIFTH HEARST UNIVERSITY AV 17 (35) 219(607) 81 (175) ST ST ST ST ST ST AV 45 (51) 988(1316) 45 (58) 58 (207) 236(436) 305(412) 104(173) 870(1141) 294(267) ADDISON ST 216(167) 825(1098) 86 (103) 27 (95) 169(547) 377(453) 191(147) 805(1216) 115(167) 58 (245) 891(986) 99 (204) 117(98) 597(968) 162(174) WAY ALLSTON 39 (24) 684(639) 50(87) 62 (75) 29 (22) 53 (71) 91 (69) 53 (48) 12 (22) 342(1229) 20 (45) 14 (79) 412(760) 16 (65) SECOND FOURTH EASTSHORE ST ST HWY LOT #4 LOTS #1 #2 and #3 BOLIVAR 580 DR UNIVERSITY AVENUE MIXED USE DEVELOPMENT Figure 12 CUMULATIVE PLUS PROJECT TRAFFIC VOLUMES AM (PM) Peak Hour 94 (88) 118(98) 47 (84) 66 (85) 59 (59) 27 (7) 79 (78) 337(318) 70(262) 60(160) 41(120) 46 (81) 18 (48) 46 (47) 132(137) 115(411) 10 (24) 13(39) 84(374) 46 (63) 817(824) 37 (89) 21 (58) 21 (24) 3 (22) 42 (26) 148(255) 16 (6) 32 (44) 91 (67) 207(109) 37 (65) 13 (58) 29 (52) 6 (12) 42 (255) 14 (45) 195(241) 16 (38) 23 (26) 213(264) 46 (54) 35 (30) 7 (16) W. FRONTAGE RD Traffic Volumes.cdr
40 700 UNIVERSITY AVENUE MIXED- USE DEVELOPMENT TRAFFIC IMPACT STUDY 7.0 Congestion Management Program Analysis The Alameda County Congestion Management Program (CMP) requires the assessment of development-driven impacts to regional roadways. Because the project would generate more than 100 PM peak hour trips, the CMP requires the use of the Countywide Travel Demand Forecasting Model to assess the impacts on regional roadways near the project site during the PM peak hour. These roadways include: I-80, University Avenue, 6 th Street, and San Pablo Avenue. For the purposes of this report, we have assumed the standard of significance for determining project impacts to be the following: On CMA designated roadway segments that are projected to meet the CMA standard in the future without the project, the impact is significant if the project causes the segment to exceed the standard and adds at least one percent to the future hour peak traffic volume; or On CMA designated roadway segments that are projected to exceed the standard in the future without the project, the impact is significant if the project adds at least one percent to the future peak-hour traffic volume. The Countywide Model is a regional travel demand model that uses socio-economic data and roadway and transit network assumptions to forecast traffic volumes and transit ridership using a four-step modeling process that includes trip generation, trip distribution, mode split, and trip assignment. This process takes into account changes in travel patterns due to future growth and balances trip productions and attractions. For the purposes of the CMP Analysis, the land uses of the proposed project were added to the base assumptions in the Countywide Model for each of the forecast years; the land use assumptions in the Countywide Model for the rest of the region were not modified Tables 17, 18, and 19 summarize the freeway analysis for the 2005, 2010, and 2025 densities, volume-capacity ratios, and corresponding LOS. Tables 20, 21, and 22 summarize the volume-capacity ratio and LOS for major roadway segments in the study area for 2005 (Baseline), 2010, and As shown in Tables 17, 18, and 19, freeway level of service is expected to remain the same with the addition of project related traffic based on both volume-to-capacity and density methodologies. Although the volume-to-capacity method indicates that freeway segments would operate at undesirable conditions in some locations with or without the project, the project would represent less than one percent of the total freeway volume. Therefore, the project would not create any significant freeway impacts. As shown in Tables 20, 21, and 22, all roadway segments are expected to remain at acceptable levels of service with the addition of project related traffic. The project would not create any significant roadway segment impacts. KORVE ENGINEERING, INC. 1/20/06 37
41 700 UNIVERSITY AVENUE MIXED- USE DEVELOPMENT TRAFFIC IMPACT STUDY Table 15: 2005 Peak Hour Freeway Level of Service Volume-to-Capacity Methodology Density Methodology Percent Peak Location Direction Project Project Project Hour Veh/Lane 1 V/C LOS Veh/Lane 1 V/C LOS pc/mi/ln LOS pc/mi/ln LOS Volume AM 1, C 1, C 19.6 B 19.6 B 0.25% I-80 Northbound PM 1, E 1, E 31.2 D 31.2 D 0.08% North of AM 2, F 2, F 36.0 D 36.1 D 0.07% University Southbound PM 1, D 1, D 24.1 C 24.2 C 0.16% AM 1, C 1, C 20.0 B 20.0 B 0.18% I-80 Northbound PM 1, E 1, E 32.3 D 32.4 D 0.22% South of AM 2, F 2, F 37.7 D 37.9 D 0.26% University Southbound PM 1, D 1, D 24.8 C 24.8 C 0.19% 1 Source: Information from the Caltrans Traffic and Vehicle Data Systems Unit was used for existing volumes. Table 16: 2010 Peak Hour Freeway Level of Service Volume-to-Capacity Methodology Density Methodology Percent Peak Location Direction Project Project Project Hour Veh/Lane 1 V/C LOS Veh/Lane 1 V/C LOS pc/mi/ln LOS pc/mi/ln LOS Volume AM 1, C 1, C 20.4 C 20.5 C 0.24% I-80 Northbound PM 1, E 1, E 32.0 D 32.0 D 0.08% North of AM 2, F 2, F 36.2 D 36.3 D 0.07% University Southbound PM 1, D 1, D 25.1 C 25.1 C 0.16% AM 1, C 1, C 20.7 C 20.8 C 0.17% I-80 Northbound PM 1, F 2, F 33.6 D 33.7 D 0.22% South of AM 2, F 2, F 38.3 D 38.5 D 0.26% University Southbound PM 1, D 1, D 25.8 C 25.8 C 0.18% 1 Source: Information from the Caltrans Traffic and Vehicle Data Systems Unit was used for existing volumes; Countywide Model was used to determine growth. KORVE ENGINEERING, INC. 1/20/06 38
42 700 UNIVERSITY AVENUE MIXED- USE DEVELOPMENT TRAFFIC IMPACT STUDY Table 17: 2025 Peak Hour Freeway Level of Service Volume-to-Capacity Methodology Density Methodology Percent Peak Location Direction Project Project Project Hour Veh/Lane 1 V/C LOS Veh/Lane 1 V/C LOS pc/mi/ln LOS pc/mi/ln LOS Volume AM 1, C 1, C 23.1 C 23.1 C 0.21% I-80 Northbound PM 2, F 2, F 34.5 D 34.6 D 0.08% North of AM 2, F 2, F 36.8 D 36.8 D 0.07% University Southbound PM 1, D 1, D 28.2 C 28.3 C 0.15% AM 1, C 1, C 23.0 C 23.0 C 0.16% I-80 Northbound PM 2, F 2, F 38.1 D 38.3 D 0.21% South of AM 2, F 2, F 40.2 D 40.5 D 0.26% University Southbound PM 1, D 1, D 29.1 C 29.2 C 0.16% 1 Source: Information from the Caltrans Traffic and Vehicle Data Systems Unit was used for existing volumes; Countywide Model was used to determine growth. KORVE ENGINEERING, INC. 1/20/06 39
43 700 UNIVERSITY AVENUE MIXED- USE DEVELOPMENT TRAFFIC IMPACT STUDY Table 18: 2005 Peak Hour Roadway Segment Level of Service Location 6 th Street North of University 6 th Street South of University San Pablo North of University San Pablo South of University University West of 6 th Street University Between 6 th and San Pablo University East of San Pablo Direction Northbound Southbound Northbound Southbound Northbound Southbound Northbound Southbound Eastbound Westbound Eastbound Westbound Eastbound Westbound Volume-to-Capacity Methodology Peak 2005 (Baseline) Project Hour Veh/Lane V/C LOS Veh/Lane V/C LOS AM A A PM A A AM A A PM A A AM A A PM A A AM A A PM A A AM A A PM B B AM A A PM B B AM A A PM B B AM A A PM B B AM B B PM B B AM B B PM C C AM A A PM A A AM A A PM B B AM A A PM A A AM A A PM B B KORVE ENGINEERING, INC. 1/20/06 40
44 700 UNIVERSITY AVENUE MIXED- USE DEVELOPMENT TRAFFIC IMPACT STUDY Table 19: 2010 Peak Hour Roadway Segment Level of Service Location 6 th Street North of University 6 th Street South of University San Pablo North of University San Pablo South of University University West of 6 th Street University Between 6 th and San Pablo University East of San Pablo Direction Northbound Southbound Northbound Southbound Northbound Southbound Northbound Southbound Eastbound Westbound Eastbound Westbound Eastbound Westbound Volume-to-Capacity Methodology Peak Project Hour Veh/Lane V/C LOS Veh/Lane V/C LOS AM A A PM A A AM A A PM A A AM A A PM A A AM A A PM A A AM A A PM B B AM A A PM B B AM A A PM B B AM A A PM B B AM B B PM B B AM B B PM C C AM A A PM A A AM A A PM B B AM A A PM A A AM A A PM B B KORVE ENGINEERING, INC. 1/20/06 41
45 700 UNIVERSITY AVENUE MIXED- USE DEVELOPMENT TRAFFIC IMPACT STUDY Table 20: 2025 Peak Hour Roadway Segment Level of Service Location 6 th Street North of University 6 th Street South of University San Pablo North of University San Pablo South of University University West of 6 th Street University Between 6 th and San Pablo University East of San Pablo Direction Northbound Southbound Northbound Southbound Northbound Southbound Northbound Southbound Eastbound Westbound Eastbound Westbound Eastbound Westbound Volume-to-Capacity Methodology Peak Project Hour Veh/Lane V/C LOS Veh/Lane V/C LOS AM A A PM A A AM A A PM A A AM A A PM A A AM A A PM A A AM A A PM B B AM A A PM B B AM A A PM B B AM A A PM B B AM A A PM B B AM B B PM C C AM A A PM B B AM A A PM B B AM A A PM B B AM A A PM B B KORVE ENGINEERING, INC. 1/20/06 42
46 700 UNIVERSITY AVENUE MIXED- USE DEVELOPMENT TRAFFIC IMPACT STUDY 8.0 Project Impacts 8.1 Traffic Impact Significance Criteria City of Berkeley standards state that a significant traffic-related impact would occur if the addition of project-related traffic results in: Intersections where the project changes the projected service level from LOS D or better to LOS E or F, or At intersections projected to operate at LOS E or LOS F without the project, the project causes an increase in the critical movement volume-to-capacity ratio of 0.01 or more 8.2 Traffic Impacts/Mitigation Measures Baseline plus Project Under the Baseline plus Project scenario, the project will not have any potentially significant impacts Cumulative plus Project Under the Cumulative plus Project scenario, the project will have a potentially significant impact at the Fourth Street / Hearst Avenue intersection. Fourth Street / Hearst Avenue: In the future, the intersection is expected to operate at LOS F without the project. The project may cause an increase in the critical movement volume-to-capacity ratio of 0.01 or more. The project s potentially significant impact can be reduced to a less-than-significant level by implementing the suggested mitigation measure. Mitigation: The intersection is expected to meet the peak hour volume traffic signal warrant in the future scenarios with or without the project. Therefore, construction of a traffic signal prior to the year 2025 would mitigate the cumulative impacts, including project-generated impacts, at this location. With the addition of a traffic signal, this intersection is expected to operate at LOS A and C in the AM and PM peak hours, respectively (Cumulative plus Project condition). Level of Service calculation worksheets for this mitigation are attached in Technical Appendix C. The project is expected to provide its fair share of funding to provide the mitigation. The City defines fair share as a project s share of remaining capacity. Thus, fair share can be determined by the project s share of the increase in volume-to-capacity ratio. The increase in volume-to-capacity ratio is calculated using the following formula: Increase in V/C = (cumulative + project minus cumulative without project) / (cumulative + project minus baseline) The project s share of the increase in volume-to-capacity ratio is calculated to be 6.06%. Therefore, the project s share of funding to provide the mitigation is 6.06%. KORVE ENGINEERING, INC. 1/20/06 43
47 700 UNIVERSITY AVENUE MIXED- USE DEVELOPMENT TRAFFIC IMPACT STUDY 8.3 Congestion Management Program Analysis The Congestion Management Program analysis identified no additional project-related traffic impacts. 8.4 Conclusion In conclusion, we find that all potentially significant project-specific impacts under the Cumulative plus Project scenario can be mitigated to a less-than-significant level by implementing the recommended mitigation measures. KORVE ENGINEERING, INC. 1/20/06 44
48
49
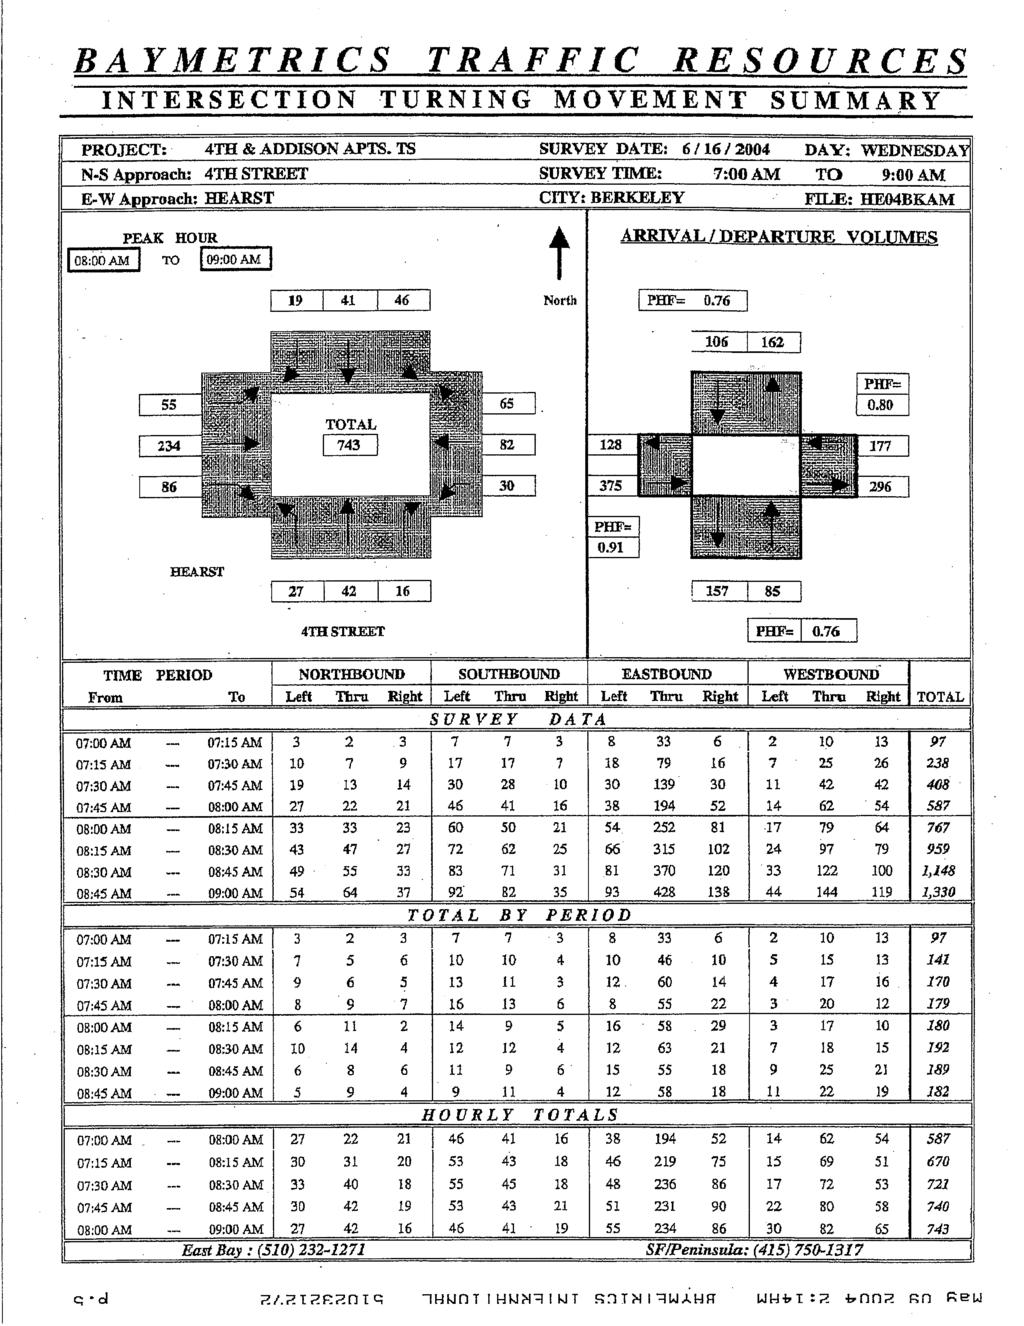
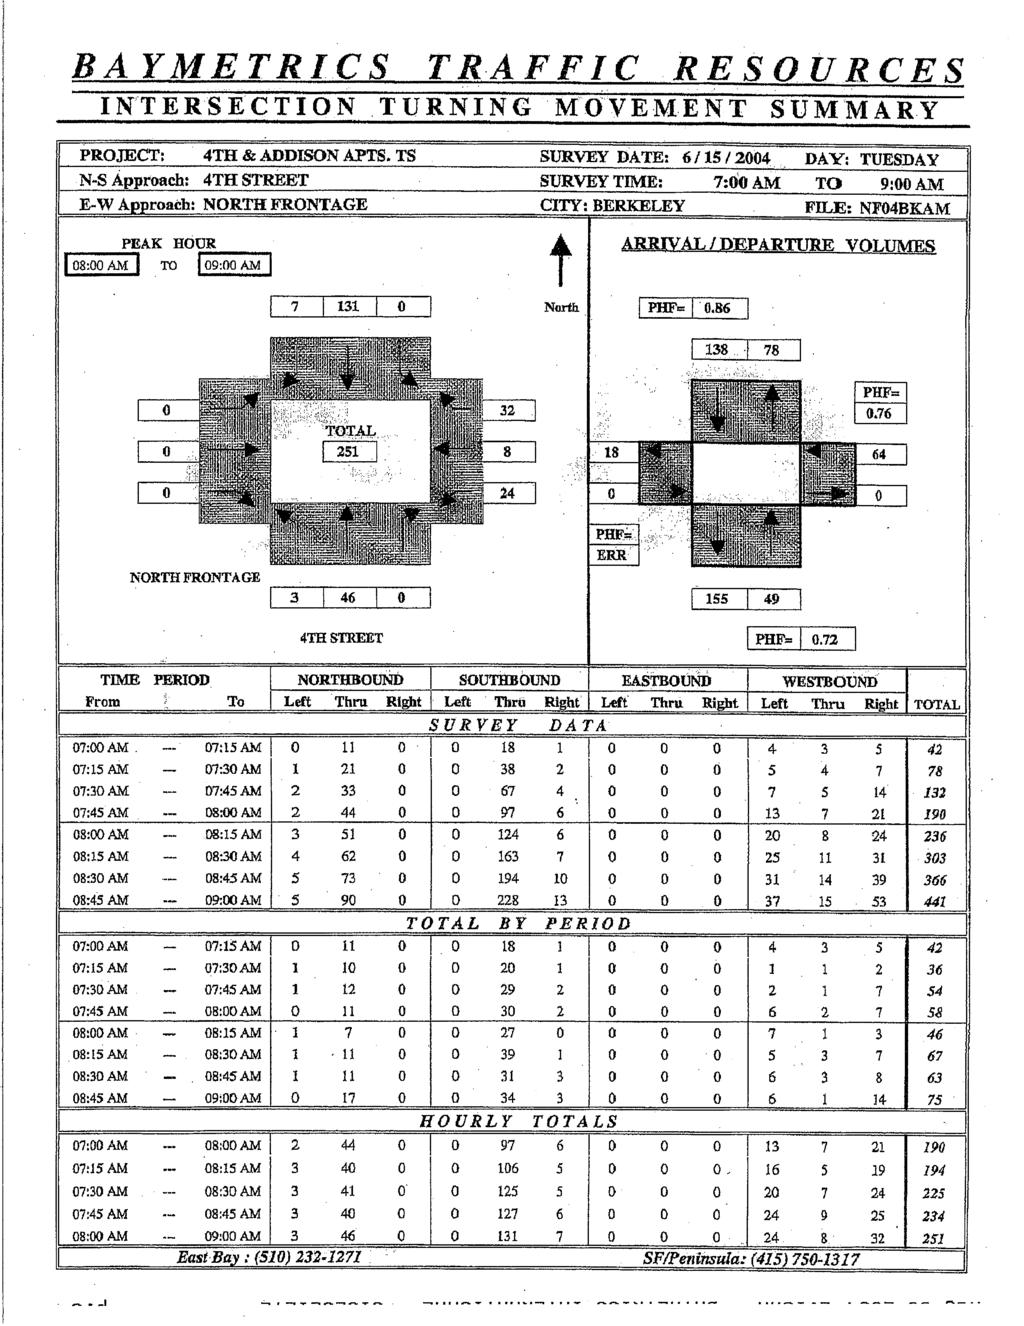
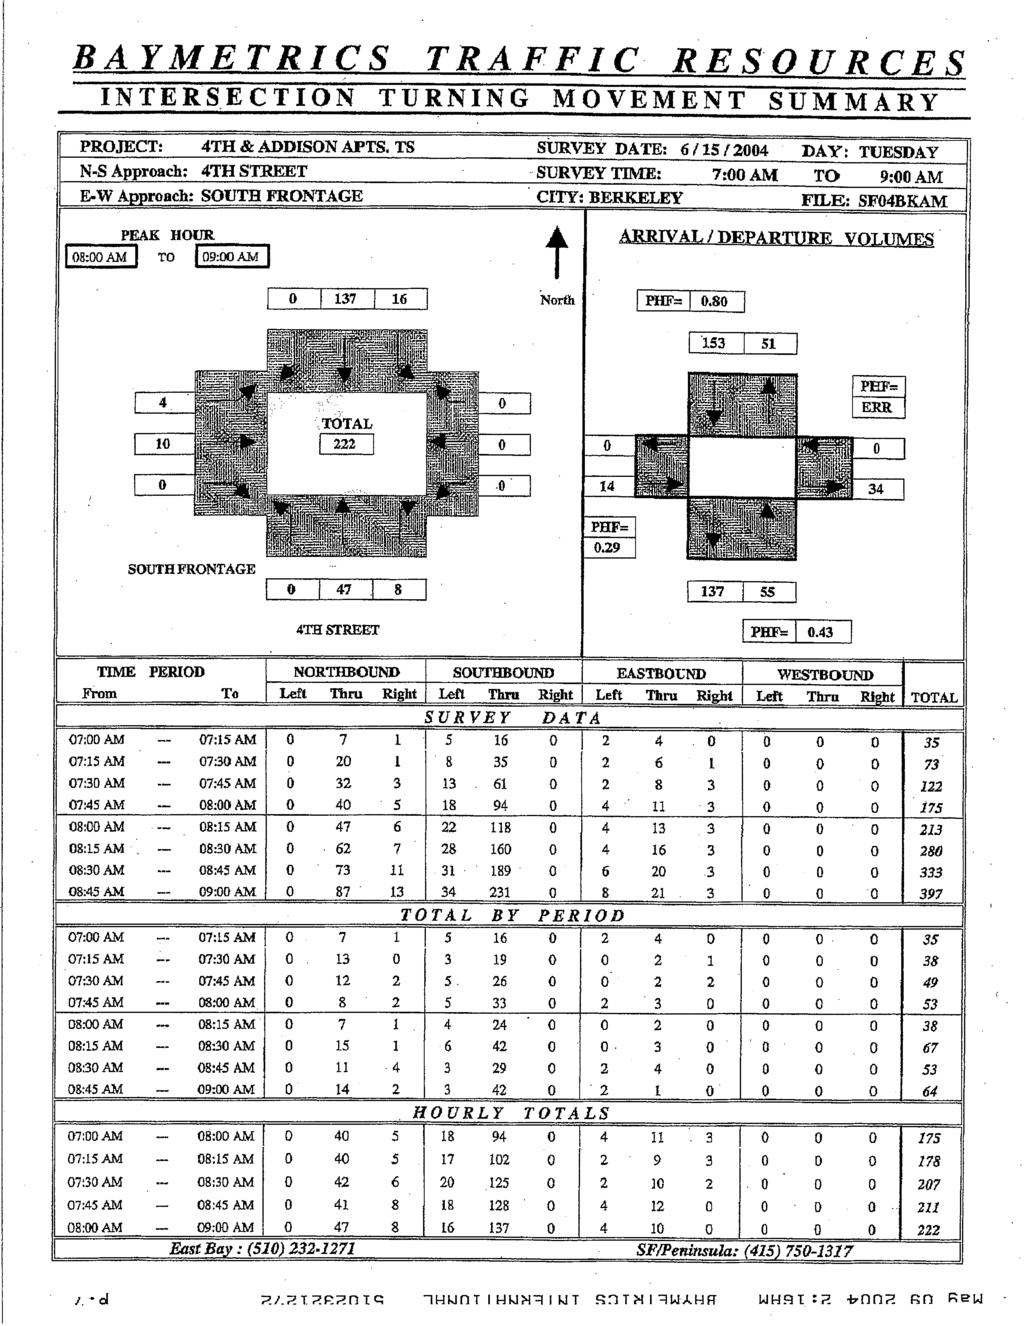
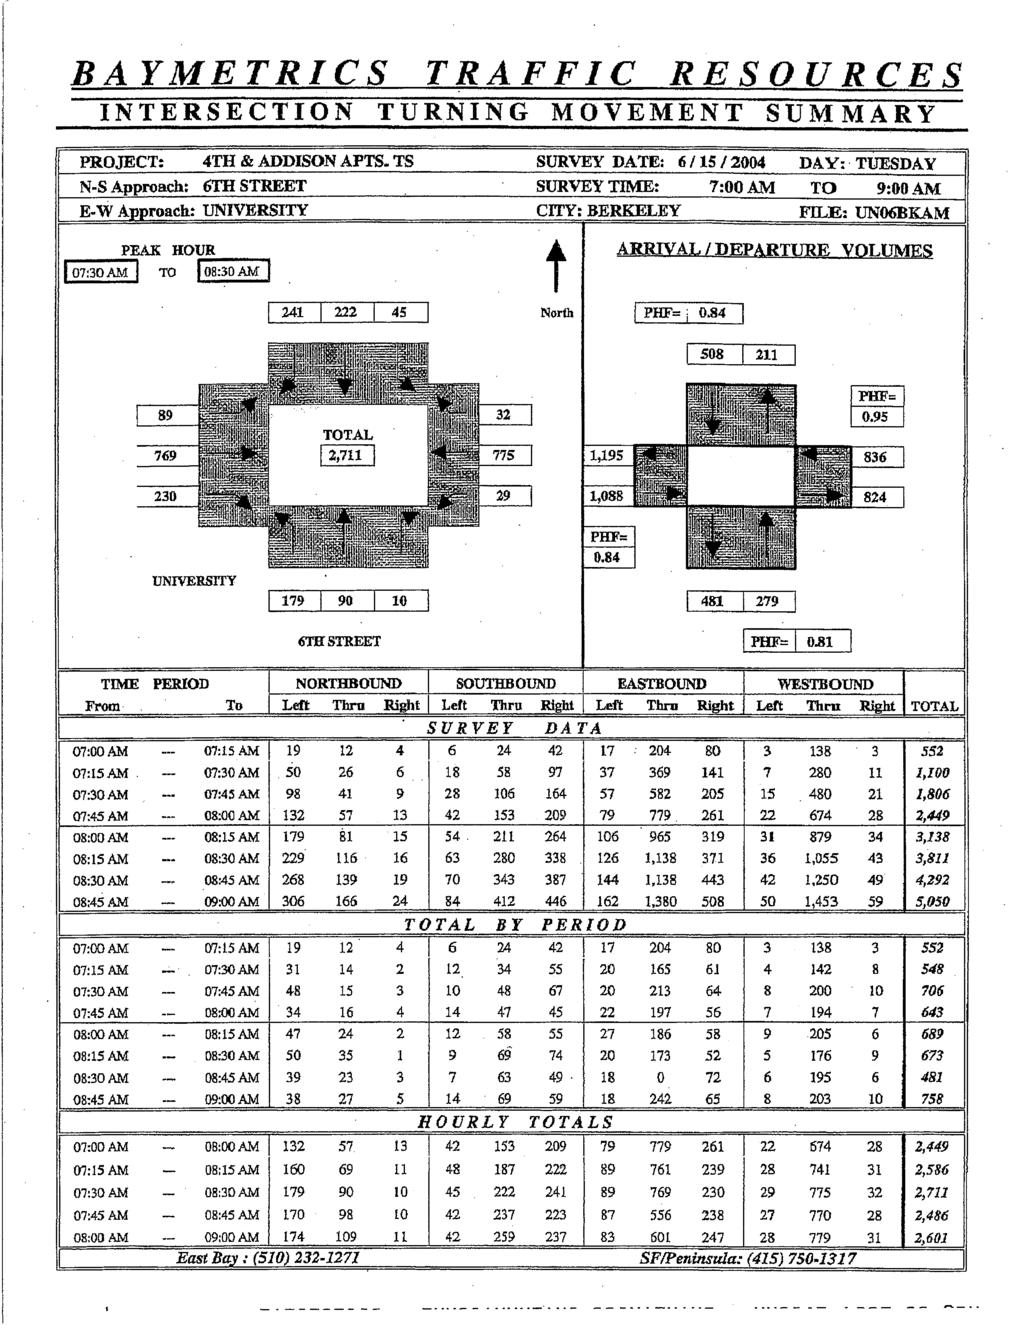
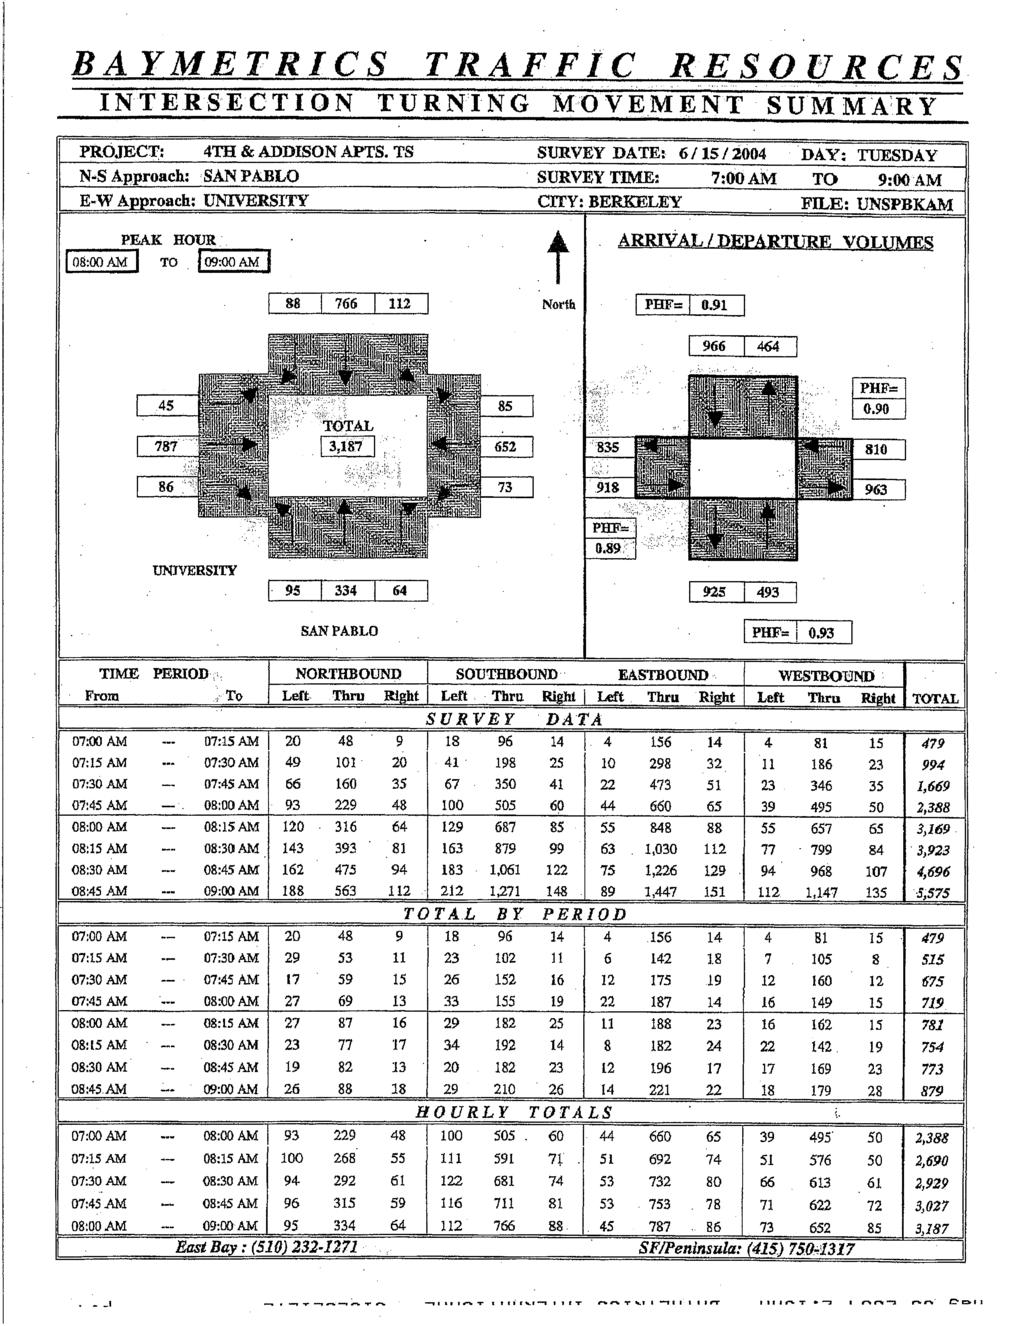
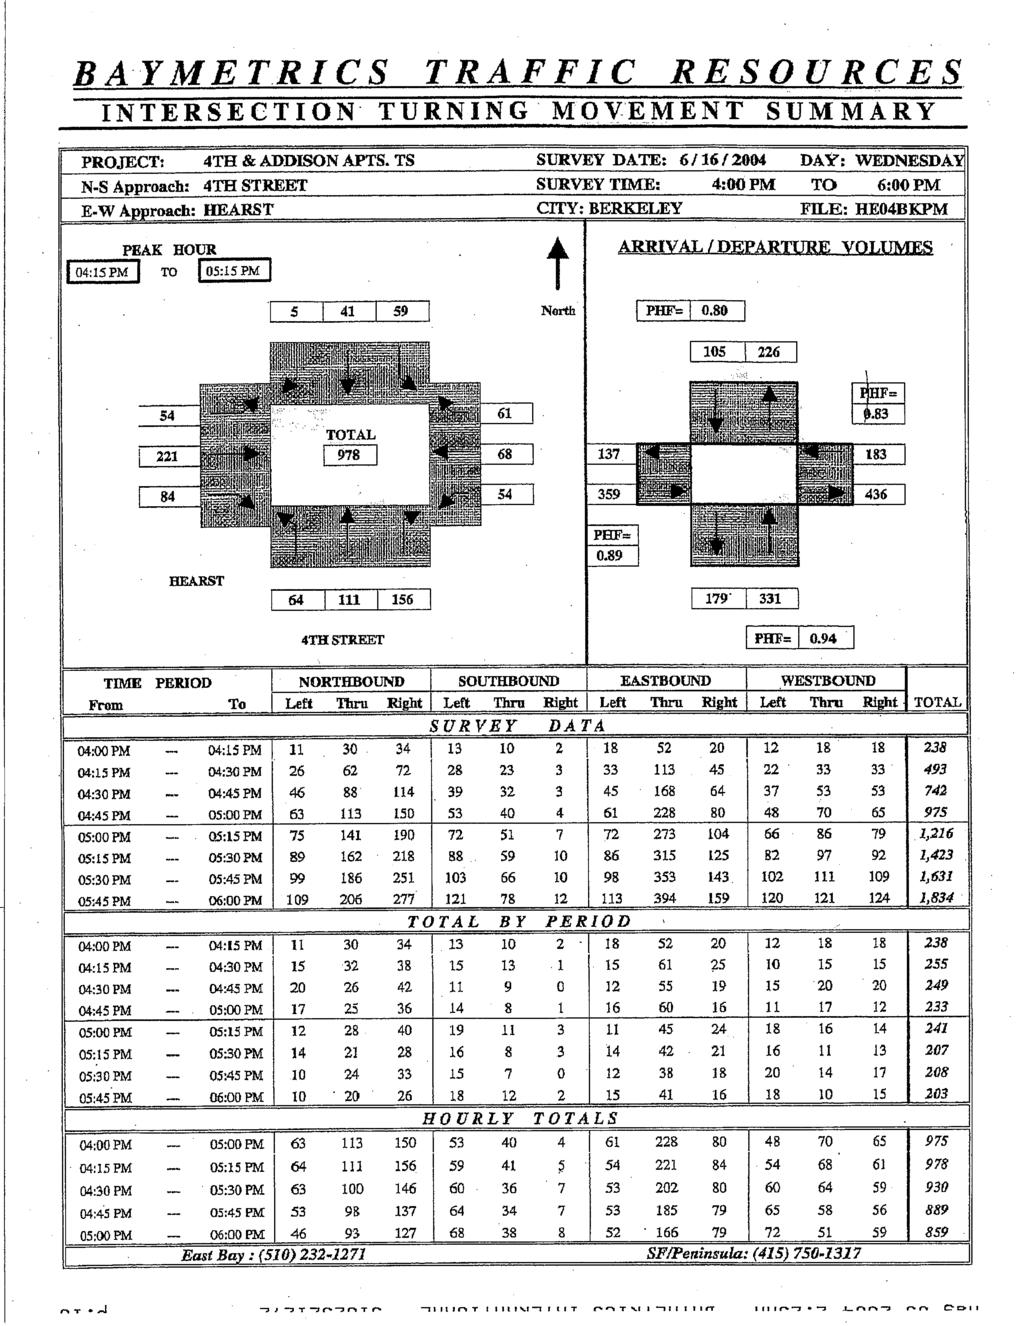
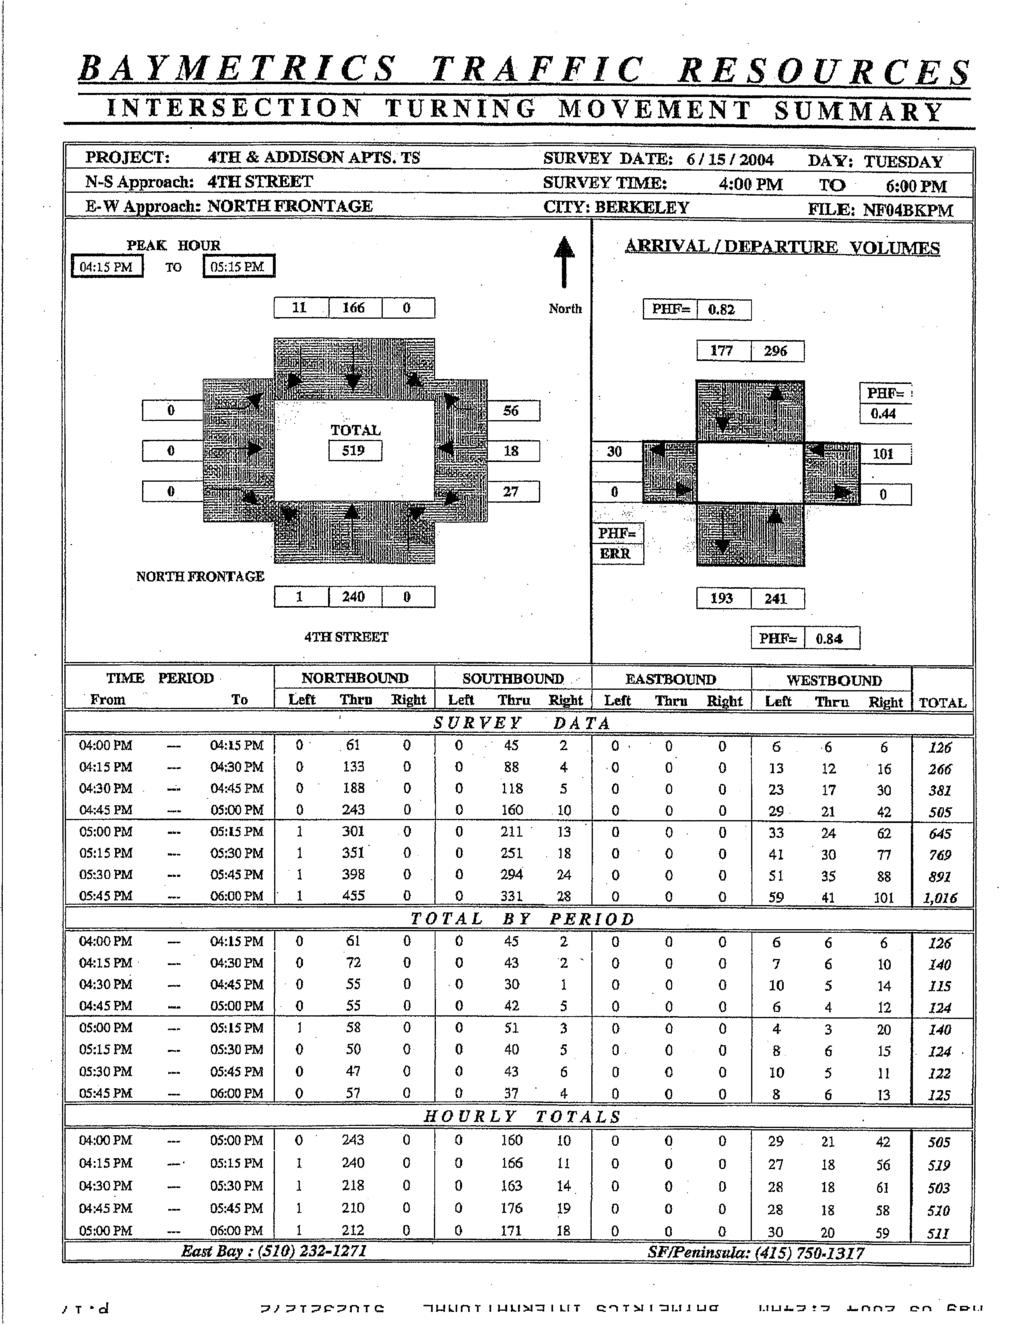
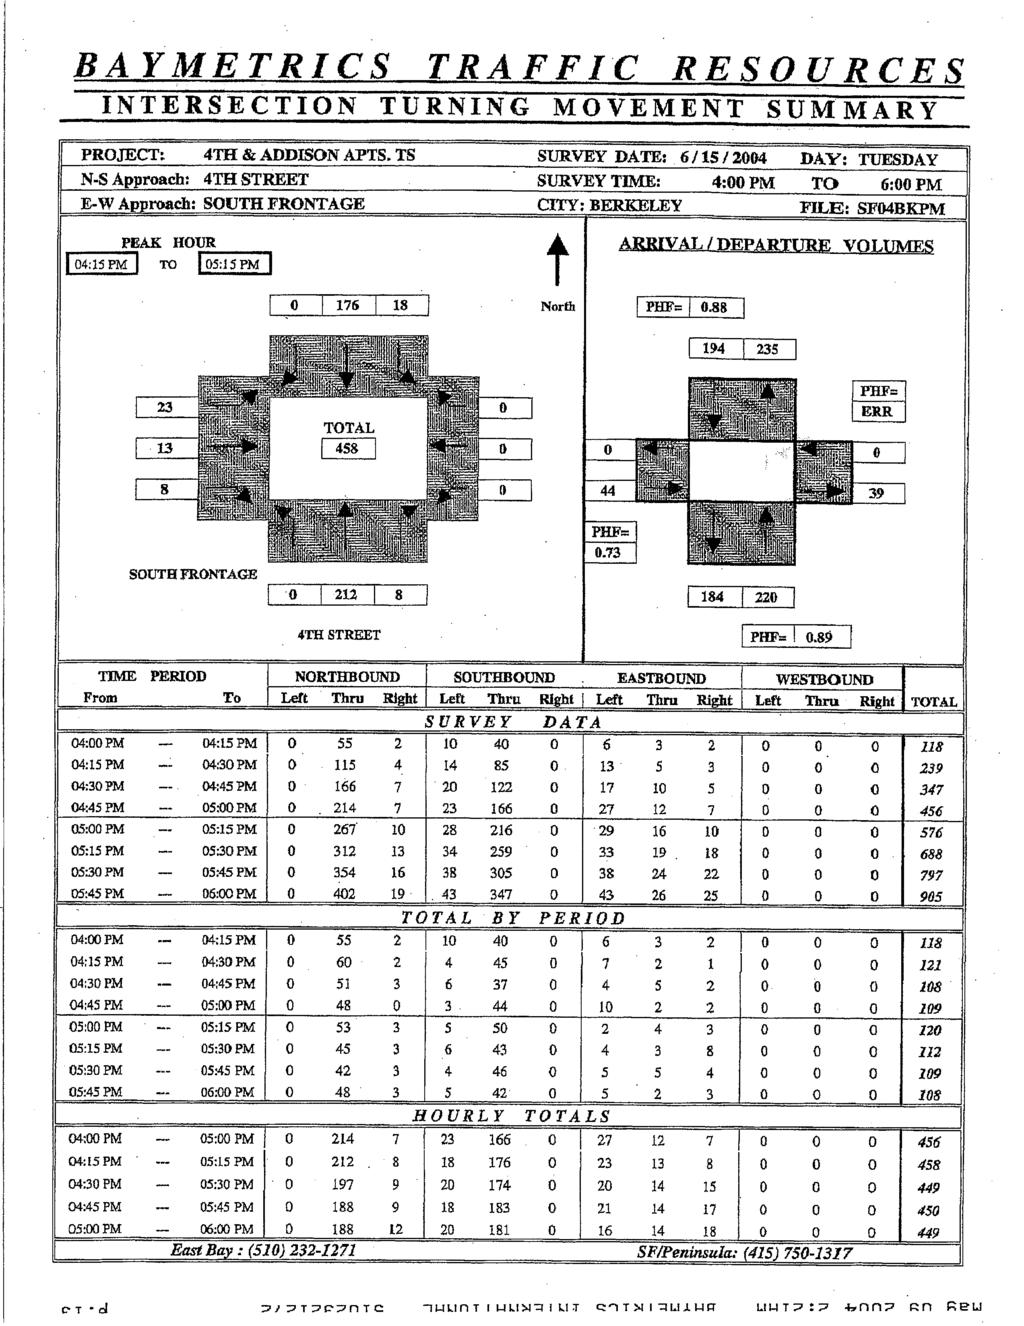
50 700 University Mixed-Use Development APPENDIX A INTERSECTION TURNING MOVEMENT SUMMARY Korve Engineering, Inc. Technical Appendix
51
52
53

54

55
56

57
58
59
60
61
62

63
64

65
66
67
BERKELEY DOWNTOWN AREA PLAN PROGRAM ENVIRONMENTAL IMPACT REPORT TRAFFIC IMPACT ANALYSIS
 BERKELEY DOWNTOWN AREA PLAN PROGRAM ENVIRONMENTAL IMPACT REPORT TRAFFIC IMPACT ANALYSIS Prepared for: City of Berkeley Prepared by: REVISED JANUARY 9, 2009 Berkeley Downtown Area Plan Program EIR Traffic
King Soopers #116 Thornton, Colorado
 Traffic Impact Study King Soopers #116 Thornton, Colorado Prepared for: Galloway & Company, Inc. T R A F F I C I M P A C T S T U D Y King Soopers #116 Thornton, Colorado Prepared for Galloway & Company
2.0 Development Driveways. Movin Out June 2017
 Movin Out June 2017 1.0 Introduction The proposed Movin Out development is a mixed use development in the northeast quadrant of the intersection of West Broadway and Fayette Avenue in the City of Madison.
APPENDIX B Traffic Analysis
 APPENDIX B Traffic Analysis Rim of the World Unified School District Reconfiguration Prepared for: Rim of the World School District 27315 North Bay Road, Blue Jay, CA 92317 Prepared by: 400 Oceangate,
Escondido Marriott Hotel and Mixed-Use Condominium Project TRAFFIC IMPACT ANALYSIS REPORT
 Escondido Marriott Hotel and Mixed-Use Condominium Project TRAFFIC IMPACT ANALYSIS REPORT Prepared for Phelps Program Management 420 Sixth Avenue, Greeley, CO 80632 Prepared by 5050 Avenida Encinas, Suite
LAWRENCE TRANSIT CENTER LOCATION ANALYSIS 9 TH STREET & ROCKLEDGE ROAD / 21 ST STREET & IOWA STREET LAWRENCE, KANSAS
 LAWRENCE TRANSIT CENTER LOCATION ANALYSIS 9 TH STREET & ROCKLEDGE ROAD / 21 ST STREET & IOWA STREET LAWRENCE, KANSAS TRAFFIC IMPACT STUDY FEBRUARY 214 OA Project No. 213-542 TABLE OF CONTENTS 1. INTRODUCTION...
Appendix C. Traffic Study
 Appendix C Traffic Study TABLE OF CONTENTS SECTION Executive Summary PAGE 1.0 Introduction... 1 1.1 Scope of Work... 1 1.2 Study Area... 2 2.0 Project Description... 3 2.1 Site Access... 4 2.2 Pedestrian
TALMONT TOWNHOMES MADISON KENNETH SPA TRAFFIC IMPACT STUDY. Sacramento, CA. Prepared For: MBK Homes. Prepared By:
 TALMONT TOWNHOMES MADISON KENNETH SPA TRAFFIC IMPACT STUDY Sacramento, CA Prepared For: MBK Homes Prepared By: KD Anderson & Associates 3853 Taylor Road, Suite G Loomis, California 95650 (916) 660-1555
Final. Traffic Impact Study For 1200 Ashby Avenue Mixed-Use Development. In City of Berkeley. November 26, TJKM Transportation Consultants
 TJKM Transportation Consultants Final Traffic Impact Study For 1200 Ashby Avenue Mixed-Use Development In City of Berkeley Pleasanton Fresno Sacramento Santa Rosa www.tjkm.com TJKM Transportation Consultants
Draft Report: West Berkeley Bowl Project
 Draft Report: West Berkeley Bowl Project July 2004 Prepared for: The City of Berkeley 1031-1925 F EHR & PEERS TRANSPORTATION CONSULTANTS 3685 Mt. Diablo Blvd. #301 Lafayette, CA 94549 925-284-3200 Fax:
West Hills Shopping Centre Lowe s Expansion Traffic Impact Study
 West Hills Shopping Centre Lowe s Expansion Traffic Impact Study Prepared for: Armel Corporation January 2015 Paradigm Transportation Solutions Ltd. 22 King Street South, Suite 300 Waterloo ON N2J 1N8
TRAFFIC IMPACT ANALYSIS
 TRAFFIC IMPACT ANALYSIS Emerald Isle Commercial Development Prepared by SEPI Engineering & Construction Prepared for Ark Consulting Group, PLLC March 2016 I. Executive Summary A. Site Location The Emerald
TRAFFIC IMPACT STUDY FOR SONIC DRIVE-IN RESTAURANT. Vallejo, CA. Prepared For:
 TRAFFIC IMPACT STUDY FOR SONIC DRIVE-IN RESTAURANT Vallejo, CA Prepared For: ELITE DRIVE-INS, INC. 2190 Meridian Park Blvd, Suite G Concord, CA 94520 Prepared By: KD Anderson & Associates 3853 Taylor Road,
EXECUTIVE SUMMARY. The following is an outline of the traffic analysis performed by Hales Engineering for the traffic conditions of this project.
 EXECUTIVE SUMMARY This study addresses the traffic impacts associated with the proposed Shopko redevelopment located in Sugarhouse, Utah. The Shopko redevelopment project is located between 1300 East and
TRAFFIC IMPACT ANALYSIS FOR. McDONALD S RESTAURANT IN CARMICAEL Sacramento County, CA. Prepared For:
 TRAFFIC IMPACT ANALYSIS FOR McDONALD S RESTAURANT IN CARMICAEL Sacramento County, CA Prepared For: McDonald s USA, LLC Pacific Sierra Region 2999 Oak Road, Suite 900 Walnut Creek, CA 94597 Prepared By:
Traffic Engineering Study
 Traffic Engineering Study Bellaire Boulevard Prepared For: International Management District Technical Services, Inc. Texas Registered Engineering Firm F-3580 November 2009 Executive Summary has been requested
Craig Scheffler, P.E., PTOE HNTB North Carolina, P.C. HNTB Project File: Subject
 TECHNICAL MEMORANDUM To Kumar Neppalli Traffic Engineering Manager Town of Chapel Hill From Craig Scheffler, P.E., PTOE HNTB North Carolina, P.C. Cc HNTB Project File: 38435 Subject Obey Creek TIS 2022
Transportation & Traffic Engineering
 Transportation & Traffic Engineering 1) Project Description This report presents a summary of findings for a Traffic Impact Analysis (TIA) performed by A+ Engineering, Inc. for the Hill Country Family
TIMBERVINE TRANSPORTATION IMPACT STUDY FORT COLLINS, COLORADO JANUARY Prepared for:
 TIMBERVINE TRANSPORTATION IMPACT STUDY FORT COLLINS, COLORADO JANUARY 2014 Prepared for: Hartford Companies 1218 W. Ash Street Suite A Windsor, Co 80550 Prepared by: DELICH ASSOCIATES 2272 Glen Haven Drive
INDUSTRIAL DEVELOPMENT
 INDUSTRIAL DEVELOPMENT Traffic Impact Study Plainfield, Illinois August 2018 Prepared for: Seefried Industrial Properties, Inc. TABLE OF CONTENTS Executive Summary 2 Introduction 3 Existing Conditions
APPENDIX C1 TRAFFIC ANALYSIS DESIGN YEAR TRAFFIC ANALYSIS
 APPENDIX C1 TRAFFIC ANALYSIS DESIGN YEAR TRAFFIC ANALYSIS DESIGN YEAR TRAFFIC ANALYSIS February 2018 Highway & Bridge Project PIN 6754.12 Route 13 Connector Road Chemung County February 2018 Appendix
Traffic Impact Analysis. Alliance Cole Avenue Residential Site Dallas, Texas. Kimley-Horn and Associates, Inc. Dallas, Texas.
 Traffic Impact Analysis Alliance Cole Avenue Residential Site Dallas, Texas February 15, 2018 Kimley-Horn and Associates, Inc. Dallas, Texas Project #064524900 Registered Firm F-928 Traffic Impact Analysis
HUMC/Mountainside Hospital Redevelopment Plan
 Traffic and Parking Analysis HUMC/Mountainside Hospital Redevelopment Plan in Glen Ridge Borough and Montclair Township PREPARED FOR H2M 119 Cherry Hill Road, Suite 110 Parsippany, NJ 07054 862.207.5900
Traffic Impact Analysis 5742 BEACH BOULEVARD MIXED USE PROJECT
 Traffic Impact Analysis 5742 BEACH BOULEVARD MIXED USE PROJECT CITY OF BUENA PARK Prepared by Project No. 14139 000 April 17 th, 2015 DKS Associates Jeffrey Heald, P.E. Rohit Itadkar, T.E. 2677 North Main
Date: February 7, 2017 John Doyle, Z-Best Products Robert Del Rio. T.E. Z-Best Traffic Operations and Site Access Analysis
 Memorandum Date: February 7, 07 To: From: Subject: John Doyle, Z-Best Products Robert Del Rio. T.E. Z-Best Traffic Operations and Site Access Analysis Introduction Hexagon Transportation Consultants, Inc.
RE: A Traffic Impact Statement for a proposed development on Quinpool Road
 James J. Copeland, P.Eng. GRIFFIN transportation group inc. 30 Bonny View Drive Fall River, NS B2T 1R2 May 31, 2018 Ellen O Hara, P.Eng. Project Engineer DesignPoint Engineering & Surveying Ltd. 200 Waterfront
Existing Traffic Conditions
 May 14, 2014 Ms. Lorraine Weiss City of San Mateo 330 West 20 th Avenue San Mateo, CA 94403 Subject: Traffic Operational Study for the Proposed Tilton Avenue Residential Development in San Mateo, California
Abrams Associates TRIP GENERATION AND PARKING ANALYSIS. City of Berkeley
 TRIP GENERATION AND PARKING ANALYSIS 2556 TELEGRAPH PROJECT City of Berkeley Prepared for: Realtex Group 505 Sansome Street, Suite 400 San Francisco, CA 94111 Prepared by: 1875 Olympic Boulevard, Suite
TRANSPORTATION STUDY FOR THE 8899 BEVERLY BOULEVARD PROJECT
 DRAFT TRANSPORTATION STUDY FOR THE 8899 BEVERLY BOULEVARD PROJECT WEST HOLLYWOOD, CALIFORNIA NOVEMBER 2013 PREPARED FOR BEVERLY BOULEVARD ASSOCIATION PREPARED BY DRAFT TRANSPORTATION STUDY FOR THE 8899
TABLE OF CONTENTS SECTION PAGE. Executive Summary... xii
 TABLE OF CONTENTS SECTION PAGE Executive Summary... xii 1.0 Introduction... 1 1.1 Study Area... 2 1.2 Traffic Impact Analysis Scenarios... 4 1.3 Study Area - City of Orange... 4 2.0 Project Description
King County Metro. Columbia Street Transit Priority Improvements Alternative Analysis. Downtown Southend Transit Study. May 2014.
 King County Metro Columbia Street Transit Priority Improvements Alternative Analysis Downtown Southend Transit Study May 2014 Parametrix Table of Contents Introduction... 1 Methodology... 1 Study Area...
Traffic Impact Analysis West Street Garden Plots Improvements and DuPage River Park Garden Plots Development Naperville, Illinois
 Traffic Impact Analysis West Street Garden Plots Improvements and DuPage River Park Garden Plots Development Naperville, Illinois Submitted by April 9, 2009 Introduction Kenig, Lindgren, O Hara, Aboona,
MINERVA PARK SITE TRAFFIC IMPACT STUDY M/I HOMES. September 2, 2015
 5500 New Albany Road Columbus, Ohio 43054 Phone: 614.775.4500 Fax: 614.775.4800 Toll Free: 1-888-775-EMHT emht.com 2015-1008 MINERVA PARK SITE TRAFFIC IMPACT STUDY M/I HOMES September 2, 2015 Engineers
Transit City Etobicoke - Finch West LRT
 Delcan Corporation Transit City Etobicoke - Finch West LRT APPENDIX D Microsimulation Traffic Modeling Report March 2010 March 2010 Appendix D CONTENTS 1.0 STUDY CONTEXT... 2 Figure 1 Study Limits... 2
Construction Realty Co.
 MEMORANDUM TO: FROM : Jeff Pickus Construction Realty Co. Luay R. Aboona, PE Principal 9575 West Higgins Road, Suite 400 Rosemont, Illinois 60018 p: 847-518-9990 f: 847-518-9987 DATE: May 22, 2014 SUBJECT:
Traffic Impact Study for Proposed Olive Boulevard Development
 Traffic Impact Study for Proposed 11330 Olive Boulevard Development Creve Coeur, Missouri July 7, 2017 Prepared For: 11330 Olive Boulevard Development 11330 Olive Boulevard Creve Coeur, Missouri 63141
Proposed location of Camp Parkway Commerce Center. Vicinity map of Camp Parkway Commerce Center Southampton County, VA
 Proposed location of Camp Parkway Commerce Center Vicinity map of Camp Parkway Commerce Center Southampton County, VA Camp Parkway Commerce Center is a proposed distribution and industrial center to be
APPENDIX E. Traffic Analysis Report
 APPENDIX E Traffic Analysis Report THIS PAGE INTENTIONALLY BLANK EAGLE RIVER TRAFFIC MITIGATION PHASE I OLD GLENN HIGHWAY/EAGLE RIVER ROAD INTERSECTION IMPROVEMENTS TRAFFIC ANALYSIS Eagle River, Alaska
Table of Contents INTRODUCTION... 3 PROJECT STUDY AREA Figure 1 Vicinity Map Study Area... 4 EXISTING CONDITIONS... 5 TRAFFIC OPERATIONS...
 Crosshaven Drive Corridor Study City of Vestavia Hills, Alabama Table of Contents INTRODUCTION... 3 PROJECT STUDY AREA... 3 Figure 1 Vicinity Map Study Area... 4 EXISTING CONDITIONS... 5 TRAFFIC OPERATIONS...
TRAFFIC IMPACT ANALYSIS SHORTBREAD LOFTS 2009 MODIFICATION Chapel Hill, North Carolina
 TRAFFIC IMPACT ANALYSIS SHORTBREAD LOFTS 2009 MODIFICATION Chapel Hill, North Carolina Prepared for: The Town of Chapel Hill, NC Prepared by: Architects-Engineers-Planners, Inc. November 2009 Traffic Impact
Oakbrook Village Plaza City of Laguna Hills
 Oakbrook Village Plaza City of Laguna Hills Traffic Impact Analysis Prepared by: HDR Engineering 3230 El Camino Real, Suite 200 Irvine, CA 92602 October 2012 Revision 3 D-1 Oakbrook Village Plaza Laguna
IRSCH REEN Hirsch/Green Transportation Consulting, Inc.
 IRSCH REEN Hirsch/Green Transportation Consulting, Inc. February 6, 2013 Mr. David Weil Director of Finance St. Matthew s Parish School 1031 Bienveneda Avenue Pacific Palisades, California 90272 RE: Trip
IV. ENVIRONMENTAL IMPACT ANALYSIS K.2. PARKING
 IV. ENVIRONMENTAL IMPACT ANALYSIS K.2. PARKING ENVIRONMENTAL SETTING The following analysis summarizes the findings and conclusions of the Traffic Analysis (Traffic Study), prepared by The Mobility Group,
TRAFFIC IMPACT STUDY DERRY GREEN CORPORATE BUSINESS PARK MILTON SECONDARY PLAN MODIFICATION
 TRAFFIC IMPACT STUDY DERRY GREEN CORPORATE BUSINESS PARK MILTON SECONDARY PLAN MODIFICATION TRAFFIC IMPACT STUDY DERRY GREEN CORPORATE BUSINESS PARK MILTON SECONDARY PLAN MODIFICATION DECEMBER 24 UPDATED
MONTEREY BAY AQUARIUM RESEARCH INSTITUTE (MBARI) MASTER PLAN UPDATE MOSS LANDING, CALIFORNIA
 MASTER PLAN UPDATE MOSS LANDING, CALIFORNIA") MONTEREY BAY AQUARIUM RESEARCH INSTITUTE (MBARI) MASTER PLAN UPDATE MOSS LANDING, CALIFORNIA TRAFFIC IMPACT ANALYSIS Administrative Draft Report Prepared For Monterey Bay Aquarium Research Institute Moss
MONTEREY BAY AQUARIUM RESEARCH INSTITUTE (MBARI) MASTER PLAN UPDATE MOSS LANDING, CALIFORNIA TRAFFIC IMPACT ANALYSIS Administrative Draft Report Prepared For Monterey Bay Aquarium Research Institute Moss
TRAFFIC IMPACT ANALYSIS FOR. Prepared For: Din/Cal 3, Inc Richmond Avenue, Suite 200 Houston, Texas Prepared By:
 TRAFFIC IMPACT ANALYSIS FOR STERLING 5 th STREET APARTMENTS PROJECT Davis, CA Prepared For: Din/Cal 3, Inc. 3411 Richmond Avenue, Suite 200 Houston, Texas 77046 Prepared By: KD Anderson & Associates, Inc.
Traffic Impact Study Speedway Gas Station Redevelopment
 Traffic Impact Study Speedway Gas Station Redevelopment Warrenville, Illinois Prepared For: Prepared By: April 11, 2018 Table of Contents 1. Introduction... 1 2. Existing Conditions... 4 Site Location...
Table Existing Traffic Conditions for Arterial Segments along Construction Access Route. Daily
 5.8 TRAFFIC, ACCESS, AND CIRCULATION This section describes existing traffic conditions in the project area; summarizes applicable regulations; and analyzes the potential traffic, access, and circulation
The major roadways in the study area are State Route 166 and State Route 33, which are shown on Figure 1-1 and described below:
 3.5 TRAFFIC AND CIRCULATION 3.5.1 Existing Conditions 3.5.1.1 Street Network DRAFT ENVIRONMENTAL IMPACT REPORT The major roadways in the study area are State Route 166 and State Route 33, which are shown
DEVELOPMENT PROPERTY 1627 MAXIME STREET CITY OF OTTAWA TRANSPORTATION OVERVIEW. Prepared for: Subhas Bhargava. July 9, Overview_1.
 DEVELOPMENT PROPERTY 1627 MAXIME STREET CITY OF OTTAWA TRANSPORTATION OVERVIEW Prepared for: Subhas Bhargava July 9, 2015 115-620 Overview_1.doc D. J. Halpenny & Associates Ltd. Consulting Transportation
MILLERSVILLE PARK TRAFFIC IMPACT ANALYSIS ANNE ARUNDEL COUNTY, MARYLAND
 MILLERSVILLE PARK TRAFFIC IMPACT ANALYSIS ANNE ARUNDEL COUNTY, MARYLAND Prepared for: Department of Public Works Anne Arundel County Prepared by: URS Corporation 4 North Park Drive, Suite 3 Hunt Valley,
THE CORNERSTONE APARTMENTS TRAFFIC IMPACT STUDY R&M PROJECT NO
 THE CORNERSTONE APARTMENTS SITUATED AT N/E/C OF STAUDERMAN AVENUE AND FOREST AVENUE VILLAGE OF LYNBROOK NASSAU COUNTY, NEW YORK TRAFFIC IMPACT STUDY R&M PROJECT NO. 2018-089 September 2018 50 Elm Street,
IV. ENVIRONMENTAL IMPACT ANALYSIS L. TRANSPORTATION/TRAFFIC
 IV. ENVIRONMENTAL IMPACT ANALYSIS L. TRANSPORTATION/TRAFFIC INTRODUCTION The following section summarizes the information provided in the traffic report entitled Traffic Impact Analysis for a Proposed
TRAFFIC PARKING ANALYSIS
 TRAFFIC PARKING ANALYSIS NAPA FLEA MARKET COUNTY OF NAPA Prepared for: Tom Harding Napa-Vallejo Flea Market 33 Kelly Road American Canyon, CA 9453 Prepared by: 166 Olympic Boulevard, Suite 21 Walnut Creek,
BROWARD BOULEVARD CORRIDOR TRANSIT STUDY
 BROWARD BOULEVARD CORRIDOR TRANSIT STUDY FM # 42802411201 EXECUTIVE SUMMARY July 2012 GOBROWARD Broward Boulevard Corridor Transit Study FM # 42802411201 Executive Summary Prepared For: Ms. Khalilah Ffrench,
APPENDIX C-2. Traffic Study Supplemental Analysis Memo
 APPENDIX C-2 Traffic Study Supplemental Analysis Memo The Mobility Group Transportation Strategies & Solutions Memorandum To: From: Subject: Tomas Carranza, LADOT Matthew Simons Traffic Review - Revised
TRAFFIC IMPACT ANALYSIS. for MILTON SQUARE
 TRAFFIC IMPACT ANALYSIS for MILTON SQUARE US Route 7 Milton, Vermont March 5, 2008 LAMOUREUX & DICKINSON 14 Morse Drive Essex Junction, Vermont 05452 (802) 878-4450 Traffic Impact Assessment EXECUTIVE
TRAFFIC IMPACT STUDY FOR
 TRAFFIC IMPACT STUDY FOR YUBA CROSSINGS MIXED USE DEVELOPMENT Yuba City, CA Prepared For: Yuba Crossings LLC 1825 Del Paso Blvd Sacramento, CA 95815 Prepared By: KDAnderson & Associates, Inc. 3853 Taylor
The key roadways in the project vicinity are described below. Exhibit displays the existing number of lanes on the study roadways.
 4.2 TRAFFIC AND CIRCULATION This section presents the key assumptions, methods, and results of analysis for the transportation and circulation impacts of the proposed project. This section is based on
Vanier Parkway and Presland Road Residential Development Transportation Impact Study
 Vanier Parkway and Presland Road Residential Development Transportation Impact Study Final Report (Revised) March 2011 Submitted to: Groupe Lépine Ottawa Project No. 09-1613 Submitted by: Groupe Lépine
DRAFT TRANSPORTATION IMPACT STUDY CASTILIAN REDEVELOPMENT PROJECT
 DRAFT TRANSPORTATION IMPACT STUDY CASTILIAN REDEVELOPMENT PROJECT Prepared for: Submitted by: 299 Lava Ridge Ct. Suite 2 Roseville, CA. 95661 June 212 TABLE OF CONTENTS 1. Introduction... 1 Project Location
GASOLINE SERVICE STATION 1618, 1622 ROGER STEVENS DRIVE OTTAWA, ONTARIO TRANSPORTATION IMPACT ASSESSMENT. Prepared for:
 GASOLINE SERVICE STATION 1618, 1622 ROGER STEVENS DRIVE OTTAWA, ONTARIO TRANSPORTATION IMPACT ASSESSMENT Prepared for: Invecta Development (Ottawa) Corporation 758 Shanks Height Milton, ON L9T 7P7 May
MERIVALE PRIORITY SQUARE 2852 MERIVALE ROAD CITY OF OTTAWA TRANSPORTATION BRIEF. Prepared for: ONT Inc. 25 Winding Way Nepean, Ontario K2C 3H1
 MERIVALE PRIORITY SQUARE 2852 MERIVALE ROAD CITY OF OTTAWA TRANSPORTATION BRIEF Prepared for: 2190986ONT Inc. 25 Winding Way Nepean, Ontario K2C 3H1 October 6, 2010 110-502 Report_1.doc D. J. Halpenny
2. Valley Circle Boulevard/Andora Avenue/Baden Avenue and Lassen Street
 IV.J TRANSPORTATION 1. INTRODUCTION This section presents an overview of the existing traffic and circulation system in and surrounding the project site. This section also discusses the potential impacts
L1TILE BEARS DAY CARE TRANSPORTATION IMPACT STUDY FORT COLLINS, COLORADO MAY Prepared for:
 L1TILE BEARS DAY CARE TRANSPORTATION IMPACT STUDY FORT COLLINS, COLORADO MAY 2012 Prepared for: Hillside Construction, Inc. 216 Hemlock Street, Suite B Fort Collins, CO 80534 Prepared by: DELICH ASSOCIATES
TRAFFIC IMPACT ANALYSIS FOR. STERLING FIFTH STREET APARTMENTS PROJECT Davis, CA. Prepared For:
 TRAFFIC IMPACT ANALYSIS FOR STERLING FIFTH STREET APARTMENTS PROJECT Davis, CA Prepared For: Din/Cal 3, Inc. 3411 Richmond Avenue, Suite 200 Houston, Texas 77046 Prepared By: KD Anderson & Associates,
METRO Orange Line BRT American Boulevard Station Options
 METRO Orange Line BRT American Boulevard Station Options Bloomington City Council Work Session November 18, 2013 Christina Morrison BRT/Small Starts Project Office Coordinating Planning and Design AMERICAN
Traffic Impact Study for the proposed. Town of Allegany, New York. August Project No Prepared For:
 Appendix B SRF Traffic Study (Revised November 2005) Draft Environmental Impact Statement University Commons Town of Allegany, Cattaraugus County, NY December 2005 Traffic Impact Study for the proposed
BARRHAVEN FELLOWSHIP CRC 3058 JOCKVALE ROAD OTTAWA, ONTARIO TRANSPORTATION BRIEF. Prepared for:
 BARRHAVEN FELLOWSHIP CRC 3058 JOCKVALE ROAD OTTAWA, ONTARIO TRANSPORTATION BRIEF Prepared for: Barrhaven Fellowship CRC 3058 Jockvale Road Ottawa, ON K2J 2W7 December 7, 2016 116-649 Report_1.doc D. J.
Volume 1 Traffic Impact Analysis Turtle Creek Boulevard Dallas, Texas. Kimley-Horn and Associates, Inc. Dallas, Texas.
 Volume 1 Traffic Impact Analysis 2727 Dallas, Texas June 18, 2018 Kimley-Horn and Associates, Inc. Dallas, Texas Project #064523000 Registered Firm F-928 Traffic Impact Analysis 2727 Dallas, Texas Prepared
TRANSPORTATION TECHNICAL REPORT
 TRANSPORTATION TECHNICAL REPORT for Sunrise Elementary School Replacement PREPARED FOR: Puyallup School District PREPARED BY: 6544 NE 61 st Street, Seattle, WA 98115 ph: (26) 523-3939 fx: (26) 523-4949
4.14 TRANSPORTATION AND CIRCULATION
 4.14 TRANSPORTATION AND CIRCULATION 4.14.1 Summary Table 4.14-1 summarizes the identified environmental impacts, proposed mitigation measures, and residual impacts of the proposed project with regard to
1650 South Delaware Street
 65 South Delaware Street Final Transportation Impact Analysis Prepared for: City of San Mateo June 8, 28 Hexagon Transportation Consultants, Inc. Hexagon Office: 4 North Second Street, Suite 4 San Jose,
IV. ENVIRONMENTAL IMPACT ANALYSIS J. TRANSPORTATION AND TRAFFIC
 IV. ENVIRONMENTAL IMPACT ANALYSIS J. TRANSPORTATION AND TRAFFIC This Section summarizes the information provided in the Traffic Study for the Santa Monica College Bundy Campus Master Plan (Traffic Study),
Quantitative analyses of weekday a.m. and p.m. commuter hour conditions have been conducted for the following five scenarios:
 6.1 TRANSPORTATION AND CIRCULATION 6.1.1 INTRODUCTION This section of the EIR presents the results of TJKM s traffic impact analysis of the proposed Greenbriar Development. The analysis includes consideration
Appendix Q Traffic Study
 Appendices Appendix Q Traffic Study Crummer Site Subdivision Draft EIR City of Malibu Appendices This page intentionally left blank. The Planning Center April 2013 TRAFFIC IMPACT ANALYSIS Photo z here
TRAFFIC IMPACT ANALYSIS RIZZO CONFERENCE CENTER EXPANSION FINAL REPORT
 TRAFFIC IMPACT ANALYSIS RIZZO CONFERENCE CENTER EXPANSION Chapel Hill, North Carolina FINAL REPORT Prepared for: The Town of Chapel Hill, NC Prepared by: Architects-Engineers-Planners, Inc. December 2010
V. DEVELOPMENT OF CONCEPTS
 Martin Luther King, Jr. Drive Extension FINAL Feasibility Study Page 9 V. DEVELOPMENT OF CONCEPTS Throughout the study process several alternative alignments were developed and eliminated. Initial discussion
Traffic Impact Statement (TIS)
") Traffic Impact Statement (TIS) Vincentian PUDA Collier County, FL 10/18/2013 Prepared for: Global Properties of Naples Prepared by: Trebilcock Consulting Solutions, PA 2614 Tamiami Trail N, Suite 615 1205
Traffic Impact Statement (TIS) Vincentian PUDA Collier County, FL 10/18/2013 Prepared for: Global Properties of Naples Prepared by: Trebilcock Consulting Solutions, PA 2614 Tamiami Trail N, Suite 615 1205
Traffic Impact Analysis for 2171 Rosecrans Avenue
 Traffic Impact Analysis for 2171 Rosecrans Avenue Prepared for: Continental Development Corporation Revised May 2016 LA16-2831 Prepared by: Fehr & Peers 600 Wilshire Blvd, Suite 1050 Los Angeles, CA 90017
Interstate Operations Study: Fargo-Moorhead Metropolitan Area Simulation Output
 NDSU Dept #2880 PO Box 6050 Fargo, ND 58108-6050 Tel 701-231-8058 Fax 701-231-6265 www.ugpti.org www.atacenter.org Interstate Operations Study: Fargo-Moorhead Metropolitan Area 2015 Simulation Output Technical
ANDERSON PROPERTY SITE ANALYSIS
 ANDERSON PROPERTY SITE ANALYSIS Introduction The Montgomery County Department of Transportation (MCDOT) initiated a feasibility study in the fall of 2012 to evaluate the need for transit service expansion
Alpine Highway to North County Boulevard Connector Study
 Alpine Highway to North County Boulevard Connector Study prepared by Avenue Consultants March 16, 2017 North County Boulevard Connector Study March 16, 2017 Table of Contents 1 Summary of Findings... 1
RICHMOND OAKS HEALTH CENTRE 6265 PERTH STREET OTTAWA, ONTARIO TRANSPORTATION BRIEF. Prepared for: Guycoki (Eastern) Limited.
 Limited.") RICHMOND OAKS HEALTH CENTRE 6265 PERTH STREET OTTAWA, ONTARIO TRANSPORTATION BRIEF Prepared for: Guycoki (Eastern) Limited June 16, 2016 116-638 Brief_1.doc D. J. Halpenny & Associates Ltd. Consulting
RICHMOND OAKS HEALTH CENTRE 6265 PERTH STREET OTTAWA, ONTARIO TRANSPORTATION BRIEF Prepared for: Guycoki (Eastern) Limited June 16, 2016 116-638 Brief_1.doc D. J. Halpenny & Associates Ltd. Consulting
Revised Report. Traffic Study for Safeway Fuel Center at Washington Square Shopping Center. In The City of Petaluma.
 Revised Report Traffic Study for Safeway Fuel Center at Washington Square Shopping Center In The Pleasanton Fresno Sacramento Santa Rosa TJKM www.tjkm.com Revised Report Traffic Study for Safeway Fuel
IMPROVEMENT CONCEPTS
 IMPROVEMENT CONCEPTS for the South Novato Transit Hub Study Prepared by: January 11, 2010 DKS Associates With Wilbur Smith Associates IMPROVEMENT CONCEPTS Chapter 1: Introduction 1. INTRODUCTION The strategic
IV. ENVIRONMENTAL IMPACT ANALYSIS N. TRANSPORTATION AND TRAFFIC
 IV. ENVIRONMENTAL IMPACT ANALYSIS N. TRANSPORTATION AND TRAFFIC The following section summarizes the information provided in the traffic report entitled Traffic Impact Analysis for a Proposed Residential
TABLE OF CONTENTS 1.0 INTRODUCTION AND SUMMARY Purpose of Report and Study Objectives... 2
 TABLE OF CONTENTS 1.0 INTRODUCTION AND SUMMARY 1 1.1 Purpose of Report and Study Objectives... 2 1.2 Executive Summary... 3 1.2.1 Site Location and Study Area... 3 1.2.2 Development Description... 3 1.2.3
Develop ground transportation improvements to make the Airport a multi-modal regional
 Project Overview TRANSPORTATION IMPROVEMENTS WHAT ARE THE PROJECT GOALS? Transportation transportation hub. Develop ground transportation improvements to make the Airport a multi-modal regional Land Use
5.9 TRANSPORTATION AND TRAFFIC
 5.9 TRANSPORTATION AND TRAFFIC This section evaluates transportation- and traffic-related impacts that have the potential to result from the construction and operation of the Project. Information and analysis
Table of Contents. Traffic Impact Analysis Capital One Building at Schilling Place
 Traffic Impact Analysis Capital One Building at Schilling Place Table of Contents Executive Summary... 1 1. Introduction... 4 2. Project Description... 4 3. Background Information... 4 4. Study Scope...
Trafalgar Road & Lower Base Line Transportation Study Ontario Inc.
 Trafalgar Road & Lower Base Line Transportation Study 1255723 Ontario Inc. Trafalgar Road & Lower Base Line Transportation Study 1255723 Ontario Inc. 1465 Pickering Parkway Suite 200 Pickering ON L1V 7G7
TRAFFIC SIGNAL DESIGN REPORT KING OF PRUSSIA ROAD & RAIDER ROAD RADNOR TOWNSHIP PENNSYLVANIA
 TRAFFIC SIGNAL DESIGN REPORT KING OF PRUSSIA ROAD & RAIDER ROAD RADNOR TOWNSHIP PENNSYLVANIA PREPARED FOR: UNIVERSITY OF PENNSYLVANIA HEALTH SYSTEM 34 CIVIC CENTER BOULEVARD PHILADELPHIA, PA 1987 (61)
Section 5.0 Traffic Information
 Section 5.0 Traffic Information 10.0 TRANSPORTATION MDM Transportation Consultants, Inc. (MDM) has prepared an evaluation of transportation impacts for the proposed evaluation for the expansion of the
Appendix J Traffic Impact Study
 MRI May 2012 Appendix J Traffic Impact Study Level 2 Traffic Assessment Limited Impact Review Appendix J [This page was left blank intentionally.] www.sgm-inc.com Figure 1. Site Driveway and Trail Crossing
CORE AREA SPECIFIC PLAN
 only four (A, B, D, and F) extend past Eighth Street to the north, and only Richards Boulevard leaves the Core Area to the south. This street pattern, compounded by the fact that Richards Boulevard is
TRAFFIC IMPACT STUDY. USD #497 Warehouse and Bus Site
 TRAFFIC IMPACT STUDY for USD #497 Warehouse and Bus Site Prepared by: Jason Hoskinson, PE, PTOE BG Project No. 16-12L July 8, 216 145 Wakarusa Drive Lawrence, Kansas 6649 T: 785.749.4474 F: 785.749.734
City of Marina. Regional Roundabout Study Utilizing Caltrans Intersection Control Evaluation Section 4: Transportation Agency for Monterey County
 Regional Roundabout Study Utilizing Caltrans Intersection Control Evaluation Section 4: City of Marina Study Intersections: RESERVATION ROAD AT BEACH ROAD RESERVATION ROAD AT DEFOREST ROAD CARDOZA AVENUE
1. INTRODUCTION 2. PROJECT DESCRIPTION CUBES SELF-STORAGE MILL CREEK TRIP GENERATION COMPARISON
 CUBES SELF-STORAGE MILL CREEK TRIP GENERATION COMPARISON 1. INTRODUCTION This report summarizes traffic impacts of the proposed CUBES Self-Storage Mill Creek project in comparison to the traffic currently
TRAFFIC DATA. Existing Derousse Ave./River Rd. AM LOS Analysis Existing Derousse Ave./River Rd. PM LOS Analysis
 Appendix E NJ TRANSIT Pennsauken Junction Transit Center and Park & Ride RiverLINE and Atlantic City Line Pennsauken Township, Camden County, New Jersey TRAFFIC DATA Background Traffic Information for