Section 5.0 Traffic Information
|
|
|
- Janis Benson
- 5 years ago
- Views:
Transcription
1 Section 5.0 Traffic Information
2 10.0 TRANSPORTATION MDM Transportation Consultants, Inc. (MDM) has prepared an evaluation of transportation impacts for the proposed evaluation for the expansion of the existing Exelon Generating Station to be located adjacent to the existing station located at 9 Summer Street (Route 126) Medway, Massachusetts. Specifically, the evaluation (a) documented existing traffic conditions along major roadways providing access to the site; (b) estimated traffic generation characteristics of the Proposed Project under peak operating conditions and during peak construction; (c) provided a qualitative assessment of traffic impacts relative to existing conditions; and (d) identified access improvements and on-site circulation/traffic management improvements, and a construction traffic management plan that supports the proposed operational needs of the Proposed Project while minimizing impact to adjacent roadways. As demonstrated in the sections below, key findings of the traffic impact assessment are as follows with the technical data included in Attachment G: Baseline Traffic Characteristics. Summer Street in the immediate study area carries approximately 7,885 vpd with 710 vehicles during the peak hour which represents 9% of the daily traffic volumes. West Street in the immediate study area is a low volume roadway that carries approximately 880 vehicles per day ( vpd ) with up to 98 vehicles during the peak hour which represents approximately 11% of the daily traffic volumes. Nominal Trip Generation. Under a worst case operational scenario with both the existing and proposed facilities experiencing peak operating conditions, the Site would generate 8 truck trips per hour (4 entering and 4 exiting trips) and approximately 176 truck trips per day (approximately 88 entering and 88 exiting). This anticipates that six trucks per hour would be delivering fuel to both the existing station and the Proposed Project. This theoretical worst case operating scenario assumes that both the existing station and the Proposed Project will be operating simultaneously at 100% burn rate on all units exclusively using oil as fuel. However, these conditions have never previously been observed at the existing Summer Street site. Adequate Capacity. Traffic impacts from operation of the Proposed Project will be nominal, even under a hypothetical worst case operational scenario with both the existing and proposed facilities experiencing peak operating conditions. The resulting truck trips would be approximately 1 directional trip every 15 minutes under worst case operations for both the existing station and proposed Project simultaneously which would have a nominal impact to traffic operations and thus no additional roadway improvements are warranted. Adequate Sight Lines. The sight lines from the proposed driveway locations exceed industry standards to allow safe vehicle exits, and no additional countermeasures are warranted (other than maintenance of existing conditions.) 3755/West Medway II 10-1 Transportation Draft Environmental Impact Report Epsilon Associates, Inc.
3 Established Truck Routes. Truck trips associated with replenishment of fuel supplies (oil) at the site will originate from Providence, RI. As a result, trucks destined to/from the Project will solely use I-495 to/ from the south and Route 126 to/from the west. These roadways are well established commercial truck routes, and provide the most direct and efficient means of travel to the Site. Adequate On-Site Circulation. Several on-site improvements were identified and incorporated into the site plan set in order to improve both site access/egress and on-site traffic circulation. Construction Activity. The preferred parking area for construction workers is at an existing material lay-down-lot in the southern portion of the Site along West Street. This preferred parking area which is primarily grass will be re-enforced with gravel, stone, or similar material during the construction period to facilitate construction employee parking. Upon completion of the construction, the material lay-down-lot will be restored with loam and seed. No additional improvements are needed for any of the construction entrances. Construction traffic would be adequately accommodated at all study intersections ("LOS D" or better operations are expected) during peak traffic hours. In practice, actual construction traffic will occur during off-peak hours, and impacts will therefore be considerably lower than analyzed. In summary, the study found that there will be adequate capacity along Summer Street and at the study intersections to accommodate the Project. Incremental traffic increases at the study intersections due to the Project generally result in inconsequential changes in intersection operations compared to No-Build conditions. Therefore, no additional off-site roadway improvements are warranted to accommodate the Project. Recommended access improvements, on-site circulation/traffic management improvements, and a construction traffic management plan will support the proposed operational needs of the Project while minimizing on-site and adjacent roadway impacts. American Association of State Highway and Transportation Officials ( AASHTO ) criteria for stopping sight distance and intersection sight distance for the ambient travel speeds are satisfied at the site driveway intersections with Summer Street and West Street Project Description The existing Exelon station contains a 135-megawatt (MW) power station on +/- 65 acres land using six (6) combustion turbine units located at the 9 Summer Street in Medway, Massachusetts. Currently, Exelon has approximately twelve (12) workers at the Site between the hours of 7:00 am and 3:00 pm and two (2) employees between the hours of 3:00 pm and 11:00 pm. The Site in relation to the regional transportation system is shown in Figure /West Medway II 10-2 Transportation Draft Environmental Impact Report Epsilon Associates, Inc.
4
5 The proposed expansion will include an adjacent 200-megawatt (MW) power station that consists of 2 dual-fuel generating units with oil backup. The Project will primarily use natural gas fuel to generate power which would be piped to the Site via a natural gas pipeline. As a backup fuel, the Project will also use ULSD which would be stored in an onsite 1,000,000 gallon storage tank. The fuel oil will be trucked to the Site to replenish the storage tank using 9,000 gallon fuel trucks via established commercial truck routes including I-495 and Route 126. In addition to these trips, occasional truck trips (several per week) may be generated to remove wastewater and replace demineralized water trailers. Water will be delivered to the Project via pipeline which will be used for emissions reduction purposes. Water demand is estimate to be used at a rate of 47,500 gallons per day with two on-site water storage tanks planned with a combined capacity of 950,000 gallons of water storage. The existing station will continue to operate as a peaking station with an expanded capacity to generate 335 MW. The Project will accept fuel deliveries 22 hours per day with no fuel deliveries during the roadway peak hours, with the bulk of the deliveries on weekdays from 7:00 am to 3:00 pm. Projected on-site employment for the proposed Project is 6 additional employees, generally working the 7:00 am to 3:00 pm shift. The proposed shifts are designed to avoid peak traffic periods on area roadways with employees generally arriving prior to 7:00 am and exiting prior to 4:00 pm. A conceptual site plan prepared by HDR, Inc. is shown in Figure 10-2 for reference purposes Baseline Conditions An overview of baseline roadway conditions, traffic volumes, safety characteristics, and public transportation facilities serving the area is provided below Study Area In brief, the traffic study evaluated area roadways likely to sustain a measurable impact from the Project, which included the following primary study intersections: Route 109 at Route 126 (Signalized); Route 126 at Exelon Site Driveway (Unsignalized); and Route 126 at Main Street (Unsignalized). Study locations which are likely to sustain a measurable impact from the Project during construction periods include the primary study intersections as well as the following supplemental study intersections: Route 126 at West Street (Unsignalized); Route 109 at West Street (Unsignalized); and 3755/West Medway II 10-4 Transportation Draft Environmental Impact Report Epsilon Associates, Inc.
6
7 West Street at Proposed Construction Driveway (Unsignalized). Details are presented in the sections below with the study intersection shown in Figure Roadways Summer Street (Route 126) Summer Street is classified by the Massachusetts Department of Transportation (MassDOT) as an urban principal arterial under local (Town) jurisdiction within the study area. Summer Street is a north-south roadway connecting Washington Street (Routes 16/126) to the north with Main Street (Route 126) to the south. The roadway generally provides a single travel lane in each direction with additional turn lanes provided at its major intersections. Near the project Site, a bituminous sidewalk is provided along the western side of the roadway. Within the study area, the posted (regulatory) speed limit along Summer Street is 40 miles per hour (mph). Land uses along Summer Street include a mix of land uses including the existing Exelon Peaking station, residential uses, several restaurants, the Medway Fire Department, and the Medway High School. Milford Street (Route 109) Milford Street is classified by MassDOT as an urban principal arterial under local (Town) jurisdiction within the study area. Milford Street is an east-west roadway connecting Medway Road (Route 109) to the west with Highland Street (Route 109) to the east. The roadway generally provides a single travel lane in each direction with additional turn lanes provided at its major intersections. Within the immediate study area, there are limited sidewalks along Milford Street. Within the study area, the posted (regulatory) speed limit along Milford Street ranges from 35 to 40 mph. Within the immediate study area, land uses along Milford Street include residential homes with increased commercial activity near Summer Street. Main Street Main Street is classified by MassDOT as an urban principal arterial under local (Town) jurisdiction within the study area. Main Street is an east-west roadway connecting Hartford Avenue (Routes 126) to the west with County Street (Route 109) to the east. The roadway generally provides a single travel lane in each direction with additional turn lanes provided at its major intersections. There are no sidewalks along Main Street in the study area. Within the study area, the posted (regulatory) speed limit along Summer Street ranges from 35 to 40 mph. Within the immediate study area, land uses along Main Street primarily include residential homes. 3755/West Medway II 10-6 Transportation Draft Environmental Impact Report Epsilon Associates, Inc.
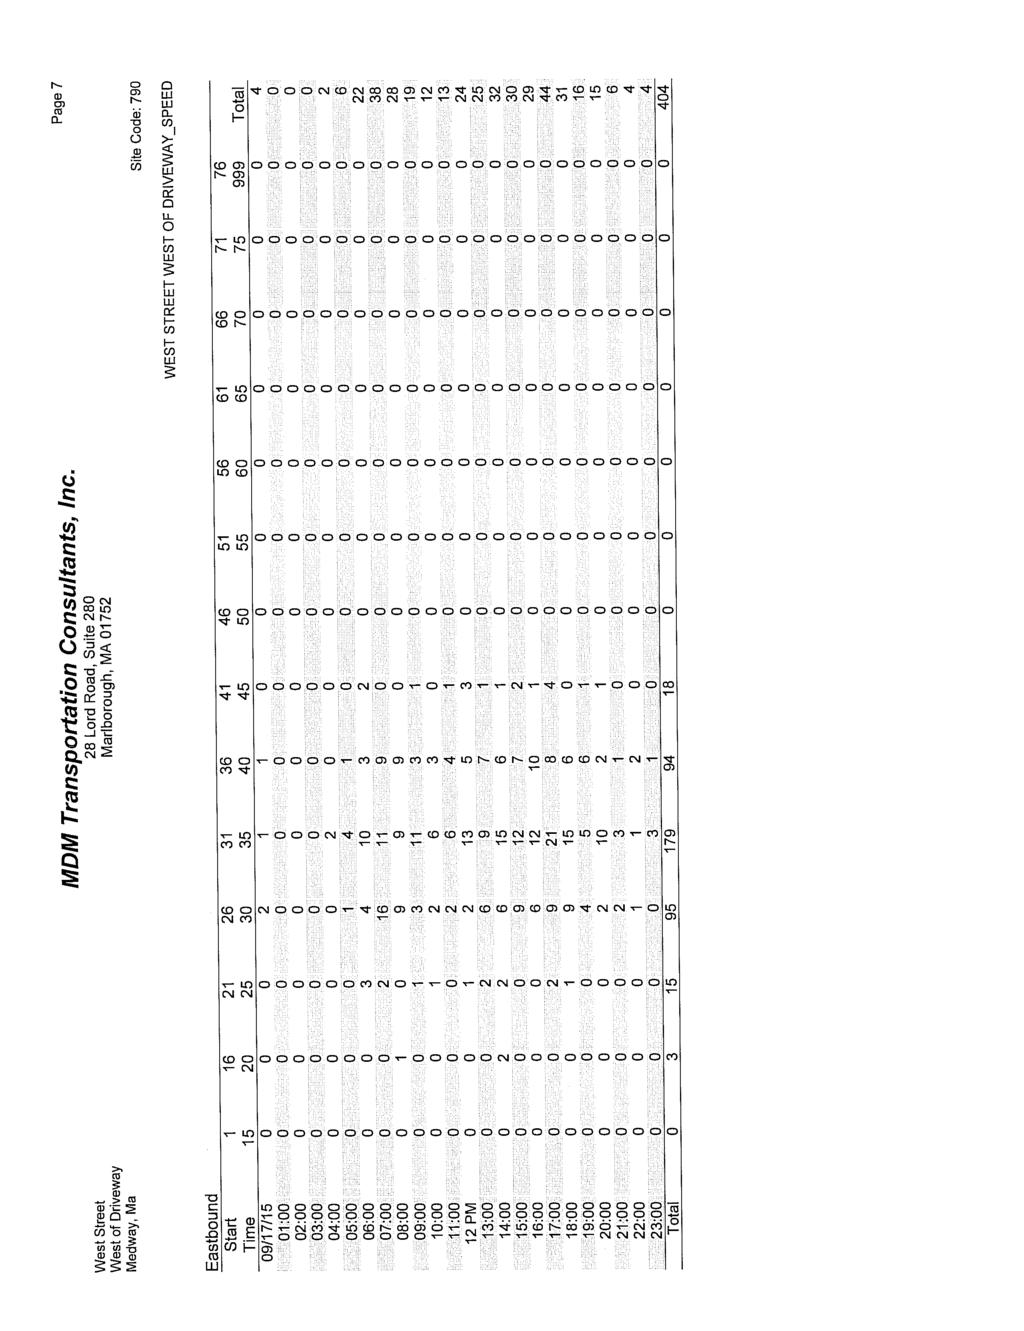
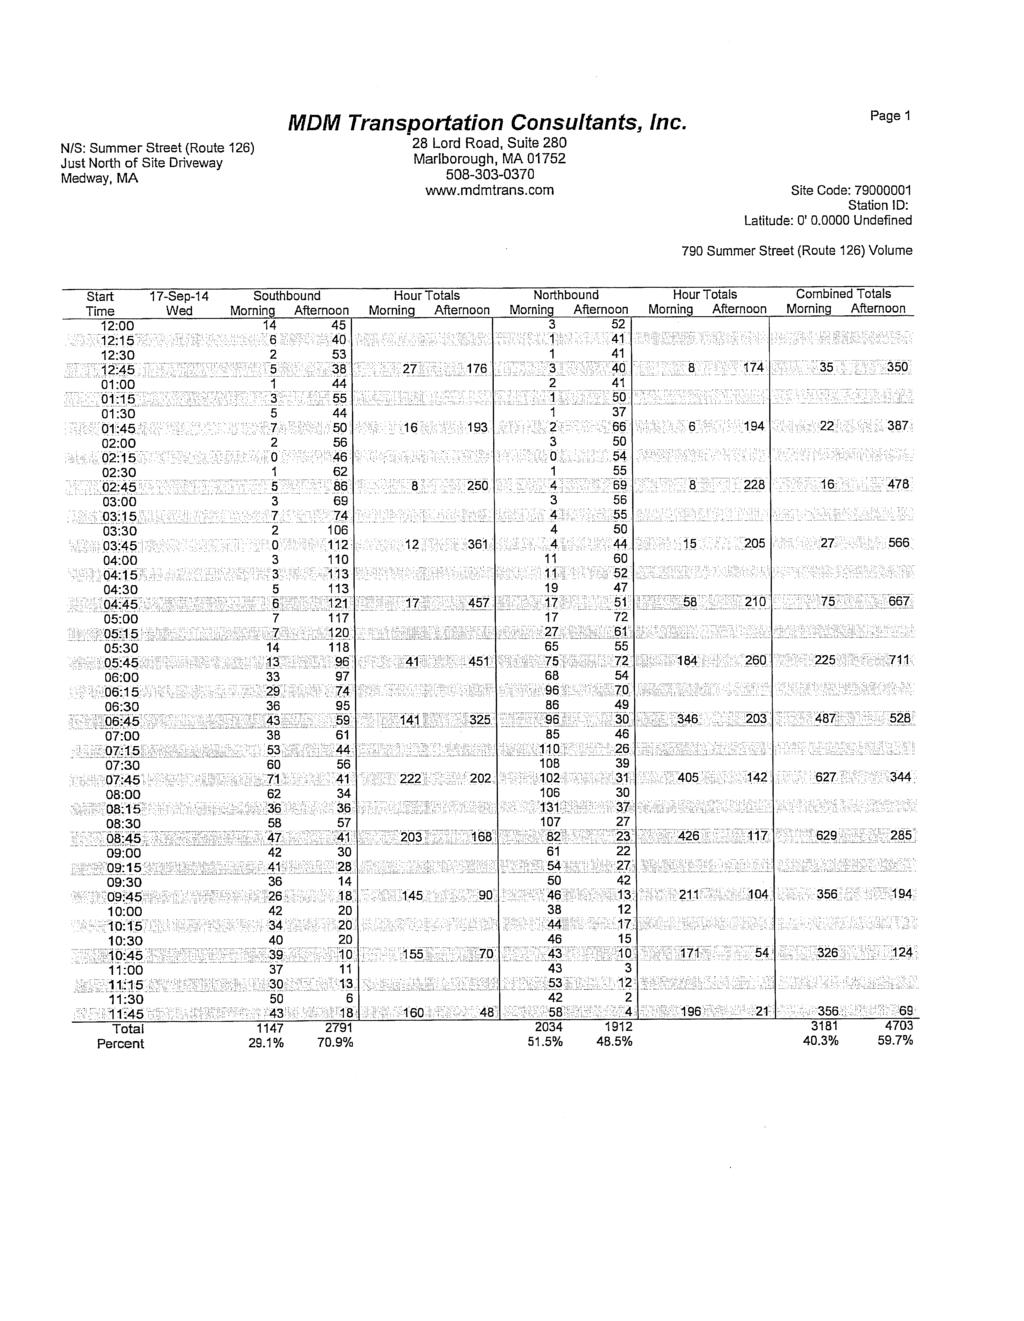
8 West Street West Street is classified by MassDOT as an urban minor arterial under local (Town) jurisdiction within the study area. West Street is a northwest-southeast roadway connecting Routes 109 to the northwest with Route 126) to the southeast. The roadway generally provides a single travel lane in each direction. Within the study area, the posted (regulatory) speed limit along West Street ranges from 25 to 30 mph. Within the immediate study area, land uses along West Street include residential homes and the existing Exelon station Traffic Volumes Baseline Traffic Volumes Peak of Adjacent Streets Traffic volume data were collected at the study area intersections during the weekday morning peak period (6:00 AM 9:00 AM) and the weekday evening peak period (3:00 PM-6:00 PM) to coincide with peak traffic activity of the site and adjacent streets. Traffic data used in the evaluation was collected in September 2014 and September 2015, which represents above-average traffic conditions, based on review of Massachusetts Department of Transportation ( MassDOT ) permanent count station data for the area. To provide a conservative analysis, no seasonal adjustment (i.e., reduction) of the data was made to the September traffic volume counts. The Baseline weekday morning and evening peak hour traffic volumes for the peak hours of the adjacent streets for the primary study intersections are shown in Figure 10-3 and Figure 10-4, respectively. Baseline Traffic Volumes Construction Periods Traffic volume data were collected at the supplemental study intersections during the weekday morning peak period (6:00 AM 7:00 AM) and the weekday evening peak period (3:00 PM - 4:00 PM) periods to coincide with peak traffic activity of the site s construction activity. Supplemental traffic data used in this evaluation was collected in January 2015, which represents below-average traffic conditions based on review of MassDOT permanent count station data for the area. In order to provide average-traffic conditions, a seasonal adjustment increase of 11% was made to the January traffic-volume counts. The Baseline traffic volumes for the construction arrival and departure periods (6:00 7:00 am and 3:00 4:00 pm) are shown in Figure 10-5 and Figure 10-6, respectively. Subsequent to the data collection, the anticipated construction workday has been shifted to be from 6:00 am to 6:00 pm. As demonstrated in Section , actual traffic volumes during the revised construction arrival and departure periods will therefore be considerably lower than shown in the following sections. 3755/West Medway II 10-7 Transportation Draft Environmental Impact Report Epsilon Associates, Inc.
9
10
11
12 Evening
13 Baseline Site Trip Generation Estimated trip generation for the existing Exelon use at the Property was determined based on turning movement counts conducted at the Site Driveway intersections with Summer Street in September As summarized in Table 10-1, the existing West Medway Station currently generates a nominal four vehicle trips (three entering and one exiting) during the weekday morning peak hour and four vehicle trips (one entering and three exiting) during the weekday evening peak hour. On weekdays, the existing West Medway Station is currently staffed by approximately twelve employees between 7:00 am and 3:00 pm and by two employees between 3:00 pm and 11:00 pm. Typical arrival times for the employees working between 7:00 a.m. and 3:00 p.m. would be between 6:00 a.m. and 7:00 a.m.; and typical departure times would be between 3:00 p.m. and 4:00 p.m. Typical arrival times for the employees working between 3:00 p.m. and 11:00 p.m. would be between 2:00 p.m. and 3:00 p.m.; and typical departure times would be between 11:00 p.m. and 12:00 a.m. All typical arrival and departure periods are therefore outside the adjacent roadways peak hours. Table 10-1 Baseline Trip Generation Exelon West Medway Station Baseline Trip Rate 2 Period/Direction Existing Site Trips 1 Per Employee Per Generator Weekday Morning Peak Hour (7:30 8:30 am): Entering Exiting Total Weekday Evening Peak Hour (4:30 5:30 pm): Entering Exiting Total Turning movement counts at the 9 Summer Street Site Driveway (inclusive of passenger cars and truck traffic) in September 2014; the existing Site includes 6-oil powered generating units and 14± total employees. 2 Observed Trips per employee and per generator unit Daily Traffic Volumes Daily traffic volumes were collected on Summer Street and West Street in the site vicinity using automatic traffic recorders ( ATR s ) in September 2014 and September 2015 and are summarized in Table /West Medway II Transportation Draft Environmental Impact Report Epsilon Associates, Inc.
14 Table 10-2 Baseline Traffic Volume Summary Time Period Daily Volume (vpd) 1 Percent Daily Traffic 2 Peak Hour Volume (vph) 3 Peak Flow Direction 4 Peak Hour Directional Volume (vph) Summer Street north of Main Street Weekday Morning Peak Hour 7,885 8% % SB 451 Weekday Evening Peak Hour 7,885 9% % NB 405 West Street between Route 126 and Beech Street Weekday Morning Peak Hour 880 9% 77 62% EB 48 Weekday Evening Peak Hour % 98 61% EB 60 1 Two-way daily traffic expressed in vehicles per day without seasonal adjustment. 2 The percent of daily traffic that occurs during the peak hour. 3 Two-way peak-hour volume expressed in vehicles per hour. 4 EB = Eastbound, WB = Westbound, NB = Northbound, and SB = Southbound As summarized in Table 10-2 above: Summer Street in the immediate study area carries approximately 7,885 vehicles per day ( vpd ) with approximately 630 vehicles and 710 vehicles during the morning and evening peak hours respectively. The peak hour traffic volumes represent approximately 8-9% of the daily traffic volumes. West Street in the immediate study area carries approximately 880 vehicles per day ( vpd ) with approximately 77 vehicles and 98 vehicles during the morning and evening peak hours respectively. The peak hour traffic volumes represent approximately 9-11% of the daily traffic volumes Measured Travel Speeds Vehicle speeds were obtained for Summer Street and West Street adjacent to the site using radar recorder devices. These measured travel speeds provide a basis for determining sight line requirements at the proposed site driveway along Summer Street and proposed Construction driveway along West Street. Table 10-3 Speed Study Results Speed Travel Speed Travel Direction Limit 1 Mean 2 85 th Percentile 3 Summer Street north of Main Street Northbound Southbound West Street between Route 126 and Beech Street Eastbound Westbound Regulatory (Posted) Speed limit in miles per hour (mph) 2 Arithmetic mean 3 The speed at or below which 85 % of the vehicles are traveling 3755/West Medway II Transportation Draft Environmental Impact Report Epsilon Associates, Inc.
15 As summarized in Table 10-3 above: Summer Street: The mean (average) travel speed on Summer Street was observed to be 40 mph for the northbound direction and 41 mph in the southbound direction; the 85th percentile travel speed was observed to be 44 mph for both the northbound and southbound directions. Measured travels speeds are generally highly consistent with the regulatory speed limits along Summer Street in the site vicinity. West Street: The mean (average) travel speed on West Street was observed to be 33 mph for the eastbound direction and 32 mph in the westbound direction; the 85th percentile travel speed was observed to be 38 mph in the eastbound direction and 35 mph in the southbound direction. Measured travels speeds are considerable higher than the regulatory speed limits along West Street in the site vicinity Intersection Crash History To identify crash trends and safety characteristics for primary study area intersections, crash data were obtained from MassDOT for the Town of Medway for the four-year period covering 2010 through 2013 (the most recent data currently available). A crash rate was calculated for the study intersections as shown in Table This rate quantifies the number of crashes per million entering vehicles. MassDOT has determined the average District 3 crash rate to be 0.66 for unsignalized intersections and 0.89 for signalized intersections. This rate represents MassDOT s average crash experience and serves as a basis for comparing reported crash rates for the study intersections. Table 10-4 Intersection Crash Summary 2010 Through INTERSECTION Data Category Milford Street at Summer Street Main Street at Summer Street Traffic Control Signalized Unsignalized Crash Rate MassDOT Dist. Avg Year: Total Type: Angle Rear-End Head-On Single-Vehicle Sideswipe /West Medway II Transportation Draft Environmental Impact Report Epsilon Associates, Inc.
16 Table 10-4 Intersection Crash Summary 2010 Through (Continued) Data Category Severity: P. Damage Only Personal Injury Fatality Conditions: Dry Wet Snow Time: 7:00 to 9:00 AM 4:00 to 6:00 PM Rest of Day 1 Source: MassDOT Crash Database. 2 MassDOT District 3 crash rates: = 0.66 unsignalized; 0.89 signalized INTERSECTION Milford Street at Summer Street Main Street at Summer Street As summarized in Table 10-4 above, Milford Street/Summer Street. Ten (10) crashes were reported for the Milford Street/ Summer Street signalized intersection approximately 2.5 per year resulting in a crash rate of The majority (70%) of reported crashes at the intersection included rear-end type collisions under dry roadway conditions. Four (4) crashes occurred during the peak periods. Main Street/Summer Street. Seven (7) crashes were reported for the Main Street/Summer Street unsignalized intersection approximately 2 per year resulting in a crash rate of 0.27 All of the reported crashes (100%) at the intersection included rear-end/ sideswipe type collisions with the majority (86%) occurring under dry roadway conditions resulting in property damage collisions. One (1) crash occurred during the morning peak period and one (1) crash occurred during the evening peak period. Summer Street at Site Driveway (#9). There were no crashes reported for the site driveway (9 Summer Street) intersection with Summer Street during the study period. In summary, based on extensive review of MassDOT crash data, the primary study intersections all experienced crash rates that are below the MassDOT District 3 averages. No additional safety countermeasures are warranted based on the review of the crash records and associated crash rates. 3755/West Medway II Transportation Draft Environmental Impact Report Epsilon Associates, Inc.
17 Sight Line Evaluations An evaluation of sight lines was conducted at the proposed site driveway location along Summer Street and proposed construction site driveway along West Street to ensure that minimum recommended sight lines are available to safely exit onto Summer Street and West Street. The evaluation documented existing sight lines for vehicles as they relate to Summer Street and West Street with comparison to recommended guidelines for the regulatory speed limit and observed travel speeds. The AASHTO standards 1 reference two types of sight distance which are relevant at the proposed site driveway intersection on Summer Street and the proposed construction driveway along West Street: stopping sight distance ( SSD ) and intersection sight distance ( ISD ). Sight lines for critical vehicle movements at the proposed site driveway intersection with Summer Street and at the proposed construction site driveway along West Street were compared to minimum SSD and ISD for the regulatory and observed travel speeds in the Site vicinity Stopping Sight Distance Sight distance is the length of roadway visible to the motorist to a fixed object. The minimum sight distance available on a roadway should be sufficiently long enough to enable a below-average operator, traveling at or near a regulatory speed limit, to stop safely before reaching a stationary object in its path, in this case, a vehicle exiting the site driveways onto Summer Street. The SSD criteria are defined by AASHTO based on design and operating speeds, anticipated driver behavior and vehicle performance, as well as physical roadway conditions. SSD includes the length of roadway traveled during the perception and reaction time of a driver to an object, and the distance traveled during brake application on wet level pavement. Adjustment factors are applied to account for roadway grades where applicable. SSD was estimated in the field using AASHTO standards for driver s eye (3.5 feet) and object height equivalent to the taillight height of a passenger car (2.0 feet) for the approaches to the intersections. Table 10-5 presents a summary of the available SSD for the roadway segment approaches to the proposed driveways and AASHTO s recommended SSD for the regulatory and observed travel speeds. 1 A policy on Geometric Design of Highways and Streets, American Association of State Highway and Transportation Officials (AASHTO), /West Medway II Transportation Draft Environmental Impact Report Epsilon Associates, Inc.
18 Table 10-5 Stopping Sight Distance Summary Approach/ Travel Direction Available Stopping Sight Distance Regulatory Speed 2 Summer Street Approaches to Proposed Site Driveway AASHTO Recommended 1 Average Travel Speed 3 85 th Percentile Travel Speed 4 Northbound Southbound 435± Feet >800 Feet 80 Feet Feet n/a 315 Feet n/a 350 Feet West Street Approaches to Proposed Construction Driveway Eastbound Westbound 430± Feet 530± Feet 155 Feet Feet 230 Feet 220 Feet 280 Feet 250 Feet 1 Recommended sight distance based on AASHTO, A Policy on Geometric Design of Highways and Streets. Based on driver height of eye of 3.5 feet to object height of 2.0 feet and adjustments for roadway grade were applicable. 2 Posted speed is 40 mph along Summer Street with NB speed based on 15 mile per hour travel speed for vehicles turning from Main Street. Posted speed along West Street is 25 mph. 3 Average Speed is 41 mph SB on Summer Street; 33 mph EB and 32 mph WB on West Street 4 85 th Percentile travel speed is 44 mph SB on Summer Street; 38 mph EB and 35 mph WB on West Street. As summarized in the above Table 10-5, analysis results indicate that the existing available sight lines exceed AASHTO s recommended SSD criteria for both travel directions along Summer Street and West Street based on the regulatory speed limit and observed travel speeds Intersection Sight Distance Clear sight lines provide sufficient sight distance for a stopped driver on a minor-road approach to depart from the intersection and enter or cross the major road. As stated under AASHTO s Intersection Sight Distance (ISD) considerations, If the available sight distance for an entering vehicle is at least equal to the appropriate stopping sight distance for the major road, then drivers have sufficient sight distance to avoid collisions To enhance traffic operations, intersection sight distances that exceed stopping sight distances are desirable along the major road. AASHTO s ISD criteria are defined into several cases. In this case the intersections are proposed to be under STOP signal control and the ISD in question relates to the ability turn left or turn right from the proposed driveways. Available ISD was estimated in the field using AASHTO standards for driver s eye (3.5 feet), object height (3.5 feet) and decision point (between 8 and 14.5 feet from the edge of travel way) for the northbound and southbound directions along Summer Street and eastbound and westbound directions along West Street. Table 10-6 presents a summary of the available ISD for the departure from the site driveways and AASHTO s recommended ISD for the regulatory speed limit and observed travel speeds. 3755/West Medway II Transportation Draft Environmental Impact Report Epsilon Associates, Inc.
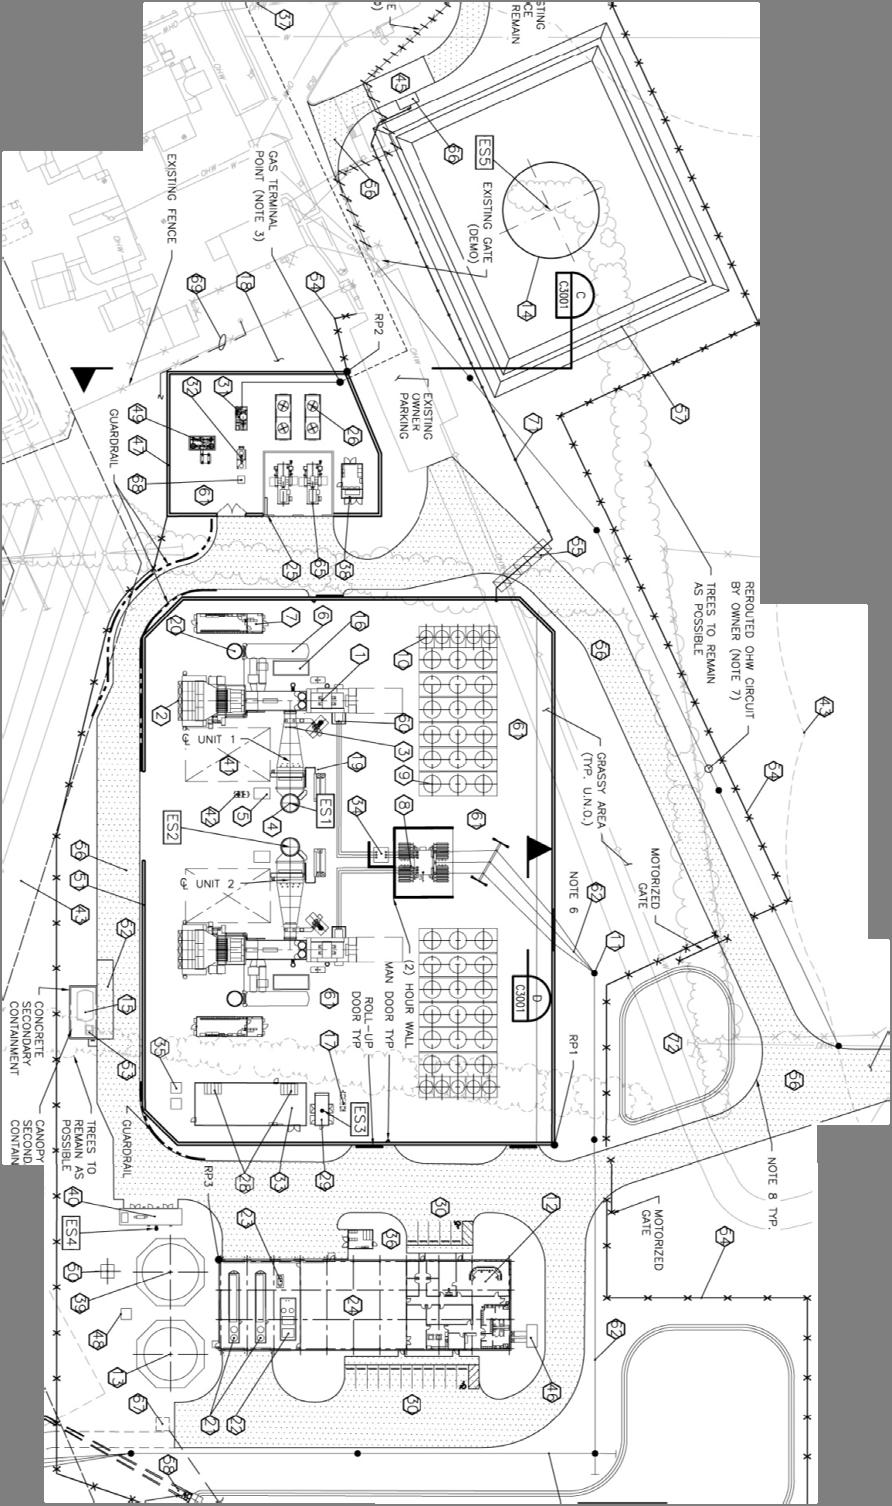
19 Table 10-6 Intersection Sight Distance Summary AASHTO Minimum 1 AASHTO Ideal 1 Approach/ Travel Direction Available SSD Regulatory Speed 2 85 th Percentile Observed Speed 3 Regulatory Speed 2 Summer Street Approaches to Proposed Site Driveway Looking North Looking South >800 Feet 435± Feet 305 Feet 80 Feet 350 Feet n/a Feet 385 Feet 165 Feet West Street Approaches to Proposed Construction Driveway Looking East Looking West 430± Feet 530± Feet 155 Feet 155 Feet 250 Feet 280 Feet 240 Feet 280 Feet 1 Recommended sight distance based on AASHTO, A Policy on Geometric Design of Highways and Streets. Based on driver height of eye of 3.5 feet and an object height of 3.5 feet and adjustments for roadway grade if required. Minimum value as noted represents SSD per AASHTO guidance. 2 Posted speed is 40 mph along Summer Street with NB speed based on 15 mile per hour travel speed for vehicles turning from Main Street. Posted speed along West Street is 25 mph. 3 Average Speed is 41 mph SB on Summer Street; 33 mph EB and 32 mph WB on West Street 4 85 th Percentile travel speed is 44 mph SB on Summer Street; 38 mph EB and 35 mph WB on West Street. The results of the ISD analysis presented in Table 10-6 indicate that the available sight lines looking north and south from the site driveway onto Summer Street and looking east and west onto West Street exceed the recommended minimum and ideal sight line requirements from AASHTO for the regulatory speed limit and observed travel speeds. MDM recommends that the sight line continue to be maintained and that any new plantings (shrubs, bushes) or physical landscape features to be located within the driveway sight lines should also be maintained at a height of 2 feet or less above the adjacent existing roadway grade to ensure unobstructed lines of sight Construction Conditions The construction period will generate construction traffic, which will include both construction truck and construction employee traffic. The following is a summary of the expected impacts of construction traffic and measures to be used to reduce and potential negative impacts during the construction period. During construction, the parking area for workers will be in an existing material lay-downlot in the southern portion of the Site along West Street as shown in Figure This preferred parking area which is primarily grass will be re-enforced with gravel, stone, or similar material during the construction period to facilitate construction employee parking. Upon completion of the construction, the material lay-down-lot will be restored with loam and seed. No additional improvements are needed for any of the construction entrances. This is the preferred parking access area compared to the Summer Street entrance, for the following reasons: 3755/West Medway II Transportation Draft Environmental Impact Report Epsilon Associates, Inc.
20
21 The traffic volumes along this section of West Street are less than 75 vehicles per hour (vph) during the arrival and departure periods. In contrast the traffic volumes along Summer Street range from 550 to 649 vph during the construction worker arrival and departure periods. The construction driveway is proposed to be along a straight section of West Street approximately half way between Route 126 and Beech Street. The sight lines are adequate and the traffic volumes on this section of West Street during the construction arrival and departure times are nominal (less than 75 vehicles per hour). Trips to/from I-495 would travel fewer miles to the West Street entrance than to the Summer Street entrance (although noting that the travel miles should have a nominal impact to safety.) It is anticipated that the entrances into the property would be required to be manned during construction independent of construction parking location. As outlined in the traffic study, incremental traffic increases at the study intersections during the construction period will be adequately accommodated below-capacity with LOS D or better operations expected (the traffic study conservatively assumed 200 vehicles for 200 workers working in a single shift with an arrival period between 6:00 7:00 am, and a departure period between 3:00 4:00 pm). Subsequent to the data collection, the anticipated construction workday has been shifted to be from 6:00 am to 6:00 pm. As demonstrated in Section , actual traffic volumes during the revised construction arrival and departure periods will therefore be considerably lower than analyzed by the traffic study. The peak construction activity is approximately 200 union workers, therefore, onsite parking along West Street will satisfy the peak construction worker demand. The preferred parking area is also proximate to an on-site pedestrian walkway connection to the proposed construction areas. The West Street parking area currently includes primarily grass areas with access/egress directly onto West Street via the existing gated entranceway which is located approximately 300 feet east of Beech Street. Exelon has met with the Town of Medway for preliminary discussions on a detailed Construction Traffic Management Plan which will address parking during construction. It is expected that the construction workers would utilize the West Street parking areas while construction deliveries would use the Summer Street entrance. No improvements are needed for the Summer Street entrance or West Street construction entrances. Beyond measures in a Construction Management Plan, no project related traffic mitigation is warranted for the day care center driveways along Summer Street due to the Project. Exelon will also actively manage construction deliveries and oil deliveries in accordance with the Construction Traffic Management Plan. 3755/West Medway II Transportation Draft Environmental Impact Report Epsilon Associates, Inc.
22 Construction will primarily be limited to on-site activity with limited activity on adjacent roadways. The existing West Medway driveway onto Summer Street is proposed to be utilized by the Project and thus construction activity on Summer Street is anticipated to be limited. Activity on Summer Street may include the construction near the site driveway and necessary utility work. It is anticipated that traffic patterns on Summer Street will be maintained during construction and that no roadway closures or detours will be required during the construction period. Exelon will establish waiting and staging areas on-site for all material deliveries and the management of truck traffic. An analysis of construction period impacts on area roadways is provided below No-Build Traffic Volume Networks Construction Periods To account for future traffic growth in the study area future, No-Build traffic volumes are developed by increasing the Baseline construction traffic volumes by approximately 3.6% (0.5% compounded annually over seven years). The resulting 2021 No-Build construction traffic volumes are provided in the Figure 10-8 and Figure 10-9 for morning and evening peak traffic volume, respectively Trip Generation Peak Construction Anticipated construction activity at the site will generate a peak of approximately 200 workers with significantly lower activity during the beginning and end of the construction period. The amount of crews and workers will vary based on the specific construction work activities, but will range up to approximately 20 to 25 crews working on site with approximately 8 to 10 workers per crew. To present a conservative (worst case) scenario, trip generation for the Project s construction impact is estimated based on a peak construction scenario and a vehicle occupancy rate of 1.0. Table 10-7 summarizes the empirically derived trip estimates for the power generation station under a peak construction scenario of 200 workers. Results indicate that under a peak construction activity scenario, the Project is conservatively estimated to generate approximately 200 entering vehicle-trips during the weekday morning period (6:00 AM to 7:00 AM) and 200 exiting vehicle-trips during the weekday evening period (3:00 PM to 4:00 PM). These trips levels do not account for carpooling which may reduce actual vehicle demands at peak construction. Furthermore, subsequent to the data collection, the anticipated construction workday has been shifted to be from 6:00 am to 6:00 pm. As demonstrated in Section , actual traffic volumes during the weekday morning and evening periods will therefore be considerably lower than shown in Table /West Medway II Transportation Draft Environmental Impact Report Epsilon Associates, Inc.
23
24
25 Table 10-7 Trip Generation Summary, Peak Construction Operations Study Period/Direction Morning Study Period (6:00 to 7:00 am): Entering Exiting Total Peak Construction Vehicle-trips Negl. 200 Evening Study Period (5:00 to 6:00 pm): Entering Exiting Total Based on 200 construction workers with vehicle occupancy of 1.0 workers per vehicle. Analysis conservatively assumes that all workers arrive between 6:00 and 7:00 and depart between 3:00 and 4:00 pm. Since the anticipated construction workday has been shifted to be from 6:00 am to 6:00 pm, actual traffic volumes during the study periods will be considerably lower than shown Trip Distribution Construction Periods Primary routes to/from the site associated with construction employee related trips are will use I-495, Route 109, and Route 126. The distribution for projected traffic for the construction employees is based on Journey to Work Census data. The resulting trip distribution pattern is shown in Figure with calculations presented in the Attachment G. It is estimated that approximately 65% of the construction worker trips will use Route I An aerial view of the Site and vicinity depicting construction employee and oil delivery routes from Route I-495 are summarized in Figure Development-related trips for the proposed Site are assigned to the roadway network using the ITE trip-generation estimates previously shown in Table 10-7 and the distribution pattern for the construction employees. Development-related trips at each intersection approach for the weekday morning, and weekday evening construction periods are quantified in the Figure and Figure Build Traffic Volume Networks Construction Periods 2021 Build construction period traffic volumes are derived by adding the incremental traffic increases for the Site s construction activity to the 2021 No-Build construction period traffic volumes. The 2021 Build construction period traffic-volume networks for the weekday morning and weekday evening construction periods are shown in Figure and Figure Capacity Analysis Construction Periods Negl. 200 This section provides an overview of operational analysis methodology, an assessment of intersection operations under Baseline and projected future No-Build and Build conditions for the construction periods. 3755/West Medway II Transportation Draft Environmental Impact Report Epsilon Associates, Inc.
26
27
28
29
30
31
32 Analysis Methodology Intersection capacity analyses are presented in this section for the Baseline, No-Build, and Build traffic-volume conditions for the construction arrival and departure periods. Capacity analyses, conducted in accordance with EEA/MassDOT guidelines, provide an index of how well the roadway facilities serve the traffic demands placed upon them. The operational results provide the basis for recommended access and roadway improvements in the following section. Capacity analysis of intersections is developed using the Synchro computer software, which implements the methods of the 2010 Highway Capacity Manual (HCM). The resulting analysis presents a LOS designation for individual intersection movements. The LOS is a letter designation that provides a qualitative measure of operating conditions based on several factors including roadway geometry, speeds, ambient traffic volumes, traffic controls, and driver characteristics. Since the LOS of a traffic facility is a function of the traffic flows placed upon it, such a facility may operate at a wide range of LOS, depending on the time of day, day of week, or period of year. A range of six levels of service are defined on the basis of average delay, ranging from LOS A (the least delay) to LOS F (delays greater than 50 seconds for unsignalized movements and delays greater than 80 seconds for signalized movements) Analysis Results Construction Periods LOS analyses were conducted for the Baseline, No-Build, and Build (Construction Period) conditions for the study intersections. The capacity analysis provided for the construction period has been calibrated based on observed vehicle delay characteristics for the unsignalized study intersections. The results of the intersection capacity for the construction period are summarized below for weekday morning and evening peak hours in Tables 10-8 and Table 10-9, respectively. Table 10-8 Intersection Capacity Analysis Results Construction Period Weekday Morning Peak Hour 2014 Baseline 2021 No-Build 2021 Build Period Approach v/c 1 Delay 2 LOS 3 v/c Delay LOS v/c Delay LOS Summer Street at Milford Street Eastbound Westbound Northbound Southbound Overall A C C C C A C C C C A C C C C Summer Street at Exelon Dwy Northbound EB L/R Exit <5 <5 A A <5 <5 A A <5 <5 A A Main Street at Summer Street Eastbound SB L Exit SB R Exit < A B A < A B A < A B A 3755/West Medway II Transportation Draft Environmental Impact Report Epsilon Associates, Inc.
33 Table 10-8 Intersection Capacity Analysis Results Construction Period (Continued) Weekday Morning Peak Hour 2014 Baseline 2021 No-Build 2021 Build Period Approach v/c 1 Delay 2 LOS 3 v/c Delay LOS v/c Delay LOS Route 126 at West Street Eastbound SB L/R Exit <5 15 A C <5 16 A C <5 16 A C Route 109 at West Street Westbound NB L Exit NB R Exit < A B A < A B A < A B A West Street at Proposed Construction Driveway Eastbound SB l/r Exit n/a 4 n/a n/a n/a n/a n/a n/a n/a n/a n/a n/a n/a <5 A A 1 Volume-to-capacity ratio 2 Average control delay per vehicle (in seconds) 3 Level of service 4 Not applicable Table 10-9 Intersection Capacity Analysis Results Construction Period Weekday Evening Peak Hour 2014 Baseline 2021 No-Build 2021 Build Period Approach v/c 1 Delay 2 LOS 3 v/c Delay LOS v/c Delay LOS Summer Street at Milford Street Eastbound Westbound Northbound Southbound Overall B C B C C B C B C C B C C C C Summer Street at Exelon Dwy Northbound EB L/R Exit <5 13 A B <5 13 A B <5 13 A B Main Street at Summer Street Eastbound SB L Exit SB R Exit < A C B < A C B < A C B Route 126 at West Street Eastbound SB L/R Exit <5 20 A C <5 21 A C <5 29 A D Route 109 at West Street Westbound NB L Exit NB R Exit < A B A < A B A < A C A West Street at Proposed Construction Driveway Eastbound SB l/r Exit n/a 4 n/a n/a n/a n/a n/a n/a n/a n/a n/a n/a n/a <5 10 A A 1 Volume-to-capacity ratio 2 Average control delay per vehicle (in seconds) 3 Level of service 4 Not applicable 3755/West Medway II Transportation Draft Environmental Impact Report Epsilon Associates, Inc.
34 As summarized in Table 10-8 and Table 10-9: Summer Street at Milford Street. The signalized Summer Street at Milford Street intersection will continue to operate below capacity at overall LOS C or better operations the peak construction period. Summer Street at Exelon Driveway. Under peak construction conditions, the Exelon Driveway approach to Summer Street will operate at LOS B or better operations. Mainline operations Summer Street are expected to continue to operate well below capacity at LOS A operations with minimal delay. Unsignalized approaches to Routes 126 and 109. Under peak construction conditions, left turns from unsignalized side streets onto Route 126 and Route 109 will continue to operate at LOS D or better operations. West Street at Proposed Construction Driveway. The proposed Construction driveway along West Street will operate well below capacity with nominal delay during the peak construction periods. In summary, incremental traffic increases at the study intersections during the construction period will be adequately accommodated below-capacity with LOS D or better operations expected Construction Period Shift Further Off-Peak Subsequent to the data collection, the anticipated construction workday has been shifted to be from 6:00 am to 6:00 pm with construction access being via West Street. To reflect the conservative nature of the capacity results provided in the study, Table and Table summarize the traffic volume differences along Summer Street and West Street for the construction worker arrival period between 5:00 6:00 AM and departure period between 6:00 7:00 PM compared the time periods assumed in this traffic report. Table Traffic Volume Comparison Summer Street north of Site Driveway Time Period Wednesday 1 Thursday 2 Average 3 Morning Construction Arrival Period 5:00-6:00 AM :00-7:00 AM Difference (-54%) -219 (-50%) -241 (-52%) 3755/West Medway II Transportation Draft Environmental Impact Report Epsilon Associates, Inc.
35 Table Traffic Volume Comparison Summer Street north of Site Driveway (Continued) Time Period Wednesday 1 Thursday 2 Average 3 Evening Construction Departure Period 3:00-4:00 PM :00-7:00 PM Difference 5-32 (-6%) -78 (-13%) -54 (-9%) 1 Collected on September 17, 2014 Collected on September 18, 2014 Average volume during time period 4 Volume Difference from 5:00-6:00 AM to 6:00-7:00 AM (as shown in the traffic report) 5 Volume Difference from 6:00-7:00 PM to 3:00-4:00 PM (as shown in the traffic report) Table Traffic Volume Comparison West Street west of Site Driveway Time Period Thursday 1 Tuesday 2 Average 3 Morning Construction Arrival Period 5:00-6:00 AM :00-7:00 AM Difference 4-23 (-72%) -15 (-54%) -19 (-63%) Evening Construction Departure Period 3:00-4:00 PM :00-7:00 PM Difference 5-1 (-2%) -17 (-35%) -9 (-16%) 1 Collected on September 17, Collected on September 22, Average volume during time period 4 Volume Difference from 5:00-6:00 AM to 6:00-7:00 AM 5 Volume Difference from 6:00-7:00 PM to 3:00-4:00 PM As summarized in Table and Table above, Summer Street The traffic volumes in the area are approximately 52% lower during the 5:00 6:00 AM period compared to the 6:00 7:00 AM period shown in the traffic report. The traffic volumes in the area are approximately 9% lower during the 6:00 7:00 PM period compared to the 3:00 4:00 PM period shown in the traffic report. 3755/West Medway II Transportation Draft Environmental Impact Report Epsilon Associates, Inc.
36 West Street The traffic volumes in the area are approximately 63% lower during the 5:00 6:00 AM period compared to the 6:00 7:00 AM period shown in the traffic report. The traffic volumes in the area are approximately 16% lower during the 6:00 7:00 PM period compared to the 3:00 4:00 PM period shown in the traffic report. In summary, traffic volumes during the revised construction arrival and departure periods are considerably lower than analyzed as part of this report. Therefore, the capacity analysis result for the construction period which indicated that incremental traffic increases at the study intersections during the construction period will be adequately accommodated below-capacity with LOS D or better operations expected is conservative and no supplemental analysis is required Future Conditions The traffic study included the establishment of a future baseline analysis condition to estimate future roadway and traffic conditions with and without the Project. For this evaluation, a seven-year planning horizon (year 2021) was selected consistent with industry standard guidelines. (In practice, a 2016/2017 planning period is anticipated and would result in improved conditions compared to the analysis shown.) To determine the impact of site-generated traffic volumes on the roadway network under future conditions, baseline traffic volumes in the study area were projected to a future year condition. Traffic volumes on the roadway network at that time, in the absence of the development (that is, the No-Build condition), includes existing (baseline) traffic, new traffic due to general background traffic growth, and traffic related to specific developments by others that are currently under review at the local and/or state level. Consideration of these ``factors resulted in the development of No-Build traffic volumes. Anticipated sitegenerated traffic volumes were then superimposed upon these No-Build traffic-flow networks to develop future Build conditions. The traffic study s findings for future No-Build traffic volumes and projected Build traffic volumes are provided below Background Growth Background traffic includes demand generated by other planned developments in the area as well as demand increases caused by external factors. External factors are general increases in traffic not attributable to a specific development and are determined using historical data. 3755/West Medway II Transportation Draft Environmental Impact Report Epsilon Associates, Inc.
37 Nearby permanent count station data published by MassDOT indicates a negative average growth rate. For purposes of this planning evaluation, a 0.5 percent growth rate was used (3.6 percent increase over a 7-year horizon). This growth rate is slightly higher than historic rates, and as such is also expected to account for any small fluctuation in hourly traffic as may occur from time to time in the study area. MassDOT permanent count station data and background growth calculations are provided in the Attachment G. Additionally, the peak use of the Exelon Project under a worst-case peak operating scenario, which has never occurred at the existing station, over a 24 hour period may increase traffic at the study intersection compared to baseline conditions. For planning purposes the traffic study assumed the following: Maximum fuel firing rate for 135 MW generated over a 24-hour weekday period; Maximum oil consumption for existing units is 17,000 gallons per hour; Replenishment of on-site fuel oil storage up to 408,000 gallons per day; 2 inbound and 2 outbound fuel oil delivery truck trips per hour; Oil delivery loads of 9,000 gallon loads per truck; Maximum fuel dispensing rate of approximately 45 minutes/truck; 2 existing fuel dispensing stations; and 12 existing full-time employees (no change) No-Build Traffic Volume Networks In summary, to account for future traffic growth in the study area future No-Build traffic volumes are developed by increasing the baseline (2014) volumes by approximately 3.6 percent (0.5 percent compounded annually over 7 years) as well as the addition of 2 inbound and 2 outbound fuel oil delivery trucks from the existing station as described above. The resulting 2021 No-Build traffic volumes are displayed in Figure and Figure Trip Generation Traffic generated by the proposed Project will be comprised of employee-related trips, truck trips associated with replenishment of oil, and service-vehicle related trips. Daily and hourly trip generation will vary from day to day based on the supplemental power generation needs of the area. To present a conservative (worst case) scenario, trip generation for the Project is estimated based on a peak operating scenario and full employment at the site. With regard to employee parking, the area designated as existing owner parking (currently used by employees and visitors of the existing station) will continue to be parking for the existing station workers and visitors. Employees and visitors of the proposed Project will use the new spaces designated on-site with access/egress via the Summer Street driveway. 3755/West Medway II Transportation Draft Environmental Impact Report Epsilon Associates, Inc.
38
39
40 Empirical Trip Generation Exelon currently anticipates that 4 of the new employees would work from 7:00 a.m. to 3:00 p.m. and 2 would work the 3:00 p.m. to 11:00 p.m. shift. It is possible that after construction of the proposed Project, the Project Site could be manned 24 hours per day in which case there would be two employees on an 11:00 p.m. to 7:00 a.m. shift. Due to the rather limited number of on-site employees, off-peak shift times and weekdayonly operating periods for the Project indicate that daily and peak-hour trip generation for the Project will be nominal under typical operating conditions. However, potential trip activity is estimated under a worst-case operational scenario, which assumes the following conditions: Maximum fuel firing rate for 200 MW generated over a 24-hour weekday period; Maximum oil consumption for two units is 15,200 gallons per hour; Replenishment of on-site fuel oil storage up to 364,800 gallons per day; 2 inbound and 2 outbound fuel oil delivery truck trips per hour; Oil delivery loads of 9,000 gallon loads per truck; On-site oil storage capacity of 1,000,000 gallons; One wastewater truck per day (Actual estimate is 1± truck per week); Several service vehicle (vans) trips per week; One (1) ammonia truck per week with 8,000 gallons delivered per truck (Actual estimate is 1-2 per month); Maximum fuel dispensing rate of approximately 45 minutes/truck; 1 new fuel dispensing stations + 2 existing fuel dispensing stations; and 6 new full-time employees. Table summarizes the empirically-derived trip estimates for the proposed Project under a peak operating scenario. As summarized therein, under the peak operating scenario, the proposed Project is estimated to generate approximately 98 total daily vehicletrips, with the majority (86 trips) associated with delivery trucks (fuel oil and service trucks). Peak hour trip generation is estimated at seven vehicle-trips during a weekday morning peak hour and seven vehicle-trips during a weekday evening peak hour. For planning purposes, the expected duration of the peak operating scenario is 24 hours per day and up 3755/West Medway II Transportation Draft Environmental Impact Report Epsilon Associates, Inc.
41 to 30 days per year. Peak hour trip generation by the proposed Project is estimated at 5 vehicle-trips during a weekday morning peak hour and 5 vehicle-trips during a weekday evening peak hour. Table Trip Generation Summary, Peak Site Operations Peak Operation Vehicle-trips 1 Peak Hour/Direction Trucks 2 Employees 3 Total Morning Peak Hour: Entering Exiting Total Evening Peak Hour: Entering Exiting Total Weekday Daily Assumes peak facility power generation scenario for the Proposed Project; trips associated with full employment and associated fuel replenishment to achieve peak facility power output over a 24-hour weekday period. 2 Assumes a maximum fuel consumption per hour and replacement evenly distributed over a 22 hour period and service trucks. 3 Based on empirical trip rates for the Site per employee for 6 additional employees. The peak operating scenario differs from the average expected operational scenario in which the proposed Project would utilize natural gas which is proposed to be piped into the Project, thus resulting in no demand for oil deliveries via trucks. The trips generated by the Project (existing and proposed) under an average operational scenario would primarily be from employees consisting of approximately 40 trips per day which is nominal. Note: Under a worst case operational scenario with both the existing and proposed facilities experiencing peak operating conditions, the Site would generate 7.3 truck trips per hour (3.6 entering and 3.6 exiting trips) and approximately truck trips per day (approximately 87.6 entering and 87.6 exiting). This anticipates that six trucks per hour would be delivering fuel to both the existing station and the Proposed Project. This theoretical worst case operating scenario assumes that both the existing station and the proposed Project will be operating simultaneously at 100% burn rate on all units exclusively using oil as fuel. However, these conditions have never previously been observed at the existing Summer Street site. Furthermore, even under this worst case operating scenario (existing station and Proposed Project), the impact of the proposed Project will be nominal with respect to traffic operations. The worst case scenario of 176 trucks per day would result in 8 truck trips per 3755/West Medway II Transportation Draft Environmental Impact Report Epsilon Associates, Inc.
42 hour generated by the site (4 entering and 4 exiting trips) assuming a 22-hour delivery period (excludes deliveries during the weekday morning and weekday evening peak hour as recommended by the Town). The resulting truck trips would be approximately 1 directional trip every 15 minutes under worst case operations for both the existing station and Proposed Project simultaneously which would have a nominal impact to traffic operations. Although the traffic study has determined that there would be nominal impact due to the proposed project during the roadway peak hours, Exelon is further prepared to limit deliveries to periods outside of the peak hours if recommended by the Town Trip Distribution Primary routes to/from the site associated with employee and truck-related trips are presented below. Site Access Routes Employee-related trips to/from the site will use I-495, Route 109, and Route 126 consistent with existing employment at the Site by Exelon. According to the Proponent truck trips associated with replenishment of fuel supplies (oil) at the site will originate from Providence, RI. As a result, trucks destined to/from the Project will solely use Route I-495 to/ from the south and Route 126 to/from the west. These roadways are well established commercial truck routes, and provide the most direct and efficient means of travel to the Site. The distribution for projected traffic for the employees of the proposed Project is based on existing travel patterns and volumes of the adjacent roadway system. The distribution of project truck traffic for the proposed Project was based on the nearby highway system and discussions with the project proponent. The resulting trip distribution is presented in Figure 10-18, with employee percentages shown in blue and truck percentages shown in green. Development-related trips for the proposed Site are assigned to the roadway network using the ITE trip-generation estimates shown in Table and the distribution patterns presented in Figure Development-related trips at each intersection approach for the weekday morning and weekday evening peak hours are quantified in Figure and Figure 10-20, respectively Build Traffic Volume Networks 2021 Build condition traffic volumes are derived by adding the incremental traffic increases for the Site to the 2021 No-Build conditions. Figure and Figure present the 2021 Build condition traffic-volume networks for the weekday morning and weekday evening peak hours. 3755/West Medway II Transportation Draft Environmental Impact Report Epsilon Associates, Inc.
43
44
45
46
47
48 Capacity Analysis Results LOS analyses were conducted for the Baseline, No-Build, and Build conditions for the study intersections. The results of the intersection capacity are summarized below in Table and Table Table Intersection Capacity Analysis Results, Weekday Morning Peak Hour 2014 Baseline 2021 No Build 2021 Build Period Approach v/c 1 Delay 2 LOS 3 v/c Delay LOS v/c Delay LOS Summer Street at Milford Street Eastbound Westbound Northbound Southbound Overall B C D D C B C D D C B C D D C Summer Street at Exelon Dwy Northbound EB L/R Exit <5 11 A B <5 11 A B <5 11 A B Main Street at Summer Street Eastbound L SB L Exit SB R Exit 1 Volume-to-capacity ratio 2 Average control delay per vehicle (in seconds) >50 12 A F B > A F B >50 12 A F B 3 Level of service Table Intersection Capacity Analysis Results, Weekend Evening Peak Hour 2014 Baseline 2021 No Build 2021 Build Period Approach v/c 1 Delay 2 LOS 3 v/c Delay LOS v/c Delay LOS Summer Street at Milford Street Eastbound Westbound Northbound Southbound Overall B C C D C B C C D C B C C D C Summer Street at Exelon Dwy Northbound EB L/R Exit <5 11 A B <5 11 A B <5 13 A B Main Street at Summer Street Eastbound L SB L Exit SB R Exit 1 Volume-to-capacity ratio 2 Average control delay per vehicle (in seconds) A E E > A F E >50 47 A F E 3 Level of service As summarized in the above Table and Table 10-14: Summer Street at Milford Street: The signalized Summer Street at Milford Street intersection will operate below capacity at overall LOS C or better operations under future No-Build conditions during the weekday morning and weekday evening peak 3755/West Medway II Transportation Draft Environmental Impact Report Epsilon Associates, Inc.
49 hours. Under future Build conditions, the intersection will continue to operate at overall LOS C or better operations during the peak hours with only negligible increases in delay compared to No-Build conditions. Summer Street at Exelon Driveway: Under Build conditions, the Medway Station Driveway approach to Summer Street will operate at LOS B or better operations during the peak hours. Mainline operations Summer Street are expected to continue to operate well below capacity at LOS A operations with minimal delay. Main Street at Summer Street: Under existing and No-Build conditions, left turns from Summer Street onto Main Street operate with long delays during the peak hours. However, these calculated delays overestimate actual measured delays which are documented below to be 20 seconds or less (see Section for further details). Right turn movements from Summer Street onto Main Street operate with only minor delays during the weekday morning peak hour and with long delays during the weekday evening peak hour. Under Build conditions, the Summer Street approach to Main Street will operate with only minor increases in delay compared to No-Build conditions. In summary, incremental traffic increases at the study intersections due to the proposed development result in inconsequential changes in intersection operations compared to No- Build conditions. Therefore, no additional roadway improvements are warranted to accommodate the project Delay Study A Stop Sign Delay study was conducted for the Summer Street approach to Main Street to determine the actual average delay for vehicles turning left and right from Summer Street onto Main Street. The delay study specifically measured average stopped delay for Summer Street vehicles approaching for turns onto the Main Street traffic stream. A comparison of the actual average vehicle delay observed in the field to the calculated delay results provided by HCM methodology is shown in Table below. 3755/West Medway II Transportation Draft Environmental Impact Report Epsilon Associates, Inc.
50 Table Average Vehicle Delay Comparison Main Street at Summer Street Baseline Conditions Calculated Results 1 Observed Results 2 Time Period/Approach Average Vehicle Delay (seconds) Maximum Vehicle Queue (vehicles) LOS Average Vehicle Delay (seconds) Maximum Vehicle Queue (vehicles) Weekday Morning Peak Hour (7:00 8:00 am) Summer Street L Exit 67 1 F 12 2 Summer Street R Exit 12 1 B 5 8 Weekday Evening Peak Hour (4:45 5:45 pm) Summer Street L Exit 49 Summer Street R Exit 38 1 Based on Highway Capacity Manual methodology. Based on field data collected on January 6, E E LOS B A C A As summarized in Table 10-15, a comparison of the actual average vehicle delay observed in the field to the calculated delay results provided by HCM methodology reveals that the HCM methodology produces an overly conservative delay analysis for the conditions on Summer Street. Specifically, calculated average delays suggest that the Summer Street approach to Main Street currently operate with average delays ranging from 49 to 67 seconds for left turn movements and 12 to 38 seconds for right turn movements during the weekday morning and evening peak hours. Observed average delays are significantly lower with average delays ranging from 12 to 20 seconds for left turn movements and 5 to 15 second for right turn movements during the weekday morning and weekday evening peak hours. Since the actual vehicle delays associated with the baseline condition are significantly less than reported and the project will add less than 5 vehicles per hour approaching Main Street, the project is not expected to have any substantial impact on the intersection operations Mitigation Trip generation for the Project is projected to be nominal with approximately 5 new vehicles per hour or less during commuter peak hours. The traffic study has found that incremental traffic associated with the Project is not expected to materially impact operating conditions at the study intersections. Study intersections exhibit below-average crash rates based on historic crash data; safety countermeasures are therefore not warranted. Likewise, the available sight lines at the proposed site driveway intersection with Summer Street and proposed construction site driveway intersection with West Street exceed the recommended minimum sight line requirements from AASHTO for the posted speed limit and observed travel speeds. The traffic study recommends the following access improvements, on-site circulation/traffic management improvements, and a construction traffic management plan that support the proposed operational needs of the Project while minimizing impact to adjacent roadways. 3755/West Medway II Transportation Draft Environmental Impact Report Epsilon Associates, Inc.
51 Site Access Improvements The Proponent has identified the following site access improvements: A STOP sign (R1-1) and STOP line pavement marking is recommended on driveway approach to Summer Street. The sign and pavement marking shall be compliant with the Manual on Uniform Traffic Control Devices ( MUTCD ). Plantings (shrubs, bushes) and structures (walls, fences, etc.) should be maintained at a height of two feet or less above the adjacent roadway grade within the sight lines in vicinity of the site driveway in order to continue to provide unobstructed sight lines On-Site Circulation/ Traffic Management Improvements The Proponent has identified the following on-site circulation/traffic management improvements: AutoTURN analysis was completed for the preliminary site plan using both a WB- 50 design vehicle (55 feet long) and fuel delivery design vehicle (62 feet long). Based on recommendations a number of areas for on-site roadways have been widening to ensure adequate on-site truck circulation. The provision of a truck by-pass should be considered in the fuel-unloading zone to increase the efficiency of fuel delivery operations. On-site truck staging areas have been identified as shown in Figure to accommodate fuel-truck storage while waiting for an unloading zone to clear. The primary fuel truck staging area has been identified adjacent to the existing on-site roadway. The potential truck staging areas can accommodate 6 fuel oil delivery trucks in the primary staging area and up to an additional 13 trucks in the overflow staging area. To the extent trucks are staged on-site they will be actively managed by on-site staff. Based on previous experience, it was estimated by Exelon that the process of entering the site, unloading and exiting the site would take approximately 45 minutes or less to perform. Under the worst case scenario the Site (existing and proposed Project combined) will generate approximately 4 inbound and 4 outbound truck trips per hour resulting in the need to stage approximately 2 vehicles. The designated staging areas for fuel unloading will be distinct from those for truck deliveries of other materials. 3755/West Medway II Transportation Draft Environmental Impact Report Epsilon Associates, Inc.
52
53 Construction Traffic Management Plan A traffic-construction management plan should be implemented in cooperation with the Town of Medway and the Project s EPC Contractor to accommodate the specific needs of the site and to provide coordination with the Town officials throughout the construction period. Exelon will also coordinate with the Town of Medway with regard to the length of the construction period and any construction permits which may be required. The construction traffic management plan should include but not be limited to the following: Designated parking areas should be provided for construction employees. This area is preferred to be in an existing material laydown lot in the southern portion of the site along West Street which will be reinforced during the construction phase of the site and returned to grass upon completion of the project. Construction periods (i.e., worker arrival/departure times) and material deliveries should be designated to coincide with off-peak travel periods of the area roadway. The current arrival/ departure periods are 5:00 6:00 am and 6:00 7:00 pm which have been shown to be off peak travel periods. Exelon should establish waiting and staging areas on-site for all material deliveries and the management of truck traffic. Dust suppression methods should be implemented at unpaved construction areas as needed (e.g., use of water trucks to wet the ground surface, stabilization of soils, creation of wind breaks, and/or use of stabilized construction and exit points) Truck Deliveries Truck trips associated with replenishment of fuel supplies (oil) at the site will originate from Providence, RI. As a result, trucks destined to/from the Project will solely use Route I-495 to/ from the south and Route 126 to/from the west. These roadways are well established commercial truck routes, and provide the most direct and efficient means of travel to the site Parking Supply Parking requirements are set forth in Section V(H)4 of the Town of Medway Zoning Bylaw ( Zoning Bylaw ). For General Light Industrial and Manufacturing, 1 space per each 2 persons employed or anticipated to be employed on the largest shift and 1 additional space for each 1,000 square feet of net floor area are required. The Project will comply, with approximately 16 proposed parking spaces for the proposed Project. As described in Section 10.3, construction worker parking will be in an existing material laydown lot in the southern portion of the site along West Street. 3755/West Medway II Transportation Draft Environmental Impact Report Epsilon Associates, Inc.
54 10.7 Public Outreach Exelon has developed a comprehensive communications plan to keep local residents, abutters, businesses and Town of Medway officials updated on significant construction milestones and schedules related to the expansion of the Project, including but not limited to: construction schedules; vehicular access and other traffic management information; construction crew movement and parking; laydown areas, staging, and equipment delivery; nighttime or weekend construction; and road repaving. These approaches include: Electronic mail - As part of public outreach during the permitting process, Exelon developed lists to reach specific targeted audiences, including direct abutters, nearby neighbors within 2 miles, local businesses and key external stakeholders. These lists will be used to deliver targeted traffic and construction messages to affected audiences during the construction phase of the Project. Mailings As part of initial communications announcing and describing the proposed Project, Exelon developed and utilized mailing lists to communicate information on public hearings related to the Project. Those lists will be utilized to provide traffic, parking, delivery and construction-related updates and notifications during the next phase of Project development. Website The Proponent is in the process of developing and has launched a Project website which includes a news section where updated information can be posted. The website will also include a sign-up section for interested parties to receive updates. Future plans also call for the development of a blog section on the site to provide additional details and as-needed updates. The website address will be included in all Project-related external communications. Social media In relation to the planned website, Exelon plans to establish a Twitter account to provide the community and Town with realtime updated information during construction and prep work. The Twitter account will be linked to the Project website. Earned/paid media When specific construction-related events are scheduled (traffic changes, major deliveries, etc.) to take place, Exelon will utilize the media to communicate with the community. This will be done through press releases sent through established local media contacts (Milford Daily News, Boston Globe West, Wicked Local, or via paid media (advertisements) when necessary. 3755/West Medway II Transportation Draft Environmental Impact Report Epsilon Associates, Inc.
55 Routine updates with Town of Medway officials Exelon has established routine communication networks with key Town officials and has conducted at least monthly meetings with Town of Medway department heads and leadership regarding the Project. These meetings will continue to be used to keep Town of Medway officials apprised of traffic management, construction, delivery and other potential issues of concern to the Town and residents during the construction phase. 3755/West Medway II Transportation Draft Environmental Impact Report Epsilon Associates, Inc.
56
57
58
59
60
61
62
63
64
65
66
67
68
69
70
71
72
73
74
75

76
77
78
79
80
81
82
83
84
85
86
87
88
89
90
91
92
93
94
95
96
97
98
99
100
101
102
103
104
105
106
107
108
109
110
111
112
113
114
115
116
117
118
119
120
121
122
123
124
125
126
127
128
129
130
131
132
133
134
135
136
137
138
139
140
141
142
143
144
145
146
147
148
149
150
151
152
153
154
155
156
157
158
159
160
161
162
163
164
165
166
167
168
169
170
171
172
173
174
175
176
177
178
179
180
181
182
183
184
185
186
187
188
189
190
191
192
193
194
195
196
197
198
199
200
201
202
203
204
205
206
207
208
209
210
211
212
213
214
215
216
217
218
219
220
221
222
223
224
225
226
227
228
229
230
231
232
233
234
235
236
237
238
239

240
APPENDIX C1 TRAFFIC ANALYSIS DESIGN YEAR TRAFFIC ANALYSIS
 APPENDIX C1 TRAFFIC ANALYSIS DESIGN YEAR TRAFFIC ANALYSIS DESIGN YEAR TRAFFIC ANALYSIS February 2018 Highway & Bridge Project PIN 6754.12 Route 13 Connector Road Chemung County February 2018 Appendix
Traffic Impact Study Speedway Gas Station Redevelopment
 Traffic Impact Study Speedway Gas Station Redevelopment Warrenville, Illinois Prepared For: Prepared By: April 11, 2018 Table of Contents 1. Introduction... 1 2. Existing Conditions... 4 Site Location...
Clean Harbors Canada, Inc.
 Clean Harbors Canada, Inc. Proposed Lambton Landfill Expansion Environmental Assessment Terms of Reference Transportation Assessment St. Clair Township, Ontario September 2009 itrans Consulting Inc. 260
INDUSTRIAL DEVELOPMENT
 INDUSTRIAL DEVELOPMENT Traffic Impact Study Plainfield, Illinois August 2018 Prepared for: Seefried Industrial Properties, Inc. TABLE OF CONTENTS Executive Summary 2 Introduction 3 Existing Conditions
Proposed location of Camp Parkway Commerce Center. Vicinity map of Camp Parkway Commerce Center Southampton County, VA
 Proposed location of Camp Parkway Commerce Center Vicinity map of Camp Parkway Commerce Center Southampton County, VA Camp Parkway Commerce Center is a proposed distribution and industrial center to be
MEMO VIA . Ms. Amy Roth DPS Director, City of Three Rivers. To:
 MEMO To: Ms. Amy Roth DPS Director, City of Three Rivers VIA EMAIL From: Michael J. Labadie, PE Julie M. Kroll, PE, PTOE Brandon Hayes, PE, P.Eng. Fleis & VandenBrink Date: January 5, 2017 Re: Proposed
Date: February 7, 2017 John Doyle, Z-Best Products Robert Del Rio. T.E. Z-Best Traffic Operations and Site Access Analysis
 Memorandum Date: February 7, 07 To: From: Subject: John Doyle, Z-Best Products Robert Del Rio. T.E. Z-Best Traffic Operations and Site Access Analysis Introduction Hexagon Transportation Consultants, Inc.
King Soopers #116 Thornton, Colorado
 Traffic Impact Study King Soopers #116 Thornton, Colorado Prepared for: Galloway & Company, Inc. T R A F F I C I M P A C T S T U D Y King Soopers #116 Thornton, Colorado Prepared for Galloway & Company
The major roadways in the study area are State Route 166 and State Route 33, which are shown on Figure 1-1 and described below:
 3.5 TRAFFIC AND CIRCULATION 3.5.1 Existing Conditions 3.5.1.1 Street Network DRAFT ENVIRONMENTAL IMPACT REPORT The major roadways in the study area are State Route 166 and State Route 33, which are shown
MILLERSVILLE PARK TRAFFIC IMPACT ANALYSIS ANNE ARUNDEL COUNTY, MARYLAND
 MILLERSVILLE PARK TRAFFIC IMPACT ANALYSIS ANNE ARUNDEL COUNTY, MARYLAND Prepared for: Department of Public Works Anne Arundel County Prepared by: URS Corporation 4 North Park Drive, Suite 3 Hunt Valley,
LAWRENCE TRANSIT CENTER LOCATION ANALYSIS 9 TH STREET & ROCKLEDGE ROAD / 21 ST STREET & IOWA STREET LAWRENCE, KANSAS
 LAWRENCE TRANSIT CENTER LOCATION ANALYSIS 9 TH STREET & ROCKLEDGE ROAD / 21 ST STREET & IOWA STREET LAWRENCE, KANSAS TRAFFIC IMPACT STUDY FEBRUARY 214 OA Project No. 213-542 TABLE OF CONTENTS 1. INTRODUCTION...
Traffic Impact Analysis West Street Garden Plots Improvements and DuPage River Park Garden Plots Development Naperville, Illinois
 Traffic Impact Analysis West Street Garden Plots Improvements and DuPage River Park Garden Plots Development Naperville, Illinois Submitted by April 9, 2009 Introduction Kenig, Lindgren, O Hara, Aboona,
TRAFFIC IMPACT ANALYSIS
 TRAFFIC IMPACT ANALYSIS Emerald Isle Commercial Development Prepared by SEPI Engineering & Construction Prepared for Ark Consulting Group, PLLC March 2016 I. Executive Summary A. Site Location The Emerald
APPENDIX E. Traffic Analysis Report
 APPENDIX E Traffic Analysis Report THIS PAGE INTENTIONALLY BLANK EAGLE RIVER TRAFFIC MITIGATION PHASE I OLD GLENN HIGHWAY/EAGLE RIVER ROAD INTERSECTION IMPROVEMENTS TRAFFIC ANALYSIS Eagle River, Alaska
EXECUTIVE SUMMARY. The following is an outline of the traffic analysis performed by Hales Engineering for the traffic conditions of this project.
 EXECUTIVE SUMMARY This study addresses the traffic impacts associated with the proposed Shopko redevelopment located in Sugarhouse, Utah. The Shopko redevelopment project is located between 1300 East and
HUMC/Mountainside Hospital Redevelopment Plan
 Traffic and Parking Analysis HUMC/Mountainside Hospital Redevelopment Plan in Glen Ridge Borough and Montclair Township PREPARED FOR H2M 119 Cherry Hill Road, Suite 110 Parsippany, NJ 07054 862.207.5900
Volume 1 Traffic Impact Analysis Turtle Creek Boulevard Dallas, Texas. Kimley-Horn and Associates, Inc. Dallas, Texas.
 Volume 1 Traffic Impact Analysis 2727 Dallas, Texas June 18, 2018 Kimley-Horn and Associates, Inc. Dallas, Texas Project #064523000 Registered Firm F-928 Traffic Impact Analysis 2727 Dallas, Texas Prepared
TRAFFIC SIGNAL DESIGN REPORT KING OF PRUSSIA ROAD & RAIDER ROAD RADNOR TOWNSHIP PENNSYLVANIA
 TRAFFIC SIGNAL DESIGN REPORT KING OF PRUSSIA ROAD & RAIDER ROAD RADNOR TOWNSHIP PENNSYLVANIA PREPARED FOR: UNIVERSITY OF PENNSYLVANIA HEALTH SYSTEM 34 CIVIC CENTER BOULEVARD PHILADELPHIA, PA 1987 (61)
V. DEVELOPMENT OF CONCEPTS
 Martin Luther King, Jr. Drive Extension FINAL Feasibility Study Page 9 V. DEVELOPMENT OF CONCEPTS Throughout the study process several alternative alignments were developed and eliminated. Initial discussion
Traffic Engineering Study
 Traffic Engineering Study Bellaire Boulevard Prepared For: International Management District Technical Services, Inc. Texas Registered Engineering Firm F-3580 November 2009 Executive Summary has been requested
King County Metro. Columbia Street Transit Priority Improvements Alternative Analysis. Downtown Southend Transit Study. May 2014.
 King County Metro Columbia Street Transit Priority Improvements Alternative Analysis Downtown Southend Transit Study May 2014 Parametrix Table of Contents Introduction... 1 Methodology... 1 Study Area...
TRAFFIC IMPACT STUDY DERRY GREEN CORPORATE BUSINESS PARK MILTON SECONDARY PLAN MODIFICATION
 TRAFFIC IMPACT STUDY DERRY GREEN CORPORATE BUSINESS PARK MILTON SECONDARY PLAN MODIFICATION TRAFFIC IMPACT STUDY DERRY GREEN CORPORATE BUSINESS PARK MILTON SECONDARY PLAN MODIFICATION DECEMBER 24 UPDATED
Traffic Impact Statement (TIS)
") Traffic Impact Statement (TIS) Vincentian PUDA Collier County, FL 10/18/2013 Prepared for: Global Properties of Naples Prepared by: Trebilcock Consulting Solutions, PA 2614 Tamiami Trail N, Suite 615 1205
Traffic Impact Statement (TIS) Vincentian PUDA Collier County, FL 10/18/2013 Prepared for: Global Properties of Naples Prepared by: Trebilcock Consulting Solutions, PA 2614 Tamiami Trail N, Suite 615 1205
Craig Scheffler, P.E., PTOE HNTB North Carolina, P.C. HNTB Project File: Subject
 TECHNICAL MEMORANDUM To Kumar Neppalli Traffic Engineering Manager Town of Chapel Hill From Craig Scheffler, P.E., PTOE HNTB North Carolina, P.C. Cc HNTB Project File: 38435 Subject Obey Creek TIS 2022
Table of Contents INTRODUCTION... 3 PROJECT STUDY AREA Figure 1 Vicinity Map Study Area... 4 EXISTING CONDITIONS... 5 TRAFFIC OPERATIONS...
 Crosshaven Drive Corridor Study City of Vestavia Hills, Alabama Table of Contents INTRODUCTION... 3 PROJECT STUDY AREA... 3 Figure 1 Vicinity Map Study Area... 4 EXISTING CONDITIONS... 5 TRAFFIC OPERATIONS...
TRAFFIC IMPACT ANALYSIS FOR THE 630/650 SOUTH STREET RETAIL DEVELOPMENT WRENTHAM, MASSACHUSETTS
 PARE PROJECT NO. 17120.00 REPORT TRAFFIC IMPACT ANALYSIS FOR THE 630/650 SOUTH STREET RETAIL DEVELOPMENT WRENTHAM, MASSACHUSETTS SUBMITTED TO: GEORGETOWN CAPITAL MANAGEMENT PO BOX 369 GEORGETOWN, MA 01833
Alpine Highway to North County Boulevard Connector Study
 Alpine Highway to North County Boulevard Connector Study prepared by Avenue Consultants March 16, 2017 North County Boulevard Connector Study March 16, 2017 Table of Contents 1 Summary of Findings... 1
APPENDIX B Traffic Analysis
 APPENDIX B Traffic Analysis Rim of the World Unified School District Reconfiguration Prepared for: Rim of the World School District 27315 North Bay Road, Blue Jay, CA 92317 Prepared by: 400 Oceangate,
Traffic Impact Analysis. Alliance Cole Avenue Residential Site Dallas, Texas. Kimley-Horn and Associates, Inc. Dallas, Texas.
 Traffic Impact Analysis Alliance Cole Avenue Residential Site Dallas, Texas February 15, 2018 Kimley-Horn and Associates, Inc. Dallas, Texas Project #064524900 Registered Firm F-928 Traffic Impact Analysis
BARRHAVEN FELLOWSHIP CRC 3058 JOCKVALE ROAD OTTAWA, ONTARIO TRANSPORTATION BRIEF. Prepared for:
 BARRHAVEN FELLOWSHIP CRC 3058 JOCKVALE ROAD OTTAWA, ONTARIO TRANSPORTATION BRIEF Prepared for: Barrhaven Fellowship CRC 3058 Jockvale Road Ottawa, ON K2J 2W7 December 7, 2016 116-649 Report_1.doc D. J.
Proposed CVS/pharmacy
 Traffic Impact and Access Study Proposed CVS/pharmacy West Main Street (Route 1) at Hull Street Clinton, Connecticut PREPARED FOR Arista Development LLC 520 Providence Highway, Suite 9 Norwood, Massachusetts
Appendix H TRAFFIC IMPACT ANALYSIS
 Appendix H TRAFFIC IMPACT ANALYSIS Teichert Boca Quarry Expansion Traffic Impact Analysis Prepared for Teichert Aggregates Prepared by TRANSPORTATION CONSULTANTS, INC. LSC Transportation Consultants, Inc.
TALMONT TOWNHOMES MADISON KENNETH SPA TRAFFIC IMPACT STUDY. Sacramento, CA. Prepared For: MBK Homes. Prepared By:
 TALMONT TOWNHOMES MADISON KENNETH SPA TRAFFIC IMPACT STUDY Sacramento, CA Prepared For: MBK Homes Prepared By: KD Anderson & Associates 3853 Taylor Road, Suite G Loomis, California 95650 (916) 660-1555
West Hills Shopping Centre Lowe s Expansion Traffic Impact Study
 West Hills Shopping Centre Lowe s Expansion Traffic Impact Study Prepared for: Armel Corporation January 2015 Paradigm Transportation Solutions Ltd. 22 King Street South, Suite 300 Waterloo ON N2J 1N8
TRAFFIC PARKING ANALYSIS
 TRAFFIC PARKING ANALYSIS NAPA FLEA MARKET COUNTY OF NAPA Prepared for: Tom Harding Napa-Vallejo Flea Market 33 Kelly Road American Canyon, CA 9453 Prepared by: 166 Olympic Boulevard, Suite 21 Walnut Creek,
RE: A Traffic Impact Statement for a proposed development on Quinpool Road
 James J. Copeland, P.Eng. GRIFFIN transportation group inc. 30 Bonny View Drive Fall River, NS B2T 1R2 May 31, 2018 Ellen O Hara, P.Eng. Project Engineer DesignPoint Engineering & Surveying Ltd. 200 Waterfront
Traffic Impact Study for the proposed. Town of Allegany, New York. August Project No Prepared For:
 Appendix B SRF Traffic Study (Revised November 2005) Draft Environmental Impact Statement University Commons Town of Allegany, Cattaraugus County, NY December 2005 Traffic Impact Study for the proposed
Transportation & Traffic Engineering
 Transportation & Traffic Engineering 1) Project Description This report presents a summary of findings for a Traffic Impact Analysis (TIA) performed by A+ Engineering, Inc. for the Hill Country Family
RICHMOND OAKS HEALTH CENTRE 6265 PERTH STREET OTTAWA, ONTARIO TRANSPORTATION BRIEF. Prepared for: Guycoki (Eastern) Limited.
 Limited.") RICHMOND OAKS HEALTH CENTRE 6265 PERTH STREET OTTAWA, ONTARIO TRANSPORTATION BRIEF Prepared for: Guycoki (Eastern) Limited June 16, 2016 116-638 Brief_1.doc D. J. Halpenny & Associates Ltd. Consulting
RICHMOND OAKS HEALTH CENTRE 6265 PERTH STREET OTTAWA, ONTARIO TRANSPORTATION BRIEF Prepared for: Guycoki (Eastern) Limited June 16, 2016 116-638 Brief_1.doc D. J. Halpenny & Associates Ltd. Consulting
TIMBERVINE TRANSPORTATION IMPACT STUDY FORT COLLINS, COLORADO JANUARY Prepared for:
 TIMBERVINE TRANSPORTATION IMPACT STUDY FORT COLLINS, COLORADO JANUARY 2014 Prepared for: Hartford Companies 1218 W. Ash Street Suite A Windsor, Co 80550 Prepared by: DELICH ASSOCIATES 2272 Glen Haven Drive
Figure 1 Map of intersection of SR 44 (Ravenna Rd) and Butternut Rd
 and Butternut Rd") Abbreviated Study District: 12 County: Geauga Route: SR 44 Section: 1.58 GEA 44 1.58 213 HSP # 47 (Rural Intersection) Prepared April 23, 215 By Bryan Emery Existing Conditions This study contains the
Abbreviated Study District: 12 County: Geauga Route: SR 44 Section: 1.58 GEA 44 1.58 213 HSP # 47 (Rural Intersection) Prepared April 23, 215 By Bryan Emery Existing Conditions This study contains the
INTERSECTION CONTROL EVALUATION
 INTERSECTION CONTROL EVALUATION Trunk Highway 22 and CSAH 21 (E Hill Street/Shanaska Creek Road) Kasota, Le Sueur County, Minnesota November 2018 Trunk Highway 22 and Le Sueur CSAH 21 (E Hill Street/Shanaska
Traffic Feasibility Study
 Traffic Feasibility Study Town Center South Robbinsville Township, Mercer County, New Jersey December 19, 2017 Prepared For Robbinsville Township Department of Community Development 2298 Route 33 Robbinsville,
DEVELOPMENT PROPERTY 1627 MAXIME STREET CITY OF OTTAWA TRANSPORTATION OVERVIEW. Prepared for: Subhas Bhargava. July 9, Overview_1.
 DEVELOPMENT PROPERTY 1627 MAXIME STREET CITY OF OTTAWA TRANSPORTATION OVERVIEW Prepared for: Subhas Bhargava July 9, 2015 115-620 Overview_1.doc D. J. Halpenny & Associates Ltd. Consulting Transportation
Appendix J Traffic Impact Study
 MRI May 2012 Appendix J Traffic Impact Study Level 2 Traffic Assessment Limited Impact Review Appendix J [This page was left blank intentionally.] www.sgm-inc.com Figure 1. Site Driveway and Trail Crossing
Appendix C. Traffic Study
 Appendix C Traffic Study TABLE OF CONTENTS SECTION Executive Summary PAGE 1.0 Introduction... 1 1.1 Scope of Work... 1 1.2 Study Area... 2 2.0 Project Description... 3 2.1 Site Access... 4 2.2 Pedestrian
PROJECT: Wilkinson Road Corridor Improvement Traffic Management Planning Project SUBJECT: Traffic Analysis
 TECHNICAL MEMORANDUM DATE: September 10, 2014 PROJECT 5861.03 NO: PROJECT: Wilkinson Road Corridor Improvement Traffic Management Planning Project SUBJECT: Traffic Analysis TO: Steve Holroyd - District
L1TILE BEARS DAY CARE TRANSPORTATION IMPACT STUDY FORT COLLINS, COLORADO MAY Prepared for:
 L1TILE BEARS DAY CARE TRANSPORTATION IMPACT STUDY FORT COLLINS, COLORADO MAY 2012 Prepared for: Hillside Construction, Inc. 216 Hemlock Street, Suite B Fort Collins, CO 80534 Prepared by: DELICH ASSOCIATES
Table Existing Traffic Conditions for Arterial Segments along Construction Access Route. Daily
 5.8 TRAFFIC, ACCESS, AND CIRCULATION This section describes existing traffic conditions in the project area; summarizes applicable regulations; and analyzes the potential traffic, access, and circulation
1. INTRODUCTION 2. PROJECT DESCRIPTION CUBES SELF-STORAGE MILL CREEK TRIP GENERATION COMPARISON
 CUBES SELF-STORAGE MILL CREEK TRIP GENERATION COMPARISON 1. INTRODUCTION This report summarizes traffic impacts of the proposed CUBES Self-Storage Mill Creek project in comparison to the traffic currently
TRAFFIC IMPACT ANALYSIS. for MILTON SQUARE
 TRAFFIC IMPACT ANALYSIS for MILTON SQUARE US Route 7 Milton, Vermont March 5, 2008 LAMOUREUX & DICKINSON 14 Morse Drive Essex Junction, Vermont 05452 (802) 878-4450 Traffic Impact Assessment EXECUTIVE
TRANSPORTATION TECHNICAL REPORT
 TRANSPORTATION TECHNICAL REPORT for Sunrise Elementary School Replacement PREPARED FOR: Puyallup School District PREPARED BY: 6544 NE 61 st Street, Seattle, WA 98115 ph: (26) 523-3939 fx: (26) 523-4949
Escondido Marriott Hotel and Mixed-Use Condominium Project TRAFFIC IMPACT ANALYSIS REPORT
 Escondido Marriott Hotel and Mixed-Use Condominium Project TRAFFIC IMPACT ANALYSIS REPORT Prepared for Phelps Program Management 420 Sixth Avenue, Greeley, CO 80632 Prepared by 5050 Avenida Encinas, Suite
Downtown One Way Street Conversion Technical Feasibility Report
 Downtown One Way Street Conversion Technical Feasibility Report As part of the City s Transportation Master Plan, this report reviews the technical feasibility of the proposed conversion of the current
MERIVALE PRIORITY SQUARE 2852 MERIVALE ROAD CITY OF OTTAWA TRANSPORTATION BRIEF. Prepared for: ONT Inc. 25 Winding Way Nepean, Ontario K2C 3H1
 MERIVALE PRIORITY SQUARE 2852 MERIVALE ROAD CITY OF OTTAWA TRANSPORTATION BRIEF Prepared for: 2190986ONT Inc. 25 Winding Way Nepean, Ontario K2C 3H1 October 6, 2010 110-502 Report_1.doc D. J. Halpenny
Traffic, Transportation & Civil Engineering Ali R. Khorasani, P.E. P.O. Box 804, Spencer, MA 01562, Tel: (508)
") Associates Traffic, Transportation & Civil Engineering Ali R. Khorasani, P.E. P.O. Box 804, Spencer, MA 01562, Tel: (508) 885-5121 Ms. Teri Ford, Associate 800 Boylston Street, Suite 1570 Boston, MA July
Associates Traffic, Transportation & Civil Engineering Ali R. Khorasani, P.E. P.O. Box 804, Spencer, MA 01562, Tel: (508) 885-5121 Ms. Teri Ford, Associate 800 Boylston Street, Suite 1570 Boston, MA July
Roundabout Feasibility Study SR 44 at Grand Avenue TABLE OF CONTENTS
 Roundabout Feasibility Study SR 44 at Grand Avenue TABLE OF CONTENTS Introduction and Executive Summary... 1 Existing Conditions... 3 Intersection Volume Conditions... 5 Intersection Operations... 9 Safety
TRAFFIC IMPACT STUDY. USD #497 Warehouse and Bus Site
 TRAFFIC IMPACT STUDY for USD #497 Warehouse and Bus Site Prepared by: Jason Hoskinson, PE, PTOE BG Project No. 16-12L July 8, 216 145 Wakarusa Drive Lawrence, Kansas 6649 T: 785.749.4474 F: 785.749.734
Interstate Operations Study: Fargo-Moorhead Metropolitan Area Simulation Output
 NDSU Dept #2880 PO Box 6050 Fargo, ND 58108-6050 Tel 701-231-8058 Fax 701-231-6265 www.ugpti.org www.atacenter.org Interstate Operations Study: Fargo-Moorhead Metropolitan Area 2015 Simulation Output Technical
TRAFFIC IMPACT ANALYSIS SHORTBREAD LOFTS 2009 MODIFICATION Chapel Hill, North Carolina
 TRAFFIC IMPACT ANALYSIS SHORTBREAD LOFTS 2009 MODIFICATION Chapel Hill, North Carolina Prepared for: The Town of Chapel Hill, NC Prepared by: Architects-Engineers-Planners, Inc. November 2009 Traffic Impact
TRAFFIC IMPACT ANALYSIS RIZZO CONFERENCE CENTER EXPANSION FINAL REPORT
 TRAFFIC IMPACT ANALYSIS RIZZO CONFERENCE CENTER EXPANSION Chapel Hill, North Carolina FINAL REPORT Prepared for: The Town of Chapel Hill, NC Prepared by: Architects-Engineers-Planners, Inc. December 2010
Bennett Pit. Traffic Impact Study. J&T Consulting, Inc. Weld County, Colorado. March 3, 2017
 Bennett Pit Traffic Impact Study J&T Consulting, Inc. Weld County, Colorado March 3, 217 Prepared By: Sustainable Traffic Solutions, Inc. http://www.sustainabletrafficsolutions.com/ Joseph L. Henderson,
2.0 Development Driveways. Movin Out June 2017
 Movin Out June 2017 1.0 Introduction The proposed Movin Out development is a mixed use development in the northeast quadrant of the intersection of West Broadway and Fayette Avenue in the City of Madison.
Memorandum. To: Sue Polka, City Engineer, City of Arden Hills. From: Sean Delmore, PE, PTOE. Date: June 21, 2017
 Memorandum engineering planning environmental construction 701 Xenia Avenue South Suite 300 Minneapolis, MN 55416 Tel: 763-541-4800 Fax: 763-541-1700 To: Sue Polka, City Engineer, City of Arden Hills From:
Appendix C-5: Proposed Refinements Rail Operations and Maintenance Facility (ROMF) Traffic Impact Analysis. Durham-Orange Light Rail Transit Project
 Traffic Impact Analysis. Durham-Orange Light Rail Transit Project") Appendix C-5: Proposed Refinements Rail Operations and Maintenance Facility (ROMF) Traffic Impact Analysis Durham-Orange Light Rail Transit Project July 25, 218 ROMF Transportation Impact Analysis Version
Appendix C-5: Proposed Refinements Rail Operations and Maintenance Facility (ROMF) Traffic Impact Analysis Durham-Orange Light Rail Transit Project July 25, 218 ROMF Transportation Impact Analysis Version
LCPS Valley Service Center
 Traffic Impact Study LCPS Valley Service Center Loudoun County, Virginia November 4, 2015 Prepared For: Loudoun County Public Schools 21000 Education Court Ashburn, VA 20148 Prepared by: 1140 Connecticut
105 Toronto Street South, Markdale Transportation Impact Study. Paradigm Transportation Solutions Limited
 105 Toronto Street South, Markdale Transportation Impact Study Paradigm Transportation Solutions Limited December 2016 Project Summary Project Number 162060 December 2016 Client Zelinka Priamo Ltd 318
One Harbor Point Residential
 Residential Gig Harbor, WA Transportation Impact Analysis January 23, 2017 Prepared for: Neil Walter Company PO Box 2181 Tacoma, WA 98401 Prepared by: TENW Transportation Engineering NorthWest 11400 SE
RTE. 1 at RTE. 637 & RTE. 639
 INTERSECTION SAFETY STUDY Prepared for: Virginia Department of Transportation Central Region Operations Traffic Engineering (UPC #81378, TO 12-092) DAVENPORT Project Number: 13-368 / /2014 RTE. 1 at RTE.
TRAFFIC IMPACT STUDY FOR SONIC DRIVE-IN RESTAURANT. Vallejo, CA. Prepared For:
 TRAFFIC IMPACT STUDY FOR SONIC DRIVE-IN RESTAURANT Vallejo, CA Prepared For: ELITE DRIVE-INS, INC. 2190 Meridian Park Blvd, Suite G Concord, CA 94520 Prepared By: KD Anderson & Associates 3853 Taylor Road,
Traffic Impact Analysis 5742 BEACH BOULEVARD MIXED USE PROJECT
 Traffic Impact Analysis 5742 BEACH BOULEVARD MIXED USE PROJECT CITY OF BUENA PARK Prepared by Project No. 14139 000 April 17 th, 2015 DKS Associates Jeffrey Heald, P.E. Rohit Itadkar, T.E. 2677 North Main
Technical Feasibility Report
 Prepared For: Bow Concord I-93 Improvements Project Bow and Concord, NH Prepared By: 53 Regional Drive Concord, NH 03301 NHDOT Project # 13742 Federal Project #T-A000(018) September 2018 TABLE OF CONTENTS
Traffic Impact Study for Proposed Olive Boulevard Development
 Traffic Impact Study for Proposed 11330 Olive Boulevard Development Creve Coeur, Missouri July 7, 2017 Prepared For: 11330 Olive Boulevard Development 11330 Olive Boulevard Creve Coeur, Missouri 63141
STH 60 Northern Reliever Route Feasibility Study Report
 #233087 v3 STH 60 Northern Reliever Route Feasibility Study Report Washington County Public Works Committee Meeting September 28, 2016 1 STH 60 Northern Reliever Route Feasibility Study Hartford Area Development
County State Aid Highway 32 (Cliff Road) and Dodd Road Intersection Study
 and Dodd Road Intersection Study") County State Aid Highway 32 (Cliff Road) and Dodd Road Intersection Study City of Eagan, Dakota County, Minnesota Date: March 2012 Project No. 14957.000 444 Cedar Street, Suite 1500 Saint Paul, MN 55101
County State Aid Highway 32 (Cliff Road) and Dodd Road Intersection Study City of Eagan, Dakota County, Minnesota Date: March 2012 Project No. 14957.000 444 Cedar Street, Suite 1500 Saint Paul, MN 55101
TABLE OF CONTENTS 1.0 INTRODUCTION AND SUMMARY Purpose of Report and Study Objectives... 2
 TABLE OF CONTENTS 1.0 INTRODUCTION AND SUMMARY 1 1.1 Purpose of Report and Study Objectives... 2 1.2 Executive Summary... 3 1.2.1 Site Location and Study Area... 3 1.2.2 Development Description... 3 1.2.3
Interstate Operations Study: Fargo-Moorhead Metropolitan Area Simulation Results
 NDSU Dept #2880 PO Box 6050 Fargo, ND 58108-6050 Tel 701-231-8058 Fax 701-231-6265 www.ugpti.org www.atacenter.org Interstate Operations Study: Fargo-Moorhead Metropolitan Area 2025 Simulation Results
Proposed Hotel and Restaurant Development
 Traffic Impact Study Proposed Hotel and Restaurant Development Marbledale Road Tuckahoe, NY PREPARED FOR BILLWIN DEVELOPMENT AFFILIATES, LLC 365 WHITE PLAINS ROAD EASTCHESTER, NY. 10709 PREPARED BY Engineering
Traffic Impact Study Proposed Residential Development (Watson Parkway North - Starwood Drive Node, City of Guelph)
") Traffic Impact Study Proposed Residential Development (Watson Parkway North - Starwood Drive Node, City of Guelph) Prepared By: 332 Lorne Avenue East Stratford ON N5A 6S4 Prepared for: Paul Kemper, President
Traffic Impact Study Proposed Residential Development (Watson Parkway North - Starwood Drive Node, City of Guelph) Prepared By: 332 Lorne Avenue East Stratford ON N5A 6S4 Prepared for: Paul Kemper, President
Trafalgar Road & Lower Base Line Transportation Study Ontario Inc.
 Trafalgar Road & Lower Base Line Transportation Study 1255723 Ontario Inc. Trafalgar Road & Lower Base Line Transportation Study 1255723 Ontario Inc. 1465 Pickering Parkway Suite 200 Pickering ON L1V 7G7
GASOLINE SERVICE STATION 1618, 1622 ROGER STEVENS DRIVE OTTAWA, ONTARIO TRANSPORTATION IMPACT ASSESSMENT. Prepared for:
 GASOLINE SERVICE STATION 1618, 1622 ROGER STEVENS DRIVE OTTAWA, ONTARIO TRANSPORTATION IMPACT ASSESSMENT Prepared for: Invecta Development (Ottawa) Corporation 758 Shanks Height Milton, ON L9T 7P7 May
TRAFFIC IMPACT ANALYSIS FOR. McDONALD S RESTAURANT IN CARMICAEL Sacramento County, CA. Prepared For:
 TRAFFIC IMPACT ANALYSIS FOR McDONALD S RESTAURANT IN CARMICAEL Sacramento County, CA Prepared For: McDonald s USA, LLC Pacific Sierra Region 2999 Oak Road, Suite 900 Walnut Creek, CA 94597 Prepared By:
Lacey Gateway Residential Phase 1
 Lacey Gateway Residential Phase Transportation Impact Study April 23, 203 Prepared for: Gateway 850 LLC 5 Lake Bellevue Drive Suite 02 Bellevue, WA 98005 Prepared by: TENW Transportation Engineering West
CHAPTER 9: VEHICULAR ACCESS CONTROL Introduction and Goals Administration Standards
 9.00 Introduction and Goals 9.01 Administration 9.02 Standards 9.1 9.00 INTRODUCTION AND GOALS City streets serve two purposes that are often in conflict moving traffic and accessing property. The higher
Re: Addendum No. 4 Transportation Overview 146 Mountshannon Drive Ottawa, Ontario
 April 18 th, 2017 Mr. Kevin Yemm Vice President, Land Development Richraft Group of Companies 2280 St. Laurent Boulevard, Suite 201 Ottawa, Ontario (Tel: 613.739.7111 / e-mail: keviny@richcraft.com) Re:
NEWCASTLE MIDDLE SCHOOL Traffic Impact Analysis
 Gibson Traffic Consultants 2802 Wetmore Avenue Suite 220 Everett, WA 98201 425.339.8266 NEWCASTLE MIDDLE SCHOOL Traffic Impact Analysis Prepared for: Renton School District Jurisdiction: City of Newcastle
MONTEREY BAY AQUARIUM RESEARCH INSTITUTE (MBARI) MASTER PLAN UPDATE MOSS LANDING, CALIFORNIA
 MASTER PLAN UPDATE MOSS LANDING, CALIFORNIA") MONTEREY BAY AQUARIUM RESEARCH INSTITUTE (MBARI) MASTER PLAN UPDATE MOSS LANDING, CALIFORNIA TRAFFIC IMPACT ANALYSIS Administrative Draft Report Prepared For Monterey Bay Aquarium Research Institute Moss
MONTEREY BAY AQUARIUM RESEARCH INSTITUTE (MBARI) MASTER PLAN UPDATE MOSS LANDING, CALIFORNIA TRAFFIC IMPACT ANALYSIS Administrative Draft Report Prepared For Monterey Bay Aquarium Research Institute Moss
Traffic Generation November 28, Mr. Todd Baker Baker Properties, LLC 953 Islington Street Suite 23D Portsmouth, NH 03801
 28-1932-03 November 28, 2016 Mr. Todd Baker Baker Properties, LLC 953 Islington Street Suite 23D Portsmouth, NH 03801 Re: Traffic Impact Evaluation The Rose Farm Residential Development Exeter, New Hampshire
County State Aid Highway 30 (Diffley Road) and Dodd Road Intersection Study
 and Dodd Road Intersection Study") County State Aid Highway 30 (Diffley Road) and Dodd Road Intersection Study City of Eagan, Dakota County, Minnesota Date: March 2012 Project No. 14957.000 444 Cedar Street, Suite 1500 Saint Paul, MN 55101
County State Aid Highway 30 (Diffley Road) and Dodd Road Intersection Study City of Eagan, Dakota County, Minnesota Date: March 2012 Project No. 14957.000 444 Cedar Street, Suite 1500 Saint Paul, MN 55101
Construction Realty Co.
 MEMORANDUM TO: FROM : Jeff Pickus Construction Realty Co. Luay R. Aboona, PE Principal 9575 West Higgins Road, Suite 400 Rosemont, Illinois 60018 p: 847-518-9990 f: 847-518-9987 DATE: May 22, 2014 SUBJECT:
830 Main Street Halifax Regional Municipality
 830 Main Street Halifax Regional Municipality Traffic Impact Statement Final Report Prepared by: GRIFFIN transportation group inc. 30 Bonny View Drive Fall River, NS B2T 1R2 www.griffininc.ca Prepared
TRAFFIC IMPACT STUDY FOR ST. JOSEPH'S ELEMENTARY SCHOOL ADDITION
 CATHOLIC DISTRICT SCHOOL BOARD OF EASTERN ONTARIO P.O. 61992 TRAFFIC IMPACT STUDY FOR ST. JOSEPH'S ELEMENTARY SCHOOL ADDITION SEPTEMBER 5, 218 TRAFFIC IMPACT STUDY FOR ST. JOSEPH'S ELEMENTARY SCHOOL ADDITION
Proposed Inn at Bellefield Traffic Impact Assessment
 Proposed Inn at Bellefield Traffic Impact Assessment Town of Hyde Park Dutchess County, New York Prepared for: T-Rex Hyde Park Owner LLC 500 Mamroneck Avenue, Suite 300 Harrison, NY 10528 June 21, 2017
2. Valley Circle Boulevard/Andora Avenue/Baden Avenue and Lassen Street
 IV.J TRANSPORTATION 1. INTRODUCTION This section presents an overview of the existing traffic and circulation system in and surrounding the project site. This section also discusses the potential impacts
Submittal Document II.G. D-bar-A Project, Traffic Impact Study, prepared by Bergmman Associates, dated November 3, 2015 ( Traffic Study )
") Submittal Document II.G. D-bar-A Project, Traffic Impact Study, prepared by Bergmman Associates, dated November 3, 2015 ( Traffic Study ) D-bar-A Project Traffic Impact Study November 3 rd, 2015 1427
Submittal Document II.G. D-bar-A Project, Traffic Impact Study, prepared by Bergmman Associates, dated November 3, 2015 ( Traffic Study ) D-bar-A Project Traffic Impact Study November 3 rd, 2015 1427
INTERSECTION ANALYSIS PARK AVENUE AND BRADDOCK ROAD (FROSTBURG, MD) FOR LENHART TRAFFIC CONSULTING, INC.
 FOR LENHART TRAFFIC CONSULTING, INC.") INTERSECTION ANALYSIS FOR PARK AVENUE AND BRADDOCK ROAD (FROSTBURG, MD) Prepared for: City of Frostburg, Maryland & Allegany County Commissioners Prepared by: LENHART TRAFFIC CONSULTING, INC. TRAFFIC ENGINEERING
INTERSECTION ANALYSIS FOR PARK AVENUE AND BRADDOCK ROAD (FROSTBURG, MD) Prepared for: City of Frostburg, Maryland & Allegany County Commissioners Prepared by: LENHART TRAFFIC CONSULTING, INC. TRAFFIC ENGINEERING
Southern Windsor County 2016 Traffic Count Program Summary April 2017
 Southern Windsor County 2016 Traffic Count Program Summary April 2017 The Southern Windsor County Regional Planning Commission (the RPC ) has been monitoring traffic at 19 locations throughout the southern
Prepared For: Toronto Transit Commission 1138 Bathurst Street Toronto, Ontario M5R 3H2. Prepared By:
 TRAFFIC IMPACT STUDY FOR THE TTC MCNICOLL BUS GARAGE CITY OF TORONTO Prepared For: Toronto Transit Commission 1138 Bathurst Street Toronto, Ontario M5R 3H2 Prepared By: Canada Inc. 4th Floor, 3 Leek Crescent
ZINFANDEL LANE / SILVERADO TRAIL INTERSECTION TRAFFIC ANALYSIS
 ZINFANDEL LANE / SILVERADO TRAIL INTERSECTION TRAFFIC ANALYSIS UPDATED TRAFFIC STUDY FOR THE PROPOSED RAYMOND VINEYARDS WINERY USE PERMIT MODIFICATION #P11-00156 AUGUST 5, 2014 PREPARED BY: OMNI-MEANS,
TRANSPORTATION STUDY FOR THE 8899 BEVERLY BOULEVARD PROJECT
 DRAFT TRANSPORTATION STUDY FOR THE 8899 BEVERLY BOULEVARD PROJECT WEST HOLLYWOOD, CALIFORNIA NOVEMBER 2013 PREPARED FOR BEVERLY BOULEVARD ASSOCIATION PREPARED BY DRAFT TRANSPORTATION STUDY FOR THE 8899