LAWRENCE TRANSIT CENTER LOCATION ANALYSIS 9 TH STREET & ROCKLEDGE ROAD / 21 ST STREET & IOWA STREET LAWRENCE, KANSAS
|
|
|
- Dorothy Nichols
- 5 years ago
- Views:
Transcription
1 LAWRENCE TRANSIT CENTER LOCATION ANALYSIS 9 TH STREET & ROCKLEDGE ROAD / 21 ST STREET & IOWA STREET LAWRENCE, KANSAS TRAFFIC IMPACT STUDY FEBRUARY 214 OA Project No
2 TABLE OF CONTENTS 1. INTRODUCTION DESCRIPTION OF PROPOSED TRANSIT CENTER DESCRIPTION OF PROPOSED TRANSIT CENTER 9 TH STREET AND ROCKLEDGE ROAD ROADWAY CLASSIFICATION AND CHARACTERISTICS DESCRIPTION OF PROPOSED TRANSIT CENTER 21 ST STREET AND IOWA STREET ROADWAY CLASSIFICATION AND CHARACTERISTICS DATA COLLECTION EXISTING TRAFFIC CONDITIONS TH STREET & ROCKLEDGE ROAD EXISTING CONDITIONS SIGNAL WARRANT ANALYSIS CAPACITY ANALYSIS EXISTING RECOMMENDATIONS - 9 TH STREET & ROCKLEDGE ROAD ST STREET & IOWA STREET EXISTING CONDITIONS SIGNAL WARRANT ANALYSIS CAPACITY ANALYSIS EXISTING RECOMMENDATIONS - 21 ST STREET & IOWA STREET EXISTING PLUS TRANSIT CENTER CONDITIONS TH STREET AND ROCKLEDGE ROAD PROPOSED TRANSIT CENTER CONDITIONS ACCESS SIGNAL WARRANT ANALYSIS CAPACITY ANALYSIS EXISTING PLUS TRANSIT CENTER RECOMMENDATIONS-9 TH STREET & ROCKLEDGE ROAD ST STREET AND IOWA STREET PROPOSED TRANSIT CENTER CONDITIONS ACCESS CAPACITY ANALYSIS EXISTING PLUS TRANSIT CENTER RECOMMENDATIONS - 21 ST STREET & IOWA STREET RECOMMENDATIONS & CONCLUSIONS APPENDIX LIST OF TABLES TABLE 1: INTERSECTION CRASH HISTORY... 1 TABLE 2: INTERSECTION LEVEL OF SERVICE SUMMARY... 1 TABLE 3: EXISTING SIGNALIZED INTERSECTION ANALYSIS TABLE 4: INTERSECTION CRASH HISTORY TABLE 5: PROPOSED BUS TRIPS TO/FROM TRANSIT CENTER... 2 TABLE 6: EXISTING PLUS TRANSIT CENTER SIGNALIZED INTERSECTION ANALYSIS TABLE 7: PROPOSED BUS TRIPS TO/FROM TRANSIT CENTER TABLE 8: EXISTING PLUS TRANSIT CENTER SIGNALIZED INTERSECTION ANALYSIS TABLE 9: SUMMARIZED COST ESTIMATE FOR PROPOSED RECOMMENDATIONS Lawrence Transit Center Traffic Analysis ii
3 LIST OF FIGURES FIGURE 1: VICINITY MAP 9 TH STREET & ROCKLEDGE ROAD... 4 FIGURE 2: VICINITY MAP 21 ST STREET & IOWA STREET... 5 FIGURE 3: SITE PLAN 9 TH STREET & ROCKLEDGE ROAD... 6 FIGURE 4: SITE PLAN 21 ST STREET & IOWA STREET... 7 FIGURE 5: EXISTING PEAK HOUR VOLUMES 9 TH STREET & ROCKLEDGE ROAD FIGURE 6: EXISTING LANE CONFIGURATIONS AND TRAFFIC CONTROL 9 TH STREET & ROCKLEDGE ROAD FIGURE 7: EXISTING LEVEL OF SERVICE 9 TH STREET & ROCKLEDGE ROAD FIGURE 8: EXISTING PEAK HOUR VOLUMES 21 ST STREET & IOWA STREET FIGURE 9: EXISTING LANE CONFIGURATIONS & TRAFFIC CONTROL 21 ST STREET & IOWA STREET FIGURE 1: EXISTING LEVEL OF SERVICE 21 ST STREET & IOWA STREET FIGURE 11: BUS TRIP DISTRIBUTION 9 TH STREET & ROCKLEDGE ROAD FIGURE 12: EXISTING PLUS TRANSIT CENTER PEAK HOUR VOLUMES 9 TH STREET & ROCKLEDGE ROAD FIGURE 13: EXISTING PLUS TRANSIT CENTER LANE CONFIGURATIONS & TRAFFIC CONTROL 9 TH STREET & ROCKLEDGE ROAD FIGURE14: EXISTING PLUS TRANSIT CENTER LEVEL OF SERVICE 9 TH STREET & ROCKLEDGE ROAD FIGURE 15: BUS AND CUT-THROUGH TRAFFIC TRIP DISTRIBUTION 21 ST STREET & IOWA STREET... 3 FIGURE 16: EXISTING PLUS TRANSIT CENTER PEAK HOUR VOLUMES 21 ST STREET & IOWA STREET FIGURE 17: EXISTING PLUS TRANSIT CENTER LANE CONFIGURATIONS & TRAFFIC CONTROL 21 ST STREET & IOWA STREET FIGURE 18: EXISTING PLUS TRANSIT CENTER LEVEL OF SERVICE 21 ST STREET & IOWA STREET Lawrence Transit Center Traffic Analysis iii
4 1. INTRODUCTION This report studies traffic impacts regarding the proposed construction of the Lawrence Transit Center that is proposed to be located in two possible sites within the City. The first location, 925 Iowa Street, is in the southeast quadrant of the intersection of 9 th Street and Centennial Drive and the second location, 221 Stewart Avenue, is in the northeast quadrant of the intersection of 21 st Street & Iowa Street. Both locations are located in Lawrence, Kansas. The approximate locations for the Transit Center are shown in the vicinity maps, Figures 1-2. The objective of this study is to evaluate the existing traffic and roadway conditions and the traffic impacts expected from the proposed Transit Center. The appropriate intersection geometrics and traffic control improvements necessary to accommodate the increased traffic on the study area roadways were identified. For the purpose of this study the Existing and Existing plus Proposed Transit Center scenarios were evaluated for the AM and PM peak hour periods. City of Lawrence staff was contacted regarding the scope of the project. The study area intersections included: 9 th Street & Rockledge Road 9 th Street & Iowa Street 21 st Street & Iowa Street 21 st Street & Ousdahl Road 21 st Street & Naismith Drive Lawrence Transit Center Traffic Analysis 1
5 2. DESCRIPTION OF PROPOSED TRANSIT CENTER The proposed Transit Center will be located in the City of Lawrence, KS. There are two locations being reviewed for the proposed Transit Center. 2.1 Description of Proposed Transit Center 9 th Street and Rockledge Road The Transit Center is proposed to be located along 9 th Street on the east side of Centennial Drive. The Transit Center will be bound by 9 th Street to the north, the Pool Room s parking lot to the east, a commercial building to the south, and Centennial Drive to the west. The proposed Transit Center includes an oval Transit Center with approximately eight bus slots going around the center and two bus slots on the south side of the road, along 9 th Street. Access to the site is proposed via one full access drive. The proposed drive will relocate an existing drive east approximately 45. The site plan for the proposed Transit Center is illustrated in Figure Roadway Classification and Characteristics Completing an analysis of the existing traffic and roadway conditions in the vicinity of the Transit Center site allows for a comparison to aid in determining the impact of the proposed Transit Center site to the surrounding roadway network. In the vicinity of the study site, 9 th Street is an east/west two-lane undivided major collector with a posted speed limit of 3 mph. In the project area, undivided local streets that intersect with 9 th Street are stop controlled. Study intersections along 9 th Street include Rockledge Road. Iowa Street is a north/south four-lane undivided principal arterial with a posted speed limit of 35 mph. The intersection of 9 th Street and Iowa Street is a signalized intersection with auxiliary left-turn lanes on all approaches and auxiliary right-turn lanes in the eastbound and westbound directions. Rockledge Road is a north/south two-lane undivided major collector with no posted speed limit. Rockledge Road provides access to residential streets. 2.2 Description of Proposed Transit Center 21 st Street and Iowa Street The Transit Center is proposed to be located along 21 st Street on the east side of Iowa Street. A parking lot to the north, Stewart Street to the east, 21 st Street to the south, and Iowa Street to the west will bind the Transit Center. The proposed Transit Center includes an oval Transit Center with approximately eight bus slots going around the center and two bus slots on south side of the center. Access to the site along 21 st Street is proposed via two full access drives. Drive 1 will be located along Stewart Avenue and Drive 2 will be located along 21 st Street. Lawrence Transit Center Traffic Analysis 2
6 The site plan for the proposed Transit Center is illustrated in Figure Roadway Classification and Characteristics In the vicinity of the study site, 21 st Street is an east/west two-lane undivided local roadway with a posted speed limit of 3 mph. 21 st Street is stop-controlled at all study intersections. Iowa Street is a north/south four-lane undivided principle arterial with a posted speed limit of 4 mph. Iowa Street has a two-way left-turn lane going northbound at the intersection of 21 st Street and Iowa Street. Ousdahl Road is a north/south two-lane undivided local roadway with no posted speed limit. Ousdahl Road provides access to residential streets. The intersection of 21 st Street and Ousdahl Road is an all-way stop controlled intersection. Naismith Drive is a north/south two-lane divided major collector with a posted speed limit of 3 mph. Naismith has auxiliary left-turn lanes in the northbound and southbound directions. Lawrence Transit Center Traffic Analysis 3

7 Project Location SOURCE: GOOGLE MAPS PROJECT NO: DRAWN BY: JMS DATE: West 133rd Street Vicinity Map Suite 2 Overland Park, KS R 9th Street & Rockledge Road TEL FAX FIGURE

8 Project Location PROJECT NO: DRAWN BY: JMS DATE: SOURCE: GOOGLE MAPS 731 West 133rd Street Vicinity Map Suite 2 Overland Park, KS R 21st Street & Iowa Street TEL FAX FIGURE
9 PROJECT NO: DRAWN BY: JMS DATE: West 133rd Street Site Plan Suite 2 Overland Park, KS R 9th Street & Rockledge Road TEL FAX FIGURE
10 PROJECT NO: DRAWN BY: JMS DATE: West 133rd Street Site Plan Suite 2 Overland Park, KS R 21st Street & Iowa Street TEL FAX FIGURE
11 3. DATA COLLECTION Olsson Associates collected AM and PM peak hour traffic counts at the intersections of 9 th Street and Rockledge Road and 21 st Street and Iowa Street. This traffic count data was collected on December 1 th -12 th, 213. Based on the traffic count data, the AM peak hour period for both intersections is from 7:3 to 8:3 AM. The PM peak hour period for 9 th Street and Rockledge Road is from 4:45 to 5:45 PM and for 21 st Street and Iowa Street the peak hour is from 5: to 6: PM. Additional turning movement counts were collected at the intersections of 9 th Street and Iowa Street, 21 st Street and Ousdahl Road, and 21 st Street and Naismith Drive. The count data was collected on January 29 th -3 th and February 6 th and 11 th, 214. This count data was utilized in determining any geometric changes needed within the site area. In addition to manual turning movement counts, Olsson Associates completed machine 24-hour counts along each approach at the study intersections of 9th Street and Rockledge Road and 21st Street and Iowa Street on December 1 th -11 th, 213. Traffic count data is included in the Appendix. Lawrence Transit Center Traffic Analysis 8
12 4. EXISTING TRAFFIC CONDITIONS The analysis of existing conditions is based on the traffic counts collected for the study intersections. Sections and detail roadway classification and intersection characteristics for the existing network. Existing traffic volumes used for analysis are illustrated in Figures 5 and 8. The existing intersection geometrics and traffic control for the study area intersections are illustrated in Figures 6 and th Street & Rockledge Road Existing Conditions The existing conditions for the 9 th Street and Rockledge Road site, east of the intersection of 9 th Street and Rockledge Road, were reviewed and signal warrant analysis and capacity analysis were completed Signal Warrant Analysis The Manual on Uniform Traffic Control Devices (MUTCD 29 Edition) provides eight signal warrants for evaluation of signalization at intersections. Typically, traffic signal warrants are based on a complete review of traffic information including volumes, pedestrians, accidents experience, and traffic progression. The preliminary need for signalization at the study intersections were evaluated based on the Eight-Hour Vehicular Warrant (Warrant 1), Four-Hour Vehicular Volume (Warrant 2), Peak Hour Warrant (Warrant 3) and Crash Experience (Warrant 7) contained in the MUTCD. To account for Warrant 1, Eight-Hour Warrant, two conditions were evaluated, Condition A Minimum Vehicular Volume and Condition B Interruption of Continuous Traffic. This warrant is based on accepted criteria used by agencies for the construction year at an intersection using projected volumes. Signal warrant analysis for the Eight-Hour Warrant was completed for the intersection of 9 th Street and Rockledge Road. Based on existing volumes the intersection does not satisfy the Eight-Hour Warrant criteria for the existing conditions. Signal warrant analysis for Warrant 2, Four-Hour Vehicular Volume Warrant, was completed for the intersection of 9 th Street and Rockledge Road under the existing conditions. The study intersection does not satisfy the criteria based on Warrant 2. Signal warrant analysis for Warrant 3, Peak Hour Warrant, was completed for the intersection of 9 th Street and Rockledge Road under existing conditions. The intersection does not satisfy the peak hour warrant criteria based on Warrant 3 during the PM peak hour period. To account for Warrant 7, Crash Experience, three criteria must be met. If one criterion is not met then the warrant is not satisfied. Table 1 shows the crash history for the past three years at the intersection of 9 th Street and Rockledge Road. Lawrence Transit Center Traffic Analysis 9
13 Table 1: Intersection Crash History 9 th Street & Rockledge Road Crashes Year Fatal Injury PDO Total The second criteria for crash experience involves five or more reported crashes, or types susceptible to correction by a traffic control signal, have occurred within a 12- month period, each crash involving personal injury or property damage apparently exceeding the applicable requirements for a reportable crash. The study intersection does not satisfy the criteria based on Warrant 7. Signal warrant analysis sheets can be found in the Appendix Capacity Analysis Signalized intersection capacity analyses were performed using SYNCHRO, version 8., based on the Highway Capacity Manual (HCM) delay methodology. Unsignalized capacity analyses were performed in accordance with Chapter 17 of the HCM using the Highway Capacity Software (HCS+), version 5.6. For simplicity, the amount of delay is equated to a grade or Level of Service (LOS) based on thresholds of driver acceptance. A letter grade between A and F is assigned, where LOS A represents the best operation. Table 2 represents the LOS associated with intersection control delay, in seconds per vehicle (sec/veh), for signalized and unsignalized intersections. Table 2: Intersection Level of Service Summary Level of Service (LOS) Level-of-Service Criteria Stop Control Approach Delay sec/veh Signal Control Control Delay sec/veh A 1 1 B >1 and 15 >1 and 2 C >15 and 25 >2 and 35 D >25 and 35 >35and 55 E >35 and 5 >55 and 8 F >5 >8 Capacity analysis was completed as discussed above for the signalized study intersection of 9 th Street and Iowa Street. Signal timing data as provided by the City of Lawrence Transit Center Traffic Analysis 1
14 Lawrence were unaltered for analysis purposes. Table 3 further details level of service for this intersection. Capacity analysis sheets are included in the Appendix. Table 3: Existing Signalized Intersection Analysis Intersection AM Peak Hour PM Peak Hour 9 th Street and Iowa Street C (3.6) D (5.4) *LOS (Delay in Seconds) During both the AM and PM peak hours the overall operation of the intersection of 9 th Street and Iowa Street is acceptable. All individual movements operate at LOS D or better during the AM and PM peak hour with the following exceptions. During the PM peak hour period the southbound left-turn movement and the northbound and southbound thru movements operate at a LOS E. Queuing is not expected to exceed beyond the available storage. Unsignalized capacity analysis was conducted for the intersection of 9 th Street and Rockledge Road. During both the AM and PM peak hour periods the southbound movement is operating at LOS F. During the AM and PM peak hour periods the southbound movement is expected to have a queue length of approximately 7 and 5 vehicles respectively. Unsignalized side street movements can be expected to operate at a lower level of service during the peak hour periods as the higher major street movements are accommodated. Figure 7 illustrates existing conditions level of service and 95 th lengths. Capacity analysis sheets are included in the Appendix. percentile queue Existing Recommendations - 9 th Street & Rockledge Road The intersection of 9 th Street and Iowa Street is currently operating at acceptable overall and individual levels of service during the AM and PM peak hour periods with the following exception. During the PM peak hour period the southbound left-turn movement and the northbound and southbound thru movements operate at a LOS E. The intersection of 9 th Street and Rockledge Road operates at acceptable levels of service with the exception of the southbound movement during the AM and PM peak hour periods that operates at a LOS F. Current volumes at the intersection of 9th Street and Rockledge Road do not satisfy Warrants 1, 2, 3 or 7 for signalization. Conditions at 9 th Street and Rockledge Road will be monitored under the existing plus bus scenario; however no further recommendations are necessary under existing operations st Street & Iowa Street Existing Conditions The existing conditions for the 21 st Street and Iowa Street site were reviewed and signal warrant analysis and capacity analysis were completed. Lawrence Transit Center Traffic Analysis 11
15 4.2.1 Signal Warrant Analysis Signal warrant analysis for the study intersection of 21 st Street and Iowa Street was performed using the methodologies described in Section The Eight-Hour Vehicular Warrant (Warrant 1), Four-Hour Vehicular Volume (Warrant 2) and Peak Hour Warrant (Warrant 3) were evaluated. Signal warrant analysis was completed for the intersection of 21 st Street and Iowa Street. Based on existing traffic volumes the intersection of 21 st Street and Iowa Street does not satisfy Warrants 1 or 2 for signalization. Signal warrant analysis for Warrant 3, Peak Hour Warrant, was completed for the intersection of 21 st Street and Iowa Street under existing conditions. The intersection satisfies the peak hour warrant criteria based on Warrant 3 during the PM peak hour period. To account for Warrant 7, Crash Experience, three criteria must be met. Table 4 shows the crash history for the past three years at the intersection of 9 th Street and Rockledge Road. Table 4: Intersection Crash History 21 st Street & Iowa Street Crashes Year Fatal Injury PDO Total The second criteria for crash experience involves five or more reported crashes, or types susceptible to correction by a traffic control signal, have occurred within a 12- month period, each crash involving personal injury or property damage apparently exceeding the applicable requirements for a reportable crash. This criterion is met during all three studied years. A criterion involving alternative configurations and observations is also involved in the Crash Experience Warrant. With the Peak Hour Warrant met, during the PM peak hour period, further analysis is not required to install a signal. Signal warrant analysis sheets can be found in the Appendix Capacity Analysis Capacity analysis was performed using the methodologies described in Section Unsignalized capacity analysis was conducted for the study intersections along 21 st Street. During both the AM and PM peak hours the individual movements at the Lawrence Transit Center Traffic Analysis 12
16 intersections of 21 st Street and Iowa Street, 21 st Street and Ousdahl Road, and 21 st Street and Naismith Drive operate at acceptable levels of service with the following exceptions. At the intersection of 21 st Street and Iowa Street, the eastbound and westbound movements operate at a LOS F during the AM and PM peak hours. Higher peak hour side street movements are causing increased delay and the warrant for signalization. The intersection will be evaluated as signalized intersection control in future condition scenarios. Figure 1 illustrates existing conditions level of service and 95 th lengths. Capacity analysis sheets are included in the Appendix. percentile queue Existing Recommendations - 21 st Street & Iowa Street The intersections of 21 st Street with Iowa Street, Ousdahl Road, and Naismith Drive are currently operating at acceptable levels of service during the AM and PM peak hour periods with the following exceptions. The eastbound and westbound movements at the intersection of 21 st Street and Iowa Street operate at a LOS F during both the AM and PM peak hour periods. Signal warrant analysis was performed for the intersection of 21 st Street and Iowa Street. The intersection satisfies the Peak Hour Warrant under existing conditions. The following roadway improvements are recommended: 21 st Street & Iowa Street Install a traffic signal at the intersection of 21 st Street and Iowa Street. This will help the side street levels of service, queue lengths, and the delay times, particularly during peak hour periods. Lawrence Transit Center Traffic Analysis 13
17 Iowa Street Rockledge Road 35 (34) 23 (1) 67 (62) 24 (59) 159 (479) 1 (3) 9th Street 4 (51) 692 (924) 164 (215) 65 (216) 63 (378) 111 (277) 44 (27) 354 (332) 1 (6) 5 (2) 23 (7) 11 (5) 47 (15) 14 (259) 4 (73) 8 (79) 496 (689) 5 (34) LEGEND XX' - AM (PM) Peak Hour Volumes PROJECT NO: DRAWN BY: JMS DATE: West 133rd Street Existing Peak Hour Volumes Suite 2 Overland Park, KS R 9th Street & Rockledge Road TEL FAX FIGURE
18 Iowa Street Rockledge Road 2' 1' 235' U 23' 9th Street S 235' 35' 11' 125' 11' 125' PROJECT NO: DRAWN BY: JMS DATE: LEGEND Unsignalized Intersection Signalized Intersection Stop Sign XX' - Turn Bay Storage Length 731 West 133rd Street Existing Lane Configurations & Traffic Control Suite 2 Overland Park, KS R 9th Street & Rockledge Road TEL FAX U S FIGURE
19 F (F) U Rockledge Road A (A) 9th Street & Iowa Street Intersection Delay 3.6 (5.4) sec. 9th Street C (E) {313' (578')} C (E) {129' (26')} Iowa Street C (D) C (C) {< 25' (63')} C (D) {68' (472')} B (C) {9' (268')} A (A) C (C) C (C) {41' (11')} C (D) {147' (364')} C (D) {< 25 (< 25')} C (D) {< 25' (71')} D (E) {295' (465')} U X LEGEND Unsignalized Intersection Signalized Level of Service Stop Sign AM (PM) Level of Service XX {XX} {AM (PM)} 95th Percentile Queue Length PROJECT NO: DRAWN BY: JMS DATE: West 133rd Street Existing Level of Service Suite 2 Overland Park, KS R 9th Street & Rockledge Road TEL FAX FIGURE
20 Naismith Drive Ousdahl Road Iowa Street 8 () 671 (145) 56 (47) 33 (38) 2 (19) 13 (23) 21st Street 3 (1) 41 (54) 6 (3) 4 (8) 52 (78) 29 (54) 4 (17) 81 (437) 13 (13) 25 (13) 66 (127) 13 (59) 1 () 4 (19) 15 (87) 99 (21) 89 (991) 47 (54) 11 (1) 95 (57) 2 (15) 28 (12) 89 (61) 25 (12) 16 (7) 123 (55) 8 (18) 13 (39) 287 (282) 56 (17) LEGEND XX' - AM (PM) Peak Hour Volumes PROJECT NO: DRAWN BY: JMS DATE: West 133rd Street Existing Peak Hour Volumes Suite 2 Overland Park, KS R 21st Street & Iowa Street TEL FAX FIGURE
21 Naismith Drive Ousdahl Road Iowa Street 5' 21st Street 15' 9' 265' 265' 1' U U U U LEGEND Unsignalized Intersection Stop Sign XX' - Turn Bay Storage Length PROJECT NO: DRAWN BY: JMS DATE: West 133rd Street Existing Lane Configurations & Traffic Control Suite 2 Overland Park, KS R 21st Street & Iowa Street TEL FAX FIGURE
22 Naismith Drive Ousdahl Road Iowa Street F (F) B (B) F (F) F (F) 21st Street A (A) A (A) U U U A (A) A (A) C (B) B (C) B (B) A (A) A (A) U X LEGEND Unsignalized Intersection Signalized Level of Service Stop Sign AM (PM) Level of Service XX {XX} {AM (PM)} 95th Percentile Queue Length PROJECT NO: DRAWN BY: JMS DATE: West 133rd Street Existing Level of Service Suite 2 Overland Park, KS R 21st Street & Iowa Street TEL FAX FIGURE

23 5. EXISTING PLUS TRANSIT CENTER CONDITIONS The proposed Transit Center is located in the City of Lawrence, KS. The proposed Transit Center is oval shaped with approximately eight bus slots going around the center and two bus slots on the side of the center. The existing plus Transit Center scenario reviews expected operations of the roadway network based on the addition of proposed Transit Center traffic to existing traffic volumes th Street and Rockledge Road Proposed Transit Center Conditions The addition of the Transit Center is not expected to grow car traffic, but is expected to grow bus traffic. Routes going through the City of Lawrence were reviewed and, with the addition of the Transit Center along 9 th Street, it was found that during either peak hour period there would be 1 busses entering the site and 1 busses exiting the site. Table 5 shows the directions in which the busses will be traveling. Table 5: Proposed Bus Trips to/from Transit Center The AM and PM peak hour bus trips for the proposed Transit Center are illustrated in Figure 11. The resulting existing plus Transit Center peak hour traffic volumes are illustrated in Figure 12 and Figure 13 illustrates the existing plus Transit Center lane configurations and traffic control Access Access to the site is proposed via one full access drive along 9 th Street. Drive 1 is a proposed drive approximately 365 east of the intersection 9 th Street and Rockledge Road. This drive will be replacing an existing drive that is located approximately 5 west of the proposed drive. Lawrence Transit Center Traffic Analysis 2
24 5.1.2 Signal Warrant Analysis Signal warrant analysis for the study intersection of 21 st Street and Iowa Street was performed using the methodologies described in Section The Eight-Hour Vehicular Warrant (Warrant 1), Four-Hour Vehicular Volume (Warrant 2) and Peak Hour Warrant (Warrant 3) were evaluated. Signal warrant analysis was completed for the intersection of 9 th Street and Rockledge Road. Based on existing traffic volumes the intersection of 9 th Street and Rockledge Road does not satisfy Warrants 1, 2, or 3 for signalization. Signal warrant analysis sheets can be found in the Appendix Capacity Analysis Capacity analysis was performed using the methodologies described in Section for the signalized study intersection of 9 th Street and Iowa Street. Signal timing data as provided by the City of Lawrence were unaltered for analysis purposes. Table 6 further details level of service for this intersection. Capacity analysis sheets are included in the Appendix. Table 6: Existing plus Transit Center Signalized Intersection Analysis Intersection AM Peak Hour * PM Peak Hour * 9 th Street and Iowa Street C (3.8) D (5.3) *LOS (Delay in Seconds) During both the AM and PM peak hours the overall operation of the intersection of 9 th Street and Iowa Street is acceptable. All individual movements operate at LOS D or better during the AM and PM peak hour with the following exceptions. During the PM peak hour period the northbound and southbound left-turn and thru movements operate at a LOS E. Queuing is not expected to exceed beyond the available storage, but there is an extended queue for the westbound movements. Unsignalized capacity analysis was conducted for the intersection of 9 th Street and Rockledge Road. It is recommended to add a southbound left-turn lane at the intersection of 9 th Street & Rockledge Road to reduce queuing and improve delay. The existing plus transit center conditions were analyzed with a 15 southbound left-turn lane in place. During both the AM and PM peak hour periods the southbound left-turn movement is expected to operate at LOS E and F, respectively. The southbound movement is expected to have a queue length of approximately 3 and 2 vehicles, during the AM and PM peak hour periods, respectively. Unsignalized side street movements can be expected to operate at a lower level of service during the peak hour periods as the higher major street movements are accommodated. Lawrence Transit Center Traffic Analysis 21
25 Figure 14 illustrates existing conditions level of service and 95 th lengths. Capacity analysis sheets are included in the Appendix. percentile queue Existing plus Transit Center Recommendations-9 th Street & Rockledge Road The intersection of 9 th Street and Iowa Street is expected to operate at an overall acceptable level of service during the AM and PM peak hour periods. The addition of bus traffic did not change the levels of service for the individual movements along 9 th Street and had a minimal effect on Iowa Street and Rockledge Road. There is an extended queue length for the westbound movements at the intersection of 9 th Street and Iowa Street. Existing plus Transit Center volumes at the intersection of 9 th Street and Rockledge Road do not satisfy Warrants 1, 2, or 3 for signalization. The following roadway improvements are recommended: 9 th Street & Rockledge Road The southbound left-turn is operating at a LOS E with increased delay and queuing. The addition of a dedicated southbound left-turn lane with 15 of storage plus taper will reduce queuing and improve delay. A traffic signal is not warranted for the intersection of 9 th Street and Rockledge Road; however, the City may have specific policy regarding protected left-turns for transit vehicles. 9 th Street & Iowa Street There is higher delay and extended queue lengths during peak periods for some movements at the intersection of 9 th Street and Iowa Street. Incremental improvements in extending turn-lanes are not expected to have a significant impact on capacity and queuing. More significant geometric improvements are expected to have significant right-of-way and capital costs st Street and Iowa Street Proposed Transit Center Conditions The addition of the Transit Center is not expected to grow passenger car traffic, but is expected to grow bus traffic. Routes going through the City of Lawrence were reviewed and with the addition of the Transit Center along 21 st Street it was found that during the AM peak hour there are expected to be 19 busses entering the site and 21 busses leaving the site. During the PM peak hour there are expected to be 2 busses entering the site and 23 busses leaving the site. Table 7 shows the directions in which the busses will be traveling. Lawrence Transit Center Traffic Analysis 22
26 Table 7: Proposed Bus Trips to/from Transit Center Based on discussions with the City of Lawrence the proposed addition of a traffic signal at the intersection of 21 st Street and Iowa Street is expected to grow cut-through passenger car traffic along 21 st Street. Based on a review of the area and discussions with the City of Lawrence staff cut-through traffic was estimated to grow by approximately 2%. The distribution of traffic growth was split evenly between the southbound right-turns and northbound left-turns at Ousdahl Road and Naismith Drive. The AM and PM peak hour bus and cut-through trips for the proposed Transit Center are illustrated in Figure 15. The resulting existing plus Transit Center peak hour traffic volumes are illustrated in Figure 16 and Figure 17 illustrates the existing plus Transit Center lane configurations and traffic control Access Access to the site is proposed via two full access drives. Drive 1 is a proposed full access drive located along Stewart Avenue approximately 27 north of the 21 st Street and Stewart Avenue intersection. This drive will be replacing two existing drives that are located just south of the proposed drive. Drive 2 is a proposed full access drive located along 21 st Street approximately 225 east of the intersection of 21 st Street and Iowa Street. This drive will be replacing an existing concrete drive approach Capacity Analysis Capacity analysis was performed using the methodologies described in Section for the signalized study intersection of 21 st Street and Iowa Street. The signal was given a reasonable cycle length and the signal split timings were optimized. Table 8 further details level of service for this intersection. Capacity analysis sheets are included in the Appendix. Lawrence Transit Center Traffic Analysis 23
27 Table 8: Existing plus Transit Center Signalized Intersection Analysis Intersection AM Peak Hour * PM Peak Hour * 21 st Street and Iowa Street A (9.7) B (12.7) *LOS (Delay in Seconds) During the AM and PM peak hour periods the overall operations of the intersection of 21 st Street and Iowa Street are expected to be acceptable. All individual movements are expected to operate at LOS D or better during the AM and PM peak hour periods with the following exceptions. During the AM and PM peak hour periods the westbound leftturn movement is expected to operate at a LOS E and F, respectively, with a queue that is not expected to exceed beyond the available storage. The proposed signalized intersection was analyzed with a westbound left-turn lane that was extended to 15 to accommodate the vehicle growth, and for optimal signal operations the west leg was modified to mirror the east-leg with one left-turn lane and a thru/right-turn lane. The signal timings include a reasonable cycle length of 12 seconds during the AM and PM peak hour periods with optimized split times. A 15 northbound left-turn lane should be striped. Unsignalized capacity analysis was conducted for the intersections of 21 st Street with Ousdahl Road and Naismith Drive. All individual movements are expected to operate at a LOS D or better during the AM and PM peak hour periods. Figure 18 illustrates existing conditions level of service and 95 th lengths. Capacity analysis sheets are included in the Appendix. percentile queue Existing plus Transit Center Recommendations - 21 st Street & Iowa Street With the addition of the traffic signal the intersection of 21 st Street and Iowa Street is expected to have an overall good operation with a slight increase in side street traffic as Iowa Street is accommodated. The westbound left-turn movement is expected to operate at a LOS E and F during both the AM and PM peak hour periods, respectively. The addition of bus and cut-through traffic had minimal effect on the levels of service for the individual movements for the unsignalized intersections along 21 st Street. The following roadway improvements are recommended: 21 st Street & Iowa Street Extend the westbound left-turn lane from 5 to 15 of storage plus taper. Restripe the northbound approach of 21 st Street and Iowa Street to have a 15 dedicated left-turn lane that transitions to the existing two-way left-turn lane. For optimal signal operation, the west leg of the intersection should mirror the east leg s configuration, which includes a left-turn lane with 15 of storage plus taper and a thru/right-turn lane. Lawrence Transit Center Traffic Analysis 24
28 The addition of a northbound auxiliary right-turn lane would benefit operations by removing vehicular and bus traffic from mainline Iowa Street traffic. Lawrence Transit Center Traffic Analysis 25
29 Iowa Street Rockledge Road 2 (2) 3 (3) 4 (4) 2 (2) 4 (4) 9th Street 3 (3) 1 (1) 1 (1) LEGEND XX' - AM (PM) Peak Hour Bus Trips PROJECT NO: DRAWN BY: JMS DATE: West 133rd Street Bus Trip Distribution Suite 2 Overland Park, KS R 9th Street & Rockledge Road TEL FAX FIGURE
30 Iowa Street Rockledge Road 35 (34) 23 (1) 69 (64) 26 (61) 163 (483) 1 (3) 9th Street 7 (54) 692 (924) 164 (215) 65 (216) 63 (378) 111 (277) 44 (27) 358 (336) 1 (6) 5 (2) 23 (7) 11 (5) 5 (18) 14 (259) 41 (74) 9 (8) 496 (689) 5 (34) LEGEND XX' - AM (PM) Peak Hour Volumes PROJECT NO: DRAWN BY: JMS DATE: West 133rd Street Existing + Transit Center Peak Hour Volumes Suite 2 Overland Park, KS R 9th Street & Rockledge Road TEL FAX FIGURE
31 Iowa Street Rockledge Road 15' U 9th Street S PROJECT NO: DRAWN BY: JMS DATE: LEGEND Unsignalized Intersection Signalized Intersection Stop Sign XX' - Turn Bay Storage Length Existing + Transit Center 731 West 133rd Street Suite 2 Lane Configurations & Traffic Control Overland Park, KS R TEL th Street & Rockledge Road FAX U S FIGURE
32 C (C) E (F) U Rockledge Road A (A) 9th Street & Iowa Street Intersection Delay 3.8 (5.3) sec. 9th Street C (E) {317' (583')} C (E) {129' (257')} Iowa Street C (D) C (C) {< 25' (63')} C (D) {69' (472')} B (C) {9' (268')} A (A) C (D) C (C) {44' (114')} C (D) {147' (364')} C (D) {< 25 (< 25')} C (E) {< 25' (75')} D (E) {295' (465')} PROJECT NO: DRAWN BY: JMS DATE: LEGEND Unsignalized Intersection Signalized Level of Service Stop Sign AM (PM) Level of Service XX {XX} {AM (PM)} 95th Percentile Queue Length 731 West 133rd Street Existing + Transit Center Level of Service Suite 2 Overland Park, KS R 9th Street & Rockledge Road TEL FAX U X FIGURE
33 Naismith Drive Ousdahl Road Iowa Street 7 (7) 6 (6) {6 (7)} {4 (4)} 4 (4) 1 (2) {3 (4)} 4 (4) {3 (4)} 21st Street 4 (5) {6 (8)} 2 (2) 4 (3) 4 (5) 3 (3) 1 (1) 2 (2) 1 (1) 1 (1) {3 (4)} LEGEND XX' - AM (PM) Peak Hour Bus Trips {XX'} - AM (PM) Peak Hour Cut-Through Trips PROJECT NO: DRAWN BY: JMS DATE: West 133rd Street Bus and Cut-Through Traffic Trip Distribution Suite 2 Overland Park, KS R 21st Street & Iowa Street TEL FAX FIGURE
34 Naismith Drive Ousdahl Road Iowa Street 8 () 671 (145) 63 (54) 45 (51) 24 (23) 2 (27) 21st Street 7 (5) 41 (54) 6 (3) 4 (8) 62 (91) 29 (54) 8 (23) 81 (437) 13 (13) 25 (13) 68 (149) 13 (59) 1 () 4 (19) 15 (87) 99 (21) 89 (991) 51 (57) 11 (1) 99 (62) 2 (15) 31 (15) 89 (61) 25 (12) 17 (9) 122 (57) 9 (19) 14 (44) 287 (282) 56 (17) LEGEND XX' - AM (PM) Peak Hour Volumes PROJECT NO: DRAWN BY: JMS DATE: West 133rd Street Existing + Transit Center Peak Hour Volumes Suite 2 Overland Park, KS R 21st Street & Iowa Street TEL FAX FIGURE
35 Naismith Drive Ousdahl Road Iowa Street Extend to 15' 21st Street S U U 15' 15' PROJECT NO: DRAWN BY: JMS DATE: LEGEND Unsignalized Intersection Signalized Intersection Stop Sign XX' - Turn Bay Storage Length Existing + Transit Center 731 West 133rd Street Suite 2 Lane Configurations & Traffic Control Overland Park, KS R TEL FAX st Street & Iowa Street 17 U S FIGURE
36 A (A) {< 25' (< 25')} A (A) {14' (425')} A (A) {< 25' (2')} Iowa Street A (B) D (D) {38' (43')} E (F) {36' (48')} 21st Street A (A) U Ousdahl Road A (A) A (A) U Naismith Drive B (D) D (C) {< 25' (< 25')} D (D) {< 25' (28')} A (A) {26' (< 25')} A (A) {197' (229')} A (A) {< 25' (< 25')} B (A) A (A) C (C) A (A) 21st Street and Stewart Avenue Intersection Delay 9.7 (12.7) sec. PROJECT NO: DRAWN BY: JMS DATE: LEGEND Unsignalized Intersection Signalized Level of Service Stop Sign AM (PM) Level of Service XX {XX} {AM (PM)} 95th Percentile Queue Length Existing + Transit Center 731 West 133rd Street Suite 2 Level of Service Overland Park, KS R TEL FAX st Street & Iowa Street 18 U X FIGURE
37 6. RECOMMENDATIONS & CONCLUSIONS This study considered the impacts regarding the proposed construction of the Lawrence Transit Center that is proposed to be located in two possible sites within the City of Lawrence, KS. One location was along 9 th Street in the southeast corner of 9 th Street and Centennial Drive. The other location was along 21 st Street in the northeast corner of 21 st Street and Iowa Street. The study determined the impacts that the proposed Lawrence Transit Center will have on traffic operations. Based on the results of the capacity analyses and field observations, the following conclusions and recommendations are made for the study area. Cost estimates for the recommended improvements at both site locations are summarized below in Table 9; full cost estimates are included in the Appendix. Table 9: Summarized Cost Estimate for Proposed Recommendations 925 Iowa - Related Roadway Improvement Costs 9th Street Repaving Repave North Leg of Rockledge $ 1,376,412 Contingency $ 344,13 Opinion of Probable Cost $ 1,72, Stewart - Related Roadway Improvement Costs Extend Westbound Left-Turn Lane from 5' to 15' plus taper* $ 39,983 Add Left-Turn Lane to the West Leg of 21st & Iowa $ 82,76 Add Northbound Right-Turn Lane to 21st & Iowa $ 92,877 Repave W. 21st St and Stewart St from Iowa to Trasit Center Entrance $ 521,798 Install Traffic Signal at 21st St and Iowa, Northbound 15' Left-Turn Lane $ 165, *Would be included in repavement. Is not included in contingency or total. Contingency $ 198,44 Opinion of Probable Cost $ 1,6,191 Existing Recommendations - 9 th Street & Rockledge Road The intersection of 9 th Street and Iowa Street is currently operating at acceptable overall levels of service during the AM and PM peak hour periods; some individual movements operate at a LOS E during the PM peak hour period. The intersection of 9 th Street and Rockledge Road operates at acceptable levels of service with the exception of the southbound movement, which operates at a LOS F during the AM and PM peak hour periods. Current volumes at the intersection of 9 th Street and Rockledge Road do not satisfy Warrants 1, 2, 3, or 7 for signalization. Conditions at 9 th Street and Rockledge Road will be monitored under the existing plus bus scenario; however no further recommendations are necessary under existing operations. Lawrence Transit Center Traffic Analysis 34
38 Existing Recommendations - 21 st Street & Iowa Street The intersections of 21 st Street with Iowa Street, Ousdahl Road, and Naismith Drive are currently operating at acceptable levels of service during the AM and PM peak hour periods with the following exceptions. The eastbound and westbound movements at the intersection of 21 st Street and Iowa Street operate at a LOS F during both the AM and PM peak hour periods. Signal warrant analysis was performed for the intersection of 21 st Street and Iowa Street. The intersection satisfies the Peak Hour Warrant under existing conditions. The following roadway improvements are recommended: 21 st Street & Iowa Street Install a traffic signal at the intersection of 21 st Street and Iowa Street. This will help the side street levels of service, queue lengths, and the delay times. Existing plus Transit Center Recommendations - 9 th Street & Rockledge Road The intersection of 9 th Street and Iowa Street is expected to operate at an overall acceptable level of service during the AM and PM peak hour periods. The addition of bus traffic did not change the levels of service for the individual movements along 9 th Street and had a minimal effect on Iowa Street and Rockledge Road. There is an extended queue length for the westbound movements at the intersection of 9 th Street and Iowa Street. Existing plus Transit Center volumes at the intersection of 9 th Street and Rockledge Road do not satisfy Warrants 1, 2, or 3 for signalization. The following roadway improvements are recommended: 9 th Street & Rockledge Road The southbound left-turn is operating at a LOS E with increased delay and queuing. The addition of a dedicated southbound left-turn lane with 15 of storage plus taper will reduce queuing and improve delay. A traffic signal is not warranted for the intersection of 9 th Street and Rockledge Road; however, the City may have specific policy regarding protected left-turns for transit vehicles. 9 th Street & Iowa Street There is higher delay and extended queue lengths during peak periods for some movements at the intersection of 9 th Street and Iowa Street. Incremental improvements in extending turn-lanes are not expected to have a significant impact on capacity and queuing. More significant geometric improvements are expected to have significant right-of-way and capital costs. Existing plus Transit Center Recommendations - 21 st Street & Iowa Street With the addition of the traffic signal the intersection of 21 st Street and Iowa Street is expected to have an overall good operation with a slight increase in side street traffic as Iowa Street is accommodated. The westbound left-turn movement is expected to operate at a LOS E and F during both the AM and PM peak hour periods, respectively. The addition of bus and cut-through traffic had minimal effect on the levels of service for Lawrence Transit Center Traffic Analysis 35
39 the individual movements for the unsignalized intersections along 21 st following roadway improvements are recommended: Street. The 21 st Street & Iowa Street Extend the westbound left-turn lane from 5 to 15 of storage plus taper. Restripe the northbound approach of 21 st Street and Iowa Street to have a 15 dedicated left-turn lane that transitions to the existing two-way left-turn lane. For optimal signal operation, the west leg of the intersection should mirror the east leg s configuration, which includes a left-turn lane with 15 of storage plus taper and a thru/right-turn lane. The addition of a northbound auxiliary right-turn lane would benefit operations by removing vehicular and bus traffic from mainline Iowa Street traffic. Lawrence Transit Center Traffic Analysis 36
40 APPENDIX Lawrence Transit Center Traffic Analysis 37
41 Traffic Counts 9 th Street (24-hour)
42 OLSSON ASSOCIATES 731 West 133rd Street Overland Park, KS Page 1 Site Code: ROCKLEDGE NB Station ID: Latitude: '. South Start 1-Dec-13 Time Tue Channel 1 12: AM * 12:15 * 12:3 * 12:45 * 1: * 1:15 * 1:3 * 1:45 * 2: * 2:15 * 2:3 * 2:45 * 3: * 3:15 * 3:3 * 3:45 * 4: * 4:15 * 4:3 * 4:45 * 5: * 5:15 * 5:3 * 5:45 * 6: * 6:15 * 6:3 * 6:45 * 7: * 7:15 * 7:3 * 7:45 * 8: * 8:15 * 8:3 * 8:45 * 9: * 9:15 * 9:3 * 9:45 * 1: * 1:15 * 1:3 * 1:45 * 11: * 11:15 * 11:3 * 11:45 * Total Peak Vol P.H.F.
43 OLSSON ASSOCIATES 731 West 133rd Street Overland Park, KS Page 2 Site Code: ROCKLEDGE NB Station ID: Latitude: '. South Start 1-Dec-13 Time Tue Channel 1 12: PM * 12:15 * 12:3 5 12:45 6 1: 1 1:15 2 1:3 2 1:45 3 2: 1 2:15 2 2:3 4 2:45 3 3: 6 3: :3 6 3:45 5 4: 2 4:15 2 4:3 6 4:45 5 5: 6 5:15 4 5:3 5 5:45 3 6: 4 6:15 3 6:3 3 6:45 3 7: 3 7:15 7:3 1 7:45 1 8: 1 8:15 4 8:3 2 8:45 2 9: 1 9:15 2 9:3 9:45 1 1: 1:15 1 1:3 1:45 11: 11: :3 11:45 1 Total 129 Peak - 15: Vol P.H.F..533
44 OLSSON ASSOCIATES 731 West 133rd Street Overland Park, KS Page 3 Site Code: ROCKLEDGE NB Station ID: Latitude: '. South Start 11-Dec-13 Time Wed Channel 1 12: AM 12:15 12:3 12:45 1: 1:15 1:3 1:45 2: 2:15 2:3 2:45 1 3: 3:15 3:3 3:45 4: 4:15 4:3 4:45 5: 5:15 5:3 1 5:45 1 6: 1 6:15 6:3 1 6:45 2 7: 7:15 3 7:3 8 7: : 14 8:15 4 8:3 2 8:45 4 9: 1 9:15 1 9:3 2 9:45 2 1: 1 1:15 2 1:3 2 1: : 1 11: :3 1 11:45 3 Total 81 Peak - 7: Vol P.H.F..696
45 OLSSON ASSOCIATES 731 West 133rd Street Overland Park, KS Page 4 Site Code: ROCKLEDGE NB Station ID: Latitude: '. South Start 11-Dec-13 Time Wed Channel 1 12: PM 3 12: :3 2 12:45 * 1: * 1:15 * 1:3 * 1:45 * 2: * 2:15 * 2:3 * 2:45 * 3: * 3:15 * 3:3 * 3:45 * 4: * 4:15 * 4:3 * 4:45 * 5: * 5:15 * 5:3 * 5:45 * 6: * 6:15 * 6:3 * 6:45 * 7: * 7:15 * 7:3 * 7:45 * 8: * 8:15 * 8:3 * 8:45 * 9: * 9:15 * 9:3 * 9:45 * 1: * 1:15 * 1:3 * 1:45 * 11: * 11:15 * 11:3 * 11:45 * Total 7 Peak Vol P.H.F. Grand Total 217 Percent ADT ADT 65 AADT 65
46 OLSSON ASSOCIATES 731 West 133rd Street Overland Park, KS Page 1 Site Code: Station ID: Rockledge Rd SB Latitude: '. Undefined Start 1-Dec-13 Time Tue Channel 1 12: AM * 12:15 * 12:3 * 12:45 * 1: * 1:15 * 1:3 * 1:45 * 2: * 2:15 * 2:3 * 2:45 * 3: * 3:15 * 3:3 * 3:45 * 4: * 4:15 * 4:3 * 4:45 * 5: * 5:15 * 5:3 * 5:45 * 6: * 6:15 * 6:3 * 6:45 * 7: * 7:15 * 7:3 * 7:45 * 8: * 8:15 * 8:3 * 8:45 * 9: * 9:15 * 9:3 * 9:45 * 1: * 1:15 * 1:3 * 1:45 * 11: * 11:15 * 11:3 * 11:45 * Total Peak Vol P.H.F.
47 OLSSON ASSOCIATES 731 West 133rd Street Overland Park, KS Page 2 Site Code: Station ID: Rockledge Rd SB Latitude: '. Undefined Start 1-Dec-13 Time Tue Channel 1 12: PM * 12:15 * 12:3 2 12: : 19 1: :3 21 1:45 2 2: 17 2: :3 17 2: : 19 3: :3 3 3: : 25 4: :3 27 4: : 17 5: :3 29 5: : 2 6: :3 19 6:45 2 7: 15 7: :3 13 7:45 1 8: 11 8:15 1 8:3 12 8: : 13 9:15 8 9:3 14 9:45 3 1: 5 1:15 9 1:3 6 1: : 4 11: :3 5 11:45 4 Total 759 Peak - 15: Vol P.H.F..776
48 OLSSON ASSOCIATES 731 West 133rd Street Overland Park, KS Page 3 Site Code: Station ID: Rockledge Rd SB Latitude: '. Undefined Start 11-Dec-13 Time Wed Channel 1 12: AM 3 12: :3 3 12:45 2 1: 2 1:15 5 1:3 1:45 2: 2 2:15 4 2:3 2 2:45 1 3: 3 3:15 1 3:3 2 3:45 1 4: 4:15 4:3 1 4:45 1 5: 2 5:15 5 5:3 2 5:45 1 6: 2 6:15 4 6:3 1 6:45 7 7: 15 7:15 1 7:3 21 7: : 35 8: :3 2 8: : 15 9: :3 18 9: : 22 1: :3 18 1: : 14 11: : :45 16 Total 461 Peak - 8: Vol P.H.F..799
49 OLSSON ASSOCIATES 731 West 133rd Street Overland Park, KS Page 4 Site Code: Station ID: Rockledge Rd SB Latitude: '. Undefined Start 11-Dec-13 Time Wed Channel 1 12: PM 18 12: : :45 * 1: * 1:15 * 1:3 * 1:45 * 2: * 2:15 * 2:3 * 2:45 * 3: * 3:15 * 3:3 * 3:45 * 4: * 4:15 * 4:3 * 4:45 * 5: * 5:15 * 5:3 * 5:45 * 6: * 6:15 * 6:3 * 6:45 * 7: * 7:15 * 7:3 * 7:45 * 8: * 8:15 * 8:3 * 8:45 * 9: * 9:15 * 9:3 * 9:45 * 1: * 1:15 * 1:3 * 1:45 * 11: * 11:15 * 11:3 * 11:45 * Total 61 Peak Vol P.H.F. Grand Total 1281 Percent ADT ADT 395 AADT 395
50 Date/Time/Volume/Average Speed/Temperature Report 21ST Street HI-Star ID: 698 Begin: Dec/1/213 12:: PM End: Dec/11/213 12:: PM Street: 9th Street Lane: EB Hours: 24. State: Ks Oper: JRC Period: 15 City: Lawrence Posted: 35 Raw Count: 348 County: Douglas AADT Factor: 1 AADT Count: 3,48 Date And Period Average Roadway Time Range Volume Speed Temperature Roadway Surface Wet/Dry Tue,Dec/1/213 [12:-12:15] MPH 62 F [12:15-12:3] 4 45 MPH 62 F [12:3-12:45] MPH 52 F [12:45-13:] MPH 52 F [13:-13:15] 5 29 MPH 48 F [13:15-13:3] MPH 44 F [13:3-13:45] MPH 42 F [13:45-14:] MPH [14:-14:15] MPH [14:15-14:3] MPH [14:3-14:45] 47 3 MPH 37 F [14:45-15:] MPH [15:-15:15] 7 27 MPH 37 F [15:15-15:3] MPH 37 F [15:3-15:45] MPH 35 F [15:45-16:] MPH 35 F [16:-16:15] MPH 33 F [16:15-16:3] MPH 33 F [16:3-16:45] 72 3 MPH 33 F [16:45-17:] 85 3 MPH 31 F [17:-17:15] 17 3 MPH 31 F [17:15-17:3] MPH 31 F [17:3-17:45] MPH 31 F [17:45-18:] MPH 33 F [18:-18:15] MPH 33 F [18:15-18:3] MPH 33 F [18:3-18:45] MPH 33 F [18:45-19:] MPH 35 F [19:-19:15] MPH 35 F [19:15-19:3] MPH 35 F [19:3-19:45] MPH 35 F [19:45-2:] MPH 37 F [2:-2:15] MPH 37 F [2:15-2:3] MPH 37 F [2:3-2:45] 2 28 MPH 37 F [2:45-21:] MPH 37 F Dec/16/213 9:42:52 AM Page: 1
51 Date/Time/Volume/Average Speed/Temperature Report 21ST Street HI-Star ID: 698 Begin: Dec/1/213 12:: PM End: Dec/11/213 12:: PM Street: 9th Street Lane: EB Hours: 24. State: Ks Oper: JRC Period: 15 City: Lawrence Posted: 35 Raw Count: 348 County: Douglas AADT Factor: 1 AADT Count: 3,48 Date And Period Average Roadway Time Range Volume Speed Temperature Roadway Surface Wet/Dry Tue,Dec/1/213 [21:-21:15] MPH 37 F [21:15-21:3] MPH 37 F [21:3-21:45] MPH 37 F [21:45-22:] MPH [22:-22:15] MPH [22:15-22:3] MPH [22:3-22:45] 5 28 MPH [22:45-23:] 7 31 MPH [23:-23:15] 1 31 MPH [23:15-23:3] 7 32 MPH [23:3-23:45] 9 28 MPH [23:45-:] 5 28 MPH Tue,Dec/1/ MPH Wed,Dec/11/213 [:-:15] 5 28 MPH [:15-:3] 9 31 MPH [:3-:45] 5 3 MPH [:45-1:] 1 32 MPH [1:-1:15] 3 27 MPH [1:15-1:3] 3 26 MPH [1:3-1:45] 5 28 MPH [1:45-2:] 3 34 MPH 42 F [2:-2:15] 2 3 MPH 42 F [2:15-2:3] 2 28 MPH 42 F [2:3-2:45] 1 22 MPH 42 F [2:45-3:] MPH 42 F [3:-3:15] 1 32 MPH 42 F [3:15-3:3] 1 32 MPH 42 F [3:3-3:45] MPH [3:45-4:] MPH [4:-4:15] 1 18 MPH [4:15-4:3] 2 2 MPH [4:3-4:45] 1 28 MPH [4:45-5:] 6 36 MPH [5:-5:15] 9 32 MPH [5:15-5:3] 5 31 MPH Dec/16/213 9:42:52 AM Page: 2
52 Date/Time/Volume/Average Speed/Temperature Report 21ST Street HI-Star ID: 698 Begin: Dec/1/213 12:: PM End: Dec/11/213 12:: PM Street: 9th Street Lane: EB Hours: 24. State: Ks Oper: JRC Period: 15 City: Lawrence Posted: 35 Raw Count: 348 County: Douglas AADT Factor: 1 AADT Count: 3,48 Date And Period Average Roadway Time Range Volume Speed Temperature Roadway Surface Wet/Dry Wed,Dec/11/213 [5:3-5:45] MPH [5:45-6:] MPH [6:-6:15] 15 3 MPH [6:15-6:3] 14 3 MPH [6:3-6:45] MPH [6:45-7:] MPH [7:-7:15] MPH [7:15-7:3] MPH [7:3-7:45] MPH [7:45-8:] MPH [8:-8:15] MPH [8:15-8:3] MPH [8:3-8:45] MPH 37 F [8:45-9:] MPH 37 F [9:-9:15] MPH 37 F [9:15-9:3] MPH 37 F [9:3-9:45] 5 31 MPH 35 F [9:45-1:] MPH 35 F [1:-1:15] 38 3 MPH 35 F [1:15-1:3] MPH 35 F [1:3-1:45] 42 3 MPH 31 F [1:45-11:] MPH 33 F [11:-11:15] 46 3 MPH 37 F [11:15-11:3] MPH [11:3-11:45] MPH [11:45-12:] 53 3 MPH 37 F Wed,Dec/11/213 Dec/1/213 12:: PM Dec/11/213 12:: PM MPH MPH Dec/16/213 9:42:52 AM Page: 3
53 OLSSON ASSOCIATES 731 West 133rd Street Overland Park, KS Page 1 Site Code: 9 WB Station ID: Latitude: '. South Start 1-Dec-13 Time Tue Channel 1 12: AM * 12:15 * 12:3 * 12:45 * 1: * 1:15 * 1:3 * 1:45 * 2: * 2:15 * 2:3 * 2:45 * 3: * 3:15 * 3:3 * 3:45 * 4: * 4:15 * 4:3 * 4:45 * 5: * 5:15 * 5:3 * 5:45 * 6: * 6:15 * 6:3 * 6:45 * 7: * 7:15 * 7:3 * 7:45 * 8: * 8:15 * 8:3 * 8:45 * 9: * 9:15 * 9:3 * 9:45 * 1: * 1:15 * 1:3 * 1:45 * 11: * 11:15 * 11:3 * 11:45 * Total Peak Vol P.H.F.
54 OLSSON ASSOCIATES 731 West 133rd Street Overland Park, KS Page 2 Site Code: 9 WB Station ID: Latitude: '. South Start 1-Dec-13 Time Tue Channel 1 12: PM * 12:15 * 12: : : 73 1: :3 63 1: : 63 2: :3 74 2: : 85 3: :3 68 3: : 14 4: : : : 155 5: : : : 13 6: : : : 61 7: :3 58 7: : 52 8: :3 58 8: : 4 9: :3 33 9: : 31 1: :3 2 1: : 13 11: : :45 16 Total 397 Peak - 16: Vol P.H.F..881
55 OLSSON ASSOCIATES 731 West 133rd Street Overland Park, KS Page 3 Site Code: 9 WB Station ID: Latitude: '. South Start 11-Dec-13 Time Wed Channel 1 12: AM 8 12: :3 8 12: : 6 1:15 4 1:3 1 1:45 7 2: 4 2:15 6 2:3 2:45 3 3: 1 3:15 3 3:3 1 3:45 2 4: 4:15 2 4:3 3 4:45 1 5: 2 5:15 3 5:3 7 5:45 7 6: 5 6: :3 19 6: : 3 7: :3 45 7: : 52 8: :3 29 8: : 41 9: :3 48 9: : 36 1: :3 4 1: : 57 11: : :45 52 Total 153 Peak - 11: Vol P.H.F..856
56 OLSSON ASSOCIATES 731 West 133rd Street Overland Park, KS Page 4 Site Code: 9 WB Station ID: Latitude: '. South Start 11-Dec-13 Time Wed Channel 1 12: PM 85 12: : :45 * 1: * 1:15 * 1:3 * 1:45 * 2: * 2:15 * 2:3 * 2:45 * 3: * 3:15 * 3:3 * 3:45 * 4: * 4:15 * 4:3 * 4:45 * 5: * 5:15 * 5:3 * 5:45 * 6: * 6:15 * 6:3 * 6:45 * 7: * 7:15 * 7:3 * 7:45 * 8: * 8:15 * 8:3 * 8:45 * 9: * 9:15 * 9:3 * 9:45 * 1: * 1:15 * 1:3 * 1:45 * 11: * 11:15 * 11:3 * 11:45 * Total 25 Peak Vol P.H.F. Grand Total 4355 Percent ADT ADT 1,39 AADT 1,39
57 Traffic Counts 9 th Street (TMC)
58 OLSSON ASSOCIATES 731 WEST 133RD STREET SUITE 2 OVERLAND PARK, KANSAS TH & IOWA AM COUNT TAYOLR & FRIEND File Name : 9TH & IOWA AM MERGED Site Code : Start Date : 2/6/214 Page No : 1 Groups Printed- Unshifted - Bank 1 IOWA 9TH IOWA 9TH From North From East From South From West Start Time Right Thru Left Peds App. Total Right Thru Left Peds App. Total Right Thru Left Peds App. Total Right Thru Left Peds App. Total Int. Total 7: AM :15 AM :3 AM :45 AM Total : AM :15 AM :3 AM :45 AM Total Grand Total Apprch % Total % Unshifted % Unshifted Bank 1 % Bank 1 IOWA Out In Total Right Thru Left Peds 9TH Out In Total Left 237 Thru 73 Right Peds 2/6/214 7: AM 2/6/214 8:45 AM Unshifted Bank 1 North Right Thru Left Peds Out In Total TH Left Thru Right Peds Out In Total IOWA
59 OLSSON ASSOCIATES 731 WEST 133RD STREET SUITE 2 OVERLAND PARK, KANSAS TH & IOWA AM COUNT TAYOLR & FRIEND File Name : 9TH & IOWA AM MERGED Site Code : Start Date : 2/6/214 Page No : 2 IOWA From North 9TH From East IOWA From South 9TH From West Start Time Right Thru Left Peds App. Total Right Thru Left Peds App. Total Right Thru Left Peds App. Total Right Thru Left Peds App. Total Int. Total Peak Hour Analysis From 7: AM to 8:45 AM - Peak 1 of 1 Peak Hour for Entire Intersection Begins at 7:15 AM 7:15 AM :3 AM :45 AM : AM Total Volume % App. Total PHF Peak Hour Analysis From 7: AM to 8:45 AM - Peak 1 of 1 Peak Hour for Each Approach Begins at: 7:15 AM 7:3 AM 7:15 AM 7:3 AM + mins mins mins mins Total Volume % App. Total PHF
60 OLSSON ASSOCIATES 731 WEST 133RD STREET SUITE 2 OVERLAND PARK, KANSAS TH & IOWA PM COUNT TAYOLR & FRIEND File Name : 9TH & IOWA PM MERGED Site Code : Start Date : 1/29/214 Page No : 1 Groups Printed- Unshifted - Bank 1 IOWA 9TH IOWA 9TH From North From East From South From West Start Time Right Thru Left Peds App. Total Right Thru Left Peds App. Total Right Thru Left Peds App. Total Right Thru Left Peds App. Total Int. Total 4: PM :15 PM :3 PM :45 PM Total : PM :15 PM :3 PM :45 PM Total Grand Total Apprch % Total % Unshifted % Unshifted Bank 1 % Bank 1 IOWA Out In Total Right Thru Left Peds 9TH Out In Total Left 489 Thru 136 Right Peds 1/29/214 4: PM 1/29/214 5:45 PM Unshifted Bank 1 North Right Thru Left Peds Out In Total TH Left Thru Right Peds Out In Total IOWA
61 OLSSON ASSOCIATES 731 WEST 133RD STREET SUITE 2 OVERLAND PARK, KANSAS TH & IOWA PM COUNT TAYOLR & FRIEND File Name : 9TH & IOWA PM MERGED Site Code : Start Date : 1/29/214 Page No : 2 IOWA From North 9TH From East IOWA From South 9TH From West Start Time Right Thru Left Peds App. Total Right Thru Left Peds App. Total Right Thru Left Peds App. Total Right Thru Left Peds App. Total Int. Total Peak Hour Analysis From 4: PM to 5:45 PM - Peak 1 of 1 Peak Hour for Entire Intersection Begins at 5: PM 5: PM :15 PM :3 PM :45 PM Total Volume % App. Total PHF Peak Hour Analysis From 4: PM to 5:45 PM - Peak 1 of 1 Peak Hour for Each Approach Begins at: 5: PM 4:45 PM 5: PM 5: PM + mins mins mins mins Total Volume % App. Total PHF
62 OLSSON ASSOCIATES 731 WEST 133RD STREET SUITE 2 OVERLAND PARK, KANSAS th Street & Rockledge Rd AM & PM Counts Taylor Count File Name : 9th Street & Rockledge Rd Merged Site Code : Start Date : 12/1/213 Page No : 1 Groups Printed- Unshifted - Bank 1 ROCKLEDGE 9 ROCKLEDGE 9 From North From East From South From West Start Time Right Thru Left Peds App. Total Right Thru Left Peds App. Total Right Thru Left Peds App. Total Right Thru Left Peds App. Total Int. Total 4: PM :15 PM :3 PM :45 PM Total : PM :15 PM :3 PM :45 PM Total *** BREAK *** 7: AM :15 AM :3 AM :45 AM Total : AM :15 AM :3 AM :45 AM Total Grand Total Apprch % Total % Unshifted % Unshifted Bank 1 % Bank 1
63 OLSSON ASSOCIATES 731 WEST 133RD STREET SUITE 2 OVERLAND PARK, KANSAS th Street & Rockledge Rd AM & PM Counts Taylor Count File Name : 9th Street & Rockledge Rd Merged Site Code : Start Date : 12/1/213 Page No : 2 ROCKLEDGE Out In Total Right Thru Left Peds 9 Out In Total Left Thru 7 7 Right Peds 12/1/213 4: PM 12/11/213 8:45 AM Unshifted Bank 1 North Right Thru Left Peds Out In Total Left Thru Right Peds Out In Total ROCKLEDGE
64 OLSSON ASSOCIATES 731 WEST 133RD STREET SUITE 2 OVERLAND PARK, KANSAS th Street & Rockledge Rd AM & PM Counts Taylor Count File Name : 9th Street & Rockledge Rd Merged Site Code : Start Date : 12/1/213 Page No : 3 ROCKLEDGE 9 ROCKLEDGE 9 From North From East From South From West Start Time Right Thru Left Peds App. Total Right Thru Left Peds App. Total Right Thru Left Peds App. Total Right Thru Left Peds App. Total Int. Total Peak Hour Analysis From 4: PM to 5:45 PM - Peak 1 of 1 Peak Hour for Entire Intersection Begins at 4:3 PM 4:3 PM :45 PM : PM :15 PM Total Volume % App. Total PHF Peak Hour Analysis From 4: PM to 5:45 PM - Peak 1 of 1 Peak Hour for Each Approach Begins at: 4:45 PM 4:3 PM 4:3 PM 4:3 PM + mins mins mins mins Total Volume % App. Total PHF
65 Traffic Counts 21 st Street (24-hour)
66 Date/Time/Volume/Average Speed/Temperature Report HI-Star ID: 5898 Begin: Dec/1/213 12:: PM End: Dec/11/213 12:: PM Street: Iowa St. Lane: NB Inside Hours: 24. State: Ks Oper: JRC Period: 15 City: Lawrence Posted: 4 Raw Count: 6427 County: Douglas AADT Factor: 1 AADT Count: 6,427 Date And Period Average Roadway Time Range Volume Speed Temperature Roadway Surface Wet/Dry Tue,Dec/1/213 [12:-12:15] MPH 44 F [12:15-12:3] MPH 46 F [12:3-12:45] MPH 46 F [12:45-13:] MPH 46 F [13:-13:15] MPH 46 F [13:15-13:3] MPH 46 F [13:3-13:45] MPH 46 F [13:45-14:] MPH 46 F [14:-14:15] MPH 46 F [14:15-14:3] MPH 46 F [14:3-14:45] MPH 46 F [14:45-15:] MPH 44 F [15:-15:15] 1 34 MPH [15:15-15:3] MPH [15:3-15:45] MPH [15:45-16:] MPH [16:-16:15] MPH 37 F [16:15-16:3] MPH 37 F [16:3-16:45] MPH 35 F [16:45-17:] MPH 35 F [17:-17:15] MPH 33 F [17:15-17:3] MPH 33 F [17:3-17:45] MPH 33 F [17:45-18:] MPH 31 F [18:-18:15] MPH 31 F [18:15-18:3] MPH 31 F [18:3-18:45] MPH 33 F [18:45-19:] MPH 33 F [19:-19:15] MPH 33 F [19:15-19:3] MPH 33 F [19:3-19:45] MPH 33 F [19:45-2:] MPH 35 F [2:-2:15] 6 33 MPH 35 F [2:15-2:3] MPH 35 F [2:3-2:45] 5 35 MPH 35 F [2:45-21:] MPH 37 F Dec/16/213 9:43:38 AM Page: 1
67 Date/Time/Volume/Average Speed/Temperature Report HI-Star ID: 5898 Begin: Dec/1/213 12:: PM End: Dec/11/213 12:: PM Street: Iowa St. Lane: NB Inside Hours: 24. State: Ks Oper: JRC Period: 15 City: Lawrence Posted: 4 Raw Count: 6427 County: Douglas AADT Factor: 1 AADT Count: 6,427 Date And Period Average Roadway Time Range Volume Speed Temperature Roadway Surface Wet/Dry Tue,Dec/1/213 [21:-21:15] 6 33 MPH 37 F [21:15-21:3] MPH 37 F [21:3-21:45] MPH 37 F [21:45-22:] MPH 37 F [22:-22:15] MPH 37 F [22:15-22:3] 4 33 MPH 37 F [22:3-22:45] MPH 37 F [22:45-23:] MPH 37 F [23:-23:15] MPH [23:15-23:3] MPH [23:3-23:45] MPH [23:45-:] MPH Tue,Dec/1/ MPH 38 F Wed,Dec/11/213 [:-:15] MPH [:15-:3] MPH [:3-:45] MPH [:45-1:] MPH [1:-1:15] 7 33 MPH [1:15-1:3] MPH [1:3-1:45] 4 34 MPH [1:45-2:] MPH [2:-2:15] 4 3 MPH [2:15-2:3] MPH [2:3-2:45] 8 33 MPH [2:45-3:] 4 33 MPH [3:-3:15] 3 33 MPH [3:15-3:3] 2 4 MPH [3:3-3:45] 5 35 MPH [3:45-4:] 6 33 MPH [4:-4:15] 5 33 MPH [4:15-4:3] 3 34 MPH [4:3-4:45] 4 32 MPH [4:45-5:] 8 32 MPH [5:-5:15] 1 32 MPH [5:15-5:3] MPH Dec/16/213 9:43:38 AM Page: 2
68 Date/Time/Volume/Average Speed/Temperature Report HI-Star ID: 5898 Begin: Dec/1/213 12:: PM End: Dec/11/213 12:: PM Street: Iowa St. Lane: NB Inside Hours: 24. State: Ks Oper: JRC Period: 15 City: Lawrence Posted: 4 Raw Count: 6427 County: Douglas AADT Factor: 1 AADT Count: 6,427 Date And Period Average Roadway Time Range Volume Speed Temperature Roadway Surface Wet/Dry Wed,Dec/11/213 [5:3-5:45] MPH [5:45-6:] MPH [6:-6:15] MPH [6:15-6:3] 4 35 MPH [6:3-6:45] MPH [6:45-7:] MPH [7:-7:15] MPH [7:15-7:3] MPH [7:3-7:45] MPH [7:45-8:] MPH [8:-8:15] MPH [8:15-8:3] MPH [8:3-8:45] MPH 37 F [8:45-9:] MPH 37 F [9:-9:15] MPH 35 F [9:15-9:3] MPH 35 F [9:3-9:45] MPH 35 F [9:45-1:] MPH 33 F [1:-1:15] MPH 31 F [1:15-1:3] MPH 33 F [1:3-1:45] MPH 35 F [1:45-11:] MPH 37 F [11:-11:15] MPH 37 F [11:15-11:3] MPH [11:3-11:45] MPH [11:45-12:] MPH Wed,Dec/11/213 Dec/1/213 12:: PM Dec/11/213 12:: PM MPH MPH Dec/16/213 9:43:38 AM Page: 3
69 Date/Time/Volume/Average Speed/Temperature Report HI-Star ID: 61 Begin: Dec/1/213 12:: PM End: Dec/11/213 12:: PM Street: Iowa St. Lane: NB Outside Hours: 24. State: Ks Oper: JRC Period: 15 City: Lawrence Posted: 4 Raw Count: 7988 County: Douglas AADT Factor: 1 AADT Count: 7,988 Date And Period Average Roadway Time Range Volume Speed Temperature Roadway Surface Wet/Dry Tue,Dec/1/213 [12:-12:15] MPH 44 F [12:15-12:3] MPH 46 F [12:3-12:45] MPH 46 F [12:45-13:] MPH 46 F [13:-13:15] MPH 46 F [13:15-13:3] MPH 46 F [13:3-13:45] MPH 48 F [13:45-14:] MPH 46 F [14:-14:15] MPH 48 F [14:15-14:3] MPH 46 F [14:3-14:45] MPH 46 F [14:45-15:] MPH 46 F [15:-15:15] MPH 42 F [15:15-15:3] MPH [15:3-15:45] MPH [15:45-16:] MPH [16:-16:15] MPH [16:15-16:3] MPH 37 F [16:3-16:45] MPH 37 F [16:45-17:] MPH 35 F [17:-17:15] MPH 35 F [17:15-17:3] MPH 33 F [17:3-17:45] MPH 33 F [17:45-18:] MPH 33 F [18:-18:15] MPH 31 F [18:15-18:3] MPH 31 F [18:3-18:45] MPH 31 F [18:45-19:] MPH 31 F [19:-19:15] MPH 33 F [19:15-19:3] MPH 33 F [19:3-19:45] MPH 33 F [19:45-2:] MPH 33 F [2:-2:15] MPH 35 F [2:15-2:3] MPH 35 F [2:3-2:45] MPH 35 F [2:45-21:] MPH 37 F Dec/16/213 9:44:13 AM Page: 1
70 Date/Time/Volume/Average Speed/Temperature Report HI-Star ID: 61 Begin: Dec/1/213 12:: PM End: Dec/11/213 12:: PM Street: Iowa St. Lane: NB Outside Hours: 24. State: Ks Oper: JRC Period: 15 City: Lawrence Posted: 4 Raw Count: 7988 County: Douglas AADT Factor: 1 AADT Count: 7,988 Date And Period Average Roadway Time Range Volume Speed Temperature Roadway Surface Wet/Dry Tue,Dec/1/213 [21:-21:15] MPH 37 F [21:15-21:3] MPH 37 F [21:3-21:45] MPH 37 F [21:45-22:] MPH 37 F [22:-22:15] MPH 37 F [22:15-22:3] MPH 37 F [22:3-22:45] MPH 37 F [22:45-23:] MPH 37 F [23:-23:15] MPH [23:15-23:3] MPH [23:3-23:45] 3 36 MPH [23:45-:] MPH Tue,Dec/1/ MPH Wed,Dec/11/213 [:-:15] MPH [:15-:3] MPH [:3-:45] 2 36 MPH [:45-1:] MPH [1:-1:15] 11 4 MPH [1:15-1:3] MPH [1:3-1:45] 7 33 MPH [1:45-2:] MPH [2:-2:15] 6 33 MPH 42 F [2:15-2:3] 8 38 MPH [2:3-2:45] MPH [2:45-3:] 6 35 MPH [3:-3:15] 12 4 MPH [3:15-3:3] MPH [3:3-3:45] MPH [3:45-4:] MPH [4:-4:15] 2 25 MPH [4:15-4:3] 12 4 MPH [4:3-4:45] MPH [4:45-5:] MPH [5:-5:15] MPH [5:15-5:3] MPH Dec/16/213 9:44:13 AM Page: 2
71 Date/Time/Volume/Average Speed/Temperature Report HI-Star ID: 61 Begin: Dec/1/213 12:: PM End: Dec/11/213 12:: PM Street: Iowa St. Lane: NB Outside Hours: 24. State: Ks Oper: JRC Period: 15 City: Lawrence Posted: 4 Raw Count: 7988 County: Douglas AADT Factor: 1 AADT Count: 7,988 Date And Period Average Roadway Time Range Volume Speed Temperature Roadway Surface Wet/Dry Wed,Dec/11/213 [5:3-5:45] 5 37 MPH 37 F [5:45-6:] 5 36 MPH 37 F [6:-6:15] MPH [6:15-6:3] MPH [6:3-6:45] MPH [6:45-7:] MPH [7:-7:15] MPH [7:15-7:3] MPH [7:3-7:45] MPH [7:45-8:] MPH [8:-8:15] MPH [8:15-8:3] MPH [8:3-8:45] MPH 37 F [8:45-9:] MPH 37 F [9:-9:15] MPH 35 F [9:15-9:3] MPH 35 F [9:3-9:45] MPH 33 F [9:45-1:] MPH 31 F [1:-1:15] MPH 33 F [1:15-1:3] MPH 35 F [1:3-1:45] MPH 37 F [1:45-11:] MPH 37 F [11:-11:15] MPH [11:15-11:3] MPH [11:3-11:45] MPH 42 F [11:45-12:] MPH 42 F Wed,Dec/11/213 Dec/1/213 12:: PM Dec/11/213 12:: PM MPH MPH Dec/16/213 9:44:13 AM Page: 3
72 Date/Time/Volume/Average Speed/Temperature Report HI-Star ID: 697 Begin: Dec/1/213 12:: PM End: Dec/11/213 12:: PM Street: Iowa St. Lane: SB Inside Hours: 24. State: Ks Oper: JRC Period: 15 City: Lawrence Posted: 4 Raw Count: 7817 County: Douglas AADT Factor: 1 AADT Count: 7,817 Date And Period Average Roadway Time Range Volume Speed Temperature Roadway Surface Wet/Dry Tue,Dec/1/213 [12:-12:15] MPH 44 F [12:15-12:3] MPH 44 F [12:3-12:45] MPH 46 F [12:45-13:] MPH 46 F [13:-13:15] MPH 46 F [13:15-13:3] MPH 48 F [13:3-13:45] MPH 48 F [13:45-14:] MPH 48 F [14:-14:15] MPH 48 F [14:15-14:3] MPH 48 F [14:3-14:45] MPH 46 F [14:45-15:] MPH 46 F [15:-15:15] MPH 44 F [15:15-15:3] MPH [15:3-15:45] MPH [15:45-16:] MPH [16:-16:15] MPH [16:15-16:3] MPH 37 F [16:3-16:45] MPH 37 F [16:45-17:] MPH 35 F [17:-17:15] MPH 35 F [17:15-17:3] MPH 35 F [17:3-17:45] MPH 33 F [17:45-18:] MPH 33 F [18:-18:15] MPH 33 F [18:15-18:3] MPH 31 F [18:3-18:45] MPH 31 F [18:45-19:] MPH 31 F [19:-19:15] MPH 31 F [19:15-19:3] MPH 33 F [19:3-19:45] MPH 33 F [19:45-2:] 6 44 MPH 33 F [2:-2:15] MPH 33 F [2:15-2:3] MPH 35 F [2:3-2:45] MPH 35 F [2:45-21:] MPH 35 F Dec/16/213 9:46:5 AM Page: 1
73 Date/Time/Volume/Average Speed/Temperature Report HI-Star ID: 697 Begin: Dec/1/213 12:: PM End: Dec/11/213 12:: PM Street: Iowa St. Lane: SB Inside Hours: 24. State: Ks Oper: JRC Period: 15 City: Lawrence Posted: 4 Raw Count: 7817 County: Douglas AADT Factor: 1 AADT Count: 7,817 Date And Period Average Roadway Time Range Volume Speed Temperature Roadway Surface Wet/Dry Tue,Dec/1/213 [21:-21:15] MPH 35 F [21:15-21:3] MPH 35 F [21:3-21:45] MPH 35 F [21:45-22:] MPH 35 F [22:-22:15] MPH 37 F [22:15-22:3] MPH 37 F [22:3-22:45] MPH 37 F [22:45-23:] MPH 37 F [23:-23:15] MPH 37 F [23:15-23:3] MPH 37 F [23:3-23:45] MPH [23:45-:] MPH Tue,Dec/1/ MPH 38 F Wed,Dec/11/213 [:-:15] MPH [:15-:3] MPH [:3-:45] MPH [:45-1:] MPH [1:-1:15] MPH [1:15-1:3] 4 48 MPH [1:3-1:45] MPH [1:45-2:] 1 48 MPH [2:-2:15] MPH [2:15-2:3] 7 43 MPH [2:3-2:45] MPH [2:45-3:] MPH [3:-3:15] 8 44 MPH [3:15-3:3] MPH [3:3-3:45] 6 42 MPH [3:45-4:] 6 45 MPH [4:-4:15] 6 48 MPH [4:15-4:3] 9 48 MPH [4:3-4:45] 1 49 MPH [4:45-5:] MPH [5:-5:15] MPH [5:15-5:3] MPH Dec/16/213 9:46:5 AM Page: 2
74 Date/Time/Volume/Average Speed/Temperature Report HI-Star ID: 697 Begin: Dec/1/213 12:: PM End: Dec/11/213 12:: PM Street: Iowa St. Lane: SB Inside Hours: 24. State: Ks Oper: JRC Period: 15 City: Lawrence Posted: 4 Raw Count: 7817 County: Douglas AADT Factor: 1 AADT Count: 7,817 Date And Period Average Roadway Time Range Volume Speed Temperature Roadway Surface Wet/Dry Wed,Dec/11/213 [5:3-5:45] MPH [5:45-6:] MPH [6:-6:15] MPH [6:15-6:3] MPH [6:3-6:45] MPH [6:45-7:] MPH [7:-7:15] MPH [7:15-7:3] MPH [7:3-7:45] MPH [7:45-8:] MPH [8:-8:15] 9 44 MPH [8:15-8:3] MPH [8:3-8:45] MPH 37 F [8:45-9:] MPH 37 F [9:-9:15] MPH 35 F [9:15-9:3] MPH 35 F [9:3-9:45] MPH 33 F [9:45-1:] MPH 31 F [1:-1:15] MPH 33 F [1:15-1:3] MPH 35 F [1:3-1:45] 9 43 MPH 35 F [1:45-11:] MPH 37 F [11:-11:15] MPH 37 F [11:15-11:3] MPH [11:3-11:45] MPH [11:45-12:] MPH Wed,Dec/11/213 Dec/1/213 12:: PM Dec/11/213 12:: PM MPH MPH 38 F Dec/16/213 9:46:5 AM Page: 3
75 OLSSON ASSOCIATES 731 West 133rd Street Overland Park, KS Page 1 Site Code: Station ID: 21st Street EB Latitude: '. Undefined Start 1-Dec-13 Time Tue Channel 1 12: AM * 12:15 * 12:3 * 12:45 * 1: * 1:15 * 1:3 * 1:45 * 2: * 2:15 * 2:3 * 2:45 * 3: * 3:15 * 3:3 * 3:45 * 4: * 4:15 * 4:3 * 4:45 * 5: * 5:15 * 5:3 * 5:45 * 6: * 6:15 * 6:3 * 6:45 * 7: * 7:15 * 7:3 * 7:45 * 8: * 8:15 * 8:3 * 8:45 * 9: * 9:15 * 9:3 * 9:45 * 1: * 1:15 * 1:3 * 1:45 * 11: * 11:15 * 11:3 * 11:45 * Total Peak Vol P.H.F.
76 OLSSON ASSOCIATES 731 West 133rd Street Overland Park, KS Page 2 Site Code: Station ID: 21st Street EB Latitude: '. Undefined Start 1-Dec-13 Time Tue Channel 1 12: PM 34 12: : : : 12 1:15 9 1:3 15 1: : 3 2:15 8 2:3 9 2: : 1 3: :3 13 3: : 24 4: :3 21 4: : 39 5: :3 22 5: : 14 6: :3 8 6:45 8 7: 11 7:15 6 7:3 4 7:45 8: 4 8:15 3 8:3 4 8:45 3 9: 9 9:15 5 9:3 5 9:45 6 1: 3 1:15 1 1:3 2 1:45 11: 11:15 11:3 2 11:45 2 Total 494 Peak - 17: Vol P.H.F..673
77 OLSSON ASSOCIATES 731 West 133rd Street Overland Park, KS Page 3 Site Code: Station ID: 21st Street EB Latitude: '. Undefined Start 11-Dec-13 Time Wed Channel 1 12: AM 1 12:15 12:3 1 12:45 1 1: 1:15 1:3 1:45 2: 1 2:15 2 2:3 2:45 3: 3:15 1 3:3 3:45 1 4: 1 4:15 4:3 4:45 5: 5:15 2 5:3 5:45 6: 1 6:15 1 6:3 6:45 1 7: 5 7:15 3 7:3 2 7:45 4 8: 6 8:15 4 8:3 3 8:45 6 9: 3 9:15 3 9:3 1 9:45 8 1: 6 1:15 6 1:3 9 1: : 6 11: : :45 28 Total 146 Peak - 11: Vol P.H.F..536
78 OLSSON ASSOCIATES 731 West 133rd Street Overland Park, KS Page 4 Site Code: Station ID: 21st Street EB Latitude: '. Undefined Start 11-Dec-13 Time Wed Channel 1 12: PM 49 12:15 * 12:3 * 12:45 * 1: * 1:15 * 1:3 * 1:45 * 2: * 2:15 * 2:3 * 2:45 * 3: * 3:15 * 3:3 * 3:45 * 4: * 4:15 * 4:3 * 4:45 * 5: * 5:15 * 5:3 * 5:45 * 6: * 6:15 * 6:3 * 6:45 * 7: * 7:15 * 7:3 * 7:45 * 8: * 8:15 * 8:3 * 8:45 * 9: * 9:15 * 9:3 * 9:45 * 1: * 1:15 * 1:3 * 1:45 * 11: * 11:15 * 11:3 * 11:45 * Total 49 Peak Vol P.H.F. Grand Total 689 Percent ADT ADT 2 AADT 2
79 Date/Time/Volume/Average Speed/Temperature Report HI-Star ID: 5899 Begin: Dec/1/213 12:: PM End: Dec/11/213 12:: PM Street: 21ST Street Lane: WB Hours: 24. State: Ks Oper: JRC Period: 15 City: Lawrence Posted: 35 Raw Count: 651 County: Douglas AADT Factor: 1 AADT Count: 651 Date And Period Average Roadway Time Range Volume Speed Temperature Roadway Surface Wet/Dry Tue,Dec/1/213 [12:-12:15] MPH 6 F [12:15-12:3] 3 47 MPH 62 F [12:3-12:45] MPH 6 F [12:45-13:] 4 MPH 58 F [13:-13:15] 4 28 MPH 56 F [13:15-13:3] MPH 54 F [13:3-13:45] MPH 54 F [13:45-14:] 9 25 MPH 54 F [14:-14:15] 7 29 MPH 54 F [14:15-14:3] 7 33 MPH 52 F [14:3-14:45] 1 27 MPH 52 F [14:45-15:] 9 29 MPH 5 F [15:-15:15] MPH 48 F [15:15-15:3] MPH 46 F [15:3-15:45] MPH 44 F [15:45-16:] MPH 42 F [16:-16:15] MPH [16:15-16:3] MPH [16:3-16:45] 5 29 MPH 37 F [16:45-17:] MPH 33 F [17:-17:15] MPH 33 F [17:15-17:3] 24 3 MPH 31 F [17:3-17:45] MPH 33 F [17:45-18:] MPH 33 F [18:-18:15] MPH 33 F [18:15-18:3] MPH 35 F [18:3-18:45] 11 2 MPH 35 F [18:45-19:] 1 29 MPH 35 F [19:-19:15] 8 27 MPH 37 F [19:15-19:3] 3 27 MPH 37 F [19:3-19:45] 3 29 MPH 37 F [19:45-2:] 3 26 MPH 37 F [2:-2:15] 7 22 MPH 37 F [2:15-2:3] 9 28 MPH 37 F [2:3-2:45] 8 28 MPH 37 F [2:45-21:] 8 24 MPH Dec/16/213 9:44:43 AM Page: 1
80 Date/Time/Volume/Average Speed/Temperature Report HI-Star ID: 5899 Begin: Dec/1/213 12:: PM End: Dec/11/213 12:: PM Street: 21ST Street Lane: WB Hours: 24. State: Ks Oper: JRC Period: 15 City: Lawrence Posted: 35 Raw Count: 651 County: Douglas AADT Factor: 1 AADT Count: 651 Date And Period Average Roadway Time Range Volume Speed Temperature Roadway Surface Wet/Dry Tue,Dec/1/213 [21:-21:15] 2 28 MPH [21:15-21:3] 7 27 MPH [21:3-21:45] 5 27 MPH [21:45-22:] 2 23 MPH [22:-22:15] 1 22 MPH [22:15-22:3] 5 24 MPH [22:3-22:45] 1 28 MPH [22:45-23:] 2 28 MPH [23:-23:15] MPH [23:15-23:3] 2 25 MPH [23:3-23:45] 3 26 MPH [23:45-:] 3 24 MPH Tue,Dec/1/ MPH 42 F Wed,Dec/11/213 [:-:15] 3 23 MPH [:15-:3] MPH [:3-:45] 1 22 MPH [:45-1:] 1 MPH 42 F [1:-1:15] 2 33 MPH 42 F [1:15-1:3] 2 23 MPH 42 F [1:3-1:45] MPH 42 F [1:45-2:] MPH 42 F [2:-2:15] MPH 42 F [2:15-2:3] MPH 42 F [2:3-2:45] MPH 42 F [2:45-3:] 1 22 MPH 42 F [3:-3:15] MPH 42 F [3:15-3:3] MPH 42 F [3:3-3:45] MPH 42 F [3:45-4:] MPH 42 F [4:-4:15] 1 32 MPH 42 F [4:15-4:3] MPH 42 F [4:3-4:45] 1 22 MPH [4:45-5:] 2 28 MPH [5:-5:15] 2 27 MPH [5:15-5:3] 1 22 MPH Dec/16/213 9:44:43 AM Page: 2
81 Date/Time/Volume/Average Speed/Temperature Report HI-Star ID: 5899 Begin: Dec/1/213 12:: PM End: Dec/11/213 12:: PM Street: 21ST Street Lane: WB Hours: 24. State: Ks Oper: JRC Period: 15 City: Lawrence Posted: 35 Raw Count: 651 County: Douglas AADT Factor: 1 AADT Count: 651 Date And Period Average Roadway Time Range Volume Speed Temperature Roadway Surface Wet/Dry Wed,Dec/11/213 [5:3-5:45] 1 18 MPH [5:45-6:] 2 23 MPH [6:-6:15] 1 28 MPH [6:15-6:3] 3 21 MPH [6:3-6:45] 2 25 MPH [6:45-7:] 1 42 MPH [7:-7:15] 5 26 MPH [7:15-7:3] MPH [7:3-7:45] 12 3 MPH [7:45-8:] MPH [8:-8:15] MPH [8:15-8:3] 7 3 MPH [8:3-8:45] 13 3 MPH [8:45-9:] MPH 37 F [9:-9:15] 4 3 MPH 37 F [9:15-9:3] 6 25 MPH 37 F [9:3-9:45] 8 31 MPH 35 F [9:45-1:] 8 27 MPH 33 F [1:-1:15] 4 26 MPH 31 F [1:15-1:3] 3 26 MPH 33 F [1:3-1:45] 7 26 MPH 37 F [1:45-11:] 2 25 MPH [11:-11:15] 4 3 MPH [11:15-11:3] 7 27 MPH [11:3-11:45] 9 3 MPH 42 F [11:45-12:] 4 33 MPH 44 F Wed,Dec/11/213 Dec/1/213 12:: PM Dec/11/213 12:: PM MPH 4 F MPH Dec/16/213 9:44:43 AM Page: 3
82 Traffic Counts 21 st Street (TMC)
83 OLSSON ASSOCIATES 731 WEST 133RD STREET SUITE 2 OVERLAND PARK, KANSAS st St. & Iowa AM & PM Count Taylor & Friend File Name : Not Named 8 Site Code : Start Date : 12/11/213 Page No : 1 Groups Printed- Unshifted - Bank 1 IOWA 21ST IOWA 21ST From North From East From South From West Start Time Right Thru Left Peds App. Total Right Thru Left Peds App. Total Right Thru Left Peds App. Total Right Thru Left Peds App. Total Int. Total 4: PM :15 PM :3 PM :45 PM Total : PM :15 PM :3 PM :45 PM Total *** BREAK *** 7: AM :15 AM :3 AM :45 AM Total : AM :15 AM :3 AM :45 AM Total Grand Total Apprch % Total % Unshifted % Unshifted Bank 1 % Bank 1
84 OLSSON ASSOCIATES 731 WEST 133RD STREET SUITE 2 OVERLAND PARK, KANSAS st St. & Iowa AM & PM Count Taylor & Friend File Name : Not Named 8 Site Code : Start Date : 12/11/213 Page No : 2 IOWA Out In Total Right Thru Left Peds 21ST Out In Total Left Thru Right Peds 12/11/213 4: PM 12/12/213 8:45 AM Unshifted Bank 1 North Right Thru Left Peds Out In Total ST Left Thru Right Peds Out In Total IOWA
85 OLSSON ASSOCIATES 731 WEST 133RD STREET SUITE 2 OVERLAND PARK, KANSAS st St. & Iowa AM & PM Count Taylor & Friend File Name : Not Named 8 Site Code : Start Date : 12/11/213 Page No : 3 IOWA From North 21ST From East IOWA From South 21ST From West Start Time Right Thru Left Peds App. Total Right Thru Left Peds App. Total Right Thru Left Peds App. Total Right Thru Left Peds App. Total Int. Total Peak Hour Analysis From 4: PM to 5:45 PM - Peak 1 of 1 Peak Hour for Entire Intersection Begins at 5: PM 5: PM :15 PM :3 PM :45 PM Total Volume % App. Total PHF Peak Hour Analysis From 4: PM to 5:45 PM - Peak 1 of 1 Peak Hour for Each Approach Begins at: 5: PM 5: PM 4:45 PM 4:3 PM + mins mins mins mins Total Volume % App. Total PHF
86 OLSSON ASSOCIATES 731 WEST 133RD STREET SUITE 2 OVERLAND PARK, KANSAS ST & OUSDAHL AM COUNT TAYLOR File Name : 21ST & OUSDAHL AM Site Code : Start Date : 2/11/214 Page No : 1 Groups Printed- Unshifted - Bank 1 OUSDAHL 21ST OUSDAHL 21ST From North From East From South From West Start Time Right Thru Left Peds App. Total Right Thru Left Peds App. Total Right Thru Left Peds App. Total Right Thru Left Peds App. Total Int. Total 7: AM :15 AM :3 AM :45 AM Total : AM :15 AM :3 AM :45 AM Total Grand Total Apprch % Total % Unshifted % Unshifted Bank 1 % Bank 1 OUSDAHL Out In Total Right Thru 8 8 Left Peds 21ST Out In Total Left 143 Thru 43 Right Peds 2/11/214 7: AM 2/11/214 8:45 AM Unshifted Bank 1 North Right Thru Left Peds Out In Total ST Left Thru Right Peds Out In Total OUSDAHL
87 OLSSON ASSOCIATES 731 WEST 133RD STREET SUITE 2 OVERLAND PARK, KANSAS ST & OUSDAHL AM COUNT TAYLOR File Name : 21ST & OUSDAHL AM Site Code : Start Date : 2/11/214 Page No : 2 OUSDAHL From North 21ST From East OUSDAHL From South 21ST From West Start Time Right Thru Left Peds App. Total Right Thru Left Peds App. Total Right Thru Left Peds App. Total Right Thru Left Peds App. Total Int. Total Peak Hour Analysis From 7: AM to 8:45 AM - Peak 1 of 1 Peak Hour for Entire Intersection Begins at 7:3 AM 7:3 AM :45 AM : AM :15 AM Total Volume % App. Total PHF Peak Hour Analysis From 7: AM to 8:45 AM - Peak 1 of 1 Peak Hour for Each Approach Begins at: 7:45 AM 7:45 AM 7:15 AM 7: AM + mins mins mins mins Total Volume % App. Total PHF
88 OLSSON ASSOCIATES 731 WEST 133RD STREET SUITE 2 OVERLAND PARK, KANSAS ST & OUSDAHL PM COUNT TAYOLR File Name : 21ST & OUSDAHL PM Site Code : Start Date : 2/6/214 Page No : 1 Groups Printed- Unshifted - Bank 1 OUSDAHL 21ST OUSDAHL 21ST From North From East From South From West Start Time Right Thru Left Peds App. Total Right Thru Left Peds App. Total Right Thru Left Peds App. Total Right Thru Left Peds App. Total Int. Total 4: PM :15 PM :3 PM :45 PM Total : PM :15 PM :3 PM :45 PM Total Grand Total Apprch % Total % Unshifted % Unshifted Bank 1 % Bank 1 OUSDAHL Out In Total Right Thru 5 5 Left Peds 21ST Out In Total Left 96 Thru 31 Right Peds 2/6/214 4: PM 2/6/214 5:45 PM Unshifted Bank 1 North Right Thru Left Peds Out In Total ST Left Thru Right Peds Out In Total OUSDAHL
89 OLSSON ASSOCIATES 731 WEST 133RD STREET SUITE 2 OVERLAND PARK, KANSAS ST & OUSDAHL PM COUNT TAYOLR File Name : 21ST & OUSDAHL PM Site Code : Start Date : 2/6/214 Page No : 2 OUSDAHL From North 21ST From East OUSDAHL From South 21ST From West Start Time Right Thru Left Peds App. Total Right Thru Left Peds App. Total Right Thru Left Peds App. Total Right Thru Left Peds App. Total Int. Total Peak Hour Analysis From 4: PM to 5:45 PM - Peak 1 of 1 Peak Hour for Entire Intersection Begins at 5: PM 5: PM :15 PM :3 PM :45 PM Total Volume % App. Total PHF Peak Hour Analysis From 4: PM to 5:45 PM - Peak 1 of 1 Peak Hour for Each Approach Begins at: 4: PM 5: PM 5: PM 5: PM + mins mins mins mins Total Volume % App. Total PHF
90 OLSSON ASSOCIATES 731 WEST 133RD STREET SUITE 2 OVERLAND PARK, KANSAS ST & NAISMITH AM COUNT TAYOLR File Name : 21ST & NAISMITH AM Site Code : Start Date : 2/11/214 Page No : 1 Groups Printed- Unshifted - Bank 1 NAISMITH 21ST NAISMITH 21ST From North From East From South From West Start Time Right Thru Left Peds App. Total Right Thru Left Peds App. Total Right Thru Left Peds App. Total Right Thru Left Peds App. Total Int. Total 7: AM :15 AM :3 AM :45 AM Total : AM :15 AM :3 AM :45 AM Total Grand Total Apprch % Total % Unshifted % Unshifted Bank 1 % Bank 1 NAISMITH Out In Total Right Thru Left Peds 21ST Out In Total Left 183 Thru 12 Right Peds 2/11/214 7: AM 2/11/214 8:45 AM Unshifted Bank 1 North Right Thru Left Peds Out In Total ST Left Thru Right Peds Out In Total NAISMITH
91 OLSSON ASSOCIATES 731 WEST 133RD STREET SUITE 2 OVERLAND PARK, KANSAS ST & NAISMITH AM COUNT TAYOLR File Name : 21ST & NAISMITH AM Site Code : Start Date : 2/11/214 Page No : 2 NAISMITH From North 21ST From East NAISMITH From South 21ST From West Start Time Right Thru Left Peds App. Total Right Thru Left Peds App. Total Right Thru Left Peds App. Total Right Thru Left Peds App. Total Int. Total Peak Hour Analysis From 7: AM to 8:45 AM - Peak 1 of 1 Peak Hour for Entire Intersection Begins at 7:3 AM 7:3 AM :45 AM : AM :15 AM Total Volume % App. Total PHF Peak Hour Analysis From 7: AM to 8:45 AM - Peak 1 of 1 Peak Hour for Each Approach Begins at: 7:3 AM 7:3 AM 7:45 AM 7:15 AM + mins mins mins mins Total Volume % App. Total PHF 1.
92 OLSSON ASSOCIATES 731 WEST 133RD STREET SUITE 2 OVERLAND PARK, KANSAS ST & NAISMITH PM COUNT TAYLOR File Name : 21ST & NAISMITH PM Site Code : Start Date : 1/3/214 Page No : 1 Groups Printed- Unshifted - Bank 1 NAISMITH 21ST NAISMITH 21ST From North From East From South From West Start Time Right Thru Left Peds App. Total Right Thru Left Peds App. Total Right Thru Left Peds App. Total Right Thru Left Peds App. Total Int. Total 4: PM :15 PM :3 PM :45 PM Total : PM :15 PM :3 PM :45 PM Total Grand Total Apprch % Total % Unshifted % Unshifted Bank 1 % Bank 1 NAISMITH Out In Total Right Thru Left Peds 21ST Out In Total Left 115 Thru 43 Right Peds 1/3/214 4: PM 1/3/214 5:45 PM Unshifted Bank 1 North Right Thru Left Peds Out In Total ST Left Thru Right Peds Out In Total NAISMITH
93 OLSSON ASSOCIATES 731 WEST 133RD STREET SUITE 2 OVERLAND PARK, KANSAS ST & NAISMITH PM COUNT TAYLOR File Name : 21ST & NAISMITH PM Site Code : Start Date : 1/3/214 Page No : 2 NAISMITH From North 21ST From East NAISMITH From South 21ST From West Start Time Right Thru Left Peds App. Total Right Thru Left Peds App. Total Right Thru Left Peds App. Total Right Thru Left Peds App. Total Int. Total Peak Hour Analysis From 4: PM to 5:45 PM - Peak 1 of 1 Peak Hour for Entire Intersection Begins at 5: PM 5: PM :15 PM :3 PM :45 PM Total Volume % App. Total PHF Peak Hour Analysis From 4: PM to 5:45 PM - Peak 1 of 1 Peak Hour for Each Approach Begins at: 5: PM 5: PM 5: PM 4: PM + mins mins mins mins Total Volume % App. Total PHF
94 Existing Signal Warrants
95 TRAFFIC SIGNAL WARRANT ANALYSIS - VOLUME WARRANTS KANSAS DEPARTMENT OF TRANSPORTATION - BUREAU OF TRAFFIC ENGINEERING Major Street : 9th Street Time Count Began : 12: PM Is the intersection in a community with a population less than 1, or are speeds greater than 4 mph? no Minor Street : Rockledge Road Date : 12/1/13 Major Street Minor Street City : Lawrence Day of Week of Count: Tuesday Adjustment factor for day of week and month of year of count County : Douglas Number of Lanes Warrant #1 - Condition A Warrant #1 - Condition B Warrant #1 - Combination of Conditions A & B Major Street Minor Street Warrant #2 Warrant #3 -- Time Approach Volumes Approach Volumes Percent of Warrant Percent of Warrant Warrant Percent Warrant Percent -- Volumes Met Volumes Met of of Beginning EAST WEST Total NORTH SOUTH Major Minor Major Minor Volume Warrant Volume Warrant : m For this warrant vehicle ***** ***** 1: volume requirements for ***** ***** 2: conditions A and B are ***** ***** reduced to 3: am % Factor ***** ***** 4: ***** ***** 5: ***** ***** 6: am ***** ***** NOTE: Conditions A and 7: B SHALL BOTH meet a 8: minimum of 8 hours However, the 8 hours 9: am satisfying condition A ***** ***** 1: NEED NOT be the same ***** ***** 11: as the 8 hours satisfying ***** condition B. 12: n ***** 1: : : pm : : : pm : ***** ***** 8: ***** ***** 9: pm ***** ***** 1: ***** ***** 11: ***** ***** 24HR Total Warranting Volumes Warranting Volumes Warranting Volumes Warranting Volumes From MUTCD Fig. 4C-1 From MUTCD Fig. 4C-3 Note: Total of both approaches. Condition A B The HIGHEST approach only. Hours Met Hours Met 1 Hours Met 3 Hours Met Hours Met NOTE: Warrant Met No Warrant Met No Warrant Met No Warrant Met No Warrant Met Basic minimum hourly volumes (unreduced) ***** Major Street volume is so low that no No NOTE: No adjust ment made Minor Street warrant exists
96 TRAFFIC SIGNAL WARRANT ANALYSIS - VOLUME WARRANTS KANSAS DEPARTMENT OF TRANSPORTATION - BUREAU OF TRAFFIC ENGINEERING Major Street : Iowa Street Time Count Began : 12: PM Is the intersection in a community with a population less than 1, or are speeds greater than 4 mph? no Minor Street : 21st Street Date : 12/1/13 Major Street Minor Street City : Lawrence Day of Week of Count: Tuesday Adjustment factor for day of week and month of year of count County : Douglas Number of Lanes Warrant #1 - Condition A Warrant #1 - Condition B Warrant #1 - Combination of Conditions A & B Major Street Minor Street Warrant #2 Warrant #3 -- Time Approach Volumes Approach Volumes Percent of Warrant Percent of Warrant Warrant Percent Warrant Percent -- Volumes Met Volumes Met of of Beginning NORTH SOUTH Total EAST WEST Major Minor Major Minor Volume Warrant Volume Warrant : m For this warrant vehicle ***** ***** 1: volume requirements for ***** ***** 2: conditions A and B are ***** ***** reduced to 3: am % Factor ***** ***** 4: ***** ***** 5: ***** ***** 6: am NOTE: Conditions A and 7: B SHALL BOTH meet a 8: minimum of 8 hours However, the 8 hours 9: am satisfying condition A : NEED NOT be the same : as the 8 hours satisfying condition B. 12: n : : : pm : : : pm : : : pm : : ***** 24HR Total Warranting Volumes Warranting Volumes Warranting Volumes Warranting Volumes From MUTCD Fig. 4C-1 From MUTCD Fig. 4C-3 Note: Total of both approaches. Condition A B The HIGHEST approach only. Hours Met Hours Met 3 Hours Met 5 Hours Met 2 Hours Met 1 NOTE: Warrant Met No Warrant Met No Warrant Met No Warrant Met No Warrant Met Basic minimum hourly volumes (unreduced) ***** Major Street volume is so low that no Yes NOTE: No adjust ment made Minor Street warrant exists
97 Existing Capacity Analysis 9 th Street
98 Queues 21: Iowa St & 9th St 2/13/214 Lane Group EBL EBT EBR WBL WBT WBR NBL NBT SBL SBT Lane Group Flow (vph) v/c Ratio Control Delay Queue Delay Total Delay Queue Length 5th (ft) Queue Length 95th (ft) Internal Link Dist (ft) Turn Bay Length (ft) Base Capacity (vph) Starvation Cap Reductn Spillback Cap Reductn Storage Cap Reductn Reduced v/c Ratio Intersection Summary 9th St & Rockledge Rd 7:3 pm 12/1/213 Lawrence Transit Center Synchro 8 Report JMS Page 1
99 HCM Signalized Intersection Capacity Analysis 21: Iowa St & 9th St 2/13/214 Movement EBL EBT EBR WBL WBT WBR NBL NBT NBR SBL SBT SBR Lane Configurations Volume (vph) Ideal Flow (vphpl) Total Lost time (s) Lane Util. Factor Frt Flt Protected Satd. Flow (prot) Flt Permitted Satd. Flow (perm) Peak-hour factor, PHF Adj. Flow (vph) RTOR Reduction (vph) Lane Group Flow (vph) Turn Type pm+pt NA Perm pm+pt NA custom pm+pt NA pm+pt NA Protected Phases Permitted Phases Actuated Green, G (s) Effective Green, g (s) Actuated g/c Ratio Clearance Time (s) Vehicle Extension (s) Lane Grp Cap (vph) v/s Ratio Prot.1.9 c c.6 c.24 v/s Ratio Perm.5.1 c v/c Ratio Uniform Delay, d Progression Factor Incremental Delay, d Delay (s) Level of Service C C C B C C C D C C Approach Delay (s) Approach LOS C C D C Intersection Summary HCM 2 Control Delay 3.6 HCM 2 Level of Service C HCM 2 Volume to Capacity ratio.45 Actuated Cycle Length (s) 12. Sum of lost time (s) 19.2 Intersection Capacity Utilization 54.9% ICU Level of Service A Analysis Period (min) 15 c Critical Lane Group 9th St & Rockledge Rd 7:3 pm 12/1/213 Lawrence Transit Center Synchro 8 Report JMS Page 2
100 Queues 21: Iowa St & 9th St 2/13/214 Lane Group EBL EBT EBR WBL WBT WBR NBL NBT SBL SBT Lane Group Flow (vph) v/c Ratio Control Delay Queue Delay Total Delay Queue Length 5th (ft) Queue Length 95th (ft) Internal Link Dist (ft) Turn Bay Length (ft) Base Capacity (vph) Starvation Cap Reductn Spillback Cap Reductn Storage Cap Reductn Reduced v/c Ratio Intersection Summary 9th St & Rockledge Rd 5: pm 12/1/213 Lawrence Transit Center Synchro 8 Report JMS Page 1
101 HCM Signalized Intersection Capacity Analysis 21: Iowa St & 9th St 2/13/214 Movement EBL EBT EBR WBL WBT WBR NBL NBT NBR SBL SBT SBR Lane Configurations Volume (vph) Ideal Flow (vphpl) Total Lost time (s) Lane Util. Factor Frt Flt Protected Satd. Flow (prot) Flt Permitted Satd. Flow (perm) Peak-hour factor, PHF Adj. Flow (vph) RTOR Reduction (vph) Lane Group Flow (vph) Turn Type pm+pt NA custom pm+pt NA custom pm+pt NA pm+pt NA Protected Phases Permitted Phases Actuated Green, G (s) Effective Green, g (s) Actuated g/c Ratio Clearance Time (s) Vehicle Extension (s) Lane Grp Cap (vph) v/s Ratio Prot.2.15 c c.12.3 v/s Ratio Perm.11.1 c c.28 v/c Ratio Uniform Delay, d Progression Factor Incremental Delay, d Delay (s) Level of Service C D D C D C D E E E Approach Delay (s) Approach LOS D D E E Intersection Summary HCM 2 Control Delay 5.4 HCM 2 Level of Service D HCM 2 Volume to Capacity ratio.79 Actuated Cycle Length (s) 15. Sum of lost time (s) 22. Intersection Capacity Utilization 79.5% ICU Level of Service D Analysis Period (min) 15 c Critical Lane Group 9th St & Rockledge Rd 5: pm 12/1/213 Lawrence Transit Center Synchro 8 Report JMS Page 2
102 Two-Way Stop Control file:///c:/users/jsturgess/appdata/local/temp/u2k895b.tmp Page 1 of 1 2/13/214 General Information Analyst JMS Agency/Co. Olsson Associates Date Performed 12/1/213 Analysis Time Period 7:3 am TWO-WAY STOP CONTROL SUMMARY Site Information Intersection Rockledge Rd & 9th St Jurisdiction City of Lawrence Analysis Year Existing Conditions 214 Project Description East/West Street: 9th Street North/South Street: Rockledge Road Intersection Orientation: East-West Study Period (hrs):.25 Vehicle Volumes and Adjustments Major Street Eastbound Westbound Movement L T R L T R Volume (veh/h) Peak-Hour Factor, PHF Hourly Flow Rate, HFR (veh/h) Percent Heavy Vehicles Median Type Undivided RT Channelized Lanes 1 1 Configuration LTR LTR Upstream Signal 1 Minor Street Northbound Southbound Movement L T R L T R Volume (veh/h) Peak-Hour Factor, PHF Hourly Flow Rate, HFR (veh/h) Percent Heavy Vehicles Percent Grade (%) Flared Approach N N Storage RT Channelized Lanes 1 1 Configuration LTR LTR Delay, Queue Length, and Level of Service Approach Eastbound Westbound Northbound Southbound Movement Lane Configuration LTR LTR LTR LTR v (veh/h) C (m) (veh/h) v/c % queue length Control Delay (s/veh) LOS A A C F Approach Delay (s/veh) Approach LOS C F Copyright 21 University of Florida, All Rights Reserved HCS+ TM Version 5.6 Generated: 2/13/214 2:44 PM
103 Two-Way Stop Control file:///c:/users/jsturgess/appdata/local/temp/u2kb668.tmp Page 1 of 1 2/13/214 General Information Analyst JMS Agency/Co. Olsson Associates Date Performed 12/1/213 Analysis Time Period 5: pm TWO-WAY STOP CONTROL SUMMARY Site Information Intersection Rockledge Rd & 9th St Jurisdiction City of Lawrence Analysis Year Existing Conditions 214 Project Description East/West Street: 9th Street North/South Street: Rockledge Road Intersection Orientation: East-West Study Period (hrs):.25 Vehicle Volumes and Adjustments Major Street Eastbound Westbound Movement L T R L T R Volume (veh/h) Peak-Hour Factor, PHF Hourly Flow Rate, HFR (veh/h) Percent Heavy Vehicles Median Type Undivided RT Channelized Lanes 1 1 Configuration LTR LTR Upstream Signal 1 Minor Street Northbound Southbound Movement L T R L T R Volume (veh/h) Peak-Hour Factor, PHF Hourly Flow Rate, HFR (veh/h) Percent Heavy Vehicles Percent Grade (%) Flared Approach N N Storage RT Channelized Lanes 1 1 Configuration LTR LTR Delay, Queue Length, and Level of Service Approach Eastbound Westbound Northbound Southbound Movement Lane Configuration LTR LTR LTR LTR v (veh/h) C (m) (veh/h) v/c % queue length Control Delay (s/veh) LOS A A C F Approach Delay (s/veh) Approach LOS C F Copyright 21 University of Florida, All Rights Reserved HCS+ TM Version 5.6 Generated: 2/13/214 2:45 PM
104 Existing Capacity Analysis 21 st Street
105 Two-Way Stop Control file:///c:/users/jsturgess/appdata/local/temp/u2kbef3.tmp Page 1 of 1 2/12/214 General Information Analyst JMS Agency/Co. Olsson Associates Date Performed 12/11/213 Analysis Time Period 7:3 am TWO-WAY STOP CONTROL SUMMARY Site Information Intersection Iowa St & 21st St Jurisdiction City of Lawrence Analysis Year Existing Conditions 214 Project Description East/West Street: 21st Street North/South Street: Iowa Street Intersection Orientation: North-South Study Period (hrs):.25 Vehicle Volumes and Adjustments Major Street Northbound Southbound Movement L T R L T R Volume (veh/h) Peak-Hour Factor, PHF Hourly Flow Rate, HFR (veh/h) Percent Heavy Vehicles Median Type Undivided RT Channelized Lanes Configuration L T TR L T Upstream Signal Minor Street Eastbound Westbound Movement L T R L T R Volume (veh/h) Peak-Hour Factor, PHF Hourly Flow Rate, HFR (veh/h) Percent Heavy Vehicles Percent Grade (%) Flared Approach N N Storage RT Channelized Lanes Configuration LTR L TR Delay, Queue Length, and Level of Service Approach Northbound Southbound Westbound Eastbound Movement Lane Configuration L L L TR LTR v (veh/h) C (m) (veh/h) v/c % queue length Control Delay (s/veh) LOS B B F F F Approach Delay (s/veh) Approach LOS F Copyright 21 University of Florida, All Rights Reserved HCS+ TM Version 5.6 Generated: 2/12/214 5:16 PM
106 Two-Way Stop Control file:///c:/users/jsturgess/appdata/local/temp/u2kce24.tmp Page 1 of 1 2/12/214 General Information Analyst JMS Agency/Co. Olsson Associates Date Performed 12/1/213 Analysis Time Period 5: pm TWO-WAY STOP CONTROL SUMMARY Site Information Intersection Iowa St & 21st St Jurisdiction City of Lawrence Analysis Year Existing Conditions 214 Project Description East/West Street: 21st Street North/South Street: Iowa Street Intersection Orientation: North-South Study Period (hrs):.25 Vehicle Volumes and Adjustments Major Street Northbound Southbound Movement L T R L T R Volume (veh/h) Peak-Hour Factor, PHF Hourly Flow Rate, HFR (veh/h) Percent Heavy Vehicles Median Type Undivided RT Channelized Lanes Configuration L T TR L T Upstream Signal Minor Street Eastbound Westbound Movement L T R L T R Volume (veh/h) Peak-Hour Factor, PHF Hourly Flow Rate, HFR (veh/h) Percent Heavy Vehicles Percent Grade (%) Flared Approach N N Storage RT Channelized Lanes Configuration LTR L TR Delay, Queue Length, and Level of Service Approach Northbound Southbound Westbound Eastbound Movement Lane Configuration L L L TR LTR v (veh/h) C (m) (veh/h) v/c % queue length Control Delay (s/veh) LOS B B F F F Approach Delay (s/veh) Approach LOS Copyright 21 University of Florida, All Rights Reserved HCS+ TM Version 5.6 Generated: 2/12/214 5:17 PM
107 All-Way Stop Control file:///c:/users/jsturgess/appdata/local/temp/u2k6471.tmp Page 1 of 1 2/12/214 General Information Analyst JMS Agency/Co. Olsson Associates Date Performed 12/11/213 Analysis Time Period 7:3 am Project ID East/West Street: 21st Street ALL-WAY STOP CONTROL ANALYSIS Site Information Intersection Ousdahl Rd & 21st St Jurisdiction City of Lawrence Analysis Year Existing Conditions 214 North/South Street: Ousdahl Road Volume Adjustments and Site Characteristics Approach Eastbound Westbound Movement L T R L T R Volume (veh/h) %Thrus Left Lane Approach Northbound Southbound Movement L T R L T R Volume (veh/h) %Thrus Left Lane Eastbound Westbound Northbound Southbound L1 L2 L1 L2 L1 L2 L1 L2 Configuration LTR LTR LTR LTR PHF Flow Rate (veh/h) % Heavy Vehicles No. Lanes Geometry Group Duration, T.25 Saturation Headway Adjustment Worksheet Prop. Left-Turns Prop. Right-Turns Prop. Heavy Vehicle.... hlt-adj hrt-adj hhv-adj hadj, computed Departure Headway and Service Time hd, initial value (s) x, initial hd, final value (s) x, final value Move-up time, m (s) Service Time, t s (s) Capacity and Level of Service Eastbound Westbound Northbound Southbound L1 L2 L1 L2 L1 L2 L1 L2 Capacity (veh/h) Delay (s/veh) LOS A A A A Approach: Delay (s/veh) LOS A A A A Intersection Delay (s/veh) 9.62 Intersection LOS Copyright 21 University of Florida, All Rights Reserved HCS+ TM Version 5.6 Generated: 2/12/214 5:51 PM A
108 All-Way Stop Control file:///c:/users/jsturgess/appdata/local/temp/u2k8c14.tmp Page 1 of 1 2/12/214 General Information Analyst JMS Agency/Co. Olsson Associates Date Performed 12/1/213 Analysis Time Period 5: pm Project ID East/West Street: 21st Street ALL-WAY STOP CONTROL ANALYSIS Site Information Intersection Ousdahl Rd & 21st St Jurisdiction City of Lawrence Analysis Year Existing Condtions 214 North/South Street: Ousdahl Road Volume Adjustments and Site Characteristics Approach Eastbound Westbound Movement L T R L T R Volume (veh/h) %Thrus Left Lane Approach Northbound Southbound Movement L T R L T R Volume (veh/h) %Thrus Left Lane Eastbound Westbound Northbound Southbound L1 L2 L1 L2 L1 L2 L1 L2 Configuration LTR LTR LTR LTR PHF Flow Rate (veh/h) % Heavy Vehicles No. Lanes Geometry Group Duration, T.25 Saturation Headway Adjustment Worksheet Prop. Left-Turns Prop. Right-Turns Prop. Heavy Vehicle.... hlt-adj hrt-adj hhv-adj hadj, computed Departure Headway and Service Time hd, initial value (s) x, initial hd, final value (s) x, final value Move-up time, m (s) Service Time, t s (s) Capacity and Level of Service Eastbound Westbound Northbound Southbound L1 L2 L1 L2 L1 L2 L1 L2 Capacity (veh/h) Delay (s/veh) LOS A A A A Approach: Delay (s/veh) LOS A A A A Intersection Delay (s/veh) 8.71 Intersection LOS Copyright 21 University of Florida, All Rights Reserved HCS+ TM Version 5.6 Generated: 2/12/214 5:52 PM A
109 Two-Way Stop Control file:///c:/users/jsturgess/appdata/local/temp/u2k3218.tmp Page 1 of 1 2/12/214 General Information Analyst JMS Agency/Co. Olsson Associates Date Performed 12/11/213 Analysis Time Period 7:3 am TWO-WAY STOP CONTROL SUMMARY Site Information Intersection Naismith Dr & 21st St Jurisdiction City of Lawrence Analysis Year Existing Conditions 214 Project Description East/West Street: 21st Street North/South Street: Naismith Drive Intersection Orientation: North-South Study Period (hrs):.25 Vehicle Volumes and Adjustments Major Street Northbound Southbound Movement L T R L T R Volume (veh/h) Peak-Hour Factor, PHF Hourly Flow Rate, HFR (veh/h) Percent Heavy Vehicles Median Type Undivided RT Channelized Lanes 1 2 Configuration L T TR Upstream Signal Minor Street Eastbound Westbound Movement L T R L T R Volume (veh/h) Peak-Hour Factor, PHF Hourly Flow Rate, HFR (veh/h) Percent Heavy Vehicles Percent Grade (%) Flared Approach N N Storage RT Channelized Lanes 1 1 Configuration TR LT Delay, Queue Length, and Level of Service Approach Northbound Southbound Westbound Eastbound Movement Lane Configuration L LT TR v (veh/h) C (m) (veh/h) v/c % queue length Control Delay (s/veh) LOS A B B Approach Delay (s/veh) Approach LOS B B Copyright 21 University of Florida, All Rights Reserved HCS+ TM Version 5.6 Generated: 2/12/214 5:19 PM
110 Two-Way Stop Control file:///c:/users/jsturgess/appdata/local/temp/u2k5287.tmp Page 1 of 1 2/12/214 General Information Analyst JMS Agency/Co. Olsson Associates Date Performed 12/11/213 Analysis Time Period 7:3 am TWO-WAY STOP CONTROL SUMMARY Site Information Intersection Naismith Dr & 21st St Jurisdiction City of Lawrence Analysis Year Existing Conditions 214 Project Description East/West Street: 21st Street North/South Street: Naismith Drive Intersection Orientation: North-South Study Period (hrs):.25 Vehicle Volumes and Adjustments Major Street Northbound Southbound Movement L T R L T R Volume (veh/h) Peak-Hour Factor, PHF Hourly Flow Rate, HFR (veh/h) Percent Heavy Vehicles Median Type Undivided RT Channelized Lanes 1 2 Configuration L T TR Upstream Signal Minor Street Eastbound Westbound Movement L T R L T R Volume (veh/h) Peak-Hour Factor, PHF Hourly Flow Rate, HFR (veh/h) Percent Heavy Vehicles Percent Grade (%) Flared Approach N N Storage RT Channelized Lanes 1 1 Configuration LT TR Delay, Queue Length, and Level of Service Approach Northbound Southbound Westbound Eastbound Movement Lane Configuration L TR LT v (veh/h) C (m) (veh/h) v/c % queue length Control Delay (s/veh) LOS A B C Approach Delay (s/veh) Approach LOS B C Copyright 21 University of Florida, All Rights Reserved HCS+ TM Version 5.6 Generated: 2/12/214 5:2 PM
111 Two-Way Stop Control file:///c:/users/jsturgess/appdata/local/temp/u2k658.tmp Page 1 of 1 2/12/214 General Information Analyst JMS Agency/Co. Olsson Associates Date Performed 12/1/213 Analysis Time Period 5: pm TWO-WAY STOP CONTROL SUMMARY Site Information Intersection Naismith Dr & 21st St Jurisdiction City of Lawrence Analysis Year Existing Conditions 214 Project Description East/West Street: 21st Street North/South Street: Naismith Drive Intersection Orientation: North-South Study Period (hrs):.25 Vehicle Volumes and Adjustments Major Street Northbound Southbound Movement L T R L T R Volume (veh/h) Peak-Hour Factor, PHF Hourly Flow Rate, HFR (veh/h) Percent Heavy Vehicles Median Type Undivided RT Channelized Lanes 1 2 Configuration L T TR Upstream Signal Minor Street Eastbound Westbound Movement L T R L T R Volume (veh/h) Peak-Hour Factor, PHF Hourly Flow Rate, HFR (veh/h) Percent Heavy Vehicles Percent Grade (%) Flared Approach N N Storage RT Channelized Lanes 1 1 Configuration TR LT Delay, Queue Length, and Level of Service Approach Northbound Southbound Westbound Eastbound Movement Lane Configuration L LT TR v (veh/h) C (m) (veh/h) v/c % queue length Control Delay (s/veh) LOS A C B Approach Delay (s/veh) Approach LOS C B Copyright 21 University of Florida, All Rights Reserved HCS+ TM Version 5.6 Generated: 2/12/214 5:21 PM
112 Two-Way Stop Control file:///c:/users/jsturgess/appdata/local/temp/u2k5696.tmp Page 1 of 1 2/12/214 General Information Analyst JMS Agency/Co. Olsson Associates Date Performed 12/1/213 Analysis Time Period 5: pm TWO-WAY STOP CONTROL SUMMARY Site Information Intersection Jurisdiction Analysis Year Project Description East/West Street: 21st Street North/South Street: Naismith Drive Intersection Orientation: North-South Study Period (hrs):.25 Naismith Dr & 21st St City of Lawrence Existing Conditions Vehicle Volumes and Adjustments Major Street Northbound Southbound Movement L T R L T R Volume (veh/h) Peak-Hour Factor, PHF Hourly Flow Rate, HFR (veh/h) Percent Heavy Vehicles Median Type Undivided RT Channelized Lanes 1 2 Configuration L T TR Upstream Signal Minor Street Eastbound Westbound Movement L T R L T R Volume (veh/h) Peak-Hour Factor, PHF Hourly Flow Rate, HFR (veh/h) Percent Heavy Vehicles Percent Grade (%) Flared Approach N N Storage RT Channelized Lanes 1 1 Configuration LT TR Delay, Queue Length, and Level of Service Approach Northbound Southbound Westbound Eastbound Movement Lane Configuration L TR LT v (veh/h) C (m) (veh/h) v/c % queue length Control Delay (s/veh) LOS A C B Approach Delay (s/veh) Approach LOS C B Copyright 21 University of Florida, All Rights Reserved HCS+ TM Version 5.6 Generated: 2/12/214 5:22 PM
113 Existing + Busses Signal Warrants
114 TRAFFIC SIGNAL WARRANT ANALYSIS - VOLUME WARRANTS KANSAS DEPARTMENT OF TRANSPORTATION - BUREAU OF TRAFFIC ENGINEERING Major Street : 9th Street Time Count Began : 12: PM Is the intersection in a community with a population less than 1, or are speeds greater than 4 mph? no Minor Street : Rockledge Road Date : 12/1/13 Major Street Minor Street City : Lawrence Day of Week of Count: Tuesday Adjustment factor for day of week and month of year of count County : Douglas Number of Lanes Warrant #1 - Condition A Warrant #1 - Condition B Warrant #1 - Combination of Conditions A & B Major Street Minor Street Warrant #2 Warrant #3 -- Time Approach Volumes Approach Volumes Percent of Warrant Percent of Warrant Warrant Percent Warrant Percent -- Volumes Met Volumes Met of of Beginning EAST WEST Total NORTH SOUTH Major Minor Major Minor Volume Warrant Volume Warrant : m For this warrant vehicle ***** ***** 1: volume requirements for ***** ***** 2: conditions A and B are ***** ***** reduced to 3: am % Factor ***** ***** 4: ***** ***** 5: ***** ***** 6: am ***** ***** NOTE: Conditions A and 7: B SHALL BOTH meet a 8: minimum of 8 hours However, the 8 hours 9: am satisfying condition A ***** ***** 1: NEED NOT be the same ***** ***** 11: as the 8 hours satisfying ***** condition B. 12: n ***** 1: : : pm : : : pm : ***** ***** 8: ***** ***** 9: pm ***** ***** 1: ***** ***** 11: ***** ***** 24HR Total Warranting Volumes Warranting Volumes Warranting Volumes Warranting Volumes From MUTCD Fig. 4C-1 From MUTCD Fig. 4C-3 Note: Total of both approaches. Condition A B The HIGHEST approach only. Hours Met Hours Met 2 Hours Met 4 Hours Met Hours Met NOTE: Warrant Met No Warrant Met No Warrant Met No Warrant Met No Warrant Met Basic minimum hourly volumes (unreduced) ***** Major Street volume is so low that no No NOTE: No adjust ment made Minor Street warrant exists
115 Existing + Busses Capacity Analysis 9 th Street
116 Queues 21: Iowa St & 9th St 2/13/214 Lane Group EBL EBT EBR WBL WBT WBR NBL NBT SBL SBT Lane Group Flow (vph) v/c Ratio Control Delay Queue Delay Total Delay Queue Length 5th (ft) Queue Length 95th (ft) Internal Link Dist (ft) Turn Bay Length (ft) Base Capacity (vph) Starvation Cap Reductn Spillback Cap Reductn Storage Cap Reductn Reduced v/c Ratio Intersection Summary 9th St & Rockledge Rd with Busses 7:3 pm 12/1/213 Lawrence Transit Center Synchro 8 Report JMS Page 1
117 HCM Signalized Intersection Capacity Analysis 21: Iowa St & 9th St 2/13/214 Movement EBL EBT EBR WBL WBT WBR NBL NBT NBR SBL SBT SBR Lane Configurations Volume (vph) Ideal Flow (vphpl) Total Lost time (s) Lane Util. Factor Frt Flt Protected Satd. Flow (prot) Flt Permitted Satd. Flow (perm) Peak-hour factor, PHF Adj. Flow (vph) RTOR Reduction (vph) Lane Group Flow (vph) Heavy Vehicles (%) 8% 2% 4% 2% 2% 2% 13% 2% 2% 2% 2% 45% Turn Type pm+pt NA custom pm+pt NA custom pm+pt NA pm+pt NA Protected Phases Permitted Phases Actuated Green, G (s) Effective Green, g (s) Actuated g/c Ratio Clearance Time (s) Vehicle Extension (s) Lane Grp Cap (vph) v/s Ratio Prot.1.9 c c.6 c.24 v/s Ratio Perm.5.1 c v/c Ratio Uniform Delay, d Progression Factor Incremental Delay, d Delay (s) Level of Service C C C B C C C D C C Approach Delay (s) Approach LOS C C D C Intersection Summary HCM 2 Control Delay 3.8 HCM 2 Level of Service C HCM 2 Volume to Capacity ratio.45 Actuated Cycle Length (s) 12. Sum of lost time (s) 19.2 Intersection Capacity Utilization 54.9% ICU Level of Service A Analysis Period (min) 15 c Critical Lane Group 9th St & Rockledge Rd with Busses 7:3 pm 12/1/213 Lawrence Transit Center Synchro 8 Report JMS Page 2
118 Queues 21: Iowa St & 9th St 2/13/214 Lane Group EBL EBT EBR WBL WBT WBR NBL NBT SBL SBT Lane Group Flow (vph) v/c Ratio Control Delay Queue Delay Total Delay Queue Length 5th (ft) Queue Length 95th (ft) Internal Link Dist (ft) Turn Bay Length (ft) Base Capacity (vph) Starvation Cap Reductn Spillback Cap Reductn Storage Cap Reductn Reduced v/c Ratio Intersection Summary 9th St & Rockledge Rd with Busses 5: pm 12/1/213 Lawrence Transit Center Synchro 8 Report JMS Page 1
119 HCM Signalized Intersection Capacity Analysis 21: Iowa St & 9th St 2/13/214 Movement EBL EBT EBR WBL WBT WBR NBL NBT NBR SBL SBT SBR Lane Configurations Volume (vph) Ideal Flow (vphpl) Total Lost time (s) Lane Util. Factor Frt Flt Protected Satd. Flow (prot) Flt Permitted Satd. Flow (perm) Peak-hour factor, PHF Adj. Flow (vph) RTOR Reduction (vph) Lane Group Flow (vph) Heavy Vehicles (%) 5% 2% 3% 2% 2% 2% 3% 2% 2% 2% 2% 8% Turn Type pm+pt NA custom pm+pt NA custom pm+pt NA pm+pt NA Protected Phases Permitted Phases Actuated Green, G (s) Effective Green, g (s) Actuated g/c Ratio Clearance Time (s) Vehicle Extension (s) Lane Grp Cap (vph) v/s Ratio Prot.2.15 c c.12 c.31 v/s Ratio Perm.12.1 c v/c Ratio Uniform Delay, d Progression Factor Incremental Delay, d Delay (s) Level of Service C D D C D C E E E E Approach Delay (s) Approach LOS D D E E Intersection Summary HCM 2 Control Delay 5.3 HCM 2 Level of Service D HCM 2 Volume to Capacity ratio.79 Actuated Cycle Length (s) 15. Sum of lost time (s) 22. Intersection Capacity Utilization 79.6% ICU Level of Service D Analysis Period (min) 15 c Critical Lane Group 9th St & Rockledge Rd with Busses 5: pm 12/1/213 Lawrence Transit Center Synchro 8 Report JMS Page 2
120 Two-Way Stop Control file:///c:/users/jsturgess/appdata/local/temp/u2kc2c5.tmp Page 1 of 1 2/25/214 General Information Analyst JMS Agency/Co. Olsson Associates Date Performed 12/1/213 Analysis Time Period 7:3 am TWO-WAY STOP CONTROL SUMMARY Site Information Intersection Rockledge Rd & 9th St Jurisdiction City of Lawrence, KS Analysis Year Existing + Bus 214 Project Description East/West Street: 9th Street North/South Street: Rockledge Road Intersection Orientation: East-West Study Period (hrs):.25 Vehicle Volumes and Adjustments Major Street Eastbound Westbound Movement L T R L T R Volume (veh/h) Peak-Hour Factor, PHF Hourly Flow Rate, HFR (veh/h) Percent Heavy Vehicles Median Type Undivided RT Channelized Lanes 1 1 Configuration LTR LTR Upstream Signal 1 Minor Street Northbound Southbound Movement L T R L T R Volume (veh/h) Peak-Hour Factor, PHF Hourly Flow Rate, HFR (veh/h) Percent Heavy Vehicles Percent Grade (%) Flared Approach N N Storage RT Channelized Lanes Configuration LTR L TR Delay, Queue Length, and Level of Service Approach Eastbound Westbound Northbound Southbound Movement Lane Configuration LTR LTR LTR L TR v (veh/h) C (m) (veh/h) v/c % queue length Control Delay (s/veh) LOS A A C E C Approach Delay (s/veh) Approach LOS C D Copyright 21 University of Florida, All Rights Reserved HCS+ TM Version 5.6 Generated: 2/25/214 9:57 AM
121 Two-Way Stop Control file:///c:/users/jsturgess/appdata/local/temp/u2k8491.tmp Page 1 of 1 2/25/214 General Information Analyst JMS Agency/Co. Olsson Associates Date Performed 12/1/213 Analysis Time Period 5: pm TWO-WAY STOP CONTROL SUMMARY Site Information Intersection Rockledge Rd & 9th St Jurisdiction City of Lawrence, KS Analysis Year Existing + Bus 214 Project Description East/West Street: 9th Street North/South Street: Rockledge Road Intersection Orientation: East-West Study Period (hrs):.25 Vehicle Volumes and Adjustments Major Street Eastbound Westbound Movement L T R L T R Volume (veh/h) Peak-Hour Factor, PHF Hourly Flow Rate, HFR (veh/h) Percent Heavy Vehicles Median Type Undivided RT Channelized Lanes 1 1 Configuration LTR LTR Upstream Signal 1 Minor Street Northbound Southbound Movement L T R L T R Volume (veh/h) Peak-Hour Factor, PHF Hourly Flow Rate, HFR (veh/h) Percent Heavy Vehicles Percent Grade (%) Flared Approach N N Storage RT Channelized Lanes Configuration LTR L TR Delay, Queue Length, and Level of Service Approach Eastbound Westbound Northbound Southbound Movement Lane Configuration LTR LTR LTR L TR v (veh/h) C (m) (veh/h) v/c % queue length Control Delay (s/veh) LOS A A D F C Approach Delay (s/veh) Approach LOS D E Copyright 21 University of Florida, All Rights Reserved HCS+ TM Version 5.6 Generated: 2/25/214 9:58 AM
122 Existing + Busses Capacity Analysis 21 st Street
123 Queues 3: Iowa St & 21st St 2/25/214 Lane Group EBL EBT WBL WBT NBL NBT NBR SBL SBT SBR Lane Group Flow (vph) v/c Ratio Control Delay Queue Delay Total Delay Queue Length 5th (ft) Queue Length 95th (ft) Internal Link Dist (ft) Turn Bay Length (ft) Base Capacity (vph) Starvation Cap Reductn Spillback Cap Reductn Storage Cap Reductn Reduced v/c Ratio Intersection Summary 21st Street & Stewart with Busses and Cut-Through Traffic 7:3 am 12/11/213 Lawrence Transit Center Synchro 8 Report JMS Page 1
124 HCM Signalized Intersection Capacity Analysis 3: Iowa St & 21st St 2/25/214 Movement EBL EBT EBR WBL WBT WBR NBL NBT NBR SBL SBT SBR Lane Configurations Volume (vph) Ideal Flow (vphpl) Total Lost time (s) Lane Util. Factor Frt Flt Protected Satd. Flow (prot) Flt Permitted Satd. Flow (perm) Peak-hour factor, PHF Adj. Flow (vph) RTOR Reduction (vph) Lane Group Flow (vph) Heavy Vehicles (%) 2% 2% 2% 22% 2% 15% 2% 2% 1% 13% 2% 2% Turn Type Perm NA Perm NA pm+pt NA Perm pm+pt NA Perm Protected Phases Permitted Phases Actuated Green, G (s) Effective Green, g (s) Actuated g/c Ratio Clearance Time (s) Vehicle Extension (s) Lane Grp Cap (vph) v/s Ratio Prot.1 c.3.1 c.3 c.1.22 v/s Ratio Perm v/c Ratio Uniform Delay, d Progression Factor Incremental Delay, d Delay (s) Level of Service D D E D A A A A A A Approach Delay (s) Approach LOS D D A A Intersection Summary HCM 2 Control Delay 9.7 HCM 2 Level of Service A HCM 2 Volume to Capacity ratio.39 Actuated Cycle Length (s) 12. Sum of lost time (s) 15. Intersection Capacity Utilization 49.9% ICU Level of Service A Analysis Period (min) 15 c Critical Lane Group 21st Street & Stewart with Busses and Cut-Through Traffic 7:3 am 12/11/213 Lawrence Transit Center Synchro 8 Report JMS Page 2
125 Queues 3: Iowa St & 21st St 2/25/214 Lane Group EBT WBL WBT NBL NBT NBR SBL SBT Lane Group Flow (vph) v/c Ratio Control Delay Queue Delay Total Delay Queue Length 5th (ft) Queue Length 95th (ft) Internal Link Dist (ft) Turn Bay Length (ft) Base Capacity (vph) Starvation Cap Reductn Spillback Cap Reductn Storage Cap Reductn Reduced v/c Ratio Intersection Summary 21st Street & Stewart with Busses and Cut-Through Traffic 5: pm 12/1/213 Lawrence Transit Center Synchro 8 Report JMS Page 1
126 HCM Signalized Intersection Capacity Analysis 3: Iowa St & 21st St 2/25/214 Movement EBL EBT EBR WBL WBT WBR NBL NBT NBR SBL SBT SBR Lane Configurations Volume (vph) Ideal Flow (vphpl) Total Lost time (s) Lane Util. Factor Frt Flt Protected Satd. Flow (prot) Flt Permitted Satd. Flow (perm) Peak-hour factor, PHF Adj. Flow (vph) RTOR Reduction (vph) Lane Group Flow (vph) Heavy Vehicles (%) 2% 2% 2% 17% 2% 14% 2% 2% 7% 15% 2% 2% Turn Type Perm NA Perm NA pm+pt NA Perm pm+pt NA Perm Protected Phases Permitted Phases Actuated Green, G (s) Effective Green, g (s) Actuated g/c Ratio Clearance Time (s) Vehicle Extension (s) Lane Grp Cap (vph) v/s Ratio Prot c.1 c.45 v/s Ratio Perm c v/c Ratio Uniform Delay, d Progression Factor Incremental Delay, d Delay (s) Level of Service D F D A A A A A Approach Delay (s) Approach LOS D E A A Intersection Summary HCM 2 Control Delay 12.7 HCM 2 Level of Service B HCM 2 Volume to Capacity ratio.61 Actuated Cycle Length (s) 12. Sum of lost time (s) 15. Intersection Capacity Utilization 61.4% ICU Level of Service B Analysis Period (min) 15 c Critical Lane Group 21st Street & Stewart with Busses and Cut-Through Traffic 5: pm 12/1/213 Lawrence Transit Center Synchro 8 Report JMS Page 2
127 All-Way Stop Control file:///c:/users/jsturgess/appdata/local/temp/u2k9922.tmp Page 1 of 1 2/12/214 General Information Analyst JMS Agency/Co. Olsson Associates Date Performed 12/11/213 Analysis Time Period 7:3 am Project ID East/West Street: 21st Street ALL-WAY STOP CONTROL ANALYSIS Site Information Intersection Ousdahl Rd & 21st St Jurisdiction City of Lawrence Analysis Year Existing + Bus + Cut-Thru 214 North/South Street: Ousdahl Road Volume Adjustments and Site Characteristics Approach Eastbound Westbound Movement L T R L T R Volume (veh/h) %Thrus Left Lane Approach Northbound Southbound Movement L T R L T R Volume (veh/h) %Thrus Left Lane Eastbound Westbound Northbound Southbound L1 L2 L1 L2 L1 L2 L1 L2 Configuration LTR LTR LTR LTR PHF Flow Rate (veh/h) % Heavy Vehicles No. Lanes Geometry Group Duration, T.25 Saturation Headway Adjustment Worksheet Prop. Left-Turns Prop. Right-Turns Prop. Heavy Vehicle..1.. hlt-adj hrt-adj hhv-adj hadj, computed Departure Headway and Service Time hd, initial value (s) x, initial hd, final value (s) x, final value Move-up time, m (s) Service Time, t s (s) Capacity and Level of Service Eastbound Westbound Northbound Southbound L1 L2 L1 L2 L1 L2 L1 L2 Capacity (veh/h) Delay (s/veh) LOS B A A A Approach: Delay (s/veh) LOS B A A A Intersection Delay (s/veh) 9.95 Intersection LOS Copyright 21 University of Florida, All Rights Reserved HCS+ TM Version 5.6 Generated: 2/12/214 5:53 PM A
128 All-Way Stop Control file:///c:/users/jsturgess/appdata/local/temp/u2keaf4.tmp Page 1 of 1 2/25/214 General Information Analyst JMS Agency/Co. Olsson Associates Date Performed 12/1/213 Analysis Time Period 5: pm Project ID East/West Street: 21st Street ALL-WAY STOP CONTROL ANALYSIS Site Information Intersection Ousdahl Rd & 21st St Jurisdiction City of Lawrence, KS Analysis Year Existing + Bus + Cut-Thru 214 North/South Street: Ousdahl Road Volume Adjustments and Site Characteristics Approach Eastbound Westbound Movement L T R L T R Volume (veh/h) %Thrus Left Lane Approach Northbound Southbound Movement L T R L T R Volume (veh/h) %Thrus Left Lane Eastbound Westbound Northbound Southbound L1 L2 L1 L2 L1 L2 L1 L2 Configuration LTR LTR LTR LTR PHF Flow Rate (veh/h) % Heavy Vehicles No. Lanes Geometry Group Duration, T.25 Saturation Headway Adjustment Worksheet Prop. Left-Turns Prop. Right-Turns Prop. Heavy Vehicle.1... hlt-adj hrt-adj hhv-adj hadj, computed Departure Headway and Service Time hd, initial value (s) x, initial hd, final value (s) x, final value Move-up time, m (s) Service Time, t s (s) Capacity and Level of Service Eastbound Westbound Northbound Southbound L1 L2 L1 L2 L1 L2 L1 L2 Capacity (veh/h) Delay (s/veh) LOS A A A A Approach: Delay (s/veh) LOS A A A A Intersection Delay (s/veh) 9. Intersection LOS Copyright 21 University of Florida, All Rights Reserved HCS+ TM Version 5.6 Generated: 2/25/214 1:47 PM A
129 Two-Way Stop Control file:///c:/users/jsturgess/appdata/local/temp/u2k99da.tmp Page 1 of 1 2/12/214 General Information Analyst JMS Agency/Co. Olsson Associates Date Performed 12/11/213 Analysis Time Period 7:3 am TWO-WAY STOP CONTROL SUMMARY Site Information Intersection Jurisdiction Analysis Year Naismith Dr & 21st St City of Lawrence Existing + Bus + Cut-Thru 214 Project Description East/West Street: 21st Street North/South Street: Naismith Drive Intersection Orientation: North-South Study Period (hrs):.25 Vehicle Volumes and Adjustments Major Street Northbound Southbound Movement L T R L T R Volume (veh/h) Peak-Hour Factor, PHF Hourly Flow Rate, HFR (veh/h) Percent Heavy Vehicles Median Type Undivided RT Channelized Lanes 1 2 Configuration L T TR Upstream Signal Minor Street Eastbound Westbound Movement L T R L T R Volume (veh/h) Peak-Hour Factor, PHF Hourly Flow Rate, HFR (veh/h) Percent Heavy Vehicles Percent Grade (%) Flared Approach N N Storage RT Channelized Lanes 1 1 Configuration TR LT Delay, Queue Length, and Level of Service Approach Northbound Southbound Westbound Eastbound Movement Lane Configuration L LT TR v (veh/h) C (m) (veh/h) v/c % queue length Control Delay (s/veh) LOS A B B Approach Delay (s/veh) Approach LOS B B Copyright 21 University of Florida, All Rights Reserved HCS+ TM Version 5.6 Generated: 2/12/214 5:31 PM
130 Two-Way Stop Control file:///c:/users/jsturgess/appdata/local/temp/u2k39f5.tmp Page 1 of 1 2/12/214 General Information Analyst JMS Agency/Co. Olsson Associates Date Performed 12/11/213 Analysis Time Period 7:3 am TWO-WAY STOP CONTROL SUMMARY Site Information Intersection Jurisdiction Analysis Year Naismith Dr & 21st St City of Lawrence Existing + Bus + Cut-Thru 214 Project Description East/West Street: 21st Street North/South Street: Naismith Drive Intersection Orientation: North-South Study Period (hrs):.25 Vehicle Volumes and Adjustments Major Street Northbound Southbound Movement L T R L T R Volume (veh/h) Peak-Hour Factor, PHF Hourly Flow Rate, HFR (veh/h) Percent Heavy Vehicles Median Type Undivided RT Channelized Lanes 1 2 Configuration L T TR Upstream Signal Minor Street Eastbound Westbound Movement L T R L T R Volume (veh/h) Peak-Hour Factor, PHF Hourly Flow Rate, HFR (veh/h) Percent Heavy Vehicles Percent Grade (%) Flared Approach N N Storage RT Channelized Lanes 1 1 Configuration LT TR Delay, Queue Length, and Level of Service Approach Northbound Southbound Westbound Eastbound Movement Lane Configuration L TR LT v (veh/h) C (m) (veh/h) v/c % queue length Control Delay (s/veh) LOS A B C Approach Delay (s/veh) Approach LOS B C Copyright 21 University of Florida, All Rights Reserved HCS+ TM Version 5.6 Generated: 2/12/214 5:34 PM
131 Two-Way Stop Control file:///c:/users/jsturgess/appdata/local/temp/u2kcee.tmp Page 1 of 1 2/12/214 General Information Analyst JMS Agency/Co. Olsson Associates Date Performed 12/1/213 Analysis Time Period 5: pm TWO-WAY STOP CONTROL SUMMARY Site Information Intersection Jurisdiction Analysis Year Naismith Dr & 21st St City of Lawrence Existing + Bus + Cut-Thru 214 Project Description East/West Street: 21st Street North/South Street: Naismith Drive Intersection Orientation: North-South Study Period (hrs):.25 Vehicle Volumes and Adjustments Major Street Northbound Southbound Movement L T R L T R Volume (veh/h) Peak-Hour Factor, PHF Hourly Flow Rate, HFR (veh/h) Percent Heavy Vehicles Median Type Undivided RT Channelized Lanes 1 2 Configuration L T TR Upstream Signal Minor Street Eastbound Westbound Movement L T R L T R Volume (veh/h) Peak-Hour Factor, PHF Hourly Flow Rate, HFR (veh/h) Percent Heavy Vehicles Percent Grade (%) Flared Approach N N Storage RT Channelized Lanes 1 1 Configuration TR LT Delay, Queue Length, and Level of Service Approach Northbound Southbound Westbound Eastbound Movement Lane Configuration L LT TR v (veh/h) C (m) (veh/h) v/c % queue length Control Delay (s/veh) LOS A D C Approach Delay (s/veh) Approach LOS D C Copyright 21 University of Florida, All Rights Reserved HCS+ TM Version 5.6 Generated: 2/12/214 5:35 PM
132 Two-Way Stop Control file:///c:/users/jsturgess/appdata/local/temp/u2kf6e6.tmp Page 1 of 1 2/12/214 General Information Analyst JMS Agency/Co. Olsson Associates Date Performed 12/1/213 Analysis Time Period 5: pm TWO-WAY STOP CONTROL SUMMARY Site Information Intersection Jurisdiction Analysis Year Naismith Dr & 21st St City of Lawrence Existing + Bus + Cut-Thru 214 Project Description East/West Street: 21st Street North/South Street: Naismith Drive Intersection Orientation: North-South Study Period (hrs):.25 Vehicle Volumes and Adjustments Major Street Northbound Southbound Movement L T R L T R Volume (veh/h) Peak-Hour Factor, PHF Hourly Flow Rate, HFR (veh/h) Percent Heavy Vehicles Median Type Undivided RT Channelized Lanes 1 2 Configuration L T TR Upstream Signal Minor Street Eastbound Westbound Movement L T R L T R Volume (veh/h) Peak-Hour Factor, PHF Hourly Flow Rate, HFR (veh/h) Percent Heavy Vehicles Percent Grade (%) Flared Approach N N Storage RT Channelized Lanes 1 1 Configuration LT TR Delay, Queue Length, and Level of Service Approach Northbound Southbound Westbound Eastbound Movement Lane Configuration L TR LT v (veh/h) C (m) (veh/h) v/c % queue length Control Delay (s/veh) LOS A C B Approach Delay (s/veh) Approach LOS C B Copyright 21 University of Florida, All Rights Reserved HCS+ TM Version 5.6 Generated: 2/12/214 5:36 PM
133 Cost Estimates of Proposed Improvements
134 ENGINEER'S ESTIMATE (CONSTRUCTION COSTS) (Concept Level) Client: City of Lawrence Project: Lawrence Transit Center Location Analysis Project Number: Date: 2/25/214 ITEM DESCRIPTION QUANTITY UNIT UNIT COST $ COST $ EXISTING PLUS TRANSIT CENTER 9TH ST & ROCKLEDGE ROAD Replacing the pavement on 9th between Rockledge and Iowa as well as the N. leg of Rockledge in order to install a left turn lane 1 Removal of Existing Structures 1 Lump Sum $25,. $25,. 2 Unclassified Excavation 55 Cu. Yd. $25. $137,5. 3 Compaction of Earthwork (All types) 4 Cu. Yd. $18. $72,. 4 Fly Ash 385 Ton $45. $17, Manipulation for Fly Ash Treated Subgrade (9") 6914 Sq. Yd. $5.5 $38,27. 6 Concrete Pavement (8")(NRDJ) 5775 Sq. Yd. $8. $462,. 7 Concrete Driveway (6") 561 Sq. Yd. $55. $3, Curb and Gutter Combined 334 Lin. Ft. $25. $75,85. 9 Sidewalk Construction (4") 7951 Sq. Ft. $5. $39, Sidewalk Ramp 25 Each $2,5. $62,5. 11 Inlet (Curb)(6'x4')(Complete) 1 Each $5,. $5,. 12 Inlet (Curb)(6'x6')(Complete) 4 Each $6,5. $26,. 13 Junction Box (5'x5')(Complete) 4 Each $5,. $2, " Storm Sewer (RCP Class III) 25 Lin. Ft. $75. $18, " Storm Sewer (RCP Class III) 47 Lin. Ft. $11. $51, " Storm Sewer (RCP Class III) 5 Lin. Ft. $13. $65, " Storm Sewer (RCP Class III) 5 Lin. Ft. $165. $82,5. 18 Modification of Storm Structure 4 Each $2,5. $1,. 19 Sod 37 Sq. Yd. $4.5 $16,65. 2 Pavement Marking & Signing 1 Lump Sum $25,. $25,. 21 Traffic Control 1 Lump Sum $1,. $1,. 22 Contractor Construction Staking 1 Lump Sum $2,. $2,. 23 Erosion Control 1 Lump Sum $2,. $2,. SUBTOTAL $1,376,412. CONTINGENCY 25% $344,13. OPINION OF PROBABLE COST $1,72,515. EXISTING PLUS TRANSIT CENTER 21ST ST & IOWA STREET Extend Westbound Left turn lane from 5' to 15' plus taper 1 Removal of Existing Structures 1 Lump Sum $2,. $2,. 2 Unclassified Excavation 53 Cu. Yd. $36. $1,98. 3 Compaction of Earthwork (All types) 5. Cu. Yd. $18. $9. 4 Aggregate for base (AB 3) 66 Ton $35. $2,31. 5 Milling (2.5") 142 Sq. Yd. $2.5 $2,65. 6 Asphalt Surface Course 2.5" 158 Ton $7. $11,6. 7 Concrete Pavement (7") 7 Sq. Yd. $75. $5,25. 8 Curb and Gutter Combined 318 Lin. Ft. $25. $7,95. 9 Pavement Marking 1 Lump Sum $1,. $1,. 1 Traffic Control 1 Lump Sum $2,5. $2,5. 11 Contractor Construction Staking 1 Lump Sum $1,5. $1,5. 12 Erosion Control 1 Lump Sum $1,. $1,. SUBTOTAL $39,983. CONTINGENCY 2% $7,996.6 OPINION OF PROBABLE COST $47,979.6
135 ENGINEER'S ESTIMATE (CONSTRUCTION COSTS) (Concept Level) Client: City of Lawrence Project: Lawrence Transit Center Location Analysis Project Number: Date: 2/25/214 ITEM DESCRIPTION QUANTITY UNIT UNIT COST $ COST $ Add Left Turn Lane to the West Leg of 21st & Iowa 1 Removal of Existing Structures 1 Lump Sum 2 Unclassified Excavation 324 Cu. Yd. $36. $11, Compaction of Earthwork (All types) 324 Cu. Yd. $18. $5, Aggregate for base (AB 3) 167 Ton $35. $5, Milling (2.5") 758 Sq. Yd. $2.5 $1, Asphalt Surface Course 2.5" 147 Ton $7. $1,29. 7 Concrete Pavement (7") 292 Sq. Yd. $75. $21,9. 8 Curb and Gutter Combined 546 Lin. Ft. $25. $13,65. 9 Sidewalk Construction (4") 1 Sq. Ft. $5. $5. 1 Sidewalk Ramp 2 Each $2,5. $5,. 11 Pavement Marking 1 Lump Sum $1,5. $1,5. 12 Traffic Control 1 Lump Sum $1,. $1,. 13 Contractor Construction Staking 1 Lump Sum $1,5. $1,5. 14 Erosion Control 1 Lump Sum $1,5. $1,5. SUBTOTAL $82,76. CONTINGENCY 2% $16,415.2 OPINION OF PROBABLE COST $98,491.2 Add NB Right Turn Lane to 21st & Iowa 1 Removal of Existing Structures 1 Lump Sum $1,. $1,. 2 Unclassified Excavation 327 Cu. Yd. $36. $11, Compaction of Earthwork (All types) 3 Cu. Yd. $18. $5,4. 4 Aggregate for base (AB 3) 163 Ton $35. $5,75. 6 Asphalt Surface Course 2.5" 5 Ton $7. $3,5. 7 Concrete Pavement (7") 356 Sq. Yd. $75. $26,7. 8 Curb and Gutter Combined 327 Lin. Ft. $25. $8, Sidewalk Construction (4") 1465 Sq. Ft. $5. $7, Sidewalk Ramp 1 Each $2,5. $2,5. 11 Inlet (Curb)(6'x4')(Complete) 2 Each $5,. $1, " Storm Sewer (RCP Class III) 2 Lin. Ft. $9. $1,8. 13 Modification of Storm Structure 2 Each $2,5. $5,. 14 Pavement Marking 1 Lump Sum $5. $5. 15 Traffic Control 1 Lump Sum $1,. $1,. 16 Contractor Construction Staking 1 Lump Sum $1,. $1,. 17 Erosion Control 1 Lump Sum $1,5. $1,5. SUBTOTAL $92,877. CONTINGENCY 2% $18,575.4 OPINION OF PROBABLE COST $111,452.4
136 ENGINEER'S ESTIMATE (CONSTRUCTION COSTS) (Concept Level) Client: City of Lawrence Project: Lawrence Transit Center Location Analysis Project Number: Date: 2/25/214 ITEM DESCRIPTION QUANTITY UNIT UNIT COST $ COST $ Replace W. 21st St. from Iowa to Stewart and Stewart St from 21st St. to North Transit Center Entrance 1 Removal of Existing Structures 1 Lump Sum $5,. $5,. 2 Unclassified Excavation 3266 Cu. Yd. $25. $81,65. 3 Compaction of Earthwork (All types) 98 Cu. Yd. $18. $17,64. 4 Fly Ash 182 Ton $45. $8,19. 5 Manipulation for Fly Ash Treated Subgrade (9") 3266 Sq. Yd. $5.5 $17, Concrete Pavement (8")(NRDJ) 187 Sq. Yd. $8. $149,6. 7 Concrete Driveway (6") 97 Sq. Yd. $55. $5, Curb and Gutter Combined 1673 Lin. Ft. $25. $41, Sidewalk Construction (4") 5269 Sq. Ft. $5. $26, Sidewalk Ramp 8 Each $2,5. $2,. 11 Inlet (Curb)(6'x4')(Complete) 6 Each $5,. $3, " Storm Sewer (RCP Class III) 1 Lin. Ft. $9. $9, " Storm Sewer (RCP Class III) 68 Lin. Ft. $11. $74, " Storm Sewer (RCP Class III) 3 Lin. Ft. $13. $3,9. 15 Modification of Storm Structure 1 Each $2,5. $2,5. 16 Sod 19 Sq. Yd. $4.5 $8, Pavement Marking 1 Lump Sum $2,. $2,. 18 Traffic Control 1 Lump Sum $1,. $1,. 19 Contractor Construction Staking 1 Lump Sum $2,5. $2,5. 2 Erosion Control 1 Lump Sum $5,. $5,. SUBTOTAL $521,798. CONTINGENCY 25% $13,449.5 OPINION OF PROBABLE COST $652,247.5 Install Traffic Signal at 21st St. & Iowa and Restripe the South Leg to Include a 15' Left Turn Lane 1 Traffic Signal and Pavement Markings 1 Lump Sum $165,. $165,. SUBTOTAL $165,. CONTINGENCY 2% $33,. OPINION OF PROBABLE COST $198,. The Engineer, using his or her professional judgment, has developed this stated Opinion of Probable Construction Cost based upon the design status identified above. Development of this Opinion has included consideration of design input level; however, the circumstances under which the work is expected to be undertaken, the cost and availability of materials, labor and services, probable bidder response and the economic conditions at the time of bid solicitation are beyond the control of the Engineer and will impact actual bid costs. Should bidding be delayed, these costs should be reviewed and, if necessary, adjusted to a more applicable Engineering News Record Construction Cost Index.
137 Geotechnical Memo
138
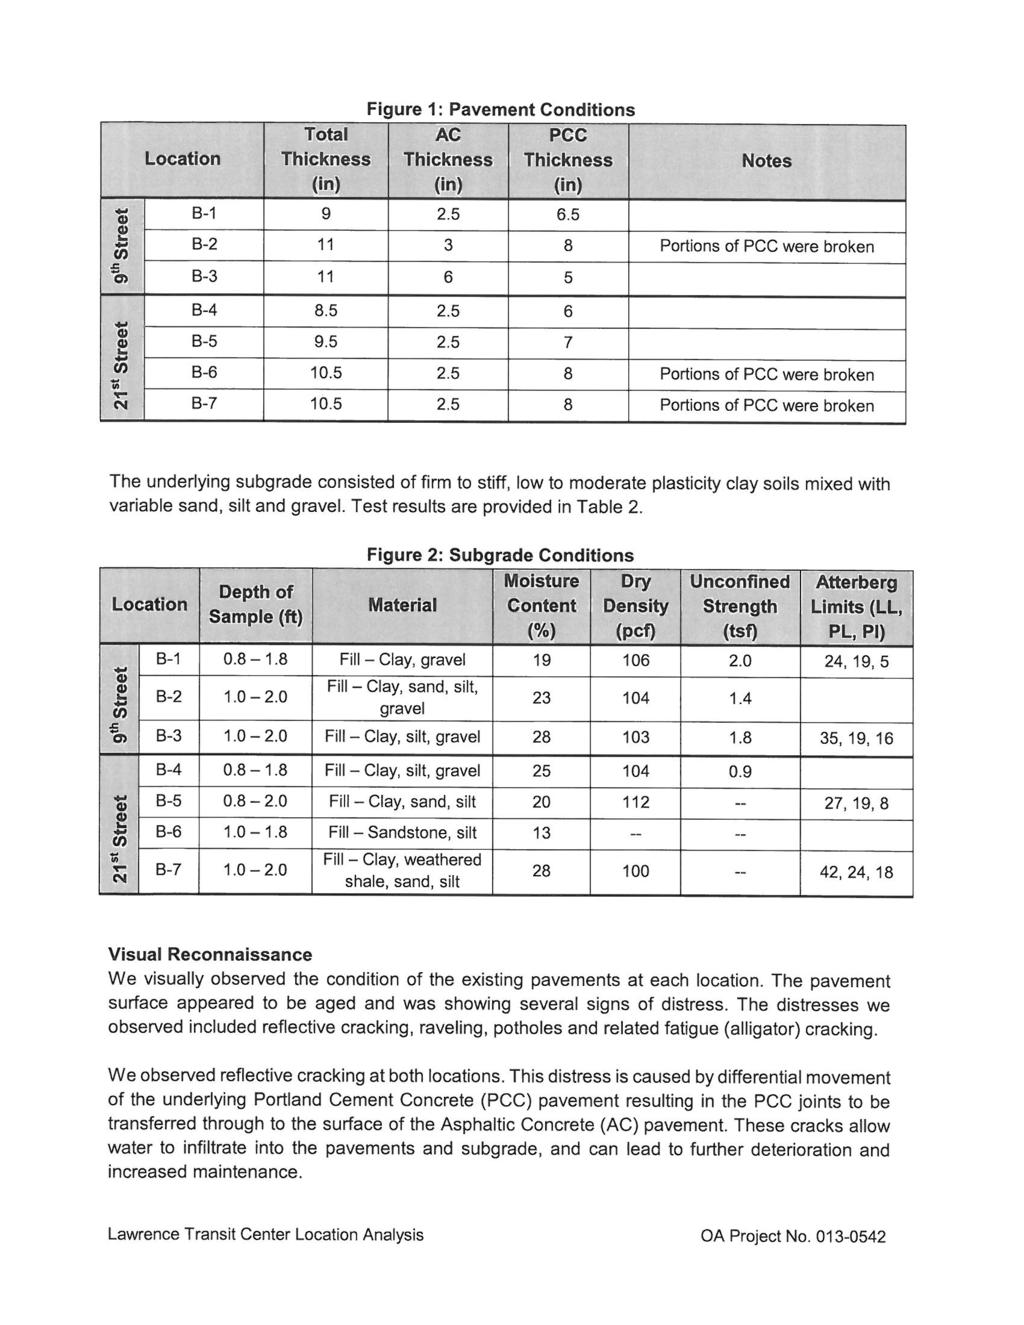
139
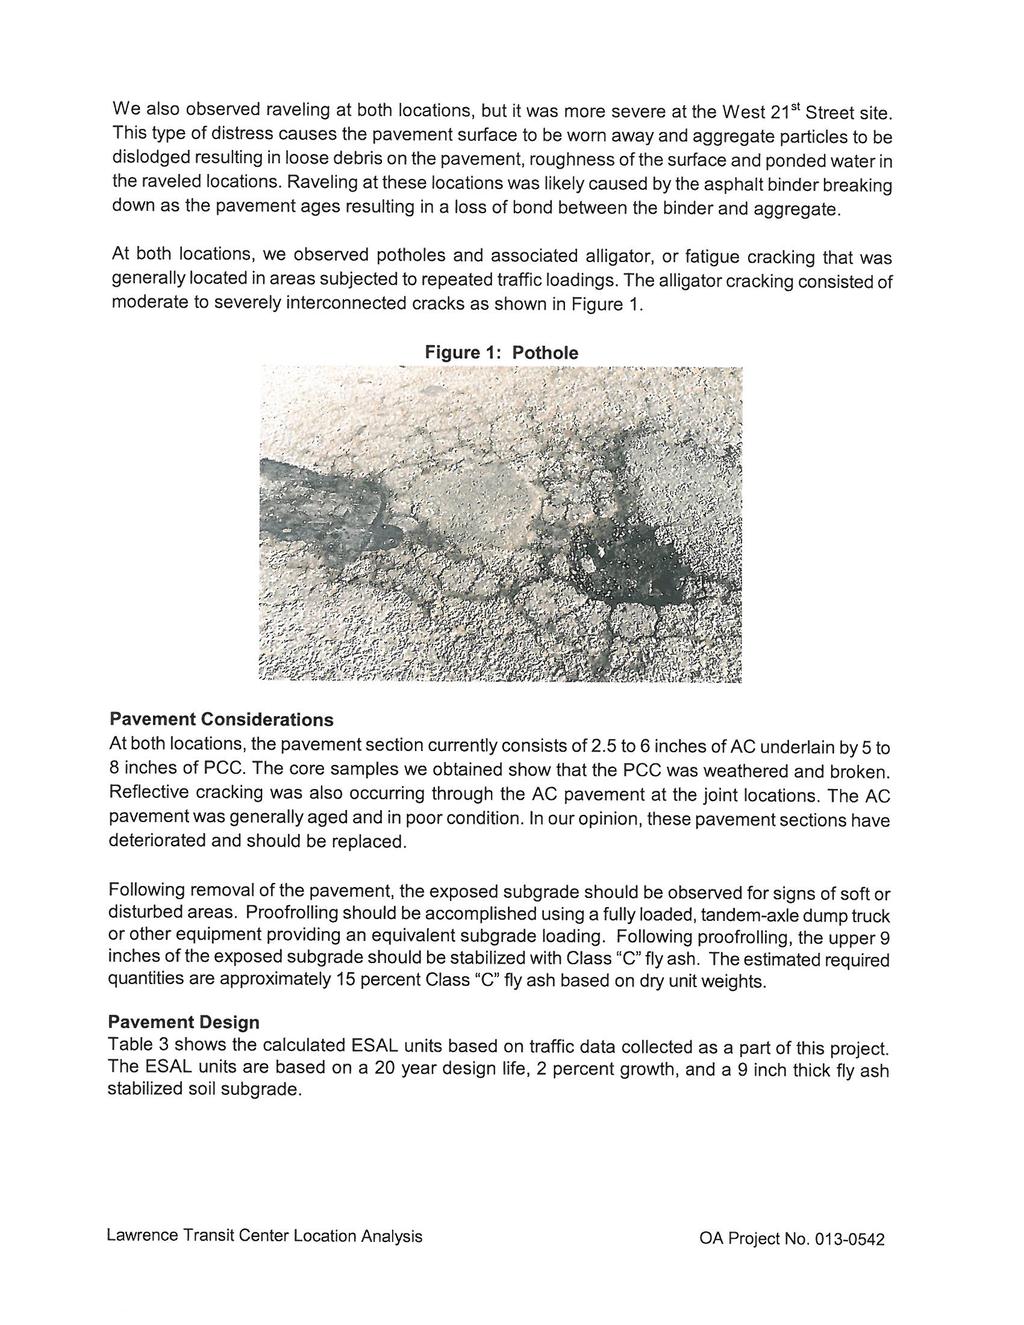
140
141

142 B-5 B-6 B-1 B-2 B-3 B-4 North Scale: n.t.s. Project No Approved by: CLW Date: 2/19/14 Core Location Map - West 9th Street Lawrence Transit Center Lawrence, Kansas

143 B-5 B-6 B-1 B-2 B-3 B-4 North Scale: n.t.s. Project No Approved by: CLW Date: 2/19/14 Core Location Map - West 21st Street Lawrence Transit Center Lawrence, Kansas


144 Pavement Core Photographs Project No Approved by: CLW Date: 2/19/14 Lawrence Transit Center - 9th Street Lawrence, Kansas


145 Pavement Core Photographs Project No Approved by: CLW Date: 2/19/14 Lawrence Transit Center - 21st Street Lawrence, Kansas


146 Pavement Core Photographs Project No Approved by: CLW Date: 2/19/14 Lawrence Transit Center - 21st Street Lawrence, Kansas
APPENDIX C1 TRAFFIC ANALYSIS DESIGN YEAR TRAFFIC ANALYSIS
 APPENDIX C1 TRAFFIC ANALYSIS DESIGN YEAR TRAFFIC ANALYSIS DESIGN YEAR TRAFFIC ANALYSIS February 2018 Highway & Bridge Project PIN 6754.12 Route 13 Connector Road Chemung County February 2018 Appendix
Traffic Impact Study Speedway Gas Station Redevelopment
 Traffic Impact Study Speedway Gas Station Redevelopment Warrenville, Illinois Prepared For: Prepared By: April 11, 2018 Table of Contents 1. Introduction... 1 2. Existing Conditions... 4 Site Location...
RTE. 1 at RTE. 637 & RTE. 639
 INTERSECTION SAFETY STUDY Prepared for: Virginia Department of Transportation Central Region Operations Traffic Engineering (UPC #81378, TO 12-092) DAVENPORT Project Number: 13-368 / /2014 RTE. 1 at RTE.
TRAFFIC IMPACT ANALYSIS
 TRAFFIC IMPACT ANALYSIS Emerald Isle Commercial Development Prepared by SEPI Engineering & Construction Prepared for Ark Consulting Group, PLLC March 2016 I. Executive Summary A. Site Location The Emerald
Bennett Pit. Traffic Impact Study. J&T Consulting, Inc. Weld County, Colorado. March 3, 2017
 Bennett Pit Traffic Impact Study J&T Consulting, Inc. Weld County, Colorado March 3, 217 Prepared By: Sustainable Traffic Solutions, Inc. http://www.sustainabletrafficsolutions.com/ Joseph L. Henderson,
Traffic Engineering Study
 Traffic Engineering Study Bellaire Boulevard Prepared For: International Management District Technical Services, Inc. Texas Registered Engineering Firm F-3580 November 2009 Executive Summary has been requested
BARRHAVEN FELLOWSHIP CRC 3058 JOCKVALE ROAD OTTAWA, ONTARIO TRANSPORTATION BRIEF. Prepared for:
 BARRHAVEN FELLOWSHIP CRC 3058 JOCKVALE ROAD OTTAWA, ONTARIO TRANSPORTATION BRIEF Prepared for: Barrhaven Fellowship CRC 3058 Jockvale Road Ottawa, ON K2J 2W7 December 7, 2016 116-649 Report_1.doc D. J.
MERIVALE PRIORITY SQUARE 2852 MERIVALE ROAD CITY OF OTTAWA TRANSPORTATION BRIEF. Prepared for: ONT Inc. 25 Winding Way Nepean, Ontario K2C 3H1
 MERIVALE PRIORITY SQUARE 2852 MERIVALE ROAD CITY OF OTTAWA TRANSPORTATION BRIEF Prepared for: 2190986ONT Inc. 25 Winding Way Nepean, Ontario K2C 3H1 October 6, 2010 110-502 Report_1.doc D. J. Halpenny
EXECUTIVE SUMMARY. The following is an outline of the traffic analysis performed by Hales Engineering for the traffic conditions of this project.
 EXECUTIVE SUMMARY This study addresses the traffic impacts associated with the proposed Shopko redevelopment located in Sugarhouse, Utah. The Shopko redevelopment project is located between 1300 East and
King Soopers #116 Thornton, Colorado
 Traffic Impact Study King Soopers #116 Thornton, Colorado Prepared for: Galloway & Company, Inc. T R A F F I C I M P A C T S T U D Y King Soopers #116 Thornton, Colorado Prepared for Galloway & Company
TRAFFIC IMPACT STUDY DERRY GREEN CORPORATE BUSINESS PARK MILTON SECONDARY PLAN MODIFICATION
 TRAFFIC IMPACT STUDY DERRY GREEN CORPORATE BUSINESS PARK MILTON SECONDARY PLAN MODIFICATION TRAFFIC IMPACT STUDY DERRY GREEN CORPORATE BUSINESS PARK MILTON SECONDARY PLAN MODIFICATION DECEMBER 24 UPDATED
TIMBERVINE TRANSPORTATION IMPACT STUDY FORT COLLINS, COLORADO JANUARY Prepared for:
 TIMBERVINE TRANSPORTATION IMPACT STUDY FORT COLLINS, COLORADO JANUARY 2014 Prepared for: Hartford Companies 1218 W. Ash Street Suite A Windsor, Co 80550 Prepared by: DELICH ASSOCIATES 2272 Glen Haven Drive
Memorandum. To: Sue Polka, City Engineer, City of Arden Hills. From: Sean Delmore, PE, PTOE. Date: June 21, 2017
 Memorandum engineering planning environmental construction 701 Xenia Avenue South Suite 300 Minneapolis, MN 55416 Tel: 763-541-4800 Fax: 763-541-1700 To: Sue Polka, City Engineer, City of Arden Hills From:
INDUSTRIAL DEVELOPMENT
 INDUSTRIAL DEVELOPMENT Traffic Impact Study Plainfield, Illinois August 2018 Prepared for: Seefried Industrial Properties, Inc. TABLE OF CONTENTS Executive Summary 2 Introduction 3 Existing Conditions
DEVELOPMENT PROPERTY 1627 MAXIME STREET CITY OF OTTAWA TRANSPORTATION OVERVIEW. Prepared for: Subhas Bhargava. July 9, Overview_1.
 DEVELOPMENT PROPERTY 1627 MAXIME STREET CITY OF OTTAWA TRANSPORTATION OVERVIEW Prepared for: Subhas Bhargava July 9, 2015 115-620 Overview_1.doc D. J. Halpenny & Associates Ltd. Consulting Transportation
Craig Scheffler, P.E., PTOE HNTB North Carolina, P.C. HNTB Project File: Subject
 TECHNICAL MEMORANDUM To Kumar Neppalli Traffic Engineering Manager Town of Chapel Hill From Craig Scheffler, P.E., PTOE HNTB North Carolina, P.C. Cc HNTB Project File: 38435 Subject Obey Creek TIS 2022
Proposed location of Camp Parkway Commerce Center. Vicinity map of Camp Parkway Commerce Center Southampton County, VA
 Proposed location of Camp Parkway Commerce Center Vicinity map of Camp Parkway Commerce Center Southampton County, VA Camp Parkway Commerce Center is a proposed distribution and industrial center to be
LCPS Valley Service Center
 Traffic Impact Study LCPS Valley Service Center Loudoun County, Virginia November 4, 2015 Prepared For: Loudoun County Public Schools 21000 Education Court Ashburn, VA 20148 Prepared by: 1140 Connecticut
MINERVA PARK SITE TRAFFIC IMPACT STUDY M/I HOMES. September 2, 2015
 5500 New Albany Road Columbus, Ohio 43054 Phone: 614.775.4500 Fax: 614.775.4800 Toll Free: 1-888-775-EMHT emht.com 2015-1008 MINERVA PARK SITE TRAFFIC IMPACT STUDY M/I HOMES September 2, 2015 Engineers
Date: February 7, 2017 John Doyle, Z-Best Products Robert Del Rio. T.E. Z-Best Traffic Operations and Site Access Analysis
 Memorandum Date: February 7, 07 To: From: Subject: John Doyle, Z-Best Products Robert Del Rio. T.E. Z-Best Traffic Operations and Site Access Analysis Introduction Hexagon Transportation Consultants, Inc.
Shirk Road at State Route 198 Interchange Analysis Tulare County, California
 Shirk Road at State Route 198 Interchange Analysis Tulare County, California DRAFT REPORT Prepared By Tulare County Association of Governments (TCAG) April 2013 Table of Contents Introduction:... 3 Project
LATSON INTERCHANGE DEVELOPMENT TRAFFIC STUDIES. Genoa Township, Livingston County, MI
 LATSON INTERCHANGE DEVELOPMENT TRAFFIC STUDIES Genoa Township, Livingston County, MI DRAFT TRAFFIC STUDY FOR I-96 AT LATSON RD INTERCHANGE Livingston County CS 47065 JN 101622C Submitted to: Michigan Department
INTERCHANGE OPERTIONS STUDY Interstate 77 / Wallings Road Interchange
 INTERCHANGE OPERTIONS STUDY Interstate 77 / Wallings Road Interchange City of Broadview Heights, Cuyahoga County, Ohio Prepared For: City of Broadview Heights Department of Engineering 9543 Broadview Road
Appendix C-5: Proposed Refinements Rail Operations and Maintenance Facility (ROMF) Traffic Impact Analysis. Durham-Orange Light Rail Transit Project
 Traffic Impact Analysis. Durham-Orange Light Rail Transit Project") Appendix C-5: Proposed Refinements Rail Operations and Maintenance Facility (ROMF) Traffic Impact Analysis Durham-Orange Light Rail Transit Project July 25, 218 ROMF Transportation Impact Analysis Version
Appendix C-5: Proposed Refinements Rail Operations and Maintenance Facility (ROMF) Traffic Impact Analysis Durham-Orange Light Rail Transit Project July 25, 218 ROMF Transportation Impact Analysis Version
Traffic Impact Analysis. Alliance Cole Avenue Residential Site Dallas, Texas. Kimley-Horn and Associates, Inc. Dallas, Texas.
 Traffic Impact Analysis Alliance Cole Avenue Residential Site Dallas, Texas February 15, 2018 Kimley-Horn and Associates, Inc. Dallas, Texas Project #064524900 Registered Firm F-928 Traffic Impact Analysis
MILLERSVILLE PARK TRAFFIC IMPACT ANALYSIS ANNE ARUNDEL COUNTY, MARYLAND
 MILLERSVILLE PARK TRAFFIC IMPACT ANALYSIS ANNE ARUNDEL COUNTY, MARYLAND Prepared for: Department of Public Works Anne Arundel County Prepared by: URS Corporation 4 North Park Drive, Suite 3 Hunt Valley,
L1TILE BEARS DAY CARE TRANSPORTATION IMPACT STUDY FORT COLLINS, COLORADO MAY Prepared for:
 L1TILE BEARS DAY CARE TRANSPORTATION IMPACT STUDY FORT COLLINS, COLORADO MAY 2012 Prepared for: Hillside Construction, Inc. 216 Hemlock Street, Suite B Fort Collins, CO 80534 Prepared by: DELICH ASSOCIATES
Traffic Impact Study for the proposed. Town of Allegany, New York. August Project No Prepared For:
 Appendix B SRF Traffic Study (Revised November 2005) Draft Environmental Impact Statement University Commons Town of Allegany, Cattaraugus County, NY December 2005 Traffic Impact Study for the proposed
Sugarland Crossing Gwinnett County, Georgia
 Sugarland Crossing Gwinnett County, Georgia S IGNAL W ARRANT A NALYSIS For the Intersection of: Sugarloaf Parkway / Richards Middle School Driveway / Sugarland Crossing Main Site Driveway Prepared for:
December 5, Red Bank Planning Board Municipal Building 90 Monmouth Street Red Bank, NJ 07701
 Dynamic Traffic, LLC www.dynamic-traffic.com 1904 Main Street Lake Como, NJ 07719 T. 732.681.0760 December 5, 2016 Red Bank Planning Board Municipal Building 90 Monmouth Street Red Bank, NJ 07701 Re: Traffic
RICHMOND OAKS HEALTH CENTRE 6265 PERTH STREET OTTAWA, ONTARIO TRANSPORTATION BRIEF. Prepared for: Guycoki (Eastern) Limited.
 Limited.") RICHMOND OAKS HEALTH CENTRE 6265 PERTH STREET OTTAWA, ONTARIO TRANSPORTATION BRIEF Prepared for: Guycoki (Eastern) Limited June 16, 2016 116-638 Brief_1.doc D. J. Halpenny & Associates Ltd. Consulting
RICHMOND OAKS HEALTH CENTRE 6265 PERTH STREET OTTAWA, ONTARIO TRANSPORTATION BRIEF Prepared for: Guycoki (Eastern) Limited June 16, 2016 116-638 Brief_1.doc D. J. Halpenny & Associates Ltd. Consulting
2.0 Development Driveways. Movin Out June 2017
 Movin Out June 2017 1.0 Introduction The proposed Movin Out development is a mixed use development in the northeast quadrant of the intersection of West Broadway and Fayette Avenue in the City of Madison.
V. DEVELOPMENT OF CONCEPTS
 Martin Luther King, Jr. Drive Extension FINAL Feasibility Study Page 9 V. DEVELOPMENT OF CONCEPTS Throughout the study process several alternative alignments were developed and eliminated. Initial discussion
INTERSECTION CONTROL EVALUATION
 INTERSECTION CONTROL EVALUATION Trunk Highway 22 and CSAH 21 (E Hill Street/Shanaska Creek Road) Kasota, Le Sueur County, Minnesota November 2018 Trunk Highway 22 and Le Sueur CSAH 21 (E Hill Street/Shanaska
Traffic Impact Analysis West Street Garden Plots Improvements and DuPage River Park Garden Plots Development Naperville, Illinois
 Traffic Impact Analysis West Street Garden Plots Improvements and DuPage River Park Garden Plots Development Naperville, Illinois Submitted by April 9, 2009 Introduction Kenig, Lindgren, O Hara, Aboona,
TRAFFIC SIGNAL DESIGN REPORT KING OF PRUSSIA ROAD & RAIDER ROAD RADNOR TOWNSHIP PENNSYLVANIA
 TRAFFIC SIGNAL DESIGN REPORT KING OF PRUSSIA ROAD & RAIDER ROAD RADNOR TOWNSHIP PENNSYLVANIA PREPARED FOR: UNIVERSITY OF PENNSYLVANIA HEALTH SYSTEM 34 CIVIC CENTER BOULEVARD PHILADELPHIA, PA 1987 (61)
TRAFFIC IMPACT STUDY FOR SONIC DRIVE-IN RESTAURANT. Vallejo, CA. Prepared For:
 TRAFFIC IMPACT STUDY FOR SONIC DRIVE-IN RESTAURANT Vallejo, CA Prepared For: ELITE DRIVE-INS, INC. 2190 Meridian Park Blvd, Suite G Concord, CA 94520 Prepared By: KD Anderson & Associates 3853 Taylor Road,
Figure 1 Map of intersection of SR 44 (Ravenna Rd) and Butternut Rd
 and Butternut Rd") Abbreviated Study District: 12 County: Geauga Route: SR 44 Section: 1.58 GEA 44 1.58 213 HSP # 47 (Rural Intersection) Prepared April 23, 215 By Bryan Emery Existing Conditions This study contains the
Abbreviated Study District: 12 County: Geauga Route: SR 44 Section: 1.58 GEA 44 1.58 213 HSP # 47 (Rural Intersection) Prepared April 23, 215 By Bryan Emery Existing Conditions This study contains the
INTERSECTION ANALYSIS PARK AVENUE AND BRADDOCK ROAD (FROSTBURG, MD) FOR LENHART TRAFFIC CONSULTING, INC.
 FOR LENHART TRAFFIC CONSULTING, INC.") INTERSECTION ANALYSIS FOR PARK AVENUE AND BRADDOCK ROAD (FROSTBURG, MD) Prepared for: City of Frostburg, Maryland & Allegany County Commissioners Prepared by: LENHART TRAFFIC CONSULTING, INC. TRAFFIC ENGINEERING
INTERSECTION ANALYSIS FOR PARK AVENUE AND BRADDOCK ROAD (FROSTBURG, MD) Prepared for: City of Frostburg, Maryland & Allegany County Commissioners Prepared by: LENHART TRAFFIC CONSULTING, INC. TRAFFIC ENGINEERING
MEMO VIA . Ms. Amy Roth DPS Director, City of Three Rivers. To:
 MEMO To: Ms. Amy Roth DPS Director, City of Three Rivers VIA EMAIL From: Michael J. Labadie, PE Julie M. Kroll, PE, PTOE Brandon Hayes, PE, P.Eng. Fleis & VandenBrink Date: January 5, 2017 Re: Proposed
Clean Harbors Canada, Inc.
 Clean Harbors Canada, Inc. Proposed Lambton Landfill Expansion Environmental Assessment Terms of Reference Transportation Assessment St. Clair Township, Ontario September 2009 itrans Consulting Inc. 260
CC SUPPORTING DOC PDF POMEROY-CENTRAL AWS REPORT W-EXHIBIT A.PDF POMEROY-ELM SWA REPORT W-EXHIBITS.PDF
 1. Agenda Documents: AGENDA.03.06.2018.PDF 2. Supporting Documentation Documents: CC SUPPORTING DOC. 2018.03.06.PDF POMEROY-CENTRAL AWS REPORT W-EXHIBIT A.PDF POMEROY-ELM SWA REPORT W-EXHIBITS.PDF COMMON
Transit City Etobicoke - Finch West LRT
 Delcan Corporation Transit City Etobicoke - Finch West LRT APPENDIX D Microsimulation Traffic Modeling Report March 2010 March 2010 Appendix D CONTENTS 1.0 STUDY CONTEXT... 2 Figure 1 Study Limits... 2
Transportation & Traffic Engineering
 Transportation & Traffic Engineering 1) Project Description This report presents a summary of findings for a Traffic Impact Analysis (TIA) performed by A+ Engineering, Inc. for the Hill Country Family
Traffic Feasibility Study
 Traffic Feasibility Study Town Center South Robbinsville Township, Mercer County, New Jersey December 19, 2017 Prepared For Robbinsville Township Department of Community Development 2298 Route 33 Robbinsville,
Proposed CVS/pharmacy
 Traffic Impact and Access Study Proposed CVS/pharmacy West Main Street (Route 1) at Hull Street Clinton, Connecticut PREPARED FOR Arista Development LLC 520 Providence Highway, Suite 9 Norwood, Massachusetts
Alpine Highway to North County Boulevard Connector Study
 Alpine Highway to North County Boulevard Connector Study prepared by Avenue Consultants March 16, 2017 North County Boulevard Connector Study March 16, 2017 Table of Contents 1 Summary of Findings... 1
Roundabout Feasibility Study SR 44 at Grand Avenue TABLE OF CONTENTS
 Roundabout Feasibility Study SR 44 at Grand Avenue TABLE OF CONTENTS Introduction and Executive Summary... 1 Existing Conditions... 3 Intersection Volume Conditions... 5 Intersection Operations... 9 Safety
TRANSPORTATION TECHNICAL REPORT
 TRANSPORTATION TECHNICAL REPORT for Sunrise Elementary School Replacement PREPARED FOR: Puyallup School District PREPARED BY: 6544 NE 61 st Street, Seattle, WA 98115 ph: (26) 523-3939 fx: (26) 523-4949
VOA Vista Drive Residential housing Development TIA Project #13915 TABLE OF CONTENTS
 VOA Vista Drive Residential housing Development TIA Project #13915 TABLE OF CONTENTS Executive Summary... 2 Project Background... 2 Conditions... 2 Findings... 3 Recommendations... 4 Introduction... 6
West Hills Shopping Centre Lowe s Expansion Traffic Impact Study
 West Hills Shopping Centre Lowe s Expansion Traffic Impact Study Prepared for: Armel Corporation January 2015 Paradigm Transportation Solutions Ltd. 22 King Street South, Suite 300 Waterloo ON N2J 1N8
Table of Contents. Traffic Impact Analysis Capital One Building at Schilling Place
 Traffic Impact Analysis Capital One Building at Schilling Place Table of Contents Executive Summary... 1 1. Introduction... 4 2. Project Description... 4 3. Background Information... 4 4. Study Scope...
Traffic Impact Statement (TIS)
") Traffic Impact Statement (TIS) Vincentian PUDA Collier County, FL 10/18/2013 Prepared for: Global Properties of Naples Prepared by: Trebilcock Consulting Solutions, PA 2614 Tamiami Trail N, Suite 615 1205
Traffic Impact Statement (TIS) Vincentian PUDA Collier County, FL 10/18/2013 Prepared for: Global Properties of Naples Prepared by: Trebilcock Consulting Solutions, PA 2614 Tamiami Trail N, Suite 615 1205
HUMC/Mountainside Hospital Redevelopment Plan
 Traffic and Parking Analysis HUMC/Mountainside Hospital Redevelopment Plan in Glen Ridge Borough and Montclair Township PREPARED FOR H2M 119 Cherry Hill Road, Suite 110 Parsippany, NJ 07054 862.207.5900
APPENDIX E. Traffic Analysis Report
 APPENDIX E Traffic Analysis Report THIS PAGE INTENTIONALLY BLANK EAGLE RIVER TRAFFIC MITIGATION PHASE I OLD GLENN HIGHWAY/EAGLE RIVER ROAD INTERSECTION IMPROVEMENTS TRAFFIC ANALYSIS Eagle River, Alaska
One Harbor Point Residential
 Residential Gig Harbor, WA Transportation Impact Analysis January 23, 2017 Prepared for: Neil Walter Company PO Box 2181 Tacoma, WA 98401 Prepared by: TENW Transportation Engineering NorthWest 11400 SE
Traffic Impact Analysis Update
 Willow Bend Traffic Impact Analysis Update TABLE OF CONTENTS Page I. INTRODUCTION -------------------------------------------------------------------------------------------- 1 II. EXISTING CONDITIONS
TRAFFIC IMPACT ANALYSIS FOR. McDONALD S RESTAURANT IN CARMICAEL Sacramento County, CA. Prepared For:
 TRAFFIC IMPACT ANALYSIS FOR McDONALD S RESTAURANT IN CARMICAEL Sacramento County, CA Prepared For: McDonald s USA, LLC Pacific Sierra Region 2999 Oak Road, Suite 900 Walnut Creek, CA 94597 Prepared By:
Table of Contents INTRODUCTION... 3 PROJECT STUDY AREA Figure 1 Vicinity Map Study Area... 4 EXISTING CONDITIONS... 5 TRAFFIC OPERATIONS...
 Crosshaven Drive Corridor Study City of Vestavia Hills, Alabama Table of Contents INTRODUCTION... 3 PROJECT STUDY AREA... 3 Figure 1 Vicinity Map Study Area... 4 EXISTING CONDITIONS... 5 TRAFFIC OPERATIONS...
County State Aid Highway 30 (Diffley Road) and Dodd Road Intersection Study
 and Dodd Road Intersection Study") County State Aid Highway 30 (Diffley Road) and Dodd Road Intersection Study City of Eagan, Dakota County, Minnesota Date: March 2012 Project No. 14957.000 444 Cedar Street, Suite 1500 Saint Paul, MN 55101
County State Aid Highway 30 (Diffley Road) and Dodd Road Intersection Study City of Eagan, Dakota County, Minnesota Date: March 2012 Project No. 14957.000 444 Cedar Street, Suite 1500 Saint Paul, MN 55101
Proposed Inn at Bellefield Traffic Impact Assessment
 Proposed Inn at Bellefield Traffic Impact Assessment Town of Hyde Park Dutchess County, New York Prepared for: T-Rex Hyde Park Owner LLC 500 Mamroneck Avenue, Suite 300 Harrison, NY 10528 June 21, 2017
Provide an overview of the development proposal including projected site traffic volumes;
 December 19, 2013 File: 163600935 Attention: Troy Elliott Carl Elliott Limited 15-1831 Robertson Road PO Box 11117 Nepean, Ontario K1H 7T8 Dear Mr. Elliott, Reference: 2235 and 2265 Robertson Road Transportation
Oakbrook Village Plaza City of Laguna Hills
 Oakbrook Village Plaza City of Laguna Hills Traffic Impact Analysis Prepared by: HDR Engineering 3230 El Camino Real, Suite 200 Irvine, CA 92602 October 2012 Revision 3 D-1 Oakbrook Village Plaza Laguna
TRAFFIC DATA. Existing Derousse Ave./River Rd. AM LOS Analysis Existing Derousse Ave./River Rd. PM LOS Analysis
 Appendix E NJ TRANSIT Pennsauken Junction Transit Center and Park & Ride RiverLINE and Atlantic City Line Pennsauken Township, Camden County, New Jersey TRAFFIC DATA Background Traffic Information for
TRAFFIC IMPACT ANALYSIS RIZZO CONFERENCE CENTER EXPANSION FINAL REPORT
 TRAFFIC IMPACT ANALYSIS RIZZO CONFERENCE CENTER EXPANSION Chapel Hill, North Carolina FINAL REPORT Prepared for: The Town of Chapel Hill, NC Prepared by: Architects-Engineers-Planners, Inc. December 2010
Section 5.0 Traffic Information
 Section 5.0 Traffic Information 10.0 TRANSPORTATION MDM Transportation Consultants, Inc. (MDM) has prepared an evaluation of transportation impacts for the proposed evaluation for the expansion of the
NEWCASTLE MIDDLE SCHOOL Traffic Impact Analysis
 Gibson Traffic Consultants 2802 Wetmore Avenue Suite 220 Everett, WA 98201 425.339.8266 NEWCASTLE MIDDLE SCHOOL Traffic Impact Analysis Prepared for: Renton School District Jurisdiction: City of Newcastle
IV. REVISIONS TO THE DRAFT IS/MND
 IV. REVISIONS TO THE DRAFT IS/MND 1. REVISIONS TO THE DRAFT IS/MND This section presents corrections and clarifications that have been made to the text of the Draft IS/MND. These changes include revisions
PROJECT: Wilkinson Road Corridor Improvement Traffic Management Planning Project SUBJECT: Traffic Analysis
 TECHNICAL MEMORANDUM DATE: September 10, 2014 PROJECT 5861.03 NO: PROJECT: Wilkinson Road Corridor Improvement Traffic Management Planning Project SUBJECT: Traffic Analysis TO: Steve Holroyd - District
ZINFANDEL LANE / SILVERADO TRAIL INTERSECTION TRAFFIC ANALYSIS
 ZINFANDEL LANE / SILVERADO TRAIL INTERSECTION TRAFFIC ANALYSIS UPDATED TRAFFIC STUDY FOR THE PROPOSED RAYMOND VINEYARDS WINERY USE PERMIT MODIFICATION #P11-00156 AUGUST 5, 2014 PREPARED BY: OMNI-MEANS,
KUM & GO 6400 WESTOWN PARKWAY WEST DES MOINES, IOWA 50266
 KUM & GO #300 PECOS STREET & 88 TH AVENUE THORNTON, COLORADO TRAFFIC IMPACT STUDY REVISION 1 PREPARED FOR KUM & GO 6400 WESTOWN PARKWAY WEST DES MOINES, IOWA 50266 JANUARY 23, 2014 OA PROJECT NO. 013-1721
TRAFFIC IMPACT DATA. Dillons #98 On-Site Relocation
 TRAFFIC IMPACT DATA For Dillons #98 On-Site Relocation COMMERCIAL DEVELOPMENT 1740 Massachusetts Street Lawrence, KS Revised April 6, 2011 Prepared by: Pickering Firm, Inc. Introduction The project site
Traffic Analysis for Bon Air Bridge Mitigation Magnolia Storm Water Quality Project
 Memo To: Paul DiDonato, ATI Architects and Engineers From: David Parisi, PE and Ashley Tam, EIT Date: February 23, 216 Subject: Traffic Analysis for Bon Air Bridge Mitigation Magnolia Storm Water Quality
Trafalgar Road & Lower Base Line Transportation Study Ontario Inc.
 Trafalgar Road & Lower Base Line Transportation Study 1255723 Ontario Inc. Trafalgar Road & Lower Base Line Transportation Study 1255723 Ontario Inc. 1465 Pickering Parkway Suite 200 Pickering ON L1V 7G7
King County Metro. Columbia Street Transit Priority Improvements Alternative Analysis. Downtown Southend Transit Study. May 2014.
 King County Metro Columbia Street Transit Priority Improvements Alternative Analysis Downtown Southend Transit Study May 2014 Parametrix Table of Contents Introduction... 1 Methodology... 1 Study Area...
4131 Chain Bridge Road
 Traffic Impact Study 4131 Chain Bridge Road City of Fairfax, VA 05/04/16 May 4, 2016 Prepared for: Paradigm 1415 North Taft Street Suite 100 Arlington, VA 22201 This report is printed on environmentally
Lacey Gateway Residential Phase 1
 Lacey Gateway Residential Phase Transportation Impact Study April 23, 203 Prepared for: Gateway 850 LLC 5 Lake Bellevue Drive Suite 02 Bellevue, WA 98005 Prepared by: TENW Transportation Engineering West
TRAFFIC IMPACT ANALYSIS FOR THE 630/650 SOUTH STREET RETAIL DEVELOPMENT WRENTHAM, MASSACHUSETTS
 PARE PROJECT NO. 17120.00 REPORT TRAFFIC IMPACT ANALYSIS FOR THE 630/650 SOUTH STREET RETAIL DEVELOPMENT WRENTHAM, MASSACHUSETTS SUBMITTED TO: GEORGETOWN CAPITAL MANAGEMENT PO BOX 369 GEORGETOWN, MA 01833
HIGHWAY 28 FUNCTIONAL DESIGN
 HIGHWAY 28 FUNCTIONAL DESIGN PUBLIC OPEN HOUSE #1 WEDNESDAY, MARCH 12, 2014 Stantec Presenters: Brad Vander Heyden, Project Engineer Neal Cormack, Project Manager Dave Parker, Project Engineer Beth Thola,
TRAFFIC IMPACT STUDY. USD #497 Warehouse and Bus Site
 TRAFFIC IMPACT STUDY for USD #497 Warehouse and Bus Site Prepared by: Jason Hoskinson, PE, PTOE BG Project No. 16-12L July 8, 216 145 Wakarusa Drive Lawrence, Kansas 6649 T: 785.749.4474 F: 785.749.734
Traffic Impact Study for Proposed Olive Boulevard Development
 Traffic Impact Study for Proposed 11330 Olive Boulevard Development Creve Coeur, Missouri July 7, 2017 Prepared For: 11330 Olive Boulevard Development 11330 Olive Boulevard Creve Coeur, Missouri 63141
TRAFFIC IMPACT STUDY DERRY GREEN CORPORATE BUSINESS PARK MILTON SECONDARY PLAN MODIFICATION
 TRAFFIC IMPACT STUDY DERRY GREEN CORPORATE BUSINESS PARK MILTON SECONDARY PLAN MODIFICATION TRAFFIC IMPACT STUDY DERRY GREEN CORPORATE BUSINESS PARK MILTON SECONDARY PLAN MODIFICATION DECEMBER 2014 UPDATED
GASOLINE SERVICE STATION 1618, 1622 ROGER STEVENS DRIVE OTTAWA, ONTARIO TRANSPORTATION IMPACT ASSESSMENT. Prepared for:
 GASOLINE SERVICE STATION 1618, 1622 ROGER STEVENS DRIVE OTTAWA, ONTARIO TRANSPORTATION IMPACT ASSESSMENT Prepared for: Invecta Development (Ottawa) Corporation 758 Shanks Height Milton, ON L9T 7P7 May
County State Aid Highway 32 (Cliff Road) and Dodd Road Intersection Study
 and Dodd Road Intersection Study") County State Aid Highway 32 (Cliff Road) and Dodd Road Intersection Study City of Eagan, Dakota County, Minnesota Date: March 2012 Project No. 14957.000 444 Cedar Street, Suite 1500 Saint Paul, MN 55101
County State Aid Highway 32 (Cliff Road) and Dodd Road Intersection Study City of Eagan, Dakota County, Minnesota Date: March 2012 Project No. 14957.000 444 Cedar Street, Suite 1500 Saint Paul, MN 55101
Intersection Control Evaluation
 Intersection Control Evaluation Stoltzman Road at Pleasant Street in Mankato, Blue Earth County, Minnesota Mankato/North Mankato Area Planning Organization October 2017 SRF No. 10279 Table of Contents
TRAFFIC IMPACT ANALYSIS. for MILTON SQUARE
 TRAFFIC IMPACT ANALYSIS for MILTON SQUARE US Route 7 Milton, Vermont March 5, 2008 LAMOUREUX & DICKINSON 14 Morse Drive Essex Junction, Vermont 05452 (802) 878-4450 Traffic Impact Assessment EXECUTIVE
APPENDIX B Traffic Analysis
 APPENDIX B Traffic Analysis Rim of the World Unified School District Reconfiguration Prepared for: Rim of the World School District 27315 North Bay Road, Blue Jay, CA 92317 Prepared by: 400 Oceangate,
Traffic Impact Analysis 5742 BEACH BOULEVARD MIXED USE PROJECT
 Traffic Impact Analysis 5742 BEACH BOULEVARD MIXED USE PROJECT CITY OF BUENA PARK Prepared by Project No. 14139 000 April 17 th, 2015 DKS Associates Jeffrey Heald, P.E. Rohit Itadkar, T.E. 2677 North Main
MURRIETA APARTMENTS TRAFFIC IMPACT ANALYSIS CITY OF MURRIETA, CALIFORNIA
 MURRIETA APARTMENTS TRAFFIC IMPACT ANALYSIS CITY OF MURRIETA, CALIFORNIA SEPTEMBER 20, 2012 Prepared for: Golden Eagle Multi-Family Properties, LLC 6201 Oak Canyon Rd., Suite 250 Irvine, CA 92618 Prepared
November 1, Mr. Jafar Tabrizi President, Tabrizi Rugs 180 Bedford Highway. Traffic Impact Statement BH-1 and BH-2, Southgate Drive, Bedford, NS
 161-12598 Mr. Jafar Tabrizi President, Tabrizi Rugs 180 Bedford Highway Bedford, NS B4A 1C1 [Via Email: tabrizi@tabrizi.com] RE: Traffic Impact Statement Dear Mr. Tabrizi: Plans are being prepared for
Interstate Operations Study: Fargo-Moorhead Metropolitan Area Simulation Results
 NDSU Dept #2880 PO Box 6050 Fargo, ND 58108-6050 Tel 701-231-8058 Fax 701-231-6265 www.ugpti.org www.atacenter.org Interstate Operations Study: Fargo-Moorhead Metropolitan Area 2025 Simulation Results
Interstate Operations Study: Fargo-Moorhead Metropolitan Area Simulation Output
 NDSU Dept #2880 PO Box 6050 Fargo, ND 58108-6050 Tel 701-231-8058 Fax 701-231-6265 www.ugpti.org www.atacenter.org Interstate Operations Study: Fargo-Moorhead Metropolitan Area 2015 Simulation Output Technical
Appendix H TRAFFIC IMPACT ANALYSIS
 Appendix H TRAFFIC IMPACT ANALYSIS Teichert Boca Quarry Expansion Traffic Impact Analysis Prepared for Teichert Aggregates Prepared by TRANSPORTATION CONSULTANTS, INC. LSC Transportation Consultants, Inc.
105 Toronto Street South, Markdale Transportation Impact Study. Paradigm Transportation Solutions Limited
 105 Toronto Street South, Markdale Transportation Impact Study Paradigm Transportation Solutions Limited December 2016 Project Summary Project Number 162060 December 2016 Client Zelinka Priamo Ltd 318
Volume 1 Traffic Impact Analysis Turtle Creek Boulevard Dallas, Texas. Kimley-Horn and Associates, Inc. Dallas, Texas.
 Volume 1 Traffic Impact Analysis 2727 Dallas, Texas June 18, 2018 Kimley-Horn and Associates, Inc. Dallas, Texas Project #064523000 Registered Firm F-928 Traffic Impact Analysis 2727 Dallas, Texas Prepared
To: File From: Adrian Soo, P. Eng. Markham, ON File: Date: August 18, 2015
 Memo To: From: Adrian Soo, P. Eng. Markham, ON : 165620021 Date: Reference: E.C. Row Expressway, Dominion Boulevard Interchange, Dougall Avenue Interchange, and Howard 1. Review of Interchange Geometry
Appendix H: Construction Impacts H-2 Transportation
 Appendix H: Construction Impacts H-2 Transportation \ AECOM 71 W. 23 rd Street New York, NY 10010 www.aecom.com 212 366 6200 tel 212 366 6214 fax Memorandum To CC Subject Robert Conway Donald Tone Construction
MADERAS HOTEL TRANSPORTATION IMPACT ANALYSIS. LLG Ref Transportation Planner III & Jorge Cuyuch Transportation Engineer I
 TRANSPORTATION IMPACT ANALYSIS MADERAS HOTEL Poway, California June 21, 2016 LLG Ref. 3-16-2602 Prepared by: Amelia Giacalone Transportation Planner III & Jorge Cuyuch Transportation Engineer I Under the
Prepared For: Toronto Transit Commission 1138 Bathurst Street Toronto, Ontario M5R 3H2. Prepared By:
 TRAFFIC IMPACT STUDY FOR THE TTC MCNICOLL BUS GARAGE CITY OF TORONTO Prepared For: Toronto Transit Commission 1138 Bathurst Street Toronto, Ontario M5R 3H2 Prepared By: Canada Inc. 4th Floor, 3 Leek Crescent
TRANSPORTATION STUDY FOR THE 8899 BEVERLY BOULEVARD PROJECT
 DRAFT TRANSPORTATION STUDY FOR THE 8899 BEVERLY BOULEVARD PROJECT WEST HOLLYWOOD, CALIFORNIA NOVEMBER 2013 PREPARED FOR BEVERLY BOULEVARD ASSOCIATION PREPARED BY DRAFT TRANSPORTATION STUDY FOR THE 8899