Date: February 7, 2017 John Doyle, Z-Best Products Robert Del Rio. T.E. Z-Best Traffic Operations and Site Access Analysis
|
|
|
- Bernadette Fleming
- 5 years ago
- Views:
Transcription
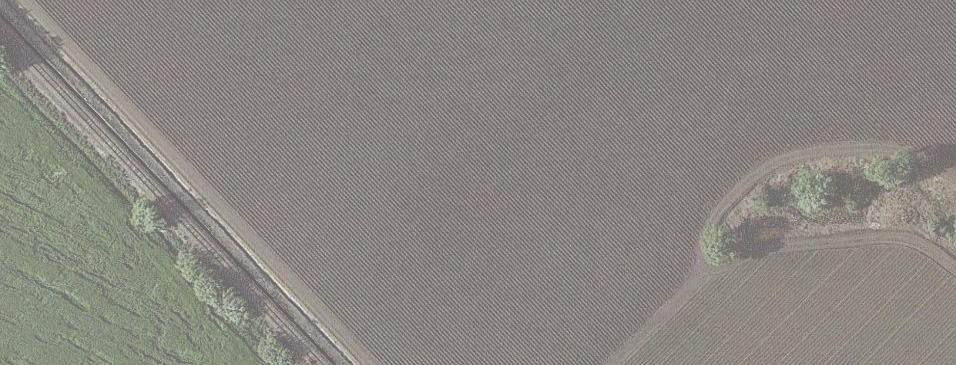
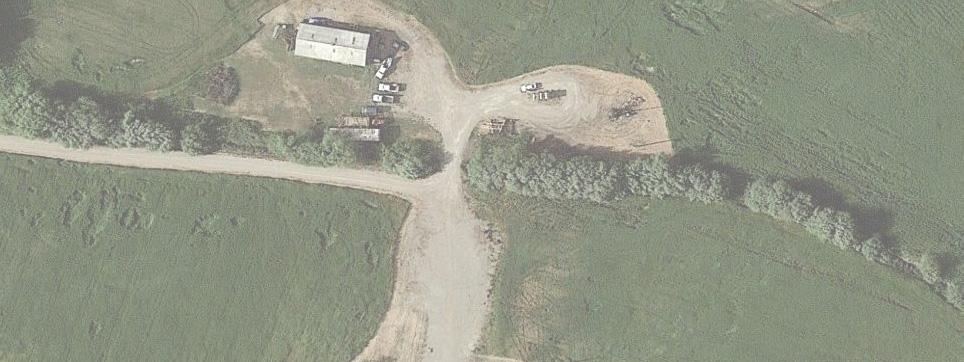
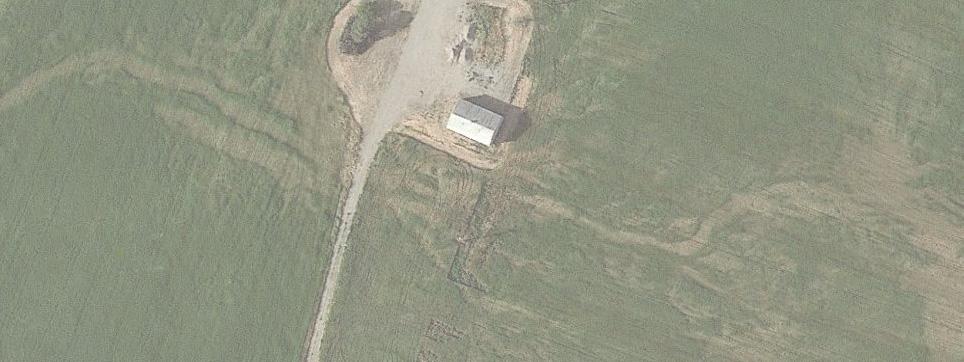
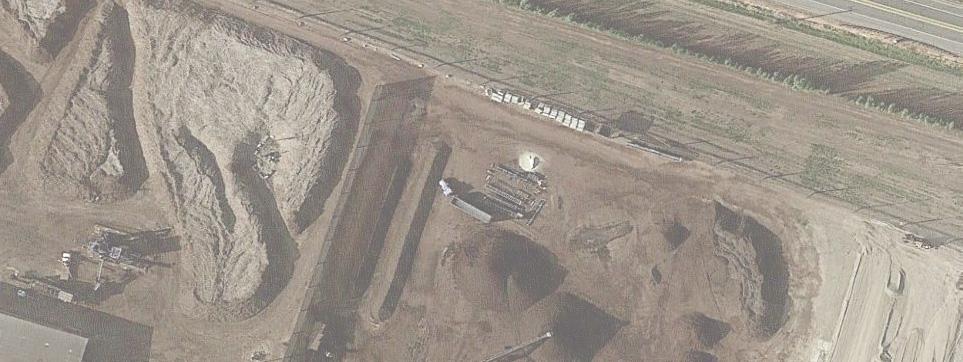
1 Memorandum Date: February 7, 07 To: From: Subject: John Doyle, Z-Best Products Robert Del Rio. T.E. Z-Best Traffic Operations and Site Access Analysis Introduction Hexagon Transportation Consultants, Inc. has completed a traffic operations and site access analysis for the proposed improvements at the existing Z-Best Compost Facility located along State Route (SR) 5, south of the City of Gilroy in southern Santa Clara County, California. The proposed project consists of material processing improvements on the existing site to more efficiently process a larger volume of material. Access to the project site is currently provided via one stop-controlled full access entrance along the south side of SR 5 (for ease of reference, SR 5 will be referred to as an east/west roadway within this report). The purpose of the traffic operations analysis is to determine the magnitude of project traffic currently on the adjacent roadway system and estimate the amount of additional traffic that would be added to the roadway system as a result of the proposed facility operations expansion (hereafter referred to as the proposed project). Existing traffic operational and/or safety constraints at the site access point and on the surrounding roadways and intersections also will be evaluated. The analysis of the transportation system is based on applicable local and regional standards. Project Overview Existing Facility The Z-Best facility (project site) is located on the south side of SR 5 in south Santa Clara County. Access to the project site is provided via one existing entrance (hereafter referred to as project entrance), which intersects with SR 5. Currently, the facility is permitted to receive up to 500 tons per day of feedstock material, inert material for facility maintenance, and additives used in finished products. Feedstock includes both green waste and municipal solid waste (MSW). Up to,500 tons per day of material may be received a maximum of 5 days per year and subset peak tonnages are set at,00 tons per day for green waste, 700 tons per day of MSW, and 500 tons per day of other material. The current hours of operation for the Z-Best facility are Monday through Friday AM to 5 PM and Saturday AM to PM. The existing use permit allows the processing building to operate from AM to 0 PM, the overall facility from AM to PM, and the windrow materials receiving, screening and turning (on-site) to be 4 hours a day. The facility is currently operated by 58 full-time employees (allowable maximum number of employees by current use permit is 0 employees) in five shift times (5 AM to 5 PM, 7 AM to 5 PM, 5 PM to 5 AM, 5 PM to :0 AM, and AM to 5 PM), with the majority of the employees (0 employees) working between 5 AM and 5 PM. Access to the project site is currently provided via one existing entrance along SR 5 located approximately 00 feet (ft.) west of the Bolsa Road intersection with SR 5. The existing work shift times and number of employees per shift are summarized in Table. The project site location is presented in Figure.

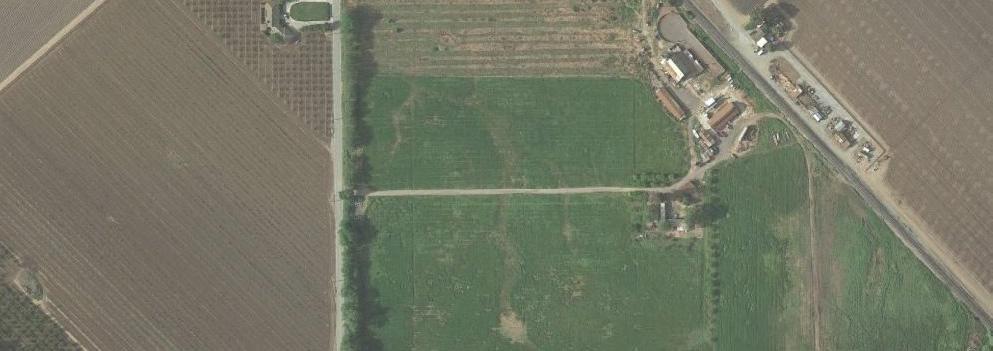
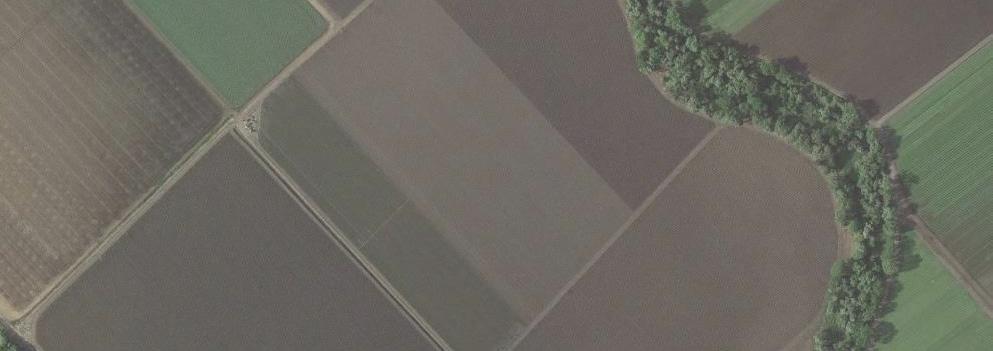
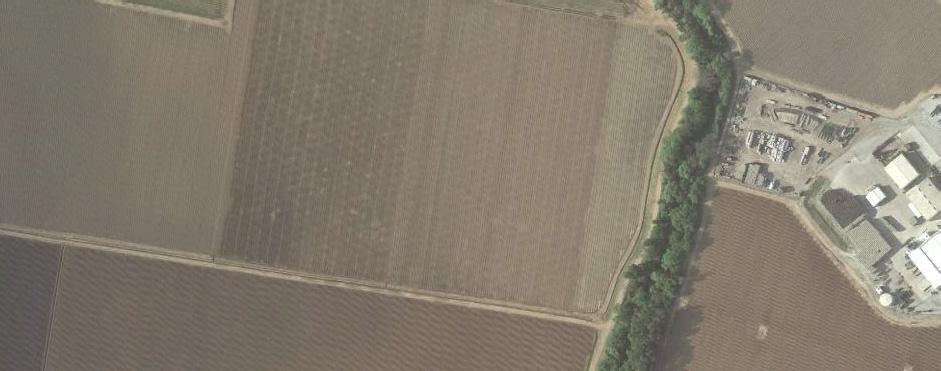
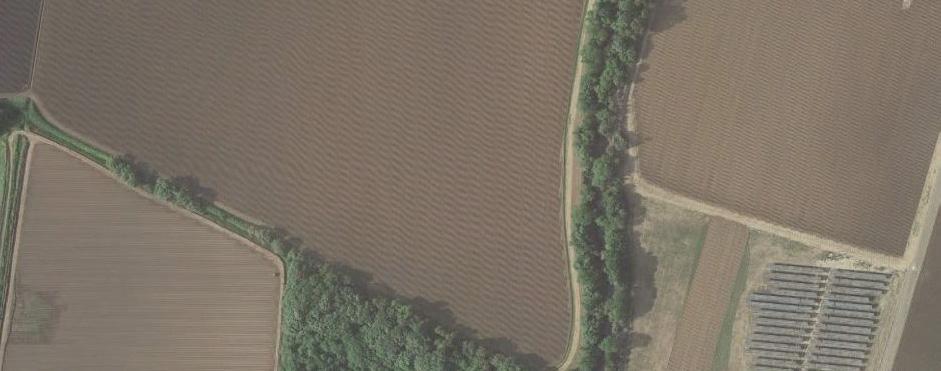
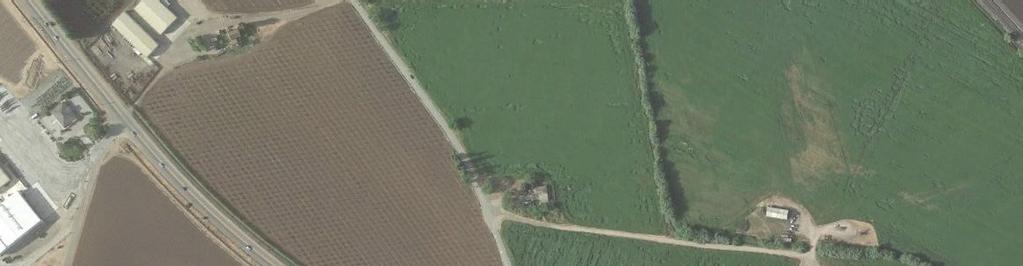
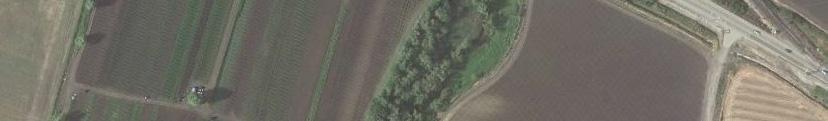


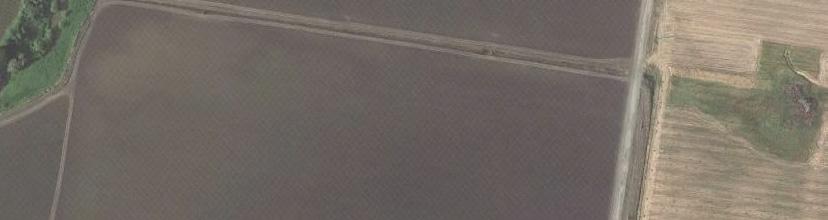


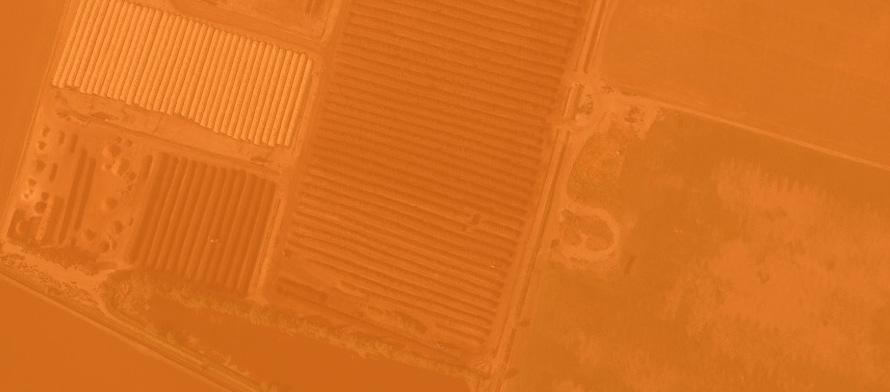


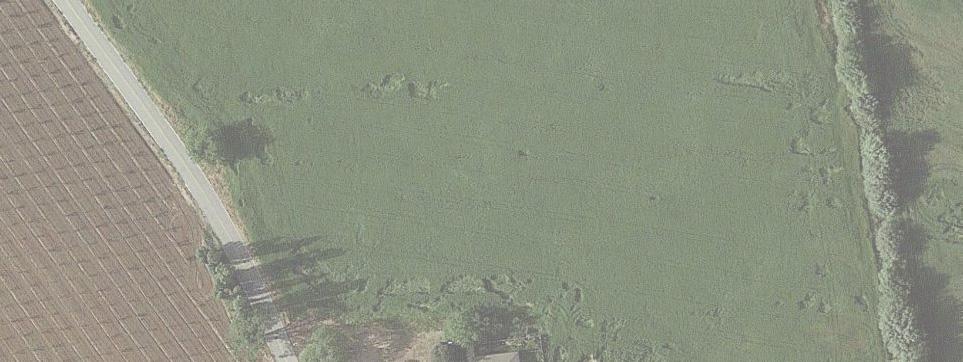
2 Z-Best Facility Traffic Operations and Site Access Analysis February 7, 07 Figure Z-Best Site Location Page
3 Z-Best Facility Traffic Operations and Site Access Analysis February 7, 07 Table Existing and Proposed Employee Work Shift Times Hours of Operation Existing Conditions Proposed Conditions :00 AM to :00 AM :00 AM 4 to :00 AM 4 :00 AM 9 to :00 AM :00 AM to 4:00 AM 4:00 AM to 5:00 AM 0 * * 5:00 AM 5 to :00 AM * :00 AM 9 to 7:00 AM 7 * SHIFT 7:00 AM to 8:00 AM 8:00 AM to 9:00 AM 9:00 AM to 0:00 AM 0:00 AM to :00 AM :00 AM to :00 PM :00 PM to :00 PM :00 PM to :00 PM :00 PM to :00 PM SHIFT SHIFT SHIFT SHIFT :00 PM to 4:00 PM 9 * 4:00 PM to 5:00 PM 5 * 4 * 5:00 PM 0 7 to :00 PM SHIFT SHIF :00 PM to 7:00 PM 7:00 PM to 8:00 PM 8:00 PM to 9:00 PM 9:00 PM to 0:00 PM 0:00 PM 4 SHIFT SHIFT to :00 PM 9 * :00 PM SHIFT to :00 AM 5 SHIFT SHIFT Notes: Existing facility shift times and number of employees per shift (assumes employees will arrive at the site 5 minutes prior to the beginning of their work shifts and leave the site 5 minutes after completion of their work shift). Proposed facility shift times and assumed number of employees per shift (assumes employees will arrive at the site 5 minutes prior to the beginning of their work shifts and leave the site 5 minutes after completion of their work shift). * Number of employees per work shift. Page
4 Z-Best Facility Traffic Operations and Site Access Analysis February 7, 07 Proposed Facility Improvements The proposed improvements (the project), involves replacing the current method of composting MSW with a more advanced, far more efficient method of composting. The current CTI composting system is proposed to be replaced with a State of the Art ECS composting method. With these proposed improvements, Z-Best will be able to compost more than double the amount of MSW feedstock within the same time period and within the same footprint on the site. Subsequently, Z-Best is proposing an increase in the daily feedstock tonnage limit from,500 tons per day to,750 tons per day. The additional feedstock tonnage is proposed to be received only at night during non-peak traffic hours. The number of employees also is proposed to increase from the current 58 employees (0 allowed by the use permit) to employees (with a maximum of 90 employees allowed by the use permit). The proposed new work shift times would be the following: 5 AM to PM, 4 PM to AM, and PM to AM. The proposed work shift times and assumed number of employees per shift are summarized in Table. It is anticipated that with the expanded operations, the facility would be able to serve an additional 57 trucks per day. All new truck trips are proposed to access the project site outside of the standard peak commute hours (7-9 AM and 4- PM). Truck traffic originating from and bound for the project site is currently restricted from using Bolsa Road. All new truck and vehicular traffic originating from and bound for the project site would continue to be restricted to the use of only SR 5 to SR 5 and US 0. Scope of Study This study estimates the additional traffic that would be generated with the proposed Zbest facility expansion and evaluates the effects of the additional traffic and possible roadway improvements at the project site entrance and along SR 5. Caltrans has initiated a study to eventually replace. miles of the existing SR 5 two-lane highway with a four-lane expressway in San Benito and Santa Clara Counties, including the segment along the project s frontage. Therefore, the analysis includes and evaluation of project conditions with the potential future SR 5 improvements in place. The analysis consists of the evaluation of current traffic operations at the study intersections and future traffic operations with the proposed project under both the existing and future roadway network. The traffic operations analyses at the study intersections consist of peak hour level of service analysis, signal warrant checks, and queuing analysis. The analysis includes an evaluation of traffic conditions during the AM (7:00-9:00 AM) and PM (4:00-:00 PM) peak commute periods at the following two intersections: SR 5 and Project Entrance SR 5 and Bolsa Road Each of the components of the intersection analyses are described in the following sections. Additionally, roadway segments along SR 5, east and west of the project site, also were evaluated to identify any existing deficiencies and to quantify the amount of additional traffic that is projected to be added by the proposed project. Potential SR 5 Widening and Realignment Caltrans has identified operational problems during the peak commute hours along the SR 5 corridor and at the US 0/SR 5 interchange, which are due primarily to the capacity constraints of the highway and interchange. Thus, Caltrans has initiated the study for the widening and realignment of SR 5 that will include the segment along the project s frontage and realignment of Bolsa Road. In the vicinity of the project site, SR 5 consists of an undivided two-lane State highway with a posted speed limit of 55 miles per hour (mph) in both directions of travel. In June 0, Caltrans approved the Hollister to Gilroy State Route 5 Route Adoption project. In the Route Adoption study, Caltrans identifies two alternatives (plus a No Build alternative) to eventually replace. miles of the existing SR 5 two-lane highway with a four-lane expressway in San Benito and Santa Clara Counties. A route adoption would require San Benito and Santa Clara Counties to adopt a specific corridor for the future expressway into their General Plans, for the purpose of acquiring most or all parcels within the defined corridor area. The route adoption study extends from San Felipe Road (in Hollister) to the end of SR 5 at US 0 in Santa Clara County. Page 4
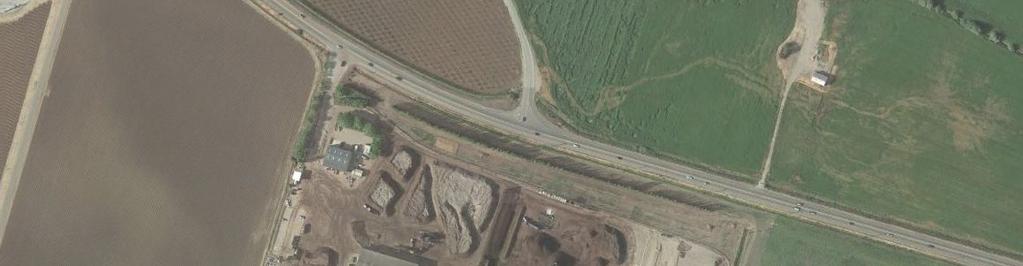
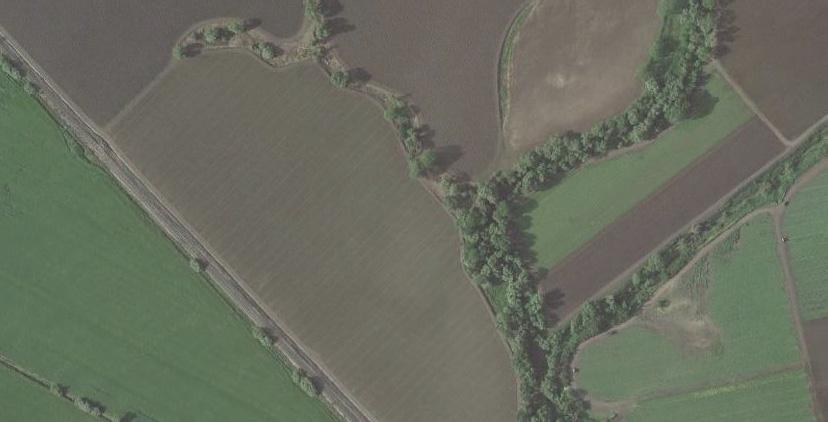
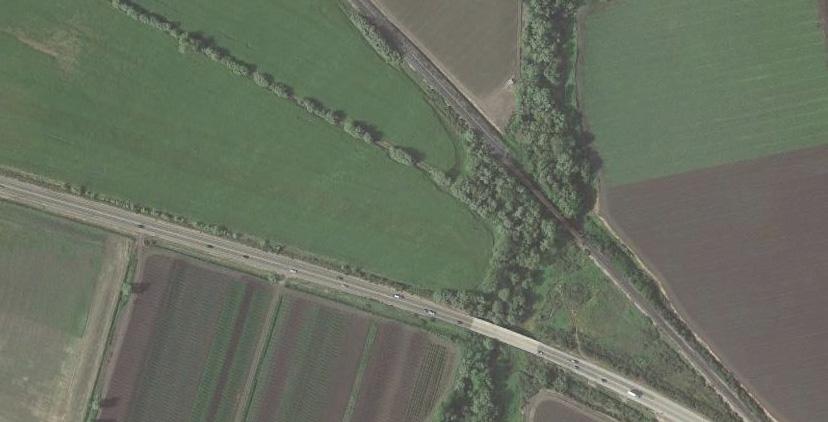
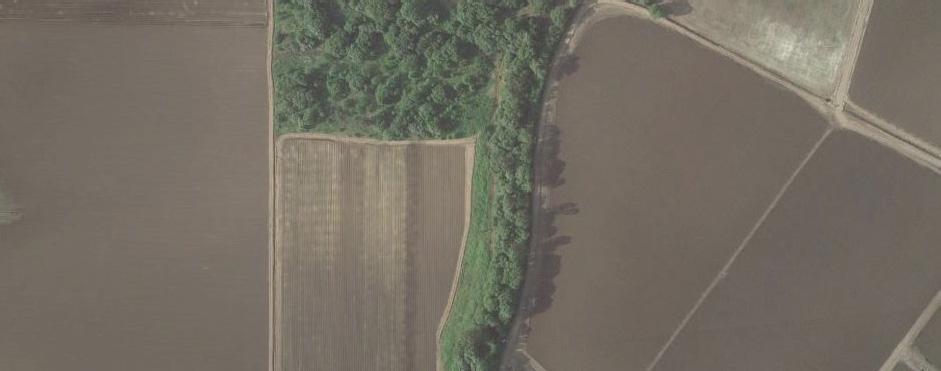
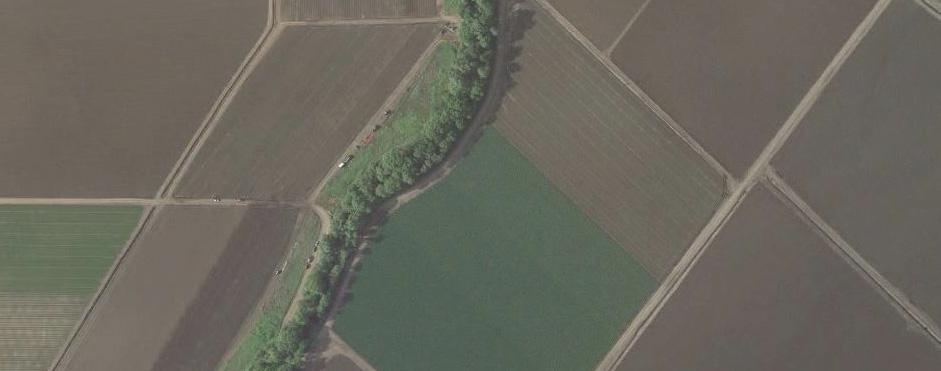
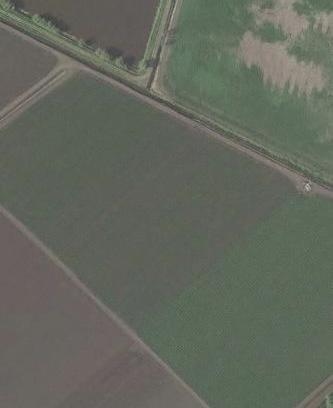
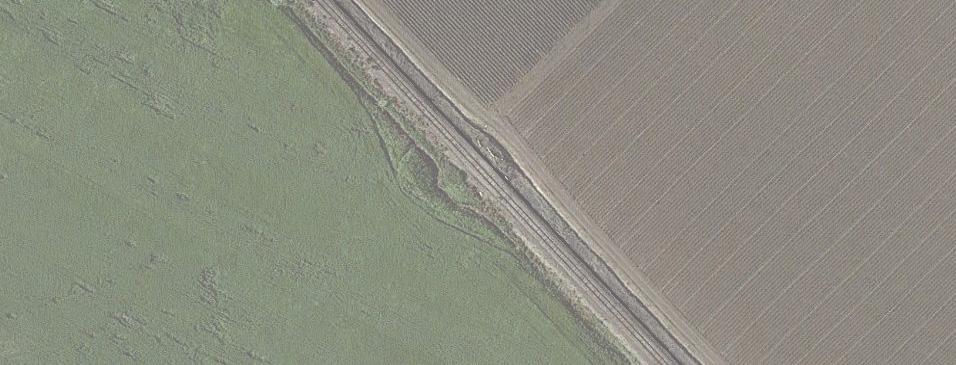
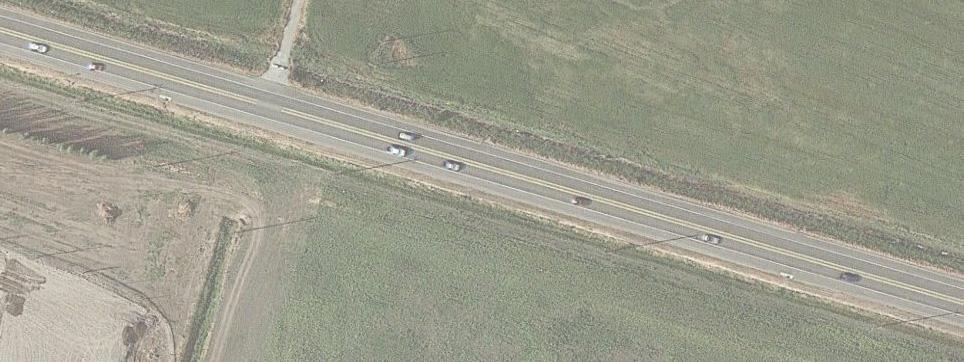
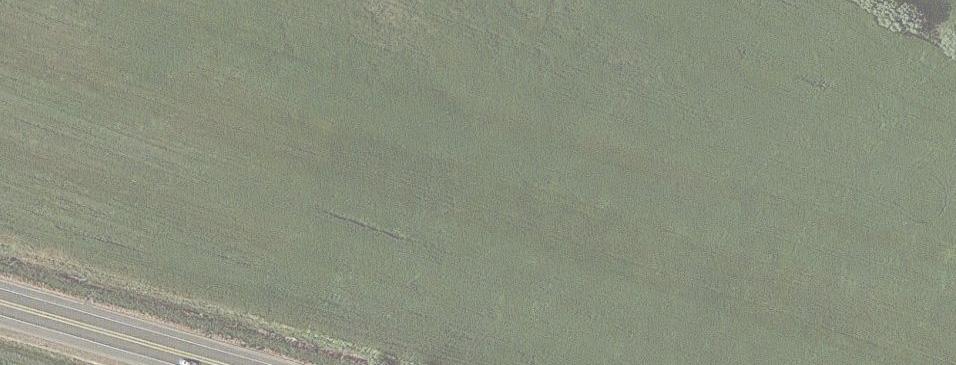
5 Z-Best Facility Traffic Operations and Site Access Analysis February 7, 07 Both route adoption alternatives are. miles long and share the same alignment from US 0 to approximately ½ mile east of Shore Road. The project site entrance is located within this area. The proposed improvements would include the realignment of both SR 5 and Bolsa Road, which would result in new intersections of Bolsa Road with the new realigned SR 5 and the existing SR 5 east of the existing Bolsa Road/SR 5 intersection. Although the actual SR 5 widening and realignment project has yet to be designed, approved, and funded, if constructed, it will affect project site access. The exact SR 5 realignment and location of the potential new intersection with Bolsa Road is not known at this time. However, the Route Adoption Alternatives and plans (prepared by Caltrans and shown on Figure ) indicate the following: The realignment of SR 5 would begin east of Bloomfield Road and run north of and parallel to the existing SR 5 alignment from this point past Shore Road. The existing SR 5 would become a frontage road and would continue to provide direct access to the adjacent parcels/land uses, including the project site. The existing segment of Bolsa Road, between the existing SR 5 and north of the realigned SR 5 would be abandoned, eliminating the existing Bolsa Road/SR 5 intersection. The new Bolsa Road realignment would extend eastward adjacent to the existing Union Pacific Railroad tracks and intersect with both the realigned SR 5 and the existing SR 5 just east of the project site. With the potential realignment of SR 5 and Bolsa Road, all project traffic bound for and originating from the Z-Best facility would utilize the new Bolsa Road intersection with the realigned SR 5. Study Scenarios This traffic study evaluates traffic conditions at the study intersections with both the existing roadway network and the planned SR 5 improvements. The study intersections were evaluated for the following study scenarios: Existing Conditions: Existing conditions represent existing peak-hour traffic volumes on the existing roadway network. Existing peak hour traffic volumes at the project entrance and Bolsa Road intersections with SR 5 were obtained from new (August 05) intersection turn movement counts. Existing Plus Project Conditions: Existing Plus Project conditions represent existing peak-hour traffic volumes with the addition of the traffic estimated to be generated by the proposed facility expansion project. This scenario assumes no changes to the existing roadway network. Existing Conditions with SR 5 Realignment: Existing conditions with SR 5 realignment represent reassigned existing traffic volumes at the project entrance and Bolsa Road intersections with the planned SR 5 improvements. Project Conditions with SR 5 Realignment: Project conditions with SR 5 realignment represent reassigned existing plus project traffic volumes at the project entrance and Bolsa Road intersections with the planned SR 5 improvements. Page 5

6 Z-Best Facility Traffic Operations and Site Access Analysis February 7, 07 Figure Potential SR 5 Widening and Realignment Page
7 Z-Best Facility Traffic Operations and Site Access Analysis February 7, 07 Trip Generation, Distribution, and Assignment Existing Trip Generation Project trips currently utilizing the project entrance and on the surrounding roadway system were determined based upon truck scale data provided by Z-Best and existing count data collected at the project entrance. The truck scale data provided by Z-Best includes the daily number of inbound and outbound trucks by hour that passed over the on-site scales during the period of October 0 through September 04, which, according to Z-Best staff, represent peak operations of the facility over the past two years. The existing count data was collected in August 05 and consists of () peak-hour intersection turn-movement counts collected at the site s entrance during the AM peak period (7:00 to 9:00 am) and the PM peak period (4:00 to :00 pm) and () 4- hour vehicle composition video counts also collected at the site s entrance. The new 4-hour vehicle composition data were compared with the truck data provided by Z-Best to validate the truck scale data. The number of daily and peak hour trips to the site associated with all other non-truck traffic also were obtained from the new traffic counts. Other non-truck vehicular trips associated with the site include cars or smaller trucks driven by employees or vendors and parts and supply deliveries. Both the truck scale data provided by Z-Best and new count data are contained in the Appendix. The existing site trip generation data is summarized in Table. Table Existing Site-Generated Trips Peak Hours Daily AM PM Type In Out Total In Out Total In Out Total Total Vehicle Trips Driveway Counts Heavy Truck Trips Truck Trips (Counts) Truck Trips (Scale Data) Notes: AM = one peak-hour between 7:00-9:00 am PM = one peak-hour between 4:00 - :00 pm Daily = 4-hour total Based on peak hour intersection turn-movement and 4-hour daily counts completed at the project site entrance in August 05. Based on vehicle composition obtained from 4-hour daily counts completed ar project site entrance in August 05. Based on truck scale data provided by Z-Best (October st, 0 to December st, 0). The count data collected at the site entrance indicates that the facility currently generates 90 daily vehicle trips with 9 trips occurring during the AM peak hour and trips occurring during the PM peak hour. Based on the vehicle composition data collected at the site entrance, approximately 09 daily truck trips are currently generated by the facility. The truck scale data indicated a peak of 4 daily truck trips. The number of truck trips obtained from the traffic counts is approximately 0% less than that indicated by the truck scale data. However, the truck scale data is reflective of a period of peak operations for the facility over the past two years. Hourly site-generated trips, both truck and non-truck trips, were estimated by correlating the 4-hour count information collected at the site entrance with the current number of employees and their shift-times. Based on this information, all components of traffic currently accessing and leaving the project site throughout the day were estimated (see Table ). It is estimated that approximately 0 truck trips and 80 non-truck trips ( Page 7
8 Z-Best Facility Traffic Operations and Site Access Analysis February 7, 07 Table Hourly Existing and Projected Site-Generated Trips Existing Conditions Proposed Conditions Non-Truck Trips Truck Trips Hours of Operation Non-Truck Trips (Based on Driveway Counts) Truck Trips (Based on Driveway Counts) Total Total Site Trips In Out Total Additional Employee Trips Existing Employee Trips/New Shift Times Other Non- Truck Trips Total Future Non-Truck Trips Total Additional Future Truck Trips Truck Trips Total Total Site Trips Net Additiuonal Trips In Out Total In Out Total :00 AM Arrivals to :00 AM Departures :00 AM Arrivals to :00 AM Departures :00 AM Arrivals to :00 AM Departures :00 AM Arrivals to 4:00 AM Departures :00 AM Arrivals to 5:00 AM Departures :00 AM Arrivals to :00 AM Departures :00 AM Arrivals to 7:00 AM Departures :00 AM Arrivals to 8:00 AM Departures :00 AM Arrivals to 9:00 AM Departures 5 9:00 AM Arrivals to 0:00 AM Departures :00 AM Arrivals to :00 AM Departures 5 :00 AM Arrivals to :00 PM Departures 0 9 :00 PM Arrivals to :00 PM Departures :00 PM Arrivals to :00 PM Departures :00 PM Arrivals 8 0 to :00 PM Departures :00 PM Arrivals to 4:00 PM Departures :00 PM Arrivals to 5:00 PM Departures :00 PM Arrivals to :00 PM Departures :00 PM Arrivals 0 4 to 7:00 PM Departures :00 PM Arrivals to 8:00 PM Departures :00 PM Arrivals to 9:00 PM Departures :00 PM Arrivals to 0:00 PM Departures :00 PM Arrivals to :00 PM Departures 0 4 :00 PM Arrivals to :00 AM Departures TOTAL DAILY TRIPS: Notes: Existing hourly project site traffic activity was estimated based on the existing 4-hour vehicle composition traffic counts conducted at the project site entrance in August 05, in combination with information provided by Z-Best on their current number of employees, employee shift times, and hours of operation. Hourly site traffic projections associated with the proposed Z-Best facility operations expansion. These projections are based on the anticipated increase in the number of employees and number of trucks accessing the site daily, the proposed new employee shift times, and the restriction of all new truck traffic to access the site during the off-peak hours only. Page 8
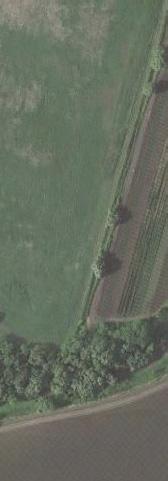
9 Z-Best Facility Traffic Operations and Site Access Analysis February 7, 07 employee trips and 4 other trips), for a total of 90 total trips, are currently generated by the Z-Best Facility on an average weekday. Project Trip Generation Estimates The additional traffic associated with the expansion of the facility operations were estimated and assigned to the roadway network based on anticipated increase in the number of employees, employee work shift times, additional truck traffic, and assuming all new truck traffic would be generated outside of the standard peak commute hours. The proposed expansion would increase the number of employees from the existing 58 employees to a maximum of 90 employees (although the applicant anticipates the plant to operate with no more than 85 employees). This represents an increase of additional employees. The additional employees would result in the addition of 4 daily trips ( inbound and outbound trips) to the project site. It is anticipated that with the expanded operations, the facility would be able to serve an additional 57 trucks per day, or 4 truck trips (57 inbound and 57 outbound) per day. With the applicant s request to extend the receipt of materials to 4 hours a day, the new truck trips would access the site throughout the entire day, with the exception of the standard commute peak hours (or 0 hours a day). There is no proposed change to the truck trips currently generated by the existing site operations. Based on this assumption, the additional truck trips represent no more than truck trips per hour. The hourly trip generation estimates with the proposed facility expansion are summarized in Table. Employee trips were estimated based on the proposed work shift times (5 AM to PM, 4 PM to AM, and PM to AM) and assuming employees would arrive at the site within 5 minutes before the beginning of their shift time and leave the site within 5 minutes of the end of their shift time. The proposed new shift times were assumed to also apply to all current employees. With the proposed expansion, the Z-Best Facility is projected to generate a total of 4 AM peak hour trips ( inbound and 8 outbound trips) and 0 PM peak hour trips (5 inbound and 5 outbound). This represents a decrease of approximately 7 trips during the AM peak hour and 7 trips during the PM peak hour when compared to existing conditions. The projected decrease is due to the change in work shift times associated with the proposed expansion. Trip Distribution and Assignment The existing directional distribution of site-generated traffic was estimated based on the direction of arriving/departing traffic obtained from the turn-movement counts conducted at the project entrance. It should be noted that the directionality of trips obtained from the driveway counts is based on the total truck and auto trips. The existing directional distribution was applied to the future volume projections, with implementation of the proposed expansion, to assign new project traffic at the project entrance and to the roadway network. Existing and Project Conditions Traffic Volumes The existing and projected peak-hour traffic volumes with the proposed facility expansion (project conditions) at the study intersections are shown on Figure. Other existing uses along SR 5 that would utilize the potential new realigned SR 5/Bolsa Road intersection for access include the Uesugi Farm site, located less than half a mile west of the project site, and sites located east of the project site. Existing traffic volumes associated with the project site and the other existing uses were reassigned to the potential new realigned SR 5/Bolsa Road intersection. However, since the amount of traffic that the other two existing uses currently generate is unknown, it was conservatively assumed, based on the size of their sites, that the Uesugi Farm site currently generates approximately half the peak-hour traffic that the project site generates, and the sites to the east currently generate approximately the same amount of peak-hour traffic as the project site. Existing and project conditions traffic volumes with the SR 5 realignment are presented on Figure 4. Passenger Car Equivalent Trips Because a significant portion of the traffic associated with the project would be truck traffic, a more conservative analysis was conducted for this study in which the truck trips were converted to passenger car equivalent (PCE) Page 9
10 Bolsa Rd Z-Best Facility Traffic Operations and Site Access Analysis February 7, 07 Bloomfield Ave Existing Conditions Project Conditions NORTH Not to Scale SR 5 Bolsa Rd SR 5 State Route 5 SR 5 Project Dwy SR 5 Project Drwy Bolsa Rd Existing Conditions Project Conditions Project Driveway State Route 5 LEGEND: = Existing Site Location X XX(XX) XX% = Study Intersection = AM(PM) Peak-Hour Traffic Volumes = Project Trip Distribution Figure Existing and Project Conditions Traffic Volumes Page 0
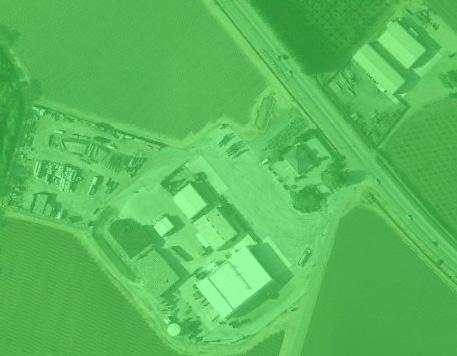
11 Bolsa Rd Z-Best Facility Traffic Operations and Site Access Analysis February 7, 07 Existing State Route 5 Bloomfield Ave NORTH Not to Scale Existing Conditions Bolsa Rd Project Conditions Bolsa Rd SR 5 SR 5 LEGEND: = Existing Site Location Bolsa Rd Realignment X XX(XX) = Study Intersection = AM(PM) Peak-Hour Traffic Volumes New Signalized Intersection State Route 5 Realignment Existing State Route 5 Alignment Existing Conditions Project Conditions Project Driveway Existing State Route 5 Bolsa Rd Bolsa Rd Existing SR 5 Existing SR 5 Figure 4 Existing and Project with SR 5 Realignment Conditions Traffic Volumes Page
12 Z-Best Facility Traffic Operations and Site Access Analysis February 7, 07 trips. This is founded on the observation that trucks impact traffic operations at intersections more significantly than passenger cars do. For this analysis, it is assumed that each truck trip is equivalent to.5 passenger car trips. Applying the PCE factors to the estimated project truck trips, it was calculated that the existing facility operations currently generates a total of 8 PCE trips ( inbound and 5 outbound) during the AM peak hour and 4 PCE trips ( inbound and 0 outbound) during the PM peak hour. With the proposed project, the facility is estimated to generate a total of PCE trips (9 inbound and outbound) during the AM peak hour and PCE trips (8 inbound and 8 outbound) during the PM peak hour. These are the project site traffic projections that were utilized for the evaluation of traffic operations at the study facilities. Intersection Level of Service Analysis Level of Service is a qualitative description of operating conditions ranging from LOS A, or free-flow conditions with little or no delay, to LOS F, or jammed conditions with excessive delays. The study intersections were analyzed using TRAFFIX software, which is based on the Highway Capacity Manual (HCM) 000 method for computing level of service at intersections. Two-way-stop controlled intersection levels of service are evaluated based on worst approach stop control delay time for all vehicles at the intersection. Traffic conditions were analyzed for the weekday AM and PM peak hours. The weekday AM peak hour of traffic is generally between 7:00 and 9:00 AM, and the weekday PM peak hour is typically between 4:00 and :00 PM. It is during these periods that the most congested traffic conditions occur on a typical weekday. The level of service results are discussed below and summarized in Table 4. The level of service calculations are included in the Appendix. Significant Impact Criteria All study facilities are located along SR 5. The California Department of Transportation (Caltrans) has jurisdiction of all State maintained facilities, including SR 5. Therefore, the study intersections were evaluated based on Caltrans significance criteria. The criteria described below apply to the weekday AM and PM peak hours. Caltrans Definition of Significant Impacts All roadway facilities studied are under the jurisdiction of Caltrans, and therefore, are required to meet the Caltrans Level of Service (LOS) standard. Caltrans level of service standard is LOS C or better. The Caltrans Guide for the Preparation of Traffic Impact Studies (Caltrans 00) defines a significant impact to occur when:. The addition of project traffic causes roadway (or intersection) operations to degrade from an acceptable level (LOS C or better) to an unacceptable level (LOS D or worse) or,. Project traffic is added to a roadway (or intersection) operating at an unacceptable level (LOS D or worse). Existing Conditions The results of the level of service analysis show that, measured against the Caltrans level of service standards, both the project entrance and Bolsa Road intersections with SR 5 currently operate at an unacceptable LOS F during the PM peak hour based on the worst approach delay. The worst approach is typically the minor street approach that is stop-controlled. Project Conditions The results of the level of service analysis show that, with implementation of the proposed project, both the project entrance and Bolsa Road intersections with SR 5 are projected to experience a small improvement in the worst approach delay, although both intersections would continue to operate at an unacceptable LOS F during the PM peak hour. The proposed project would not add any additional traffic to either of the study intersections during the peak hours, therefore, based on Caltrans impact criteria, the proposed project would not result in a significant project impact at the study intersections. Page
13 Z-Best Facility Traffic Operations and Site Access Analysis February 7, 07 Table 4 Operations Analysis Results Summary Existing Existing Plus Project LOS Peak Warrant Average Worst Warrant Average Worst Location Standard Hour Met? Delay LOS Delay LOS Met? Delay LOS Change Delay LOS Change Existing Network SR 5 and Project Entrance C AM No 0. A+ 8.7 D No 0. A D -0. PM No 0.9 A+ 0. F No 0. A E -. SR 5 and Bolsa Road C AM No 0. A+ 0. D No 0. A D 0.0 PM Yes. C F Yes.5 C F -. Existing Network with SR 5 Realignment New SR 5 and Bolsa Road (unsignalized) C AM No 0.8 A+ 54. F No 0.7 A F -0. PM Yes 5.7 F 0. F Yes 44. E F -. New SR 5 and Bolsa Road (signalized) C AM B B PM B B Notes: Whole intersection weighted average control delay expressed in seconds per vehicle. The worst case delay is normally the time it would take a vehicle on the minor street of an unsignalized intersection to make a left-turn onto the major street, expressed in seconds per vehicle. Bold indicates unacceptable level of service. Page
14 Z-Best Facility Traffic Operations and Site Access Analysis February 7, 07 Level of Service Analysis with Potential SR 5 Improvements These analysis scenarios assumed the potential realignment of SR 5 and Bolsa Road. The analysis focuses on the new potential intersection created by the realigned SR 5 and Bolsa Road, which would provide access to the project site and other existing uses along the existing SR 5. The project site entrance would be located along a frontage roadway (existing SR 5) with minimal through traffic, and therefore, would operate better than under existing conditions. Existing Conditions with SR 5 Realignment The results of the level of service analysis show that the new potential intersection of the realigned SR 5 and Bolsa Road would operate at an unacceptable LOS E and F during the AM and PM peak hours, respectively, with the reassignment of existing traffic as a result of the proposed SR 5 improvements and assuming the new intersection would continue to be stop-controlled on Bolsa Road. Assuming the new Bolsa Road intersection with the realigned SR 5 is controlled by a traffic signal, the intersection is projected to operate at an acceptable LOS B during both the AM and PM peak hours. The existing project site entrance along the existing SR 5 (new frontage road) would operate acceptably under this scenario. Project Conditions with SR 5 Realignment The results of the level of service analysis show that the new potential intersection of the realigned SR 5 and Bolsa Road would continue to operate at an unacceptable LOS E and F during the AM and PM peak hours, respectively, under project conditions with SR 5 realignment and assuming the new intersection would continue to be stop-controlled on Bolsa Road. However, the proposed project would result in an improvement in the intersections worst approach delay (associated with reduced number of employee peak-hour trips), therefore, based on Caltrans impact criteria, the proposed project would not result in a significant project impact at the intersection of the realigned SR 5/Bolsa Road. Assuming the new Bolsa Road intersection with the realigned SR 5 is controlled by a traffic signal, the intersection is projected to operate at an acceptable LOS B during both the AM and PM peak hours under project plus SR 5 realignment conditions. Therefore, the proposed project would not result in a significant project impact at this intersection under these assumptions. The existing project site entrance along the existing SR 5 (new frontage road) would operate acceptably under this scenario. Signal Warrant Analysis The level of service analysis at the study intersections were supplemented with an assessment of the need for signalization of the intersections. The need for signalization of unsignalized intersections is assessed based on the Peak-Hour Volume Warrant (Warrant ) described in the California Manual on Uniform Traffic Control Devices for Streets and Highways (CA MUTCD), Part 4, Highway Traffic Signals, 04. This method makes no evaluation of intersection level of service, but simply provides an indication whether vehicular peak hour traffic volumes are, or would be, sufficient to justify installation of a traffic signal. Intersections that meet the peak hour warrant are subject to further analysis before determining that a traffic signal is necessary. Additional analysis may include unsignalized level of service analysis and/or operational analysis such as evaluating vehicle queuing and delay. Other options such as traffic control devices, signage, or geometric changes may be preferable based on existing field conditions. The results of the peak-hour volume warrants indicate that the existing and project condition peak-hour volumes at the existing project entrance intersection with SR 5 fall below the threshold that warrant signalization. The peak hour volumes at the existing SR 5 and Bolsa Road intersection currently meet the threshold for signalization during the PM peak hour. Since the proposed project would not add additional peak-hour traffic to the intersection, it would not exacerbate the need for signalization of the intersection. With the planned realignment of SR 5, the reassigned existing and project condition peak-hour traffic volumes at the new potential intersection of the realigned SR 5 and Bolsa Road would meet the threshold Page 4
15 Z-Best Facility Traffic Operations and Site Access Analysis February 7, 07 that warrants signalization during the PM peak hour. However, since the proposed project would not add additional peak-hour traffic to the intersection, it would not exacerbate the need for signalization of the intersection. Traffic volumes at the project entrance intersection with the existing SR 5 (frontage road) would fall below the threshold that warrants signalization under this scenario. The results of the signal warrant analysis are summarized in Table 4. The signal warrant sheets are included within the Appendix. Intersection Operations (Queuing) Analysis The operations analysis is based on vehicle queuing for left-turn movements at intersections. Vehicle queues obtained from TRAFFIX were utilized for this analysis. The basis of the analysis is as follows: () TRAFFIX is used to estimate the 95 th percentile maximum number of queued vehicles during the peak hour for a particular movement; () the estimated maximum number of vehicles in the queue is translated into a queue length, assuming 5 feet per vehicle; and () the estimated maximum queue length is compared to the existing or planned available storage capacity for the movement. This analysis thus provides a basis for estimating future storage requirements at the selected locations. The queue estimates for movements at the new potential intersection of the realigned SR 5 and Bolsa Road were evaluated under both existing and project conditions. The queuing analysis results show that, under existing conditions and based on the reassigned peak-hour traffic volumes, both the eastbound and westbound left-turn approaches along the realigned SR 5 at Bolsa Road would experience queue lengths of no more than vehicle during the peak hours. The southbound approach would experience a queue length of 4 vehicles, or 00 ft. assuming an average vehicle length of 5 ft. per vehicle, during the PM peak hour, while the northbound approach would experience a queue length of vehicles, or 50 ft., during the PM peak hour. However, the projected queue would occur along Bolsa Road and would not result in a disruption of traffic flow on SR 5. Under project conditions, all projected left-turn vehicle queues at the realigned SR 5 and Bolsa Road intersection would remain unchanged, with the exception of the northbound approach, which is projected to experience queue lengths of no more than vehicle during the PM peak hour with implementation of the proposed project. Therefore, the proposed project would not negatively affect the projected peak-hour left-turn vehicular queues at the intersection of the realigned SR 5 and Bolsa Road. During the off-peak hours, as many as 0 trips (8 non-truck and truck trips) are projected to access the project site from the east on SR 5. These trips represent westbound left-turn movements at the new potential realigned SR 5/Bolsa Road intersection. Even if the westbound left-turn trips associated with the project site are conservatively assumed to be 0 trips during the PM peak-hour (instead of the projected trip, during the worst of the two peak hours), the queue analysis results show that the projected westbound left-turn queue length along the realigned SR 5 at Bolsa Road would continue to be no more than vehicle. Collision History The collision history along SR 5 in the vicinity of the project entrance and Bolsa Road intersections with SR 5 was reviewed. A review of collision data received from Caltrans indicates a total of 9 collisions over a - year span along SR 5 between Bloomfield Road and the beginning of the highway divider (located approximately.5 miles east of the project site entrance). The number of collisions along this highway segment exceeds the statewide average for similar facilities. However, only two collisions occurred in the vicinity of the project entrance and Bolsa Road intersections with SR 5 over that same -year period. Highway Segment Operations The highway segments located immediately east and west of the project entrance were evaluated based on the Highway Capacity Manual (HCM) 00 methodology and using the Highway Capacity Software (HCS). The results of the highway segment peak hour level of service analysis show that the segments along SR 5 currently operate at an unacceptable LOS E during the AM and PM peak hours. According to the Caltrans definition of impact on highway segments, the addition of any traffic to a facility currently operating unacceptably would be considered an impact. The proposed project is estimated to result Page 5
16 Z-Best Facility Traffic Operations and Site Access Analysis February 7, 07 in a decrease in traffic volume during the peak hours. Therefore, the proposed project would not result in a significant project impact on segments of SR 5. Potential SR 5 Improvements The operations and site access analysis shows that although the proposed project would not result in traffic impacts at the study intersections and highway segments, both the study intersections and the study highway segments currently operate at unacceptable levels. The proposed SR 5 improvements would improve traffic operations along the realigned SR 5, the new intersection of realigned SR 5/Bolsa Road, and the project site entrance. Converting the existing SR 5 to a frontage roadway would improve both traffic conditions and safety at the project entrance since the through traffic on the frontage road would be minimal. Additionally, the potential new intersection of the realigned SR 5/Bolsa Road would provide a controlled access point to the project site from SR 5. The peak hour intersection level of service and signal warrant analysis at the realigned SR 5/Bolsa Road intersection indicates that the intersection would have peak hour volumes that warrant the installation of traffic signal. Providing access to the project site from SR 5 via a signalized intersection would improve operations and safety for both project traffic and through traffic along SR 5, in particular since the majority of vehicular trips generated by the project site are large trucks. The potential new intersection also would include exclusive left-turn lanes along SR 5 that would not only increase intersection capacity but also would minimize the disruption of through traffic along SR 5. Overall, the potential SR 5 improvements would improve traffic conditions at the project site access and along SR 5. Described below is the recommended intersection lane configuration at the potential new realigned SR 5/Bolsa Road intersection to provide adequate access to the project site and other existing uses along the new frontage road (existing SR 5). Conceptual Layout of New SR 5 and Bolsa Road Intersection A conceptual layout of the potential new Bolsa Road intersection with the realigned SR 5, intersection which would provide access to the project site, was prepared per Caltrans design standards. Each of the design requirements that would be applicable to the new access intersection are discussed below. Figure 5 provides a conceptual layout of the intersection per Caltrans requirements. Highway Design Manual Standards The Caltrans Highway Design Manual (HDM) makes the following recommendations regarding intersection design standards (Topic 405). Sight Distance A clear line of sight should be provided between the driver on the minor street (crossroad) and the approaching traffic (major street). At a minimum, adequate stopping sight distance should be provided at all unsignalized intersections. Corner sight distance and decision sight distance also should be provided when possible and/or applicable. In some cases, the cost of providing the required corner sight distance may be excessive. When restrictive conditions exist, the minimum value for corner sight distance shall be equal to the stopping sight distance. Decision sight distance is required at intersections where the State route turns or crosses another State route. Based on the design speed along SR 5 (posted speed limit of 55 mph), the required stopping sight distance must be no less than 500 ft. (Table 0. of the HDM) and the minimum corner sight distance should be 05 ft. Since SR 5 is relatively straight in the vicinity of the new intersection location, more than,000 ft. of sight distance to the west and east on SR 5 from the new Bolsa Road could be provided. Acceleration Lanes According to the HDM, at rural intersections with stop control on the local cross road, acceleration lanes for left and right turn onto the State facility should be considered. Acceleration lanes would not be required if the new intersection is to be signalized. Page

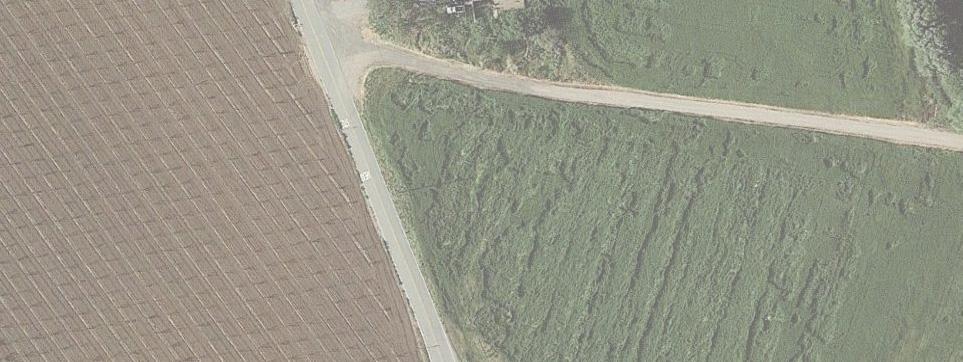
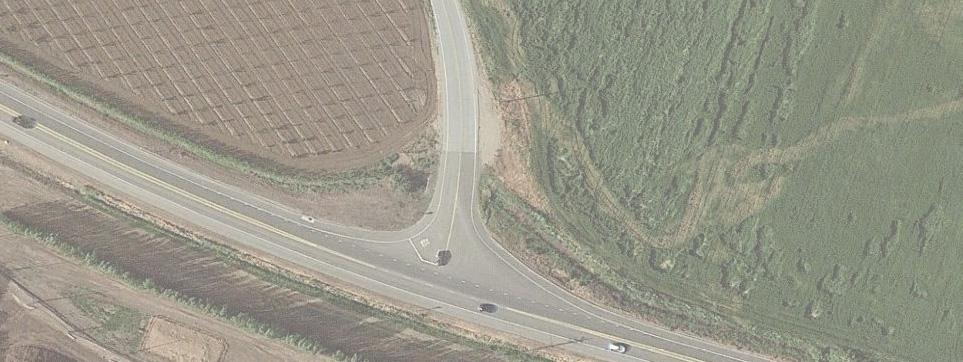
17 Z-Best Facility Traffic Operations and Site Access Analysis February 7, 07 Figure 5 Conceptual Project Access along Realigned SR 5 P a g e 7
18 Z-Best Facility Traffic Operations and Site Access Analysis February 7, 07 Left-Turn Channelization The HDM recommends left-turn lanes be provided at intersections to expedite the movement of through traffic, control the movement of turning traffic, increase intersection capacity, and improve safety. At a minimum, the left-turn lane should meet the following requirements: Lane Width The lane width for both single and double left-turn lanes on State highways shall be ft. However, under certain circumstances, left-turn lane widths of ft. or as narrow as 0 ft. may be used. Based on Caltrans design criteria, the left-turn lanes at the new intersection should be a minimum of 0 ft. wide. Approach Taper The approach taper provides space for a left-turn lane by moving traffic laterally to the right. In all situations where space is available (usually in rural and semi-rural areas on in urban areas with high traffic speeds and/or volumes), the standard left-turn channelization design in which all widening is to the right of approaching traffic and the deceleration lane begins at the end of the approach taper should be used. However, alternate designs with the deceleration lane beginning at the / point of the approach taper (so that part of the deceleration takes place in the through traffic lane) may be used in urban areas where constraints exist, speeds are moderate, and traffic volumes are relatively low. The required approach taper (Figure 405.A) for the left-turn lanes on SR 5, based on a design speed of 55 mph and assuming the proposed left-turn lane would be ft. wide, is 0 ft. Deceleration Lane Length Deceleration lane length are based on the roadway s design speed. It is desirable that deceleration take place entirely off the through traffic lanes. Based on Table 405.B of the HDM, the required deceleration lane length for a 55 mph roadway is approximately 485 ft. (including bay taper). Bay tapers of 0 ft. are normally used on rural high-speed highways. As described above, alternate left-turn channelization designs allow the deceleration lane beginning at the / point of the approach taper, so part of the deceleration takes place in the through traffic lane. In cases where partial deceleration is permitted on the through lanes, designs speeds may be reduced 0 to 0 mph for a lower entry speed. Storage Length As a minimum, storage space for passenger cars should be provided at 5 ft. per car within turn-pockets. However, if the peak hour traffic is 0 percent (%) or more, space for one passenger car and one truck should be provided. Vehicular queue estimates for left-turns at the potential new intersection show 95 th percentile queue lengths of no more than vehicle for left-turn movements along SR 5 during the peak hours. However, traffic volumes along SR 5 are composed of a significant amount of heavy trucks since it serves as the primary route to US 0 from a primarily agricultural area. Therefore, based on the estimated queue length calculations and Caltrans standards, a minimum of 75 ft. (one vehicle and one truck length) of queue storage capacity should be provided in the left-turn pockets along the realigned SR 5 at the potential new intersection with Bolsa Road. Ultimately, Caltrans will decide whether the proposed improvements are adequate and meet Caltrans design standards. Conclusions The proposed expansion of the existing facility operations on the site will include an increase in the number of employees from the current 58 employees (0 allowed by the use permit) to employees (with a maximum of 90 employees allowed by the use permit). It is also anticipated that with the expanded operations, the facility would be able to serve an additional 57 trucks per day. However, based on the proposed new work shift times and all new truck trips being proposed to access the project site outside of the standard peak commute hours, the proposed expansion of the existing Z-Best facility operations would result in a decrease in the number of peak-hour trips generated by the project site when compared to existing conditions. Therefore, the proposed project would not result on impacts to any of the study facilities on SR 5. The operations and site access analysis shows that although the proposed project would not result in traffic impacts at the study intersections and highway segments along SR 5, both the study intersections and the study highway segments currently operate at unacceptable levels. The proposed SR 5 improvements would improve traffic operations along the realigned SR 5, the new intersection of realigned SR 5/Bolsa Road, and the project site entrance. Page 8
LAWRENCE TRANSIT CENTER LOCATION ANALYSIS 9 TH STREET & ROCKLEDGE ROAD / 21 ST STREET & IOWA STREET LAWRENCE, KANSAS
 LAWRENCE TRANSIT CENTER LOCATION ANALYSIS 9 TH STREET & ROCKLEDGE ROAD / 21 ST STREET & IOWA STREET LAWRENCE, KANSAS TRAFFIC IMPACT STUDY FEBRUARY 214 OA Project No. 213-542 TABLE OF CONTENTS 1. INTRODUCTION...
Clean Harbors Canada, Inc.
 Clean Harbors Canada, Inc. Proposed Lambton Landfill Expansion Environmental Assessment Terms of Reference Transportation Assessment St. Clair Township, Ontario September 2009 itrans Consulting Inc. 260
INDUSTRIAL DEVELOPMENT
 INDUSTRIAL DEVELOPMENT Traffic Impact Study Plainfield, Illinois August 2018 Prepared for: Seefried Industrial Properties, Inc. TABLE OF CONTENTS Executive Summary 2 Introduction 3 Existing Conditions
APPENDIX C1 TRAFFIC ANALYSIS DESIGN YEAR TRAFFIC ANALYSIS
 APPENDIX C1 TRAFFIC ANALYSIS DESIGN YEAR TRAFFIC ANALYSIS DESIGN YEAR TRAFFIC ANALYSIS February 2018 Highway & Bridge Project PIN 6754.12 Route 13 Connector Road Chemung County February 2018 Appendix
TRAFFIC IMPACT ANALYSIS
 TRAFFIC IMPACT ANALYSIS Emerald Isle Commercial Development Prepared by SEPI Engineering & Construction Prepared for Ark Consulting Group, PLLC March 2016 I. Executive Summary A. Site Location The Emerald
The major roadways in the study area are State Route 166 and State Route 33, which are shown on Figure 1-1 and described below:
 3.5 TRAFFIC AND CIRCULATION 3.5.1 Existing Conditions 3.5.1.1 Street Network DRAFT ENVIRONMENTAL IMPACT REPORT The major roadways in the study area are State Route 166 and State Route 33, which are shown
Appendix H TRAFFIC IMPACT ANALYSIS
 Appendix H TRAFFIC IMPACT ANALYSIS Teichert Boca Quarry Expansion Traffic Impact Analysis Prepared for Teichert Aggregates Prepared by TRANSPORTATION CONSULTANTS, INC. LSC Transportation Consultants, Inc.
APPENDIX B Traffic Analysis
 APPENDIX B Traffic Analysis Rim of the World Unified School District Reconfiguration Prepared for: Rim of the World School District 27315 North Bay Road, Blue Jay, CA 92317 Prepared by: 400 Oceangate,
King Soopers #116 Thornton, Colorado
 Traffic Impact Study King Soopers #116 Thornton, Colorado Prepared for: Galloway & Company, Inc. T R A F F I C I M P A C T S T U D Y King Soopers #116 Thornton, Colorado Prepared for Galloway & Company
Proposed location of Camp Parkway Commerce Center. Vicinity map of Camp Parkway Commerce Center Southampton County, VA
 Proposed location of Camp Parkway Commerce Center Vicinity map of Camp Parkway Commerce Center Southampton County, VA Camp Parkway Commerce Center is a proposed distribution and industrial center to be
PROJECT: Wilkinson Road Corridor Improvement Traffic Management Planning Project SUBJECT: Traffic Analysis
 TECHNICAL MEMORANDUM DATE: September 10, 2014 PROJECT 5861.03 NO: PROJECT: Wilkinson Road Corridor Improvement Traffic Management Planning Project SUBJECT: Traffic Analysis TO: Steve Holroyd - District
Traffic Impact Study Speedway Gas Station Redevelopment
 Traffic Impact Study Speedway Gas Station Redevelopment Warrenville, Illinois Prepared For: Prepared By: April 11, 2018 Table of Contents 1. Introduction... 1 2. Existing Conditions... 4 Site Location...
TRAFFIC PARKING ANALYSIS
 TRAFFIC PARKING ANALYSIS NAPA FLEA MARKET COUNTY OF NAPA Prepared for: Tom Harding Napa-Vallejo Flea Market 33 Kelly Road American Canyon, CA 9453 Prepared by: 166 Olympic Boulevard, Suite 21 Walnut Creek,
Table of Contents INTRODUCTION... 3 PROJECT STUDY AREA Figure 1 Vicinity Map Study Area... 4 EXISTING CONDITIONS... 5 TRAFFIC OPERATIONS...
 Crosshaven Drive Corridor Study City of Vestavia Hills, Alabama Table of Contents INTRODUCTION... 3 PROJECT STUDY AREA... 3 Figure 1 Vicinity Map Study Area... 4 EXISTING CONDITIONS... 5 TRAFFIC OPERATIONS...
Section 5.0 Traffic Information
 Section 5.0 Traffic Information 10.0 TRANSPORTATION MDM Transportation Consultants, Inc. (MDM) has prepared an evaluation of transportation impacts for the proposed evaluation for the expansion of the
The key roadways in the project vicinity are described below. Exhibit displays the existing number of lanes on the study roadways.
 4.2 TRAFFIC AND CIRCULATION This section presents the key assumptions, methods, and results of analysis for the transportation and circulation impacts of the proposed project. This section is based on
King County Metro. Columbia Street Transit Priority Improvements Alternative Analysis. Downtown Southend Transit Study. May 2014.
 King County Metro Columbia Street Transit Priority Improvements Alternative Analysis Downtown Southend Transit Study May 2014 Parametrix Table of Contents Introduction... 1 Methodology... 1 Study Area...
Transportation & Traffic Engineering
 Transportation & Traffic Engineering 1) Project Description This report presents a summary of findings for a Traffic Impact Analysis (TIA) performed by A+ Engineering, Inc. for the Hill Country Family
Traffic Engineering Study
 Traffic Engineering Study Bellaire Boulevard Prepared For: International Management District Technical Services, Inc. Texas Registered Engineering Firm F-3580 November 2009 Executive Summary has been requested
MONTEREY BAY AQUARIUM RESEARCH INSTITUTE (MBARI) MASTER PLAN UPDATE MOSS LANDING, CALIFORNIA
 MASTER PLAN UPDATE MOSS LANDING, CALIFORNIA") MONTEREY BAY AQUARIUM RESEARCH INSTITUTE (MBARI) MASTER PLAN UPDATE MOSS LANDING, CALIFORNIA TRAFFIC IMPACT ANALYSIS Administrative Draft Report Prepared For Monterey Bay Aquarium Research Institute Moss
MONTEREY BAY AQUARIUM RESEARCH INSTITUTE (MBARI) MASTER PLAN UPDATE MOSS LANDING, CALIFORNIA TRAFFIC IMPACT ANALYSIS Administrative Draft Report Prepared For Monterey Bay Aquarium Research Institute Moss
RTE. 1 at RTE. 637 & RTE. 639
 INTERSECTION SAFETY STUDY Prepared for: Virginia Department of Transportation Central Region Operations Traffic Engineering (UPC #81378, TO 12-092) DAVENPORT Project Number: 13-368 / /2014 RTE. 1 at RTE.
Traffic Impact Analysis West Street Garden Plots Improvements and DuPage River Park Garden Plots Development Naperville, Illinois
 Traffic Impact Analysis West Street Garden Plots Improvements and DuPage River Park Garden Plots Development Naperville, Illinois Submitted by April 9, 2009 Introduction Kenig, Lindgren, O Hara, Aboona,
TRAFFIC IMPACT STUDY DERRY GREEN CORPORATE BUSINESS PARK MILTON SECONDARY PLAN MODIFICATION
 TRAFFIC IMPACT STUDY DERRY GREEN CORPORATE BUSINESS PARK MILTON SECONDARY PLAN MODIFICATION TRAFFIC IMPACT STUDY DERRY GREEN CORPORATE BUSINESS PARK MILTON SECONDARY PLAN MODIFICATION DECEMBER 24 UPDATED
EXECUTIVE SUMMARY. The following is an outline of the traffic analysis performed by Hales Engineering for the traffic conditions of this project.
 EXECUTIVE SUMMARY This study addresses the traffic impacts associated with the proposed Shopko redevelopment located in Sugarhouse, Utah. The Shopko redevelopment project is located between 1300 East and
Table Existing Traffic Conditions for Arterial Segments along Construction Access Route. Daily
 5.8 TRAFFIC, ACCESS, AND CIRCULATION This section describes existing traffic conditions in the project area; summarizes applicable regulations; and analyzes the potential traffic, access, and circulation
To: File From: Adrian Soo, P. Eng. Markham, ON File: Date: August 18, 2015
 Memo To: From: Adrian Soo, P. Eng. Markham, ON : 165620021 Date: Reference: E.C. Row Expressway, Dominion Boulevard Interchange, Dougall Avenue Interchange, and Howard 1. Review of Interchange Geometry
Shirk Road at State Route 198 Interchange Analysis Tulare County, California
 Shirk Road at State Route 198 Interchange Analysis Tulare County, California DRAFT REPORT Prepared By Tulare County Association of Governments (TCAG) April 2013 Table of Contents Introduction:... 3 Project
Appendix J Traffic Impact Study
 MRI May 2012 Appendix J Traffic Impact Study Level 2 Traffic Assessment Limited Impact Review Appendix J [This page was left blank intentionally.] www.sgm-inc.com Figure 1. Site Driveway and Trail Crossing
TRAFFIC IMPACT STUDY FOR SONIC DRIVE-IN RESTAURANT. Vallejo, CA. Prepared For:
 TRAFFIC IMPACT STUDY FOR SONIC DRIVE-IN RESTAURANT Vallejo, CA Prepared For: ELITE DRIVE-INS, INC. 2190 Meridian Park Blvd, Suite G Concord, CA 94520 Prepared By: KD Anderson & Associates 3853 Taylor Road,
LCPS Valley Service Center
 Traffic Impact Study LCPS Valley Service Center Loudoun County, Virginia November 4, 2015 Prepared For: Loudoun County Public Schools 21000 Education Court Ashburn, VA 20148 Prepared by: 1140 Connecticut
Appendix C. Traffic Study
 Appendix C Traffic Study TABLE OF CONTENTS SECTION Executive Summary PAGE 1.0 Introduction... 1 1.1 Scope of Work... 1 1.2 Study Area... 2 2.0 Project Description... 3 2.1 Site Access... 4 2.2 Pedestrian
Bennett Pit. Traffic Impact Study. J&T Consulting, Inc. Weld County, Colorado. March 3, 2017
 Bennett Pit Traffic Impact Study J&T Consulting, Inc. Weld County, Colorado March 3, 217 Prepared By: Sustainable Traffic Solutions, Inc. http://www.sustainabletrafficsolutions.com/ Joseph L. Henderson,
Traffic Impact Analysis 5742 BEACH BOULEVARD MIXED USE PROJECT
 Traffic Impact Analysis 5742 BEACH BOULEVARD MIXED USE PROJECT CITY OF BUENA PARK Prepared by Project No. 14139 000 April 17 th, 2015 DKS Associates Jeffrey Heald, P.E. Rohit Itadkar, T.E. 2677 North Main
West Hills Shopping Centre Lowe s Expansion Traffic Impact Study
 West Hills Shopping Centre Lowe s Expansion Traffic Impact Study Prepared for: Armel Corporation January 2015 Paradigm Transportation Solutions Ltd. 22 King Street South, Suite 300 Waterloo ON N2J 1N8
MEMORANDUM. Figure 1. Roundabout Interchange under Alternative D
 MEMORANDUM Date: To: Liz Diamond, Dokken Engineering From: Subject: Dave Stanek, Fehr & Peers Western Placerville Interchanges 2045 Analysis RS08-2639 Fehr & Peers has completed a transportation analysis
TABLE OF CONTENTS SECTION PAGE. Executive Summary... xii
 TABLE OF CONTENTS SECTION PAGE Executive Summary... xii 1.0 Introduction... 1 1.1 Study Area... 2 1.2 Traffic Impact Analysis Scenarios... 4 1.3 Study Area - City of Orange... 4 2.0 Project Description
HUMC/Mountainside Hospital Redevelopment Plan
 Traffic and Parking Analysis HUMC/Mountainside Hospital Redevelopment Plan in Glen Ridge Borough and Montclair Township PREPARED FOR H2M 119 Cherry Hill Road, Suite 110 Parsippany, NJ 07054 862.207.5900
Traffic Impact Study for the proposed. Town of Allegany, New York. August Project No Prepared For:
 Appendix B SRF Traffic Study (Revised November 2005) Draft Environmental Impact Statement University Commons Town of Allegany, Cattaraugus County, NY December 2005 Traffic Impact Study for the proposed
BARRHAVEN FELLOWSHIP CRC 3058 JOCKVALE ROAD OTTAWA, ONTARIO TRANSPORTATION BRIEF. Prepared for:
 BARRHAVEN FELLOWSHIP CRC 3058 JOCKVALE ROAD OTTAWA, ONTARIO TRANSPORTATION BRIEF Prepared for: Barrhaven Fellowship CRC 3058 Jockvale Road Ottawa, ON K2J 2W7 December 7, 2016 116-649 Report_1.doc D. J.
Appendix M. Traffic Impact Analysis Report
 Appendix M Traffic Impact Analysis Report California Flats Solar Project Traffic Impact Analysis Report August 5, 213 Contents Executive Summary... 1 1. Introduction... 4 2. Existing Conditions... 12 3.
APPENDIX E. Traffic Analysis Report
 APPENDIX E Traffic Analysis Report THIS PAGE INTENTIONALLY BLANK EAGLE RIVER TRAFFIC MITIGATION PHASE I OLD GLENN HIGHWAY/EAGLE RIVER ROAD INTERSECTION IMPROVEMENTS TRAFFIC ANALYSIS Eagle River, Alaska
DEVELOPMENT PROPERTY 1627 MAXIME STREET CITY OF OTTAWA TRANSPORTATION OVERVIEW. Prepared for: Subhas Bhargava. July 9, Overview_1.
 DEVELOPMENT PROPERTY 1627 MAXIME STREET CITY OF OTTAWA TRANSPORTATION OVERVIEW Prepared for: Subhas Bhargava July 9, 2015 115-620 Overview_1.doc D. J. Halpenny & Associates Ltd. Consulting Transportation
MILLERSVILLE PARK TRAFFIC IMPACT ANALYSIS ANNE ARUNDEL COUNTY, MARYLAND
 MILLERSVILLE PARK TRAFFIC IMPACT ANALYSIS ANNE ARUNDEL COUNTY, MARYLAND Prepared for: Department of Public Works Anne Arundel County Prepared by: URS Corporation 4 North Park Drive, Suite 3 Hunt Valley,
Perris Apartments Traffic Impact Analysis City of Perris, California
 Perris Apartments Traffic Impact Analysis City of Perris, California Prepared for: JD Pierce Company, Inc. 2222 Martin St., Suite 100 Irvine, CA 92612 Prepared by: TJW ENGINEERING, INC. 540 N. Golden Circle
APPENDIX J LAKE WOHLFORD DAM REPLACEMENT PROJECT TRAFFIC IMPACT ANALYSIS (DAM REPLACEMENT) Lake Wohlford Dam Replacement Project EIR
 Lake Wohlford Dam Replacement Project EIR") APPENDIX J LAKE WOHLFORD DAM REPLACEMENT PROJECT TRAFFIC IMPACT ANALYSIS (DAM REPLACEMENT) Replacement Project EIR Appendices TRAFFIC IMPACT ANALYSIS LAKE WOHLFORD DAM Escondido, California December 19,
APPENDIX J LAKE WOHLFORD DAM REPLACEMENT PROJECT TRAFFIC IMPACT ANALYSIS (DAM REPLACEMENT) Replacement Project EIR Appendices TRAFFIC IMPACT ANALYSIS LAKE WOHLFORD DAM Escondido, California December 19,
MINERVA PARK SITE TRAFFIC IMPACT STUDY M/I HOMES. September 2, 2015
 5500 New Albany Road Columbus, Ohio 43054 Phone: 614.775.4500 Fax: 614.775.4800 Toll Free: 1-888-775-EMHT emht.com 2015-1008 MINERVA PARK SITE TRAFFIC IMPACT STUDY M/I HOMES September 2, 2015 Engineers
Traffic Impact Analysis. Alliance Cole Avenue Residential Site Dallas, Texas. Kimley-Horn and Associates, Inc. Dallas, Texas.
 Traffic Impact Analysis Alliance Cole Avenue Residential Site Dallas, Texas February 15, 2018 Kimley-Horn and Associates, Inc. Dallas, Texas Project #064524900 Registered Firm F-928 Traffic Impact Analysis
TALMONT TOWNHOMES MADISON KENNETH SPA TRAFFIC IMPACT STUDY. Sacramento, CA. Prepared For: MBK Homes. Prepared By:
 TALMONT TOWNHOMES MADISON KENNETH SPA TRAFFIC IMPACT STUDY Sacramento, CA Prepared For: MBK Homes Prepared By: KD Anderson & Associates 3853 Taylor Road, Suite G Loomis, California 95650 (916) 660-1555
STH 60 Northern Reliever Route Feasibility Study Report
 #233087 v3 STH 60 Northern Reliever Route Feasibility Study Report Washington County Public Works Committee Meeting September 28, 2016 1 STH 60 Northern Reliever Route Feasibility Study Hartford Area Development
MEMO VIA . Ms. Amy Roth DPS Director, City of Three Rivers. To:
 MEMO To: Ms. Amy Roth DPS Director, City of Three Rivers VIA EMAIL From: Michael J. Labadie, PE Julie M. Kroll, PE, PTOE Brandon Hayes, PE, P.Eng. Fleis & VandenBrink Date: January 5, 2017 Re: Proposed
Existing Traffic Conditions
 May 14, 2014 Ms. Lorraine Weiss City of San Mateo 330 West 20 th Avenue San Mateo, CA 94403 Subject: Traffic Operational Study for the Proposed Tilton Avenue Residential Development in San Mateo, California
Escondido Marriott Hotel and Mixed-Use Condominium Project TRAFFIC IMPACT ANALYSIS REPORT
 Escondido Marriott Hotel and Mixed-Use Condominium Project TRAFFIC IMPACT ANALYSIS REPORT Prepared for Phelps Program Management 420 Sixth Avenue, Greeley, CO 80632 Prepared by 5050 Avenida Encinas, Suite
TRANSPORTATION TECHNICAL REPORT
 TRANSPORTATION TECHNICAL REPORT for Sunrise Elementary School Replacement PREPARED FOR: Puyallup School District PREPARED BY: 6544 NE 61 st Street, Seattle, WA 98115 ph: (26) 523-3939 fx: (26) 523-4949
4.14 TRANSPORTATION AND CIRCULATION
 4.14 TRANSPORTATION AND CIRCULATION 4.14.1 Summary Table 4.14-1 summarizes the identified environmental impacts, proposed mitigation measures, and residual impacts of the proposed project with regard to
April 7, Mr. Blake Shutler Compass Homes Development LLC Summit Homes Construction, LLC PO Box 6539 Dillon, CO 80435
 Compass Homes Development LLC Summit Homes Construction, LLC PO Box 6539 Dillon, CO 80435 Re: Trip Generation Comparison West Hills Townhomes Keystone, Colorado FHU Reference No. 116388-01 Dear Mr. Shutler:
TRAFFIC IMPACT ANALYSIS RIZZO CONFERENCE CENTER EXPANSION FINAL REPORT
 TRAFFIC IMPACT ANALYSIS RIZZO CONFERENCE CENTER EXPANSION Chapel Hill, North Carolina FINAL REPORT Prepared for: The Town of Chapel Hill, NC Prepared by: Architects-Engineers-Planners, Inc. December 2010
TRANSPORTATION STUDY FOR THE 8899 BEVERLY BOULEVARD PROJECT
 DRAFT TRANSPORTATION STUDY FOR THE 8899 BEVERLY BOULEVARD PROJECT WEST HOLLYWOOD, CALIFORNIA NOVEMBER 2013 PREPARED FOR BEVERLY BOULEVARD ASSOCIATION PREPARED BY DRAFT TRANSPORTATION STUDY FOR THE 8899
TIMBERVINE TRANSPORTATION IMPACT STUDY FORT COLLINS, COLORADO JANUARY Prepared for:
 TIMBERVINE TRANSPORTATION IMPACT STUDY FORT COLLINS, COLORADO JANUARY 2014 Prepared for: Hartford Companies 1218 W. Ash Street Suite A Windsor, Co 80550 Prepared by: DELICH ASSOCIATES 2272 Glen Haven Drive
APPENDIX G TRAFFIC STUDY TECHNICAL MEMORANDUM
 APPENDIX G TRAFFIC STUDY TECHNICAL MEMORANDUM TECHNICAL MEMORANDUM To: From: Date: Subject: Jerry Flores - AECOM Brian A. Marchetti, AICP September 9, 5 DRAFT Traffic Study LABOE Channel 5 Studio Relocation
D R A F T TRAFFIC IMPACT ANALYSIS FOR. DARK HORSE GOLF RESORT EXPANSION Nevada County, CA. Prepared For:
 D R A F T TRAFFIC IMPACT ANALYSIS FOR DARK HORSE GOLF RESORT EXPANSION Nevada County, CA Prepared For: ASIAN PACIFIC GROUP 18000 Van Karman Avenue, Suite 500 Irvine, CA 92612 Prepared By: KD Anderson &
Alpine Highway to North County Boulevard Connector Study
 Alpine Highway to North County Boulevard Connector Study prepared by Avenue Consultants March 16, 2017 North County Boulevard Connector Study March 16, 2017 Table of Contents 1 Summary of Findings... 1
105 Toronto Street South, Markdale Transportation Impact Study. Paradigm Transportation Solutions Limited
 105 Toronto Street South, Markdale Transportation Impact Study Paradigm Transportation Solutions Limited December 2016 Project Summary Project Number 162060 December 2016 Client Zelinka Priamo Ltd 318
Appendix C-5: Proposed Refinements Rail Operations and Maintenance Facility (ROMF) Traffic Impact Analysis. Durham-Orange Light Rail Transit Project
 Traffic Impact Analysis. Durham-Orange Light Rail Transit Project") Appendix C-5: Proposed Refinements Rail Operations and Maintenance Facility (ROMF) Traffic Impact Analysis Durham-Orange Light Rail Transit Project July 25, 218 ROMF Transportation Impact Analysis Version
Appendix C-5: Proposed Refinements Rail Operations and Maintenance Facility (ROMF) Traffic Impact Analysis Durham-Orange Light Rail Transit Project July 25, 218 ROMF Transportation Impact Analysis Version
Craig Scheffler, P.E., PTOE HNTB North Carolina, P.C. HNTB Project File: Subject
 TECHNICAL MEMORANDUM To Kumar Neppalli Traffic Engineering Manager Town of Chapel Hill From Craig Scheffler, P.E., PTOE HNTB North Carolina, P.C. Cc HNTB Project File: 38435 Subject Obey Creek TIS 2022
Proposed Commercial Service at Paine Field Traffic Impact Analysis
 Gibson Traffic Consultants 80 Wetmore Avenue Suite 0 Everett, WA 980.9.86 Prepared for: Federal Aviation Administration July 0 GTC #09-07 TABLE OF CONTENTS. EXECUTIVE SUMMARY.... PROJECT IDENTIFICATION....
TABLE OF CONTENTS 1.0 INTRODUCTION AND SUMMARY Purpose of Report and Study Objectives... 2
 TABLE OF CONTENTS 1.0 INTRODUCTION AND SUMMARY 1 1.1 Purpose of Report and Study Objectives... 2 1.2 Executive Summary... 3 1.2.1 Site Location and Study Area... 3 1.2.2 Development Description... 3 1.2.3
IV. REVISIONS TO THE DRAFT IS/MND
 IV. REVISIONS TO THE DRAFT IS/MND 1. REVISIONS TO THE DRAFT IS/MND This section presents corrections and clarifications that have been made to the text of the Draft IS/MND. These changes include revisions
East Stockton Boulevard (South Sacramento) Costco Gasoline Expansion Fuel Station Expansion Trip Generation Estimate
 Costco Gasoline Expansion Fuel Station Expansion Trip Generation Estimate") MEMORANDUM Date: February 7, 2013 Project #: 13270.0 To: From: Matt Cyr, Barghausen Consulting Engineers Sonia Hennum, PTOE & Alex Kiheri Project: Subject: cc: East Stockton Boulevard (South Sacramento)
MEMORANDUM Date: February 7, 2013 Project #: 13270.0 To: From: Matt Cyr, Barghausen Consulting Engineers Sonia Hennum, PTOE & Alex Kiheri Project: Subject: cc: East Stockton Boulevard (South Sacramento)
RICHMOND OAKS HEALTH CENTRE 6265 PERTH STREET OTTAWA, ONTARIO TRANSPORTATION BRIEF. Prepared for: Guycoki (Eastern) Limited.
 Limited.") RICHMOND OAKS HEALTH CENTRE 6265 PERTH STREET OTTAWA, ONTARIO TRANSPORTATION BRIEF Prepared for: Guycoki (Eastern) Limited June 16, 2016 116-638 Brief_1.doc D. J. Halpenny & Associates Ltd. Consulting
RICHMOND OAKS HEALTH CENTRE 6265 PERTH STREET OTTAWA, ONTARIO TRANSPORTATION BRIEF Prepared for: Guycoki (Eastern) Limited June 16, 2016 116-638 Brief_1.doc D. J. Halpenny & Associates Ltd. Consulting
MERIVALE PRIORITY SQUARE 2852 MERIVALE ROAD CITY OF OTTAWA TRANSPORTATION BRIEF. Prepared for: ONT Inc. 25 Winding Way Nepean, Ontario K2C 3H1
 MERIVALE PRIORITY SQUARE 2852 MERIVALE ROAD CITY OF OTTAWA TRANSPORTATION BRIEF Prepared for: 2190986ONT Inc. 25 Winding Way Nepean, Ontario K2C 3H1 October 6, 2010 110-502 Report_1.doc D. J. Halpenny
Prepared For: Toronto Transit Commission 1138 Bathurst Street Toronto, Ontario M5R 3H2. Prepared By:
 TRAFFIC IMPACT STUDY FOR THE TTC MCNICOLL BUS GARAGE CITY OF TORONTO Prepared For: Toronto Transit Commission 1138 Bathurst Street Toronto, Ontario M5R 3H2 Prepared By: Canada Inc. 4th Floor, 3 Leek Crescent
RE: A Traffic Impact Statement for a proposed development on Quinpool Road
 James J. Copeland, P.Eng. GRIFFIN transportation group inc. 30 Bonny View Drive Fall River, NS B2T 1R2 May 31, 2018 Ellen O Hara, P.Eng. Project Engineer DesignPoint Engineering & Surveying Ltd. 200 Waterfront
City of Marina. Regional Roundabout Study Utilizing Caltrans Intersection Control Evaluation Section 4: Transportation Agency for Monterey County
 Regional Roundabout Study Utilizing Caltrans Intersection Control Evaluation Section 4: City of Marina Study Intersections: RESERVATION ROAD AT BEACH ROAD RESERVATION ROAD AT DEFOREST ROAD CARDOZA AVENUE
IRSCH REEN Hirsch/Green Transportation Consulting, Inc.
 IRSCH REEN Hirsch/Green Transportation Consulting, Inc. February 6, 2013 Mr. David Weil Director of Finance St. Matthew s Parish School 1031 Bienveneda Avenue Pacific Palisades, California 90272 RE: Trip
TRAFFIC IMPACT STUDY VICDOM BROCK ROAD PIT EXPANSION
 TRAFFIC IMPACT STUDY VICDOM BROCK ROAD PIT EXPANSION TOWNSHIP OF UXBRIDGE P/N 05-1993 June 2011 Revised -August 2011 Prepared by: Skelton, Brumwell & Associates Inc. 93 Bell Farm Road, Suite 107 Barrie,
Appendix Q Traffic Study
 Appendices Appendix Q Traffic Study Crummer Site Subdivision Draft EIR City of Malibu Appendices This page intentionally left blank. The Planning Center April 2013 TRAFFIC IMPACT ANALYSIS Photo z here
1650 South Delaware Street
 65 South Delaware Street Final Transportation Impact Analysis Prepared for: City of San Mateo June 8, 28 Hexagon Transportation Consultants, Inc. Hexagon Office: 4 North Second Street, Suite 4 San Jose,
Subarea Study. Manning Avenue (CSAH 15) Corridor Management and Safety Improvement Project. Final Version 1. Washington County.
 Corridor Management and Safety Improvement Project. Final Version 1. Washington County.") Subarea Study Manning Avenue (CSAH 15) Corridor Management and Safety Improvement Project Final Version 1 Washington County June 12, 214 SRF No. 138141 Table of Contents Introduction... 1 Forecast Methodology
Subarea Study Manning Avenue (CSAH 15) Corridor Management and Safety Improvement Project Final Version 1 Washington County June 12, 214 SRF No. 138141 Table of Contents Introduction... 1 Forecast Methodology
APPENDIX C-2. Traffic Study Supplemental Analysis Memo
 APPENDIX C-2 Traffic Study Supplemental Analysis Memo The Mobility Group Transportation Strategies & Solutions Memorandum To: From: Subject: Tomas Carranza, LADOT Matthew Simons Traffic Review - Revised
Volume 1 Traffic Impact Analysis Turtle Creek Boulevard Dallas, Texas. Kimley-Horn and Associates, Inc. Dallas, Texas.
 Volume 1 Traffic Impact Analysis 2727 Dallas, Texas June 18, 2018 Kimley-Horn and Associates, Inc. Dallas, Texas Project #064523000 Registered Firm F-928 Traffic Impact Analysis 2727 Dallas, Texas Prepared
City of Pacific Grove
 Regional Study Utilizing Caltrans Intersection Evaluation Section 7: City of Pacific Grove s: FIRST STREET AT CENTRAL AVENUE Transportation Agency for Monterey County Prepared by Transportation Agency
TRAFFIC IMPACT ANALYSIS. for MILTON SQUARE
 TRAFFIC IMPACT ANALYSIS for MILTON SQUARE US Route 7 Milton, Vermont March 5, 2008 LAMOUREUX & DICKINSON 14 Morse Drive Essex Junction, Vermont 05452 (802) 878-4450 Traffic Impact Assessment EXECUTIVE
Quantitative analyses of weekday a.m. and p.m. commuter hour conditions have been conducted for the following five scenarios:
 6.1 TRANSPORTATION AND CIRCULATION 6.1.1 INTRODUCTION This section of the EIR presents the results of TJKM s traffic impact analysis of the proposed Greenbriar Development. The analysis includes consideration
Appendix B Traffic Impact Analysis, Asphalt Plant No. 1 Replacement and Modernization
 Appendix B Traffic Impact Analysis, Asphalt Plant No. 1 Replacement and Modernization REPORT Traffic Impact Analysis, Asphalt Plant No. 1 Replacement and Modernization Prepared for City of Los Angeles
TRAFFIC IMPACT ASSESSMENT PART OF AN ENVIRONMENTAL IMPACT ASSESSMENT FOR THE KEBRAFIELD ROODEPOORT COLLIERY IN THE PULLEN S HOPE AREA
 TRAFFIC IMPACT ASSESSMENT PART OF AN ENVIRONMENTAL IMPACT ASSESSMENT FOR THE KEBRAFIELD ROODEPOORT COLLIERY IN THE PULLEN S HOPE AREA 20 March 2014 Report prepared by: Corli Havenga Transportation Engineers
DRAFT TRANSPORTATION IMPACT STUDY CASTILIAN REDEVELOPMENT PROJECT
 DRAFT TRANSPORTATION IMPACT STUDY CASTILIAN REDEVELOPMENT PROJECT Prepared for: Submitted by: 299 Lava Ridge Ct. Suite 2 Roseville, CA. 95661 June 212 TABLE OF CONTENTS 1. Introduction... 1 Project Location
4 COSTS AND OPERATIONS
 4 COSTS AND OPERATIONS 4.1 INTRODUCTION This chapter summarizes the estimated capital and operations and maintenance (O&M) costs for the Modal and High-Speed Train (HST) Alternatives evaluated in this
Trafalgar Road & Lower Base Line Transportation Study Ontario Inc.
 Trafalgar Road & Lower Base Line Transportation Study 1255723 Ontario Inc. Trafalgar Road & Lower Base Line Transportation Study 1255723 Ontario Inc. 1465 Pickering Parkway Suite 200 Pickering ON L1V 7G7
INTERSECTION CONTROL EVALUATION
 INTERSECTION CONTROL EVALUATION Trunk Highway 22 and CSAH 21 (E Hill Street/Shanaska Creek Road) Kasota, Le Sueur County, Minnesota November 2018 Trunk Highway 22 and Le Sueur CSAH 21 (E Hill Street/Shanaska
Section 3.12 Traffic and Transportation
 Section. Traffic and Transportation SECTION SUMMARY This section describes existing ground transportation within the Port and surrounding area associated with implementation of the proposed Project. An
5.9 TRANSPORTATION AND TRAFFIC
 5.9 TRANSPORTATION AND TRAFFIC This section evaluates transportation- and traffic-related impacts that have the potential to result from the construction and operation of the Project. Information and analysis
ZINFANDEL LANE / SILVERADO TRAIL INTERSECTION TRAFFIC ANALYSIS
 ZINFANDEL LANE / SILVERADO TRAIL INTERSECTION TRAFFIC ANALYSIS UPDATED TRAFFIC STUDY FOR THE PROPOSED RAYMOND VINEYARDS WINERY USE PERMIT MODIFICATION #P11-00156 AUGUST 5, 2014 PREPARED BY: OMNI-MEANS,
Regional Transportation System The regional transportation system is discussed in Chapter 5, Section 5.7.
 6.7 TRAFFIC 6.7.1 Affected Environment Regional Transportation System The regional transportation system is discussed in Chapter 5, Section 5.7. Local Transportation System The proposed Dillingham Trail
ANDERSON PROPERTY SITE ANALYSIS
 ANDERSON PROPERTY SITE ANALYSIS Introduction The Montgomery County Department of Transportation (MCDOT) initiated a feasibility study in the fall of 2012 to evaluate the need for transit service expansion
Appendix B Traffic Impact Analysis, Asphalt Plant No. 1 Replacement and Modernization
 Appendix B Traffic Impact Analysis, Asphalt Plant No. 1 Replacement and Modernization DRAFT REPORT Traffic Impact Analysis, Asphalt Plant No. 1 Replacement and Modernization Prepared for City of Los Angeles
Appendix H: Construction Impacts H-2 Transportation
 Appendix H: Construction Impacts H-2 Transportation \ AECOM 71 W. 23 rd Street New York, NY 10010 www.aecom.com 212 366 6200 tel 212 366 6214 fax Memorandum To CC Subject Robert Conway Donald Tone Construction
Traffic Impact Study for the Maria Drive Apartment Complex
 Traffic Impact Study for the Maria Drive Apartment Complex Prepared for the City of Petaluma Submitted by Whitlock & Weinberger Transportation, Inc. 490 Mendocino Avenue Suite 201 Santa Rosa, CA 95401
INTERCHANGE OPERTIONS STUDY Interstate 77 / Wallings Road Interchange
 INTERCHANGE OPERTIONS STUDY Interstate 77 / Wallings Road Interchange City of Broadview Heights, Cuyahoga County, Ohio Prepared For: City of Broadview Heights Department of Engineering 9543 Broadview Road
TRAFFIC IMPACT ANALYSIS FOR. McDONALD S RESTAURANT IN CARMICAEL Sacramento County, CA. Prepared For:
 TRAFFIC IMPACT ANALYSIS FOR McDONALD S RESTAURANT IN CARMICAEL Sacramento County, CA Prepared For: McDonald s USA, LLC Pacific Sierra Region 2999 Oak Road, Suite 900 Walnut Creek, CA 94597 Prepared By:
TRAFFIC IMPACT STUDY. USD #497 Warehouse and Bus Site
 TRAFFIC IMPACT STUDY for USD #497 Warehouse and Bus Site Prepared by: Jason Hoskinson, PE, PTOE BG Project No. 16-12L July 8, 216 145 Wakarusa Drive Lawrence, Kansas 6649 T: 785.749.4474 F: 785.749.734