APPENDIX J LAKE WOHLFORD DAM REPLACEMENT PROJECT TRAFFIC IMPACT ANALYSIS (DAM REPLACEMENT) Lake Wohlford Dam Replacement Project EIR
|
|
|
- Felicia Christine Robertson
- 5 years ago
- Views:
Transcription
1 APPENDIX J LAKE WOHLFORD DAM REPLACEMENT PROJECT TRAFFIC IMPACT ANALYSIS (DAM REPLACEMENT) Replacement Project EIR Appendices
2


3 TRAFFIC IMPACT ANALYSIS LAKE WOHLFORD DAM Escondido, California December 19, 2014 LLG Ref
4 EXECUTIVE SUMMARY The project ( Project ) proposes constructing a replacement dam immediately west of the existing dam and deconstructing the existing dam. The Project site is east of the intersection of Oakvale Road and Lake Wohlford Road on City of Escondido-owned land in unincorporated San Diego County, northeast of downtown Escondido. Project construction will generate traffic from on-site workers and the hauling of material to and from the Project site, which will cease upon completion of the Project. The Project study area includes four (4) intersections and two (2) roadway street segments. The traffic analyses for the project were conducted in accordance with the City of Escondido s Traffic Impact Requirement Guidelines (2014). The following scenarios are evaluated in this report: Existing Existing + Project Existing + Cumulative Projects Existing + Project + Cumulative Projects The Project traffic generation calculations were conducted using a site-specific trip generation methodology described in detail in Section 7.1. Based on the number of employees, truck trips, and other Project characteristics, the Project is calculated to generate 898 daily trips with 59 trips (31 inbound/ 28 outbound) in the AM peak hour and 59 trips (28 inbound/ 31 outbound) during the PM peak hour. These calculations represent the busiest phase of the Project, which is expected to last five months. Total Project construction, including the Oakvale Road realignment, which is studied in a separate report, is expected to require approximately sixteen months. Project traffic was distributed via truck routes identified in the City s General Plan. The distribution was developed with respect to the Project s location relative to local destinations and regional access via I-15 and the roadway characteristics and existing traffic patterns on the truck routes. Cumulative projects were accounted for based on research conducted by LLG within the City of Escondido and County of San Diego, and an interpolated growth rate based on Year 2035 volumes and existing traffic counts was applied. A Horizon Year (2035) analysis was not conducted since the Project will not add any trips to the street system once construction is complete. Based on the City of Escondido significance criteria, no significant impacts were identified. Therefore no mitigation measures are proposed. i N:\2324\\Report\2324 Report LW Nov 2014.doc
5 TABLE OF CONTENTS SECTION PAGE 1.0 Introduction Project Description Project Description Project Location Existing Conditions Study Area Existing Transportation Conditions Existing Traffic Volumes Analysis Approach and Methodology Significance Criteria City of Escondido Analysis of Existing Conditions Peak Hour Intersection Levels of Service Daily Street Segment Levels of Service Trip Generation, Distribution, and Assignment Trip Generation Truck Trips Employee Trips Trip Distribution & Assignment Cumulative Growth Traffic Volumes Analysis of Near-Term Scenarios Existing + Project Intersection Analysis Segment Operations Existing + Cumulative Growth Intersection Analysis Segment Operations Existing + Project + Cumulative Growth Intersection Analysis Segment Operations ii N:\2324\\Report\2324 Report LW Nov 2014.doc
6 10.0 Significance of Impacts and Mitigation Measures Significance of Impacts Mitigation Measures APPENDIX APPENDICES A. Intersection and Segment Manual Count Sheets B. Intersection Methodology and Analysis Sheets C. City of Escondido Roadway Classification Table LIST OF FIGURES SECTION FIGURE # PAGE Figure 1 1 Vicinity Map... 2 Figure 1 2 Project Area Map... 3 Figure 3 1 Existing Conditions Diagram... 7 Figure 3 2 Existing Traffic Volumes... 8 Figure 7 1 Project Traffic Distribution Figure 7 2 Project Traffic Volumes Figure 7 3 Existing + Project Traffic Volumes Figure 7 4 City of Escondido Truck Routes Figure 8 1 Cumulative Growth Traffic Volumes Figure 8 2 Existing + Cumulative Growth Traffic Volumes Figure 8 3 Existing + Project + Cumulative Growth Traffic Volumes iii N:\2324\\Report\2324 Report LW Nov 2014.doc
7 LIST OF TABLES SECTION TABLE # PAGE Table 3 1 Existing Traffic Volumes... 6 Table 4 1 Traffic Impact Analysis ADT Thresholds for Roadway Segments Table 4 2 Traffic Impact Analysis ADT Thresholds for Intersections Table 5 1 City of Escondido Traffic Impact Significance Thresholds Table 6 1 Existing Intersection Operations Table 6 2 Existing Street Segment Operations Table 7 1 Project Trip Generation Table 9 1 Near-Term Intersection Operations Table 9 2 Near-Term Street Segment Operations iv N:\2324\\Report\2324 Report LW Nov 2014.doc
8 TRAFFIC IMPACT ANALYSIS LAKE WOHLFORD DAM Escondido, California December 19, INTRODUCTION Linscott, Law and Greenspan, Engineers (LLG) have prepared the following traffic impact analysis to assess the impacts to the street system as a result of the project ( Project ), which proposes constructing a replacement dam immediately west of the existing dam and deconstructing the existing dam. The Project site is on land owned by the City of Escondido (City), east of the intersection of Oakvale Road and Lake Wohlford Road in unincorporated San Diego County (County), northeast of downtown Escondido. Figure 1 1 shows the Project vicinity and Figure 1 2 illustrates, in more detail, the site location. The traffic analysis presented in this report includes the following: Project Description Existing Conditions Analysis Approach and Methodology Significance Criteria Analysis of Existing Conditions Project Trip Generation/Distribution/Assignment Cumulative Projects Analysis of Near-term Scenarios Significance of Impacts and Mitigation Measures 1 N:\2324\\Report\2324 Report LW Nov 2014.doc
9 OCEANSIDE VISTA Legend City P A C I F I C O C E A N Boundary Incorporated Unincorporated 5 SOLANA BEACH CARLSBAD DEL MAR ENCINITAS N:\2324\\Figures Date: 12/11/14 } SAN DIEGO CORONADO SAN MARCOS }56 }163 }52 }75 1 }15 ESCONDIDO NATIONAL CITY 15 }94 POWAY LA MESA LEMON GROVE }54 }125 }125 PROJECT SITE SANTEE }94 }67 EL CAJON 8 [ Miles Figure 1-1 Vicinity Map

10 Project Site N:\2324\\Figures Date: 12/11/14 Figure 1-2 Project Area Map
11 2.0 PROJECT DESCRIPTION 2.1 Project Description Lake Wohlford is a man-made reservoir owned and operated by the City of Escondido. The Project entails constructing a replacement dam immediately downstream (west) of the existing dam and deconstructing the existing dam by removing the hydraulic fill material that is at a higher elevation than the original rock fill. The replacement dam would feature an outlet tower that is integrated into the dam s upstream face; the top of the existing outlet tower would be demolished, and the bottom of the existing outlet tower and the outlet pipe would be abandoned in place. To accommodate the replacement dam s configuration, the City also intends to realign a portion of Oakvale Road that passes the southern dam abutment. This portion of the road would be realigned south of its current location, requiring excavation into the adjacent hillside. The City intends to construct the Oakvale Road realignment as a separate construction package prior to the dam construction and this road realignment is the subject of a separate study. Therefore, this study is focused on the Project phases subsequent to the road realignment. Total Project construction, including the realignment of Oakvale Road, is anticipated to require approximately sixteen months. Roadway excavation is scheduled to begin in May Completion of the realigned road is expected in December Subsequently, excavation of the dam foundation is anticipated to take 2 to 3 months. Establishment of a temporary access road is anticipated to take 1 to 2 months. The dam raise construction is then anticipated to take 5 months. 2.2 Project Location Lake Wohlford is located in the rural foothills of unincorporated County of San Diego, approximately 0.5 miles east of the City s incorporated boundaries and 5 miles northeast of the City s downtown center. Lake Wohlford is within the County s unincorporated Valley Center Community Planning Area, on land owned by the City. The primary staging area for Project construction is anticipated to be located at the Lake Wohlford Marina and on the adjacent lakeshore area to the west. A temporary access road would connect the Marina staging area to the dam construction zone. 4 N:\2324\\Report\2324 Report LW Nov 2014.doc
12 3.0 EXISTING CONDITIONS 3.1 Study Area The study area was determined in accordance with the City of Escondido s published Traffic Impact Analysis Requirement Guidelines (2014). Further details on the City s guidelines for developing the study area can be found in Section 4.0. The study area includes the following four (4) existing public intersections and two (2) street segments. Intersections: 1. Lake Wohlford Road / Oakvale Road 2. Lake Wohlford Road / Valley Center Road 3. Valley Parkway / El Norte Parkway 4. Valley Parkway / Bear Valley Parkway Segments: Lake Wohlford Road Valley Center Road to Oakvale Road Valley Parkway El Norte Parkway to Lake Wohlford Road 3.2 Existing Transportation Conditions The following is a brief description of the streets in the Project area. Roadway classifications are taken from the City of Escondido s General Plan Mobility Element (2011). Lake Wohlford Road is a generally east/west facility with portions in both the City of Escondido and the unincorporated area of the County. Within the City of Escondido it is classified as a Local Collector. Within the unincorporated County it is classified as a 2.2F Light Collector. For the purpose of being conservative, the lower-capacity County classification is used. Lake Wohlford Road is currently constructed as a two-lane undivided roadway with narrow shoulders and no passing lanes, through generally steep and mountainous terrain. The posted speed limit is 50 mph. Valley Parkway is a north/south roadway within the City of Escondido and is classified as a Prime Arterial in the vicinity of the Project. From Bear Valley Parkway to Beven Drive, Valley Parkway is currently built as a five-lane divided roadway. From Beven Drive to Lake Wohlford Road, Valley Parkway transitions to a two-lane roadway with a two-way left-turn lane median. The posted speed limit is 45 mph. Bear Valley Parkway is a north/south facility in the City of Escondido with varying classifications. In the Project study area, from Valley Parkway to Boyle Avenue it is currently constructed as a fourlane divided roadway and classified as a Major Road. The posted speed limit is 45 mph north of Boyle Avenue. Curbside parking is prohibited. Bear Valley Parkway provides Class II bicycle lanes from Valley Parkway to Boyle Avenue. 5 N:\2324\\Report\2324 Report LW Nov 2014.doc
13 El Norte Parkway is currently built as a Four-Lane Collector west of Valley Parkway to Washington Avenue. Bike lanes and bus stops are provided on El Norte Parkway in the study area. Figure 3 1 shows an existing conditions diagram, including signalized/unsignalized intersections and lane configurations. 3.3 Existing Traffic Volumes Table 3 1 is a summary of the most recent available Average Daily Traffic (ADT) counts. LLG commissioned these street segment counts as well as manual hand counts at the study area intersections in February and March 2014 when schools were in session. Street Segment TABLE 3 1 EXISTING TRAFFIC VOLUMES ADT a Lake Wohlford Road Valley Center Road to Oakvale Road 4,680 Valley Parkway El Norte Parkway to Lake Wohlford Road 29,700 b Footnotes: a. Average Daily Traffic Volume counts conducted in February and March 2014 by LLG Engineers. b. Volume based on Escondido General Plan Update Traffic Impact Analysis, December 5, 2011 Figure 3 2 shows the Existing Traffic Volumes. Appendix A contains the manual count sheets. 6 N:\2324\\Report\2324 Report LW Nov 2014.doc
14 Êe 5D Lk Wohlfrd Rd El Norte Pkwy Êe ee!$ Oakvale Rd 3 4 RTOL Vlly Center Rd ee Bear Vlly Pkwy Êe ee Lk Wohlfrd Rd RTOL 4D 60 Center R d Valle y Lake Wohlford 2U Rd 50 1 [_ PROJECT SITE!!! Oakvale Rd 2U 2U 2 5D El Norte Pkwy 3 4 # Number of Travel Lanes 50 4D Bear D / U RTOL Divided / Undivided Roadway Turn Lane Configurations Right Turn Overlap Phase Intersection Control XX Posted Speed Limit N:\2324\Lake Wohlfrd Dam\Figures Date: 12/11/14 Figure 3-1 Existing Conditions Diagram
15 1 2 Lk Wohlfrd Rd 109 / / / / / 9 El Norte Pkwy 324 / / / 89 Oakvale Rd 182 / / 5 11 / 9 3 / 3 5 / 6 79 / / / / / ,091 / / 7 51 / / / 9 19 / / / 49 Vlly Center Rd 5 / / 210 Bear Vlly Pkwy 93 / / 1, / / / / / / 365 Center R d Valle y Lake Wohlford 4,680 Rd 1 [_ PROJECT SITE!!! Oakvale Rd 2 29,700 El Norte Pkwy 3 4 Bear N:\2324\\Figures Date: 12/11/14!# Study Intersections AM / PM AM / PM Intersection Peak Hour Volumes XX,XXX Average Daily Trips [ Figure 3-2 Existing Traffic Volumes
16 4.0 ANALYSIS APPROACH AND METHODOLOGY Level of service (LOS) is the term used to denote the different operating conditions which occur on a given roadway segment under various traffic volume loads. It is a qualitative measure used to describe a quantitative analysis taking into account factors such as roadway geometries, signal phasing, speed, travel delay, freedom to maneuver, and safety. Level of service provides an index to the operational qualities of a roadway segment or an intersection. Level of service designations range from A to F, with LOS A representing the best operating conditions and LOS F representing the worst operating conditions. Level of service designation is reported differently for signalized intersections, unsignalized intersections and roadway segments. The City of Escondido s Traffic Impact Analysis Guidelines (2014) provide the following direction on report approach and methodology: 1. The traffic study should include a SANDAG prepared Select Zone Assignment for the project to determine the project traffic distribution. 2. The traffic study should utilize the Brief Guide of Vehicular Traffic Generation Rates for the San Diego Region (April 2002) published by SANDAG, to determine the project traffic volume. 3. Traffic should utilize the following scenarios to determine project traffic impacts at intersections and along roadway segments. a. Existing Condition (based on new traffic counts) b. Existing + Project Traffic Condition c. Existing + Cumulative Projects Traffic Condition d. Existing + Cumulative Projects + Project Traffic Condition e. Year 2035 Traffic Condition 4. Highway Capacity Manual (Year 2010) should be utilized to determine level of service for intersections. 5. The study area should include at least all site access points and major intersections (signalized and un-signalized) adjacent to the site. The tables below contain the trigger-points to identify if a roadway segment or intersection should be included in the Traffic Impact Analysis. Table 4 1 below contains the trigger-points for roadway segments within the City of Escondido for different street classifications based on ADT added to the segment. Table 4 2 below contains the trigger-points for intersections based on peak hour volumes. 9 N:\2324\\Report\2324 Report LW Nov 2014.doc
17 TABLE 4 1 TRAFFIC IMPACT ANALYSIS ADT THRESHOLDS FOR ROADWAY SEGMENTS Street Classification Lanes Cross Sections (ft.) TIA Trigger-Points (ADT generation) Prime Arterial Major Road Collector (8 lanes) 116/136 (NP) 900 (6 lanes) 106/126 (NP) 800 (6 lanes) 90/110 (NP) 700 (4 lanes) 82/102 (NP) 500 (4 lanes) 64/84 (NP) 500 (4 lanes) (WP) 250 Local Collector and all other (2 lanes) 42/66 (NP) (WP) 200 TABLE 4 2 TRAFFIC IMPACT ANALYSIS ADT THRESHOLDS FOR INTERSECTIONS Intersection Classification (Minor leg of the intersection) TIA Trigger-Points (AM or PM peak hour trips added to any leg) Prime Arterial 50 Major Road 40 Collector 30 Local Collector 20 Signalized intersections were analyzed under AM and PM peak hour conditions. Average vehicle delay was determined utilizing the methodology found in Chapter 18 of the 2010 Highway Capacity Manual (HCM), with the assistance of the Synchro (version 8) computer software. The delay values (represented in seconds) were qualified with a corresponding intersection LOS. Signalized intersection calculation worksheets and a more detailed explanation of the methodology are attached in Appendix B. Unsignalized intersections were analyzed under AM and PM peak hour conditions. Average vehicle delay and LOS was determined based upon the procedures found in Chapters 19 and 20 of the 2010 Highway Capacity Manual (HCM), with the assistance of the Synchro (version 8) computer software. Unsignalized intersection calculation worksheets and a more detailed explanation of the methodology are attached in Appendix B. 10 N:\2324\\Report\2324 Report LW Nov 2014.doc
18 Street segment analysis is based upon the comparison of daily traffic volumes (ADTs) to the City of Escondido Roadway Classification, Level of Service, and ADT Table. This table provides segment capacities for different street classifications, based on traffic volumes and roadway characteristics. The City of Escondido Roadway Classification, Level of Service, and ADT Table is attached in Appendix C. 11 N:\2324\\Report\2324 Report LW Nov 2014.doc
19 5.0 SIGNIFICANCE CRITERIA The project study area includes locations that lie within the City of Escondido s General Plan Area. The following is a summary of the City s published significance criteria. 5.1 City of Escondido In accordance with SANTEC/ITE Guidelines for Traffic Impact Studies in the San Diego Region, the following thresholds shall be used to identify if a project is of significant traffic impact under any scenario. Based on SANTEC/ITE guidelines, if now or in the future, the project s traffic impact causes the values in Table 5 1 below to be exceeded in a roadway segment or an intersection that is operating at LOS D or worse, it is determined to be a significant impact and the project shall identify mitigation measures. Level of Service With Project TABLE 5 1 CITY OF ESCONDIDO TRAFFIC IMPACT SIGNIFICANCE THRESHOLDS Allowable Change due to Project Impact Roadway Segments Intersections V/C Speed Reduction (mph) Delay (sec.) D, E, or F N:\2324\\Report\2324 Report LW Nov 2014.doc
20 6.0 ANALYSIS OF EXISTING CONDITIONS 6.1 Peak Hour Intersection Levels of Service Table 6 1 summarizes the existing peak hour intersection operations. As shown, all the study area intersections are calculated to currently operate at service levels of LOS C or better during both the AM and PM peak hours. TABLE 6 1 EXISTING INTERSECTION OPERATIONS Intersection Control Type Peak Hour Delay a Existing LOS b 1. Lake Wohlford Road / Oakvale Road MSSC c 2. Lake Wohlford Road / Valley Center Road Signal 3. Valley Parkway / El Norte Parkway Signal 4. Valley Parkway / Bear Valley Parkway Signal Footnotes: a. Average delay expressed in seconds per vehicle. b. Level of Service. c. Minor Street Stop Controlled intersection, minor street left-turn delay is reported. AM 10.4 B PM 11.5 B AM 15.5 B PM 10.7 B AM 22.8 C PM 26.6 C AM 24.9 C PM 20.3 C SIGNALIZED DELAY/LOS THRESHOLDS UNSIGNALIZED DELAY/LOS THRESHOLDS Delay LOS Delay LOS A A 10.1 to 20.0 B 10.1 to 15.0 B 20.1 to 35.0 C 15.1 to 25.0 C 35.1 to 55.0 D 25.1 to 35.0 D 55.1 to 80.0 E 35.1 to 50.0 E 80.1 F 50.1 F 6.2 Daily Street Segment Levels of Service Table 6 2, on the following page, summarizes the existing segment operations along the key study area roadways. As shown, both roadway segments currently operate at LOS C or better. 13 N:\2324\\Report\2324 Report LW Nov 2014.doc
21 Street Segment TABLE 6 2 EXISTING STREET SEGMENT OPERATIONS Existing Classification Capacity (LOS E) a ADT b LOS c V/C d Lake Wohlford Road Valley Center Road to Oakvale Road Local Collector 9,700 e 4,680 A Valley Parkway El Norte Parkway to Lake Wohlford Road 5-Lane Major f 43,500 29,700 C Footnotes: a. Capacities based on the City of Escondido Roadway Classification (see Appendix C). b. Average Daily Traffic volumes c. Level of Service d. Volume to Capacity e. County of San Diego Light Collector w/reduced Shoulder (2.2F) capacity used. f. Capacity based on average of 4-Lane Major and 6-Lane Major 14 N:\2324\\Report\2324 Report LW Nov 2014.doc
22 7.0 TRIP GENERATION, DISTRIBUTION, AND ASSIGNMENT 7.1 Trip Generation Project trip generation will be composed of heavy truck trips making multiple round-trips per day and employee trips, mainly commute trips to and from the site by workers who will remain on-site for the duration of their shift. Each of these components are discussed in greater detail in the following sections. Based on direct coordination with the client, LLG determined the following values and assumptions that are relevant to both components of Project trip generation: The Project will employ a 16-hour workday comprised of two shifts. The shifts are typically expected to run from 6 AM to 3 PM and from 3 PM to 12 AM Truck Trips The Project consists of multiple phases which would generate a varying number of daily haul trips by heavy trucks. Excavation of the dam s foundation and adjacent slopes would result in approximately 59,600 cubic yards of material from foundation and abutment slopes hauled to a nearby quarry. Hauling would entail 96 truckloads per day over a 9-week period. The dam construction phase would require approximately 193,000 tons of material, including aggregate, fly ash, and cement, to be delivered to the site. In total, the hauling of material to the site would result in 88 truckloads per day over approximately 13-weeks of the 4- to 5-month dam construction period. Demolition of the existing dam, assuming the full dam removal option is implemented, would result in 59,100 cubic yards of material to be hauled off-site. This would require 96 truckloads per day over a 9-week period. Although the base number of truck trips is lower during the dam construction phase, 20 cubic-yard trucks would be used during this phase, versus 10 cubic-yard trucks in other phases. The larger truck type in use during this phase would result in a relatively greater effect on the street system. Therefore the dam construction phase, representing the most intense phase of the Project, is the phase used to calculate Project trip generation in this analysis. Project ADT associated with trucks trips is calculated by applying a rate of 2.0 to the 88 round trips to account for both inbound and outbound truck trips. A Passenger Car Equivalent (PCE) of 4.0 is also applied to account for the differing speed, acceleration, and maneuverability of heavy trucks compared to typical passenger vehicles. The AM and PM peak hour percentages were determined by assuming 100% of truck trips take place within and are evenly dispersed over the 16-hour workday described previously. This yields an hourly share of 6.25% of truck trips, which is conservatively rounded up to 7% in the calculation below. 15 N:\2324\\Report\2324 Report LW Nov 2014.doc
23 7.1.2 Employee Trips Project engineers calculate that during the dam construction phase there will be a maximum of 44 on-site workers during any one shift, resulting conservatively in 88 employees traveling to the site in a single day. A trip rate of 2.2 per employee was used to account for daily commuting to and from the Project site and occasional extra trips taken by employees during the workday. This rate also includes trips by other miscellaneous staff that may be on site on an intermittent basis, including surveyors, materials testing, inspection, or environmental monitoring. Based on the typical shift schedule previously noted, the arrival and departure of each shift would occur outside of 7 AM to 9 AM and 4 PM to 6 PM peak periods. The remaining 0.2 trips per employee, or roughly 10% of the total employee trip generation, may occur throughout the day. It is conservatively assumed that these trips may take place during the AM and PM peak periods, and are split evenly between the two peaks. Table 7 1 shows a summary of the Project traffic generation. As tabulated the proposed Project is calculated to generate the equivalent of 898 daily trips with 59 trips (31 inbound/ 28 outbound) in the AM peak hour and 59 trips (28 inbound/ 31 outbound) during the PM peak hour. TABLE 7 1 PROJECT TRIP GENERATION AM Peak Hour PM Peak Hour Type Amount Rate a PCE b ADT % of In:Out Volume % of In:Out Volume ADT Split In Out ADT Split In Out Truck % 5: % 5: Employee % 6: % 4:6 4 6 Total Footnotes: a. Rate is based on site-specific trip generation factors. b. Passenger Car Equivalent 7.2 Trip Distribution & Assignment Project trips were distributed regionally based on potential destinations for material hauling from construction activity. A small number of trips were distributed via Lake Wohlford Road and Valley Center Road to possible local destinations in Valley Center. The rest of the trips are distributed to regional destinations via the City of Escondido s identified truck routes, ultimately reaching I-15 for regional access. Trips were split among these existing truck routes based on orientation to northbound or southbound destinations and roadway characteristics including size of the roadway, existing congestion patterns, surrounding land uses, and spacing of signalized intersections. Figure 7 1 shows the Project trip distribution percentages. Figure 7 2 shows the AM/PM peak hour Project traffic volumes. Figure 7 3 shows Existing + Project traffic volumes. Figure 7 4 shows truck routes within the City of Escondido as identified in the City s Mobility and Infrastructure Element. 16 N:\2324\\Report\2324 Report LW Nov 2014.doc
24 1 2 Lk Wohlfrd Rd 75% 20% Oakvale Rd % 45% El Norte Pkwy 45% 15% 20% 45% 75% 5% Vlly Center Rd Bear Vlly Pkwy 90% 30% 5% 90% 15% 30% Center R d 75% 5% 2 90% 5% Valle y Lake Wohlford 95% Rd 1 [_ PROJECT SITE!!! Oakvale Rd El Norte Pkwy 45% 3 45% 15% 4 30% Bear ^_ XX% Project Site Project Traffic Distribution XX% Distribution by Movement N:\2324\\Figures Date: 12/11/14 [ Figure 7-1 Project Trip Distribution
25 1 2 Lk Wohlfrd Rd 21 / 23 1 / 1 Vlly Center Rd 1 / 1 26 / 28 6 / 6 13 / / 14 El Norte Pkwy 23 / / 13 Oakvale Rd 6 / 6 14 / / 5 Bear Vlly Pkwy 28 / 26 9 / 8 5 / 5 8 / 9 Center R d Valle y Lake Wohlford 853 Rd 1 [_ PROJECT SITE!!! Oakvale Rd El Norte Pkwy 3 4 Bear N:\2324\\Figures Date: 12/11/14!# Study Intersections AM / PM AM / PM Intersection Peak Hour Volumes XX,XXX Average Daily Trips [ Figure 7-2 Project Traffic Volumes
26 1 2 Lk Wohlfrd Rd 132 / / / / / 9 El Norte Pkwy 338 / / / 89 Oakvale Rd 203 / / 5 17 / 15 3 / 3 5 / 6 79 / / / / / ,091 / / 8 51 / / / 9 19 / / / 49 Vlly Center Rd 6 / / 238 Bear Vlly Pkwy 93 / / 1, / / / / / / 374 Center R d Valle y Lake Wohlford 5,533 Rd 1 [_ PROJECT SITE!!! Oakvale Rd 2 30,508 El Norte Pkwy 3 4 Bear N:\2324\\Figures Date: 12/11/14!# Study Intersections AM / PM AM / PM Intersection Peak Hour Volumes XX,XXX Average Daily Trips [ Figure 7-3 Existing + Project Traffic Volumes
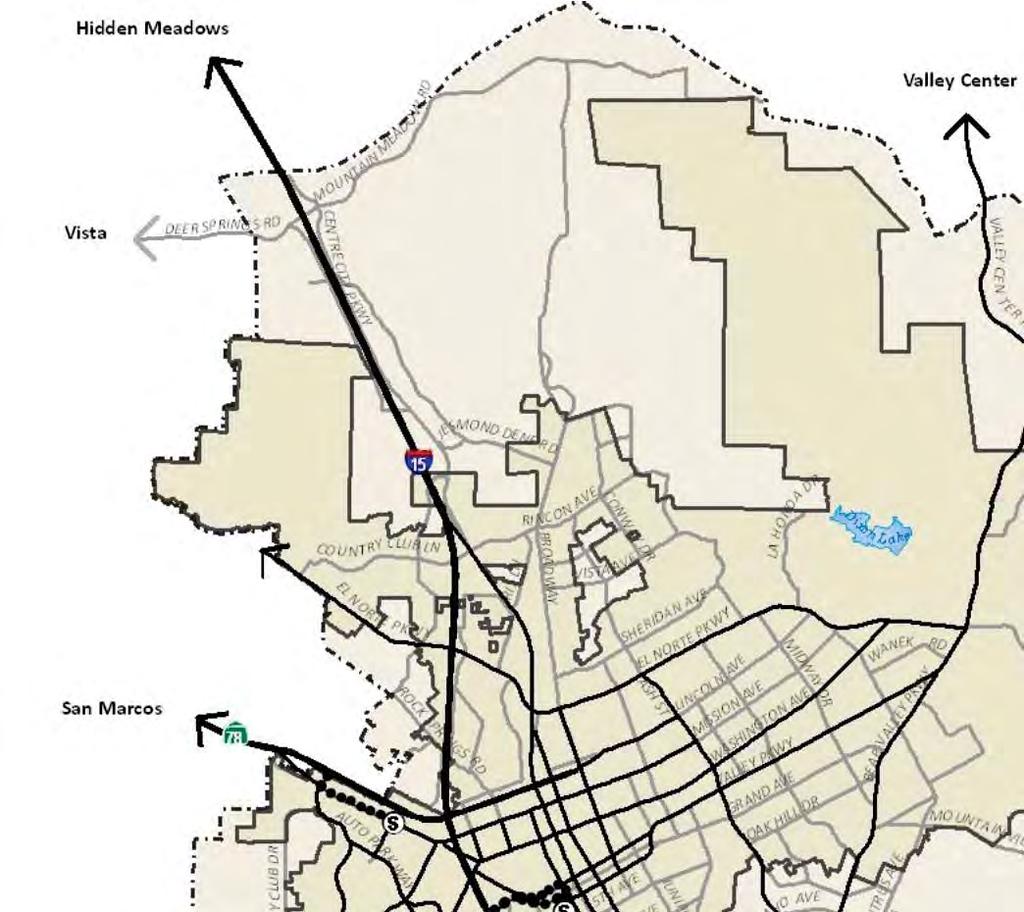
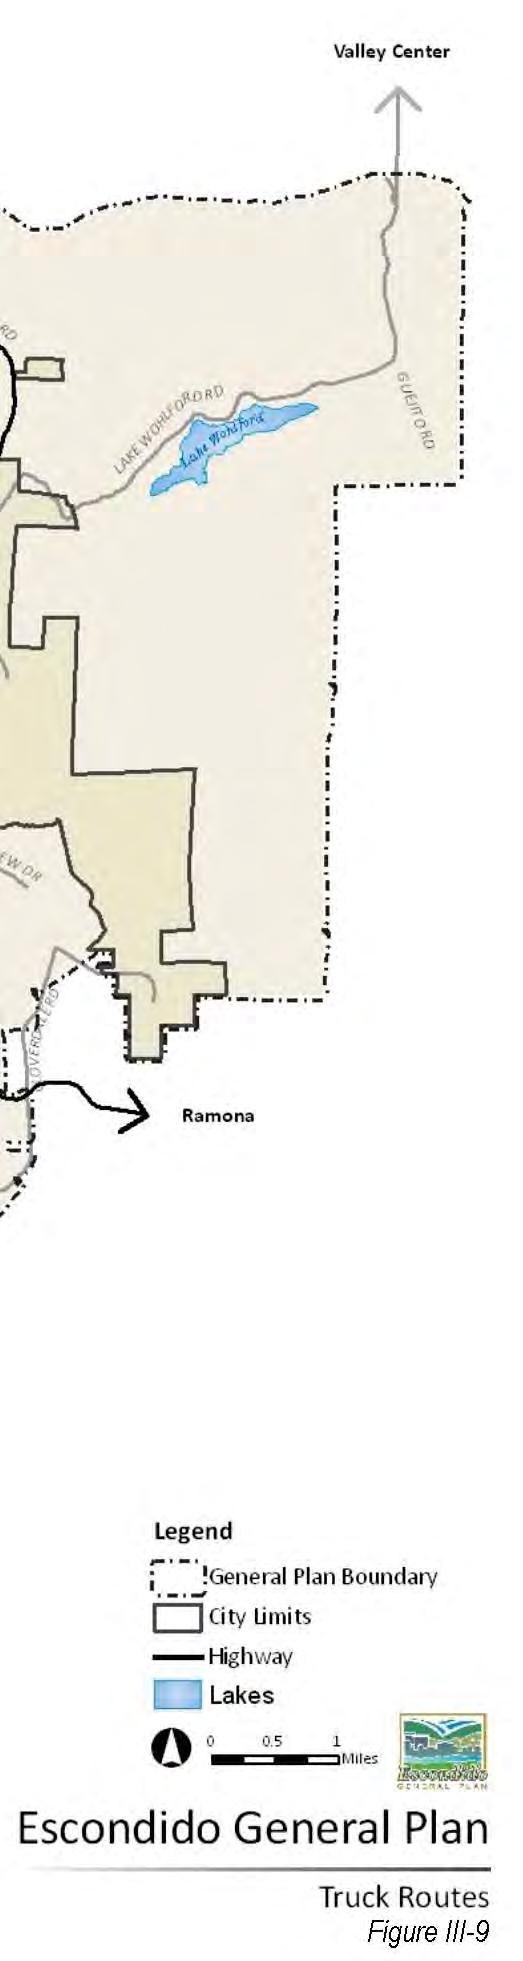
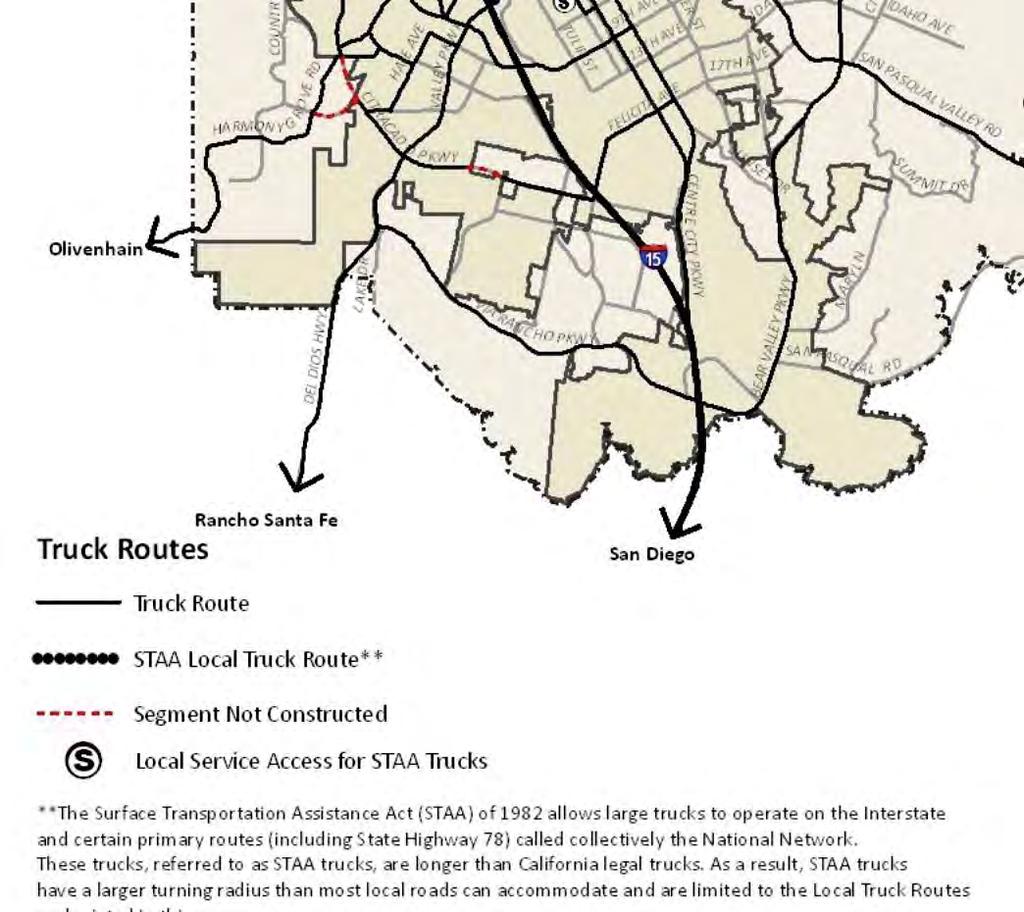

27 N:\2324\\Figures Date: 12/11/14 Figure 7-4 City of Escondido Truck Routes
28 8.0 CUMULATIVE GROWTH TRAFFIC VOLUMES Cumulative projects are other projects in the study area that will add traffic to the local circulation system in the near future. LLG coordinated directly with City of Escondido and County of San Diego staff to determine and obtain cumulative projects traffic volume information to be included for analysis. LLG has recently completed traffic studies for two projects in the vicinity which may add traffic to the roadway system analyzed. However, due to uncertain completion dates of these projects a cumulative growth approach was used. In order to forecast near-term cumulative traffic conditions LLG used interpolated growth between Year 2035 and existing Year 2014 traffic counts. Typical annual growth ranged between 2-5% at study area intersections and segments. Based on the estimates of when Project phases are scheduled to begin, as presented in Section 2.1, the dam construction phase, which is the basis of Project trip generation as discussed in Section 7.1, would begin in early Thus, location-specific growth factors were applied to each study area location for a period of two (2) years to arrive at near-term baseline conditions which are analyzed in this report as + Cumulative Growth scenarios. Figure 8 1 shows the total cumulative growth traffic volumes. Figure 8 2 shows the existing + cumulative growth traffic volumes. Figure 8 3 shows the existing + project + cumulative growth traffic volumes. 21 N:\2324\\Report\2324 Report LW Nov 2014.doc
29 1 2 Lk Wohlfrd Rd 14 / 28 0 / 1 30 / / 34 El Norte Pkwy 22 / 35 1 / 1 7 / 4 Oakvale Rd 1 / 0 23 / 22 1 / 1 1 / 0 4 / 5 20 / 47 1 / / 72 1 / 1 0 / 1 12 / 21 3 / 2 Vlly Center Rd Bear Vlly Pkwy 0 / 1 23 / / / / / 15 4 / 2 27 / 27 Center R d Valle y Lake Wohlford 570 Rd 1 [_ PROJECT SITE!!! Oakvale Rd 2 90 El Norte Pkwy 3 4 Bear N:\2324\\Figures Date: 12/11/14!# Study Intersections AM / PM AM / PM Intersection Peak Hour Volumes XX,XXX Average Daily Trips [ Figure 8-1 Cumulative Growth Traffic Volumes
30 1 2 Lk Wohlfrd Rd 123 / / / / / 9 El Norte Pkwy 346 / / / 93 Oakvale Rd 205 / / 5 12 / 9 3 / 3 5 / 6 80 / / / / 1, / ,179 / / 8 51 / / / 9 19 / / / 51 Vlly Center Rd 5 / / 234 Bear Vlly Pkwy 97 / / 1, / / / / / / 380 Center R d Valle y Lake Wohlford 5,250 Rd 1 [_ PROJECT SITE!!! Oakvale Rd 2 29,790 El Norte Pkwy 3 4 Bear N:\2324\\Figures Date: 12/11/14!# Study Intersections AM / PM AM / PM Intersection Peak Hour Volumes XX,XXX Average Daily Trips [ Figure 8-2 Existing + Cumulative Growth Traffic Volumes
31 1 2 Lk Wohlfrd Rd 146 / / / / / 9 El Norte Pkwy 360 / / / 93 Oakvale Rd 226 / / 5 18 / 15 3 / 3 5 / 6 80 / / / / 1, / ,179 / / 9 51 / / / 9 19 / / / 51 Vlly Center Rd 6 / / 262 Bear Vlly Pkwy 97 / / 1, / / / / / / 389 Center R d Valle y Lake Wohlford 6,103 Rd 1 [_ PROJECT SITE!!! Oakvale Rd 2 30,598 El Norte Pkwy 3 4 Bear N:\2324\\Figures Date: 12/11/14!# Study Intersections AM / PM AM / PM Intersection Peak Hour Volumes XX,XXX Average Daily Trips [ Figure 8-3 Existing + Project + Cumulative Growth Traffic Volumes
32 9.0 ANALYSIS OF NEAR-TERM SCENARIOS The following is a summary of the operational analyses for the various street-system components for the near-term traffic scenarios. 9.1 Existing + Project Intersection Analysis Table 9 1 summarizes the peak hour intersection operations with the addition of Project traffic. Table 9 1 shows that all the study area intersections are calculated to continue to operate at LOS C or better with the addition of Project traffic Segment Operations Table 9 2 summarizes the roadway segment operations with the addition of Project traffic. As seen in Table 9 2, study area segments are calculated to continue to operate at LOS C or better. 9.2 Existing + Cumulative Growth Intersection Analysis Table 9 1 summarizes the peak hour intersection operations with the addition of cumulative growth traffic. Table 9 1 shows that the study area intersections are calculated to operate at LOS C or better Segment Operations Table 9 2 summarizes the roadway segment operations with the addition of cumulative growth traffic. As seen in Table 9 2, all study area segments are calculated to continue to operate at LOS C or better. 9.3 Existing + Project + Cumulative Growth Intersection Analysis Table 9 1 summarizes the peak hour intersection operations for Existing + Cumulative Growth + Project conditions. Table 9 1 shows that all study area intersections are calculated to operate at LOS C or better with the addition of Project traffic Segment Operations Table 9 2 summarizes the roadway segment operations for the Existing + Cumulative Growth + Project conditions. As seen in Table 9 2, all study area segments are calculated to continue to operate at LOS C or better. 25 N:\2324\\Report\2324 Report LW Nov 2014.doc
33 TABLE 9 1 NEAR-TERM INTERSECTION OPERATIONS Intersection Control Type Peak Hour Existing Existing + Project Existing + Cumulative Growth Existing + Cumulative Growth + Project Delay a LOS b Delay LOS Δ c Delay LOS Delay LOS Δ c Significant Impact? 1. Lake Wohlford Rd / Oakvale Rd MSSC d 2. Lake Wohlford Rd / Valley Center Rd Signal 3. Valley Parkway / El Norte Parkway Signal 4. Valley Parkway / Bear Valley Parkway Signal AM 10.4 B 11.0 B B 11.4 B 0.7 No PM 11.5 B 12.2 B B 12.9 B 0.9 No AM 15.5 B 17.6 B C 26.3 C 3.4 No PM 10.7 B 12.3 B B 14.1 B 1.7 No AM 22.8 C 23.1 C C 23.9 C 0.3 No PM 26.6 C 27.8 C C 31.9 C 1.6 No AM 24.9 C 25.1 C C 25.8 C 0.2 No PM 20.3 C 20.4 C C 20.7 C 0.1 No Footnotes: a. Average delay expressed in seconds per vehicle. b. Level of Service. c. Δ denotes an increase in delay due to project. d. Minor Street Stop Controlled intersection. Minor street left turn delay is reported. SIGNALIZED DELAY/LOS THRESHOLDS UNSIGNALIZED DELAY/LOS THRESHOLDS Delay LOS Delay LOS A A 10.1 to 20.0 B 10.1 to 15.0 B 20.1 to 35.0 C 15.1 to 25.0 C 35.1 to 55.0 D 25.1 to 35.0 D 55.1 to 80.0 E 35.1 to 50.0 E 80.1 F 50.1 F 26 N:\2324\\Report\2324 Report LW Nov 2014.doc
34 Street Segment Capacity (LOS E) a Existing TABLE 9 2 NEAR-TERM STREET SEGMENT OPERATIONS Existing + Project Existing + Cumulative Projects Existing + Cumulative Projects + Project Sig Impact? ADT b LOS c V/C d ADT LOS V/C Δ e ADT LOS V/C ADT LOS V/C Δ e Lake Wohlford Road Valley Center Rd to Oakvale Rd 9,700 f 4,680 A ,533 B ,250 B ,103 B No Valley Parkway El Norte Pkwy to Lake Wohlford Rd Footnotes: a. Capacities based on the City of Escondido Roadway Classification (See Appendix C). b. Average Daily Traffic c. Level of Service d. Volume to Capacity ratio e. Δ denotes a Project-induced increase in the Volume to Capacity (V/C) ratio. f. County of San Diego Light Collector w/reduced Shoulder (2.2F) capacity used. 43,500 29,700 C ,508 C ,790 C ,598 C No 27 N:\2324\\Report\2324 Report LW Nov 2014.doc
35 10.0 SIGNIFICANCE OF IMPACTS AND MITIGATION MEASURES 10.1 Significance of Impacts The traffic impacts of the proposed 898-ADT Project do not exceed the significance thresholds published by the City of Escondido. No significant impacts are calculated Mitigation Measures The Project does not result in any significant impacts according to City of Escondido criteria. No mitigation measures are required. End of Report 28 N:\2324\\Report\2324 Report LW Nov 2014.doc
36
TRAFFIC IMPACT ANALYSIS 661 BEAR VALLEY. Escondido, California September 1, LLG Ref
 TRAFFIC IMPACT ANALYSIS 661 BEAR VALLEY Escondido, California September 1, 2015 LLG Ref. 3-13-2299 EXECUTIVE SUMMARY The Project (Project) proposes the development of 55 residential dwelling units on 40.88
TRAFFIC IMPACT ANALYSIS WESTMINSTER SEMINARY. Escondido, California June 25, LLG Ref Transportation Engineer II
 TRAFFIC IMPACT ANALYSIS WESTMINSTER SEMINARY Escondido, California June 25, 2015 LLG Ref. 3-15-2420 Prepared by: Pedram Massoudi Transportation Engineer II Under the Supervision of: John Boarman, P.E.
APPENDICES. Appendix R Traffic Impact Analysis (January 2017)
") APPENDICES Appendix R Traffic Impact Analysis (January 2017) 661 Bear Valley Parkway EIR March 2017 APPENDICES This page intentionally left blank 661 Bear Valley Parkway EIR March 2017 TRAFFIC IMPACT ANALYSIS
APPENDICES Appendix R Traffic Impact Analysis (January 2017) 661 Bear Valley Parkway EIR March 2017 APPENDICES This page intentionally left blank 661 Bear Valley Parkway EIR March 2017 TRAFFIC IMPACT ANALYSIS
MADERAS HOTEL TRANSPORTATION IMPACT ANALYSIS. LLG Ref Transportation Planner III & Jorge Cuyuch Transportation Engineer I
 TRANSPORTATION IMPACT ANALYSIS MADERAS HOTEL Poway, California June 21, 2016 LLG Ref. 3-16-2602 Prepared by: Amelia Giacalone Transportation Planner III & Jorge Cuyuch Transportation Engineer I Under the
TRAFFIC IMPACT ANALYSIS SAFARI HIGHLANDS RANCH
 TRAFFIC IMPACT ANALYSIS SAFARI HIGHLANDS RANCH, California November 11, 2016 LLG Ref. 3-14-2334 EXECUTIVE SUMMARY The Project proposes the development of 550 luxury residential dwelling units, public trails,
Escondido Marriott Hotel and Mixed-Use Condominium Project TRAFFIC IMPACT ANALYSIS REPORT
 Escondido Marriott Hotel and Mixed-Use Condominium Project TRAFFIC IMPACT ANALYSIS REPORT Prepared for Phelps Program Management 420 Sixth Avenue, Greeley, CO 80632 Prepared by 5050 Avenida Encinas, Suite
LOTUS RANCH TRAFFIC IMPACT ANALYSIS. LLG Ref Senior Transportation Engineer & Charlene Sadiarin Transportation Engineer II
 TRAFFIC IMPACT ANALYSIS LOTUS RANCH El Centro, California April 26, 2016 LLG Ref. 3-14-2392 Prepared by: KC Yellapu, P.E Senior Transportation Engineer & Charlene Sadiarin Transportation Engineer II Under
Table Existing Traffic Conditions for Arterial Segments along Construction Access Route. Daily
 5.8 TRAFFIC, ACCESS, AND CIRCULATION This section describes existing traffic conditions in the project area; summarizes applicable regulations; and analyzes the potential traffic, access, and circulation
LOTUS RANCH TRAFFIC IMPACT ANALYSIS. LLG Ref Senior Transportation Engineer & Charlene Sadiarin Transportation Engineer II
 TRAFFIC IMPACT ANALYSIS LOTUS RANCH El Centro, California July 31, 2015February 12, 2016 LLG Ref. 3-14-2392 Prepared by: KC Yellapu, P.E Senior Transportation Engineer & Charlene Sadiarin Transportation
APPENDIX D- TRAFFIC STUDY
 APPENDIX D- TRAFFIC STUDY TRANSPORTATION IMPACT ANALYSIS IMPERIAL COUNTY OFFICE OF EDUCATION County of Imperial, California March 06, 2018 LLG Ref. 3-17-2831 Prepared by: Jose R. Nunez Transportation Planner
NOB HILL IMPROVEMENTS PROJECT
 CONSTRUCTION TRAFFIC ANALYSIS NOB HILL IMPROVEMENTS PROJECT San Diego, California February 18, 2014 LLG Ref. 3-13-2204 TABLE OF CONTENTS SECTION PAGE 1.0 Introduction... 1 2.0 Project Description... 2
APPENDIX B Traffic Analysis
 APPENDIX B Traffic Analysis Rim of the World Unified School District Reconfiguration Prepared for: Rim of the World School District 27315 North Bay Road, Blue Jay, CA 92317 Prepared by: 400 Oceangate,
Date: February 7, 2017 John Doyle, Z-Best Products Robert Del Rio. T.E. Z-Best Traffic Operations and Site Access Analysis
 Memorandum Date: February 7, 07 To: From: Subject: John Doyle, Z-Best Products Robert Del Rio. T.E. Z-Best Traffic Operations and Site Access Analysis Introduction Hexagon Transportation Consultants, Inc.
Traffic Impact Analysis 5742 BEACH BOULEVARD MIXED USE PROJECT
 Traffic Impact Analysis 5742 BEACH BOULEVARD MIXED USE PROJECT CITY OF BUENA PARK Prepared by Project No. 14139 000 April 17 th, 2015 DKS Associates Jeffrey Heald, P.E. Rohit Itadkar, T.E. 2677 North Main
LAWRENCE TRANSIT CENTER LOCATION ANALYSIS 9 TH STREET & ROCKLEDGE ROAD / 21 ST STREET & IOWA STREET LAWRENCE, KANSAS
 LAWRENCE TRANSIT CENTER LOCATION ANALYSIS 9 TH STREET & ROCKLEDGE ROAD / 21 ST STREET & IOWA STREET LAWRENCE, KANSAS TRAFFIC IMPACT STUDY FEBRUARY 214 OA Project No. 213-542 TABLE OF CONTENTS 1. INTRODUCTION...
The major roadways in the study area are State Route 166 and State Route 33, which are shown on Figure 1-1 and described below:
 3.5 TRAFFIC AND CIRCULATION 3.5.1 Existing Conditions 3.5.1.1 Street Network DRAFT ENVIRONMENTAL IMPACT REPORT The major roadways in the study area are State Route 166 and State Route 33, which are shown
APPENDIX H. Transportation Impact Study
 APPENDIX H Transportation Impact Study BUENA VISTA LAGOON ENHANCEMENT PROJECT TRANSPORTATION IMPACT STUDY Prepared for: San Diego Association of Governments Prepared by: VRPA Technologies, Inc. 9520 Padgett
Appendix C. Traffic Study
 Appendix C Traffic Study TABLE OF CONTENTS SECTION Executive Summary PAGE 1.0 Introduction... 1 1.1 Scope of Work... 1 1.2 Study Area... 2 2.0 Project Description... 3 2.1 Site Access... 4 2.2 Pedestrian
APPENDIX C1 TRAFFIC ANALYSIS DESIGN YEAR TRAFFIC ANALYSIS
 APPENDIX C1 TRAFFIC ANALYSIS DESIGN YEAR TRAFFIC ANALYSIS DESIGN YEAR TRAFFIC ANALYSIS February 2018 Highway & Bridge Project PIN 6754.12 Route 13 Connector Road Chemung County February 2018 Appendix
Alpine Highway to North County Boulevard Connector Study
 Alpine Highway to North County Boulevard Connector Study prepared by Avenue Consultants March 16, 2017 North County Boulevard Connector Study March 16, 2017 Table of Contents 1 Summary of Findings... 1
APPENDIX G Traffic Assessment of EIR Alternatives Traffic Impact Analysis
 APPENDIX G Traffic Assessment of EIR Alternatives Traffic Impact Analysis MEMORANDUM To: From: Subject: Paul Garcia Chris Moore Atkins Date: March 24, 2016 John Boarman LLG Ref: 3-15-2464 Cara Hilgesen
The key roadways in the project vicinity are described below. Exhibit displays the existing number of lanes on the study roadways.
 4.2 TRAFFIC AND CIRCULATION This section presents the key assumptions, methods, and results of analysis for the transportation and circulation impacts of the proposed project. This section is based on
TIMBERVINE TRANSPORTATION IMPACT STUDY FORT COLLINS, COLORADO JANUARY Prepared for:
 TIMBERVINE TRANSPORTATION IMPACT STUDY FORT COLLINS, COLORADO JANUARY 2014 Prepared for: Hartford Companies 1218 W. Ash Street Suite A Windsor, Co 80550 Prepared by: DELICH ASSOCIATES 2272 Glen Haven Drive
Proposed location of Camp Parkway Commerce Center. Vicinity map of Camp Parkway Commerce Center Southampton County, VA
 Proposed location of Camp Parkway Commerce Center Vicinity map of Camp Parkway Commerce Center Southampton County, VA Camp Parkway Commerce Center is a proposed distribution and industrial center to be
INDUSTRIAL DEVELOPMENT
 INDUSTRIAL DEVELOPMENT Traffic Impact Study Plainfield, Illinois August 2018 Prepared for: Seefried Industrial Properties, Inc. TABLE OF CONTENTS Executive Summary 2 Introduction 3 Existing Conditions
Bennett Pit. Traffic Impact Study. J&T Consulting, Inc. Weld County, Colorado. March 3, 2017
 Bennett Pit Traffic Impact Study J&T Consulting, Inc. Weld County, Colorado March 3, 217 Prepared By: Sustainable Traffic Solutions, Inc. http://www.sustainabletrafficsolutions.com/ Joseph L. Henderson,
Appendix H TRAFFIC IMPACT ANALYSIS
 Appendix H TRAFFIC IMPACT ANALYSIS Teichert Boca Quarry Expansion Traffic Impact Analysis Prepared for Teichert Aggregates Prepared by TRANSPORTATION CONSULTANTS, INC. LSC Transportation Consultants, Inc.
EXECUTIVE SUMMARY. The following is an outline of the traffic analysis performed by Hales Engineering for the traffic conditions of this project.
 EXECUTIVE SUMMARY This study addresses the traffic impacts associated with the proposed Shopko redevelopment located in Sugarhouse, Utah. The Shopko redevelopment project is located between 1300 East and
King Soopers #116 Thornton, Colorado
 Traffic Impact Study King Soopers #116 Thornton, Colorado Prepared for: Galloway & Company, Inc. T R A F F I C I M P A C T S T U D Y King Soopers #116 Thornton, Colorado Prepared for Galloway & Company
Clean Harbors Canada, Inc.
 Clean Harbors Canada, Inc. Proposed Lambton Landfill Expansion Environmental Assessment Terms of Reference Transportation Assessment St. Clair Township, Ontario September 2009 itrans Consulting Inc. 260
TRANSPORTATION STUDY FOR THE 8899 BEVERLY BOULEVARD PROJECT
 DRAFT TRANSPORTATION STUDY FOR THE 8899 BEVERLY BOULEVARD PROJECT WEST HOLLYWOOD, CALIFORNIA NOVEMBER 2013 PREPARED FOR BEVERLY BOULEVARD ASSOCIATION PREPARED BY DRAFT TRANSPORTATION STUDY FOR THE 8899
BARRHAVEN FELLOWSHIP CRC 3058 JOCKVALE ROAD OTTAWA, ONTARIO TRANSPORTATION BRIEF. Prepared for:
 BARRHAVEN FELLOWSHIP CRC 3058 JOCKVALE ROAD OTTAWA, ONTARIO TRANSPORTATION BRIEF Prepared for: Barrhaven Fellowship CRC 3058 Jockvale Road Ottawa, ON K2J 2W7 December 7, 2016 116-649 Report_1.doc D. J.
PROJECT: Wilkinson Road Corridor Improvement Traffic Management Planning Project SUBJECT: Traffic Analysis
 TECHNICAL MEMORANDUM DATE: September 10, 2014 PROJECT 5861.03 NO: PROJECT: Wilkinson Road Corridor Improvement Traffic Management Planning Project SUBJECT: Traffic Analysis TO: Steve Holroyd - District
Traffic Impact Analysis West Street Garden Plots Improvements and DuPage River Park Garden Plots Development Naperville, Illinois
 Traffic Impact Analysis West Street Garden Plots Improvements and DuPage River Park Garden Plots Development Naperville, Illinois Submitted by April 9, 2009 Introduction Kenig, Lindgren, O Hara, Aboona,
TRAFFIC IMPACT STUDY DERRY GREEN CORPORATE BUSINESS PARK MILTON SECONDARY PLAN MODIFICATION
 TRAFFIC IMPACT STUDY DERRY GREEN CORPORATE BUSINESS PARK MILTON SECONDARY PLAN MODIFICATION TRAFFIC IMPACT STUDY DERRY GREEN CORPORATE BUSINESS PARK MILTON SECONDARY PLAN MODIFICATION DECEMBER 24 UPDATED
MINERVA PARK SITE TRAFFIC IMPACT STUDY M/I HOMES. September 2, 2015
 5500 New Albany Road Columbus, Ohio 43054 Phone: 614.775.4500 Fax: 614.775.4800 Toll Free: 1-888-775-EMHT emht.com 2015-1008 MINERVA PARK SITE TRAFFIC IMPACT STUDY M/I HOMES September 2, 2015 Engineers
Section 5.0 ENVIRONMENTAL ANALYSIS
 Section 5.0 ENVIRONMENTAL ANALYSIS 5.2 TRANSPORTATION/CIRCULATION/PARKING This section evaluates potential traffic-related and parking impacts associated with the proposed project. The following discussion
2.0 Development Driveways. Movin Out June 2017
 Movin Out June 2017 1.0 Introduction The proposed Movin Out development is a mixed use development in the northeast quadrant of the intersection of West Broadway and Fayette Avenue in the City of Madison.
Appendix Q Traffic Study
 Appendices Appendix Q Traffic Study Crummer Site Subdivision Draft EIR City of Malibu Appendices This page intentionally left blank. The Planning Center April 2013 TRAFFIC IMPACT ANALYSIS Photo z here
Volume 1 Traffic Impact Analysis Turtle Creek Boulevard Dallas, Texas. Kimley-Horn and Associates, Inc. Dallas, Texas.
 Volume 1 Traffic Impact Analysis 2727 Dallas, Texas June 18, 2018 Kimley-Horn and Associates, Inc. Dallas, Texas Project #064523000 Registered Firm F-928 Traffic Impact Analysis 2727 Dallas, Texas Prepared
Section 5.8 Transportation and Traffic
 Section 5.8 Transportation and Traffic 5.8 TRANSPORTATION AND TRAFFIC Generous This Section is based on the Topgolf Specific Plan Traffic Impact Analysis (RK Engineering Group, Inc., October 31, 2016);
L1TILE BEARS DAY CARE TRANSPORTATION IMPACT STUDY FORT COLLINS, COLORADO MAY Prepared for:
 L1TILE BEARS DAY CARE TRANSPORTATION IMPACT STUDY FORT COLLINS, COLORADO MAY 2012 Prepared for: Hillside Construction, Inc. 216 Hemlock Street, Suite B Fort Collins, CO 80534 Prepared by: DELICH ASSOCIATES
Tijuana River Valley Regional Park Campground and Education Center
 Tijuana River Valley Regional Park Campground and Education Center Draft Report September 2018 Prepared for: County of San Diego 5500 Overland Avenue, Suite 410 San Diego, CA 92123 Prepared by: 3900 Fifth
MILLERSVILLE PARK TRAFFIC IMPACT ANALYSIS ANNE ARUNDEL COUNTY, MARYLAND
 MILLERSVILLE PARK TRAFFIC IMPACT ANALYSIS ANNE ARUNDEL COUNTY, MARYLAND Prepared for: Department of Public Works Anne Arundel County Prepared by: URS Corporation 4 North Park Drive, Suite 3 Hunt Valley,
Subarea Study. Manning Avenue (CSAH 15) Corridor Management and Safety Improvement Project. Final Version 1. Washington County.
 Corridor Management and Safety Improvement Project. Final Version 1. Washington County.") Subarea Study Manning Avenue (CSAH 15) Corridor Management and Safety Improvement Project Final Version 1 Washington County June 12, 214 SRF No. 138141 Table of Contents Introduction... 1 Forecast Methodology
Subarea Study Manning Avenue (CSAH 15) Corridor Management and Safety Improvement Project Final Version 1 Washington County June 12, 214 SRF No. 138141 Table of Contents Introduction... 1 Forecast Methodology
TALMONT TOWNHOMES MADISON KENNETH SPA TRAFFIC IMPACT STUDY. Sacramento, CA. Prepared For: MBK Homes. Prepared By:
 TALMONT TOWNHOMES MADISON KENNETH SPA TRAFFIC IMPACT STUDY Sacramento, CA Prepared For: MBK Homes Prepared By: KD Anderson & Associates 3853 Taylor Road, Suite G Loomis, California 95650 (916) 660-1555
Oakbrook Village Plaza City of Laguna Hills
 Oakbrook Village Plaza City of Laguna Hills Traffic Impact Analysis Prepared by: HDR Engineering 3230 El Camino Real, Suite 200 Irvine, CA 92602 October 2012 Revision 3 D-1 Oakbrook Village Plaza Laguna
IV. ENVIRONMENTAL IMPACT ANALYSIS B. TRAFFIC AND CIRCULATION
 IV. ENVIRONMENTAL IMPACT ANALYSIS B. TRAFFIC AND CIRCULATION 1. INTRODUCTION This section is based on the technical report, Traffic Study for 10131 Constellation Boulevard Residential Project, prepared
Appendix C. Traffic Impact Study
 Appendix C Traffic Impact Study TRAFFIC STUDY FOR THE EAGLE ROCK AGGREGATE TERMINAL Prepared by: FEHR & PEERS 201 Santa Monica Blvd. Suite 500 Santa Monica, CA 90401-2213 T. (310) 458-9916 F. (310) 394-7663
King County Metro. Columbia Street Transit Priority Improvements Alternative Analysis. Downtown Southend Transit Study. May 2014.
 King County Metro Columbia Street Transit Priority Improvements Alternative Analysis Downtown Southend Transit Study May 2014 Parametrix Table of Contents Introduction... 1 Methodology... 1 Study Area...
Transportation & Traffic Engineering
 Transportation & Traffic Engineering 1) Project Description This report presents a summary of findings for a Traffic Impact Analysis (TIA) performed by A+ Engineering, Inc. for the Hill Country Family
Appendix J Traffic Impact Study
 MRI May 2012 Appendix J Traffic Impact Study Level 2 Traffic Assessment Limited Impact Review Appendix J [This page was left blank intentionally.] www.sgm-inc.com Figure 1. Site Driveway and Trail Crossing
Task 5.1: Existing Conditions Review and Analysis
 City of Oceanside Coast Highway Corridor Task 5.1: Existing Conditions Review and Analysis Technical Memorandum August 2014 DOCUMENT CONTROL Client: Project Name: Report Title: City of Oceanside City of
4.7 Construction Surface Transportation
 4.7.1 Introduction The traffic analysis presented in this section addresses the construction traffic impacts specific to the proposed Project. The construction traffic impacts were analyzed for both the
Traffic Impact Analysis. Alliance Cole Avenue Residential Site Dallas, Texas. Kimley-Horn and Associates, Inc. Dallas, Texas.
 Traffic Impact Analysis Alliance Cole Avenue Residential Site Dallas, Texas February 15, 2018 Kimley-Horn and Associates, Inc. Dallas, Texas Project #064524900 Registered Firm F-928 Traffic Impact Analysis
FOCUSED TRAFFIC REPORT VVSD ESCONDIDO. Escondido, California December 18, LLG Ref
 FOCUSED TRAFFIC REPORT VVSD ESCONDIDO Escondido, California December 18, 2014 LLG Ref. 3-14-2404 EXECUTIVE SUMMARY The Veterans Village of San Diego (VVSD) Escondido residential project ( Project ) is
TABLE OF CONTENTS SECTION PAGE. Executive Summary... xii
 TABLE OF CONTENTS SECTION PAGE Executive Summary... xii 1.0 Introduction... 1 1.1 Study Area... 2 1.2 Traffic Impact Analysis Scenarios... 4 1.3 Study Area - City of Orange... 4 2.0 Project Description
TRAFFIC IMPACT ANALYSIS
 TRAFFIC IMPACT ANALYSIS Emerald Isle Commercial Development Prepared by SEPI Engineering & Construction Prepared for Ark Consulting Group, PLLC March 2016 I. Executive Summary A. Site Location The Emerald
DRAFT ADDITIONAL ANALYSIS TO THE SDSU 2007 CAMPUS MASTER PLAN REVISION FINAL EIR
 DRAFT ADDITIONAL ANALYSIS TO THE SDSU 2007 CAMPUS MASTER PLAN REVISION FINAL EIR State Clearinghouse No. 2007021020 Prepared for: The Board of Trustees of The California State University 401 Golden Shore
5.9 TRANSPORTATION AND TRAFFIC
 5.9 TRANSPORTATION AND TRAFFIC This section evaluates transportation- and traffic-related impacts that have the potential to result from the construction and operation of the Project. Information and analysis
TRAFFIC PARKING ANALYSIS
 TRAFFIC PARKING ANALYSIS NAPA FLEA MARKET COUNTY OF NAPA Prepared for: Tom Harding Napa-Vallejo Flea Market 33 Kelly Road American Canyon, CA 9453 Prepared by: 166 Olympic Boulevard, Suite 21 Walnut Creek,
BERKELEY DOWNTOWN AREA PLAN PROGRAM ENVIRONMENTAL IMPACT REPORT TRAFFIC IMPACT ANALYSIS
 BERKELEY DOWNTOWN AREA PLAN PROGRAM ENVIRONMENTAL IMPACT REPORT TRAFFIC IMPACT ANALYSIS Prepared for: City of Berkeley Prepared by: REVISED JANUARY 9, 2009 Berkeley Downtown Area Plan Program EIR Traffic
TRAFFIC IMPACT STUDY FOR SONIC DRIVE-IN RESTAURANT. Vallejo, CA. Prepared For:
 TRAFFIC IMPACT STUDY FOR SONIC DRIVE-IN RESTAURANT Vallejo, CA Prepared For: ELITE DRIVE-INS, INC. 2190 Meridian Park Blvd, Suite G Concord, CA 94520 Prepared By: KD Anderson & Associates 3853 Taylor Road,
ENVIRONMENTAL IMPACT ANALYSIS D. TRANSPORTATION AND CIRCULATION 1. INTRODUCTION
 IV. ENVIRONMENTAL IMPACT ANALYSIS 1. INTRODUCTION This section is based on a traffic and parking impact study that was prepared for the proposed CSMC West Tower Project by Linscott, Law & Greenspan, Engineers,
APPENDICES. No Cumulative Impact Project Alternative Traffic Analysis Memorandum (May 2016)
") APPENDICES Appendix T No Cumulative Impact Project Alternative Traffic Analysis Memorandum (May 2016) 661 Bear Valley Parkway EIR March 2017 APPENDICES This page intentionally left blank 661 Bear Valley
APPENDICES Appendix T No Cumulative Impact Project Alternative Traffic Analysis Memorandum (May 2016) 661 Bear Valley Parkway EIR March 2017 APPENDICES This page intentionally left blank 661 Bear Valley
NEWCASTLE MIDDLE SCHOOL Traffic Impact Analysis
 Gibson Traffic Consultants 2802 Wetmore Avenue Suite 220 Everett, WA 98201 425.339.8266 NEWCASTLE MIDDLE SCHOOL Traffic Impact Analysis Prepared for: Renton School District Jurisdiction: City of Newcastle
4.14 TRANSPORTATION AND CIRCULATION
 4.14 TRANSPORTATION AND CIRCULATION 4.14.1 Summary Table 4.14-1 summarizes the identified environmental impacts, proposed mitigation measures, and residual impacts of the proposed project with regard to
Proposed Commercial Service at Paine Field Traffic Impact Analysis
 Gibson Traffic Consultants 80 Wetmore Avenue Suite 0 Everett, WA 980.9.86 Prepared for: Federal Aviation Administration July 0 GTC #09-07 TABLE OF CONTENTS. EXECUTIVE SUMMARY.... PROJECT IDENTIFICATION....
Re: Addendum No. 4 Transportation Overview 146 Mountshannon Drive Ottawa, Ontario
 April 18 th, 2017 Mr. Kevin Yemm Vice President, Land Development Richraft Group of Companies 2280 St. Laurent Boulevard, Suite 201 Ottawa, Ontario (Tel: 613.739.7111 / e-mail: keviny@richcraft.com) Re:
Traffic Impact Study Speedway Gas Station Redevelopment
 Traffic Impact Study Speedway Gas Station Redevelopment Warrenville, Illinois Prepared For: Prepared By: April 11, 2018 Table of Contents 1. Introduction... 1 2. Existing Conditions... 4 Site Location...
Appendix G Traffic and Parking Report
 Appendix G Traffic and Parking Report TABLE OF CONTENTS SECTION PAGE Executive Summary... v 1.0 Introduction... 1 1.1 Study Area... 3 2.0 Project Description... 4 2.1 Site Location... 4 2.2 Existing Project
Table of Contents. Traffic Impact Analysis Capital One Building at Schilling Place
 Traffic Impact Analysis Capital One Building at Schilling Place Table of Contents Executive Summary... 1 1. Introduction... 4 2. Project Description... 4 3. Background Information... 4 4. Study Scope...
3.8 TRANSPORTATION, CIRCULATION AND PARKING
 3.8 TRANSPORTATION, CIRCULATION AND PARKING This section provides an overview of traffic, circulation and parking impacts and evaluates the construction and operational impacts associated with the Proposed
Appendix C-5: Proposed Refinements Rail Operations and Maintenance Facility (ROMF) Traffic Impact Analysis. Durham-Orange Light Rail Transit Project
 Traffic Impact Analysis. Durham-Orange Light Rail Transit Project") Appendix C-5: Proposed Refinements Rail Operations and Maintenance Facility (ROMF) Traffic Impact Analysis Durham-Orange Light Rail Transit Project July 25, 218 ROMF Transportation Impact Analysis Version
Appendix C-5: Proposed Refinements Rail Operations and Maintenance Facility (ROMF) Traffic Impact Analysis Durham-Orange Light Rail Transit Project July 25, 218 ROMF Transportation Impact Analysis Version
MEMORANDUM. Project Description. Operational Trip Generation. Construction Trip Generation. Date: August 12, 2014 TG: To: From: Subject:
 MEMORANDUM Date: August 12, 2014 TG: 13329.01 To: From: Subject: Jeremy Krout EPD Solutions Inc. Rafik Albert EPD Solutions Inc. Rawad Hani Transpo Group AP North Lake Solar Project Traffic Scoping The
Traffic Engineering Study
 Traffic Engineering Study Bellaire Boulevard Prepared For: International Management District Technical Services, Inc. Texas Registered Engineering Firm F-3580 November 2009 Executive Summary has been requested
TRAFFIC IMPACT ANALYSIS FOR. McDONALD S RESTAURANT IN CARMICAEL Sacramento County, CA. Prepared For:
 TRAFFIC IMPACT ANALYSIS FOR McDONALD S RESTAURANT IN CARMICAEL Sacramento County, CA Prepared For: McDonald s USA, LLC Pacific Sierra Region 2999 Oak Road, Suite 900 Walnut Creek, CA 94597 Prepared By:
Shirk Road at State Route 198 Interchange Analysis Tulare County, California
 Shirk Road at State Route 198 Interchange Analysis Tulare County, California DRAFT REPORT Prepared By Tulare County Association of Governments (TCAG) April 2013 Table of Contents Introduction:... 3 Project
Quantitative analyses of weekday a.m. and p.m. commuter hour conditions have been conducted for the following five scenarios:
 6.1 TRANSPORTATION AND CIRCULATION 6.1.1 INTRODUCTION This section of the EIR presents the results of TJKM s traffic impact analysis of the proposed Greenbriar Development. The analysis includes consideration
2. Valley Circle Boulevard/Andora Avenue/Baden Avenue and Lassen Street
 IV.J TRANSPORTATION 1. INTRODUCTION This section presents an overview of the existing traffic and circulation system in and surrounding the project site. This section also discusses the potential impacts
4.7 Construction Surface Transportation
 4.7 Construction Surface Transportation 4.7.1 Introduction The traffic analysis presented in this section addresses the construction traffic impacts specific to the proposed Project. The construction traffic
Table of Contents INTRODUCTION... 3 PROJECT STUDY AREA Figure 1 Vicinity Map Study Area... 4 EXISTING CONDITIONS... 5 TRAFFIC OPERATIONS...
 Crosshaven Drive Corridor Study City of Vestavia Hills, Alabama Table of Contents INTRODUCTION... 3 PROJECT STUDY AREA... 3 Figure 1 Vicinity Map Study Area... 4 EXISTING CONDITIONS... 5 TRAFFIC OPERATIONS...
CHAPTER 9: VEHICULAR ACCESS CONTROL Introduction and Goals Administration Standards
 9.00 Introduction and Goals 9.01 Administration 9.02 Standards 9.1 9.00 INTRODUCTION AND GOALS City streets serve two purposes that are often in conflict moving traffic and accessing property. The higher
IV. ENVIRONMENTAL IMPACT ANALYSIS N. TRANSPORTATION AND TRAFFIC
 IV. ENVIRONMENTAL IMPACT ANALYSIS N. TRANSPORTATION AND TRAFFIC The following section summarizes the information provided in the traffic report entitled Traffic Impact Analysis for a Proposed Residential
APPENDIX A LEVEL OF SERVICE CONCEPTS, ANALYSIS METHODOLOGIES,STANDARDS OF SIGNIFICANCE
 APPENDIX A LEVEL OF SERVICE CONCEPTS, ANALYSIS METHODOLOGIES,STANDARDS OF SIGNIFICANCE Roadway Segment Level of Service Definitions LOS V/C Congestion/Delay Traffic Description (Used for surface streets,
MONTEREY BAY AQUARIUM RESEARCH INSTITUTE (MBARI) MASTER PLAN UPDATE MOSS LANDING, CALIFORNIA
 MASTER PLAN UPDATE MOSS LANDING, CALIFORNIA") MONTEREY BAY AQUARIUM RESEARCH INSTITUTE (MBARI) MASTER PLAN UPDATE MOSS LANDING, CALIFORNIA TRAFFIC IMPACT ANALYSIS Administrative Draft Report Prepared For Monterey Bay Aquarium Research Institute Moss
MONTEREY BAY AQUARIUM RESEARCH INSTITUTE (MBARI) MASTER PLAN UPDATE MOSS LANDING, CALIFORNIA TRAFFIC IMPACT ANALYSIS Administrative Draft Report Prepared For Monterey Bay Aquarium Research Institute Moss
West Hills Shopping Centre Lowe s Expansion Traffic Impact Study
 West Hills Shopping Centre Lowe s Expansion Traffic Impact Study Prepared for: Armel Corporation January 2015 Paradigm Transportation Solutions Ltd. 22 King Street South, Suite 300 Waterloo ON N2J 1N8
Los Angeles Mission College Facilities Master Plan Draft Program Environmental Impact Report 3.13 TRANSPORTATION / TRAFFIC
 3.13 TRANSPORTATION / TRAFFIC As a result of the analysis undertaken in the Initial Study for the Los Angeles Mission College Facilities Master Plan, the (LACCD) determined that the proposed project may
Traffic Impact Analysis Update
 Willow Bend Traffic Impact Analysis Update TABLE OF CONTENTS Page I. INTRODUCTION -------------------------------------------------------------------------------------------- 1 II. EXISTING CONDITIONS
RTE. 1 at RTE. 637 & RTE. 639
 INTERSECTION SAFETY STUDY Prepared for: Virginia Department of Transportation Central Region Operations Traffic Engineering (UPC #81378, TO 12-092) DAVENPORT Project Number: 13-368 / /2014 RTE. 1 at RTE.
Section 5.0 Traffic Information
 Section 5.0 Traffic Information 10.0 TRANSPORTATION MDM Transportation Consultants, Inc. (MDM) has prepared an evaluation of transportation impacts for the proposed evaluation for the expansion of the
LCPS Valley Service Center
 Traffic Impact Study LCPS Valley Service Center Loudoun County, Virginia November 4, 2015 Prepared For: Loudoun County Public Schools 21000 Education Court Ashburn, VA 20148 Prepared by: 1140 Connecticut
TransNet Dollars Keep San Diego Moving
 TransNet Dollars Keep San Diego Moving In 1987, San Diego region voters approved the TransNet program a half-cent sales tax to fund a variety of important transportation projects throughout the region.
Lacey Gateway Residential Phase 1
 Lacey Gateway Residential Phase Transportation Impact Study April 23, 203 Prepared for: Gateway 850 LLC 5 Lake Bellevue Drive Suite 02 Bellevue, WA 98005 Prepared by: TENW Transportation Engineering West
STAFF REPORT # CHANGE OF ZONING
 STAFF REPORT #17-2000-0007 CHANGE OF ZONING PLANNING COMMISSION MEETING DATE: November 16, 2017 (Applicant Provided Materials / Traffic Study = Blue) 1. APPLICATION: A public hearing for an application
TRAFFIC IMPACT ANALYSIS RIZZO CONFERENCE CENTER EXPANSION FINAL REPORT
 TRAFFIC IMPACT ANALYSIS RIZZO CONFERENCE CENTER EXPANSION Chapel Hill, North Carolina FINAL REPORT Prepared for: The Town of Chapel Hill, NC Prepared by: Architects-Engineers-Planners, Inc. December 2010
VOA Vista Drive Residential housing Development TIA Project #13915 TABLE OF CONTENTS
 VOA Vista Drive Residential housing Development TIA Project #13915 TABLE OF CONTENTS Executive Summary... 2 Project Background... 2 Conditions... 2 Findings... 3 Recommendations... 4 Introduction... 6
ZINFANDEL LANE / SILVERADO TRAIL INTERSECTION TRAFFIC ANALYSIS
 ZINFANDEL LANE / SILVERADO TRAIL INTERSECTION TRAFFIC ANALYSIS UPDATED TRAFFIC STUDY FOR THE PROPOSED RAYMOND VINEYARDS WINERY USE PERMIT MODIFICATION #P11-00156 AUGUST 5, 2014 PREPARED BY: OMNI-MEANS,
TRAFFIC IMPACT STUDY. USD #497 Warehouse and Bus Site
 TRAFFIC IMPACT STUDY for USD #497 Warehouse and Bus Site Prepared by: Jason Hoskinson, PE, PTOE BG Project No. 16-12L July 8, 216 145 Wakarusa Drive Lawrence, Kansas 6649 T: 785.749.4474 F: 785.749.734
RICHMOND OAKS HEALTH CENTRE 6265 PERTH STREET OTTAWA, ONTARIO TRANSPORTATION BRIEF. Prepared for: Guycoki (Eastern) Limited.
 Limited.") RICHMOND OAKS HEALTH CENTRE 6265 PERTH STREET OTTAWA, ONTARIO TRANSPORTATION BRIEF Prepared for: Guycoki (Eastern) Limited June 16, 2016 116-638 Brief_1.doc D. J. Halpenny & Associates Ltd. Consulting
RICHMOND OAKS HEALTH CENTRE 6265 PERTH STREET OTTAWA, ONTARIO TRANSPORTATION BRIEF Prepared for: Guycoki (Eastern) Limited June 16, 2016 116-638 Brief_1.doc D. J. Halpenny & Associates Ltd. Consulting