Table of Contents INTRODUCTION... 3 PROJECT STUDY AREA Figure 1 Vicinity Map Study Area... 4 EXISTING CONDITIONS... 5 TRAFFIC OPERATIONS...
|
|
|
- Noel Preston
- 5 years ago
- Views:
Transcription
1
2 Crosshaven Drive Corridor Study City of Vestavia Hills, Alabama Table of Contents INTRODUCTION... 3 PROJECT STUDY AREA... 3 Figure 1 Vicinity Map Study Area... 4 EXISTING CONDITIONS... 5 TRAFFIC OPERATIONS... 5 Figure 2 Vicinity Map Study Area... 6 CONCEPT PLAN DEVELOPMENT... 8 Figure 3 TOPICS VIII Project... 8 PUBLIC INVOLVEMENT... 9 Figure 4 Phasing Plan Figure 3 TOPICS VIII Project Phase Figure 3 Northern Phase Figure 3 Southern Phase CONCLUSION Appendix A Traffic Operations Study... A Appendix B Cost Estimates... B Appendix C Public Involvement... C 2
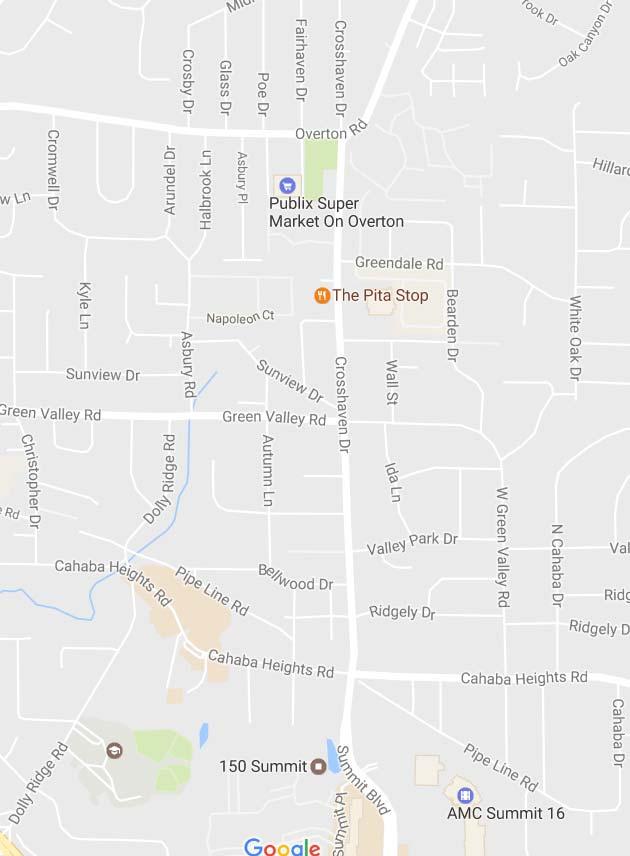
3 Crosshaven Drive Corridor Study City of Vestavia Hills, Alabama INTRODUCTION Neel-Schaffer Inc., in association with Skipper Consulting Inc., was contracted by the Regional Planning Commission of Greater Birmingham (RPCGB) as a part of an Advanced Planning, Programming and Logical Termini (APPLE) study to evaluate and propose recommendations for traffic operational improvements (including continuous turn lane) and pedestrian connectivity for Crosshaven Drive in Vestavia Hills, Alabama. The study limits along Crosshaven Drive extend from Cahaba Heights Road to Overton Road and involved seven (7) intersections, including four (4) signalized and three (3) unsignalized side road intersections. Additionally, the study evaluated potential environmental, right of way and utility impacts. Utilizing Jefferson County GIS Data, a base map was produced along the corridor showing opportunities and constraints that were considered in the study. Sources of information used in the study included: the Institute of Transportation Engineers; Transportation Research Board; Federal Highway Administration; the City of Vestavia Hills; Jefferson County; Regional Planning Commission of Greater Birmingham; and information provided by Skipper Consulting, Inc. PROJECT STUDY AREA The study area focused on a segment along Crosshaven Drive in the City of Vestavia Hills from Cahaba Heights Road to Overton Road. Intersections within the study area included: Crosshaven Drive at Cahaba Heights Road Crosshaven Drive at Ridgely Drive Crosshaven Drive at Valley Park Drive Crosshaven Drive at Green Valley Road Crosshaven Drive at Bearden Court Crosshaven Drive at Greendale Drive Crosshaven Drive at Overton Road A Vicinity Map illustrating the project study area is shown in Figure 1. 3

4 Crosshaven Drive Corridor Study City of Vestavia Hills, Alabama Figure 1 Vicinity Map - Study Area 4
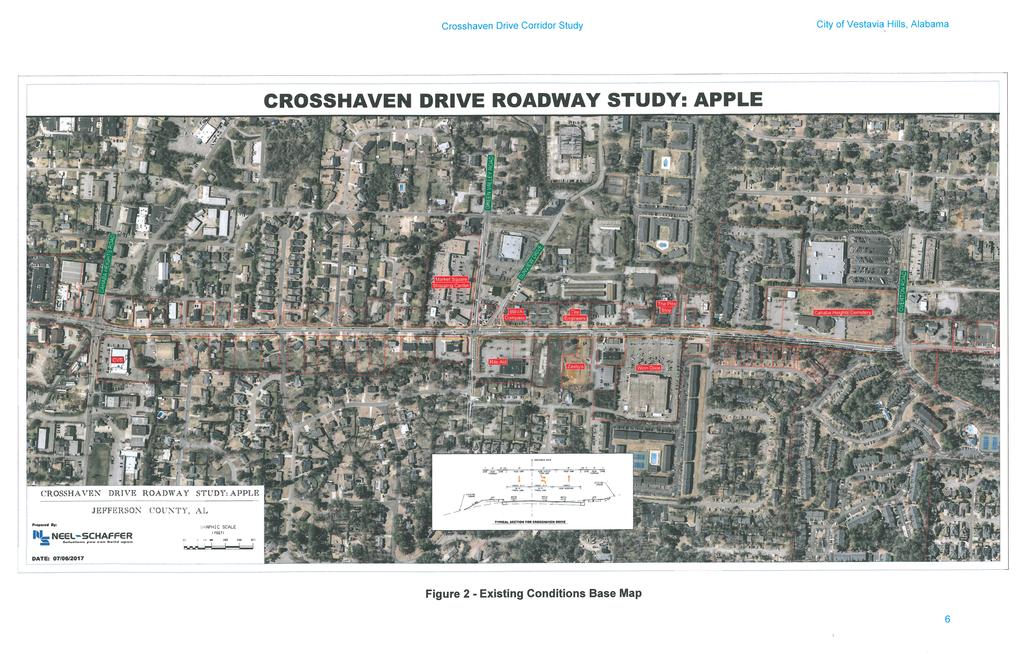
5 Crosshaven Drive Corridor Study City of Vestavia Hills, Alabama EXISTING CONDITIONS Currently Crosshaven Drive, within the study area, is a two-lane roadway that is functionally classified as a minor arterial roadway from Overton Road to Green Valley Road and a collector roadway from Green Valley Road to Cahaba Heights Road. The posted speed limit throughout the corridor is 25 miles per hour. The west side of the corridor is characterized as established residential areas with some commercial development that has occurred in recent years. The east side of the corridor, also once mostly established residential areas, has undergone significant commercial development. With the recent commercial development along the corridor, increased traffic congestion in the peak hours has significantly affected the level of service along the corridor. Base mapping of the study area existing conditions was developed with data provided by the RPCGB and Jefferson County. In addition to aerial mapping, features such as parcel data and utility locations were obtained and merged into the GIS database for the base mapping. Planned commercial developments and roadway improvements were also obtained from the City to display on the mapping. See Figure 2 for base mapping of the existing conditions with parcel data displayed. TRAFFIC OPERATIONS A traffic operations study was performed to determine needed roadway improvements for Crosshaven Drive between Cahaba Heights Road and Overton Road in Vestavia Hills, Alabama. The study was completed by Skipper Consulting Inc., as a subconsultant to Neel-Schaffer, Inc. See Appendix A to view the complete report. The following is a summary of the findings of the traffic operations study (this summary includes excerpts from the traffic operations study report). Detailed traffic analyses were performed for the seven (7) study intersections on Crosshaven Drive. Existing turning movement traffic counts and machine traffic counts were collected. The a.m. and p.m. peak hour counts are shown in Figure 2 of Appendix A. The machine traffic count data is included in included in Table 1 of Appendix A. In addition to the traffic counts, on site observations of the traffic flow during AM, Midday and PM peak periods were conducted. Significant queuing of vehicles during these periods and the locations were noted. Observations were made concerning green times at the signalized intersections to note whether sufficient green time was available to clear the queue of vehicles. As a result of review of the existing traffic counts and the onsite observations at the signalized intersections, the following recommendations were offered for consideration for immediate improvements that could made on Crosshaven Drive (excerpt from traffic study report): Increase the Maximum Green time for Crosshaven Drive at Green Valley Road. Implement a Maximum Green 2 programming at Crosshaven Drive at Cahaba Heights Road to give more time to Crosshaven Drive during midday peak. Sunview Drive should be restricted to right in/right out only movements. 5
6
7 Crosshaven Drive Corridor Study City of Vestavia Hills, Alabama Existing a.m. and p.m. peak hour intersection capacity analyses, 95 th percentile queue calculations, roadway segment capacity analyses and turn lane warrant analysis were also performed. In order to analyze future traffic conditions, historical traffic growth was calculated utilizing past years traffic counts obtained from the RPCGB and the Alabama Department of Transportation (ALDOT). The historical traffic counts and growth analysis is shown in Table 8 of Appendix A. A yearly traffic growth factor of +3.3% was therefore used to analyze future traffic conditions. Existing traffic was projected forward using the +3.3% traffic growth factor to obtain future year 2027 traffic volumes. See Figure 3 in Appendix A for the Future 2027 traffic volume at the study area roadway intersections and along the roadway segments. Future year peak hour intersection capacity analysis, intersection queues, roadway segment capacity analysis, and turn lane warrant analysis were performed. The results of these analyses are shown in Tables 9, 10, 11 and 12 of Appendix A. Based on the results of the analyses, the following recommended improvements for Crosshaven Road were developed (excerpt from traffic study report): Crosshaven Drive entire roadway from Cahaba Heights Road to Overton Road Widen to a continuous three lane cross section Crosshaven Drive at Cahaba Heights Road Construct a right turn lane on Cahaba Heights Road eastbound Construct a right turn lane on Cahaba Heights Road westbound Construct a right turn lane on Crosshaven Drive southbound Crosshaven Drive at Green Valley Road Construct a left turn lane on Green Valley Road eastbound Construct a right turn lane on Green Valley Road eastbound Construct a right turn lane on Crosshaven Drive northbound Construct a left turn lane on Crosshaven Drive southbound Crosshaven Drive at Bearden Court Construct a left turn lane on Crosshaven Drive southbound Install a traffic signal when warranted Crosshaven Drive at Greendale Road Construct a right turn lane on Crosshaven Drive northbound Construct a left turn lane on Crosshaven Drive southbound Crosshaven Drive at Overton Road Construct a right turn lane on Overton Road eastbound 7
8 Crosshaven Drive Corridor Study City of Vestavia Hills, Alabama CONCEPT PLAN DEVELOPMENT Based on the recommendations from the Traffic Operations Study, a concept plan was developed that would serve as a tool for future implementation of the needed improvements along Crosshaven Drive within the study area. Consideration was given to the priority order of implementation of the improvements and fundable construction phasing. Consideration was also given to an ongoing ALDOT project, TOPICS VIII, for improvements at the Crosshaven Drive and Green Valley Road intersection. This intersection is centrally located within the study area and all recommended improvements north or south of the intersection would need to be coordinated with the TOPICS VIII project. CROSSHAVEN DRIVE Figure 3 TOPICS VIII Project 8
9 Crosshaven Drive Corridor Study City of Vestavia Hills, Alabama Based on the traffic operations needs and improvements identified in the traffic operations study, implementation of the TOPICS VIII project at the Crosshaven Drive and Green Valley Road should be the priority as the first phase to be implemented. The TOPICS VIII project is underway and is fully funded. The improvements north of the TOPICS VIII project were identified as a second phase with the improvements to the south being a third phase (See Figure 4 for Phasing Plan). The recommended phasing plan for the improvements are as follows: 1 st Phase: TOPICS VIII Project Phase (See Figure 5) o According to the traffic operations study, the project addresses the largest traffic congestion need, so it is considered the highest priority of the three phases o Ongoing ALDOT Project o Right of way acquisition currently underway o Project has a construction letting date of January 2020 o Estimated cost N/A 2 nd Phase: Northern Phase (See Figure 6) o From Green Valley Road to Overton Road o Next in priority after the TOPICS project Phase according to the traffic operations study o Can be accomplished independently of other phases and with local funds o Estimated cost $2,535,336 (See Appendix B) 3 rd Phase: Southern Phase (See Figure 7) o From Cahaba Heights Road to Green Valley Road o Next in priority after the Northern Phase o Can be accomplished with local funds and independently of other phases o Estimated cost - $2,076,418 (See Appendix B) PUBLIC INVOLVEMENT In order to obtain input from the public on the proposed improvements being developed as a part of this study, a neighborhood meeting was advertised and conducted. The meeting was held in the New Merkle House on November 14, The meeting was well attended by neighborhood residents and comments received in general were positive and in support of the proposed improvements to Crosshaven Drive. The following is a sample of the comments received: As a resident of Cahaba Heights, I want to encourage you to continue with the idea of a sidewalk running the full length of Crosshaven Drive. I enjoy walking my dog in this area and have met many other people who regularly run and walk in the area. I think the sidewalks will add to the community and encourage some of us to walk short distances rather than get into our cars and drive to the businesses on Crosshaven. As far as the Crosshaven Drive Apple Study, it sounds like a good idea. It would however be even better if you could get new businesses along Crosshaven to chip in enough money to support acquiring enough width along Crosshaven to make sidewalks wide enough to accommodate walkers, bikers and golf carts thereby providing improvements to the overall neighborhood experience rather than just being a traffic conduit for the Summit and those coming from Liberty Park to Overton and Crosshaven. See Appendix B for the presentation and information presented at the meeting. 9

10 Crosshaven Drive Corridor Study City of Vestavia Hills, Alabama TOPICS VIII PROJECT PHASE SOUTH PHASE NORTH PHASE EXISTING PAVEMENT (RETAIN) PROPOSED PAVEMENT - NORTH PHASE PROPOSED PAVEMENT - SOUTH PHASE PROPOSED PAVEMENT TOPICS VIII VII PROPOSED SIDEWALK Figure 4 Phasing Plan 10

11 Crosshaven Drive Corridor Study Figure 5 TOPICS VIII Project Phase City of Vestavia Hills, Alabama 11

12 Crosshaven Drive Corridor Study Figure 6 Northern Phase City of Vestavia Hills, Alabama 12

13 Crosshaven Drive Corridor Study Figure 7 Southern Phase City of Vestavia Hills, Alabama 13
14 Crosshaven Drive Corridor Study City of Vestavia Hills, Alabama CONCLUSION The overall objective for the Crosshaven Drive Roadway Study: APPLE Program was to evaluate and propose recommendations for traffic operational improvements and pedestrian connectivity for Crosshaven Drive. Existing physical and operational characteristics of the corridor were assessed. Skipper Consulting, Inc. conducted a Traffic Operations Study to determine roadway improvements for Crosshaven Drive between Cahaba Heights Road and Overton Road in Vestavia Hills, Alabama. The study documented existing conditions analyses and the existing traffic levels of service and congestion throughout the corridor. As a result of the study, recommended improvements were developed and outlined in their report (See Appendix A). These recommended improvements included widening Crosshaven Drive to a continuous three lane cross section. Recommendations for needed right and left turn lanes were also analyzed for all intersections along the corridor. All recommended improvements were placed on base mapping displaying both existing and future known developments. All of the recommended improvements were determined to be feasible to construct with minimal additional right of way required or utility involvement. A concept plan was developed to prioritize fundable phases of construction. The corridor phases were prioritized based on traffic demand. The first priority is to pursue the construction of the TOPICS VIII project. The second phase of construction recommended is the Northern section with the third phase being the Southern section. Input from the public was obtained through a neighborhood meeting conducted at the Merkle House near the project corridor. In general, the comments received were positive and consensus that the recommended improvements are needed. 14
15 APPENDIX A Traffic Operations Study Prepared by: Skipper Consulting Inc.

16 T R A F F I C O P E R A T I O N S S T U D Y Crosshaven Drive Vestavia Hills, Alabama Advance Planning, Programming, and Logical Engineering (APPLE) Program Prepared for: NEEL-SCHAFFER, INC. THE CITY OF VESTAVIA HILLS THE REGIONAL PLANNING COMMISSION OF GREATER BIRMINGHAM Prepared by: AUGUST, 2018
17
18
19
20 Traffic Study Crosshaven Drive APPLE TABLE OF CONTENTS Page Introduction... 1 Study Area... 1 Study Intersections... 1 Background Information... 4 Intersection Turning Movement Traffic Counts... 4 Machine Traffic Counts... 4 Speed Survey... 6 Vehicle Classification... 7 Traffic Control Devices... 7 Observations... 8 Immediate Improvements... 9 Existing Conditions Analysis Existing Peak Hour Intersection Capacity Analysis Existing Peak Hour Queues Existing Peak Hour Roadway Segment Capacity Analysis Existing Daily Roadway Segment Capacity Analysis Existing Turn Lane Warrant Analysis Future Conditions Analysis Historical Traffic Growth Future Peak Hour Traffic Volumes Future Peak Hour Intersection Capacity Analysis Future Peak Hour Intersection Queues Future Peak Hour Roadway Segment Capacity Analysis Future Daily Roadway Segment Capacity Analysis Future Turn Lane Warrant Analysis Recommended Improvements Analysis of Recommended Improvements Future Peak Hour Intersection Capacity Analysis with Improvements Future Peak Hour Intersection Queues with Improvements Future Peak Hour Roadway Segment Capacity Analysis with Improvements Future Daily Roadway Segment Capacity Analysis with Improvements Skipper Consulting, Inc. Page i
21 Traffic Study Crosshaven Drive APPLE APPENDICES Appendix A Appendix B Appendix C Appendix D Appendix E Appendix F Appendix G Appendix H Appendix I Appendix J Appendix K Appendix L Existing Intersection Turning Movement Traffic Counts Existing Machine Traffic Counts Existing Intersection Capacity Analysis Worksheets Existing Queue Calculation Worksheets Existing Roadway Segment Capacity Analysis Worksheets Daily Volume and Level of Service Table Future Intersection Capacity Analysis Worksheets Future Queue Calculation Worksheets Future Roadway Segment Capacity Analysis Worksheets Future Intersection Capacity Analysis Worksheets with Improvements Future Queue Calculation Worksheets with Improvements Future Roadway Segment Capacity Analysis Worksheets with Improvements Skipper Consulting, Inc. Page ii
22 Traffic Study Crosshaven Drive APPLE LIST OF ILLUSTRATIONS Figure Page 1 Project Location Map Existing Traffic Counts Future 2027 Traffic Volumes Table 1 Summary of Machine Counts Summary of Speed Survey Summary of Vehicle Classification Counts Existing Intersection Capacity Analysis Existing Intersection Queue Analysis Existing Peak Hour Roadway Segment Capacity Analysis Existing Daily Roadway Segment Capacity Analysis Historical Traffic Growth Future Intersection Capacity Analysis Future Intersection Queue Analysis Future Peak Hour Roadway Segment Capacity Analysis Future Daily Roadway Segment Capacity Analysis Future Intersection Capacity Analysis with Improvements Future Intersection Queue Analysis with Improvements Future Peak Hour Roadway Segment Capacity Analysis with Improvements Future Daily Roadway Segment Capacity Analysis with Improvements Skipper Consulting, Inc. Page iii
23
 study being performed as a subconsultant to Neel Schaffer, Inc.")
24 Traffic Study Crosshaven Drive APPLE INTRODUCTION This report documents a traffic study to determine roadway improvements for Crosshaven Drive between Cahaba Heights Road and Overton Road in Vestavia Hills, Alabama. This study was performed as a part of an Advance Planning, Programming and Logical Engineering (APPLE) study being performed as a subconsultant to Neel Schaffer, Inc. for the City of Vestavia Hills in conjunction with the Regional Planning Commission of Greater Birmingham. Study Area The study area includes Crosshaven Drive from Cahaba Heights Road to Overton Road. The location of the study area is shown in Figure 1. Within the study area, Crosshaven Drive is a two lane roadway. The posted speed limit on Crosshaven Drive within the study area is 25 miles per hour. Crosshaven Drive is classified as minor arterial roadway from Overton Road to Green Valley Road and a collector roadway from Green Valley Road to Cahaba Heights Road. An excerpt of the roadway classification map is shown below. Study Intersections Detailed traffic analyses were performed for seven (7) study intersections on Crosshaven Drive. The locations of the seven study intersections are shown on Figure 1, and include: Crosshaven Drive at Cahaba Heights Road Crosshaven Drive at Ridgely Drive Crosshaven Drive at Valley Park Drive Skipper Consulting, Inc. Page 1
25
26 Traffic Study Crosshaven Drive APPLE Crosshaven Drive at Green Valley Road Crosshaven Drive at Bearden Court Crosshaven Drive at Greendale Drive Crosshaven Drive at Overton Road Skipper Consulting, Inc. Page 3
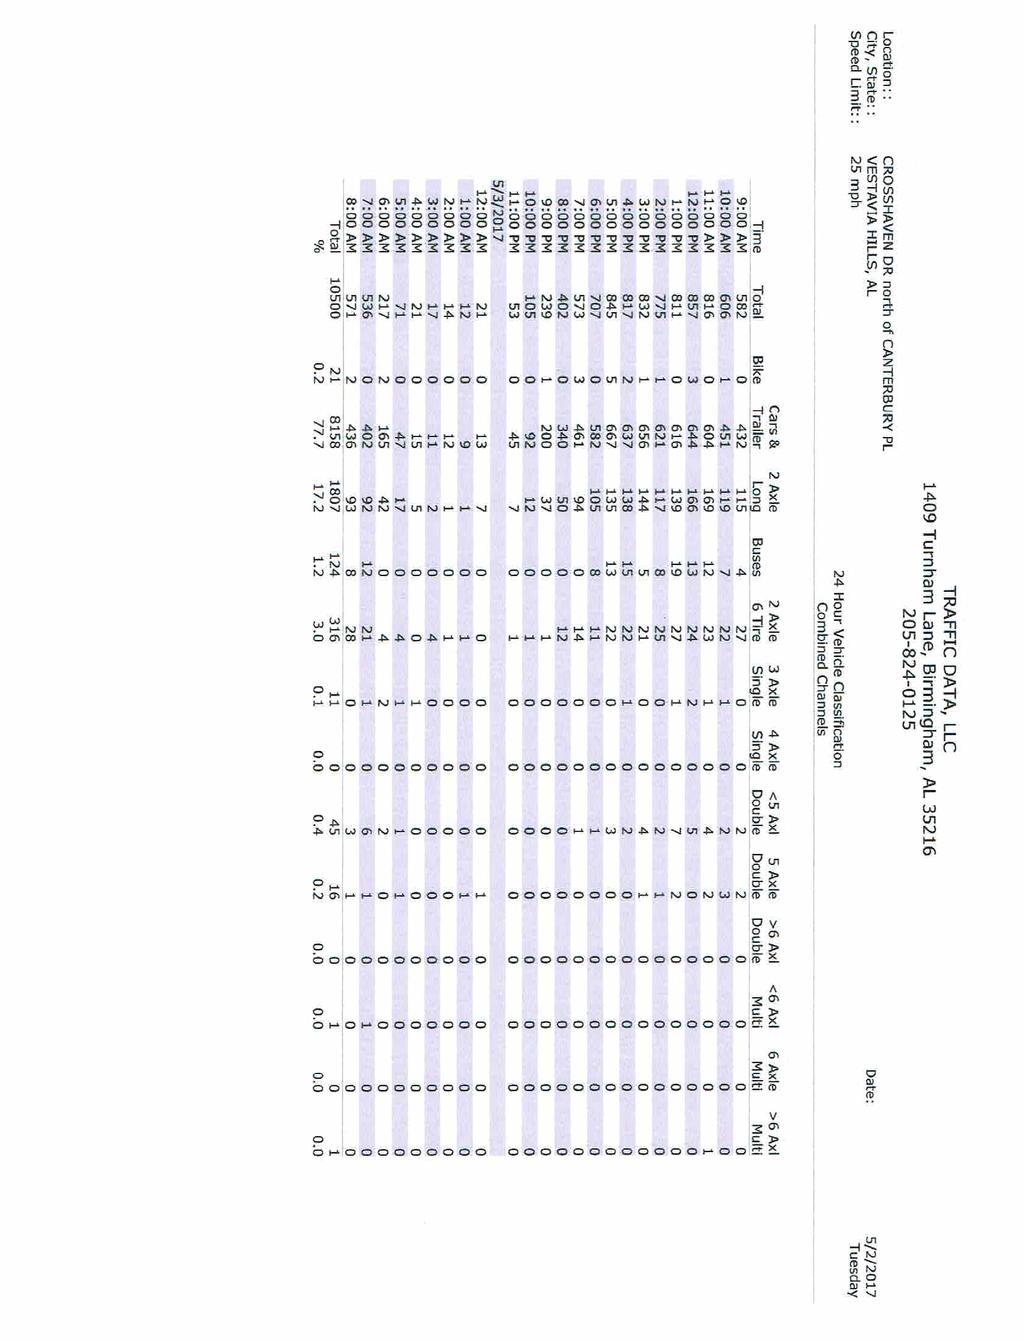
27 Traffic Study Crosshaven Drive APPLE BACKGROUND INFORMATION Intersection Turning Movement Traffic Counts Intersection turning movement traffic counts were performed at the study intersections on Monday to Tuesday, October 3 4, 2016, and Tuesday to Thursday, May 2 4, 2017 by Traffic Data LLC on behalf of Skipper Consulting, Inc. The intersection turning movement traffic count data is included in Appendix A. Using the intersection turning movement traffic count data, the a.m. and p.m. peak hours of traffic flow were determined. The a.m. and p.m. peak hour intersection turning movement traffic counts are shown in Figure 2. Machine Traffic Counts Twenty four (24) hour machine traffic counts were performed at Crosshaven Drive at two locations on Tuesday to Wednesday, May 2 3, 2017 by Traffic Data, LLC on behalf of Skipper Consulting, Inc. The locations of the two machine counts were as follows: Crosshaven Drive north of Crown Ridge Drive Crosshaven Drive north of Canterbury Place The machine traffic count data is included in Appendix B. A summary of the machine traffic count data is included in Table 1. Skipper Consulting, Inc. Page 4
28
29 Traffic Study Crosshaven Drive APPLE Table 1 Summary of Machine Counts Crosshaven Drive North of Crown Ridge Drive Northbound Southbound Daily 5,902 5,344 AM Peak Hour PM Peak Hour North of Canterbury Place Northbound Southbound Daily 5,087 5,413 AM Peak Hour PM Peak Hour Speed Survey The machine traffic counts included speed surveys. The speed data is included in Appendix B and is summarized in Table 2. Table 2 Summary of Speed Survey Crosshaven Drive North of Crown Ridge Drive Average 31 mph 85 th Percentile 35 mph % 3, % 4, % 1, % % % North of Canterbury Place Average 33 mph 85 th Percentile 37 mph % 1, % 4, % 2, % % % Skipper Consulting, Inc. Page 6
30 Traffic Study Crosshaven Drive APPLE Vehicle Classification The machine traffic counts included vehicle classification. The vehicle classification data is included in Appendix B and is summarized in Table 3. Table 3 Summary of Vehicle Classification Counts Crosshaven Drive North of Crown Ridge Drive Motorcycle % Passenger Vehicle 10, % Bus % Light Truck % Heavy Truck % North of Canterbury Place Motorcycle % Passenger Vehicle 9, % Bus % Light Truck % Heavy Truck % Traffic Control Devices The following intersections are controlled by traffic signalization: Crosshaven Drive at Cahaba Heights Road eight phase traffic signal with protected permissive left turns Crosshaven Drive at Green Valley Road two phase traffic signal Crosshaven Drive at Greendale Road two phase traffic signal Crosshaven Drive at Overton Road five phase traffic signal with protected permissive left turn on Overton Road westbound and permissive only left turns on Crosshaven Drive All other intersections are controlled by side street stop signs. Skipper Consulting, Inc. Page 7
31 Traffic Study Crosshaven Drive APPLE Observations Observations of traffic flow on Crosshaven Drive were conducted during the a.m., midday, and p.m. peak periods of traffic flow on Monday, May 8 and Thursday May 11, 2017 by Skipper Consulting, Inc. The following is a summary of observations: AM Peak Period There is a significant queue of vehicles on Cahaba Heights Road westbound at Crosshaven Drive (13 vehicles counted). Vehicles turning left from Crosshaven Drive northbound onto Green Valley Road westbound disrupt traffic flow on Crosshaven Drive northbound. There is a significant queue of vehicles on Crosshaven Drive southbound at Green Valley Road (17 vehicles counted). There is a significant queue of vehicles on Overton Road westbound at Crosshaven Drive (22 vehicles counted). Midday Peak Period Traffic is stop and go on Crosshaven Drive southbound between Greendale Road and Green Valley Road due to queue and turning vehicles. A left turn lane is particularly needed at Bearden Court. There is a significant queue of vehicles on Crosshaven Drive southbound at Green Valley Road (29 vehicles counted). The maximum green time on Crosshaven Drive southbound at Green Valley Road is insufficient to clear the queue of vehicles. There is a significant queue of vehicles on Crosshaven Drive northbound at Green Valley Road (21 vehicles counted). There is significant queue of vehicles on Crosshaven Drive southbound at Cahaba Heights Road (37 vehicles counted). The maximum green time on Crosshaven Drive southbound at Cahaba Heights Road is insufficient to clear the queue of vehicles. Skipper Consulting, Inc. Page 8
32 Traffic Study Crosshaven Drive APPLE Vehicles turning left from Crosshaven Drive southbound onto Green Valley Road eastbound disrupt traffic flow in the entire intersection of Crosshaven Drive at Green Valley Road. Vehicles turning left from Sunview Drive onto Crosshaven Drive northbound disrupt traffic flow in the entire intersection of Crosshaven Drive at Green Valley Road. PM Peak Period There is significant queue of vehicles on Crosshaven Drive southbound at Cahaba Heights Road (41 vehicles counted). Queue backs past Valley Park Drive. Left turns from Crosshaven Drive northbound onto Sunview Drive disrupt northbound and southbound traffic flow on Crosshaven Drive. A left turn lane is needed on Green Valley Road eastbound at Crosshaven Drive. A left turn lane is needed on Crosshaven Drive northbound at Green Valley Road. There is a significant queue of vehicles on Crosshaven Drive northbound at Green Valley Road (17 vehicles counted). There is a significant queue of vehicles on Green Valley Road eastbound at Crosshaven Drive. Immediate Improvements The following recommendations are offered for consideration for immediate improvements to make on Crosshaven Drive: Increase the Maximum Green time for Crosshaven Drive at Green Valley Road. Implement a Maximum Green 2 programming at Crosshaven Drive at Cahaba Heights Road to give more time to Crosshaven Drive during midday peak. Sunview Drive should be restricted to right in/right out only movements. Skipper Consulting, Inc. Page 9
33 Traffic Study Crosshaven Drive APPLE EXISTING CONDITIONS ANALYSIS Existing Peak Hour Intersection Capacity Analysis Existing a.m. and p.m. peak hour intersection capacity analyses were performed for the study intersections using the method of analysis included in the 2010 Highway Capacity Manual, published by the Transportation Research Board. Capacities are expressed as levels of service, and range from a level of service A (highest quality of service) to a level of service F (jammed conditions). As a general rule, operation at a level of service C or better is desirable, with a level of service D considered acceptable during peak hours of traffic flow. The results of the a.m. and p.m. peak hour intersection capacity analyses are included in Appendix C and are summarized in Table 4. Existing Peak Hour Intersection Queues Existing a.m. and p.m. peak hour 95 th percentile queue calculations were performed for the study intersections. The results of the queue calculations are included in Appendix D and are summarized in Table 5. Existing Peak Hour Roadway Segment Capacity Analysis Existing a.m. and p.m. peak hour roadway segment capacity analyses were performed for the two study roadway segments using the method of analysis included in the 2010 Highway Capacity Manual, published by the Transportation Research Board. The results of the peak hour segment capacity analyses are included in Appendix E and are summarized in Table 6. Skipper Consulting, Inc. Page 10
34 Traffic Study Crosshaven Drive APPLE Table 4 Existing Intersection Capacity Analysis Level of Service Intersection Approach Movement AM Peak PM Peak Left B C Cahaba Heights Road Through Right B C Eastbound Overall approach B C Left B C Cahaba Heights Road Through Right D C Westbound Overall approach D C Crosshaven Drive at Cahaba Heights Road Crosshaven Drive at Ridgely Drive Crosshaven Drive at Valley Park Drive/ Canterbury Place Crosshaven Drive at Green Valley Road/Sunview Drive Summit Parkway Northbound Crosshaven Drive Southbound Ridgely Drive Eastbound Ridgely Drive Westbound Crosshaven Drive Northbound Crosshaven Drive Southbound Canterbury Place Eastbound Valley Park Drive Westbound Crosshaven Drive Northbound Crosshaven Drive Southbound Green Valley Road Eastbound Green Valley Road Westbound Crosshaven Drive Northbound Crosshaven Drive Southbound Sunview Drive Southeastbound Left C C Through Right C C Overall approach C C Left C C Through Right D C Overall approach C C Overall intersection C C Left Through Right B B Left Through Right C C Left Through Right A A Left Through Right A A Left Through Right B B Left Through Right C C Left Through Right A A Left Through Right A A Left Through Right A C Left Through Right C A Left Through Right B B Left Through Right B B Left Through Right A A Overall intersection B B Skipper Consulting, Inc. Page 11
35 Traffic Study Crosshaven Drive APPLE Table 4 (Continued) Existing Intersection Capacity Analysis Intersection Approach Movement Crosshaven Drive at Bearden Court Crosshaven Drive at Greendale Drive Crosshaven Drive at Overton Road Office Access Eastbound Bearden Court Westbound Crosshaven Drive Northbound Crosshaven Drive Southbound Greendale Road Westbound Crosshaven Drive Northbound Crosshaven Drive Southbound Overton Road Eastbound Overton Road Westbound Crosshaven Drive Northbound Crosshaven Drive Southbound Level of Service AM Peak PM Peak Left Through Right A E Left Through Right C E Left Through Right A A Left Through Right A A Left Right B C Through Right A A Left Through A A Overall intersection A A Left B B Through Right C C Overall approach C C Left B B Through Right B A Overall approach B B Left Through C C Right B C Overall approach C C Left Through Right B C Overall intersection B B Skipper Consulting, Inc. Page 12
36 Traffic Study Crosshaven Drive APPLE Table 5 Existing Intersection Queue Analysis Intersection Approach Movement 95 th Percentile Queue AM Peak PM Peak Cahaba Heights Road Left Eastbound Through Right Cahaba Heights Road Left Crosshaven Drive at Westbound Through Right Cahaba Heights Road Summit Parkway Left Northbound Through Right Crosshaven Drive Left Southbound Through Right Ridgely Drive Eastbound Left Through Right 2 5 Ridgely Drive Crosshaven Drive at Westbound Left Through Right 8 2 Ridgely Drive Crosshaven Drive Northbound Left Through Right 0 0 Crosshaven Drive Southbound Left Through Right 1 0 Canterbury Place Eastbound Left Through Right 1 2 Valley Park Drive Crosshaven Drive at Left Through Right 5 2 Westbound Valley Park Drive/ Crosshaven Drive Canterbury Place Left Through Right 0 0 Northbound Crosshaven Drive Southbound Left Through Right 0 0 Green Valley Road Eastbound Left Through Right Green Valley Road Left Through Right Westbound Crosshaven Drive at Crosshaven Drive Green Valley Left Through Right Northbound Road/Sunview Drive Crosshaven Drive Left Through Right Southbound Sunview Drive Southeastbound Left Through Right 7 14 Skipper Consulting, Inc. Page 13
37 Traffic Study Crosshaven Drive APPLE Table 5 (Continued) Existing Intersection Queue Analysis Intersection Approach Movement Crosshaven Drive at Bearden Court Crosshaven Drive at Greendale Drive Crosshaven Drive at Overton Road Office Access Eastbound Bearden Court Westbound Crosshaven Drive Northbound Crosshaven Drive Southbound Greendale Road Westbound Crosshaven Drive Northbound Crosshaven Drive Southbound Overton Road Eastbound Overton Road Westbound Crosshaven Drive Northbound Crosshaven Drive Southbound 95 th Percentile Queue AM Peak PM Peak Left Through Right 0 3 Left Through Right Left Through Right 0 0 Left Through Right 0 3 Left Right Through Right Left Through Left 9 6 Through Right Left Through Right Left Through Right Left Through Right Table 6 Existing Peak Hour Roadway Segment Capacity Analysis Crosshaven Drive Segment Cahaba Heights Rd to Green Valley Rd Green Valley Rd to Overton Rd AM Peak Traffic Volumes Opposing Direction Analysis Direction Level of Service v/c Ratio PM Peak Traffic Volumes Opposing Direction Analysis Direction Level of Service v/c Ratio 450 vph 366 vph C vph 399 vph C vph 352 vph C vph 494 vph D 0.53 Skipper Consulting, Inc. Page 14
38 Traffic Study Crosshaven Drive APPLE Existing Daily Roadway Segment Capacity Analysis Existing daily roadway segment capacity analyses were performed for the two study roadway segments using the capacity chart prepared by the Alabama Department of Transportation with level of service thresholds assigned according to the 2010 Highway Capacity Manual. The level of service chart is included in Appendix F. The results of the analysis are shown in Table 7. All segments of Crosshaven Drive currently operate at a level of service C or D. The corridor can sustain the following traffic increases before the level of service will decline to a level of service E : North segment +2,100 vehicles per day South segment +1,950 vehicles per day Table 7 Existing Daily Roadway Segment Capacity Analysis Crosshaven Drive Segment Classification Cross Section Daily Volume Capacity Cahaba Heights Road to Green Valley Road Green Valley Road to Overton Road Collector Minor Arterial 2 Lane Undivided 2 Lane Undivided v/c Ratio Level of Service 10,500 vpd 16,600 vpd 0.63 D 11,246 vpd 17,800 vpd 0.63 C Existing Turn Lane Warrant Analysis Existing a.m. and p.m. peak hour turn lane warrant analyses were performed for each turning movement at each study intersection where there is not an existing turn lane provided. The methods of analysis used for the turn lane warrants were as follows: For unsignalized intersections and for right turns, the method of analysis presented in the National Cooperative Highway Research Program Report 279, Intersection Channelization Design Guide, was used. Skipper Consulting, Inc. Page 15
39 Traffic Study Crosshaven Drive APPLE For left turns at signalized intersections, the method of analysis presented in the Virginia Transportation Research Council Final Report Development of Left Turn Lane Guidelines for Signalized and Unsignalized Intersections was used. The results of the turn lane warrant analyses are presented as follows: Crosshaven Drive at Cahaba Heights Road Construct a right turn lane on Cahaba Heights Road eastbound Construct a right turn lane on Cahaba Heights Road westbound Construct a right turn lane on Crosshaven Drive southbound Crosshaven Drive at Green Valley Road Construct a left turn lane on Green Valley Road eastbound Construct a right turn lane on Green Valley Road eastbound Construct a right turn lane on Crosshaven Drive northbound Construct a left turn lane on Crosshaven Drive southbound Crosshaven Drive at Bearden Court Construct a left turn lane on Crosshaven Drive southbound Crosshaven Drive at Greendale Road Construct a right turn lane on Crosshaven Drive northbound Construct a left turn lane on Crosshaven Drive southbound Crosshaven Drive at Overton Road Construct a right turn lane on Overton Road eastbound Skipper Consulting, Inc. Page 16
40 Traffic Study Crosshaven Drive APPLE Crosshaven Drive segment from Cahaba Heights Road to Green Valley Road A center turn lane is warranted at any driveway or public roadway where the hourly left turn traffic flow exceeds 32 vehicles per hour. This indicates that a continuous center turn lane is not necessarily warranted while the development along the segment of roadway remains primarily residential. As the land along this roadway segment converts to commercial, the need for a center turn lane will become evident. Crosshaven Drive segment from Green Valley Road to Overton Road A center turn lane is warranted at any driveway or public roadway where the hourly left turn traffic flow exceeds 19 vehicles per hour. This indicates that a continuous center turn lane is warranted due to the predominance of commercial land uses in this segment of Crosshaven Drive. Skipper Consulting, Inc. Page 17
41 Traffic Study Crosshaven Drive APPLE FUTURE CONDITIONS ANALYSIS Historical Traffic Growth Historical traffic growth on Crosshaven Drive was calculated based on traffic counts obtained from the Regional Planning Commission of Greater Birmingham and the Alabama Department of Transportation. The historical traffic counts and growth analysis is shown in Table 8. For the purposes of this study, a yearly traffic growth rate of +3.3% per year was used. Table 8 Historical Traffic Growth Crosshaven Drive Year Cahaba Heights Rd to Green Valley Rd Green Valley Rd to Overton Rd Count Growth Count Growth % % % % % % % % % % % % % % Average 4.3% 2.4% Future Peak Hour Traffic Volumes Traffic on the study area roadway intersections and roadway segments was projected forward to the year 2027 using the +3.3% per year historical traffic growth rate. The future a.m. and p.m. peak hour traffic volumes are shown in Figure 3. Skipper Consulting, Inc. Page 18
42
43 Traffic Study Crosshaven Drive APPLE Future Peak Hour Intersection Capacity Analysis Future a.m. and p.m. peak hour intersection capacity analyses were performed for the study intersections using the method of analysis included in the 2010 Highway Capacity Manual, published by the Transportation Research Board. The results of the a.m. and p.m. peak hour intersection capacity analyses are included in Appendix G and are summarized in Table 9. Future Peak Hour Intersection Queues Future a.m. and p.m. peak hour 95 th percentile queue calculations were performed for the study intersections. The results of the queue calculations are included in Appendix H and are summarized in Table 10. Future Peak Hour Roadway Segment Capacity Analysis Future a.m. and p.m. peak hour roadway segment capacity analyses were performed for the two study roadway segments using the method of analysis included in the 2010 Highway Capacity Manual, published by the Transportation Research Board. The results of the peak hour segment capacity analyses are included in Appendix I and are summarized in Table 11. Future Daily Roadway Segment Capacity Analysis Future daily roadway segment capacity analyses were performed for the two study roadway segments using the capacity chart prepared by the Alabama Department of Transportation with level of service thresholds assigned according to the 2010 Highway Capacity Manual. The level of service chart is included in Appendix F. The results of the analysis are shown in Table 12. Future Turn Lane Warrant Analysis No additional turn lanes are warranted based on future traffic volumes beyond those turn lanes warranted for existing traffic volumes. Skipper Consulting, Inc. Page 20
44 Traffic Study Crosshaven Drive APPLE Table 9 Future Intersection Capacity Analysis Level of Service Intersection Approach Movement AM Peak PM Peak Left C F Cahaba Heights Road Through Right C E Eastbound Overall approach C E Left B F Cahaba Heights Road Through Right F D Westbound Overall approach F E Crosshaven Drive at Cahaba Heights Road Crosshaven Drive at Ridgely Drive Crosshaven Drive at Valley Park Drive/ Canterbury Place Crosshaven Drive at Green Valley Road/Sunview Drive Summit Parkway Northbound Crosshaven Drive Southbound Ridgely Drive Eastbound Ridgely Drive Westbound Crosshaven Drive Northbound Crosshaven Drive Southbound Canterbury Place Eastbound Valley Park Drive Westbound Crosshaven Drive Northbound Crosshaven Drive Southbound Green Valley Road Eastbound Green Valley Road Westbound Crosshaven Drive Northbound Crosshaven Drive Southbound Sunview Drive Southeastbound Left F F Through Right C F Overall approach F F Left C F Through Right E F Overall approach D F Overall intersection F F Left Through Right C C Left Through Right D E Left Through Right A A Left Through Right A A Left Through Right C C Left Through Right C D Left Through Right A A Left Through Right A A Left Through Right C F Left Through Right F A Left Through Right E F Left Through Right E D Left Through Right A A Overall intersection E E Skipper Consulting, Inc. Page 21
45 Traffic Study Crosshaven Drive APPLE Table 9 (Continued) Future Intersection Capacity Analysis Intersection Approach Movement Crosshaven Drive at Bearden Court Crosshaven Drive at Greendale Drive Crosshaven Drive at Overton Road Office Access Eastbound Bearden Court Westbound Crosshaven Drive Northbound Crosshaven Drive Southbound Greendale Road Westbound Crosshaven Drive Northbound Crosshaven Drive Southbound Overton Road Eastbound Overton Road Westbound Crosshaven Drive Northbound Crosshaven Drive Southbound Level of Service AM Peak PM Peak Left Through Right A F Left Through Right D F Left Through Right A A Left Through Right A A Left Right B C Through Right A A Left Through A A Overall intersection A A Left B B Through Right D E Overall approach D E Left E F Through Right D A Overall approach D D Left Through D D Right B D Overall approach D D Left Through Right B C Overall intersection D D Skipper Consulting, Inc. Page 22
46 Traffic Study Crosshaven Drive APPLE Table 10 Future Intersection Queue Analysis Intersection Approach Movement 95 th Percentile Queue AM Peak PM Peak Cahaba Heights Road Left Eastbound Through Right Cahaba Heights Road Left Crosshaven Drive at Westbound Through Right Cahaba Heights Road Summit Parkway Left Northbound Through Right Crosshaven Drive Left Southbound Through Right Ridgely Drive Eastbound Left Through Right 4 11 Ridgely Drive Crosshaven Drive at Westbound Left Through Right 19 4 Ridgely Drive Crosshaven Drive Northbound Left Through Right 1 0 Crosshaven Drive Southbound Left Through Right 1 1 Canterbury Place Eastbound Left Through Right 2 3 Valley Park Drive Crosshaven Drive at Left Through Right 11 5 Westbound Valley Park Drive/ Crosshaven Drive Canterbury Place Left Through Right 0 0 Northbound Crosshaven Drive Southbound Left Through Right 0 1 Green Valley Road Eastbound Left Through Right Green Valley Road Left Through Right Westbound Crosshaven Drive at Crosshaven Drive Green Valley Left Through Right Northbound Road/Sunview Drive Crosshaven Drive Left Through Right Southbound Sunview Drive Southeastbound Left Through Right 8 18 Skipper Consulting, Inc. Page 23
47 Traffic Study Crosshaven Drive APPLE Table 10 (Continued) Future Intersection Queue Analysis Intersection Approach Movement Crosshaven Drive at Bearden Court Crosshaven Drive at Greendale Drive Crosshaven Drive at Overton Road Office Access Eastbound Bearden Court Westbound Crosshaven Drive Northbound Crosshaven Drive Southbound Greendale Road Westbound Crosshaven Drive Northbound Crosshaven Drive Southbound Overton Road Eastbound Overton Road Westbound Crosshaven Drive Northbound Crosshaven Drive Southbound 95 th Percentile Queue AM Peak PM Peak Left Through Right 0 12 Left Through Right Left Through Right 0 0 Left Through Right 0 7 Left Right Through Right Left Through Left 12 8 Through Right Left Through Right Left Through Right Left Through Right Table 11 Future Peak Hour Roadway Segment Capacity Analysis Crosshaven Drive Segment Cahaba Heights Rd to Green Valley Rd Green Valley Rd to Overton Rd AM Peak Traffic Volumes Opposing Direction Analysis Direction Level of Service v/c Ratio PM Peak Traffic Volumes Opposing Direction Analysis Direction Level of Service v/c Ratio 590 vph 479 vph D vph 522 vph D vph 461 vph D vph 647 vph D 0.53 Skipper Consulting, Inc. Page 24
48 Traffic Study Crosshaven Drive APPLE Table 12 Future Daily Roadway Segment Capacity Analysis Crosshaven Drive Segment Classification Cross Section Daily Volume Capacity Cahaba Heights Road to Green Valley Road Green Valley Road to Overton Road Collector Minor Arterial 2 Lane Undivided 2 Lane Undivided v/c Ratio Level of Service 13,750 vpd 16,600 vpd 0.83 E 14,750 vpd 17,800 vpd 0.83 E Skipper Consulting, Inc. Page 25
49 Traffic Study Crosshaven Drive APPLE RECOMMENDED IMPROVEMENTS Based on the results of the analyses presented in this report, the following is a list of recommended improvements for Crosshaven Drive: Crosshaven Drive entire roadway from Cahaba Heights Road to Overton Road Widen to a continuous three lane cross section Crosshaven Drive at Cahaba Heights Road Construct a right turn lane on Cahaba Heights Road eastbound Construct a right turn lane on Cahaba Heights Road westbound Construct a right turn lane on Crosshaven Drive southbound Crosshaven Drive at Green Valley Road Construct a left turn lane on Green Valley Road eastbound Construct a right turn lane on Green Valley Road eastbound Construct a right turn lane on Crosshaven Drive northbound Construct a left turn lane on Crosshaven Drive southbound Crosshaven Drive at Bearden Court Construct a left turn lane on Crosshaven Drive southbound Install a traffic signal when warranted Crosshaven Drive at Greendale Road Construct a right turn lane on Crosshaven Drive northbound Construct a left turn lane on Crosshaven Drive southbound Crosshaven Drive at Overton Road Construct a right turn lane on Overton Road eastbound Skipper Consulting, Inc. Page 26
50 Traffic Study Crosshaven Drive APPLE ANALYSIS OF RECOMMENDED IMPROVEMENTS Future Peak Hour Intersection Capacity Analysis with Improvements Future a.m. and p.m. peak hour intersection capacity analyses were performed for the study intersections using the method of analysis included in the 2010 Highway Capacity Manual, published by the Transportation Research Board. The results of the a.m. and p.m. peak hour intersection capacity analyses are included in Appendix J and are summarized in Table 13. Future Peak Hour Intersection Queues with Improvements Future a.m. and p.m. peak hour 95 th percentile queue calculations were performed for the study intersections. The results of the queue calculations are included in Appendix K and are summarized in Table 14. Future Peak Hour Roadway Segment Capacity Analysis with Improvements Future a.m. and p.m. peak hour roadway segment capacity analyses were performed for the two study roadway segments using the method of analysis included in the 2010 Highway Capacity Manual, published by the Transportation Research Board. The results of the peak hour segment capacity analyses are included in Appendix L and are summarized in Table 15. Future Daily Roadway Segment Capacity Analysis with Improvements Future daily roadway segment capacity analyses were performed for the two study roadway segments using the capacity chart prepared by the Alabama Department of Transportation with level of service thresholds assigned according to the 2010 Highway Capacity Manual. The level of service chart is included in Appendix F. The results of the analysis are shown in Table 16. Skipper Consulting, Inc. Page 27
51 Traffic Study Crosshaven Drive APPLE Table 13 Future Intersection Capacity Analysis with Improvements Intersection Approach Movement Level of Service AM Peak PM Peak Left D C Cahaba Heights Road Through C C Eastbound Right B C Overall approach C C Left B D Cahaba Heights Road Through D C Westbound Right B C Overall approach D C Crosshaven Drive at Cahaba Heights Road Crosshaven Drive at Ridgely Drive Crosshaven Drive at Valley Park Drive/ Canterbury Place Crosshaven Drive at Green Valley Road/Sunview Drive Summit Parkway Northbound Crosshaven Drive Southbound Left D C Through Right C D Overall approach D D Left C D Through D C Right C B Overall approach D C Overall intersection D C Ridgely Drive Eastbound Left Through Right C C Ridgely Drive Westbound Left Through Right D E Crosshaven Drive Northbound Left A A Crosshaven Drive Southbound Left A A Canterbury Place Eastbound Left Through Right C C Valley Park Drive Westbound Left Through Right C D Crosshaven Drive Northbound Left A A Crosshaven Drive Southbound Left A A Green Valley Road Eastbound Green Valley Road Westbound Crosshaven Drive Northbound Crosshaven Drive Southbound Sunview Drive Southeastbound Left B B Through A A Right A A Overall approach B B Left Through Right D A Left A A Through B B Right A A Overall approach B B Left B A Through Right B B Overall approach B B Left Through Right A A Overall intersection C B Skipper Consulting, Inc. Page 28
52 Traffic Study Crosshaven Drive APPLE Table 13 (Continued) Future Intersection Capacity Analysis with Improvements Intersection Approach Movement Level of Service AM Peak PM Peak Office Access Eastbound Left Through Right A C Bearden Court Westbound Left Through Right D C Left A A Crosshaven Drive Crosshaven Drive at Through Right A B Northbound Bearden Court Overall approach A B Crosshaven Drive at Greendale Drive Crosshaven Drive at Overton Road Crosshaven Drive Southbound Greendale Road Westbound Crosshaven Drive Northbound Crosshaven Drive Southbound Overton Road Eastbound Overton Road Westbound Crosshaven Drive Northbound Crosshaven Drive Southbound Left A A Through Right A A Overall approach A A Overall intersection A A Left Right B C Through A A Right A A Overall approach A A Left A A Through A A Overall approach A A Overall intersection A A Left B B Through C C Right B B Overall approach C C Left C D Through Right D A Overall approach D B Left Through D D Right B C Overall approach D C Left Through Right B C Overall intersection C C Skipper Consulting, Inc. Page 29
53 Traffic Study Crosshaven Drive APPLE Table 14 Future Intersection Queue Analysis with Improvements 95 th Percentile Queue Intersection Approach Movement AM Peak PM Peak Left Cahaba Heights Road Through Eastbound Right Left Cahaba Heights Road Through Westbound Right Crosshaven Drive at Cahaba Heights Road Crosshaven Drive at Ridgely Drive Crosshaven Drive at Valley Park Drive/ Canterbury Place Crosshaven Drive at Green Valley Road/Sunview Drive Summit Parkway Northbound Crosshaven Drive Southbound Ridgely Drive Eastbound Ridgely Drive Westbound Crosshaven Drive Northbound Crosshaven Drive Southbound Canterbury Place Eastbound Valley Park Drive Westbound Crosshaven Drive Northbound Crosshaven Drive Southbound Green Valley Road Eastbound Green Valley Road Westbound Crosshaven Drive Northbound Crosshaven Drive Southbound Sunview Drive Southeastbound Left Through Right Left Through Right Left Through Right 4 11 Left Through Right 18 4 Left 1 0 Through Right 0 0 Left 1 1 Through Right 0 0 Left Through Right 2 3 Left Through Right 11 5 Left 0 0 Through Right 0 0 Left 0 1 Through Right 0 0 Left Through Right 9 21 Left Through Right Left Through Right Left Through Right Left Through Right 9 18 Skipper Consulting, Inc. Page 30
54 Traffic Study Crosshaven Drive APPLE Table 14 (Continued) Future Intersection Queue Analysis with Improvements Intersection Approach Movement Crosshaven Drive at Bearden Court Crosshaven Drive at Greendale Drive Crosshaven Drive at Overton Road Office Access Eastbound Bearden Court Westbound Crosshaven Drive Northbound Crosshaven Drive Southbound Greendale Road Westbound Crosshaven Drive Northbound Crosshaven Drive Southbound Overton Road Eastbound Overton Road Westbound Crosshaven Drive Northbound Crosshaven Drive Southbound 95 th Percentile Queue AM Peak PM Peak Left Through Right 0 2 Left Through Right Left 0 0 Through Right Left 2 20 Through Right Left Right Through Right 8 11 Left Through Left 12 8 Through Right Left Through Right Left Through Right Left Through Right Table 15 Future Peak Hour Roadway Segment Capacity Analysis with Improvements Crosshaven Drive Segment Cahaba Heights Rd to Green Valley Rd Green Valley Rd to Overton Rd AM Peak Traffic Volumes Opposing Direction Analysis Direction Level of Service v/c Ratio PM Peak Traffic Volumes Opposing Direction Analysis Direction Level of Service v/c Ratio 590 vph 479 vph C vph 522 vph C vph 461 vph C vph 647 vph D 0.53 Skipper Consulting, Inc. Page 31
55 Traffic Study Crosshaven Drive APPLE Table 16 Future Daily Roadway Segment Capacity Analysis with Improvements Crosshaven Drive Segment Classification Cross Section Daily Volume Capacity Cahaba Heights Road to Green Valley Road Green Valley Road to Overton Road v/c Ratio Level of Service Collector 3 Lane 13,750 vpd 20,800 vpd 0.66 D Minor Arterial 3 Lane 14,750 vpd 22,000 vpd 0.67 D Skipper Consulting, Inc. Page 32
56 Appendix A Existing Intersection Turning Movement Traffic Counts
57
58
59
60
61
62
63
64
65
66
67
68
69
70
71
72
73
74 Appendix B Existing Machine Traffic Counts
75
76
77
78
79
80
81
82 Appendix C Existing Intersection Capacity Analysis Worksheets
83
84 Crosshaven Dr APPLE Existing AM 1: Cahaba Heights Road & Crosshaven Dr Movement EBL EBT EBR WBL WBT WBR NBL NBT NBR SBL SBT SBR Lane Configurations Ideal Flow (vphpl) Total Lost time (s) Lane Util. Factor Frt Flt Protected Satd. Flow (prot) Flt Permitted Satd. Flow (perm) Volume (vph) Peak-hour factor, PHF Adj. Flow (vph) RTOR Reduction (vph) Lane Group Flow (vph) Turn Type pm+pt pm+pt pm+pt pm+pt Protected Phases Permitted Phases Actuated Green, G (s) Effective Green, g (s) Actuated g/c Ratio Clearance Time (s) Vehicle Extension (s) Lane Grp Cap (vph) v/s Ratio Prot c c0.34 c v/s Ratio Perm c v/c Ratio Uniform Delay, d Progression Factor Incremental Delay, d Delay (s) Level of Service B B B D C C C D Approach Delay (s) Approach LOS B D C C Intersection Summary HCM Average Control Delay 29.9 HCM Level of Service C HCM Volume to Capacity ratio 0.83 Actuated Cycle Length (s) 81.2 Sum of lost time (s) 12.0 Intersection Capacity Utilization 72.0% ICU Level of Service C Analysis Period (min) 15 c Critical Lane Group Timing Plan: Existing AM Page 1 Skipper Consulting
85 Crosshaven Dr APPLE Existing AM 2: Ridgley Dr & Crosshaven Dr Movement EBL EBT EBR WBL WBT WBR NBL NBT NBR SBL SBT SBR Lane Configurations Sign Control Stop Stop Free Free Grade 0% 0% 0% 0% Volume (veh/h) Peak Hour Factor Hourly flow rate (vph) Pedestrians Lane Width (ft) Walking Speed (ft/s) Percent Blockage Right turn flare (veh) Median type None None Median storage veh) Upstream signal (ft) 473 px, platoon unblocked vc, conflicting volume vc1, stage 1 conf vol vc2, stage 2 conf vol vcu, unblocked vol tc, single (s) tc, 2 stage (s) tf (s) p0 queue free % cm capacity (veh/h) Direction, Lane # EB 1 WB 1 NB 1 SB 1 Volume Total Volume Left Volume Right csh Volume to Capacity Queue Length 95th (ft) Control Delay (s) Lane LOS B C A A Approach Delay (s) Approach LOS B C Intersection Summary Average Delay 1.0 Intersection Capacity Utilization 36.3% ICU Level of Service A Analysis Period (min) 15 Timing Plan: Existing AM Page 1 Skipper Consulting
86 Crosshaven Dr APPLE Existing AM 3: Valley Park Dr & Crosshaven Dr Movement EBL EBT EBR WBL WBT WBR NBL NBT NBR SBL SBT SBR Lane Configurations Sign Control Stop Stop Free Free Grade 0% 0% 0% 0% Volume (veh/h) Peak Hour Factor Hourly flow rate (vph) Pedestrians Lane Width (ft) Walking Speed (ft/s) Percent Blockage Right turn flare (veh) Median type None None Median storage veh) Upstream signal (ft) px, platoon unblocked vc, conflicting volume vc1, stage 1 conf vol vc2, stage 2 conf vol vcu, unblocked vol tc, single (s) tc, 2 stage (s) tf (s) p0 queue free % cm capacity (veh/h) Direction, Lane # EB 1 WB 1 NB 1 SB 1 Volume Total Volume Left Volume Right csh Volume to Capacity Queue Length 95th (ft) Control Delay (s) Lane LOS B C A A Approach Delay (s) Approach LOS B C Intersection Summary Average Delay 0.7 Intersection Capacity Utilization 31.1% ICU Level of Service A Analysis Period (min) 15 Timing Plan: Existing AM Page 2 Skipper Consulting
87 Crosshaven Dr APPLE Existing AM 4: Green Valley Rd & Crosshaven Dr Movement EBL EBT EBR WBL WBT WBR WBR2 NBL2 NBL NBT NBR SBL Lane Configurations Ideal Flow (vphpl) Total Lost time (s) Lane Util. Factor Frt Flt Protected Satd. Flow (prot) Flt Permitted Satd. Flow (perm) Volume (vph) Peak-hour factor, PHF Adj. Flow (vph) RTOR Reduction (vph) Lane Group Flow (vph) Turn Type Perm Perm Perm Perm Perm Protected Phases 1 1 2! Permitted Phases ! 2! Actuated Green, G (s) Effective Green, g (s) Actuated g/c Ratio Clearance Time (s) Vehicle Extension (s) Lane Grp Cap (vph) v/s Ratio Prot v/s Ratio Perm 0.17 c0.36 c0.32 v/c Ratio Uniform Delay, d Progression Factor Incremental Delay, d Delay (s) Level of Service A C B Approach Delay (s) Approach LOS A C B Intersection Summary HCM Average Control Delay 17.6 HCM Level of Service B HCM Volume to Capacity ratio 0.83 Actuated Cycle Length (s) 42.4 Sum of lost time (s) 8.0 Intersection Capacity Utilization 91.7% ICU Level of Service F Analysis Period (min) 15! Phase conflict between lane groups. c Critical Lane Group Timing Plan: Existing AM Page 2 Skipper Consulting
88 Crosshaven Dr APPLE Existing AM 4: Green Valley Rd & Crosshaven Dr Movement SBT SBR SBR2 SEL2 SEL SER Lane Configurations Ideal Flow (vphpl) Total Lost time (s) Lane Util. Factor Frt Flt Protected Satd. Flow (prot) Flt Permitted Satd. Flow (perm) Volume (vph) Peak-hour factor, PHF Adj. Flow (vph) RTOR Reduction (vph) Lane Group Flow (vph) Turn Type custom Protected Phases 2! 2! Permitted Phases 1 Actuated Green, G (s) Effective Green, g (s) Actuated g/c Ratio Clearance Time (s) Vehicle Extension (s) Lane Grp Cap (vph) v/s Ratio Prot v/s Ratio Perm v/c Ratio Uniform Delay, d Progression Factor Incremental Delay, d Delay (s) Level of Service B A Approach Delay (s) Approach LOS B A Intersection Summary Timing Plan: Existing AM Page 3 Skipper Consulting
89 Crosshaven Dr APPLE Existing AM 5: Bearden Ct & Crosshaven Dr Movement EBL EBT EBR WBL WBT WBR NBL NBT NBR SBL SBT SBR Lane Configurations Sign Control Stop Stop Free Free Grade 0% 0% 0% 0% Volume (veh/h) Peak Hour Factor Hourly flow rate (vph) Pedestrians Lane Width (ft) Walking Speed (ft/s) Percent Blockage Right turn flare (veh) Median type None None Median storage veh) Upstream signal (ft) px, platoon unblocked vc, conflicting volume vc1, stage 1 conf vol vc2, stage 2 conf vol vcu, unblocked vol tc, single (s) tc, 2 stage (s) tf (s) p0 queue free % cm capacity (veh/h) Direction, Lane # EB 1 WB 1 NB 1 SB 1 Volume Total Volume Left Volume Right csh Volume to Capacity Queue Length 95th (ft) Control Delay (s) Lane LOS A C A Approach Delay (s) Approach LOS A C Intersection Summary Average Delay 0.9 Intersection Capacity Utilization 35.3% ICU Level of Service A Analysis Period (min) 15 Timing Plan: Existing AM Page 3 Skipper Consulting
90 Crosshaven Dr APPLE Existing AM 6: Greendale Dr & Crosshaven Dr Movement WBL WBR NBT NBR SBL SBT Lane Configurations Ideal Flow (vphpl) Total Lost time (s) Lane Util. Factor Frt Flt Protected Satd. Flow (prot) Flt Permitted Satd. Flow (perm) Volume (vph) Peak-hour factor, PHF Adj. Flow (vph) RTOR Reduction (vph) Lane Group Flow (vph) Turn Type Perm Protected Phases Permitted Phases 2 Actuated Green, G (s) Effective Green, g (s) Actuated g/c Ratio Clearance Time (s) Vehicle Extension (s) Lane Grp Cap (vph) v/s Ratio Prot c v/s Ratio Perm c0.27 v/c Ratio Uniform Delay, d Progression Factor Incremental Delay, d Delay (s) Level of Service B A A Approach Delay (s) Approach LOS B A A Intersection Summary HCM Average Control Delay 6.6 HCM Level of Service A HCM Volume to Capacity ratio 0.45 Actuated Cycle Length (s) 38.4 Sum of lost time (s) 8.0 Intersection Capacity Utilization 59.9% ICU Level of Service B Analysis Period (min) 15 c Critical Lane Group Timing Plan: Existing AM Page 4 Skipper Consulting
91 Crosshaven Dr APPLE Existing AM 7: Overton Rd & Crosshaven Dr Movement EBL EBT EBR WBL WBT WBR NBL NBT NBR SBL SBT SBR Lane Configurations Ideal Flow (vphpl) Total Lost time (s) Lane Util. Factor Frt Flt Protected Satd. Flow (prot) Flt Permitted Satd. Flow (perm) Volume (vph) Peak-hour factor, PHF Adj. Flow (vph) RTOR Reduction (vph) Lane Group Flow (vph) Turn Type Perm pm+pt Perm Perm Perm Protected Phases Permitted Phases Actuated Green, G (s) Effective Green, g (s) Actuated g/c Ratio Clearance Time (s) Vehicle Extension (s) Lane Grp Cap (vph) v/s Ratio Prot c0.43 v/s Ratio Perm c v/c Ratio Uniform Delay, d Progression Factor Incremental Delay, d Delay (s) Level of Service B C B B C B B Approach Delay (s) Approach LOS C B C B Intersection Summary HCM Average Control Delay 18.3 HCM Level of Service B HCM Volume to Capacity ratio 0.76 Actuated Cycle Length (s) 66.0 Sum of lost time (s) 8.0 Intersection Capacity Utilization 76.8% ICU Level of Service D Analysis Period (min) 15 c Critical Lane Group Timing Plan: Existing AM Page 5 Skipper Consulting
92 Crosshaven Dr APPLE Existing PM 1: Cahaba Heights Road & Crosshaven Dr Movement EBL EBT EBR WBL WBT WBR NBL NBT NBR SBL SBT SBR Lane Configurations Ideal Flow (vphpl) Total Lost time (s) Lane Util. Factor Frt Flt Protected Satd. Flow (prot) Flt Permitted Satd. Flow (perm) Volume (vph) Peak-hour factor, PHF Adj. Flow (vph) RTOR Reduction (vph) Lane Group Flow (vph) Turn Type pm+pt pm+pt pm+pt pm+pt Protected Phases Permitted Phases Actuated Green, G (s) Effective Green, g (s) Actuated g/c Ratio Clearance Time (s) Vehicle Extension (s) Lane Grp Cap (vph) v/s Ratio Prot 0.02 c0.30 c c c0.24 v/s Ratio Perm v/c Ratio Uniform Delay, d Progression Factor Incremental Delay, d Delay (s) Level of Service C C C C C C C C Approach Delay (s) Approach LOS C C C C Intersection Summary HCM Average Control Delay 28.3 HCM Level of Service C HCM Volume to Capacity ratio 0.79 Actuated Cycle Length (s) 75.8 Sum of lost time (s) 16.0 Intersection Capacity Utilization 78.6% ICU Level of Service D Analysis Period (min) 15 c Critical Lane Group Timing Plan: Existing PM Page 1 Skipper Consulting
93 Crosshaven Dr APPLE Existing PM 2: Ridgley Dr & Crosshaven Dr Movement EBL EBT EBR WBL WBT WBR NBL NBT NBR SBL SBT SBR Lane Configurations Sign Control Stop Stop Free Free Grade 0% 0% 0% 0% Volume (veh/h) Peak Hour Factor Hourly flow rate (vph) Pedestrians Lane Width (ft) Walking Speed (ft/s) Percent Blockage Right turn flare (veh) Median type None None Median storage veh) Upstream signal (ft) 473 px, platoon unblocked vc, conflicting volume vc1, stage 1 conf vol vc2, stage 2 conf vol vcu, unblocked vol tc, single (s) tc, 2 stage (s) tf (s) p0 queue free % cm capacity (veh/h) Direction, Lane # EB 1 WB 1 NB 1 SB 1 Volume Total Volume Left Volume Right csh Volume to Capacity Queue Length 95th (ft) Control Delay (s) Lane LOS B C A Approach Delay (s) Approach LOS B C Intersection Summary Average Delay 0.5 Intersection Capacity Utilization 39.6% ICU Level of Service A Analysis Period (min) 15 Timing Plan: Existing PM Page 1 Skipper Consulting
94 Crosshaven Dr APPLE Existing PM 3: Valley Park Dr & Crosshaven Dr Movement EBL EBT EBR WBL WBT WBR NBL NBT NBR SBL SBT SBR Lane Configurations Sign Control Stop Stop Free Free Grade 0% 0% 0% 0% Volume (veh/h) Peak Hour Factor Hourly flow rate (vph) Pedestrians Lane Width (ft) Walking Speed (ft/s) Percent Blockage Right turn flare (veh) Median type None None Median storage veh) Upstream signal (ft) px, platoon unblocked vc, conflicting volume vc1, stage 1 conf vol vc2, stage 2 conf vol vcu, unblocked vol tc, single (s) tc, 2 stage (s) tf (s) p0 queue free % cm capacity (veh/h) Direction, Lane # EB 1 WB 1 NB 1 SB 1 Volume Total Volume Left Volume Right csh Volume to Capacity Queue Length 95th (ft) Control Delay (s) Lane LOS B C A A Approach Delay (s) Approach LOS B C Intersection Summary Average Delay 0.3 Intersection Capacity Utilization 38.0% ICU Level of Service A Analysis Period (min) 15 Timing Plan: Existing PM Page 2 Skipper Consulting
95 Crosshaven Dr APPLE Existing PM 4: Green Valley Rd & Crosshaven Dr Movement EBL2 EBL EBT EBR WBL WBT WBR WBR2 NBL2 NBL NBT NBR Lane Configurations Ideal Flow (vphpl) Total Lost time (s) Lane Util. Factor Frt Flt Protected Satd. Flow (prot) Flt Permitted Satd. Flow (perm) Volume (vph) Peak-hour factor, PHF Adj. Flow (vph) RTOR Reduction (vph) Lane Group Flow (vph) Turn Type Perm Perm Perm Perm Perm Protected Phases 1 1 2! Permitted Phases 1! ! Actuated Green, G (s) Effective Green, g (s) Actuated g/c Ratio Clearance Time (s) Vehicle Extension (s) Lane Grp Cap (vph) v/s Ratio Prot v/s Ratio Perm c c0.32 v/c Ratio Uniform Delay, d Progression Factor Incremental Delay, d Delay (s) Level of Service C A B Approach Delay (s) Approach LOS C A B Intersection Summary HCM Average Control Delay 17.0 HCM Level of Service B HCM Volume to Capacity ratio 0.82 Actuated Cycle Length (s) 42.2 Sum of lost time (s) 8.0 Intersection Capacity Utilization 90.0% ICU Level of Service E Analysis Period (min) 15! Phase conflict between lane groups. c Critical Lane Group Timing Plan: Existing PM Page 2 Skipper Consulting
96 Crosshaven Dr APPLE Existing PM 4: Green Valley Rd & Crosshaven Dr Movement SBL SBT SBR SBR2 SEL2 SEL SER Lane Configurations Ideal Flow (vphpl) Total Lost time (s) Lane Util. Factor Frt Flt Protected Satd. Flow (prot) Flt Permitted Satd. Flow (perm) Volume (vph) Peak-hour factor, PHF Adj. Flow (vph) RTOR Reduction (vph) Lane Group Flow (vph) Turn Type Perm custom Protected Phases 2! 2! Permitted Phases 2! 1! Actuated Green, G (s) Effective Green, g (s) Actuated g/c Ratio Clearance Time (s) Vehicle Extension (s) Lane Grp Cap (vph) v/s Ratio Prot v/s Ratio Perm v/c Ratio Uniform Delay, d Progression Factor Incremental Delay, d Delay (s) Level of Service B A Approach Delay (s) Approach LOS B A Intersection Summary Timing Plan: Existing PM Page 3 Skipper Consulting
97 Crosshaven Dr APPLE Existing PM 5: Bearden Ct & Crosshaven Dr Movement EBL EBT EBR WBL WBT WBR NBL NBT NBR SBL SBT SBR Lane Configurations Sign Control Stop Stop Free Free Grade 0% 0% 0% 0% Volume (veh/h) Peak Hour Factor Hourly flow rate (vph) Pedestrians Lane Width (ft) Walking Speed (ft/s) Percent Blockage Right turn flare (veh) Median type None None Median storage veh) Upstream signal (ft) px, platoon unblocked vc, conflicting volume vc1, stage 1 conf vol vc2, stage 2 conf vol vcu, unblocked vol tc, single (s) tc, 2 stage (s) tf (s) p0 queue free % cm capacity (veh/h) Direction, Lane # EB 1 WB 1 NB 1 SB 1 Volume Total Volume Left Volume Right csh Volume to Capacity Queue Length 95th (ft) Control Delay (s) Lane LOS E E A Approach Delay (s) Approach LOS E E Intersection Summary Average Delay 2.6 Intersection Capacity Utilization 58.6% ICU Level of Service B Analysis Period (min) 15 Timing Plan: Existing PM Page 3 Skipper Consulting
98 Crosshaven Dr APPLE Existing PM 6: Greendale Dr & Crosshaven Dr Movement WBL WBR NBT NBR SBL SBT Lane Configurations Ideal Flow (vphpl) Total Lost time (s) Lane Util. Factor Frt Flt Protected Satd. Flow (prot) Flt Permitted Satd. Flow (perm) Volume (vph) Peak-hour factor, PHF Adj. Flow (vph) RTOR Reduction (vph) Lane Group Flow (vph) Turn Type Perm Protected Phases Permitted Phases 2 Actuated Green, G (s) Effective Green, g (s) Actuated g/c Ratio Clearance Time (s) Vehicle Extension (s) Lane Grp Cap (vph) v/s Ratio Prot c0.04 c0.42 v/s Ratio Perm 0.33 v/c Ratio Uniform Delay, d Progression Factor Incremental Delay, d Delay (s) Level of Service C A A Approach Delay (s) Approach LOS C A A Intersection Summary HCM Average Control Delay 4.7 HCM Level of Service A HCM Volume to Capacity ratio 0.53 Actuated Cycle Length (s) 64.7 Sum of lost time (s) 8.0 Intersection Capacity Utilization 77.3% ICU Level of Service D Analysis Period (min) 15 c Critical Lane Group Timing Plan: Existing PM Page 4 Skipper Consulting
99 Crosshaven Dr APPLE Existing PM 7: Overton Rd & Crosshaven Dr Movement EBL EBT EBR WBL WBT WBR NBL NBT NBR SBL SBT SBR Lane Configurations Ideal Flow (vphpl) Total Lost time (s) Lane Util. Factor Frt Flt Protected Satd. Flow (prot) Flt Permitted Satd. Flow (perm) Volume (vph) Peak-hour factor, PHF Adj. Flow (vph) RTOR Reduction (vph) Lane Group Flow (vph) Turn Type Perm pm+pt Perm Perm Perm Protected Phases Permitted Phases Actuated Green, G (s) Effective Green, g (s) Actuated g/c Ratio Clearance Time (s) Vehicle Extension (s) Lane Grp Cap (vph) v/s Ratio Prot c0.36 c v/s Ratio Perm c v/c Ratio Uniform Delay, d Progression Factor Incremental Delay, d Delay (s) Level of Service B C B A C C C Approach Delay (s) Approach LOS C B C C Intersection Summary HCM Average Control Delay 19.8 HCM Level of Service B HCM Volume to Capacity ratio 0.77 Actuated Cycle Length (s) 67.4 Sum of lost time (s) 12.0 Intersection Capacity Utilization 73.6% ICU Level of Service D Analysis Period (min) 15 c Critical Lane Group Timing Plan: Existing PM Page 5 Skipper Consulting
100 Appendix D Existing Queue Calculation Worksheets
101
102 Crosshaven Dr APPLE Existing AM 1: Cahaba Heights Road & Crosshaven Dr Lane Group EBL EBT WBL WBT NBL NBT SBL SBT Lane Group Flow (vph) v/c Ratio Control Delay Queue Delay Total Delay Queue Length 50th (ft) Queue Length 95th (ft) #465 # Internal Link Dist (ft) Turn Bay Length (ft) Base Capacity (vph) Starvation Cap Reductn Spillback Cap Reductn Storage Cap Reductn Reduced v/c Ratio Intersection Summary # 95th percentile volume exceeds capacity, queue may be longer. Queue shown is maximum after two cycles. Timing Plan: Existing AM Page 1 Skipper Consulting
103 Crosshaven Dr APPLE Existing AM 4: Green Valley Rd & Crosshaven Dr Lane Group EBT WBT NBT SBT SEL Lane Group Flow (vph) v/c Ratio Control Delay Queue Delay Total Delay Queue Length 50th (ft) Queue Length 95th (ft) 48 #226 # Internal Link Dist (ft) Turn Bay Length (ft) Base Capacity (vph) Starvation Cap Reductn Spillback Cap Reductn Storage Cap Reductn Reduced v/c Ratio Intersection Summary # 95th percentile volume exceeds capacity, queue may be longer. Queue shown is maximum after two cycles. Timing Plan: Existing AM Page 2 Skipper Consulting
104 Crosshaven Dr APPLE Existing AM 6: Greendale Dr & Crosshaven Dr Lane Group WBL NBT SBT Lane Group Flow (vph) v/c Ratio Control Delay Queue Delay Total Delay Queue Length 50th (ft) Queue Length 95th (ft) Internal Link Dist (ft) Turn Bay Length (ft) Base Capacity (vph) Starvation Cap Reductn Spillback Cap Reductn Storage Cap Reductn Reduced v/c Ratio Intersection Summary Timing Plan: Existing AM Page 3 Skipper Consulting
105 Crosshaven Dr APPLE Existing AM 7: Overton Rd & Crosshaven Dr Lane Group EBL EBT WBL WBT NBT NBR SBT Lane Group Flow (vph) v/c Ratio Control Delay Queue Delay Total Delay Queue Length 50th (ft) Queue Length 95th (ft) # Internal Link Dist (ft) Turn Bay Length (ft) Base Capacity (vph) Starvation Cap Reductn Spillback Cap Reductn Storage Cap Reductn Reduced v/c Ratio Intersection Summary # 95th percentile volume exceeds capacity, queue may be longer. Queue shown is maximum after two cycles. Timing Plan: Existing AM Page 4 Skipper Consulting
106 Crosshaven Dr APPLE Existing PM 1: Cahaba Heights Road & Crosshaven Dr Lane Group EBL EBT WBL WBT NBL NBT SBL SBT Lane Group Flow (vph) v/c Ratio Control Delay Queue Delay Total Delay Queue Length 50th (ft) Queue Length 95th (ft) 77 # #125 #355 #137 #376 Internal Link Dist (ft) Turn Bay Length (ft) Base Capacity (vph) Starvation Cap Reductn Spillback Cap Reductn Storage Cap Reductn Reduced v/c Ratio Intersection Summary # 95th percentile volume exceeds capacity, queue may be longer. Queue shown is maximum after two cycles. Timing Plan: Existing PM Page 1 Skipper Consulting
107 Crosshaven Dr APPLE Existing PM 4: Green Valley Rd & Crosshaven Dr Lane Group EBT WBT NBT SBT SEL Lane Group Flow (vph) v/c Ratio Control Delay Queue Delay Total Delay Queue Length 50th (ft) Queue Length 95th (ft) # #241 # Internal Link Dist (ft) Turn Bay Length (ft) Base Capacity (vph) Starvation Cap Reductn Spillback Cap Reductn Storage Cap Reductn Reduced v/c Ratio Intersection Summary # 95th percentile volume exceeds capacity, queue may be longer. Queue shown is maximum after two cycles. Timing Plan: Existing PM Page 2 Skipper Consulting
108 Crosshaven Dr APPLE Existing PM 6: Greendale Dr & Crosshaven Dr Lane Group WBL NBT SBT Lane Group Flow (vph) v/c Ratio Control Delay Queue Delay Total Delay Queue Length 50th (ft) Queue Length 95th (ft) Internal Link Dist (ft) Turn Bay Length (ft) Base Capacity (vph) Starvation Cap Reductn Spillback Cap Reductn Storage Cap Reductn Reduced v/c Ratio Intersection Summary Timing Plan: Existing PM Page 3 Skipper Consulting
109 Crosshaven Dr APPLE Existing PM 7: Overton Rd & Crosshaven Dr Lane Group EBL EBT WBL WBT NBT NBR SBT Lane Group Flow (vph) v/c Ratio Control Delay Queue Delay Total Delay Queue Length 50th (ft) Queue Length 95th (ft) 6 # # Internal Link Dist (ft) Turn Bay Length (ft) Base Capacity (vph) Starvation Cap Reductn Spillback Cap Reductn Storage Cap Reductn Reduced v/c Ratio Intersection Summary # 95th percentile volume exceeds capacity, queue may be longer. Queue shown is maximum after two cycles. Timing Plan: Existing PM Page 4 Skipper Consulting
110 Appendix E Existing Roadway Segment Capacity Analysis Worksheets
111
112 Directional file:///c:/users/rcaudle/appdata/local/temp/s2k2265.tmp Page 1 of 2 5/22/2017 General Information DIRECTIONAL TWO-LANE HIGHWAY SEGMENT WORKSHEET Analyst RLC Agency or Company Skipper Consulting Date Performed 5/22/2017 Analysis Time Period AM Peak Project Description: Croisshaven APPLE Input Data Site Information Highway / Direction of Travel Crosshaven Drive From/To Cahaba Heights to Green Valley Jurisdiction City of Vestavia Hills Analysis Year Existing 2017 Analysis direction vol., V d 450veh/h Opposing direction vol., V o 366veh/h Shoulder width ft 2.0 Lane Width ft 12.0 Segment Length mi 0.4 Average Travel Speed Analysis Direction (d) Class I highway Class II highway Class III highway Terrain Level Rolling Grade Length mi Up/down Peak-hour factor, PHF 0.87 No-passing zone 100% % Trucks and Buses, P T 5 % % Recreational vehicles, P R 0% Access points mi 40/mi Opposing Direction (o) Passenger-car equivalents for trucks, E T (Exhibit or 15-12) Passenger-car equivalents for RVs, E R (Exhibit or 15-13) Heavy-vehicle adjustment factor, f HV,ATS =1/ (1+ P T (E T -1)+P R (E R -1) ) Grade adjustment factor 1, f g,ats (Exhibit 15-9) Demand flow rate 2, v i (pc/h) v i =V i / (PHF* f g,ats * f HV,ATS ) Free-Flow Speed from Field Measurement Estimated Free-Flow Speed Base free-flow speed 4, BFFS mi/h Mean speed of sample 3, S FM 37 Total demand flow rate, both directions, v Free-flow speed, FFS=S FM (v/ f HV,ATS ) Adj. for no-passing zones, f np,ats (Exhibit 15-15) 2.3 mi/h Percent Time-Spent-Following Adj. for lane and shoulder width, 4 f LS (Exhibit 15-7) mi/h Adj. for access points 4, f A (Exhibit 15-8) mi/h Free-flow speed, FFS (FSS=BFFS-f LS -f A ) 43.6 mi/h Average travel speed, ATS d =FFS (v d,ats mi/h v o,ats ) - f np,ats Percent free flow speed, PFFS 76.0 % Analysis Direction (d) Opposing Direction (o) Passenger-car equivalents for trucks, E T (Exhibit or 15-19) Passenger-car equivalents for RVs, E R (Exhibit or 15-19) Heavy-vehicle adjustment factor, f HV =1/ (1+ P T (E T -1)+P R (E R -1) ) Grade adjustment factor 1, f g,ptsf (Exhibit or Ex 15-17) Directional flow rate 2, v i (pc/h) v i =V i /(PHF*f HV,PTSF * f g,ptsf ) Base percent time-spent-following 4, BPTSF d (%)=100(1-e av d b ) 53.8 Adj. for no-passing zone, f np,ptsf (Exhibit 15-21) 38.1 Percent time-spent-following, PTSF (%)=BPTSF +f d d np,ptsf *(v d,ptsf / v d,ptsf v o,ptsf ) Level of Service and Other Performance Measures Level of service, LOS (Exhibit 15-3) C Volume to capacity ratio, v/c 0.53
113 Directional file:///c:/users/rcaudle/appdata/local/temp/s2k2265.tmp Page 2 of 2 5/22/2017 Capacity, C d,ats (Equation 15-12) veh/h 1675 Capacity, C d,ptsf (Equation 15-13) veh/h 1700 Percent Free-Flow Speed PFFS d (Equation Class III only) 76.0 Bicycle Level of Service Directional demand flow rate in outside lane, v OL (Eq ) veh/h Effective width, Wv (Eq ) ft Effective speed factor, S t (Eq ) 2.61 Bicycle level of service score, BLOS (Eq ) 4.23 Bicycle level of service (Exhibit 15-4) Notes 1. Note that the adjustment factor for level terrain is 1.00,as level terrain is one of the base conditions. For the purpose of grade adjustment, specific downgrade segments are treated as level terrain. 2. If v i (v d or v o ) >=1,700 pc/h, terminate analysis--the LOS is F. 3. For the analysis direction only and for v>200 veh/h. 4. For the analysis direction only 5. Exhibit provides coefficients a and b for Equation Use alternative Exhibit if some trucks operate at crawl speeds on a specific downgrade. Copyright 2016 University of Florida, All Rights Reserved HCS 2010 TM Version 6.90 Generated: 5/22/ :46 AM D
114 Directional file:///c:/users/rcaudle/appdata/local/temp/s2k2265.tmp Page 1 of 2 5/22/2017 General Information DIRECTIONAL TWO-LANE HIGHWAY SEGMENT WORKSHEET Analyst RLC Agency or Company Skipper Consulting Date Performed 5/22/2017 Analysis Time Period AM Peak Project Description: Croisshaven APPLE Input Data Site Information Highway / Direction of Travel Crosshaven Drive From/To Green Valley to Overton Rd Jurisdiction City of Vestavia Hills Analysis Year Existing 2017 Analysis direction vol., V d 430veh/h Opposing direction vol., V o 352veh/h Shoulder width ft 2.0 Lane Width ft 12.0 Segment Length mi 0.5 Average Travel Speed Analysis Direction (d) Class I highway Class II highway Class III highway Terrain Level Rolling Grade Length mi Up/down Peak-hour factor, PHF 0.90 No-passing zone 100% % Trucks and Buses, P T 5 % % Recreational vehicles, P R 0% Access points mi 25/mi Opposing Direction (o) Passenger-car equivalents for trucks, E T (Exhibit or 15-12) Passenger-car equivalents for RVs, E R (Exhibit or 15-13) Heavy-vehicle adjustment factor, f HV,ATS =1/ (1+ P T (E T -1)+P R (E R -1) ) Grade adjustment factor 1, f g,ats (Exhibit 15-9) Demand flow rate 2, v i (pc/h) v i =V i / (PHF* f g,ats * f HV,ATS ) Free-Flow Speed from Field Measurement Estimated Free-Flow Speed Base free-flow speed 4, BFFS mi/h Mean speed of sample 3, S FM 35 Total demand flow rate, both directions, v Free-flow speed, FFS=S FM (v/ f HV,ATS ) Adj. for no-passing zones, f np,ats (Exhibit 15-15) 2.4 mi/h Percent Time-Spent-Following Adj. for lane and shoulder width, 4 f LS (Exhibit 15-7) mi/h Adj. for access points 4, f A (Exhibit 15-8) mi/h Free-flow speed, FFS (FSS=BFFS-f LS -f A ) 41.3 mi/h Average travel speed, ATS d =FFS (v d,ats mi/h v o,ats ) - f np,ats Percent free flow speed, PFFS 75.5 % Analysis Direction (d) Opposing Direction (o) Passenger-car equivalents for trucks, E T (Exhibit or 15-19) Passenger-car equivalents for RVs, E R (Exhibit or 15-19) Heavy-vehicle adjustment factor, f HV =1/ (1+ P T (E T -1)+P R (E R -1) ) Grade adjustment factor 1, f g,ptsf (Exhibit or Ex 15-17) Directional flow rate 2, v i (pc/h) v i =V i /(PHF*f HV,PTSF * f g,ptsf ) Base percent time-spent-following 4, BPTSF d (%)=100(1-e av d b ) 51.9 Adj. for no-passing zone, f np,ptsf (Exhibit 15-21) 39.7 Percent time-spent-following, PTSF (%)=BPTSF +f d d np,ptsf *(v d,ptsf / v d,ptsf v o,ptsf ) Level of Service and Other Performance Measures Level of service, LOS (Exhibit 15-3) C Volume to capacity ratio, v/c 0.53
115 Directional file:///c:/users/rcaudle/appdata/local/temp/s2k2265.tmp Page 2 of 2 5/22/2017 Capacity, C d,ats (Equation 15-12) veh/h 1675 Capacity, C d,ptsf (Equation 15-13) veh/h 1700 Percent Free-Flow Speed PFFS d (Equation Class III only) 75.5 Bicycle Level of Service Directional demand flow rate in outside lane, v OL (Eq ) veh/h Effective width, Wv (Eq ) ft Effective speed factor, S t (Eq ) 2.61 Bicycle level of service score, BLOS (Eq ) 4.17 Bicycle level of service (Exhibit 15-4) Notes 1. Note that the adjustment factor for level terrain is 1.00,as level terrain is one of the base conditions. For the purpose of grade adjustment, specific downgrade segments are treated as level terrain. 2. If v i (v d or v o ) >=1,700 pc/h, terminate analysis--the LOS is F. 3. For the analysis direction only and for v>200 veh/h. 4. For the analysis direction only 5. Exhibit provides coefficients a and b for Equation Use alternative Exhibit if some trucks operate at crawl speeds on a specific downgrade. Copyright 2016 University of Florida, All Rights Reserved HCS 2010 TM Version 6.90 Generated: 5/22/ :21 AM D
116 Directional file:///c:/users/rcaudle/appdata/local/temp/s2k2265.tmp Page 1 of 2 5/22/2017 General Information DIRECTIONAL TWO-LANE HIGHWAY SEGMENT WORKSHEET Analyst RLC Agency or Company Skipper Consulting Date Performed 5/22/2017 Analysis Time Period PM Peak Project Description: Croisshaven APPLE Input Data Site Information Highway / Direction of Travel Crosshaven Drive From/To Cahaba Heights to Green Valley Jurisdiction City of Vestavia Hills Analysis Year Existing 2017 Analysis direction vol., V d 469veh/h Opposing direction vol., V o 399veh/h Shoulder width ft 2.0 Lane Width ft 12.0 Segment Length mi 0.4 Average Travel Speed Analysis Direction (d) Class I highway Class II highway Class III highway Terrain Level Rolling Grade Length mi Up/down Peak-hour factor, PHF 0.95 No-passing zone 100% % Trucks and Buses, P T 5 % % Recreational vehicles, P R 0% Access points mi 40/mi Opposing Direction (o) Passenger-car equivalents for trucks, E T (Exhibit or 15-12) Passenger-car equivalents for RVs, E R (Exhibit or 15-13) Heavy-vehicle adjustment factor, f HV,ATS =1/ (1+ P T (E T -1)+P R (E R -1) ) Grade adjustment factor 1, f g,ats (Exhibit 15-9) Demand flow rate 2, v i (pc/h) v i =V i / (PHF* f g,ats * f HV,ATS ) Free-Flow Speed from Field Measurement Estimated Free-Flow Speed Base free-flow speed 4, BFFS mi/h Mean speed of sample 3, S FM 37 Total demand flow rate, both directions, v Free-flow speed, FFS=S FM (v/ f HV,ATS ) Adj. for no-passing zones, f np,ats (Exhibit 15-15) 2.3 mi/h Percent Time-Spent-Following Adj. for lane and shoulder width, 4 f LS (Exhibit 15-7) mi/h Adj. for access points 4, f A (Exhibit 15-8) mi/h Free-flow speed, FFS (FSS=BFFS-f LS -f A ) 43.6 mi/h Average travel speed, ATS d =FFS (v d,ats mi/h v o,ats ) - f np,ats Percent free flow speed, PFFS 76.4 % Analysis Direction (d) Opposing Direction (o) Passenger-car equivalents for trucks, E T (Exhibit or 15-19) Passenger-car equivalents for RVs, E R (Exhibit or 15-19) Heavy-vehicle adjustment factor, f HV =1/ (1+ P T (E T -1)+P R (E R -1) ) Grade adjustment factor 1, f g,ptsf (Exhibit or Ex 15-17) Directional flow rate 2, v i (pc/h) v i =V i /(PHF*f HV,PTSF * f g,ptsf ) Base percent time-spent-following 4, BPTSF d (%)=100(1-e av d b ) 52.7 Adj. for no-passing zone, f np,ptsf (Exhibit 15-21) 39.1 Percent time-spent-following, PTSF (%)=BPTSF +f d d np,ptsf *(v d,ptsf / v d,ptsf v o,ptsf ) Level of Service and Other Performance Measures Level of service, LOS (Exhibit 15-3) C Volume to capacity ratio, v/c 0.53
117 Directional file:///c:/users/rcaudle/appdata/local/temp/s2k2265.tmp Page 2 of 2 5/22/2017 Capacity, C d,ats (Equation 15-12) veh/h 1675 Capacity, C d,ptsf (Equation 15-13) veh/h 1700 Percent Free-Flow Speed PFFS d (Equation Class III only) 76.4 Bicycle Level of Service Directional demand flow rate in outside lane, v OL (Eq ) veh/h Effective width, Wv (Eq ) ft Effective speed factor, S t (Eq ) 2.61 Bicycle level of service score, BLOS (Eq ) 4.26 Bicycle level of service (Exhibit 15-4) Notes 1. Note that the adjustment factor for level terrain is 1.00,as level terrain is one of the base conditions. For the purpose of grade adjustment, specific downgrade segments are treated as level terrain. 2. If v i (v d or v o ) >=1,700 pc/h, terminate analysis--the LOS is F. 3. For the analysis direction only and for v>200 veh/h. 4. For the analysis direction only 5. Exhibit provides coefficients a and b for Equation Use alternative Exhibit if some trucks operate at crawl speeds on a specific downgrade. Copyright 2016 University of Florida, All Rights Reserved HCS 2010 TM Version 6.90 Generated: 5/22/ :50 AM D
118 Directional file:///c:/users/rcaudle/appdata/local/temp/s2k2265.tmp Page 1 of 2 5/22/2017 General Information DIRECTIONAL TWO-LANE HIGHWAY SEGMENT WORKSHEET Analyst RLC Agency or Company Skipper Consulting Date Performed 5/22/2017 Analysis Time Period PM Peak Project Description: Croisshaven APPLE Input Data Site Information Highway / Direction of Travel Crosshaven Drive From/To Green Valley to Overton Rd Jurisdiction City of Vestavia Hills Analysis Year Existing 2017 Analysis direction vol., V d 566veh/h Opposing direction vol., V o 494veh/h Shoulder width ft 2.0 Lane Width ft 12.0 Segment Length mi 0.5 Average Travel Speed Analysis Direction (d) Class I highway Class II highway Class III highway Terrain Level Rolling Grade Length mi Up/down Peak-hour factor, PHF 0.91 No-passing zone 100% % Trucks and Buses, P T 5 % % Recreational vehicles, P R 0% Access points mi 25/mi Opposing Direction (o) Passenger-car equivalents for trucks, E T (Exhibit or 15-12) Passenger-car equivalents for RVs, E R (Exhibit or 15-13) Heavy-vehicle adjustment factor, f HV,ATS =1/ (1+ P T (E T -1)+P R (E R -1) ) Grade adjustment factor 1, f g,ats (Exhibit 15-9) Demand flow rate 2, v i (pc/h) v i =V i / (PHF* f g,ats * f HV,ATS ) Free-Flow Speed from Field Measurement Estimated Free-Flow Speed Base free-flow speed 4, BFFS mi/h Mean speed of sample 3, S FM 35 Total demand flow rate, both directions, v Free-flow speed, FFS=S FM (v/ f HV,ATS ) Adj. for no-passing zones, f np,ats (Exhibit 15-15) 1.9 mi/h Percent Time-Spent-Following Adj. for lane and shoulder width, 4 f LS (Exhibit 15-7) mi/h Adj. for access points 4, f A (Exhibit 15-8) mi/h Free-flow speed, FFS (FSS=BFFS-f LS -f A ) 43.5 mi/h Average travel speed, ATS d =FFS (v d,ats mi/h v o,ats ) - f np,ats Percent free flow speed, PFFS 73.4 % Analysis Direction (d) Opposing Direction (o) Passenger-car equivalents for trucks, E T (Exhibit or 15-19) Passenger-car equivalents for RVs, E R (Exhibit or 15-19) Heavy-vehicle adjustment factor, f HV =1/ (1+ P T (E T -1)+P R (E R -1) ) Grade adjustment factor 1, f g,ptsf (Exhibit or Ex 15-17) Directional flow rate 2, v i (pc/h) v i =V i /(PHF*f HV,PTSF * f g,ptsf ) Base percent time-spent-following 4, BPTSF d (%)=100(1-e av d b ) 59.5 Adj. for no-passing zone, f np,ptsf (Exhibit 15-21) 33.4 Percent time-spent-following, PTSF (%)=BPTSF +f d d np,ptsf *(v d,ptsf / v d,ptsf v o,ptsf ) Level of Service and Other Performance Measures Level of service, LOS (Exhibit 15-3) D Volume to capacity ratio, v/c 0.53
119 Directional file:///c:/users/rcaudle/appdata/local/temp/s2k2265.tmp Page 2 of 2 5/22/2017 Capacity, C d,ats (Equation 15-12) veh/h 1675 Capacity, C d,ptsf (Equation 15-13) veh/h 1700 Percent Free-Flow Speed PFFS d (Equation Class III only) 73.4 Bicycle Level of Service Directional demand flow rate in outside lane, v OL (Eq ) veh/h Effective width, Wv (Eq ) ft Effective speed factor, S t (Eq ) 2.61 Bicycle level of service score, BLOS (Eq ) 4.33 Bicycle level of service (Exhibit 15-4) Notes 1. Note that the adjustment factor for level terrain is 1.00,as level terrain is one of the base conditions. For the purpose of grade adjustment, specific downgrade segments are treated as level terrain. 2. If v i (v d or v o ) >=1,700 pc/h, terminate analysis--the LOS is F. 3. For the analysis direction only and for v>200 veh/h. 4. For the analysis direction only 5. Exhibit provides coefficients a and b for Equation Use alternative Exhibit if some trucks operate at crawl speeds on a specific downgrade. Copyright 2016 University of Florida, All Rights Reserved HCS 2010 TM Version 6.90 Generated: 5/22/ :22 AM D
120 Appendix F Daily Volume and Level of Service Table
121
122 Level of Service Chart By Roadway Type and Cross-Section (based on ALDOT approved capacities) Functional Classification Freeway Expressway Arterial (Divided) Arterial (Undivided) Collector (Divided) Collector (Undivided) Number of Maximum Daily Flow Rate Related to Level of Service Lanes A B C D E F 4 23,800 34,000 42,160 51,000 68,000 >68, ,700 51,000 63,240 76, ,000 >102, ,600 68,000 84, , ,000 >136, ,500 85, , , ,000 >170, ,500 25,000 31,000 37,500 50,000 >50, ,250 37,500 46,500 56,250 75,000 >75, ,000 50,000 62,000 75, ,000 >100, ,700 11,000 13,640 16,500 22,000 >22, ,865 16,950 21,018 25,425 33,900 >33, ,500 25,000 31,000 37,500 50,000 >50, ,760 36,800 45,632 55,200 73,600 >73, ,230 8,900 11,036 13,350 17,800 >17, ,850 15,500 19,220 23,250 31,000 >31, ,030 22,900 28,396 34,350 45,800 >45, ,085 31,550 39,122 47,325 63,100 >63, ,280 10,400 12,896 15,600 20,800 >20, ,975 14,250 17,670 21,375 28,500 >28, ,700 21,000 26,040 31,500 42,000 >42, ,810 8,300 10,292 12,450 16,600 >16, ,170 13,100 16,244 19,650 26,200 >26, ,545 19,350 23,994 29,025 38,700 >38,700
123
124 Appendix G Future Intersection Capacity Analysis Worksheets
125
126 Crosshaven Dr APPLE Future 2027 AM 1: Cahaba Heights Road & Crosshaven Dr Movement EBL EBT EBR WBL WBT WBR NBL NBT NBR SBL SBT SBR Lane Configurations Ideal Flow (vphpl) Total Lost time (s) Lane Util. Factor Frt Flt Protected Satd. Flow (prot) Flt Permitted Satd. Flow (perm) Volume (vph) Peak-hour factor, PHF Growth Factor (vph) 131% 131% 131% 131% 131% 131% 131% 131% 131% 131% 131% 131% Adj. Flow (vph) RTOR Reduction (vph) Lane Group Flow (vph) Turn Type pm+pt pm+pt pm+pt pm+pt Protected Phases Permitted Phases Actuated Green, G (s) Effective Green, g (s) Actuated g/c Ratio Clearance Time (s) Vehicle Extension (s) Lane Grp Cap (vph) v/s Ratio Prot c c0.45 c v/s Ratio Perm c v/c Ratio Uniform Delay, d Progression Factor Incremental Delay, d Delay (s) Level of Service C C B F F C C E Approach Delay (s) Approach LOS C F F D Intersection Summary HCM Average Control Delay 81.4 HCM Level of Service F HCM Volume to Capacity ratio 1.21 Actuated Cycle Length (s) 88.8 Sum of lost time (s) 12.0 Intersection Capacity Utilization 90.2% ICU Level of Service E Analysis Period (min) 15 c Critical Lane Group Timing Plan: Future 2027 AM Page 1 Skipper Consulting
127 Crosshaven Dr APPLE Future 2027 AM 2: Ridgley Dr & Crosshaven Dr Movement EBL EBT EBR WBL WBT WBR NBL NBT NBR SBL SBT SBR Lane Configurations Sign Control Stop Stop Free Free Grade 0% 0% 0% 0% Volume (veh/h) Peak Hour Factor Hourly flow rate (vph) Pedestrians Lane Width (ft) Walking Speed (ft/s) Percent Blockage Right turn flare (veh) Median type None None Median storage veh) Upstream signal (ft) 473 px, platoon unblocked vc, conflicting volume vc1, stage 1 conf vol vc2, stage 2 conf vol vcu, unblocked vol tc, single (s) tc, 2 stage (s) tf (s) p0 queue free % cm capacity (veh/h) Direction, Lane # EB 1 WB 1 NB 1 SB 1 Volume Total Volume Left Volume Right csh Volume to Capacity Queue Length 95th (ft) Control Delay (s) Lane LOS C D A A Approach Delay (s) Approach LOS C D Intersection Summary Average Delay 1.5 Intersection Capacity Utilization 45.3% ICU Level of Service A Analysis Period (min) 15 Timing Plan: Future 2027 AM Page 1 Skipper Consulting
128 Crosshaven Dr APPLE Future 2027 AM 3: Valley Park Dr & Crosshaven Dr Movement EBL EBT EBR WBL WBT WBR NBL NBT NBR SBL SBT SBR Lane Configurations Sign Control Stop Stop Free Free Grade 0% 0% 0% 0% Volume (veh/h) Peak Hour Factor Hourly flow rate (vph) Pedestrians Lane Width (ft) Walking Speed (ft/s) Percent Blockage Right turn flare (veh) Median type None None Median storage veh) Upstream signal (ft) px, platoon unblocked vc, conflicting volume vc1, stage 1 conf vol vc2, stage 2 conf vol vcu, unblocked vol tc, single (s) tc, 2 stage (s) tf (s) p0 queue free % cm capacity (veh/h) Direction, Lane # EB 1 WB 1 NB 1 SB 1 Volume Total Volume Left Volume Right csh Volume to Capacity Queue Length 95th (ft) Control Delay (s) Lane LOS C C A A Approach Delay (s) Approach LOS C C Intersection Summary Average Delay 0.9 Intersection Capacity Utilization 37.6% ICU Level of Service A Analysis Period (min) 15 Timing Plan: Future 2027 AM Page 2 Skipper Consulting
129 Crosshaven Dr APPLE Future 2027 AM 4: Green Valley Rd & Crosshaven Dr Movement EBL EBT EBR WBL WBT WBR WBR2 NBL2 NBL NBT NBR SBL Lane Configurations Ideal Flow (vphpl) Total Lost time (s) Lane Util. Factor Frt Flt Protected Satd. Flow (prot) Flt Permitted Satd. Flow (perm) Volume (vph) Peak-hour factor, PHF Growth Factor (vph) 131% 131% 131% 131% 131% 131% 131% 131% 131% 131% 131% 131% Adj. Flow (vph) RTOR Reduction (vph) Lane Group Flow (vph) Turn Type Perm Perm Perm Perm Perm Protected Phases 1 1 2! Permitted Phases ! 2! Actuated Green, G (s) Effective Green, g (s) Actuated g/c Ratio Clearance Time (s) Vehicle Extension (s) Lane Grp Cap (vph) v/s Ratio Prot v/s Ratio Perm 0.32 c0.47 c0.43 v/c Ratio Uniform Delay, d Progression Factor Incremental Delay, d Delay (s) Level of Service C F E Approach Delay (s) Approach LOS C F E Intersection Summary HCM Average Control Delay 66.9 HCM Level of Service E HCM Volume to Capacity ratio 1.09 Actuated Cycle Length (s) 45.0 Sum of lost time (s) 8.0 Intersection Capacity Utilization 113.5% ICU Level of Service H Analysis Period (min) 15! Phase conflict between lane groups. c Critical Lane Group Timing Plan: Future 2027 AM Page 2 Skipper Consulting
130 Crosshaven Dr APPLE Future 2027 AM 4: Green Valley Rd & Crosshaven Dr Movement SBT SBR SBR2 SEL2 SEL SER Lane Configurations Ideal Flow (vphpl) Total Lost time (s) Lane Util. Factor Frt Flt Protected Satd. Flow (prot) Flt Permitted Satd. Flow (perm) Volume (vph) Peak-hour factor, PHF Growth Factor (vph) 131% 131% 131% 131% 131% 131% Adj. Flow (vph) RTOR Reduction (vph) Lane Group Flow (vph) Turn Type custom Protected Phases 2! 2! Permitted Phases 1 Actuated Green, G (s) Effective Green, g (s) Actuated g/c Ratio Clearance Time (s) Vehicle Extension (s) Lane Grp Cap (vph) v/s Ratio Prot v/s Ratio Perm v/c Ratio Uniform Delay, d Progression Factor Incremental Delay, d Delay (s) Level of Service E A Approach Delay (s) Approach LOS E A Intersection Summary Timing Plan: Future 2027 AM Page 3 Skipper Consulting
131 Crosshaven Dr APPLE Future 2027 AM 5: Bearden Ct & Crosshaven Dr Movement EBL EBT EBR WBL WBT WBR NBL NBT NBR SBL SBT SBR Lane Configurations Sign Control Stop Stop Free Free Grade 0% 0% 0% 0% Volume (veh/h) Peak Hour Factor Hourly flow rate (vph) Pedestrians Lane Width (ft) Walking Speed (ft/s) Percent Blockage Right turn flare (veh) Median type None None Median storage veh) Upstream signal (ft) px, platoon unblocked vc, conflicting volume vc1, stage 1 conf vol vc2, stage 2 conf vol vcu, unblocked vol tc, single (s) tc, 2 stage (s) tf (s) p0 queue free % cm capacity (veh/h) Direction, Lane # EB 1 WB 1 NB 1 SB 1 Volume Total Volume Left Volume Right csh Volume to Capacity Queue Length 95th (ft) Control Delay (s) Lane LOS A D A Approach Delay (s) Approach LOS A D Intersection Summary Average Delay 1.3 Intersection Capacity Utilization 43.2% ICU Level of Service A Analysis Period (min) 15 Timing Plan: Future 2027 AM Page 3 Skipper Consulting
132 Crosshaven Dr APPLE Future 2027 AM 6: Greendale Dr & Crosshaven Dr Movement WBL WBR NBT NBR SBL SBT Lane Configurations Ideal Flow (vphpl) Total Lost time (s) Lane Util. Factor Frt Flt Protected Satd. Flow (prot) Flt Permitted Satd. Flow (perm) Volume (vph) Peak-hour factor, PHF Growth Factor (vph) 131% 131% 131% 131% 131% 131% Adj. Flow (vph) RTOR Reduction (vph) Lane Group Flow (vph) Turn Type Perm Protected Phases Permitted Phases 2 Actuated Green, G (s) Effective Green, g (s) Actuated g/c Ratio Clearance Time (s) Vehicle Extension (s) Lane Grp Cap (vph) v/s Ratio Prot c v/s Ratio Perm c0.36 v/c Ratio Uniform Delay, d Progression Factor Incremental Delay, d Delay (s) Level of Service B A A Approach Delay (s) Approach LOS B A A Intersection Summary HCM Average Control Delay 8.3 HCM Level of Service A HCM Volume to Capacity ratio 0.62 Actuated Cycle Length (s) 37.4 Sum of lost time (s) 8.0 Intersection Capacity Utilization 75.4% ICU Level of Service D Analysis Period (min) 15 c Critical Lane Group Timing Plan: Future 2027 AM Page 4 Skipper Consulting
133 Crosshaven Dr APPLE Future 2027 AM 7: Overton Rd & Crosshaven Dr Movement EBL EBT EBR WBL WBT WBR NBL NBT NBR SBL SBT SBR Lane Configurations Ideal Flow (vphpl) Total Lost time (s) Lane Util. Factor Frt Flt Protected Satd. Flow (prot) Flt Permitted Satd. Flow (perm) Volume (vph) Peak-hour factor, PHF Growth Factor (vph) 131% 131% 131% 131% 131% 131% 131% 131% 131% 131% 131% 131% Adj. Flow (vph) RTOR Reduction (vph) Lane Group Flow (vph) Turn Type Perm pm+pt Perm Perm Perm Protected Phases Permitted Phases Actuated Green, G (s) Effective Green, g (s) Actuated g/c Ratio Clearance Time (s) Vehicle Extension (s) Lane Grp Cap (vph) v/s Ratio Prot c0.56 v/s Ratio Perm 0.03 c0.39 c v/c Ratio Uniform Delay, d Progression Factor Incremental Delay, d Delay (s) Level of Service B D E D D B B Approach Delay (s) Approach LOS D D D B Intersection Summary HCM Average Control Delay 43.6 HCM Level of Service D HCM Volume to Capacity ratio 0.96 Actuated Cycle Length (s) 78.9 Sum of lost time (s) 8.0 Intersection Capacity Utilization 92.3% ICU Level of Service F Analysis Period (min) 15 c Critical Lane Group Timing Plan: Future 2027 AM Page 5 Skipper Consulting
134 Crosshaven Dr APPLE Future PM 1: Cahaba Heights Road & Crosshaven Dr Movement EBL EBT EBR WBL WBT WBR NBL NBT NBR SBL SBT SBR Lane Configurations Ideal Flow (vphpl) Total Lost time (s) Lane Util. Factor Frt Flt Protected Satd. Flow (prot) Flt Permitted Satd. Flow (perm) Volume (vph) Peak-hour factor, PHF Growth Factor (vph) 131% 131% 131% 131% 131% 131% 131% 131% 131% 131% 131% 131% Adj. Flow (vph) RTOR Reduction (vph) Lane Group Flow (vph) Turn Type pm+pt pm+pt pm+pt pm+pt Protected Phases Permitted Phases Actuated Green, G (s) Effective Green, g (s) Actuated g/c Ratio Clearance Time (s) Vehicle Extension (s) Lane Grp Cap (vph) v/s Ratio Prot c c v/s Ratio Perm 0.39 c c0.34 v/c Ratio Uniform Delay, d Progression Factor Incremental Delay, d Delay (s) Level of Service F E F D F F F F Approach Delay (s) Approach LOS E E F F Intersection Summary HCM Average Control Delay 86.4 HCM Level of Service F HCM Volume to Capacity ratio 1.13 Actuated Cycle Length (s) 90.0 Sum of lost time (s) 12.0 Intersection Capacity Utilization 98.8% ICU Level of Service F Analysis Period (min) 15 c Critical Lane Group Timing Plan: Future PM Page 1 Skipper Consulting
135 Crosshaven Dr APPLE Future PM 2: Ridgley Dr & Crosshaven Dr Movement EBL EBT EBR WBL WBT WBR NBL NBT NBR SBL SBT SBR Lane Configurations Sign Control Stop Stop Free Free Grade 0% 0% 0% 0% Volume (veh/h) Peak Hour Factor Hourly flow rate (vph) Pedestrians Lane Width (ft) Walking Speed (ft/s) Percent Blockage Right turn flare (veh) Median type None None Median storage veh) Upstream signal (ft) 473 px, platoon unblocked vc, conflicting volume vc1, stage 1 conf vol vc2, stage 2 conf vol vcu, unblocked vol tc, single (s) tc, 2 stage (s) tf (s) p0 queue free % cm capacity (veh/h) Direction, Lane # EB 1 WB 1 NB 1 SB 1 Volume Total Volume Left Volume Right csh Volume to Capacity Queue Length 95th (ft) Control Delay (s) Lane LOS C E A Approach Delay (s) Approach LOS C E Intersection Summary Average Delay 0.7 Intersection Capacity Utilization 49.1% ICU Level of Service A Analysis Period (min) 15 Timing Plan: Future PM Page 1 Skipper Consulting
136 Crosshaven Dr APPLE Future PM 3: Valley Park Dr & Crosshaven Dr Movement EBL EBT EBR WBL WBT WBR NBL NBT NBR SBL SBT SBR Lane Configurations Sign Control Stop Stop Free Free Grade 0% 0% 0% 0% Volume (veh/h) Peak Hour Factor Hourly flow rate (vph) Pedestrians Lane Width (ft) Walking Speed (ft/s) Percent Blockage Right turn flare (veh) Median type None None Median storage veh) Upstream signal (ft) px, platoon unblocked vc, conflicting volume vc1, stage 1 conf vol vc2, stage 2 conf vol vcu, unblocked vol tc, single (s) tc, 2 stage (s) tf (s) p0 queue free % cm capacity (veh/h) Direction, Lane # EB 1 WB 1 NB 1 SB 1 Volume Total Volume Left Volume Right csh Volume to Capacity Queue Length 95th (ft) Control Delay (s) Lane LOS C D A A Approach Delay (s) Approach LOS C D Intersection Summary Average Delay 0.5 Intersection Capacity Utilization 46.6% ICU Level of Service A Analysis Period (min) 15 Timing Plan: Future PM Page 2 Skipper Consulting
137 Crosshaven Dr APPLE Future PM 4: Green Valley Rd & Crosshaven Dr Movement EBL2 EBL EBT EBR WBL WBT WBR WBR2 NBL2 NBL NBT NBR Lane Configurations Ideal Flow (vphpl) Total Lost time (s) Lane Util. Factor Frt Flt Protected Satd. Flow (prot) Flt Permitted Satd. Flow (perm) Volume (vph) Peak-hour factor, PHF Growth Factor (vph) 131% 131% 131% 131% 131% 131% 131% 131% 131% 131% 131% 131% Adj. Flow (vph) RTOR Reduction (vph) Lane Group Flow (vph) Turn Type Perm Perm Perm Perm Perm Protected Phases 1 1 2! Permitted Phases 1! ! Actuated Green, G (s) Effective Green, g (s) Actuated g/c Ratio Clearance Time (s) Vehicle Extension (s) Lane Grp Cap (vph) v/s Ratio Prot v/s Ratio Perm c c0.44 v/c Ratio Uniform Delay, d Progression Factor Incremental Delay, d Delay (s) Level of Service F A F Approach Delay (s) Approach LOS F A F Intersection Summary HCM Average Control Delay 72.0 HCM Level of Service E HCM Volume to Capacity ratio 1.15 Actuated Cycle Length (s) 45.0 Sum of lost time (s) 8.0 Intersection Capacity Utilization 111.1% ICU Level of Service H Analysis Period (min) 15! Phase conflict between lane groups. c Critical Lane Group Timing Plan: Future PM Page 2 Skipper Consulting
138 Crosshaven Dr APPLE Future PM 4: Green Valley Rd & Crosshaven Dr Movement SBL SBT SBR SBR2 SEL2 SEL SER Lane Configurations Ideal Flow (vphpl) Total Lost time (s) Lane Util. Factor Frt Flt Protected Satd. Flow (prot) Flt Permitted Satd. Flow (perm) Volume (vph) Peak-hour factor, PHF Growth Factor (vph) 131% 131% 131% 131% 131% 131% 131% Adj. Flow (vph) RTOR Reduction (vph) Lane Group Flow (vph) Turn Type Perm custom Protected Phases 2! 2! Permitted Phases 2! 1! Actuated Green, G (s) Effective Green, g (s) Actuated g/c Ratio Clearance Time (s) Vehicle Extension (s) Lane Grp Cap (vph) v/s Ratio Prot v/s Ratio Perm v/c Ratio Uniform Delay, d Progression Factor Incremental Delay, d Delay (s) Level of Service D A Approach Delay (s) Approach LOS D A Intersection Summary Timing Plan: Future PM Page 3 Skipper Consulting
139 Crosshaven Dr APPLE Future PM 5: Bearden Ct & Crosshaven Dr Movement EBL EBT EBR WBL WBT WBR NBL NBT NBR SBL SBT SBR Lane Configurations Sign Control Stop Stop Free Free Grade 0% 0% 0% 0% Volume (veh/h) Peak Hour Factor Hourly flow rate (vph) Pedestrians Lane Width (ft) Walking Speed (ft/s) Percent Blockage Right turn flare (veh) Median type None None Median storage veh) Upstream signal (ft) px, platoon unblocked vc, conflicting volume vc1, stage 1 conf vol vc2, stage 2 conf vol vcu, unblocked vol tc, single (s) tc, 2 stage (s) tf (s) p0 queue free % cm capacity (veh/h) Direction, Lane # EB 1 WB 1 NB 1 SB 1 Volume Total Volume Left Volume Right csh Volume to Capacity Queue Length 95th (ft) Control Delay (s) Lane LOS F F A Approach Delay (s) Approach LOS F F Intersection Summary Average Delay 13.1 Intersection Capacity Utilization 74.1% ICU Level of Service D Analysis Period (min) 15 Timing Plan: Future PM Page 3 Skipper Consulting
140 Crosshaven Dr APPLE Future PM 6: Greendale Dr & Crosshaven Dr Movement WBL WBR NBT NBR SBL SBT Lane Configurations Ideal Flow (vphpl) Total Lost time (s) Lane Util. Factor Frt Flt Protected Satd. Flow (prot) Flt Permitted Satd. Flow (perm) Volume (vph) Peak-hour factor, PHF Growth Factor (vph) 131% 131% 131% 131% 131% 131% Adj. Flow (vph) RTOR Reduction (vph) Lane Group Flow (vph) Turn Type Perm Protected Phases Permitted Phases 2 Actuated Green, G (s) Effective Green, g (s) Actuated g/c Ratio Clearance Time (s) Vehicle Extension (s) Lane Grp Cap (vph) v/s Ratio Prot c0.06 c0.55 v/s Ratio Perm 0.45 v/c Ratio Uniform Delay, d Progression Factor Incremental Delay, d Delay (s) Level of Service C A A Approach Delay (s) Approach LOS C A A Intersection Summary HCM Average Control Delay 6.7 HCM Level of Service A HCM Volume to Capacity ratio 0.70 Actuated Cycle Length (s) 60.6 Sum of lost time (s) 8.0 Intersection Capacity Utilization 96.4% ICU Level of Service F Analysis Period (min) 15 c Critical Lane Group Timing Plan: Future PM Page 4 Skipper Consulting
141 Crosshaven Dr APPLE Future PM 7: Overton Rd & Crosshaven Dr Movement EBL EBT EBR WBL WBT WBR NBL NBT NBR SBL SBT SBR Lane Configurations Ideal Flow (vphpl) Total Lost time (s) Lane Util. Factor Frt Flt Protected Satd. Flow (prot) Flt Permitted Satd. Flow (perm) Volume (vph) Peak-hour factor, PHF Growth Factor (vph) 131% 131% 131% 131% 131% 131% 131% 131% 131% 131% 131% 131% Adj. Flow (vph) RTOR Reduction (vph) Lane Group Flow (vph) Turn Type Perm pm+pt Perm Perm Perm Protected Phases Permitted Phases Actuated Green, G (s) Effective Green, g (s) Actuated g/c Ratio Clearance Time (s) Vehicle Extension (s) Lane Grp Cap (vph) v/s Ratio Prot 0.48 c v/s Ratio Perm 0.01 c0.58 c v/c Ratio Uniform Delay, d Progression Factor Incremental Delay, d Delay (s) Level of Service B E F A D D C Approach Delay (s) Approach LOS E D D C Intersection Summary HCM Average Control Delay 49.3 HCM Level of Service D HCM Volume to Capacity ratio 1.03 Actuated Cycle Length (s) 79.4 Sum of lost time (s) 8.0 Intersection Capacity Utilization 91.3% ICU Level of Service F Analysis Period (min) 15 c Critical Lane Group Timing Plan: Future PM Page 5 Skipper Consulting
142 Appendix H Future Queue Calculation Worksheets
143
144 Crosshaven Dr APPLE Future 2027 AM 1: Cahaba Heights Road & Crosshaven Dr Lane Group EBL EBT WBL WBT NBL NBT SBL SBT Lane Group Flow (vph) v/c Ratio Control Delay Queue Delay Total Delay Queue Length 50th (ft) ~503 ~ Queue Length 95th (ft) #700 # #350 Internal Link Dist (ft) Turn Bay Length (ft) Base Capacity (vph) Starvation Cap Reductn Spillback Cap Reductn Storage Cap Reductn Reduced v/c Ratio Intersection Summary ~ Volume exceeds capacity, queue is theoretically infinite. Queue shown is maximum after two cycles. # 95th percentile volume exceeds capacity, queue may be longer. Queue shown is maximum after two cycles. Timing Plan: Future 2027 AM Page 1 Skipper Consulting
145 Crosshaven Dr APPLE Future 2027 AM 4: Green Valley Rd & Crosshaven Dr Lane Group EBT WBT NBT SBT SEL Lane Group Flow (vph) v/c Ratio Control Delay Queue Delay Total Delay Queue Length 50th (ft) 43 ~252 ~207 ~115 3 Queue Length 95th (ft) #107 #340 #356 #248 8 Internal Link Dist (ft) Turn Bay Length (ft) Base Capacity (vph) Starvation Cap Reductn Spillback Cap Reductn Storage Cap Reductn Reduced v/c Ratio Intersection Summary ~ Volume exceeds capacity, queue is theoretically infinite. Queue shown is maximum after two cycles. # 95th percentile volume exceeds capacity, queue may be longer. Queue shown is maximum after two cycles. Timing Plan: Future 2027 AM Page 2 Skipper Consulting
146 Crosshaven Dr APPLE Future 2027 AM 6: Greendale Dr & Crosshaven Dr Lane Group WBL NBT SBT Lane Group Flow (vph) v/c Ratio Control Delay Queue Delay Total Delay Queue Length 50th (ft) Queue Length 95th (ft) #180 Internal Link Dist (ft) Turn Bay Length (ft) Base Capacity (vph) Starvation Cap Reductn Spillback Cap Reductn Storage Cap Reductn Reduced v/c Ratio Intersection Summary # 95th percentile volume exceeds capacity, queue may be longer. Queue shown is maximum after two cycles. Timing Plan: Future 2027 AM Page 3 Skipper Consulting
147 Crosshaven Dr APPLE Future 2027 AM 7: Overton Rd & Crosshaven Dr Lane Group EBL EBT WBL WBT NBT NBR SBT Lane Group Flow (vph) v/c Ratio Control Delay Queue Delay Total Delay Queue Length 50th (ft) ~150 ~ Queue Length 95th (ft) 12 #368 #328 #754 # Internal Link Dist (ft) Turn Bay Length (ft) Base Capacity (vph) Starvation Cap Reductn Spillback Cap Reductn Storage Cap Reductn Reduced v/c Ratio Intersection Summary ~ Volume exceeds capacity, queue is theoretically infinite. Queue shown is maximum after two cycles. # 95th percentile volume exceeds capacity, queue may be longer. Queue shown is maximum after two cycles. Timing Plan: Future 2027 AM Page 4 Skipper Consulting
148 Crosshaven Dr APPLE Future PM 1: Cahaba Heights Road & Crosshaven Dr Lane Group EBL EBT WBL WBT NBL NBT SBL SBT Lane Group Flow (vph) v/c Ratio Control Delay Queue Delay Total Delay Queue Length 50th (ft) ~59 ~367 ~ ~99 ~327 ~107 ~350 Queue Length 95th (ft) #173 #604 #223 #463 #245 #526 #253 #550 Internal Link Dist (ft) Turn Bay Length (ft) Base Capacity (vph) Starvation Cap Reductn Spillback Cap Reductn Storage Cap Reductn Reduced v/c Ratio Intersection Summary ~ Volume exceeds capacity, queue is theoretically infinite. Queue shown is maximum after two cycles. # 95th percentile volume exceeds capacity, queue may be longer. Queue shown is maximum after two cycles. Timing Plan: Future PM Page 1 Skipper Consulting
149 Crosshaven Dr APPLE Future PM 4: Green Valley Rd & Crosshaven Dr Lane Group EBT WBT NBT SBT SEL Lane Group Flow (vph) v/c Ratio Control Delay Queue Delay Total Delay Queue Length 50th (ft) ~ ~211 ~149 9 Queue Length 95th (ft) # #360 # Internal Link Dist (ft) Turn Bay Length (ft) Base Capacity (vph) Starvation Cap Reductn Spillback Cap Reductn Storage Cap Reductn Reduced v/c Ratio Intersection Summary ~ Volume exceeds capacity, queue is theoretically infinite. Queue shown is maximum after two cycles. # 95th percentile volume exceeds capacity, queue may be longer. Queue shown is maximum after two cycles. Timing Plan: Future PM Page 2 Skipper Consulting
150 Crosshaven Dr APPLE Future PM 6: Greendale Dr & Crosshaven Dr Lane Group WBL NBT SBT Lane Group Flow (vph) v/c Ratio Control Delay Queue Delay Total Delay Queue Length 50th (ft) Queue Length 95th (ft) 44 #382 #312 Internal Link Dist (ft) Turn Bay Length (ft) Base Capacity (vph) Starvation Cap Reductn Spillback Cap Reductn Storage Cap Reductn Reduced v/c Ratio Intersection Summary # 95th percentile volume exceeds capacity, queue may be longer. Queue shown is maximum after two cycles. Timing Plan: Future PM Page 3 Skipper Consulting
151 Crosshaven Dr APPLE Future PM 7: Overton Rd & Crosshaven Dr Lane Group EBL EBT WBL WBT NBT NBR SBT Lane Group Flow (vph) v/c Ratio Control Delay Queue Delay Total Delay Queue Length 50th (ft) 2 ~433 ~ Queue Length 95th (ft) 8 #652 # #217 # Internal Link Dist (ft) Turn Bay Length (ft) Base Capacity (vph) Starvation Cap Reductn Spillback Cap Reductn Storage Cap Reductn Reduced v/c Ratio Intersection Summary ~ Volume exceeds capacity, queue is theoretically infinite. Queue shown is maximum after two cycles. # 95th percentile volume exceeds capacity, queue may be longer. Queue shown is maximum after two cycles. Timing Plan: Future PM Page 4 Skipper Consulting
152 Appendix I Future Roadway Segment Capacity Analysis Worksheets
153
154 Directional file:///c:/users/rcaudle/appdata/local/temp/s2kcc2e.tmp Page 1 of 2 6/14/2017 General Information DIRECTIONAL TWO-LANE HIGHWAY SEGMENT WORKSHEET Analyst RLC Agency or Company Skipper Consulting Date Performed 5/22/2017 Analysis Time Period AM Peak Project Description: Croisshaven APPLE Input Data Site Information Highway / Direction of Travel Crosshaven Drive From/To Cahaba Heights to Green Valley Jurisdiction City of Vestavia Hills Analysis Year Future 2027 Analysis direction vol., V d 590veh/h Opposing direction vol., V o 479veh/h Shoulder width ft 2.0 Lane Width ft 12.0 Segment Length mi 0.4 Average Travel Speed Analysis Direction (d) Class I highway Class II highway Class III highway Terrain Level Rolling Grade Length mi Up/down Peak-hour factor, PHF 0.87 No-passing zone 100% % Trucks and Buses, P T 5 % % Recreational vehicles, P R 0% Access points mi 40/mi Opposing Direction (o) Passenger-car equivalents for trucks, E T (Exhibit or 15-12) Passenger-car equivalents for RVs, E R (Exhibit or 15-13) Heavy-vehicle adjustment factor, f HV,ATS =1/ (1+ P T (E T -1)+P R (E R -1) ) Grade adjustment factor 1, f g,ats (Exhibit 15-9) Demand flow rate 2, v i (pc/h) v i =V i / (PHF* f g,ats * f HV,ATS ) Free-Flow Speed from Field Measurement Estimated Free-Flow Speed Base free-flow speed 4, BFFS mi/h Mean speed of sample 3, S FM 37 Total demand flow rate, both directions, v Free-flow speed, FFS=S FM (v/ f HV,ATS ) Adj. for no-passing zones, f np,ats (Exhibit 15-15) 1.8 mi/h Percent Time-Spent-Following Adj. for lane and shoulder width, 4 f LS (Exhibit 15-7) mi/h Adj. for access points 4, f A (Exhibit 15-8) mi/h Free-flow speed, FFS (FSS=BFFS-f LS -f A ) 43.5 mi/h Average travel speed, ATS d =FFS (v d,ats mi/h v o,ats ) - f np,ats Percent free flow speed, PFFS 72.5 % Analysis Direction (d) Opposing Direction (o) Passenger-car equivalents for trucks, E T (Exhibit or 15-19) Passenger-car equivalents for RVs, E R (Exhibit or 15-19) Heavy-vehicle adjustment factor, f HV =1/ (1+ P T (E T -1)+P R (E R -1) ) Grade adjustment factor 1, f g,ptsf (Exhibit or Ex 15-17) Directional flow rate 2, v i (pc/h) v i =V i /(PHF*f HV,PTSF * f g,ptsf ) Base percent time-spent-following 4, BPTSF d (%)=100(1-e av d b ) 62.5 Adj. for no-passing zone, f np,ptsf (Exhibit 15-21) 31.7 Percent time-spent-following, PTSF (%)=BPTSF +f d d np,ptsf *(v d,ptsf / v d,ptsf v o,ptsf ) Level of Service and Other Performance Measures Level of service, LOS (Exhibit 15-3) D Volume to capacity ratio, v/c 0.53
155 Directional file:///c:/users/rcaudle/appdata/local/temp/s2kcc2e.tmp Page 2 of 2 6/14/2017 Capacity, C d,ats (Equation 15-12) veh/h 1675 Capacity, C d,ptsf (Equation 15-13) veh/h 1700 Percent Free-Flow Speed PFFS d (Equation Class III only) 72.5 Bicycle Level of Service Directional demand flow rate in outside lane, v OL (Eq ) veh/h Effective width, Wv (Eq ) ft Effective speed factor, S t (Eq ) 2.61 Bicycle level of service score, BLOS (Eq ) 4.37 Bicycle level of service (Exhibit 15-4) Notes 1. Note that the adjustment factor for level terrain is 1.00,as level terrain is one of the base conditions. For the purpose of grade adjustment, specific downgrade segments are treated as level terrain. 2. If v i (v d or v o ) >=1,700 pc/h, terminate analysis--the LOS is F. 3. For the analysis direction only and for v>200 veh/h. 4. For the analysis direction only 5. Exhibit provides coefficients a and b for Equation Use alternative Exhibit if some trucks operate at crawl speeds on a specific downgrade. Copyright 2016 University of Florida, All Rights Reserved HCS7 TM TwoLane Version 7.1 Generated: 6/14/2017 2:02 PM D
156 Directional file:///c:/users/rcaudle/appdata/local/temp/s2k1963.tmp Page 1 of 2 6/14/2017 General Information DIRECTIONAL TWO-LANE HIGHWAY SEGMENT WORKSHEET Analyst RLC Agency or Company Skipper Consulting Date Performed 5/22/2017 Analysis Time Period PM Peak Project Description: Croisshaven APPLE Input Data Site Information Highway / Direction of Travel Crosshaven Drive From/To Cahaba Heights to Green Valley Jurisdiction City of Vestavia Hills Analysis Year Future 2027 Analysis direction vol., V d 614veh/h Opposing direction vol., V o 523veh/h Shoulder width ft 2.0 Lane Width ft 12.0 Segment Length mi 0.4 Average Travel Speed Analysis Direction (d) Class I highway Class II highway Class III highway Terrain Level Rolling Grade Length mi Up/down Peak-hour factor, PHF 0.95 No-passing zone 100% % Trucks and Buses, P T 5 % % Recreational vehicles, P R 0% Access points mi 40/mi Opposing Direction (o) Passenger-car equivalents for trucks, E T (Exhibit or 15-12) Passenger-car equivalents for RVs, E R (Exhibit or 15-13) Heavy-vehicle adjustment factor, f HV,ATS =1/ (1+ P T (E T -1)+P R (E R -1) ) Grade adjustment factor 1, f g,ats (Exhibit 15-9) Demand flow rate 2, v i (pc/h) v i =V i / (PHF* f g,ats * f HV,ATS ) Free-Flow Speed from Field Measurement Estimated Free-Flow Speed Base free-flow speed 4, BFFS mi/h Mean speed of sample 3, S FM 37 Total demand flow rate, both directions, v Free-flow speed, FFS=S FM (v/ f HV,ATS ) Adj. for no-passing zones, f np,ats (Exhibit 15-15) 1.8 mi/h Percent Time-Spent-Following Adj. for lane and shoulder width, 4 f LS (Exhibit 15-7) mi/h Adj. for access points 4, f A (Exhibit 15-8) mi/h Free-flow speed, FFS (FSS=BFFS-f LS -f A ) 43.6 mi/h Average travel speed, ATS d =FFS (v d,ats mi/h v o,ats ) - f np,ats Percent free flow speed, PFFS 72.9 % Analysis Direction (d) Opposing Direction (o) Passenger-car equivalents for trucks, E T (Exhibit or 15-19) Passenger-car equivalents for RVs, E R (Exhibit or 15-19) Heavy-vehicle adjustment factor, f HV =1/ (1+ P T (E T -1)+P R (E R -1) ) Grade adjustment factor 1, f g,ptsf (Exhibit or Ex 15-17) Directional flow rate 2, v i (pc/h) v i =V i /(PHF*f HV,PTSF * f g,ptsf ) Base percent time-spent-following 4, BPTSF d (%)=100(1-e av d b ) 61.3 Adj. for no-passing zone, f np,ptsf (Exhibit 15-21) 32.6 Percent time-spent-following, PTSF (%)=BPTSF +f d d np,ptsf *(v d,ptsf / v d,ptsf v o,ptsf ) Level of Service and Other Performance Measures Level of service, LOS (Exhibit 15-3) D Volume to capacity ratio, v/c 0.53
157 Directional file:///c:/users/rcaudle/appdata/local/temp/s2k1963.tmp Page 2 of 2 6/14/2017 Capacity, C d,ats (Equation 15-12) veh/h 1675 Capacity, C d,ptsf (Equation 15-13) veh/h 1700 Percent Free-Flow Speed PFFS d (Equation Class III only) 72.9 Bicycle Level of Service Directional demand flow rate in outside lane, v OL (Eq ) veh/h Effective width, Wv (Eq ) ft Effective speed factor, S t (Eq ) 2.61 Bicycle level of service score, BLOS (Eq ) 4.35 Bicycle level of service (Exhibit 15-4) Notes 1. Note that the adjustment factor for level terrain is 1.00,as level terrain is one of the base conditions. For the purpose of grade adjustment, specific downgrade segments are treated as level terrain. 2. If v i (v d or v o ) >=1,700 pc/h, terminate analysis--the LOS is F. 3. For the analysis direction only and for v>200 veh/h. 4. For the analysis direction only 5. Exhibit provides coefficients a and b for Equation Use alternative Exhibit if some trucks operate at crawl speeds on a specific downgrade. Copyright 2016 University of Florida, All Rights Reserved HCS7 TM TwoLane Version 7.1 Generated: 6/14/2017 2:05 PM D
158 Directional file:///c:/users/rcaudle/appdata/local/temp/s2k66e7.tmp Page 1 of 2 6/14/2017 General Information DIRECTIONAL TWO-LANE HIGHWAY SEGMENT WORKSHEET Analyst RLC Agency or Company Skipper Consulting Date Performed 5/22/2017 Analysis Time Period AM Peak Project Description: Croisshaven APPLE Input Data Site Information Highway / Direction of Travel Crosshaven Drive From/To Green Valley to Overton Rd Jurisdiction City of Vestavia Hills Analysis Year Future 2027 Analysis direction vol., V d 563veh/h Opposing direction vol., V o 461veh/h Shoulder width ft 2.0 Lane Width ft 12.0 Segment Length mi 0.5 Average Travel Speed Analysis Direction (d) Class I highway Class II highway Class III highway Terrain Level Rolling Grade Length mi Up/down Peak-hour factor, PHF 0.90 No-passing zone 100% % Trucks and Buses, P T 5 % % Recreational vehicles, P R 0% Access points mi 25/mi Opposing Direction (o) Passenger-car equivalents for trucks, E T (Exhibit or 15-12) Passenger-car equivalents for RVs, E R (Exhibit or 15-13) Heavy-vehicle adjustment factor, f HV,ATS =1/ (1+ P T (E T -1)+P R (E R -1) ) Grade adjustment factor 1, f g,ats (Exhibit 15-9) Demand flow rate 2, v i (pc/h) v i =V i / (PHF* f g,ats * f HV,ATS ) Free-Flow Speed from Field Measurement Estimated Free-Flow Speed Base free-flow speed 4, BFFS mi/h Mean speed of sample 3, S FM 35 Total demand flow rate, both directions, v Free-flow speed, FFS=S FM (v/ f HV,ATS ) Adj. for no-passing zones, f np,ats (Exhibit 15-15) 2.0 mi/h Percent Time-Spent-Following Adj. for lane and shoulder width, 4 f LS (Exhibit 15-7) mi/h Adj. for access points 4, f A (Exhibit 15-8) mi/h Free-flow speed, FFS (FSS=BFFS-f LS -f A ) 41.3 mi/h Average travel speed, ATS d =FFS (v d,ats mi/h v o,ats ) - f np,ats Percent free flow speed, PFFS 72.1 % Analysis Direction (d) Opposing Direction (o) Passenger-car equivalents for trucks, E T (Exhibit or 15-19) Passenger-car equivalents for RVs, E R (Exhibit or 15-19) Heavy-vehicle adjustment factor, f HV =1/ (1+ P T (E T -1)+P R (E R -1) ) Grade adjustment factor 1, f g,ptsf (Exhibit or Ex 15-17) Directional flow rate 2, v i (pc/h) v i =V i /(PHF*f HV,PTSF * f g,ptsf ) Base percent time-spent-following 4, BPTSF d (%)=100(1-e av d b ) 60.0 Adj. for no-passing zone, f np,ptsf (Exhibit 15-21) 33.9 Percent time-spent-following, PTSF (%)=BPTSF +f d d np,ptsf *(v d,ptsf / v d,ptsf v o,ptsf ) Level of Service and Other Performance Measures Level of service, LOS (Exhibit 15-3) D Volume to capacity ratio, v/c 0.53
159 Directional file:///c:/users/rcaudle/appdata/local/temp/s2k66e7.tmp Page 2 of 2 6/14/2017 Capacity, C d,ats (Equation 15-12) veh/h 1675 Capacity, C d,ptsf (Equation 15-13) veh/h 1700 Percent Free-Flow Speed PFFS d (Equation Class III only) 72.1 Bicycle Level of Service Directional demand flow rate in outside lane, v OL (Eq ) veh/h Effective width, Wv (Eq ) ft Effective speed factor, S t (Eq ) 2.61 Bicycle level of service score, BLOS (Eq ) 4.33 Bicycle level of service (Exhibit 15-4) Notes 1. Note that the adjustment factor for level terrain is 1.00,as level terrain is one of the base conditions. For the purpose of grade adjustment, specific downgrade segments are treated as level terrain. 2. If v i (v d or v o ) >=1,700 pc/h, terminate analysis--the LOS is F. 3. For the analysis direction only and for v>200 veh/h. 4. For the analysis direction only 5. Exhibit provides coefficients a and b for Equation Use alternative Exhibit if some trucks operate at crawl speeds on a specific downgrade. Copyright 2016 University of Florida, All Rights Reserved HCS7 TM TwoLane Version 7.1 Generated: 6/14/2017 2:07 PM D
160 Directional file:///c:/users/rcaudle/appdata/local/temp/s2k3147.tmp Page 1 of 2 6/14/2017 General Information DIRECTIONAL TWO-LANE HIGHWAY SEGMENT WORKSHEET Analyst RLC Agency or Company Skipper Consulting Date Performed 5/22/2017 Analysis Time Period PM Peak Project Description: Croisshaven APPLE Input Data Site Information Highway / Direction of Travel Crosshaven Drive From/To Green Valley to Overton Rd Jurisdiction City of Vestavia Hills Analysis Year Future 2027 Analysis direction vol., V d 741veh/h Opposing direction vol., V o 647veh/h Shoulder width ft 2.0 Lane Width ft 12.0 Segment Length mi 0.5 Average Travel Speed Analysis Direction (d) Class I highway Class II highway Class III highway Terrain Level Rolling Grade Length mi Up/down Peak-hour factor, PHF 0.91 No-passing zone 100% % Trucks and Buses, P T 5 % % Recreational vehicles, P R 0% Access points mi 25/mi Opposing Direction (o) Passenger-car equivalents for trucks, E T (Exhibit or 15-12) Passenger-car equivalents for RVs, E R (Exhibit or 15-13) Heavy-vehicle adjustment factor, f HV,ATS =1/ (1+ P T (E T -1)+P R (E R -1) ) Grade adjustment factor 1, f g,ats (Exhibit 15-9) Demand flow rate 2, v i (pc/h) v i =V i / (PHF* f g,ats * f HV,ATS ) Free-Flow Speed from Field Measurement Estimated Free-Flow Speed Base free-flow speed 4, BFFS mi/h Mean speed of sample 3, S FM 35 Total demand flow rate, both directions, v Free-flow speed, FFS=S FM (v/ f HV,ATS ) Adj. for no-passing zones, f np,ats (Exhibit 15-15) 1.4 mi/h Percent Time-Spent-Following Adj. for lane and shoulder width, 4 f LS (Exhibit 15-7) mi/h Adj. for access points 4, f A (Exhibit 15-8) mi/h Free-flow speed, FFS (FSS=BFFS-f LS -f A ) 43.4 mi/h Average travel speed, ATS d =FFS (v d,ats mi/h v o,ats ) - f np,ats Percent free flow speed, PFFS 68.5 % Analysis Direction (d) Opposing Direction (o) Passenger-car equivalents for trucks, E T (Exhibit or 15-19) Passenger-car equivalents for RVs, E R (Exhibit or 15-19) Heavy-vehicle adjustment factor, f HV =1/ (1+ P T (E T -1)+P R (E R -1) ) Grade adjustment factor 1, f g,ptsf (Exhibit or Ex 15-17) Directional flow rate 2, v i (pc/h) v i =V i /(PHF*f HV,PTSF * f g,ptsf ) Base percent time-spent-following 4, BPTSF d (%)=100(1-e av d b ) 69.1 Adj. for no-passing zone, f np,ptsf (Exhibit 15-21) 26.0 Percent time-spent-following, PTSF (%)=BPTSF +f d d np,ptsf *(v d,ptsf / v d,ptsf v o,ptsf ) Level of Service and Other Performance Measures Level of service, LOS (Exhibit 15-3) D Volume to capacity ratio, v/c 0.53
161 Directional file:///c:/users/rcaudle/appdata/local/temp/s2k3147.tmp Page 2 of 2 6/14/2017 Capacity, C d,ats (Equation 15-12) veh/h 1675 Capacity, C d,ptsf (Equation 15-13) veh/h 1700 Percent Free-Flow Speed PFFS d (Equation Class III only) 68.5 Bicycle Level of Service Directional demand flow rate in outside lane, v OL (Eq ) veh/h Effective width, Wv (Eq ) ft Effective speed factor, S t (Eq ) 2.61 Bicycle level of service score, BLOS (Eq ) 4.47 Bicycle level of service (Exhibit 15-4) Notes 1. Note that the adjustment factor for level terrain is 1.00,as level terrain is one of the base conditions. For the purpose of grade adjustment, specific downgrade segments are treated as level terrain. 2. If v i (v d or v o ) >=1,700 pc/h, terminate analysis--the LOS is F. 3. For the analysis direction only and for v>200 veh/h. 4. For the analysis direction only 5. Exhibit provides coefficients a and b for Equation Use alternative Exhibit if some trucks operate at crawl speeds on a specific downgrade. Copyright 2016 University of Florida, All Rights Reserved HCS7 TM TwoLane Version 7.1 Generated: 6/14/2017 2:09 PM D
162 Appendix J Future Intersection Capacity Analysis Worksheets with Improvements
163
164 Crosshaven Dr APPLE Future AM w/imp 1: Cahaba Heights Road & Crosshaven Dr Movement EBL EBT EBR WBL WBT WBR NBL NBT NBR SBL SBT SBR Lane Configurations Ideal Flow (vphpl) Total Lost time (s) Lane Util. Factor Frt Flt Protected Satd. Flow (prot) Flt Permitted Satd. Flow (perm) Volume (vph) Peak-hour factor, PHF Growth Factor (vph) 131% 131% 131% 131% 131% 131% 131% 131% 131% 131% 131% 131% Adj. Flow (vph) RTOR Reduction (vph) Lane Group Flow (vph) Turn Type pm+pt Perm pm+pt Perm pm+pt pm+pt Perm Protected Phases Permitted Phases Actuated Green, G (s) Effective Green, g (s) Actuated g/c Ratio Clearance Time (s) Vehicle Extension (s) Lane Grp Cap (vph) v/s Ratio Prot c c0.37 c v/s Ratio Perm c v/c Ratio Uniform Delay, d Progression Factor Incremental Delay, d Delay (s) Level of Service D C B B D B D C C D C Approach Delay (s) Approach LOS C D D D Intersection Summary HCM Average Control Delay 39.5 HCM Level of Service D HCM Volume to Capacity ratio 0.89 Actuated Cycle Length (s) 88.3 Sum of lost time (s) 8.0 Intersection Capacity Utilization 78.2% ICU Level of Service D Analysis Period (min) 15 c Critical Lane Group Timing Plan: Future AM w/im Page 1 Skipper Consulting
165 Crosshaven Dr APPLE Future AM w/imp 2: Ridgley Dr & Crosshaven Dr Movement EBL EBT EBR WBL WBT WBR NBL NBT NBR SBL SBT SBR Lane Configurations Sign Control Stop Stop Free Free Grade 0% 0% 0% 0% Volume (veh/h) Peak Hour Factor Hourly flow rate (vph) Pedestrians Lane Width (ft) Walking Speed (ft/s) Percent Blockage Right turn flare (veh) Median type None None Median storage veh) Upstream signal (ft) 473 px, platoon unblocked vc, conflicting volume vc1, stage 1 conf vol vc2, stage 2 conf vol vcu, unblocked vol tc, single (s) tc, 2 stage (s) tf (s) p0 queue free % cm capacity (veh/h) Direction, Lane # EB 1 WB 1 NB 1 NB 2 SB 1 SB 2 Volume Total Volume Left Volume Right csh Volume to Capacity Queue Length 95th (ft) Control Delay (s) Lane LOS C D A A Approach Delay (s) Approach LOS C D Intersection Summary Average Delay 1.4 Intersection Capacity Utilization 39.9% ICU Level of Service A Analysis Period (min) 15 Timing Plan: Future AM w/im Page 1 Skipper Consulting
166 Crosshaven Dr APPLE Future AM w/imp 3: Valley Park Dr & Crosshaven Dr Movement EBL EBT EBR WBL WBT WBR NBL NBT NBR SBL SBT SBR Lane Configurations Sign Control Stop Stop Free Free Grade 0% 0% 0% 0% Volume (veh/h) Peak Hour Factor Hourly flow rate (vph) Pedestrians Lane Width (ft) Walking Speed (ft/s) Percent Blockage Right turn flare (veh) Median type None None Median storage veh) Upstream signal (ft) px, platoon unblocked vc, conflicting volume vc1, stage 1 conf vol vc2, stage 2 conf vol vcu, unblocked vol tc, single (s) tc, 2 stage (s) tf (s) p0 queue free % cm capacity (veh/h) Direction, Lane # EB 1 WB 1 NB 1 NB 2 SB 1 SB 2 Volume Total Volume Left Volume Right csh Volume to Capacity Queue Length 95th (ft) Control Delay (s) Lane LOS C C A A Approach Delay (s) Approach LOS C C Intersection Summary Average Delay 0.8 Intersection Capacity Utilization 35.8% ICU Level of Service A Analysis Period (min) 15 Timing Plan: Future AM w/im Page 2 Skipper Consulting
167 Crosshaven Dr APPLE Future AM w/imp 4: Green Valley Rd & Crosshaven Dr Movement EBL EBT EBR WBL WBT WBR WBR2 NBL2 NBL NBT NBR SBL Lane Configurations Ideal Flow (vphpl) Total Lost time (s) Lane Util. Factor Frt Flt Protected Satd. Flow (prot) Flt Permitted Satd. Flow (perm) Volume (vph) Peak-hour factor, PHF Growth Factor (vph) 131% 131% 131% 131% 131% 131% 131% 131% 131% 131% 131% 131% Adj. Flow (vph) RTOR Reduction (vph) Lane Group Flow (vph) Turn Type Perm Perm Perm Perm Perm Perm Perm Protected Phases 1 1 2! Permitted Phases ! 2 2! Actuated Green, G (s) Effective Green, g (s) Actuated g/c Ratio Clearance Time (s) Vehicle Extension (s) Lane Grp Cap (vph) v/s Ratio Prot 0.04 c0.26 v/s Ratio Perm c v/c Ratio Uniform Delay, d Progression Factor Incremental Delay, d Delay (s) Level of Service B A A D A B A B Approach Delay (s) Approach LOS B D B Intersection Summary HCM Average Control Delay 26.5 HCM Level of Service C HCM Volume to Capacity ratio 0.90 Actuated Cycle Length (s) 43.8 Sum of lost time (s) 8.0 Intersection Capacity Utilization 94.6% ICU Level of Service F Analysis Period (min) 15! Phase conflict between lane groups. c Critical Lane Group Timing Plan: Future AM w/im Page 2 Skipper Consulting
168 Crosshaven Dr APPLE Future AM w/imp 4: Green Valley Rd & Crosshaven Dr Movement SBT SBR SBR2 SEL2 SEL SER Lane Configurations Ideal Flow (vphpl) Total Lost time (s) Lane Util. Factor Frt Flt Protected Satd. Flow (prot) Flt Permitted Satd. Flow (perm) Volume (vph) Peak-hour factor, PHF Growth Factor (vph) 131% 131% 131% 131% 131% 131% Adj. Flow (vph) RTOR Reduction (vph) Lane Group Flow (vph) Turn Type custom Protected Phases 2! 2! Permitted Phases 1 Actuated Green, G (s) Effective Green, g (s) Actuated g/c Ratio Clearance Time (s) Vehicle Extension (s) Lane Grp Cap (vph) v/s Ratio Prot 0.18 v/s Ratio Perm 0.01 v/c Ratio Uniform Delay, d Progression Factor Incremental Delay, d Delay (s) Level of Service B A Approach Delay (s) Approach LOS B A Intersection Summary Timing Plan: Future AM w/im Page 3 Skipper Consulting
169 Crosshaven Dr APPLE Future AM w/imp 5: Bearden Ct & Crosshaven Dr Movement EBL EBT EBR WBL WBT WBR NBL NBT NBR SBL SBT SBR Lane Configurations Ideal Flow (vphpl) Total Lost time (s) Lane Util. Factor Frt Flt Protected Satd. Flow (prot) Flt Permitted Satd. Flow (perm) Volume (vph) Peak-hour factor, PHF Growth Factor (vph) 131% 131% 131% 131% 131% 131% 131% 131% 131% 131% 131% 131% Adj. Flow (vph) RTOR Reduction (vph) Lane Group Flow (vph) Turn Type Perm Perm Perm Perm Protected Phases Permitted Phases Actuated Green, G (s) Effective Green, g (s) Actuated g/c Ratio Clearance Time (s) Vehicle Extension (s) Lane Grp Cap (vph) v/s Ratio Prot 0.28 c0.39 v/s Ratio Perm c v/c Ratio Uniform Delay, d Progression Factor Incremental Delay, d Delay (s) Level of Service D A A A Approach Delay (s) Approach LOS A D A A Intersection Summary HCM Average Control Delay 3.9 HCM Level of Service A HCM Volume to Capacity ratio 0.46 Actuated Cycle Length (s) 79.6 Sum of lost time (s) 8.0 Intersection Capacity Utilization 41.1% ICU Level of Service A Analysis Period (min) 15 c Critical Lane Group Timing Plan: Future AM w/im Page 4 Skipper Consulting
170 Crosshaven Dr APPLE Future AM w/imp 6: Greendale Dr & Crosshaven Dr Movement WBL WBR NBT NBR SBL SBT Lane Configurations Ideal Flow (vphpl) Total Lost time (s) Lane Util. Factor Frt Flt Protected Satd. Flow (prot) Flt Permitted Satd. Flow (perm) Volume (vph) Peak-hour factor, PHF Growth Factor (vph) 131% 131% 131% 131% 131% 131% Adj. Flow (vph) RTOR Reduction (vph) Lane Group Flow (vph) Turn Type Perm Perm Protected Phases Permitted Phases 2 2 Actuated Green, G (s) Effective Green, g (s) Actuated g/c Ratio Clearance Time (s) Vehicle Extension (s) Lane Grp Cap (vph) v/s Ratio Prot c c0.30 v/s Ratio Perm v/c Ratio Uniform Delay, d Progression Factor Incremental Delay, d Delay (s) Level of Service B A A A A Approach Delay (s) Approach LOS B A A Intersection Summary HCM Average Control Delay 7.4 HCM Level of Service A HCM Volume to Capacity ratio 0.55 Actuated Cycle Length (s) 36.1 Sum of lost time (s) 8.0 Intersection Capacity Utilization 50.7% ICU Level of Service A Analysis Period (min) 15 c Critical Lane Group Timing Plan: Future AM w/im Page 5 Skipper Consulting
171 Crosshaven Dr APPLE Future AM w/imp 7: Overton Rd & Crosshaven Dr Movement EBL EBT EBR WBL WBT WBR NBL NBT NBR SBL SBT SBR Lane Configurations Ideal Flow (vphpl) Total Lost time (s) Lane Util. Factor Frt Flt Protected Satd. Flow (prot) Flt Permitted Satd. Flow (perm) Volume (vph) Peak-hour factor, PHF Growth Factor (vph) 131% 131% 131% 131% 131% 131% 131% 131% 131% 131% 131% 131% Adj. Flow (vph) RTOR Reduction (vph) Lane Group Flow (vph) Turn Type Perm Perm pm+pt Perm Perm Perm Protected Phases Permitted Phases Actuated Green, G (s) Effective Green, g (s) Actuated g/c Ratio Clearance Time (s) Vehicle Extension (s) Lane Grp Cap (vph) v/s Ratio Prot c0.56 v/s Ratio Perm c v/c Ratio Uniform Delay, d Progression Factor Incremental Delay, d Delay (s) Level of Service B C B C D D B B Approach Delay (s) Approach LOS C D D B Intersection Summary HCM Average Control Delay 33.4 HCM Level of Service C HCM Volume to Capacity ratio 0.96 Actuated Cycle Length (s) 79.0 Sum of lost time (s) 8.0 Intersection Capacity Utilization 92.3% ICU Level of Service F Analysis Period (min) 15 c Critical Lane Group Timing Plan: Future AM w/im Page 6 Skipper Consulting
172 Crosshaven Dr APPLE Future PM w/imp 1: Cahaba Heights Road & Crosshaven Dr Movement EBL EBT EBR WBL WBT WBR NBL NBT NBR SBL SBT SBR Lane Configurations Ideal Flow (vphpl) Total Lost time (s) Lane Util. Factor Frt Flt Protected Satd. Flow (prot) Flt Permitted Satd. Flow (perm) Volume (vph) Peak-hour factor, PHF Growth Factor (vph) 131% 131% 131% 131% 131% 131% 131% 131% 131% 131% 131% 131% Adj. Flow (vph) RTOR Reduction (vph) Lane Group Flow (vph) Turn Type pm+pt Perm pm+pt Perm pm+pt pm+pt Perm Protected Phases Permitted Phases Actuated Green, G (s) Effective Green, g (s) Actuated g/c Ratio Clearance Time (s) Vehicle Extension (s) Lane Grp Cap (vph) v/s Ratio Prot c c0.31 c v/s Ratio Perm c v/c Ratio Uniform Delay, d Progression Factor Incremental Delay, d Delay (s) Level of Service C C C D C C C D D C B Approach Delay (s) Approach LOS C C D C Intersection Summary HCM Average Control Delay 33.3 HCM Level of Service C HCM Volume to Capacity ratio 0.85 Actuated Cycle Length (s) 80.6 Sum of lost time (s) 12.0 Intersection Capacity Utilization 82.6% ICU Level of Service E Analysis Period (min) 15 c Critical Lane Group Timing Plan: Future PM w/im Page 1 Skipper Consulting
173 Crosshaven Dr APPLE Future PM w/imp 2: Ridgley Dr & Crosshaven Dr Movement EBL EBT EBR WBL WBT WBR NBL NBT NBR SBL SBT SBR Lane Configurations Sign Control Stop Stop Free Free Grade 0% 0% 0% 0% Volume (veh/h) Peak Hour Factor Hourly flow rate (vph) Pedestrians Lane Width (ft) Walking Speed (ft/s) Percent Blockage Right turn flare (veh) Median type None None Median storage veh) Upstream signal (ft) 473 px, platoon unblocked vc, conflicting volume vc1, stage 1 conf vol vc2, stage 2 conf vol vcu, unblocked vol tc, single (s) tc, 2 stage (s) tf (s) p0 queue free % cm capacity (veh/h) Direction, Lane # EB 1 WB 1 NB 1 NB 2 SB 1 SB 2 Volume Total Volume Left Volume Right csh Volume to Capacity Queue Length 95th (ft) Control Delay (s) Lane LOS C E A Approach Delay (s) Approach LOS C E Intersection Summary Average Delay 0.7 Intersection Capacity Utilization 44.9% ICU Level of Service A Analysis Period (min) 15 Timing Plan: Future PM w/im Page 1 Skipper Consulting
174 Crosshaven Dr APPLE Future PM w/imp 3: Valley Park Dr & Crosshaven Dr Movement EBL EBT EBR WBL WBT WBR NBL NBT NBR SBL SBT SBR Lane Configurations Sign Control Stop Stop Free Free Grade 0% 0% 0% 0% Volume (veh/h) Peak Hour Factor Hourly flow rate (vph) Pedestrians Lane Width (ft) Walking Speed (ft/s) Percent Blockage Right turn flare (veh) Median type None None Median storage veh) Upstream signal (ft) px, platoon unblocked vc, conflicting volume vc1, stage 1 conf vol vc2, stage 2 conf vol vcu, unblocked vol tc, single (s) tc, 2 stage (s) tf (s) p0 queue free % cm capacity (veh/h) Direction, Lane # EB 1 WB 1 NB 1 NB 2 SB 1 SB 2 Volume Total Volume Left Volume Right csh Volume to Capacity Queue Length 95th (ft) Control Delay (s) Lane LOS C D A A Approach Delay (s) Approach LOS C D Intersection Summary Average Delay 0.4 Intersection Capacity Utilization 43.2% ICU Level of Service A Analysis Period (min) 15 Timing Plan: Future PM w/im Page 2 Skipper Consulting
175 Crosshaven Dr APPLE Future PM w/imp 4: Green Valley Rd & Crosshaven Dr Movement EBL2 EBL EBT EBR WBL WBT WBR WBR2 NBL2 NBL NBT NBR Lane Configurations Ideal Flow (vphpl) Total Lost time (s) Lane Util. Factor Frt Flt Protected Satd. Flow (prot) Flt Permitted Satd. Flow (perm) Volume (vph) Peak-hour factor, PHF Growth Factor (vph) 131% 131% 131% 131% 131% 131% 131% 131% 131% 131% 131% 131% Adj. Flow (vph) RTOR Reduction (vph) Lane Group Flow (vph) Turn Type Perm Perm Perm Perm Perm Perm Perm Protected Phases 1 1 2! Permitted Phases 1! ! 2 Actuated Green, G (s) Effective Green, g (s) Actuated g/c Ratio Clearance Time (s) Vehicle Extension (s) Lane Grp Cap (vph) v/s Ratio Prot v/s Ratio Perm c v/c Ratio Uniform Delay, d Progression Factor Incremental Delay, d Delay (s) Level of Service B A A A A B A Approach Delay (s) Approach LOS B A B Intersection Summary HCM Average Control Delay 12.5 HCM Level of Service B HCM Volume to Capacity ratio 0.76 Actuated Cycle Length (s) 41.5 Sum of lost time (s) 8.0 Intersection Capacity Utilization 91.3% ICU Level of Service F Analysis Period (min) 15! Phase conflict between lane groups. c Critical Lane Group Timing Plan: Future PM w/im Page 2 Skipper Consulting
176 Crosshaven Dr APPLE Future PM w/imp 4: Green Valley Rd & Crosshaven Dr Movement SBL SBT SBR SBR2 SEL2 SEL SER Lane Configurations Ideal Flow (vphpl) Total Lost time (s) Lane Util. Factor Frt Flt Protected Satd. Flow (prot) Flt Permitted Satd. Flow (perm) Volume (vph) Peak-hour factor, PHF Growth Factor (vph) 131% 131% 131% 131% 131% 131% 131% Adj. Flow (vph) RTOR Reduction (vph) Lane Group Flow (vph) Turn Type Perm custom Protected Phases 2! 2! Permitted Phases 2! 1! Actuated Green, G (s) Effective Green, g (s) Actuated g/c Ratio Clearance Time (s) Vehicle Extension (s) Lane Grp Cap (vph) v/s Ratio Prot c0.30 v/s Ratio Perm v/c Ratio Uniform Delay, d Progression Factor Incremental Delay, d Delay (s) Level of Service A B A Approach Delay (s) Approach LOS B A Intersection Summary Timing Plan: Future PM w/im Page 3 Skipper Consulting
177 Crosshaven Dr APPLE Future PM w/imp 5: Bearden Ct & Crosshaven Dr Movement EBL EBT EBR WBL WBT WBR NBL NBT NBR SBL SBT SBR Lane Configurations Ideal Flow (vphpl) Total Lost time (s) Lane Util. Factor Frt Flt Protected Satd. Flow (prot) Flt Permitted Satd. Flow (perm) Volume (vph) Peak-hour factor, PHF Growth Factor (vph) 131% 131% 131% 131% 131% 131% 131% 131% 131% 131% 131% 131% Adj. Flow (vph) RTOR Reduction (vph) Lane Group Flow (vph) Turn Type Perm Perm Perm Perm Protected Phases Permitted Phases Actuated Green, G (s) Effective Green, g (s) Actuated g/c Ratio Clearance Time (s) Vehicle Extension (s) Lane Grp Cap (vph) v/s Ratio Prot c v/s Ratio Perm 0.00 c v/c Ratio Uniform Delay, d Progression Factor Incremental Delay, d Delay (s) Level of Service C C B A A Approach Delay (s) Approach LOS C C B A Intersection Summary HCM Average Control Delay 9.4 HCM Level of Service A HCM Volume to Capacity ratio 0.77 Actuated Cycle Length (s) 62.9 Sum of lost time (s) 8.0 Intersection Capacity Utilization 66.1% ICU Level of Service C Analysis Period (min) 15 c Critical Lane Group Timing Plan: Future PM w/im Page 4 Skipper Consulting
178 Crosshaven Dr APPLE Future PM w/imp 6: Greendale Dr & Crosshaven Dr Movement WBL WBR NBT NBR SBL SBT Lane Configurations Ideal Flow (vphpl) Total Lost time (s) Lane Util. Factor Frt Flt Protected Satd. Flow (prot) Flt Permitted Satd. Flow (perm) Volume (vph) Peak-hour factor, PHF Growth Factor (vph) 131% 131% 131% 131% 131% 131% Adj. Flow (vph) RTOR Reduction (vph) Lane Group Flow (vph) Turn Type Perm Perm Protected Phases Permitted Phases 2 2 Actuated Green, G (s) Effective Green, g (s) Actuated g/c Ratio Clearance Time (s) Vehicle Extension (s) Lane Grp Cap (vph) v/s Ratio Prot c0.06 c v/s Ratio Perm v/c Ratio Uniform Delay, d Progression Factor Incremental Delay, d Delay (s) Level of Service C A A A A Approach Delay (s) Approach LOS C A A Intersection Summary HCM Average Control Delay 5.3 HCM Level of Service A HCM Volume to Capacity ratio 0.61 Actuated Cycle Length (s) 60.6 Sum of lost time (s) 8.0 Intersection Capacity Utilization 61.3% ICU Level of Service B Analysis Period (min) 15 c Critical Lane Group Timing Plan: Future PM w/im Page 5 Skipper Consulting
179 Crosshaven Dr APPLE Future PM w/imp 7: Overton Rd & Crosshaven Dr Movement EBL EBT EBR WBL WBT WBR NBL NBT NBR SBL SBT SBR Lane Configurations Ideal Flow (vphpl) Total Lost time (s) Lane Util. Factor Frt Flt Protected Satd. Flow (prot) Flt Permitted Satd. Flow (perm) Volume (vph) Peak-hour factor, PHF Growth Factor (vph) 131% 131% 131% 131% 131% 131% 131% 131% 131% 131% 131% 131% Adj. Flow (vph) RTOR Reduction (vph) Lane Group Flow (vph) Turn Type Perm Perm pm+pt Perm Perm Perm Protected Phases Permitted Phases Actuated Green, G (s) Effective Green, g (s) Actuated g/c Ratio Clearance Time (s) Vehicle Extension (s) Lane Grp Cap (vph) v/s Ratio Prot 0.33 c v/s Ratio Perm c0.43 c v/c Ratio Uniform Delay, d Progression Factor Incremental Delay, d Delay (s) Level of Service B C B D A D C C Approach Delay (s) Approach LOS C B C C Intersection Summary HCM Average Control Delay 24.4 HCM Level of Service C HCM Volume to Capacity ratio 0.87 Actuated Cycle Length (s) 70.3 Sum of lost time (s) 8.0 Intersection Capacity Utilization 77.9% ICU Level of Service D Analysis Period (min) 15 c Critical Lane Group Timing Plan: Future PM w/im Page 6 Skipper Consulting
180 Appendix K Future Queue Calculation Worksheets with Improvements
181
182 Crosshaven Dr APPLE Future AM w/imp 1: Cahaba Heights Road & Crosshaven Dr Lane Group EBL EBT EBR WBL WBT WBR NBL NBT SBL SBT SBR Lane Group Flow (vph) v/c Ratio Control Delay Queue Delay Total Delay Queue Length 50th (ft) Queue Length 95th (ft) # # # # Internal Link Dist (ft) Turn Bay Length (ft) Base Capacity (vph) Starvation Cap Reductn Spillback Cap Reductn Storage Cap Reductn Reduced v/c Ratio Intersection Summary # 95th percentile volume exceeds capacity, queue may be longer. Queue shown is maximum after two cycles. Timing Plan: Future AM w/im Page 1 Skipper Consulting
183 Crosshaven Dr APPLE Future AM w/imp 4: Green Valley Rd & Crosshaven Dr Lane Group EBL EBT EBR WBT NBL NBT NBR SBL SBT SEL Lane Group Flow (vph) v/c Ratio Control Delay Queue Delay Total Delay Queue Length 50th (ft) ~ Queue Length 95th (ft) # # # # Internal Link Dist (ft) Turn Bay Length (ft) Base Capacity (vph) Starvation Cap Reductn Spillback Cap Reductn Storage Cap Reductn Reduced v/c Ratio Intersection Summary ~ Volume exceeds capacity, queue is theoretically infinite. Queue shown is maximum after two cycles. # 95th percentile volume exceeds capacity, queue may be longer. Queue shown is maximum after two cycles. Timing Plan: Future AM w/im Page 2 Skipper Consulting
184 Crosshaven Dr APPLE Future AM w/imp 5: Bearden Ct & Crosshaven Dr Lane Group WBT NBT SBL SBT Lane Group Flow (vph) v/c Ratio Control Delay Queue Delay Total Delay Queue Length 50th (ft) Queue Length 95th (ft) Internal Link Dist (ft) Turn Bay Length (ft) Base Capacity (vph) Starvation Cap Reductn Spillback Cap Reductn Storage Cap Reductn Reduced v/c Ratio Intersection Summary Timing Plan: Future AM w/im Page 3 Skipper Consulting
185 Crosshaven Dr APPLE Future AM w/imp 6: Greendale Dr & Crosshaven Dr Lane Group WBL NBT NBR SBL SBT Lane Group Flow (vph) v/c Ratio Control Delay Queue Delay Total Delay Queue Length 50th (ft) Queue Length 95th (ft) Internal Link Dist (ft) Turn Bay Length (ft) Base Capacity (vph) Starvation Cap Reductn Spillback Cap Reductn Storage Cap Reductn Reduced v/c Ratio Intersection Summary Timing Plan: Future AM w/im Page 4 Skipper Consulting
186 Crosshaven Dr APPLE Future AM w/imp 7: Overton Rd & Crosshaven Dr Lane Group EBL EBT EBR WBL WBT NBT NBR SBT Lane Group Flow (vph) v/c Ratio Control Delay Queue Delay Total Delay Queue Length 50th (ft) ~ Queue Length 95th (ft) #227 #754 # Internal Link Dist (ft) Turn Bay Length (ft) Base Capacity (vph) Starvation Cap Reductn Spillback Cap Reductn Storage Cap Reductn Reduced v/c Ratio Intersection Summary ~ Volume exceeds capacity, queue is theoretically infinite. Queue shown is maximum after two cycles. # 95th percentile volume exceeds capacity, queue may be longer. Queue shown is maximum after two cycles. Timing Plan: Future AM w/im Page 5 Skipper Consulting
187 Crosshaven Dr APPLE Future PM w/imp 1: Cahaba Heights Road & Crosshaven Dr Lane Group EBL EBT EBR WBL WBT WBR NBL NBT SBL SBT SBR Lane Group Flow (vph) v/c Ratio Control Delay Queue Delay Total Delay Queue Length 50th (ft) Queue Length 95th (ft) #213 #538 #230 # Internal Link Dist (ft) Turn Bay Length (ft) Base Capacity (vph) Starvation Cap Reductn Spillback Cap Reductn Storage Cap Reductn Reduced v/c Ratio Intersection Summary # 95th percentile volume exceeds capacity, queue may be longer. Queue shown is maximum after two cycles. Timing Plan: Future PM w/im Page 1 Skipper Consulting
188 Crosshaven Dr APPLE Future PM w/imp 4: Green Valley Rd & Crosshaven Dr Lane Group EBL EBT EBR WBT NBL NBT NBR SBL SBT SEL Lane Group Flow (vph) v/c Ratio Control Delay Queue Delay Total Delay Queue Length 50th (ft) Queue Length 95th (ft) # # Internal Link Dist (ft) Turn Bay Length (ft) Base Capacity (vph) Starvation Cap Reductn Spillback Cap Reductn Storage Cap Reductn Reduced v/c Ratio Intersection Summary # 95th percentile volume exceeds capacity, queue may be longer. Queue shown is maximum after two cycles. Timing Plan: Future PM w/im Page 2 Skipper Consulting
189 Crosshaven Dr APPLE Future PM w/imp 5: Bearden Ct & Crosshaven Dr Lane Group EBT WBT NBT SBL SBT Lane Group Flow (vph) v/c Ratio Control Delay Queue Delay Total Delay Queue Length 50th (ft) Queue Length 95th (ft) 2 21 # #208 Internal Link Dist (ft) Turn Bay Length (ft) Base Capacity (vph) Starvation Cap Reductn Spillback Cap Reductn Storage Cap Reductn Reduced v/c Ratio Intersection Summary # 95th percentile volume exceeds capacity, queue may be longer. Queue shown is maximum after two cycles. Timing Plan: Future PM w/im Page 3 Skipper Consulting
190 Crosshaven Dr APPLE Future PM w/imp 6: Greendale Dr & Crosshaven Dr Lane Group WBL NBT NBR SBL SBT Lane Group Flow (vph) v/c Ratio Control Delay Queue Delay Total Delay Queue Length 50th (ft) Queue Length 95th (ft) 44 # Internal Link Dist (ft) Turn Bay Length (ft) Base Capacity (vph) Starvation Cap Reductn Spillback Cap Reductn Storage Cap Reductn Reduced v/c Ratio Intersection Summary # 95th percentile volume exceeds capacity, queue may be longer. Queue shown is maximum after two cycles. Timing Plan: Future PM w/im Page 4 Skipper Consulting
191 Crosshaven Dr APPLE Future PM w/imp 7: Overton Rd & Crosshaven Dr Lane Group EBL EBT EBR WBL WBT NBT NBR SBT Lane Group Flow (vph) v/c Ratio Control Delay Queue Delay Total Delay Queue Length 50th (ft) Queue Length 95th (ft) # #217 # Internal Link Dist (ft) Turn Bay Length (ft) Base Capacity (vph) Starvation Cap Reductn Spillback Cap Reductn Storage Cap Reductn Reduced v/c Ratio Intersection Summary # 95th percentile volume exceeds capacity, queue may be longer. Queue shown is maximum after two cycles. Timing Plan: Future PM w/im Page 5 Skipper Consulting
192 Appendix L Future Roadway Segment Capacity Analysis Worksheets with Improvements
193
194 Directional file:///c:/users/rcaudle/appdata/local/temp/s2kcc2e.tmp Page 1 of 2 6/14/2017 General Information DIRECTIONAL TWO-LANE HIGHWAY SEGMENT WORKSHEET Analyst RLC Agency or Company Skipper Consulting Date Performed 5/22/2017 Analysis Time Period AM Peak Project Description: Croisshaven APPLE Input Data Site Information Highway / Direction of Travel From/To Jurisdiction Analysis Year Crosshaven Drive Cahaba Heights to Green Valley City of Vestavia Hills Future 2027 w/imp Analysis direction vol., V d 590veh/h Opposing direction vol., V o 479veh/h Shoulder width ft 2.0 Lane Width ft 12.0 Segment Length mi 0.4 Average Travel Speed Analysis Direction (d) Class I highway Class II highway Class III highway Terrain Level Rolling Grade Length mi Up/down Peak-hour factor, PHF 0.87 No-passing zone 0% % Trucks and Buses, P T 5 % % Recreational vehicles, P R 0% Access points mi 40/mi Opposing Direction (o) Passenger-car equivalents for trucks, E T (Exhibit or 15-12) Passenger-car equivalents for RVs, E R (Exhibit or 15-13) Heavy-vehicle adjustment factor, f HV,ATS =1/ (1+ P T (E T -1)+P R (E R -1) ) Grade adjustment factor 1, f g,ats (Exhibit 15-9) Demand flow rate 2, v i (pc/h) v i =V i / (PHF* f g,ats * f HV,ATS ) Free-Flow Speed from Field Measurement Estimated Free-Flow Speed Base free-flow speed 4, BFFS mi/h Mean speed of sample 3, S FM 37 Total demand flow rate, both directions, v Free-flow speed, FFS=S FM (v/ f HV,ATS ) Adj. for no-passing zones, f np,ats (Exhibit 15-15) 0.4 mi/h Percent Time-Spent-Following Adj. for lane and shoulder width, 4 f LS (Exhibit 15-7) mi/h Adj. for access points 4, f A (Exhibit 15-8) mi/h Free-flow speed, FFS (FSS=BFFS-f LS -f A ) 43.5 mi/h Average travel speed, ATS d =FFS (v d,ats mi/h v o,ats ) - f np,ats Percent free flow speed, PFFS 75.7 % Analysis Direction (d) Opposing Direction (o) Passenger-car equivalents for trucks, E T (Exhibit or 15-19) Passenger-car equivalents for RVs, E R (Exhibit or 15-19) Heavy-vehicle adjustment factor, f HV =1/ (1+ P T (E T -1)+P R (E R -1) ) Grade adjustment factor 1, f g,ptsf (Exhibit or Ex 15-17) Directional flow rate 2, v i (pc/h) v i =V i /(PHF*f HV,PTSF * f g,ptsf ) Base percent time-spent-following 4, BPTSF d (%)=100(1-e av d b ) 62.5 Adj. for no-passing zone, f np,ptsf (Exhibit 15-21) 12.8 Percent time-spent-following, PTSF (%)=BPTSF +f d d np,ptsf *(v d,ptsf / v d,ptsf v o,ptsf ) Level of Service and Other Performance Measures Level of service, LOS (Exhibit 15-3) C Volume to capacity ratio, v/c 0.53
195 Directional file:///c:/users/rcaudle/appdata/local/temp/s2kcc2e.tmp Page 2 of 2 6/14/2017 Capacity, C d,ats (Equation 15-12) veh/h 1675 Capacity, C d,ptsf (Equation 15-13) veh/h 1700 Percent Free-Flow Speed PFFS d (Equation Class III only) 75.7 Bicycle Level of Service Directional demand flow rate in outside lane, v OL (Eq ) veh/h Effective width, Wv (Eq ) ft Effective speed factor, S t (Eq ) 2.61 Bicycle level of service score, BLOS (Eq ) 4.37 Bicycle level of service (Exhibit 15-4) Notes 1. Note that the adjustment factor for level terrain is 1.00,as level terrain is one of the base conditions. For the purpose of grade adjustment, specific downgrade segments are treated as level terrain. 2. If v i (v d or v o ) >=1,700 pc/h, terminate analysis--the LOS is F. 3. For the analysis direction only and for v>200 veh/h. 4. For the analysis direction only 5. Exhibit provides coefficients a and b for Equation Use alternative Exhibit if some trucks operate at crawl speeds on a specific downgrade. Copyright 2016 University of Florida, All Rights Reserved HCS7 TM TwoLane Version 7.1 Generated: 6/14/2017 2:03 PM D
196 Directional file:///c:/users/rcaudle/appdata/local/temp/s2k1963.tmp Page 1 of 2 6/14/2017 General Information DIRECTIONAL TWO-LANE HIGHWAY SEGMENT WORKSHEET Analyst RLC Agency or Company Skipper Consulting Date Performed 5/22/2017 Analysis Time Period PM Peak Project Description: Croisshaven APPLE Input Data Site Information Highway / Direction of Travel From/To Jurisdiction Analysis Year Crosshaven Drive Cahaba Heights to Green Valley City of Vestavia Hills Future 2027 w/imp Analysis direction vol., V d 614veh/h Opposing direction vol., V o 523veh/h Shoulder width ft 2.0 Lane Width ft 12.0 Segment Length mi 0.4 Average Travel Speed Analysis Direction (d) Class I highway Class II highway Class III highway Terrain Level Rolling Grade Length mi Up/down Peak-hour factor, PHF 0.95 No-passing zone 0% % Trucks and Buses, P T 5 % % Recreational vehicles, P R 0% Access points mi 40/mi Opposing Direction (o) Passenger-car equivalents for trucks, E T (Exhibit or 15-12) Passenger-car equivalents for RVs, E R (Exhibit or 15-13) Heavy-vehicle adjustment factor, f HV,ATS =1/ (1+ P T (E T -1)+P R (E R -1) ) Grade adjustment factor 1, f g,ats (Exhibit 15-9) Demand flow rate 2, v i (pc/h) v i =V i / (PHF* f g,ats * f HV,ATS ) Free-Flow Speed from Field Measurement Estimated Free-Flow Speed Base free-flow speed 4, BFFS mi/h Mean speed of sample 3, S FM 37 Total demand flow rate, both directions, v Free-flow speed, FFS=S FM (v/ f HV,ATS ) Adj. for no-passing zones, f np,ats (Exhibit 15-15) 0.4 mi/h Percent Time-Spent-Following Adj. for lane and shoulder width, 4 f LS (Exhibit 15-7) mi/h Adj. for access points 4, f A (Exhibit 15-8) mi/h Free-flow speed, FFS (FSS=BFFS-f LS -f A ) 43.6 mi/h Average travel speed, ATS d =FFS (v d,ats mi/h v o,ats ) - f np,ats Percent free flow speed, PFFS 76.2 % Analysis Direction (d) Opposing Direction (o) Passenger-car equivalents for trucks, E T (Exhibit or 15-19) Passenger-car equivalents for RVs, E R (Exhibit or 15-19) Heavy-vehicle adjustment factor, f HV =1/ (1+ P T (E T -1)+P R (E R -1) ) Grade adjustment factor 1, f g,ptsf (Exhibit or Ex 15-17) Directional flow rate 2, v i (pc/h) v i =V i /(PHF*f HV,PTSF * f g,ptsf ) Base percent time-spent-following 4, BPTSF d (%)=100(1-e av d b ) 61.3 Adj. for no-passing zone, f np,ptsf (Exhibit 15-21) 13.1 Percent time-spent-following, PTSF (%)=BPTSF +f d d np,ptsf *(v d,ptsf / v d,ptsf v o,ptsf ) Level of Service and Other Performance Measures Level of service, LOS (Exhibit 15-3) C Volume to capacity ratio, v/c 0.53
197 Directional file:///c:/users/rcaudle/appdata/local/temp/s2k1963.tmp Page 2 of 2 6/14/2017 Capacity, C d,ats (Equation 15-12) veh/h 1675 Capacity, C d,ptsf (Equation 15-13) veh/h 1700 Percent Free-Flow Speed PFFS d (Equation Class III only) 76.2 Bicycle Level of Service Directional demand flow rate in outside lane, v OL (Eq ) veh/h Effective width, Wv (Eq ) ft Effective speed factor, S t (Eq ) 2.61 Bicycle level of service score, BLOS (Eq ) 4.35 Bicycle level of service (Exhibit 15-4) Notes 1. Note that the adjustment factor for level terrain is 1.00,as level terrain is one of the base conditions. For the purpose of grade adjustment, specific downgrade segments are treated as level terrain. 2. If v i (v d or v o ) >=1,700 pc/h, terminate analysis--the LOS is F. 3. For the analysis direction only and for v>200 veh/h. 4. For the analysis direction only 5. Exhibit provides coefficients a and b for Equation Use alternative Exhibit if some trucks operate at crawl speeds on a specific downgrade. Copyright 2016 University of Florida, All Rights Reserved HCS7 TM TwoLane Version 7.1 Generated: 6/14/2017 2:06 PM D
198 Directional file:///c:/users/rcaudle/appdata/local/temp/s2k66e7.tmp Page 1 of 2 6/14/2017 General Information DIRECTIONAL TWO-LANE HIGHWAY SEGMENT WORKSHEET Analyst RLC Agency or Company Skipper Consulting Date Performed 5/22/2017 Analysis Time Period AM Peak Project Description: Croisshaven APPLE Input Data Site Information Highway / Direction of Travel From/To Jurisdiction Analysis Year Crosshaven Drive Green Valley to Overton Rd City of Vestavia Hills Future 2027 w/imp Analysis direction vol., V d 563veh/h Opposing direction vol., V o 461veh/h Shoulder width ft 2.0 Lane Width ft 12.0 Segment Length mi 0.5 Average Travel Speed Analysis Direction (d) Class I highway Class II highway Class III highway Terrain Level Rolling Grade Length mi Up/down Peak-hour factor, PHF 0.90 No-passing zone 0% % Trucks and Buses, P T 5 % % Recreational vehicles, P R 0% Access points mi 25/mi Opposing Direction (o) Passenger-car equivalents for trucks, E T (Exhibit or 15-12) Passenger-car equivalents for RVs, E R (Exhibit or 15-13) Heavy-vehicle adjustment factor, f HV,ATS =1/ (1+ P T (E T -1)+P R (E R -1) ) Grade adjustment factor 1, f g,ats (Exhibit 15-9) Demand flow rate 2, v i (pc/h) v i =V i / (PHF* f g,ats * f HV,ATS ) Free-Flow Speed from Field Measurement Estimated Free-Flow Speed Base free-flow speed 4, BFFS mi/h Mean speed of sample 3, S FM 35 Total demand flow rate, both directions, v Free-flow speed, FFS=S FM (v/ f HV,ATS ) Adj. for no-passing zones, f np,ats (Exhibit 15-15) 0.5 mi/h Percent Time-Spent-Following Adj. for lane and shoulder width, 4 f LS (Exhibit 15-7) mi/h Adj. for access points 4, f A (Exhibit 15-8) mi/h Free-flow speed, FFS (FSS=BFFS-f LS -f A ) 41.3 mi/h Average travel speed, ATS d =FFS (v d,ats mi/h v o,ats ) - f np,ats Percent free flow speed, PFFS 75.7 % Analysis Direction (d) Opposing Direction (o) Passenger-car equivalents for trucks, E T (Exhibit or 15-19) Passenger-car equivalents for RVs, E R (Exhibit or 15-19) Heavy-vehicle adjustment factor, f HV =1/ (1+ P T (E T -1)+P R (E R -1) ) Grade adjustment factor 1, f g,ptsf (Exhibit or Ex 15-17) Directional flow rate 2, v i (pc/h) v i =V i /(PHF*f HV,PTSF * f g,ptsf ) Base percent time-spent-following 4, BPTSF d (%)=100(1-e av d b ) 60.0 Adj. for no-passing zone, f np,ptsf (Exhibit 15-21) 13.2 Percent time-spent-following, PTSF (%)=BPTSF +f d d np,ptsf *(v d,ptsf / v d,ptsf v o,ptsf ) Level of Service and Other Performance Measures Level of service, LOS (Exhibit 15-3) C Volume to capacity ratio, v/c 0.53
199 Directional file:///c:/users/rcaudle/appdata/local/temp/s2k66e7.tmp Page 2 of 2 6/14/2017 Capacity, C d,ats (Equation 15-12) veh/h 1675 Capacity, C d,ptsf (Equation 15-13) veh/h 1700 Percent Free-Flow Speed PFFS d (Equation Class III only) 75.7 Bicycle Level of Service Directional demand flow rate in outside lane, v OL (Eq ) veh/h Effective width, Wv (Eq ) ft Effective speed factor, S t (Eq ) 2.61 Bicycle level of service score, BLOS (Eq ) 4.33 Bicycle level of service (Exhibit 15-4) Notes 1. Note that the adjustment factor for level terrain is 1.00,as level terrain is one of the base conditions. For the purpose of grade adjustment, specific downgrade segments are treated as level terrain. 2. If v i (v d or v o ) >=1,700 pc/h, terminate analysis--the LOS is F. 3. For the analysis direction only and for v>200 veh/h. 4. For the analysis direction only 5. Exhibit provides coefficients a and b for Equation Use alternative Exhibit if some trucks operate at crawl speeds on a specific downgrade. Copyright 2016 University of Florida, All Rights Reserved HCS7 TM TwoLane Version 7.1 Generated: 6/14/2017 2:08 PM D
200 Directional file:///c:/users/rcaudle/appdata/local/temp/s2k3147.tmp Page 1 of 2 6/14/2017 General Information DIRECTIONAL TWO-LANE HIGHWAY SEGMENT WORKSHEET Analyst RLC Agency or Company Skipper Consulting Date Performed 5/22/2017 Analysis Time Period PM Peak Project Description: Croisshaven APPLE Input Data Site Information Highway / Direction of Travel Crosshaven Drive From/To Green Valley to Overton Rd Jurisdiction City of Vestavia Hills Analysis Year Future 2027 Analysis direction vol., V d 741veh/h Opposing direction vol., V o 647veh/h Shoulder width ft 2.0 Lane Width ft 12.0 Segment Length mi 0.5 Average Travel Speed Analysis Direction (d) Class I highway Class II highway Class III highway Terrain Level Rolling Grade Length mi Up/down Peak-hour factor, PHF 0.91 No-passing zone 0% % Trucks and Buses, P T 5 % % Recreational vehicles, P R 0% Access points mi 25/mi Opposing Direction (o) Passenger-car equivalents for trucks, E T (Exhibit or 15-12) Passenger-car equivalents for RVs, E R (Exhibit or 15-13) Heavy-vehicle adjustment factor, f HV,ATS =1/ (1+ P T (E T -1)+P R (E R -1) ) Grade adjustment factor 1, f g,ats (Exhibit 15-9) Demand flow rate 2, v i (pc/h) v i =V i / (PHF* f g,ats * f HV,ATS ) Free-Flow Speed from Field Measurement Estimated Free-Flow Speed Base free-flow speed 4, BFFS mi/h Mean speed of sample 3, S FM 35 Total demand flow rate, both directions, v Free-flow speed, FFS=S FM (v/ f HV,ATS ) Adj. for no-passing zones, f np,ats (Exhibit 15-15) 0.3 mi/h Percent Time-Spent-Following Adj. for lane and shoulder width, 4 f LS (Exhibit 15-7) mi/h Adj. for access points 4, f A (Exhibit 15-8) mi/h Free-flow speed, FFS (FSS=BFFS-f LS -f A ) 43.4 mi/h Average travel speed, ATS d =FFS (v d,ats mi/h v o,ats ) - f np,ats Percent free flow speed, PFFS 70.9 % Analysis Direction (d) Opposing Direction (o) Passenger-car equivalents for trucks, E T (Exhibit or 15-19) Passenger-car equivalents for RVs, E R (Exhibit or 15-19) Heavy-vehicle adjustment factor, f HV =1/ (1+ P T (E T -1)+P R (E R -1) ) Grade adjustment factor 1, f g,ptsf (Exhibit or Ex 15-17) Directional flow rate 2, v i (pc/h) v i =V i /(PHF*f HV,PTSF * f g,ptsf ) Base percent time-spent-following 4, BPTSF d (%)=100(1-e av d b ) 69.1 Adj. for no-passing zone, f np,ptsf (Exhibit 15-21) 11.9 Percent time-spent-following, PTSF (%)=BPTSF +f d d np,ptsf *(v d,ptsf / v d,ptsf v o,ptsf ) Level of Service and Other Performance Measures Level of service, LOS (Exhibit 15-3) D Volume to capacity ratio, v/c 0.53
201 Directional file:///c:/users/rcaudle/appdata/local/temp/s2k3147.tmp Page 2 of 2 6/14/2017 Capacity, C d,ats (Equation 15-12) veh/h 1675 Capacity, C d,ptsf (Equation 15-13) veh/h 1700 Percent Free-Flow Speed PFFS d (Equation Class III only) 70.9 Bicycle Level of Service Directional demand flow rate in outside lane, v OL (Eq ) veh/h Effective width, Wv (Eq ) ft Effective speed factor, S t (Eq ) 2.61 Bicycle level of service score, BLOS (Eq ) 4.47 Bicycle level of service (Exhibit 15-4) Notes 1. Note that the adjustment factor for level terrain is 1.00,as level terrain is one of the base conditions. For the purpose of grade adjustment, specific downgrade segments are treated as level terrain. 2. If v i (v d or v o ) >=1,700 pc/h, terminate analysis--the LOS is F. 3. For the analysis direction only and for v>200 veh/h. 4. For the analysis direction only 5. Exhibit provides coefficients a and b for Equation Use alternative Exhibit if some trucks operate at crawl speeds on a specific downgrade. Copyright 2016 University of Florida, All Rights Reserved HCS7 TM TwoLane Version 7.1 Generated: 6/14/2017 2:10 PM D
202 APPENDIX B Cost Estimates
203 Table 1 Estimated Utility Cost
204 Table 2 Cost Estimated for Northern Phase
205 Table 3 Cost Estimated for Southern Phase
206 APPENDIX C Public Involvement
207 11/2/2018 Crosshaven Drive Neighborhood Meeting Held in the New Merkle House November 14, 2017 AGENDA Introductions Project Overview Traffic Study Engineering Feasibility Questions and Answers 1

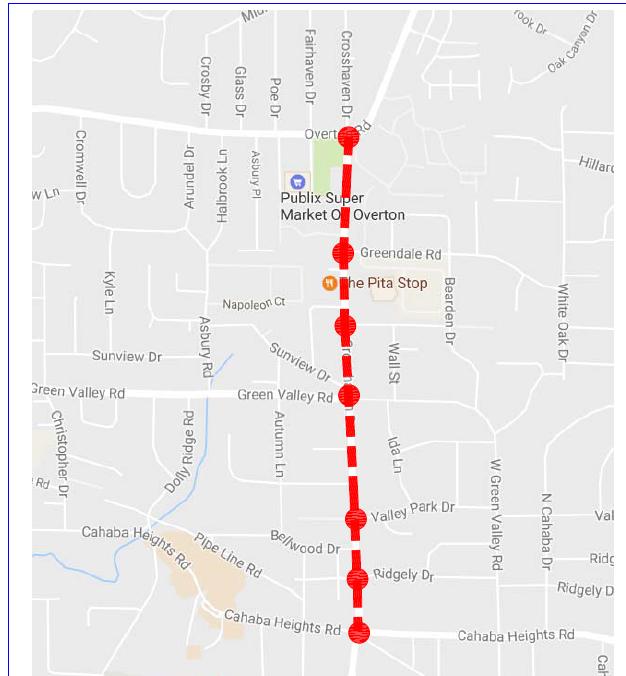
208 11/2/2018 Study Area and Intersections 2


209 11/2/2018 Functional Classification Existing Traffic Counts 3

210 11/2/2018 Existing Traffic Counts Existing Traffic Counts 4


211 11/2/2018 Existing Speed Survey Existing Vehicle Classification 5
212 11/2/2018 Observations AM Queues on Cahaba Heights Road westbound Queues on Overton Road westbound Queues on Crosshaven Drive southbound Observations Midday Stop and go traffic on Crosshaven Drive between Greendale Road and Green Valley Road Queue on Crosshaven Drive northbound and southbound at Green Valley Road Queue on Crosshaven Drive southbound at Cahaba Heights Road 6


213 11/2/2018 Observations Midday Observations Midday 7

214 11/2/2018 Observations Midday Observations PM Queue on Crosshaven Drive northbound and southbound at Green Valley Road Queue on Green Valley Road eastbound at Crosshaven Drive Queue on Green Valley Road southbound at Cahaba Heights Road Traffic exiting Sunview Drive causes signficant disruptions 8
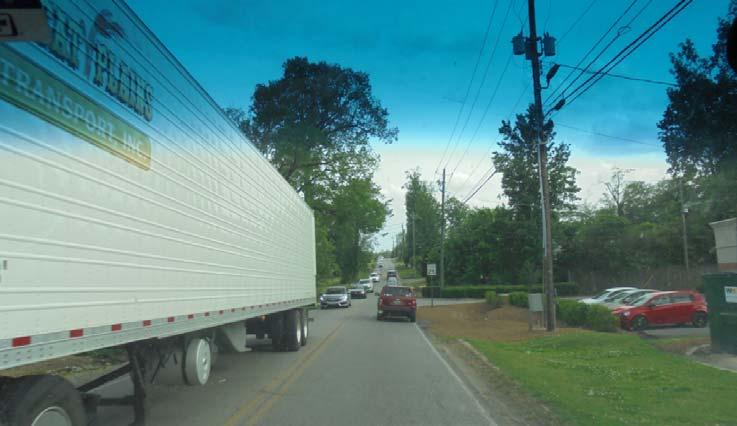
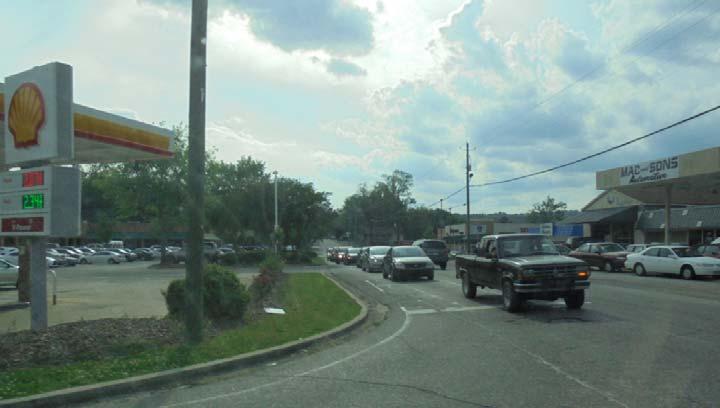
215 11/2/2018 Observations PM Observations PM 9

216 11/2/2018 Observations PM Observations PM 10


217 11/2/2018 Existing Intersection Capacity Analysis Existing Intersection Capacity Analysis 11


218 11/2/2018 Existing Intersection Capacity Analysis Existing Queues 12


219 11/2/2018 Existing Queues Existing Queues 13


220 11/2/2018 Existing Roadway Segment Capacity Analysis Traffic Growth 14

221 11/2/2018 Future 2027 Traffic Volumes Future 2027 Traffic Volumes 15


222 11/2/2018 Future 2027 Intersection Capacity Analysis Future 2027 Intersection Capacity Analysis 16


223 11/2/2018 Future 2027 Intersection Capacity Analysis Future 2027 Queue Analysis 17


224 11/2/2018 Future 2027 Queue Analysis Future 2027 Queue Analysis 18


225 11/2/2018 Future Roadway Segment Capacity Analysis Recommended Improvements 19
226 11/2/2018 Recommended Improvements Recommended Improvements 20


227 11/2/ Capacity Analysis with Recommended Improvements 2027 Capacity Analysis with Recommended Improvements 21


228 11/2/ Capacity Analysis with Recommended Improvements 2027 Queue Analysis with Recommended Improvements 22

229 11/2/ Queue Analysis with Recommended Improvements 2027 Queue Analysis with Recommended Improvements 23

230 11/2/ Roadway Segment Capacity Analysis with Recommended Improvements 24
231 11/2/2018 Engineering Feasibility PHASING PLAN 1


232 11/2/2018 TOPICS VIII Ongoing Jefferson Co. Project Federally Funded with 80/20 Split ROW Acquisition currently underway Project has a letting date of January 2020 According to Skipper s Traffic Study, this project addresses largest traffic congestion need, so is the highest priority among the 3 different Phases. NORTHERN PHASE From Green Valley to Overton Next in Priority According to Study Can be Accomplished Independently of Others & w/ Local Funds 2
233 11/2/2018 SOUTHERN PHASE From Cahaba Heights to Green Valley Next in Priority After Northern Phase Can Be Accomplished w/ Local Funds & Independently of Others 3

234 11/2/2018 4
Alpine Highway to North County Boulevard Connector Study
 Alpine Highway to North County Boulevard Connector Study prepared by Avenue Consultants March 16, 2017 North County Boulevard Connector Study March 16, 2017 Table of Contents 1 Summary of Findings... 1
TRAFFIC IMPACT ANALYSIS
 TRAFFIC IMPACT ANALYSIS Emerald Isle Commercial Development Prepared by SEPI Engineering & Construction Prepared for Ark Consulting Group, PLLC March 2016 I. Executive Summary A. Site Location The Emerald
LAWRENCE TRANSIT CENTER LOCATION ANALYSIS 9 TH STREET & ROCKLEDGE ROAD / 21 ST STREET & IOWA STREET LAWRENCE, KANSAS
 LAWRENCE TRANSIT CENTER LOCATION ANALYSIS 9 TH STREET & ROCKLEDGE ROAD / 21 ST STREET & IOWA STREET LAWRENCE, KANSAS TRAFFIC IMPACT STUDY FEBRUARY 214 OA Project No. 213-542 TABLE OF CONTENTS 1. INTRODUCTION...
APPENDIX C1 TRAFFIC ANALYSIS DESIGN YEAR TRAFFIC ANALYSIS
 APPENDIX C1 TRAFFIC ANALYSIS DESIGN YEAR TRAFFIC ANALYSIS DESIGN YEAR TRAFFIC ANALYSIS February 2018 Highway & Bridge Project PIN 6754.12 Route 13 Connector Road Chemung County February 2018 Appendix
TIMBERVINE TRANSPORTATION IMPACT STUDY FORT COLLINS, COLORADO JANUARY Prepared for:
 TIMBERVINE TRANSPORTATION IMPACT STUDY FORT COLLINS, COLORADO JANUARY 2014 Prepared for: Hartford Companies 1218 W. Ash Street Suite A Windsor, Co 80550 Prepared by: DELICH ASSOCIATES 2272 Glen Haven Drive
Traffic Engineering Study
 Traffic Engineering Study Bellaire Boulevard Prepared For: International Management District Technical Services, Inc. Texas Registered Engineering Firm F-3580 November 2009 Executive Summary has been requested
Date: February 7, 2017 John Doyle, Z-Best Products Robert Del Rio. T.E. Z-Best Traffic Operations and Site Access Analysis
 Memorandum Date: February 7, 07 To: From: Subject: John Doyle, Z-Best Products Robert Del Rio. T.E. Z-Best Traffic Operations and Site Access Analysis Introduction Hexagon Transportation Consultants, Inc.
Proposed location of Camp Parkway Commerce Center. Vicinity map of Camp Parkway Commerce Center Southampton County, VA
 Proposed location of Camp Parkway Commerce Center Vicinity map of Camp Parkway Commerce Center Southampton County, VA Camp Parkway Commerce Center is a proposed distribution and industrial center to be
Traffic Impact Analysis West Street Garden Plots Improvements and DuPage River Park Garden Plots Development Naperville, Illinois
 Traffic Impact Analysis West Street Garden Plots Improvements and DuPage River Park Garden Plots Development Naperville, Illinois Submitted by April 9, 2009 Introduction Kenig, Lindgren, O Hara, Aboona,
Traffic Impact Study Speedway Gas Station Redevelopment
 Traffic Impact Study Speedway Gas Station Redevelopment Warrenville, Illinois Prepared For: Prepared By: April 11, 2018 Table of Contents 1. Introduction... 1 2. Existing Conditions... 4 Site Location...
STH 60 Northern Reliever Route Feasibility Study Report
 #233087 v3 STH 60 Northern Reliever Route Feasibility Study Report Washington County Public Works Committee Meeting September 28, 2016 1 STH 60 Northern Reliever Route Feasibility Study Hartford Area Development
West Hills Shopping Centre Lowe s Expansion Traffic Impact Study
 West Hills Shopping Centre Lowe s Expansion Traffic Impact Study Prepared for: Armel Corporation January 2015 Paradigm Transportation Solutions Ltd. 22 King Street South, Suite 300 Waterloo ON N2J 1N8
LCPS Valley Service Center
 Traffic Impact Study LCPS Valley Service Center Loudoun County, Virginia November 4, 2015 Prepared For: Loudoun County Public Schools 21000 Education Court Ashburn, VA 20148 Prepared by: 1140 Connecticut
King Soopers #116 Thornton, Colorado
 Traffic Impact Study King Soopers #116 Thornton, Colorado Prepared for: Galloway & Company, Inc. T R A F F I C I M P A C T S T U D Y King Soopers #116 Thornton, Colorado Prepared for Galloway & Company
EXECUTIVE SUMMARY. The following is an outline of the traffic analysis performed by Hales Engineering for the traffic conditions of this project.
 EXECUTIVE SUMMARY This study addresses the traffic impacts associated with the proposed Shopko redevelopment located in Sugarhouse, Utah. The Shopko redevelopment project is located between 1300 East and
MEMO VIA . Ms. Amy Roth DPS Director, City of Three Rivers. To:
 MEMO To: Ms. Amy Roth DPS Director, City of Three Rivers VIA EMAIL From: Michael J. Labadie, PE Julie M. Kroll, PE, PTOE Brandon Hayes, PE, P.Eng. Fleis & VandenBrink Date: January 5, 2017 Re: Proposed
INDUSTRIAL DEVELOPMENT
 INDUSTRIAL DEVELOPMENT Traffic Impact Study Plainfield, Illinois August 2018 Prepared for: Seefried Industrial Properties, Inc. TABLE OF CONTENTS Executive Summary 2 Introduction 3 Existing Conditions
105 Toronto Street South, Markdale Transportation Impact Study. Paradigm Transportation Solutions Limited
 105 Toronto Street South, Markdale Transportation Impact Study Paradigm Transportation Solutions Limited December 2016 Project Summary Project Number 162060 December 2016 Client Zelinka Priamo Ltd 318
MILLERSVILLE PARK TRAFFIC IMPACT ANALYSIS ANNE ARUNDEL COUNTY, MARYLAND
 MILLERSVILLE PARK TRAFFIC IMPACT ANALYSIS ANNE ARUNDEL COUNTY, MARYLAND Prepared for: Department of Public Works Anne Arundel County Prepared by: URS Corporation 4 North Park Drive, Suite 3 Hunt Valley,
L1TILE BEARS DAY CARE TRANSPORTATION IMPACT STUDY FORT COLLINS, COLORADO MAY Prepared for:
 L1TILE BEARS DAY CARE TRANSPORTATION IMPACT STUDY FORT COLLINS, COLORADO MAY 2012 Prepared for: Hillside Construction, Inc. 216 Hemlock Street, Suite B Fort Collins, CO 80534 Prepared by: DELICH ASSOCIATES
BARRHAVEN FELLOWSHIP CRC 3058 JOCKVALE ROAD OTTAWA, ONTARIO TRANSPORTATION BRIEF. Prepared for:
 BARRHAVEN FELLOWSHIP CRC 3058 JOCKVALE ROAD OTTAWA, ONTARIO TRANSPORTATION BRIEF Prepared for: Barrhaven Fellowship CRC 3058 Jockvale Road Ottawa, ON K2J 2W7 December 7, 2016 116-649 Report_1.doc D. J.
Lacey Gateway Residential Phase 1
 Lacey Gateway Residential Phase Transportation Impact Study April 23, 203 Prepared for: Gateway 850 LLC 5 Lake Bellevue Drive Suite 02 Bellevue, WA 98005 Prepared by: TENW Transportation Engineering West
Summary of the Alcoa Highway Redevelopment Project
 Appendix B Summary of the Alcoa Highway Redevelopment Project By Marcia Finfer, October 2009 The Timberlake community, along with numerous other concerned citizen groups (including the Lakemoor Hills community)
Southern Windsor County 2016 Traffic Count Program Summary April 2017
 Southern Windsor County 2016 Traffic Count Program Summary April 2017 The Southern Windsor County Regional Planning Commission (the RPC ) has been monitoring traffic at 19 locations throughout the southern
King County Metro. Columbia Street Transit Priority Improvements Alternative Analysis. Downtown Southend Transit Study. May 2014.
 King County Metro Columbia Street Transit Priority Improvements Alternative Analysis Downtown Southend Transit Study May 2014 Parametrix Table of Contents Introduction... 1 Methodology... 1 Study Area...
TRAFFIC SIGNAL DESIGN REPORT KING OF PRUSSIA ROAD & RAIDER ROAD RADNOR TOWNSHIP PENNSYLVANIA
 TRAFFIC SIGNAL DESIGN REPORT KING OF PRUSSIA ROAD & RAIDER ROAD RADNOR TOWNSHIP PENNSYLVANIA PREPARED FOR: UNIVERSITY OF PENNSYLVANIA HEALTH SYSTEM 34 CIVIC CENTER BOULEVARD PHILADELPHIA, PA 1987 (61)
RTE. 1 at RTE. 637 & RTE. 639
 INTERSECTION SAFETY STUDY Prepared for: Virginia Department of Transportation Central Region Operations Traffic Engineering (UPC #81378, TO 12-092) DAVENPORT Project Number: 13-368 / /2014 RTE. 1 at RTE.
TRAFFIC IMPACT STUDY DERRY GREEN CORPORATE BUSINESS PARK MILTON SECONDARY PLAN MODIFICATION
 TRAFFIC IMPACT STUDY DERRY GREEN CORPORATE BUSINESS PARK MILTON SECONDARY PLAN MODIFICATION TRAFFIC IMPACT STUDY DERRY GREEN CORPORATE BUSINESS PARK MILTON SECONDARY PLAN MODIFICATION DECEMBER 24 UPDATED
Clean Harbors Canada, Inc.
 Clean Harbors Canada, Inc. Proposed Lambton Landfill Expansion Environmental Assessment Terms of Reference Transportation Assessment St. Clair Township, Ontario September 2009 itrans Consulting Inc. 260
ANDERSON PROPERTY SITE ANALYSIS
 ANDERSON PROPERTY SITE ANALYSIS Introduction The Montgomery County Department of Transportation (MCDOT) initiated a feasibility study in the fall of 2012 to evaluate the need for transit service expansion
MERIVALE PRIORITY SQUARE 2852 MERIVALE ROAD CITY OF OTTAWA TRANSPORTATION BRIEF. Prepared for: ONT Inc. 25 Winding Way Nepean, Ontario K2C 3H1
 MERIVALE PRIORITY SQUARE 2852 MERIVALE ROAD CITY OF OTTAWA TRANSPORTATION BRIEF Prepared for: 2190986ONT Inc. 25 Winding Way Nepean, Ontario K2C 3H1 October 6, 2010 110-502 Report_1.doc D. J. Halpenny
Traffic Impact Study for the proposed. Town of Allegany, New York. August Project No Prepared For:
 Appendix B SRF Traffic Study (Revised November 2005) Draft Environmental Impact Statement University Commons Town of Allegany, Cattaraugus County, NY December 2005 Traffic Impact Study for the proposed
Escondido Marriott Hotel and Mixed-Use Condominium Project TRAFFIC IMPACT ANALYSIS REPORT
 Escondido Marriott Hotel and Mixed-Use Condominium Project TRAFFIC IMPACT ANALYSIS REPORT Prepared for Phelps Program Management 420 Sixth Avenue, Greeley, CO 80632 Prepared by 5050 Avenida Encinas, Suite
APPENDIX E. Traffic Analysis Report
 APPENDIX E Traffic Analysis Report THIS PAGE INTENTIONALLY BLANK EAGLE RIVER TRAFFIC MITIGATION PHASE I OLD GLENN HIGHWAY/EAGLE RIVER ROAD INTERSECTION IMPROVEMENTS TRAFFIC ANALYSIS Eagle River, Alaska
TRAFFIC IMPACT ANALYSIS RIZZO CONFERENCE CENTER EXPANSION FINAL REPORT
 TRAFFIC IMPACT ANALYSIS RIZZO CONFERENCE CENTER EXPANSION Chapel Hill, North Carolina FINAL REPORT Prepared for: The Town of Chapel Hill, NC Prepared by: Architects-Engineers-Planners, Inc. December 2010
IV. ENVIRONMENTAL IMPACT ANALYSIS N. TRANSPORTATION AND TRAFFIC
 IV. ENVIRONMENTAL IMPACT ANALYSIS N. TRANSPORTATION AND TRAFFIC The following section summarizes the information provided in the traffic report entitled Traffic Impact Analysis for a Proposed Residential
Traffic Impact Analysis. Alliance Cole Avenue Residential Site Dallas, Texas. Kimley-Horn and Associates, Inc. Dallas, Texas.
 Traffic Impact Analysis Alliance Cole Avenue Residential Site Dallas, Texas February 15, 2018 Kimley-Horn and Associates, Inc. Dallas, Texas Project #064524900 Registered Firm F-928 Traffic Impact Analysis
Bennett Pit. Traffic Impact Study. J&T Consulting, Inc. Weld County, Colorado. March 3, 2017
 Bennett Pit Traffic Impact Study J&T Consulting, Inc. Weld County, Colorado March 3, 217 Prepared By: Sustainable Traffic Solutions, Inc. http://www.sustainabletrafficsolutions.com/ Joseph L. Henderson,
Shirk Road at State Route 198 Interchange Analysis Tulare County, California
 Shirk Road at State Route 198 Interchange Analysis Tulare County, California DRAFT REPORT Prepared By Tulare County Association of Governments (TCAG) April 2013 Table of Contents Introduction:... 3 Project
King Street & Wyman Road Transportation Impact Study & Transportation Demand Management. Paradigm Transportation Solutions Limited
 King Street & Wyman Road Transportation Impact Study & Transportation Demand Management Paradigm Transportation Solutions Limited April 28 Project Summary Project Number 822 April 28 Client RISE Commercial
Transportation & Traffic Engineering
 Transportation & Traffic Engineering 1) Project Description This report presents a summary of findings for a Traffic Impact Analysis (TIA) performed by A+ Engineering, Inc. for the Hill Country Family
November 1, Mr. Jafar Tabrizi President, Tabrizi Rugs 180 Bedford Highway. Traffic Impact Statement BH-1 and BH-2, Southgate Drive, Bedford, NS
 161-12598 Mr. Jafar Tabrizi President, Tabrizi Rugs 180 Bedford Highway Bedford, NS B4A 1C1 [Via Email: tabrizi@tabrizi.com] RE: Traffic Impact Statement Dear Mr. Tabrizi: Plans are being prepared for
Section 5.0 Traffic Information
 Section 5.0 Traffic Information 10.0 TRANSPORTATION MDM Transportation Consultants, Inc. (MDM) has prepared an evaluation of transportation impacts for the proposed evaluation for the expansion of the
Environmental Assessment Derry Road and Argentia Road Intersection
 Air and Noise Study Environmental Assessment Derry Road and Argentia Road Intersection Project 11-4295 City of Mississauga, Region of Peel October 17, 2014 1 Region of Peel Environmental Assessment for
Trafalgar Road & Lower Base Line Transportation Study Ontario Inc.
 Trafalgar Road & Lower Base Line Transportation Study 1255723 Ontario Inc. Trafalgar Road & Lower Base Line Transportation Study 1255723 Ontario Inc. 1465 Pickering Parkway Suite 200 Pickering ON L1V 7G7
V. DEVELOPMENT OF CONCEPTS
 Martin Luther King, Jr. Drive Extension FINAL Feasibility Study Page 9 V. DEVELOPMENT OF CONCEPTS Throughout the study process several alternative alignments were developed and eliminated. Initial discussion
TRAFFIC CALMING PROGRAM
 TRAFFIC CALMING PROGRAM PROGRAM BASICS Mount Pleasant Transportation Department 100 Ann Edwards Lane Mt. Pleasant, SC 29465 Tel: 843-856-3080 www.tompsc.com The Town of Mount Pleasant has adopted a traffic
RICHMOND OAKS HEALTH CENTRE 6265 PERTH STREET OTTAWA, ONTARIO TRANSPORTATION BRIEF. Prepared for: Guycoki (Eastern) Limited.
 Limited.") RICHMOND OAKS HEALTH CENTRE 6265 PERTH STREET OTTAWA, ONTARIO TRANSPORTATION BRIEF Prepared for: Guycoki (Eastern) Limited June 16, 2016 116-638 Brief_1.doc D. J. Halpenny & Associates Ltd. Consulting
RICHMOND OAKS HEALTH CENTRE 6265 PERTH STREET OTTAWA, ONTARIO TRANSPORTATION BRIEF Prepared for: Guycoki (Eastern) Limited June 16, 2016 116-638 Brief_1.doc D. J. Halpenny & Associates Ltd. Consulting
Table Existing Traffic Conditions for Arterial Segments along Construction Access Route. Daily
 5.8 TRAFFIC, ACCESS, AND CIRCULATION This section describes existing traffic conditions in the project area; summarizes applicable regulations; and analyzes the potential traffic, access, and circulation
INTERSECTION CONTROL EVALUATION
 INTERSECTION CONTROL EVALUATION Trunk Highway 22 and CSAH 21 (E Hill Street/Shanaska Creek Road) Kasota, Le Sueur County, Minnesota November 2018 Trunk Highway 22 and Le Sueur CSAH 21 (E Hill Street/Shanaska
HIGHWAY 28 FUNCTIONAL DESIGN
 HIGHWAY 28 FUNCTIONAL DESIGN PUBLIC OPEN HOUSE #1 WEDNESDAY, MARCH 12, 2014 Stantec Presenters: Brad Vander Heyden, Project Engineer Neal Cormack, Project Manager Dave Parker, Project Engineer Beth Thola,
MEMORANDUM. Figure 1. Roundabout Interchange under Alternative D
 MEMORANDUM Date: To: Liz Diamond, Dokken Engineering From: Subject: Dave Stanek, Fehr & Peers Western Placerville Interchanges 2045 Analysis RS08-2639 Fehr & Peers has completed a transportation analysis
West Rosslyn Development
 Traffic Impact Study and Transportation Management Plan West Rosslyn Development Arlington County, VA Revised: January 11, 2017 May 10, 2016 Prepared for: Penzance 2400 N Street, NW, Suite 600 Washington,
TRAFFIC DATA. Existing Derousse Ave./River Rd. AM LOS Analysis Existing Derousse Ave./River Rd. PM LOS Analysis
 Appendix E NJ TRANSIT Pennsauken Junction Transit Center and Park & Ride RiverLINE and Atlantic City Line Pennsauken Township, Camden County, New Jersey TRAFFIC DATA Background Traffic Information for
Interstate Operations Study: Fargo-Moorhead Metropolitan Area Simulation Output
 NDSU Dept #2880 PO Box 6050 Fargo, ND 58108-6050 Tel 701-231-8058 Fax 701-231-6265 www.ugpti.org www.atacenter.org Interstate Operations Study: Fargo-Moorhead Metropolitan Area 2015 Simulation Output Technical
TECHNICAL MEMORANDUM. Part A: Introduction
 TECHNICAL MEMORANDUM To: David J. Decker Decker Properties, Inc. 5950 Seminole Centre Ct. Suite 200 Madison, Wisconsin 53711 608-663-1218 Fax: 608-663-1226 www.klengineering.com From: Mike Scarmon, P.E.,
Traffic Impact Study Proposed Residential Development (Watson Parkway North - Starwood Drive Node, City of Guelph)
") Traffic Impact Study Proposed Residential Development (Watson Parkway North - Starwood Drive Node, City of Guelph) Prepared By: 332 Lorne Avenue East Stratford ON N5A 6S4 Prepared for: Paul Kemper, President
Traffic Impact Study Proposed Residential Development (Watson Parkway North - Starwood Drive Node, City of Guelph) Prepared By: 332 Lorne Avenue East Stratford ON N5A 6S4 Prepared for: Paul Kemper, President
2.0 Development Driveways. Movin Out June 2017
 Movin Out June 2017 1.0 Introduction The proposed Movin Out development is a mixed use development in the northeast quadrant of the intersection of West Broadway and Fayette Avenue in the City of Madison.
Figure 1 Map of intersection of SR 44 (Ravenna Rd) and Butternut Rd
 and Butternut Rd") Abbreviated Study District: 12 County: Geauga Route: SR 44 Section: 1.58 GEA 44 1.58 213 HSP # 47 (Rural Intersection) Prepared April 23, 215 By Bryan Emery Existing Conditions This study contains the
Abbreviated Study District: 12 County: Geauga Route: SR 44 Section: 1.58 GEA 44 1.58 213 HSP # 47 (Rural Intersection) Prepared April 23, 215 By Bryan Emery Existing Conditions This study contains the
APPENDIX B Traffic Analysis
 APPENDIX B Traffic Analysis Rim of the World Unified School District Reconfiguration Prepared for: Rim of the World School District 27315 North Bay Road, Blue Jay, CA 92317 Prepared by: 400 Oceangate,
Letter of Transmittal
 Letter of Transmittal To: Chris Lovell City of Richmond Hill Date: 5/2/6 Job 2582 Re: Richmond Hill-South Bryan County Transportation STudy WE ARE SENDING YOU THE FOLLOWING ITEMS ( attached) ( under separate
MADERAS HOTEL TRANSPORTATION IMPACT ANALYSIS. LLG Ref Transportation Planner III & Jorge Cuyuch Transportation Engineer I
 TRANSPORTATION IMPACT ANALYSIS MADERAS HOTEL Poway, California June 21, 2016 LLG Ref. 3-16-2602 Prepared by: Amelia Giacalone Transportation Planner III & Jorge Cuyuch Transportation Engineer I Under the
TALMONT TOWNHOMES MADISON KENNETH SPA TRAFFIC IMPACT STUDY. Sacramento, CA. Prepared For: MBK Homes. Prepared By:
 TALMONT TOWNHOMES MADISON KENNETH SPA TRAFFIC IMPACT STUDY Sacramento, CA Prepared For: MBK Homes Prepared By: KD Anderson & Associates 3853 Taylor Road, Suite G Loomis, California 95650 (916) 660-1555
INTERSECTION ANALYSIS PARK AVENUE AND BRADDOCK ROAD (FROSTBURG, MD) FOR LENHART TRAFFIC CONSULTING, INC.
 FOR LENHART TRAFFIC CONSULTING, INC.") INTERSECTION ANALYSIS FOR PARK AVENUE AND BRADDOCK ROAD (FROSTBURG, MD) Prepared for: City of Frostburg, Maryland & Allegany County Commissioners Prepared by: LENHART TRAFFIC CONSULTING, INC. TRAFFIC ENGINEERING
INTERSECTION ANALYSIS FOR PARK AVENUE AND BRADDOCK ROAD (FROSTBURG, MD) Prepared for: City of Frostburg, Maryland & Allegany County Commissioners Prepared by: LENHART TRAFFIC CONSULTING, INC. TRAFFIC ENGINEERING
Evaluation of Renton Ramp Meters on I-405
 Evaluation of Renton Ramp Meters on I-405 From the SE 8 th St. Interchange in Bellevue to the SR 167 Interchange in Renton January 2000 By Hien Trinh Edited by Jason Gibbens Northwest Region Traffic Systems
Traffic Feasibility Study
 Traffic Feasibility Study Town Center South Robbinsville Township, Mercer County, New Jersey December 19, 2017 Prepared For Robbinsville Township Department of Community Development 2298 Route 33 Robbinsville,
The Eastern Connector Study November, 2007 planning for the future
 The Eastern Connector Study November, 2007 planning for the future In late 2006, Albemarle County and the City of Charlottesville jointly initiated the Eastern Connector Corridor Study. The Project Team
MINERVA PARK SITE TRAFFIC IMPACT STUDY M/I HOMES. September 2, 2015
 5500 New Albany Road Columbus, Ohio 43054 Phone: 614.775.4500 Fax: 614.775.4800 Toll Free: 1-888-775-EMHT emht.com 2015-1008 MINERVA PARK SITE TRAFFIC IMPACT STUDY M/I HOMES September 2, 2015 Engineers
Proposed CVS/pharmacy
 Traffic Impact and Access Study Proposed CVS/pharmacy West Main Street (Route 1) at Hull Street Clinton, Connecticut PREPARED FOR Arista Development LLC 520 Providence Highway, Suite 9 Norwood, Massachusetts
TABLE OF CONTENTS SECTION PAGE. Executive Summary... xii
 TABLE OF CONTENTS SECTION PAGE Executive Summary... xii 1.0 Introduction... 1 1.1 Study Area... 2 1.2 Traffic Impact Analysis Scenarios... 4 1.3 Study Area - City of Orange... 4 2.0 Project Description
Oakbrook Village Plaza City of Laguna Hills
 Oakbrook Village Plaza City of Laguna Hills Traffic Impact Analysis Prepared by: HDR Engineering 3230 El Camino Real, Suite 200 Irvine, CA 92602 October 2012 Revision 3 D-1 Oakbrook Village Plaza Laguna
HUMC/Mountainside Hospital Redevelopment Plan
 Traffic and Parking Analysis HUMC/Mountainside Hospital Redevelopment Plan in Glen Ridge Borough and Montclair Township PREPARED FOR H2M 119 Cherry Hill Road, Suite 110 Parsippany, NJ 07054 862.207.5900
BROWARD BOULEVARD CORRIDOR TRANSIT STUDY
 BROWARD BOULEVARD CORRIDOR TRANSIT STUDY FM # 42802411201 EXECUTIVE SUMMARY July 2012 GOBROWARD Broward Boulevard Corridor Transit Study FM # 42802411201 Executive Summary Prepared For: Ms. Khalilah Ffrench,
TRAFFIC IMPACT ANALYSIS SHORTBREAD LOFTS 2009 MODIFICATION Chapel Hill, North Carolina
 TRAFFIC IMPACT ANALYSIS SHORTBREAD LOFTS 2009 MODIFICATION Chapel Hill, North Carolina Prepared for: The Town of Chapel Hill, NC Prepared by: Architects-Engineers-Planners, Inc. November 2009 Traffic Impact
TRAFFIC IMPACT ANALYSIS. for MILTON SQUARE
 TRAFFIC IMPACT ANALYSIS for MILTON SQUARE US Route 7 Milton, Vermont March 5, 2008 LAMOUREUX & DICKINSON 14 Morse Drive Essex Junction, Vermont 05452 (802) 878-4450 Traffic Impact Assessment EXECUTIVE
Traffic Impact Analysis Update
 Willow Bend Traffic Impact Analysis Update TABLE OF CONTENTS Page I. INTRODUCTION -------------------------------------------------------------------------------------------- 1 II. EXISTING CONDITIONS
I-820 (East) Project Description. Fort Worth District. Reconstruct Southern I-820/SH 121 Interchange
 Project Description. Fort Worth District. Reconstruct Southern I-820/SH 121 Interchange") I-820 (East) Project Description Fort Worth District Reconstruct Southern I-820/SH 121 Interchange I-820 from approximately 2,000 feet north of Pipeline Road/Glenview Drive to approximately 3,200 feet
I-820 (East) Project Description Fort Worth District Reconstruct Southern I-820/SH 121 Interchange I-820 from approximately 2,000 feet north of Pipeline Road/Glenview Drive to approximately 3,200 feet
The major roadways in the study area are State Route 166 and State Route 33, which are shown on Figure 1-1 and described below:
 3.5 TRAFFIC AND CIRCULATION 3.5.1 Existing Conditions 3.5.1.1 Street Network DRAFT ENVIRONMENTAL IMPACT REPORT The major roadways in the study area are State Route 166 and State Route 33, which are shown
Volume 1 Traffic Impact Analysis Turtle Creek Boulevard Dallas, Texas. Kimley-Horn and Associates, Inc. Dallas, Texas.
 Volume 1 Traffic Impact Analysis 2727 Dallas, Texas June 18, 2018 Kimley-Horn and Associates, Inc. Dallas, Texas Project #064523000 Registered Firm F-928 Traffic Impact Analysis 2727 Dallas, Texas Prepared
DEVELOPMENT PROPERTY 1627 MAXIME STREET CITY OF OTTAWA TRANSPORTATION OVERVIEW. Prepared for: Subhas Bhargava. July 9, Overview_1.
 DEVELOPMENT PROPERTY 1627 MAXIME STREET CITY OF OTTAWA TRANSPORTATION OVERVIEW Prepared for: Subhas Bhargava July 9, 2015 115-620 Overview_1.doc D. J. Halpenny & Associates Ltd. Consulting Transportation
MONTEREY BAY AQUARIUM RESEARCH INSTITUTE (MBARI) MASTER PLAN UPDATE MOSS LANDING, CALIFORNIA
 MASTER PLAN UPDATE MOSS LANDING, CALIFORNIA") MONTEREY BAY AQUARIUM RESEARCH INSTITUTE (MBARI) MASTER PLAN UPDATE MOSS LANDING, CALIFORNIA TRAFFIC IMPACT ANALYSIS Administrative Draft Report Prepared For Monterey Bay Aquarium Research Institute Moss
MONTEREY BAY AQUARIUM RESEARCH INSTITUTE (MBARI) MASTER PLAN UPDATE MOSS LANDING, CALIFORNIA TRAFFIC IMPACT ANALYSIS Administrative Draft Report Prepared For Monterey Bay Aquarium Research Institute Moss
December 5, Red Bank Planning Board Municipal Building 90 Monmouth Street Red Bank, NJ 07701
 Dynamic Traffic, LLC www.dynamic-traffic.com 1904 Main Street Lake Como, NJ 07719 T. 732.681.0760 December 5, 2016 Red Bank Planning Board Municipal Building 90 Monmouth Street Red Bank, NJ 07701 Re: Traffic
TRAFFIC AND TRANSPORTATION TECHNICAL MEMORANDUM
 TRAFFIC AND TRANSPORTATION TECHNICAL MEMORANDUM for ENVIRONMENTAL ASSESSMENT US 460 Bypass Interchange and Southgate Drive Relocation State Project No.: 0460-150-204, P101, R201, C501, B601; UPC 99425
TRAFFIC PARKING ANALYSIS
 TRAFFIC PARKING ANALYSIS NAPA FLEA MARKET COUNTY OF NAPA Prepared for: Tom Harding Napa-Vallejo Flea Market 33 Kelly Road American Canyon, CA 9453 Prepared by: 166 Olympic Boulevard, Suite 21 Walnut Creek,
Craig Scheffler, P.E., PTOE HNTB North Carolina, P.C. HNTB Project File: Subject
 TECHNICAL MEMORANDUM To Kumar Neppalli Traffic Engineering Manager Town of Chapel Hill From Craig Scheffler, P.E., PTOE HNTB North Carolina, P.C. Cc HNTB Project File: 38435 Subject Obey Creek TIS 2022
2405 Mer Bleue Orleans, (Ottawa), ON Community Transportation Study Mattamy Homes. Prepared By: Stantec Consulting Ltd. Version 2
, ON Community Transportation Study Mattamy Homes. Prepared By: Stantec Consulting Ltd. Version 2") 2405 Mer Bleue Orleans, (Ottawa), ON Community Transportation Study Mattamy Homes Prepared By: Stantec Consulting Ltd. Version 2 April 2014 Stantec Consulting Ltd. 400-1331 Clyde Avenue, Ottawa ON K2C
2405 Mer Bleue Orleans, (Ottawa), ON Community Transportation Study Mattamy Homes Prepared By: Stantec Consulting Ltd. Version 2 April 2014 Stantec Consulting Ltd. 400-1331 Clyde Avenue, Ottawa ON K2C
GASOLINE SERVICE STATION 1618, 1622 ROGER STEVENS DRIVE OTTAWA, ONTARIO TRANSPORTATION IMPACT ASSESSMENT. Prepared for:
 GASOLINE SERVICE STATION 1618, 1622 ROGER STEVENS DRIVE OTTAWA, ONTARIO TRANSPORTATION IMPACT ASSESSMENT Prepared for: Invecta Development (Ottawa) Corporation 758 Shanks Height Milton, ON L9T 7P7 May
CITY OF POWAY MEMORANDUM
 CITY OF POWAY MEMORANDUM TO: FROM: Traffic Safety Committee Steve Crosby P.E., City Engineer DATE: February 14, 2018 SUBJECT: Espola Road speeding concerns BACKGROUND In 2017, staff received a request
Construction Realty Co.
 MEMORANDUM TO: FROM : Jeff Pickus Construction Realty Co. Luay R. Aboona, PE Principal 9575 West Higgins Road, Suite 400 Rosemont, Illinois 60018 p: 847-518-9990 f: 847-518-9987 DATE: May 22, 2014 SUBJECT:
TRANSPORTATION TECHNICAL REPORT
 TRANSPORTATION TECHNICAL REPORT for Sunrise Elementary School Replacement PREPARED FOR: Puyallup School District PREPARED BY: 6544 NE 61 st Street, Seattle, WA 98115 ph: (26) 523-3939 fx: (26) 523-4949
Appendix C-5: Proposed Refinements Rail Operations and Maintenance Facility (ROMF) Traffic Impact Analysis. Durham-Orange Light Rail Transit Project
 Traffic Impact Analysis. Durham-Orange Light Rail Transit Project") Appendix C-5: Proposed Refinements Rail Operations and Maintenance Facility (ROMF) Traffic Impact Analysis Durham-Orange Light Rail Transit Project July 25, 218 ROMF Transportation Impact Analysis Version
Appendix C-5: Proposed Refinements Rail Operations and Maintenance Facility (ROMF) Traffic Impact Analysis Durham-Orange Light Rail Transit Project July 25, 218 ROMF Transportation Impact Analysis Version
April 7, Mr. Blake Shutler Compass Homes Development LLC Summit Homes Construction, LLC PO Box 6539 Dillon, CO 80435
 Compass Homes Development LLC Summit Homes Construction, LLC PO Box 6539 Dillon, CO 80435 Re: Trip Generation Comparison West Hills Townhomes Keystone, Colorado FHU Reference No. 116388-01 Dear Mr. Shutler:
One Harbor Point Residential
 Residential Gig Harbor, WA Transportation Impact Analysis January 23, 2017 Prepared for: Neil Walter Company PO Box 2181 Tacoma, WA 98401 Prepared by: TENW Transportation Engineering NorthWest 11400 SE
Access Management Standards
 Access Management Standards This section replaces Access Control Standards on Page number 300-4 of the Engineering Standards passed February 11, 2002 and is an abridged version of the Access Management
Vanier Parkway and Presland Road Residential Development Transportation Impact Study
 Vanier Parkway and Presland Road Residential Development Transportation Impact Study Final Report (Revised) March 2011 Submitted to: Groupe Lépine Ottawa Project No. 09-1613 Submitted by: Groupe Lépine
Missouri Seat Belt Usage Survey for 2017
 Missouri Seat Belt Usage Survey for 2017 Conducted for the Highway Safety & Traffic Division of the Missouri Department of Transportation by The Missouri Safety Center University of Central Missouri Final
Open House. Highway212. Meetings. Corridor Access Management, Safety & Phasing Plan. 5:30 to 6:30 p.m. - Southwest Corridor Transportation Coalition
 Welcome Meetings 5:30 to 6:30 p.m. - Southwest Corridor Transportation Coalition 6:30 to 8:00 p.m. - Open House Why is Highway 212 Project Important? Important Arterial Route Local Support Highway 212
TRAFFIC IMPACT ANALYSIS SAFARI HIGHLANDS RANCH
 TRAFFIC IMPACT ANALYSIS SAFARI HIGHLANDS RANCH, California November 11, 2016 LLG Ref. 3-14-2334 EXECUTIVE SUMMARY The Project proposes the development of 550 luxury residential dwelling units, public trails,
Interchange Justification Report
 Interchange Justification Report Interstate 29 at 85 th Street- Exit 74 Sioux Falls, SD SEH No. 132589 October 1, 2018 Prepared by: Short Elliott Hendrickson Inc. Executive Summary The Interchange Justification
Diablo Vista Pumping Plant Replacement
 Diablo Vista Pumping Plant Replacement Traffic Study PHA Transportation Consultants 12-05-359 October 2012 Diablo Vista Pumping Plant Replacement Traffic Study For EBMUD October 2012 PHA Transportation