Appendix G: Transportation/Traffic
|
|
|
- Griselda Ray
- 5 years ago
- Views:
Transcription
1 City of Irvine - William Lyon Homes: Vista Verde Draft EIR Appendix G: Transportation/Traffic Michael Brandman Associates H:\Client (PN-JN)\0006\ \EIR\3 - DEIR\ Sec99-00 Appendix Dividers Vista Verde.doc
2

3 VISTA VERDE PROJECT TRAFFIC IMPACT ANALYSIS Prepared for WILLIAM LYON HOMES Prepared by ALTON PARKWAY, IRVINE, CALIFORNIA CONTACT: MIKE ERICKSON December 20, 2010 JN
4 TABLE OF CONTENTS EXECUTIVE SUMMARY... 1 INTRODUCTION... 3 Study Area... 3 Intersection Analysis Methodology... 4 Roadway Segment Analysis Methodology... 6 Peak Hour Performance Criteria... 7 Thresholds of Significance... 7 EXISTING CONDITIONS... 7 Roadway Description... 7 Existing Conditions Traffic Volumes... 8 Existing Conditions Peak Hour Intersection Level of Service... 9 Existing Conditions Roadway Segment ADT Analysis... 9 Existing Arterial Peak Hour Link Analysis PROPOSED PROJECT Forecast Project Trip Generation Project Trip Distribution EXISTING PLUS PROJECT CONDITIONS Existing Plus Project Conditions Traffic Volumes Existing Plus Project Conditions Peak Hour Intersection Level of Service Existing Plus Project Conditions Roadway Segment ADT Analysis Existing Plus Project Conditions Arterial Peak Hour Link Analysis YEAR 2015 (INTERIM) WITHOUT PROJECT CONDITIONS Year 2015 (Interim) Without Project Conditions Traffic Volumes Year 2015 (Interim) Without Project Conditions Peak Hour Intersection Level of Service Year 2015 (Interim) Without Project Conditions Roadway Segment ADT Analysis Year 2015 (Interim) Without Project Conditions Arterial Peak Hour Link Analysis YEAR 2015 (INTERIM) WITH PROJECT CONDITIONS Year 2015 (Interim) With Project Conditions Traffic Volumes Year 2015 (Interim) With Project Conditions Peak Hour Intersection Level of Service Year 2015 (Interim) With Project Conditions Roadway Segment ADT Analysis Year 2015 (Interim) With Project Conditions Arterial Peak Hour Link Analysis... 23
5 POST-2030 WITHOUT PROJECT CONDITIONS Post-2030 Without Project Conditions Traffic Volumes Post-2030 Without Project Conditions Peak Hour Intersection Level of Service Post-2030 Without Project Conditions Roadway Segment ADT Analysis Post-2030 Without Project Conditions Arterial Peak Hour Link Analysis POST-2030 WITH PROJECT CONDITIONS Post-2030 With Project Conditions Traffic Volumes Post-2030 With Project Conditions Peak Hour Intersection Level of Service Forecast for Post-2030 With Project Conditions Signal Warrant Analysis Post-2030 With Project Conditions Roadway Segment ADT Analysis Post-2030 With Project Conditions Arterial Peak Hour Link Analysis POST-2030 PENDING WITHOUT PROJECT CONDITIONS Post-2030 Pending Without Project Conditions Traffic Volumes Post-2030 Pending Without Project Conditions Peak Hour Intersection Level of Service Post-2030 Pending Without Project Conditions Roadway Segment ADT Analysis Post-2030 Pending Without Project Conditions Arterial Peak Hour Link Analysis POST-2030 PENDING WITH PROJECT CONDITIONS Post-2030 Pending With Project Conditions Traffic Volumes Post-2030 Pending With Project Conditions Peak Hour Intersection Level of Service Post-2030 Pending With Project Conditions Signal Warrant Analysis Post-2030 Pending With Project Conditions Roadway Segment ADT Analysis Post-2030 Pending With Project Conditions Arterial Peak Hour Link Analysis SPECIAL ISSUES Access Analysis TDP-1: Turn Lane Pocket Length Evaluation TDP-2: Bay Taper Length Evaluation TDP-3: Left-Turn In/Out Access Evaluation TDP-4: Right-Turn Lanes at Driveways TDP-10: Intersection Spacing Evaluation TDP-14: Driveway Length Evaluation Pedestrian Circulation Bicycle Circulation Traffic Comparison To Prior Use Lower Density Alternative Analysis Summary Orange County Congestion Management Program Analysis MITIGATION MEASURES CONCLUSIONS... 50
6 APPENDIX A EXISTING COUNT DATA APPENDIX B LOS ANALYSIS SHEETS APPENDIX C SIGNAL WARRANT ANALYSIS SHEET APPENDIX D APPROVED SCOPE OF WORK
7 LIST OF TABLES Table 1 Intersection LOS & V/C Ratio Ranges... 5 Table 2 LOS & Delay Ranges... 5 Table 3 Roadway Segment LOS & V/C Ratio Ranges... 6 Table 4 Roadway Segment LOS & V/C Ratio Ranges... 6 Table 5 Existing Conditions AM & PM Peak Hour LOS of Study Intersections... 9 Table 6 Existing Conditions Study Roadway Segment ADT Analysis Table 7 University Drive Existing Roadway Segment Peak Hour Link Analysis Table 8 Existing Conditions Distance Summary Table 9 ITAM Land Use Assumptions Table 10 Project Socioeconomic-Based Forecast Trip Generation Table 11 ITE Trip Generation Rates Table 12 Project ITE-Based Forecast Trip Generation Table 13 Existing and Existing Plus Project Conditions AM & PM Peak Hour LOS of Study Intersections Table 14 Existing and Existing Plus Project Conditions Study Roadway Segment ADT Analysis Table 15 University Drive Existing and Existing Plus Project Conditions Roadway Segment Peak Hour Link Analysis Table 16 Year 2015 (Interim) Without Project Conditions AM & PM Peak Hour LOS of Study Intersections Table 17 Year 2015 (Interim) Without Project Conditions Study Roadway Segment ADT Analysis Table 18 University Drive Year 2015 (Interim) Without Project Conditions Roadway Segment Peak Hour Link Analysis Table 19 Year 2015 (Interim) Without Project Conditions and Year 2015 (Interim) With Project Conditions AM & PM Peak Hour LOS of Study Intersections Table 20 Year 2015 (Interim) Without Project Conditions and Year 2015 (Interim) With Project Conditions Study Roadway Segment ADT Analysis Table 21 University Drive Year 2015 (Interim) Without Project Conditions and Year 2015 (Interim) With Project Conditions Roadway Segment Peak Hour Link Analysis Table 22 Post-2030 Without Project Conditions AM & PM Peak Hour LOS of Study Intersections Table 23 Post-2030 Without Project Conditions Study Roadway Segment ADT Analysis Table 24 University Drive Post-2030 Roadway Segment Peak Hour Link Analysis Table 25 Post-2030 Without Project Conditions and Post-2030 With Project Conditions AM & PM Peak Hour LOS of Study Intersections Table 26 Post-2030 With Project Conditions Traffic Signal Warrant Analysis Summary Table 27 Post-2030 Without Project Conditions and Post-2030 With Project Conditions Study Roadway Segment ADT Analysis Table 28 University Drive Post-2030 Without Project Conditions and Post-2030 With Project Conditions Roadway Segment Peak Hour Link Analysis Table 29 Post-2030 Without Project Conditions AM & PM Peak Hour LOS of Study Intersections Table 30 Post-2030 Pending Without Project Conditions Study Roadway Segment ADT Analysis Table 31 University Drive Post-2030 Pending Without Project Roadway Segment Peak Hour Link Analysis... 35
8 Table 32 Post-2030 Pending Without Project Conditions and Post-2030 With Project Conditions AM & PM Peak Hour LOS of Study Intersections Table 33 Post-2030 Pending With Project Conditions Traffic Signal Warrant Analysis Summary Table 34 Post-2030 Pending Without Project Conditions and Post-2030 With Project Conditions Study Roadway Segment ADT Analysis Table 35 University Drive Post-2030 Pending Without Project Conditions and Post With Project Conditions Roadway Segment Peak Hour Link Analysis Table 36 Post-2030 With Project Conditions Turn Lane Pocket Length Evaluation Table 37 Right-Turn Lane Warrant Table 38 Distance Between Driveways & Intersections Table 39 Forecast Distance Between Driveways Summary Table 40 Preliminary Trip Generation Comparison of Vista Verde School Site Conversion Based on IUSD Information Table 41 Preliminary Trip Generation Comparison of Vista Verde School Site Conversion Based on ITAM Model Assumptions Table 42 Vista Verde Project Lower Density Alternative Trip Generation Comparison Table 43 Forecast Distance Between Driveways Summary... 48
9 LIST OF EXHIBITS Follows Page Exhibit 1 Regional Project Location... 3 Exhibit 2 Project Site Location... 3 Exhibit 3 Study Intersection Locations... 4 Exhibit 4 Existing AM/PM Peak Hour Study Intersection Volumes... 9 Exhibit 5 Existing ADT Volumes... 9 Exhibit 6 Existing Study Intersection/Roadway Segment Geometry... 9 Exhibit 7 Proposed Project Site Plan Exhibit 8 Forecast Inbound Trip Percent Distribution of Proposed Project Exhibit 9 Forecast Outbound Trip Percent Distribution of Proposed Project Exhibit 10 Existing With Project AM/PM Peak Hour Study Intersection Volumes Exhibit 11 Existing With Project ADT Volumes Exhibit 12 Forecast Year 2015 (Interim) Without Project AM/PM Peak Hour Study Intersection Volumes Exhibit 13 Forecast Year 2015 (Interim) Without Project ADT Volumes Exhibit 14 Forecast Year 2015 (Interim) With Project AM/PM Peak Hour Study Intersection Volumes Exhibit 15 Forecast Year 2015 (Interim) With Project ADT Volumes Exhibit 16 Post-2030 Without Project AM/PM Peak Hour Study Intersection Volumes Exhibit 17 Post-2030 Without Project ADT Volumes Exhibit 18 Post-2030 With Project AM/PM Peak Hour Study Intersection Volumes Exhibit 19 Post-2030 With Project ADT Volumes Exhibit 20 Post-2030 Pending Without Project AM/PM Peak Hour Study Intersection Volumes Exhibit 21 Post 2030 Pending Without Project ADT Volumes Exhibit 22 Post-2030 Pending With Project AM/PM Peak Hour Study Intersection Volumes Exhibit 23 Post-2030 Pending With Project ADT Volumes Exhibit 24 Post-2030 With Project AM/PM Peak Hour Project Access Volumes Exhibit 25 Proposed Project Site Plan Lower Density Alternative... 47
10 EXECUTIVE SUMMARY This study analyzes the forecast traffic conditions associated with the proposed Vista Verde project in the City of Irvine. The project site is located at the southwest corner of the Rosa Drew Lane/Michelson Drive intersection and is generally bound by existing single-family homes on Cottonwood Lane to the west, Dave Robins Park to the south, Michelson Drive and single-family homes beyond to the north, and Rosa Drew Lane and Parkwood Apartments to the east. The proposed project consists of 66 detached single-family dwelling units. The prior use of this site was for the Vista Verde Elementary School, which closed December The closed Vista Verde Elementary School utilized two access locations along Michelson Drive the westerly access with full inbound/outbound access and the easterly access with right-in/right-out/left-out access. Site access at the project is proposed to be provided via a single stop-controlled full-access location at Michelson Drive consisting of one inbound lane and one outbound stop-controlled, shared left-turn/right-turn lane. Since only one access location at the project site is planned, the number of existing access locations at the project site will be reduced by one location. Existing roadway striping of the westbound left-turn lane pocket on Michelson Drive at the project access location is planned to be shifted slightly easterly to line up with the single project access location. Motorists turning left into the project site will yield to oncoming traffic on Michelson Drive. Motorists exiting the project site will be stop-controlled; motorists on Michelson Drive will continue to be uncontrolled. Though the project site was previously utilized for a school, since that use has not existed since December 2006, the impact analysis and identification of potential mitigation measures does not assume trip generation credits for the prior school use. The proposed 66 detached single-family dwelling unit project is forecast to generate 632 daily trips, which include 50 a.m. peak hour trips and 66 p.m. peak hour trips based on application of standard ITE trip generation rates. Trip generation based on the ITAM model forecast results in generation of 567 daily trips, which include 48 a.m. peak hour trips and 48 p.m. peak hour trips. The addition of project-generated trips is forecast to not result in a change in the level of service at any of the study intersections or study roadway segments for either short-term or buildout forecasts. Based on City-established thresholds of significance, the addition of projectgenerated trips is forecast to result in no significant impacts at the study intersections or roadways for any of the analysis scenarios; hence, no mitigation measures are required for the proposed project since the LOS for any intersection operating at a deficient LOS (LOS E or worse) does not change with implementation of the proposed project. The proposed project site is planned to link the existing pedestrian circulation system at the project access point. Pedestrian and bicyclist conditions will be improved along the project frontage on Michelson Drive since the proposed project plans to remove one of the existing project site driveways, thereby reducing the number of locations where potential conflicts between pedestrians/bicyclists and vehicles entering/exiting the project site occur. Additionally, since a connective pedestrian and bicycle trail already exists, implementation will enhance both the pedestrian and bicycle circulation system consistent with Circulation Objectives B-3 and B-4. A lower density alternative to the proposed project has been proposed, which reduces the number of units on the site to 54 units, while still taking access from a single access off 1
11 Michelson Drive. That lower density 54 detached single-family dwelling unit project alternative will generate 115 less daily trips, which consist of 10 less a.m. peak hour trips and 11 less p.m. peak hour trips based on application of the ITE trip generation rates. Therefore, any potential impacts caused by the proposed 54 detached single-family dwelling unit alternative project will be the same as or less than the proposed 66 detached single-family dwelling unit project. 2
12 INTRODUCTION This study analyzes the forecast traffic conditions associated with the proposed Vista Verde project in the City of Irvine. The project site is located at the southwest corner of the Rosa Drew Lane/Michelson Drive intersection and is generally bound by existing single-family homes on Cottonwood Lane to the west, Dave Robins Park to the south, Michelson Drive and single-family homes beyond to the north, and Rosa Drew Lane and Parkwood Apartments to the east. The prior use of this site was for the Vista Verde Elementary School, which closed December The closed Vista Verde Elementary School utilized two access locations along Michelson Drive the westerly access with full inbound/outbound access and the easterly access with right-in/right-out/left-out access. Site access at the project is proposed to be provided via a single stop-controlled full-access location at Michelson Drive consisting of one inbound lane and one outbound stop-controlled, shared left-turn/right-turn lane. Since only one access location at the project site is planned, the number of existing access locations at the project site is reduced by one location. Existing roadway striping of the westbound left-turn lane pocket on Michelson Drive at the project access location is planned to be shifted easterly to line up with the access location. Motorists turning left into the project site will yield to oncoming traffic on Michelson Drive. Motorists exiting the project site will be stop-controlled; motorists on Michelson Drive are uncontrolled. Though the project site was previously utilized for a school, since that use has not existed since December 2006, the impact analysis and identification of potential mitigation measures does not assume trip generation credits for the prior school use. Exhibit 1 shows the regional location of the project site. Exhibit 2 shows the project site location. Study Area The study area is defined by the following boundaries: Michelson Drive on the north; University Drive on the east and south; and Culver Drive on the west. The following seven (7) study intersections are included for analysis: Culver Drive/Michelson Drive; Sandburg Way/Michelson Drive; Yale Avenue/Michelson Drive; Yale Avenue/University Drive; Rosa Drew Lane/Michelson Drive; 3
13 SAN FERNANDO MOORPARK THOUSAND OAKS AGOURA HILLS 118 VENTURA CO LOS ANGELES CO MAILBU SIMI VALLEY CALABASSAS SANTA MONICA PACIFIC OCEAN WEST HOLLYWOOD BEVERLY HILLS REDONDO BEACH RANCHO PALOS VERDES BURBANK LOS 110 ANGELES INGLEWOOD HAWTHORNE GLENDALE CARSON 103 SAN PEDRO SOUTH GATE LONG BEACH ANGELES NATIONAL FOREST PASADENA ALHAMBRA 19 MONTEBELLO PARAMOUNT CYPRESS HUNTINGTON BEACH EL MONTE WHITTIER LOS ANGELES CO ORANGE CO FULLERTON ANAHEIM AZUSA 60 NEWPORT BEACH WEST COVINA COSTA MESA POMONA SAN BERNARDINO CO ORANGE CO 261 SANTA ANA IRVINE * 73 PROJECT SITE WALNUT ORANGE SAN DIMAS LAGUNA BEACH YORBA LINDA 241 LOS ANGELES CO CHINO 5 LAGUNA NIGUEL SAN BERNARDINO CO 83 RIVERSIDE CO ORANGE CO 241 RANCHO CUCAMONGA MISSION VIEJO ONTARIO NORCO 91 CORONA CLEVELAND NATIONAL FOREST SAN JUAN CAPISTRANO FONTANA RIVERSIDE Not to Scale H:\pdata\ \Traffic\Exhibits\Exh01.ai DEC/2010 Regional Project Location Exhibit 1
14 Not to Scale ROSA DREW LN YALE AVE UNIVERSITY DR MICHELSON DR DEC/2010 CULVER DR SANDBURG WAY Legend: Project Site Location H:\pdata\ \Traffic\Exhibits\Exh02.ai PROJECT SITE Project Site Location Exhibit 2
15 Ridgeline Drive-Rosa Drew Lane/University Drive; and Michelson Drive/University Drive. None of the seven study intersections are identified as priority intersections in the 2008 Citywide Circulation Phasing Analysis (Parsons Brinckerhoff, April 2009). Additionally, this analysis includes the following five (5) roadway links for analysis: University Drive between Rosa Drew Lane and Yale Avenue; University Drive between Rosa Drew Lane and Michelson Drive; Rosa Drew Lane between Michelson Drive and University Drive; Michelson Drive west of Rosa Drew Lane; and Michelson Drive west of Yale Avenue. Exhibit 3 shows the location of the study intersections and roadway segments, which are analyzed for the following study scenarios: Existing conditions; Existing plus project conditions; Year 2015 (interim) without project conditions; Year 2015 (interim) with project conditions; Post-2030 without project conditions; Post-2030 with project conditions; Post-2030 pending without project conditions; and Post-2030 pending with project conditions. Forecast traffic volumes are identified using the Irvine Transportation Analysis Model (ITAM). Intersection Analysis Methodology Level of service (LOS) is commonly used as a qualitative description of intersection operation and is based on the capacity of the intersection and the volume of traffic using the intersection. The Intersection Capacity Utilization (ICU) analysis method is utilized in this study to determine the operating LOS of the signalized study intersections. The ICU analysis methodology describes the operation of an intersection using a range of LOS from LOS A (free-flow conditions) to LOS F (severely congested conditions), based on corresponding Volume/Capacity (V/C) ratios shown in Table 1. 4
16 CULVER DR MICHELSON DR YALE AVE ROSA DREW LN SANDBURG WAY UNIVERSITY DR Legend: Study Intersection Location Roadway Segment ADT Location Project Site Location Not to Scale H:\pdata\ \Traffic\Exhibits\Exh03.ai Study Intersection and Roadway Segment Locations DEC/2010 Exhibit 3
17 Table 1 Intersection LOS & V/C Ratio Ranges LOS V/C Ratio A < 0.60 B 0.61 < 0.70 C 0.71 < 0.80 D 0.81 < 0.90 E 0.91 < 1.00 F > 1.00 Source: 1990 Transportation Research Board The City of Irvine has requested the use of the Highway Capacity Manual (HCM) intersection analysis methodology to analyze the operation of unsignalized intersections. The HCM analysis methodology describes the operation of an intersection using a range of LOS from LOS A (free-flow conditions) to LOS F (severely congested conditions), based on the corresponding stopped delay experienced per vehicle for unsignalized intersections shown in Table 2. LOS Table 2 LOS & Delay Ranges Delay (seconds/vehicle) Unsignalized Intersections A < 10.0 B > 10.0 to < 15.0 C > 15.0 to < 25.0 D > 25.0 to < 35.0 E > 35.0 to < 50.0 F > 50.0 Source: 2000 Highway Capacity Manual. Level of service is based on the average stopped delay per vehicle for all movements of signalized intersections and all-way stop-controlled intersections; for one-way or two-way stopcontrolled intersections, LOS is based on the worst stop-controlled approach. 5
18 Roadway Segment Analysis Methodology Level of service (LOS) is commonly used as a qualitative description of operation and is based on the capacity and the volume of traffic using the facility. In accordance with City of Irvine Traffic Impact Analysis Guidelines (August 24, 2004) roadway link LOS is determined based on corresponding Volume/Capacity (V/C) ratios shown in Table 3. Table 3 Roadway Segment LOS & V/C Ratio Ranges LOS V/C Ratio A < 0.60 B 0.61 < 0.70 C 0.71 < 0.80 D 0.81 < 0.90 E 0.91 < 1.00 F > 1.00 Source: 1990 Transportation Research Board The roadway capacities used in this analysis to determine V/C ratios are shown in Table 4. Facility Type 1 Freeways Freeway Ramps Table 4 Roadway Segment LOS & V/C Ratio Ranges Number of Lanes LOS D Capacity (Vehicles) LOS E Capacity (Vehicles) , , , , , , ,000 90, ,800 22, ,400 16,000 Expressway 6 121, ,000 Major Highways 8 64,800 72, ,600 54,000 Primary Highway 4 28,800 32,000 Secondary Highway 4 25,200 28,000 Commuter 2 11,700 13,000 Commuter (Rural) 2 16,200 18,000 Source: City of Irvine Traffic Impact Analysis Guidelines (August 24, 2004) Note: 1 = Facility type based on the General Plan Circulation Element Arterial Highway Designation. If not listed in the table, facility/number of lanes/capacity is interpolated. 6
19 Peak Hour Performance Criteria Based on Objective G-1, Policy (c) on pages B-7 and B-8 of the Irvine General Plan Circulation Element, LOS D or better shall be considered acceptable for roadway links and intersections. Thresholds of Significance The City of Irvine has established the following thresholds of significance to determine whether the addition of project-generated trips at a study intersection or roadway link results in a significant impact and thus requires mitigation: If the roadway link or signalized intersection in question exceeds the acceptable LOS in the baseline condition and the impact of the development is greater than or equal to 0.02 rounded to the second decimal place, or for intersections projected to be deficient in the most recent Circulation Phasing Analysis Report, the project raises the V/C or ICU by 0.01 rounded to the third decimal place, causing it to become deficient, then project mitigation will be required back at a minimum, to baseline; and The City of Irvine s Link Capacity Analysis guidelines require roadway segments theoretically impacted by the proposed project on an ADT basis be further analyzed using peak hour data. If the roadway segment peak hour data meets the performance criteria then the roadway capacity is determined to satisfy City of Irvine Standards. EXISTING CONDITIONS Roadway Description The characteristics of the roadway system in the vicinity of the project site are described below: Culver Drive in the study area is a six-lane divided roadway trending in a north-south direction. The posted speed limit on Culver Drive is 45 miles per hour. On-street parking is prohibited on Culver Drive in the study area. In the study area, Culver Drive is classified as a Major Highway in the City of Irvine Master Plan of Arterial Highways. Culver Drive contains a sidewalk on both sides of the roadway (approximately 5 feet in width), as well as a bike lane (approximately 7 feet in width) on both sides of the roadway. Michelson Drive between Culver Driver and University Drive is a two-lane divided roadway trending in an east-west direction. Michelson Drive west of Culver Drive is a four-lane divided roadway. Michelson Drive east of University Drive changes name to Strawberry Farm Road and is a two-lane undivided roadway. The posted speed limit on Michelson Drive between Culver Drive and University Drive is 35 miles per hour. On-street parking is prohibited on Michelson Drive in the study area. Michelson Drive is classified as a Commuter Highway in the City of Irvine Master Plan of Arterial Highways. Michelson Drive contains a sidewalk on both sides of the roadway (approximately 5 feet in width), as well as a bike lane (approximately 7 feet in width) on both sides of the roadway. 7
20 Ridgeline Drive is a four-lane undivided roadway trending in a north-south direction. The posted speed limit on Ridgeline Drive is 50 miles per hour. On-street parking is prohibited on Ridgeline Drive. According to City of Irvine Master Plan of Arterial Highways, Ridgeline Drive is classified as a Secondary Highway. North of University Drive, Ridgeline Drive changes name to Rosa Drew Lane. Ridgeline Drive contains a sidewalk on the east side of the roadway (approximately 5 feet in width), as well as a bike lane (approximately 7 feet in width) on both sides of the roadway. Rosa Drew Lane is a two-lane undivided roadway trending in a north-south direction between University Drive and Michelson Drive. On-street parking is permitted on Rosa Drew Lane. North of Michelson Drive, Rosa Drew Lane changes name to Jordan Avenue, and south of University Drive, Rosa Drew Lane changes name to Ridgeline Drive. Rosa Drew Lane is a Local Street. Rosa Drew Lane contains a sidewalk on both sides of the roadway (approximately 5 to 10 feet in width) and does not have a striped bike lane on either side of the roadway. Sandburg Way in the study area is a two-lane undivided roadway in a north-south direction. The posted speed limit on Sandburg Way is 25 miles per hour. On-street parking is permitted on Sandburg Way. Sandburg Way is a Local Street. Sandburg Way contains a sidewalk on both sides of the roadway (approximately 5 feet in width) and does not have a striped bike lane on either side of the roadway. University Drive is a four- to six-lane divided roadway in an east-west direction. The posted speed limit on University Drive ranges between 50 and 55 miles per hour. On-street parking is prohibited on University Drive. According to City of Irvine Master Plan of Arterial Highways, University Drive is classified as a Primary Highway between Culver Drive and Michelson Drive and as Major Highway everywhere else in the study area. University Drive contains a sidewalk on the north side of the roadway (approximately 5 feet in width), as well as a bike lane (approximately 7 feet in width) on both sides of the roadway. Yale Avenue is a two-lane undivided roadway in a north-south direction. On-street parking is prohibited on Yale Avenue. In the study area, Yale Avenue is classified as a Secondary Highway in the City of Irvine Master Plan of Arterial Highways. Yale Avenue contains a sidewalk on both sides of the roadway (approximately 5 to 10 feet in width), as well as a bike lane (approximately 7 feet in width) on both sides of the roadway. It should be noted, for existing and forecast year 2015 conditions, Yale Avenue is assumed to remain in its current condition where it terminates just north of Michelson Drive, allowing vehicular access to and from the Rancho San Joaquin Middle School and does not allow for vehicular access over the I- 405 freeway; however, for forecast year 2030 conditions, Yale Avenue is assumed to allow vehicular traffic to and from the north over the I-405 freeway. Existing Conditions Traffic Volumes To determine the existing operation of the study intersections, two days of a.m. peak hour and p.m. peak hour intersection movement counts were collected, November 18, 2009 and November 19, 2009; a.m. peak period intersection counts were collected from 7:00 a.m. to 9:00 a.m. and p.m. peak period intersection counts were collected from 4:00 p.m. to 6:00 p.m. The highest hour within the peak period counted was identified for each day of counts, and then averaged to identify intersection peak hour movements and submitted to the City of Irvine. The City of Irvine incorporated the collected volumes into the existing ITAM model and produced revised existing volumes for use in this analysis. 8
21 Exhibit 4 shows existing conditions a.m. peak hour and p.m. peak hour volumes at the study intersections based on data provided by the City. To determine the existing operation of the study roadway segments, two days of average daily traffic (ADT) volumes for the roadway circulation system were collected and submitted to the City of Irvine. ADT volumes were collected at respective roadway segments on November 18 and 19, 2009, September 23 and 24, 2009, and October 22 and 23, Exhibit 5 shows existing ADT volumes for the study roadway segments based on data provided by the City; detailed November 2009 traffic count data is contained in Appendix A. Exhibit 6 shows existing conditions study intersection geometry as modeled in ITAM. Exhibit 6a shows post-2030 conditions study intersection geometry as modeled in ITAM. Existing Conditions Peak Hour Intersection Level of Service Table 5 summarizes existing conditions a.m. and p.m. peak hour LOS of the study intersections based on ICU calculations provided by the City and HCM calculations based on data supplied by the City; detailed LOS analysis worksheets are contained in Appendix B. Table 5 Existing Conditions AM & PM Peak Hour LOS of Study Intersections Study Intersection AM Peak Hour V/C Delay LOS PM Peak Hour V/C Delay LOS Culver Dr/Michelson Dr N/A A 0.77 N/A C Sandburg Wy/Michelson Dr 2 N/A 10.4 B N/A 15.3 C Yale Ave/Michelson Dr 2 N/A 10.6 B N/A 12.5 B Yale Ave/University Dr N/A C 0.66 N/A B Rosa Drew Ln/Michelson Dr 2 N/A 8.9 A N/A 10.9 B Ridgeline Dr-Rosa Drew Ln/University Dr N/A C 0.92 N/A E Michelson Dr/University Dr N/A B 0.90 N/A D Note: V/C = volume to capacity ratio; delay shown in seconds per vehicle; deficient intersection operation shown in bold. Source: City provided ITAM data for signalized intersections. 1 = Signalized intersection analyzed utilizing the ICU methodology. 2 = Unsignalized intersection analyzed utilizing the HCM methodology. As shown in Table 5, according to City of Irvine performance criteria, the study intersections are currently operating at an acceptable LOS (LOS D or better) during the a.m. peak hour and p.m. peak hour with the exception of the Rosa Drew Lane/University Drive intersection during the p.m. peak hour. Existing Conditions Roadway Segment ADT Analysis Existing conditions roadway segment ADT analysis has been performed using ADT volumes shown in Exhibit 5. 9
22 Not to Scale 12/30 147/219 10/10 38/16 31/12 23/12 8/0 217/217 57/5 51/0 50/0 69/1 29/19 16/15 22/19 25/42 164/327 18/32 27/13 64/0 13/15 73/0 170/394 46/15 ROSA DREW LN YALE AVE MICHELSON DR 159/ / /9 296/366 4/4 26/42 14/46 1/3 2/11 17/ / /3 81/30 146/44 34/ / /56 995/2012 UNIVERSITY DR 12/ / /485 13/26 26/61 46/37 704/492 29/46 60/34 26/40 912/ /55 Existing AM/PM Peak Hour Intersection Volumes Exhibit 4 DEC/ /36 271/172 62/33 39/53 11/31 126/70 18/14 38/20 39/31 CULVER DR 16/54 133/ /102 SANDBURG WAY 306/ / /130 24/ / /182 AM/PM Intersection Volumes Project Site Location H:\pdata\ \Traffic\Exhibits\Exh04.ai 243/ / / /584 82/ /193 Legend: XX/XX
23 30,400 Not to Scale ROSA DREW LN YALE AVE 5,500 5,600 47,700 1,650 6,300 41,400 CULVER DR 15,700 MICHELSON DR 5,700 8,500 13,300 1, SANDBURG WAY UNIVERSITY DR Legend: 30,000 X,XXX ADT Volume Project Site Location H:\pdata\ \Traffic\Exhibits\Exh05.ai DEC/2010 Existing Roadway Segment ADT Exhibit 5
24 STOP STOP STOP STOP 4D 6D 6D CULVER DR 4D STOP STOP 2D STOP STOP 2U 2U 2D STOP MICHELSON DR STOP 2D 2U YALE AVE STOP ROSA DREW LN STOP Legend: SANDBURG WAY 4D 2U UNIVERSITY DR 4D 4D 2D 2U 2U 2D 4D 2U 2U 5D Not to Scale Existing Lane F Free Right-Turn Lane Defacto Right-Turn Lane OV Right-Turn Overlap Signal-Controlled Intersection Stop-Controlled Intersection STOP Stop-Controlled Approach H:\pdata\ \Traffic\Exhibits\Exh06.ai 2U 2-Lane Undivided Roadway 2D 2-Lane Divided Roadway 4U 4-Lane Undivided Roadway 4D 4-Lane Divided Roadway OV 6D 6-Lane Divided Roadway Project Site Location Existing Study Intersection/Roadway Segment Geometry DEC/2010 Exhibit 6
25 STOP STOP STOP STOP 4D 6D 6D CULVER DR 4D STOP STOP 2D STOP STOP 2U 2U 2D STOP MICHELSON DR STOP 2D 2U YALE AVE STOP ROSA DREW LN STOP Legend: SANDBURG WAY 5D 2U UNIVERSITY DR 5D 4D 2D 2U 2U 2D 4D 2U 2U 5D Not to Scale Existing Lane F Free Right-Turn Lane Defacto Right-Turn Lane OV Right-Turn Overlap Signal-Controlled Intersection Stop-Controlled Intersection STOP Stop-Controlled Approach H:\pdata\ \Traffic\Exhibits\Exh06a.ai 2U 2-Lane Undivided Roadway 2D 2-Lane Divided Roadway 4U 4-Lane Undivided Roadway 4D 4-Lane Divided Roadway 5D 5-Lane Divided Roadway 6D 6-Lane Divided Roadway Project Site Location Post-2030 Study Intersection/Roadway Segment Geometry DEC/2010 Exhibit 6a
26 Table 6 summarizes the study roadway segment ADT analysis for existing conditions. Table 6 Existing Conditions Study Roadway Segment ADT Analysis Study Roadway Segment Capacity ADT V/C - LOS University Dr from Rosa Drew Ln to Yale Ave 32,000 30, E University Dr from Rosa Drew Ln to Michelson Dr 32,000 41, F Rosa Drew Ln from Michelson Dr to University Dr 13,000 1, A Michelson Dr west of Rosa Drew Ln 18,000 5, A Michelson Dr west of Yale Ave 18,000 5, B Note: V/C = volume to capacity ratio; deficient operation shown in bold. Source: City provided ITAM data. As shown in Table 6, according to City of Irvine performance criteria, the following study roadway segments are calculated as currently operating at a deficient LOS (LOS E or worse): University Drive from Rosa Drew Lane to Yale Avenue; and University Drive from Rosa Drew Lane to Michelson Drive. Existing Arterial Peak Hour Link Analysis Existing roadway segment peak hour link analysis has been performed using peak hour volumes obtained from City provided ITAM data. Table 7 summarizes the existing roadway segment peak hour link analysis. Study Roadway Segment University Dr WO Yale Ave - Eastbound - Westbound University Dr EO Yale Ave - Eastbound - Westbound University Dr SO Michelson Dr - Eastbound - Westbound University Dr NO Michelson Dr - Eastbound - Westbound Table 7 University Drive Existing Roadway Segment Peak Hour Link Analysis Number of Lanes Capacity 1 AM Peak Hour PM Peak Hour Volume V/C LOS Volume V/C LOS 3,200 3,200 3,200 3,200 3,200 3,200 3,200 4,800 1,082 1,978 1,076 2,294 1,629 2,417 1,852 2, A 0.62 B 0.34 A 0.72 C 0.51 A 0.76 C 0.58 A 0.47 A Note: V/C = volume to capacity ratio; NO = north of; SO = south of; WO = west of; EO = east of. Source: City provided ITAM data. 1 = Roadway capacity assumes 1,600 vehicles/hour/lane. 2,068 1,338 2,042 1,690 2,423 1,925 2,795 1, B 0.42 A 0.64 B 0.53 A 0.76 C 0.60 A 0.87 D 0.35 A 10
27 As shown in Table 7, the University Drive study roadway segments are currently operating at an acceptable LOS (LOS D or better) during both the a.m. peak hour and p.m. peak hour according to City of Irvine performance criteria. As also shown in Table 7, while the University Drive roadway segment between Rosa Drew Lane and Michelson Drive is calculated as currently operating at a deficient LOS (LOS E or worse) (Refer to Table 6) over a 24-hour period, the associated University Drive roadway segment west of Michelson Drive is operating at an acceptable LOS (LOS D or better) during both the a.m. and p.m. peak hours, which are the key to overall roadway segment operation. Table 8 summarizes the distances between the existing site access locations and adjacent intersections or driveways. Table 8 Existing Conditions Distance Summary Location Approximate Distance (feet) Michelson Drive Project Accesses Distance from Rosa Drew Lane to Driveway 1 Distance from Rosa Drew Lane to Driveway 2 Distance from Driveway 1 to Driveway 2 Distance from Royce Road to Driveway feet 600 feet 260 feet 275 feet PROPOSED PROJECT The proposed project consists of 66 detached single-family dwelling units. The project site is located at the southwest corner of the Rosa Drew Lane/Michelson Drive intersection and is generally bound by existing single-family homes on Cottonwood Lane to the west, Dave Robins Park to the south, Michelson Drive and single-family homes beyond to the north, and Rosa Drew Lane and Parkwood Apartments to the east. The prior use of this site was for the Vista Verde Elementary School, which closed December The closed Vista Verde Elementary School utilized two access locations along Michelson Drive the westerly access with full inbound/outbound access and the easterly access with right-in/right-out/left-out access. Site access at the project is proposed to be provided via a single stop-controlled full-access location at Michelson Drive consisting of one inbound lane and one outbound stop-controlled, shared left-turn/right-turn lane. Since only one access location at the project site is planned, the number of existing access locations at the project site will be reduced by one location. Existing roadway striping of the westbound left-turn lane pocket on Michelson Drive at the project access location is planned to be shifted easterly to line up with the access location. Motorists turning left into the project site will yield to oncoming traffic on Michelson Drive. Motorists exiting the project site will be stop-controlled; motorists on Michelson Drive will continue to be uncontrolled. 11
28 Though the project site was previously utilized for a school, since that use has not existed since December 2006, the impact analysis and identification of potential mitigation measures does not assume trip generation credits for the prior school use. Exhibit 7 shows the proposed project site plan. Forecast Project Trip Generation Table 9 summarizes ITAM land use assumptions used to calculate forecast project trip generation for use in this analysis. Table 9 ITAM Land Use Assumptions ITAM Land Use Code Description Units No-Project Scenario With Project Scenario Difference Project Site Part of ITAM Zone Single-Family Residential Source: City provided ITAM data. Note: DU = dwelling units DU The ITAM model is utilized in evaluating the study intersections and study roadway segments in this analysis. Table 10 summarizes the ITAM model forecast trip generation of the proposed project for the study scenarios included in this analysis. Table 10 Project Socioeconomic-Based Forecast Trip Generation Zone AM Peak Hour Trips PM Peak Hour Trips In Out Total In Out Total Daily Trips (Project Site Part of ITAM Zone 263) Source: City provided ITAM data. This study analyzes the forecast traffic conditions associated with the proposed Vista Verde project based on the socioeconomic trip generation forecasts shown in Table 10. Table 11 summarizes Institute of Transportation Engineers (ITE) Trip Generation rates used to calculate the number of trips generated by the proposed project for project site access analysis. 12
29 Not to Scale H:\pdata\ \Traffic\Exhibits\Exh07.ai Proposed Project Site Plan DEC/2010 Exhibit 7
30 Table 11 ITE Trip Generation Rates Land Use ITE Code Units AM Peak Hour Rates PM Peak Hour Rates Daily Trip In Out Total In Out Total Rate Single-Family Residential 210 du Note: du = dwelling unit. Source: 2008 ITE Trip Generation Manual, 8 th Edition. Table 12 summarizes trips forecast to be generated by the proposed project utilizing the ITE trip generation rates in Table 11. Table 12 Project ITE-Based Forecast Trip Generation Land Use AM Peak Hour Trips PM Peak Hour Trips Daily Trips In Out Total In Out Total 66 Detached Single-Family Dwelling Units As shown in Table 12, based on ITE trip generation rates, the proposed project is forecast to generate 632 daily trips, which include 50 a.m. peak hour trips and 66 p.m. peak hour trips. The project ITE-based trip generation is identified for use in the project site access analysis. Project Trip Distribution Forecast distribution of trips forecast to be generated by the proposed project is based on select zone run model plots provided by the City. Exhibits 8 and 9 show the forecast inbound and outbound trip percent distribution for the proposed project, which was included in ITAM traffic data for buildout conditions. EXISTING PLUS PROJECT CONDITIONS Forecasts contained in this report have been prepared by the City utilizing the ITAM forecast traffic data. Existing Plus Project Conditions Traffic Volumes Exhibit 10 shows existing plus project conditions a.m. and p.m. peak hour volumes at the study intersections based on data provided by the City. Exhibit 11 shows existing plus project conditions ADT volumes based on data provided by the City. Existing Plus Project Conditions Peak Hour Intersection Level of Service Table 13 summarizes existing plus project conditions a.m. and p.m. peak hour LOS of the study intersections based on ICU calculations provided by the City and HCM calculations based on data supplied by the City; detailed LOS analysis worksheets are contained in Appendix B. 13
31 31% CULVER DR 19% 1% 51% 1% 52% SANDBURG WAY 1% MICHELSON DR 53% 10% YALE AVE 63% 3% ROSA DREW LN 34% 2% 32% 32% Legend: 10% UNIVERSITY DR 3% XX% Forecast Trip Percent Distribution Project Site Location Not to Scale H:\pdata\ \Traffic\Exhibits\Exh08.ai Forecast Inbound Trip Percent Distribution of Proposed Project DEC/2010 Exhibit 8
32 19% CULVER DR 32% 1% 1% 52% 53% 1% SANDBURG WAY MICHELSON DR 11% 54% YALE AVE 65% 3% ROSA DREW LN 32% 2% Legend: 11% UNIVERSITY DR 3% 30% 1% 29% XX% Forecast Trip Percent Distribution Project Site Location Not to Scale H:\pdata\ \Traffic\Exhibits\Exh09.ai Forecast Outbound Trip Percent Distribution of Proposed Project DEC/2010 Exhibit 9
33 Not to Scale 12/30 147/229 10/10 38/16 32/12 23/12 8/0 232/224 62/7 51/0 50/0 69/1 29/19 17/16 22/19 25/42 175/327 19/43 28/17 64/0 13/15 73/0 174/398 47/18 ROSA DREW LN YALE AVE MICHELSON DR 159/ / /9 306/368 4/4 26/42 14/46 1/3 3/12 17/ / /3 81/30 152/46 34/ / /60 995/2020 UNIVERSITY DR 13/ / /485 13/26 26/61 47/37 704/494 29/46 60/34 26/40 912/ /60 Existing Plus Project AM/PM Peak Hour Intersection Volumes Exhibit 10 DEC/ /36 285/178 62/33 39/54 11/31 126/70 18/14 38/20 39/31 CULVER DR 16/54 139/ /102 SANDBURG WAY 319/ / /130 24/ / /182 AM/PM Intersection Volumes Project Site Location H:\pdata\ \Traffic\Exhibits\Exh10.ai 245/ / / /585 84/ /193 Legend: XX/XX
34 30,500 30,000 Not to Scale ROSA DREW LN YALE AVE MICHELSON DR 5,900 5,600 5,800 47,800 1,650 6,400 1,850 1,000 41,400 UNIVERSITY DR Existing Plus Project Roadway Segment ADT DEC/2010 Exhibit 11 8,700 CULVER DR 15,900 13,500 SANDBURG WAY Legend: X,XXX ADT Volume Project Site Location H:\pdata\ \Traffic\Exhibits\Exh11.ai
35 Table 13 Existing and Existing Plus Project Conditions AM & PM Peak Hour LOS of Study Intersections Existing Conditions Existing Plus Project Conditions Study Intersection AM Peak Hour PM Peak Hour AM Peak Hour PM Peak Hour V/C Delay LOS V/C Delay LOS V/C Delay LOS Change in V/C or Delay Significant Impact? V/C Delay LOS Change in V/C or Delay Significant Impact? Culver Dr/Michelson Dr N/A A 0.77 N/A C 0.56 N/A A 0.01 No 0.77 N/A C 0.00 No Sandburg Wy/Michelson Dr 2 N/A 10.4 B N/A 15.3 C N/A 10.5 B 0.10 No N/A 15.6 C 0.30 No Yale Ave/Michelson Dr 2 N/A 10.6 B N/A 12.5 B N/A 10.9 B 0.30 No N/A 12.7 B 0.20 No Yale Ave/University Dr N/A C 0.66 N/A B 0.73 N/A C 0.01 No 0.66 N/A B 0.00 No Rosa Drew Ln/Michelson Dr 2 N/A 8.9 A N/A 10.9 B N/A 9.0 A 0.10 No N/A 11.1 B 0.20 No Ridgeline Dr-Rosa Drew Ln N/A C 0.92 N/A E 0.78 N/A C 0.00 No 0.92 N/A E 0.00 No /University Dr Michelson Dr/University Dr N/A B 0.90 N/A D 0.61 N/A B 0.00 No 0.90 N/A D 0.00 No Note: V/C = volume to capacity ratio; delay shown in seconds per vehicle; Change in V/C or Delay = change in V/C ratio or delay in seconds; N/A = not applicable; deficient intersection operation shown in bold. Source: City provided ITAM data for signalized intersections. 1 = Signalized intersection analyzed utilizing the ICU methodology. 2 = Unsignalized intersection analyzed utilizing the HCM methodology. 14
36 As shown in Table 13, with the addition of project-generated trips, all the study intersections are forecast to operate at an acceptable LOS (LOS D or better) according to City of Irvine performance criteria with the exception of the Rosa Drew Lane/University Drive intersection during the a.m. peak hour only for existing plus project conditions. As also shown in Table 13, the addition of project-generated trips is forecast to not result in a change in the level of service at any of the study intersections, and based on City-established thresholds of significance, the addition of project-generated trips is forecast to result in no significant impacts at the study intersections for existing plus project conditions since the LOS at the Rosa Drew Lane/University Drive intersection does not change with implementation of the project. Existing Plus Project Conditions Roadway Segment ADT Analysis Existing plus project conditions roadway segment ADT analysis has been performed using ADT volumes provided by the City (see Exhibit 11). Table 14 summarizes the study roadway segment ADT analysis for forecast existing plus project conditions. Table 14 Existing and Existing Plus Project Conditions Study Roadway Segment ADT Analysis Study Roadway Segment Capacity Existing Conditions Existing Plus Project Conditions ADT V/C LOS ADT V/C LOS Change in V/C Significant Impact? University Dr from Rosa Drew Ln to Yale Ave 32,000 30, E 30, E 0.00 No University Dr from Rosa Drew Ln to Michelson Dr 32,000 41, F 41, F 0.00 No Rosa Drew Ln from Michelson Dr to University Dr 13,000 1, A 1, A 0.00 No Michelson Dr west of Rosa Drew Ln 18,000 5, A 5, A 0.00 No Michelson Dr west of Yale Ave 18,000 5, B 5, B 0.01 No Note: V/C = volume to capacity ratio; Change in V/C = change in V/C ratio; deficient operation shown in bold. Source: City provided ITAM data. As shown in Table 14, with the addition of project-generated trips, the following study roadway segments are forecast to continue to operate at a deficient LOS (LOS E or worse) for existing plus project conditions: University Drive from Rosa Drew Lane to Yale Avenue; and University Drive from Rosa Drew Lane to Michelson Drive. As also shown in Table 14, the addition of project-generated trips is forecast to not result in a change in the level of service at any of the study roadway segments, and based on Cityestablished thresholds of significance, the addition of project-generated trips is forecast to result in no significant impact at the study roadway segments for existing plus project conditions. Existing Plus Project Conditions Arterial Peak Hour Link Analysis Existing plus project conditions roadway segment peak hour link analysis has been performed using peak hour volumes obtained from City provided ITAM data. Existing plus project conditions roadway segment peak hour link analysis volumes are derived by adding trips associated with the proposed project to existing volumes. Table 15 summarizes existing plus project conditions roadway segment peak hour link analysis. 15
37 Table 15 University Drive Existing and Existing Plus Project Conditions Roadway Segment Peak Hour Link Analysis Study Roadway Segment University Dr WO Yale Ave - Eastbound - Westbound University Dr EO Yale Ave - Eastbound - Westbound University Dr SO Michelson Dr - Eastbound - Westbound University Dr NO Michelson Dr - Eastbound - Westbound Number of Lanes/ Capacity 1 2/3,200 2/3,200 2/3,200 2/3,200 2/3,200 2/3,200 2/3,200 3/4,800 Existing Conditions Existing Plus Project Conditions AM Peak Hour PM Peak Hour AM Peak Hour PM Peak Hour Volume V/C LOS Volume V/C LOS Volume V/C LOS 1,082 1,978 1,076 2,294 1,629 2,417 1,852 2, A 0.62 B 0.34 A 0.72 C 0.51 A 0.76 C 0.58 A 0.47 A 2,068 1,338 2,042 1,690 2,423 1,925 2,795 1, B 0.42 A 0.64 B 0.53 A 0.76 C 0.60 A 0.87 D 0.35 A Note: V/C = volume to capacity ratio; NO = north of; SO = south of; WO = west of; EO = east of. Source: City provided ITAM data. 1 = Roadway capacity assumes 1,600 vehicles/hour/lane. 1,083 1,978 1,076 2,294 1,630 2,417 1,869 2, A 0.62 B 0.34 A 0.72 C 0.51 A 0.76 C 0.58 A 0.47 A Change in V/C Significant Impact? No No No No No No No No Volume 2,072 1,338 2,042 1,694 2,423 1,934 2,798 1,670 V/C LOS 0.65 B 0.42 A 0.64 B 0.53 A 0.76 C 0.60 A 0.87 D 0.35 A Change in V/C Significant Impact? No No No No No No No No 16
38 As shown in Table 15, with the addition of project-generated trips, the University Drive study roadway segments are forecast to operate at an acceptable LOS (LOS D or better) during both the a.m. peak hour and p.m. peak hour according to City of Irvine performance criteria for existing plus project conditions. As also shown in Table 15, while the University Drive roadway segment between Rosa Drew Lane and Michelson Drive is calculated as forecast to operate at a deficient LOS (LOS E or worse) (Refer to Table 14) over a 24-hour period for existing plus project conditions, the associated University Drive roadway segment west of Michelson Drive is operating at an acceptable LOS (LOS D or better) during both the a.m. and p.m. peak hours, which are the key to overall roadway segment operation. As also shown in Table 15, the addition of project-generated trips is forecast to not result in a change in the level of service at any of the study roadway segments, and based on Cityestablished thresholds of significance, the addition of project-generated trips is forecast to result in no significant impact at the study roadway segments during both the a.m. and p.m. peak hours for existing plus project conditions. YEAR 2015 (INTERIM) WITHOUT PROJECT CONDITIONS Year 2015 (interim) scenario includes addition of trips forecast to be generated by approved projects identified by City staff, as well as affects of background traffic growth. To determine the impacts of the proposed project, year 2015 (interim) without project conditions are examined prior to year 2015 (interim) with project conditions. Year 2015 (Interim) Without Project Conditions Traffic Volumes Year 2015 (interim) without project conditions traffic volumes and forecasts are based on data provided by the City. The forecasts provided by the City reflect removal of the school uses on the project site. Exhibit 12 shows year 2015 (interim) without project conditions a.m. peak hour and p.m. peak hour volumes at the study intersections based on data provided by the City. Exhibit 13 shows year 2015 (interim) without project conditions study roadway segment ADT volumes based on data provided by the City. Year 2015 (Interim) Without Project Conditions Peak Hour Intersection Level of Service Table 16 summarizes year 2015 (interim) without project conditions a.m. and p.m. peak hour LOS of the study intersections based on ICU calculations provided by the City and HCM calculations based on data supplied by the City; detailed LOS analysis worksheets are contained in Appendix B. 17
39 Not to Scale 10/32 263/324 19/15 28/15 36/12 26/12 12/3 320/322 68/10 54/3 46/9 80/7 27/22 11/14 31/24 28/45 255/452 45/63 27/8 69/2 14/20 111/5 241/469 58/51 41/43 379/270 60/37 24/18 30/18 45/34 CULVER DR 45/58 9/26 126/76 20/51 240/ /105 ROSA DREW LN YALE AVE MICHELSON DR 320/ / /20 469/501 7/3 25/37 6/33 1/6 3/21 29/ /2127 9/7 55/14 95/26 20/ / / /1986 SANDBURG WAY 249/ / /192 16/ / /291 UNIVERSITY DR 8/ / /598 22/11 86/62 53/28 Project Site Location 730/456 46/43 54/48 27/35 918/ /80 Year 2015 (Interim) Without Project AM/PM Peak Hour Intersection Volumes Exhibit 12 H:\pdata\ \Traffic\Exhibits\Exh12.ai DEC/ / / / / / /193 Legend: XX/XX
40 36,000 33,500 Not to Scale ROSA DREW LN YALE AVE MICHELSON DR 7,000 9,700 6,900 6,900 52,900 1,700 7,700 1,800 1,100 46,100 UNIVERSITY DR Year 2015 (Interim) Without Project Roadway Segment ADT DEC/2010 Exhibit 13 CULVER DR 17,100 14,800 SANDBURG WAY Legend: X,XXX ADT Volume Project Site Location H:\pdata\ \Traffic\Exhibits\Exh13.ai
41 Table 16 Year 2015 (Interim) Without Project Conditions AM & PM Peak Hour LOS of Study Intersections Study Intersection AM Peak Hour V/C Delay LOS PM Peak Hour V/C Delay LOS Culver Dr/Michelson Dr N/A A 0.80 N/A C Sandburg Wy/Michelson Dr 2 N/A 13.0 B N/A 28.0 D Yale Ave/Michelson Dr 2 N/A 13.5 B N/A 16.9 C Yale Ave/University Dr N/A C 0.64 N/A B Rosa Drew Ln/Michelson Dr 2 N/A 10.8 B N/A 15.8 C Ridgeline Dr-Rosa Drew Ln /University Dr N/A C 0.85 N/A D Michelson Dr/University Dr N/A B 0.86 N/A D Note: V/C = volume to capacity ratio; delay shown in seconds per vehicle. Source: City provided ITAM data for signalized intersections. 1 = Signalized intersection analyzed utilizing the ICU methodology. 2 = Unsignalized intersection analyzed utilizing the HCM methodology. As shown in Table 16, all study intersections are forecast to operate at an acceptable LOS (LOS D or better) according to City of Irvine performance criteria for forecast year 2015 (interim) without project conditions. It should be noted, due to changes in the distribution of traffic patterns as identified in the ITAM data, the Ridgeline Drive-Rosa Drew Lane/University Drive intersection is projected to have different traffic levels resulting in a better level of service than is now experienced during existing conditions. Year 2015 (Interim) Without Project Conditions Roadway Segment ADT Analysis Year 2015 (interim) without project conditions roadway segment ADT analysis has been performed using ADT volumes provided by the City (see Exhibit 13). The forecasts provided by the City reflect removal of the school uses on the project site. Table 17 summarizes the roadway segment ADT analysis for year 2015 (interim) without project conditions. 18
42 Table 17 Year 2015 (Interim) Without Project Conditions Study Roadway Segment ADT Analysis Study Roadway Segment Capacity ADT V/C - LOS University Dr from Rosa Drew Ln to Yale Ave 32,000 33, F University Dr from Rosa Drew Ln to Michelson Dr 32,000 46, F Rosa Drew Ln from Michelson Dr to University Dr 13,000 1, A Michelson Dr west of Rosa Drew Ln 18,000 6, A Michelson Dr west of Yale Ave 18,000 7, A Note: V/C = volume to capacity ratio; deficient operation shown in bold. Source: City provided ITAM data. As shown in Table 17, according to City of Irvine performance criteria, the following two study roadway segments are forecast to operate at a deficient LOS (LOS F) for year 2015 (interim) without project conditions: University Drive from Rosa Drew Lane to Yale Avenue; and University Drive from Rosa Drew Lane to Michelson Drive. Year 2015 (Interim) Without Project Conditions Arterial Peak Hour Link Analysis Year 2015 (interim) without project conditions roadway segment peak hour link analysis has been performed using peak hour volumes obtained from City provided ITAM data. Table 18 summarizes year 2015 (interim) without project conditions roadway segment peak hour link analysis. Study Roadway Segment University Dr WO Yale Ave - Eastbound - Westbound University Dr EO Yale Ave - Eastbound - Westbound University Dr SO Michelson Dr - Eastbound - Westbound University Dr NO Michelson Dr - Eastbound - Westbound Table 18 University Drive Year 2015 (Interim) Without Project Conditions Roadway Segment Peak Hour Link Analysis Number of Lanes Capacity 1 AM Peak Hour PM Peak Hour Volume V/C LOS Volume V/C LOS 3,200 3,200 3,200 3,200 3,200 3,200 3,200 4,800 1,155 2,065 1,170 2,140 1,673 2,346 2,110 2, A 0.65 B 0.37 A 0.67 B 0.52 A 0.73 C 0.66 B 0.42 A Note: V/C = volume to capacity ratio; NO = north of; SO = south of; WO = west of; EO = east of. Source: City provided ITAM data. 1 = Roadway capacity assumes 1,600 vehicles/hour/lane. 2,021 1,439 2,000 1,825 2,230 1,944 2,661 1, B 0.45 A 0.63 B 0.57 A 0.70 B 0.61 A 0.83 D 0.34 A 19
43 As shown in Table 18, the University Drive study roadway segments are forecast to operate at an acceptable LOS (LOS D or better) during both the a.m. peak hour and p.m. peak hour according to City of Irvine performance criteria for year 2015 (interim) without project conditions. As also shown in Table 18, while the University Drive roadway segment between Rosa Drew Lane and Michelson Drive is calculated as forecast to operate at a deficient LOS (LOS E or worse) (Refer to Table 17) over a 24-hour period for year 2015 (interim) without project conditions, the associated University Drive roadway segment west of Michelson Drive is forecast to operate at an acceptable LOS (LOS D or better) during both the a.m. and p.m. peak hours, which are the key to overall roadway segment operation. YEAR 2015 (INTERIM) WITH PROJECT CONDITIONS Year 2015 (Interim) With Project Conditions Traffic Volumes Year 2015 (interim) with project conditions traffic volumes and forecasts are based on data provided by the City. Exhibit 14 shows year 2015 (interim) with project conditions a.m. peak hour and p.m. peak hour volumes at the study intersections based on data provided by the City. Exhibit 15 shows year 2015 (interim) with project conditions study roadway segment ADT volumes based on data provided by the City. Year 2015 (Interim) With Project Conditions Peak Hour Intersection Level of Service Table 19 summarizes year 2015 (interim) with project conditions a.m. and p.m. peak hour LOS of the study intersections based on ICU calculations provided by the City and HCM calculations based on data supplied by the City; detailed LOS analysis worksheets are contained in Appendix B. 20
44 Not to Scale 10/32 254/336 18/13 28/15 36/11 25/13 12/3 328/323 69/10 56/4 46/10 78/7 28/22 11/13 31/24 29/45 264/447 45/57 28/9 68/3 14/20 109/5 246/478 55/50 42/44 385/280 63/38 25/19 30/18 44/34 CULVER DR 46/60 9/26 125/76 19/50 241/ /104 ROSA DREW LN YALE AVE MICHELSON DR 312/ / /20 480/501 7/3 25/36 6/33 1/6 3/21 28/ /2116 9/7 55/17 96/33 19/ / / /1973 SANDBURG WAY 252/ / /195 16/ / /293 UNIVERSITY DR 8/ / /592 22/11 86/62 52/28 AM/PM Intersection Volumes Project Site Location 730/457 46/43 54/47 27/35 917/ /77 Year 2015 (Interim) With Project AM/PM Peak Hour Intersection Volumes Exhibit 14 H:\pdata\ \Traffic\Exhibits\Exh14.ai DEC/ / / / / / /193 Legend: XX/XX
45 35,900 33,400 Not to Scale ROSA DREW LN YALE AVE MICHELSON DR 7,100 9,800 7,000 7,000 52,900 1,700 7,900 1,800 1,200 46,000 UNIVERSITY DR Forecast Year 2015 (Interim) With Project Roadway Segment ADT DEC/2010 Exhibit 15 CULVER DR 17,300 14,900 SANDBURG WAY Legend: X,XXX ADT Volume Project Site Location H:\pdata\ \Traffic\Exhibits\Exh15.ai
46 Table 19 Year 2015 (Interim) Without Project Conditions and Year 2015 (Interim) With Project Conditions AM & PM Peak Hour LOS of Study Intersections Year 2015 (Interim) Without Project Conditions Year 2015 (Interim) With Project Conditions Study Intersection AM Peak Hour PM Peak Hour AM Peak Hour PM Peak Hour V/C Delay LOS V/C Delay LOS V/C Delay LOS Change in V/C or Delay Significant Impact? V/C Delay LOS Change in V/C or Delay Significant Impact? Culver Dr/Michelson Dr N/A A 0.80 N/A C 0.54 N/A A 0.00 No 0.80 N/A C 0.00 No Sandburg Wy/Michelson Dr 2 N/A 13.0 B N/A 28.0 D N/A 13.2 B 0.20 No N/A 29.9 D 1.90 No Yale Ave/Michelson Dr 2 N/A 13.5 B N/A 16.9 C N/A 13.8 B 0.30 No N/A 17.5 C 0.60 No Yale Ave/University Dr N/A C 0.64 N/A B 0.71 N/A C 0.00 No 0.64 N/A B 0.00 No Rosa Drew Ln/Michelson Dr 2 N/A 10.8 B N/A 15.8 C N/A 10.8 B 0.00 No N/A 15.6 C No Ridgeline Dr-Rosa Drew Ln /University Dr N/A C 0.85 N/A D 0.79 N/A C 0.00 No 0.85 N/A D 0.00 No Michelson Dr/University Dr N/A B 0.86 N/A D 0.68 N/A B 0.00 No 0.85 N/A D No Note: V/C = volume to capacity ratio; delay shown in seconds per vehicle; Change in V/C or Delay = change in V/C ratio or delay in seconds; N/A = not applicable. Source: City provided ITAM data for signalized intersections. 1 = Signalized intersection analyzed utilizing the ICU methodology. 2 = Unsignalized intersection analyzed utilizing the HCM methodology. 21
47 As shown in Table 19, with the addition of project-generated trips, all study intersections are forecast to continue to operate at an acceptable LOS (LOS D or better) during the a.m. peak hour and p.m. peak hour according to City of Irvine performance criteria for year 2015 (interim) with project conditions. As also shown in Table 19, the addition of project-generated trips is forecast to not result in a change in the level of service at any of the study intersections; furthermore, based on Cityestablished thresholds of significance, the addition of project-generated trips is forecast to result in no significant impacts at the study intersections for year 2015 (interim) with project conditions. Year 2015 (Interim) With Project Conditions Roadway Segment ADT Analysis Year 2015 (interim) with project conditions roadway segment ADT analysis has been performed using ADT volumes provided by the City (see Exhibit 15). Table 20 summarizes the roadway segment ADT analysis for year 2015 (interim) with project conditions. Table 20 Year 2015 (Interim) Without Project Conditions and Year 2015 (Interim) With Project Conditions Study Roadway Segment ADT Analysis Study Roadway Segment Capacity Year 2015 (Interim) Without Project Conditions Year 2015 (Interim) With Project Conditions ADT V/C LOS ADT V/C LOS Change in V/C Significant Impact? University Dr from Rosa Drew Ln to Yale Ave 32,000 33, F 33, F No University Dr from Rosa Drew Ln to Michelson Dr 32,000 46, F 46, F 0.00 No Rosa Drew Ln from Michelson Dr to University Dr 13,000 1, A 1, A 0.00 No Michelson Dr west of Rosa Drew Ln 18,000 6, A 7, A 0.01 No Michelson Dr west of Yale Ave 18,000 7, A 7, A 0.00 No Note: V/C = volume to capacity ratio; Change in V/C = change in V/C ratio; deficient operation shown in bold. Source: City provided ITAM data. As shown in Table 20, with the addition of project-generated trips, the following two study roadway segments are forecast to continue to operate at a deficient LOS (LOS F) for year 2015 (interim) with project conditions: University Drive from Rosa Drew Lane to Yale Avenue; and University Drive from Rosa Drew Lane to Michelson Drive. As also shown in Table 20, the addition of project-generated trips is forecast to not result in a change in the level of service at any of the study roadway segments, and based on Cityestablished thresholds of significance, the addition of project-generated trips is forecast to result in no significant impact at the study roadway segments for year 2015 (interim) with project conditions. 22
48 Year 2015 (Interim) With Project Conditions Arterial Peak Hour Link Analysis Year 2015 (interim) with project conditions roadway segment peak hour link analysis has been performed using peak hour volumes obtained from City provided ITAM data. Year 2015 (interim) with project conditions roadway segment peak hour link analysis volumes are derived by adding trips associated with the proposed project to year 2015 (interim) without project conditions. Table 15 summarizes year 2015 (interim) with project conditions roadway segment peak hour link analysis. 23
49 Table 21 University Drive Year 2015 (Interim) Without Project Conditions and Year 2015 (Interim) With Project Conditions Roadway Segment Peak Hour Link Analysis Study Roadway Segment University Dr WO Yale Ave - Eastbound - Westbound University Dr EO Yale Ave - Eastbound - Westbound University Dr SO Michelson Dr - Eastbound - Westbound University Dr NO Michelson Dr - Eastbound - Westbound Number of Lanes/ Capacity 1 2/3,200 2/3,200 2/3,200 2/3,200 2/3,200 2/3,200 2/3,200 3/4,800 Year 2015 Conditions Year 2015 With Project Conditions AM Peak Hour PM Peak Hour AM Peak Hour PM Peak Hour Volume V/C LOS Volume V/C LOS Volume V/C LOS 1,155 2,065 1,170 2,140 1,673 2,346 2,110 2, A 0.65 B 0.37 A 0.67 B 0.52 A 0.73 C 0.66 B 0.42 A 2,021 1,439 2,000 1,825 2,230 1,944 2,661 1, B 0.45 A 0.63 B 0.57 A 0.70 B 0.61 A 0.83 D 0.34 A Note: V/C = volume to capacity ratio; NO = north of; SO = south of; WO = west of; EO = east of. Source: City provided ITAM data. 1 = Roadway capacity assumes 1,600 vehicles/hour/lane. 1,156 2,053 1,170 2,130 1,676 2,323 2,125 2, A 0.64 B 0.37 A 0.67 B 0.52 A 0.73 C 0.66 B 0.42 A Change in V/C Significant Impact? No No No No No No No No Volume 2,013 1,447 1,990 1,822 2,225 1,957 2,650 1,620 V/C LOS 0.63 B 0.45 A 0.62 B 0.57 A 0.70 B 0.61 A 0.83 D 0.34 A Change in V/C Significant Impact? No No No No No No No No 24
50 As shown in Table 21, with the addition of project-generated trips, the University Drive study roadway segments are forecast to operate at an acceptable LOS (LOS D or better) during both the a.m. peak hour and p.m. peak hour according to City of Irvine performance criteria for year 2015 (interim) with project conditions. As also shown in Table 21, while the University Drive roadway segments between Rosa Drew Lane and Yale Avenue and between Rosa Drew Lane and Michelson Drive are calculated as forecast to operate at a deficient LOS (LOS E or worse) (Refer to Table 20) over a 24-hour period for year 2015 (interim) with project conditions, the associated University Drive roadway segments between Yale Avenue and Michelson Drive are operating at an acceptable LOS (LOS D or better) during both the a.m. and p.m. peak hours, which are the key to overall roadway segment operation. As also shown in Table 21, the addition of project-generated trips is forecast to not result in a change in the level of service at any of the study roadway segments, and based on Cityestablished thresholds of significance, the addition of project-generated trips is forecast to result in no significant impact at the study roadway segments during both the a.m. peak hour and p.m. peak hour for year 2015 (interim) with project conditions. POST-2030 WITHOUT PROJECT CONDITIONS Post-2030 without project conditions includes addition of trips forecast to be generated by cumulative projects as identified by City staff. To determine the impacts of the proposed project, post-2030 without project conditions are examined prior to post-2030 with project conditions. Post-2030 Without Project Conditions Traffic Volumes Post-2030 without project conditions traffic volumes and forecasts are based on data provided by the City. The forecasts provided by the City reflect removal of the school uses on the project site. Exhibit 16 shows post-2030 without project conditions a.m. peak hour and p.m. peak hour volumes at the study intersections based on data provided by the City. Exhibit 17 shows post without project conditions study roadway segment ADT volumes based on data provided by the City. Post-2030 Without Project Conditions Peak Hour Intersection Level of Service Table 22 summarizes post-2030 without project conditions a.m. and p.m. peak hour LOS of the study intersections based on ICU calculations provided by the City and HCM calculations based on data supplied by the City; detailed LOS analysis worksheets are contained in Appendix B. 25
51 Not to Scale 6/26 260/401 18/19 27/12 42/14 31/14 40/ / /11 237/ / /85 40/28 12/17 59/45 32/46 374/461 80/97 33/26 191/201 8/23 221/ /442 67/26 40/42 343/262 57/39 55/55 9/24 116/72 ROSA DREW LN YALE AVE MICHELSON DR 319/ / /21 543/502 7/3 30/36 6/33 1/6 3/21 31/ /2266 9/7 106/36 368/160 25/ / / /2029 UNIVERSITY DR 10/ / /575 21/18 79/85 62/49 742/480 64/43 69/54 46/ / /70 Post-2030 Without Project AM/PM Peak Hour Intersection Volumes Exhibit 16 DEC/ /16 29/18 41/36 CULVER DR 21/54 315/ /103 SANDBURG WAY 223/ /201 90/190 14/96 904/ /404 AM/PM Intersection Volumes Project Site Location H:\pdata\ \Traffic\Exhibits\Exh16.ai 256/ / / / / /208 Legend: XX/XX
52 45,200 39,100 Not to Scale ROSA DREW LN YALE AVE MICHELSON DR 7,900 8,200 8,300 58,800 2,000 8,500 5,200 5,000 51,000 UNIVERSITY DR Post-2030 Without Project Roadway Segment ADT DEC/2010 Exhibit 17 10,500 CULVER DR 18,100 15,700 SANDBURG WAY Legend: X,XXX ADT Volume Project Site Location H:\pdata\ \Traffic\Exhibits\Exh17.ai
53 Table 22 Post-2030 Without Project Conditions AM & PM Peak Hour LOS of Study Intersections Study Intersection AM Peak Hour V/C Delay LOS PM Peak Hour V/C Delay LOS Culver Dr/Michelson Dr N/A A 0.85 N/A D Sandburg Wy/Michelson Dr 2 N/A 13.1 B N/A 35.8 E Yale Ave/Michelson Dr 2 N/A 22.7 C N/A 32.4 D Yale Ave/University Dr N/A C 0.67 N/A B Rosa Drew Ln/Michelson Dr 2 N/A 14.3 B N/A 20.4 C Ridgeline Dr-Rosa Drew Ln /University Dr N/A C 0.87 N/A D Michelson Dr/University Dr N/A C 0.90 N/A D Note: V/C = volume to capacity ratio; delay shown in seconds per vehicle; deficient intersection operation shown in bold. Source: City provided ITAM data for signalized intersections. 1 = Signalized intersection analyzed utilizing the ICU methodology. 2 = Unsignalized intersection analyzed utilizing the HCM methodology. As shown in Table 22, the study intersections are forecast to operate at an acceptable LOS (LOS D or better) according to City of Irvine performance criteria for post-2030 without project conditions with the exception of the Sandburg Way/Michelson Drive intersection during the p.m. peak hour. Post-2030 Without Project Conditions Roadway Segment ADT Analysis Post-2030 without project conditions roadway segment ADT analysis has been performed using ADT volumes provided by the City (see Exhibit 17). The forecasts provided by the City reflect removal of the school uses on the project site. Table 23 summarizes the roadway segment ADT analysis for post-2030 without project conditions. Table 23 Post-2030 Without Project Conditions Study Roadway Segment ADT Analysis Study Roadway Segment Capacity ADT V/C LOS University Dr from Rosa Drew Ln to Yale Ave 40,000 39, E University Dr from Rosa Drew Ln to Michelson Dr 32,000 51, F Rosa Drew Ln from Michelson Dr to University Dr 13,000 2, A Michelson Dr west of Rosa Drew Ln 18,000 8, A Michelson Dr west of Yale Ave 18,000 7, A Note: V/C = volume to capacity ratio; deficient operation shown in bold. Source: City provided ITAM data. 26
54 As shown in Table 23, according to City of Irvine performance criteria, the study roadway segments are forecast to operate at an acceptable LOS (LOS D or better) for post-2030 without project conditions with the exception of University Drive from Rosa Drew lane to Michelson Drive. Post-2030 Without Project Conditions Arterial Peak Hour Link Analysis Post-2030 without project conditions roadway segment peak hour link analysis has been performed using peak hour volumes obtained from City provided ITAM data. Table 24 summarizes post-2030 without project conditions roadway segment peak hour link analysis. Study Roadway Segment University Dr WO Yale Ave - Eastbound - Westbound University Dr EO Yale Ave - Eastbound - Westbound University Dr SO Michelson Dr - Eastbound - Westbound University Dr NO Michelson Dr - Eastbound - Westbound Table 24 University Drive Post-2030 Roadway Segment Peak Hour Link Analysis Number of Lanes Capacity 1 AM Peak Hour PM Peak Hour Volume V/C LOS Volume V/C LOS 3,200 4,800 3,200 4,800 3,200 3,200 4,800 4,800 1,462 2,464 1,463 2,807 1,941 2,609 2,450 2, A 0.51 A 0.46 A 0.58 A 0.61 A 0.82 D 0.51 A 0.48 A Note: V/C = volume to capacity ratio; NO = north of; SO = south of; WO = west of; EO = east of. Source: City provided ITAM data. 1 = Roadway capacity assumes 1,600 vehicles/hour/lane. 2,192 1,841 2,065 2,095 2,340 2,296 2,801 1, B 0.38 A 0.65 B 0.44 A 0.73 C 0.72 C 0.58 A 0.40 A As shown in Table 24, the University Drive study roadway segments are forecast to operate at an acceptable LOS (LOS D or better) during both the a.m. peak hour and p.m. peak hour according to City of Irvine performance criteria for post-2030 without project conditions. As also shown in Table 24, while the University Drive roadway segment between Rosa Drew Lane and Michelson Drive is calculated as forecast to operate at a deficient LOS (LOS E or worse) (Refer to Table 23) over a 24-hour period for post-2030 without project conditions, the associated University Drive roadway segment west of Michelson Drive is forecast to operate at an acceptable LOS (LOS D or better) during both the a.m. peak hour and p.m. peak hour for post-2030 without project conditions, which are the key to overall roadway segment operation. POST-2030 WITH PROJECT CONDITIONS This section analyzes the impact of the addition of trips forecast to be generated by the proposed project to post-2030 without project conditions traffic volumes. 27
55 Post-2030 With Project Conditions Traffic Volumes Post-2030 with project conditions traffic volumes and forecasts are based on data provided by the City. Exhibit 18 shows post-2030 with project conditions a.m. peak hour and p.m. peak hour volumes at the study intersections based on data provided by the City. Exhibit 19 shows post-2030 with project conditions study roadway segment ADT volumes based on data provided by the City. Post-2030 With Project Conditions Peak Hour Intersection Level of Service Table 25 summarizes post-2030 with project conditions a.m. and p.m. peak hour LOS of the study intersections based on ICU calculations provided by the City and HCM calculations based on data supplied by the City; detailed LOS analysis worksheets are contained in Appendix B. 28
56 Not to Scale 6/27 258/410 19/19 27/12 42/14 29/14 39/ / /11 232/ / /85 41/28 12/17 56/45 31/46 385/461 80/97 33/27 190/201 8/23 223/ /451 71/26 ROSA DREW LN YALE AVE MICHELSON DR 319/ / /21 553/503 7/3 30/36 6/33 1/6 3/21 30/ /2274 9/7 105/35 369/161 25/ / / /2025 UNIVERSITY DR 10/ / /578 23/18 83/84 66/48 741/482 64/42 68/53 46/ / /68 Post-2030 With Project AM/PM Peak Hour Intersection Volumes Exhibit 18 DEC/ /42 347/262 53/39 52/55 9/24 119/72 28/16 28/18 43/36 CULVER DR 22/54 320/ /103 SANDBURG WAY 224/ /201 90/190 14/96 905/ /404 AM/PM Intersection Volumes Project Site Location H:\pdata\ \Traffic\Exhibits\Exh18.ai 262/ / / / / /208 Legend: XX/XX
57 45,300 Not to Scale CULVER DR 18,300 ROSA DREW LN YALE AVE MICHELSON DR 8,000 10,600 15,900 8,300 8,400 59,000 1,900 SANDBURG WAY 8,600 5,300 5,100 51,000 UNIVERSITY DR Legend: 39,100 X,XXX ADT Volume Project Site Location H:\pdata\ \Traffic\Exhibits\Exh19.ai DEC/2010 Post-2030 With Project Roadway Segment ADT Exhibit 19
58 Table 25 Post-2030 Without Project Conditions and Post-2030 With Project Conditions AM & PM Peak Hour LOS of Study Intersections Post-2030 Without Project Conditions Post-2030 With Project Conditions Study Intersection AM Peak Hour PM Peak Hour AM Peak Hour PM Peak Hour V/C Delay LOS V/C Delay LOS V/C Delay LOS Change in V/C or Delay Significant Impact? V/C Delay LOS Change in V/C or Delay Significant Impact? Culver Dr/Michelson Dr N/A A 0.85 N/A D 0.60 N/A A 0.00 No 0.85 N/A D 0.00 No Sandburg Wy/Michelson Dr 2 N/A 13.1 B N/A 35.8 E N/A 13.3 B 0.20 No N/A 35.8 E 0.00 No Yale Ave/Michelson Dr 2 N/A 22.7 C N/A 32.4 D N/A 23.2 C 0.50 No N/A 34.2 D 1.80 No Yale Ave/University Dr N/A C 0.67 N/A B 0.76 N/A C 0.00 No 0.67 N/A B 0.00 No Rosa Drew Ln/Michelson Dr 2 N/A 14.3 B N/A 20.4 C N/A 14.6 B 0.30 No N/A 20.7 C 0.30 No Ridgeline Dr-Rosa Drew Ln N/A C 0.87 N/A D 0.80 N/A C 0.02 No 0.87 N/A D 0.00 No /University Dr Michelson Dr/University Dr N/A C 0.90 N/A D 0.78 N/A C 0.00 No 0.90 N/A D 0.00 No Note: V/C = volume to capacity ratio; delay shown in seconds per vehicle; Change in V/C or Delay = change in V/C ratio or delay in seconds; deficient intersection operation shown in bold; N/A = not applicable. Source: City provided ITAM data for signalized intersections. 1 = Signalized intersection analyzed utilizing the ICU methodology. 2 = Unsignalized intersection analyzed utilizing the HCM methodology. 29
59 As shown in Table 25, with the addition of project-generated trips, the study intersections are forecast to continue to operate at an acceptable LOS (LOS D or better) during the a.m. peak hour and p.m. peak hour according to City of Irvine performance criteria for post-2030 with project conditions with the exception of the Sandburg Way/Michelson Drive intersection during the p.m. peak hour. As also shown in Table 25, the addition of project-generated trips is forecast to not result in a change in the level of service at any of the study intersections, and based on City-established thresholds of significance, the addition of project-generated trips is forecast to result in no significant impacts at the study intersections for post-2030 with project conditions since the LOS at the Rosa Drew Lane/University Drive intersection does not change with implementation of the project. Forecast for Post-2030 With Project Conditions Signal Warrant Analysis An MUTCD signal warrant analysis was prepared to determine if signalization is projected to be warranted at the Sandburg Way/Michelson Drive study intersection for the following the signal warrants: Minimum Vehicular Traffic Warrant; Interruption of Continuous Traffic Warrant; and Combinations Warrant. Table 26 summarizes the results of the post-2030 with project traffic signal warrants for the Sandburg Way/Michelson Drive study intersections; detailed traffic signal warrant sheets are contained in Appendix C. Study Intersection Table 26 Post-2030 With Project Conditions Traffic Signal Warrant Analysis Summary Minimum Vehicular Traffic Warrant Satisfied? Warrant Type Interruption of Continuous Traffic Warrant Satisfied? Combinations Warrant Satisfied? Signalization of Intersection Warranted? Sandburg Way/Michelson Drive No No No No As shown in Table 26, the traffic signal warrants are not satisfied at the Sandburg Way/Michelson Drive intersection for post-2030 with project conditions. Post-2030 With Project Conditions Roadway Segment ADT Analysis Post-2030 with project conditions roadway segment ADT analysis has been performed using ADT volumes provided by the City (see Exhibit 19). Table 27 summarizes the roadway segment ADT analysis for post-2030 with project conditions. 30
60 Table 27 Post-2030 Without Project Conditions and Post-2030 With Project Conditions Study Roadway Segment ADT Analysis Study Roadway Segment Capacity Post-2030 Without Project Conditions Post-2030 With Project Conditions ADT V/C LOS ADT V/C LOS Change in V/C Significant Impact? University Dr from Rosa Drew Ln to Yale Ave 40,000 39, E 39, E 0.00 No University Dr from Rosa Drew Ln to Michelson Dr 32,000 51, F 51, F 0.00 No Rosa Drew Ln from Michelson Dr to University Dr 13,000 2, A 1, A 0.00 No Michelson Dr west of Rosa Drew Ln 18,000 8, A 8, A 0.00 No Michelson Dr west of Yale Ave 18,000 7, A 8, A 0.00 No Note: V/C = volume to capacity ratio; Change in V/C = change in V/C ratio; deficient operation shown in bold. Source: City provided ITAM data. As shown in Table 27, with the addition of project-generated trips, the study roadway segments are forecast to continue to operate at an acceptable LOS (LOS D or better) for post-2030 with project conditions with the exception of University Drive from Rosa Drew Land to Michelson Drive. As also shown in Table 27, the addition of project-generated trips is forecast to not result in a change in the level of service at any of the study roadway segments, and based on Cityestablished thresholds of significance, the addition of project-generated trips is forecast to result in no significant impact at the study roadway segments for post-2030 with project conditions. Post-2030 With Project Conditions Arterial Peak Hour Link Analysis Post-2030 with project conditions roadway segment peak hour link analysis has been performed using peak hour volumes obtained from City provided ITAM data. Post-2030 with project conditions roadway segment peak hour link analysis volumes are derived by adding trips associated with the proposed project to year post-2030 without project conditions. Table 28 summarizes post-2030 with project conditions roadway segment peak hour link analysis. 31
61 Table 28 University Drive Post-2030 Without Project Conditions and Post-2030 With Project Conditions Roadway Segment Peak Hour Link Analysis Study Roadway Segment University Dr WO Yale Ave - Eastbound - Westbound University Dr EO Yale Ave - Eastbound - Westbound University Dr SO Michelson Dr - Eastbound - Westbound University Dr NO Michelson Dr - Eastbound - Westbound Number of Lanes/ Capacity 1 2/3,200 3/4,800 2/3,200 3/4,800 2/3,200 2/3,200 3/4,800 3/4,800 Post-2030 Conditions Post-2030 With Project Conditions AM Peak Hour PM Peak Hour AM Peak Hour PM Peak Hour Volume V/C LOS Volume V/C LOS Volume V/C LOS 1,462 2,464 1,463 2,807 1,941 2,609 2,450 2, A 0.51 A 0.46 A 0.58 A 0.61 A 0.82 D 0.51 A 0.48 A 2,192 1,841 2,065 2,095 2,340 2,296 2,801 1, B 0.38 A 0.65 B 0.44 A 0.73 C 0.72 C 0.58 A 0.40 A Note: V/C = volume to capacity ratio; NO = north of; SO = south of; WO = west of; EO = east of. Source: City provided ITAM data. 1 = Roadway capacity assumes 1,600 vehicles/hour/lane. 1,450 2,496 1,450 2,840 1,930 2,629 2,450 2, A 0.52 A 0.45 A 0.59 A 0.60 A 0.82 D 0.51 A 0.48 A Change in V/C Significant Impact? No No No No No No No No Volume 2,189 1,845 2,060 2,104 2,346 2,315 2,810 1,909 V/C LOS 0.68 B 0.38 A 0.64 B 0.44 A 0.73 C 0.72 C 0.59 A 0.40 A Change in V/C Significant Impact? No No No No No No No No 32
62 As shown in Table 28, with the addition of project-generated trips, the University Drive study roadway segments are forecast to operate at an acceptable LOS (LOS D or better) during both the a.m. peak hour and p.m. peak hour according to City of Irvine performance criteria for post with project conditions. As also shown in Table 28, while the University Drive roadway segment between Rosa Drew Lane and Michelson Drive is calculated as forecast to operate at a deficient LOS (LOS E or worse) (Refer to Table 27) over a 24-hour period for post-2030 with project conditions, the associated University Drive roadway segment west of Michelson Drive is operating at an acceptable LOS (LOS D or better) during both the a.m. and p.m. peak hours, which are the key to overall roadway segment operation. As also shown in Table 28, the addition of project-generated trips is forecast to not result in a change in the level of service at any of the study roadway segments, and based on Cityestablished thresholds of significance, the addition of project-generated trips is forecast to result in no significant impact at the study roadway segments during both the a.m. peak hour and p.m. peak hour for post-2030 with project conditions. POST-2030 PENDING WITHOUT PROJECT CONDITIONS Post-2030 pending without project conditions includes addition of trips forecast to be generated by cumulative projects as identified by City staff including those whoe approvals are still pending. To determine the impacts of the proposed project, post-2030 pending without project conditions are examined prior to post-2030 pending with project conditions. Post-2030 Pending Without Project Conditions Traffic Volumes Post-2030 pending without project conditions traffic volumes and forecasts are based on data provided by the City. The forecasts provided by the City reflect removal of the school uses on the project site and consideration of projects having pending approvals. Exhibit 20 shows post-2030 pending without project conditions a.m. peak hour and p.m. peak hour volumes at the study intersections based on data provided by the City. Exhibit 21 shows post-2030 pending without project conditions study roadway segment ADT volumes based on data provided by the City. Post-2030 Pending Without Project Conditions Peak Hour Intersection Level of Service Table 29 summarizes post-2030 pending without project conditions a.m. and p.m. peak hour LOS of the study intersections based on ICU calculations provided by the City and HCM calculations based on data supplied by the City; detailed LOS analysis worksheets are contained in Appendix B. 33
63 Not to Scale 6/27 247/410 19/19 28/11 43/14 28/14 39/ / /11 235/ / /89 43/28 13/17 54/46 31/46 378/451 78/97 32/26 192/202 8/24 229/ /435 69/26 39/42 326/262 54/39 29/16 29/18 41/36 CULVER DR 54/54 9/24 116/72 22/54 320/ /103 ROSA DREW LN YALE AVE MICHELSON DR 309/ / /21 552/492 8/3 31/36 6/33 1/6 3/21 30/ /2255 9/7 103/35 362/161 25/ / / /2015 SANDBURG WAY 221/ /204 86/183 14/92 909/ /406 UNIVERSITY DR 10/ / /579 21/18 79/84 62/48 AM/PM Intersection Volumes Project Site Location 742/481 64/42 68/53 46/ / /68 Post-2030 Pending Without Project AM/PM Peak Hour Intersection Volumes Exhibit 20 H:\pdata\ \Traffic\Exhibits\Exh20.ai DEC/ / / / / / /201 Legend: XX/XX
64 45,200 39,000 Not to Scale ROSA DREW LN YALE AVE MICHELSON DR 7,800 10,400 7,100 8,200 58,800 1,900 8,500 5,000 5,200 51,000 UNIVERSITY DR Post-2030 Pending Without Project Roadway Segment ADT DEC/2010 Exhibit 21 CULVER DR 18,100 15,700 SANDBURG WAY Legend: X,XXX ADT Volume Project Site Location H:\pdata\ \Traffic\Exhibits\Exh21.ai
65 Table 29 Post-2030 Without Project Conditions AM & PM Peak Hour LOS of Study Intersections Study Intersection AM Peak Hour V/C Delay LOS PM Peak Hour V/C Delay LOS Culver Dr/Michelson Dr N/A A 0.85 N/A D Sandburg Wy/Michelson Dr 2 N/A 12.9 B N/A 33.6 D Yale Ave/Michelson Dr 2 N/A 22.5 C N/A 31.3 D Yale Ave/University Dr N/A C 0.66 N/A B Rosa Drew Ln/Michelson Dr 2 N/A 14.6 B N/A 20.0 C Ridgeline Dr-Rosa Drew Ln /University Dr N/A C 0.87 N/A D Michelson Dr/University Dr N/A C 0.88 N/A D Note: V/C = volume to capacity ratio; delay shown in seconds per vehicle; deficient intersection operation shown in bold. Source: City provided ITAM data for signalized intersections. 1 = Signalized intersection analyzed utilizing the ICU methodology. 2 = Unsignalized intersection analyzed utilizing the HCM methodology. As shown in Table 29, alll of the study intersections are forecast to operate at an acceptable LOS (LOS D or better) according to City of Irvine performance criteria for post-2030 pending without project conditions. Post-2030 Pending Without Project Conditions Roadway Segment ADT Analysis Post-2030 pending without project conditions roadway segment ADT analysis has been performed using ADT volumes provided by the City (see Exhibit 21). The forecasts provided by the City reflect removal of the school uses on the project site. Table 30 summarizes the roadway segment ADT analysis for post-2030 pending without project conditions. Table 30 Post-2030 Pending Without Project Conditions Study Roadway Segment ADT Analysis Study Roadway Segment Capacity ADT V/C LOS University Dr from Rosa Drew Ln to Yale Ave 40,000 39, E University Dr from Rosa Drew Ln to Michelson Dr 32,000 51, F Rosa Drew Ln from Michelson Dr to University Dr 13,000 1, A Michelson Dr west of Rosa Drew Ln 18,000 8, A Michelson Dr west of Yale Ave 18,000 7, A Note: V/C = volume to capacity ratio; deficient operation shown in bold. Source: City provided ITAM data. As shown in Table 30, according to City of Irvine performance criteria, the study roadway segments are forecast to operate at an acceptable LOS (LOS D or better) for post-2030 pending 34
66 without project conditions with the exception of University Drive from Rosa Drew lane to Michelson Drive. Post-2030 Pending Without Project Conditions Arterial Peak Hour Link Analysis Post-2030 pending without project conditions roadway segment peak hour link analysis has been performed using peak hour volumes obtained from City provided ITAM data. Table 31 summarizes post-2030 pending without project conditions roadway segment peak hour link analysis. Table 31 University Drive Post-2030 Pending Without Project Roadway Segment Peak Hour Link Analysis Study Roadway Segment University Dr WO Yale Ave - Eastbound - Westbound University Dr EO Yale Ave - Eastbound - Westbound University Dr SO Michelson Dr - Eastbound - Westbound University Dr NO Michelson Dr - Eastbound - Westbound Number of Lanes Capacity 1 AM Peak Hour PM Peak Hour Volume V/C LOS Volume V/C LOS 3,200 4,800 3,200 4,800 3,200 3,200 4,800 4,800 1,462 2,820 1,460 2,794 1,951 2,375 2,470 2, A 0.59 A 0.46 A 0.58 A 0.61 A 0.74 C 0.51 A 0.55 A Note: V/C = volume to capacity ratio; NO = north of; SO = south of; WO = west of; EO = east of. Source: City provided ITAM data. 1 = Roadway capacity assumes 1,600 vehicles/hour/lane. 2,179 1,930 2,050 2,040 2,335 2,114 2,780 2, B 0.40 A 0.64 B 0.43 A 0.73 C 0.66 B 0.58 A 0.48 A As shown in Table 31, the University Drive study roadway segments are forecast to operate at an acceptable LOS (LOS D or better) during both the a.m. peak hour and p.m. peak hour according to City of Irvine performance criteria for post-2030 pending without project conditions. As also shown in Table 31, while the University Drive roadway segment between Rosa Drew Lane and Michelson Drive is calculated as forecast to operate at a deficient LOS (LOS E or worse) (Refer to Table 23) over a 24-hour period for post-2030 without project conditions, the associated University Drive roadway segment west of Michelson Drive is forecast to operate at an acceptable LOS (LOS D or better) during both the a.m. peak hour and p.m. peak hour for post-2030 pending without project conditions, which are the key to overall roadway segment operation. POST-2030 PENDING WITH PROJECT CONDITIONS This section analyzes the impact of the addition of trips forecast to be generated by the proposed project to post-2030 pending without project conditions traffic volumes. 35
67 Post-2030 Pending With Project Conditions Traffic Volumes Post-2030 pending with project conditions traffic volumes and forecasts are based on data provided by the City. Exhibit 22 shows post-2030 pending with project conditions a.m. peak hour and p.m. peak hour volumes at the study intersections based on data provided by the City. Exhibit 23 shows post pending with project conditions study roadway segment ADT volumes based on data provided by the City. Post-2030 Pending With Project Conditions Peak Hour Intersection Level of Service Table 32 summarizes post-2030 pending with project conditions a.m. and p.m. peak hour LOS of the study intersections based on ICU calculations provided by the City and HCM calculations based on data supplied by the City; detailed LOS analysis worksheets are contained in Appendix B. 36
68 Not to Scale 6/27 249/410 18/19 28/11 42/14 29/14 41/ / /11 241/ / /86 42/28 12/17 56/46 32/46 394/451 81/97 33/27 191/200 8/24 228/ /443 68/26 34/43 341/266 55/40 29/16 29/18 42/35 CULVER DR 55/54 7/24 117/71 19/53 325/ /103 ROSA DREW LN YALE AVE MICHELSON DR 309/ / /20 562/499 8/3 31/38 6/32 1/6 3/22 30/ /2249 9/7 104/34 370/163 27/ / / /2016 SANDBURG WAY 229/ /204 90/184 14/92 904/ /405 UNIVERSITY DR 10/ / /579 22/18 83/84 66/48 AM/PM Intersection Volumes Project Site Location 741/481 64/43 69/53 46/ / /68 Post-2030 Pending With Project AM/PM Peak Hour Intersection Volumes Exhibit 22 H:\pdata\ \Traffic\Exhibits\Exh22.ai DEC/ / / / / / /202 Legend: XX/XX
69 45,100 Not to Scale CULVER DR 18,200 ROSA DREW LN YALE AVE MICHELSON DR 8,000 10,600 15,800 7,300 8,300 58,800 1,900 SANDBURG WAY 8,600 5,100 5,300 50,800 UNIVERSITY DR Legend: 38,900 X,XXX ADT Volume Project Site Location H:\pdata\ \Traffic\Exhibits\Exh23.ai DEC/2010 Post-2030 Pending With Project Roadway Segment ADT Exhibit 23
70 Table 32 Post-2030 Pending Without Project Conditions and Post-2030 With Project Conditions AM & PM Peak Hour LOS of Study Intersections Post-2030 Pending Without Project Conditions Post-2030 Pending With Project Conditions Study Intersection AM Peak Hour PM Peak Hour AM Peak Hour PM Peak Hour V/C Delay LOS V/C Delay LOS V/C Delay LOS Change in V/C or Delay Significant Impact? V/C Delay LOS Change in V/C or Delay Significant Impact? Culver Dr/Michelson Dr N/A A 0.85 N/A D 0.60 N/A A 0.00 No 0.85 N/A D 0.00 No Sandburg Wy/Michelson Dr 2 N/A 12.9 B N/A 33.6 D N/A 13.3 B 0.40 No N/A 34.6 D 1.00 No Yale Ave/Michelson Dr 2 N/A 22.5 C N/A 31.3 D N/A 23.1 C 0.60 No N/A 33.1 D 1.80 No Yale Ave/University Dr N/A C 0.66 N/A B 0.77 N/A C 0.02 No 0.66 N/A B 0.00 No Rosa Drew Ln/Michelson Dr 2 N/A 14.6 B N/A 20.0 C N/A 15.0 B 0.40 No N/A 20.0 C 0.00 No Ridgeline Dr-Rosa Drew Ln N/A C 0.87 N/A D 0.79 N/A C 0.00 No 0.87 N/A D 0.00 No /University Dr Michelson Dr/University Dr N/A C 0.88 N/A D 0.79 N/A C 0.01 No 0.89 N/A D 0.01 No Note: V/C = volume to capacity ratio; delay shown in seconds per vehicle; Change in V/C or Delay = change in V/C ratio or delay in seconds; deficient intersection operation shown in bold; N/A = not applicable. Source: City provided ITAM data for signalized intersections. 1 = Signalized intersection analyzed utilizing the ICU methodology. 2 = Unsignalized intersection analyzed utilizing the HCM methodology. 37
71 As shown in Table 32, with the addition of project-generated trips, all of the study intersections are forecast to continue to operate at an acceptable LOS (LOS D or better) during the a.m. peak hour and p.m. peak hour according to City of Irvine performance criteria for post-2030 pending with project conditions. As also shown in Table 32, the addition of project-generated trips is forecast to not result in a change in the level of service at any of the study intersections, and based on City-established thresholds of significance, the addition of project-generated trips is forecast to result in no significant impacts at the study intersections for post-2030 pending with project conditions since the LOS at the Rosa Drew Lane/University Drive intersection does not change with implementation of the project. Post-2030 Pending With Project Conditions Signal Warrant Analysis An MUTCD signal warrant analysis was prepared to determine if signalization is projected to be warranted at the Sandburg Way/Michelson Drive study intersection for the following the signal warrants: Minimum Vehicular Traffic Warrant; Interruption of Continuous Traffic Warrant; and Combinations Warrant. Table 33 summarizes the results of the post-2030 pending with project traffic signal warrants for the Sandburg Way/Michelson Drive study intersections; detailed traffic signal warrant sheets are contained in Appendix C. Study Intersection Table 33 Post-2030 Pending With Project Conditions Traffic Signal Warrant Analysis Summary Minimum Vehicular Traffic Warrant Satisfied? Warrant Type Interruption of Continuous Traffic Warrant Satisfied? Combinations Warrant Satisfied? Signalization of Intersection Warranted? Sandburg Way/Michelson Drive No No No No As shown in Table 33, the traffic signal warrants are not satisfied at the Sandburg Way/Michelson Drive intersection for post-2030 pending with project conditions. Post-2030 Pending With Project Conditions Roadway Segment ADT Analysis Post-2030 pending with project conditions roadway segment ADT analysis has been performed using ADT volumes provided by the City (see Exhibit 23). Table 34 summarizes the roadway segment ADT analysis for post-2030 pending with project conditions. 38
72 Table 34 Post-2030 Pending Without Project Conditions and Post-2030 With Project Conditions Study Roadway Segment ADT Analysis Study Roadway Segment Capacity Post-2030 Without Project Conditions Post-2030 With Project Conditions ADT V/C LOS ADT V/C LOS Change in V/C Significant Impact? University Dr from Rosa Drew Ln to Yale Ave 40,000 39, E 38, E 0.00 No University Dr from Rosa Drew Ln to Michelson Dr 32,000 51, F 50, F 0.00 No Rosa Drew Ln from Michelson Dr to University Dr 13,000 1, A 1, A 0.00 No Michelson Dr west of Rosa Drew Ln 18,000 8, A 8, A 0.00 No Michelson Dr west of Yale Ave 18,000 7, A 8, A 0.00 No Note: V/C = volume to capacity ratio; Change in V/C = change in V/C ratio; deficient operation shown in bold. Source: City provided ITAM data. As shown in Table 34, with the addition of project-generated trips, the study roadway segments are forecast to continue to operate at an acceptable LOS (LOS D or better) for post-2030 pending with project conditions with the exception of University Drive from Rosa Drew Land to Michelson Drive. As also shown in Table 34, the addition of project-generated trips is forecast to not result in a change in the level of service at any of the study roadway segments, and based on Cityestablished thresholds of significance, the addition of project-generated trips is forecast to result in no significant impact at the study roadway segments for post-2030 pending with project conditions. Post-2030 Pending With Project Conditions Arterial Peak Hour Link Analysis Post-2030 pending with project conditions roadway segment peak hour link analysis has been performed using peak hour volumes obtained from City provided ITAM data. Post-2030 pending with project conditions roadway segment peak hour link analysis volumes are derived by adding trips associated with the proposed project to year post-2030 pending without project conditions. Table 35 summarizes post-2030 pending with project conditions roadway segment peak hour link analysis. 39
73 Table 35 University Drive Post-2030 Pending Without Project Conditions and Post-2030 With Project Conditions Roadway Segment Peak Hour Link Analysis Study Roadway Segment University Dr WO Yale Ave - Eastbound - Westbound University Dr EO Yale Ave - Eastbound - Westbound University Dr SO Michelson Dr - Eastbound - Westbound University Dr NO Michelson Dr - Eastbound - Westbound Number of Lanes/ Capacity 1 2/3,200 3/4,800 2/3,200 3/4,800 2/3,200 2/3,200 3/4,800 3/4,800 Post-2030 Pending Conditions Post-2030 Pending With Project Conditions AM Peak Hour PM Peak Hour AM Peak Hour PM Peak Hour Volume V/C LOS Volume V/C LOS Volume V/C LOS 1,462 2,820 1,460 2,794 1,951 2,375 2,470 2, A 0.59 A 0.46 A 0.58 A 0.61 A 0.74 C 0.51 A 0.55 A 2,179 1,930 2,050 2,040 2,335 2,114 2,780 2, B 0.40 A 0.64 B 0.43 A 0.73 C 0.66 B 0.58 A 0.48 A Note: V/C = volume to capacity ratio; NO = north of; SO = south of; WO = west of; EO = east of. Source: City provided ITAM data. 1 = Roadway capacity assumes 1,600 vehicles/hour/lane. 1,469 2,820 1,460 2,792 1,951 2,365 2,480 2, A 0.59 A 0.46 A 0.58 A 0.61 A 0.74 C 0.52 A 0.54 A Change in V/C Significant Impact? No No No No No No No No Volume 2,182 1,930 2,050 2,031 2,325 2,105 2,780 2,322 V/C LOS 0.68 B 0.40 A 0.64 B 0.42 A 0.73 C 0.66 B 0.58 A 0.48 A Change in V/C Significant Impact? No No No No No No No No 40
74 As shown in Table 35, with the addition of project-generated trips, the University Drive study roadway segments are forecast to operate at an acceptable LOS (LOS D or better) during both the a.m. peak hour and p.m. peak hour according to City of Irvine performance criteria for post pending with project conditions. As also shown in Table 35, while the University Drive roadway segment between Rosa Drew Lane and Michelson Drive is calculated as forecast to operate at a deficient LOS (LOS E or worse) (Refer to Table 27) over a 24-hour period for post-2030 pending with project conditions, the associated University Drive roadway segment west of Michelson Drive is operating at an acceptable LOS (LOS D or better) during both the a.m. and p.m. peak hours, which are the key to overall roadway segment operation. As also shown in Table 35, the addition of project-generated trips is forecast to not result in a change in the level of service at any of the study roadway segments, and based on Cityestablished thresholds of significance, the addition of project-generated trips is forecast to result in no significant impact at the study roadway segments during both the a.m. peak hour and p.m. peak hour for post-2030 pending with project conditions. 41
75 SPECIAL ISSUES This section discusses the special issues associated with the proposed project, which consist of the following: Access Analysis; Access Analysis Pedestrian Circulation; Bicycle Circulation; Traffic Comparison to Prior Use; Alternative Analysis Summary; and Orange County Congestion Management Program Analysis. Site access at the project site is proposed to be provided via one project access location at Michelson Drive. This section evaluates the project access location on Michelson Drive for the following criteria during post-2030 with project conditions which is considered the worst-case scenario analyzed in this report: TDP-1: Turn lane pocket lengths; TDP-2: Bay taper length; TDP-3: Left-turn in/out access; TDP-4: Right-turn lanes at the driveway access; TDP-10: Distance between the driveway access and adjacent intersections; and TDP-14: Driveway Lengths. Exhibit 24 shows post-2030 with project conditions a.m. peak hour and p.m. peak hour project access volumes utilizing the ITE-based trip generation forecasts for the proposed project and forecast trip percent distribution shown in Exhibits 8 and 9. The site access analysis is prepared for post-2030 with project conditions utilizing post-2030 with project conditions project access volumes shown in Exhibit 24. TDP-1: Turn Lane Pocket Length Evaluation An evaluation of left-turn storage capacity has been prepared in accordance with Transportation Design Procedures 1 (TDP-1) of the City of Irvine Transportation Design Procedures (February 2007) for the following left-turn movement: Westbound Michelson Drive onto Project Access. The evaluation of left-turn storage capacity has been prepared for post-2030 with project conditions. 42
76 401/439 8/25 210/380 5/17 22/14 15/10 Legend: XX/XX AM/PM Intersection Volumes Not to Scale H:\pdata\ \Traffic\Exhibits\Exh24.ai Post-2030 With Project Conditions AM/PM Peak Hour Driveway Volumes DEC/2010 Exhibit 24
77 Table 36 shows the results of the turn lane pocket length evaluation for post-2030 with project conditions in accordance with TDP-1 of the City of Irvine Transportation Design Procedures (February 2007). Table 36 Post-2030 With Project Conditions Turn Lane Pocket Length Evaluation Location Peak Hour Volume (Vehicles) Minimum Turn- Pocket Length Desired Turn- Pocket Length 1 Available Turn- Pocket Length Adequate Turn- Pocket Length Provided? AM Peak Hour Westbound Michelson Left-Turn at Proj Access 5 90 feet 2 90 Feet feet Yes PM Peak Hour Westbound Michelson Left-Turn at Proj Access feet 2 90 feet feet Yes Notes: 1 = Source: City of Irvine Transportation Design Procedures (February 2007). 2 = Minimum required length of 90 feet for Commuter Street governs. As shown in Table 36, based on TDP-1 of the City of Irvine Transportation Design Procedures (February 2007), it is recommended the westbound Michelson Drive left-turn lane at the project access be 90 feet to accommodate minimum required turn-pocket length for post-2030 with project a.m. peak hour traffic volumes. TDP-2: Bay Taper Length Evaluation Inclusion of a bay taper length at the eastbound Michelson Drive left-turn at the full-access driveway on Michelson Drive has been considered in accordance with TDP-2 of the City of Irvine Transportation Design Procedures (February 2007). Since the existing dedicated westbound Michelson Drive left-turn lane pocket will not conflict with the eastbound Michelson Drive left-turn lane pocket at Jordan Avenue-Rosa Drew Lane, further consideration of the bay taper length evaluation is not applicable. TDP-3: Left-Turn In/Out Access Evaluation TDP-3 of the City of Irvine Transportation Design Procedures (February 2007 considers left-turn in/out access along Major, Primary, Secondary and Commuter Streets. While Michelson Drive is classified as a Commuter Street, the procedure for considering left-turn in/out access as outlined in Figure 3.1 of TDP-3 is concerned with four-lane roadways. Since Michelson Drive is a two-lane roadway, the evaluation of TDP-3 is not applicable for the proposed project since evaluation of TDP-3 is required for four-lane arterial roadways. TDP-4: Right-Turn Lanes at Driveways Right lanes at driveways are required by the City of Irvine when the turn volumes and through volumes could conflict. An evaluation of the project access location on Michelson Drive has been prepared in accordance with TDP-4 of the City of Irvine Transportation Design Procedures (February 2007) to determine whether a right-turn deceleration lane is required at the access location. Table 37 shows the criteria to satisfy installation of a right-turn lane based on section TDP-4 of the City of Irvine Transportation Design Procedures (February 2007). 43
78 Table 37 Right-Turn Lane Warrant Highway Major Primary Secondary Right-Turn Lane All Peak Hourly Volume > 100 vehicles Peak Hourly Volume > 200 vehicles Commuter Not Required Source: City of Irvine Transportation Design Procedures (February 2007). Since Michelson Drive is a Commuter Street, a right-turn lane is not required at the project access location. As shown in Exhibit 24, approximately 8 right-turning a.m. peak hour trips and 25 right-turning p.m. peak hour trips are forecast to occur at the project access location on Michelson Drive. TDP-10: Intersection Spacing Evaluation Table 38 shows the recommended minimum spacing between a driveway and an intersection or two driveways based on section TDP-10 of the City of Irvine Transportation Design Procedures (February 2007). Table 38 Distance Between Driveways & Intersections Classification Major Primary Secondary Commuter Local Recommended Minimum Separation (feet) 335 feet 230 feet 185 feet 150 feet 105 feet Private Way 90 feet Source: City of Irvine Transportation Design Procedures (February 2007). Table 39 summarizes the distances between the proposed project access location and adjacent intersections or driveways. 44
79 Table 39 Forecast Distance Between Driveways Summary Location Approximate Distance (feet) Recommended Minimum Separation (feet) Meet Recommended Spacing? Michelson Drive Project Access Distance to Royce Rd 425 feet 150 feet Yes Distance to Rosa Drew Lane 450 feet 150 feet Yes As shown in Table 39, the project access distance meets the minimum distances per TDP-10. TDP-14: Driveway Length Evaluation Since access to the project site is by a roadway and not a driveway where parking aisles are present, evaluation of TDP-14 is not applicable to this project. Pedestrian Circulation As shown on Exhibit 7, the proposed project site is planned to link the existing pedestrian circulation system at the project access point. Pedestrian conditions will be incrementally enhanced along the project frontage on Michelson Drive since the proposed project plans to remove one of the existing project site driveways, thereby reducing the number of locations where potential conflicts between pedestrians and vehicles entering/exiting the project site occur. Sidewalks (approximately 5 feet in width) are currently constructed along Rosa Drew Lane and Michelson Drive along the project frontage, as well as at adjacent properties. Therefore, since a connective sidewalk system already exists on Rosa Drew Lane and Michelson Drive, the pedestrian facilities will be maintained upon completion of the proposed project and as such, will maintain consistency with Circulation Objective B-3. Additionally, sidewalk widths adjacent the project frontage will be constructed in accordance with City of Irvine standards. Bicycle Circulation As shown on Exhibit 7, the proposed project site is planned to link the existing bicycle circulation system at the project access point. Bicyclist conditions will be incrementally enhanced along the project frontage on Michelson Drive since the proposed project plans to remove one of the existing project site driveways, thereby reducing the number of locations where potential conflicts between bicyclists and vehicles entering/exiting the project site occur. A Class II (on-street) bicycle trail (approximately 7 feet in width) currently exists on Michelson Drive. The proposed Vista Verde project does not entail any changes to the City of Irvine General Plan Circulation Element Trails Network. Therefore, since a connective bicycle circulation system already exists on Michelson Drive, the bicycle facilities will be maintained upon completion of the project and as such, will maintain consistency with Circulation Objective B-4. Additionally, bicycle facilities adjacent the project frontage will be constructed in accordance with City of Irvine standards. 45
80 Traffic Comparison To Prior Use As previously noted, this analysis when determining potential project impacts and any related mitigation measures, assumed the project site to have no existing land use and related trip generation. Recognizing the proposed project site was previously utilized as a school site, which generated trips that used to utilize the roadways in this area and were included in the ITAM traffic model projections, this section compares the trip generation associated with that prior use with the forecast trip generation of the proposed project as a point of historical comparison. Trip generation for schools is based on the number of students the site serves. Therefore, the Irvine Unified School District (IUSD) was contacted to obtain their records of student enrollment; IUSD reported enrollment at the former Vista Verde Elementary School had been 667 students. Additionally, the ITAM assumptions for the site were researched, revealing the ITAM modeling assumed an elementary school with 722 students. Hence, ITAM assumed a higher student population, addressing a worst-case scenario for long-range planning purposes. With this as a background, the comparison of the project s trip generation to that associated with IUSD s student enrollment number would be most appropriate for consideration of the existing and short-term conditions, while comparison with the higher number of students in the ITAM model would be most appropriate for references relative to buildout conditions. The proposed project s 66 detached single-family dwelling units are forecast to generate 50 a.m. peak hour, 66 p.m. peak hour, and 632 daily trips based on ITE trip generation rates for single family detached housing. Table 40 shows the net trip generation of the proposed project when accounting for the existing elementary school land use based on attendance information received from the IUSD. Land Use Elementary School Table 40 Preliminary Trip Generation Comparison of Vista Verde School Site Conversion Based on IUSD Information AM Peak Hour Trips PM Peak Hour Trips In Out Total In Out Total Daily Trips Generation Rates Students Single-Family Residential 3 Generation Rates Dwelling Units Difference The rates are established per student from ITE Trip Generation 8 th Edition. 2 Attendance information received from Irvine Unified School District. 3 The rates are established per dwelling unit from ITE Trip Generation 8 th Edition. As shown in Table 40, the proposed residential project when compared to the former elementary school at the project site is forecast to generate 250 less a.m. peak hour trips, 34 less p.m. peak hour trips, and 228 less daily trips based on IUSD attendance information. 46
81 Therefore, it can be concluded that the proposed land use will result in reduced trip generation compared to the prior site use. In the current ITAM model, the land use assumed for the proposed project site is a 722 student elementary school. Table 41 shows the net trip generation of the proposed project when accounting for the elementary school land use assumed in the ITAM model. Table 41 Preliminary Trip Generation Comparison of Vista Verde School Site Conversion Based on ITAM Model Assumptions Land Use Elementary School AM Peak Hour Trips PM Peak Hour Trips In Out Total In Out Total Daily Trips Generation Rates Students Single-Family Residential 3 Generation Rates Dwelling Units Difference The rates are established per student from ITE Trip Generation 8 th Edition 2 Data from current ITAM land use assumptions 3 The rates are established per dwelling unit from ITE Trip Generation 8 th Edition As shown in Table 41, the proposed residential project when compared to the former elementary school at the project site is forecast to generate 274 less a.m. peak hour trips, 42 less p.m. peak hour trips, and 299 less daily trips based on the ITAM model. Therefore, it can be concluded that the proposed land use will result in reduced trip generation compared to the prior General Plan assumptions for the project site. It is shown in both cases the proposed project is forecast to generate less trips than the prior use as a school site during both a.m. and p.m. peak hours, as well as on a daily basis. Lower Density Alternative Analysis Summary A lower density project alternative is being considered that would result in the number of units on the subject site being reduced to 54 detached single-family homes. Site access for the alternative plan would be provided via one full access at Michelson Drive, as is the case for the proposed project. Exhibit 25 shows the lower density alternative project site plan containing 54 dwelling units. Table 42 summarizes the ITE trip generation and net forecast trip generation of the proposed Vista Verde project lower density alternative utilizing the applicable ITE trip generation rates. 47
82 Source: William Lyon Homes (Charles Hartman and Associates), May 11, 2010 Not to Scale H:\pdata\ \Traffic\Exhibits\Exh25.ai Proposed Project Site Plan - Lower Density Alternative DEC/2010 Exhibit 25
83 Table 42 Vista Verde Project Lower Density Alternative Trip Generation Comparison Land Use AM Peak Hour Trips PM Peak Hour Trips Daily Trips In Out Total In Out Total ITE Trip Generation Rates Single-Family Dwelling Unit (ITE 210) Forecast Net Trip Generation of Project Lower Density Project Alternative 66 Detached Single-Family dwelling units Detached Single-Family dwelling units Trip Generation Difference Source: 2008 ITE Trip Generation Manual, 8 th Edition; du = dwelling unit As shown in Table 42, the lower density proposed 54 detached single-family dwelling unit project alternative will generate 115 less daily trips, which consist of 10 less a.m. peak hour trips and 11 less p.m. peak hour trips. Therefore, any potential impacts caused by the proposed 54 detached single-family dwelling unit alternative project will be the same as or less than the proposed 66 detached single-family dwelling unit project. Table 43 summarizes the distances between the proposed project access location and adjacent intersections or driveways for the lower density alternative. Table 43 Forecast Distance Between Driveways Summary Location Approximate Distance (feet) Recommended Minimum Separation (feet) Meet Recommended Spacing? Michelson Drive Project Access Distance to Royce Rd 405 feet 150 feet Yes Distance to Rosa Drew Lane 470 feet 150 feet Yes Orange County Congestion Management Program Analysis The purpose of the Orange County Congestion Management Program (CMP) is to develop a coordinated approach to managing and decreasing traffic congestion by linking the various transportation, land use and air quality planning program throughout the County. The program is consistent with that of the Southern California Association of Governments (SCAG). The CMP requires review of substantial individual projects that might on their own impact the CMP transportation system. 48
84 The Orange County CMP states that if a project generating 1,600 or more trips/day will directly access, or is in close proximity to, a CMP Highway System link, a CMP traffic impact analysis is required. As previously noted in this report, the proposed project is forecast to generate 632 trips per day based on application of the ITE trip generation rates; therefore, no CMP traffic impact analysis is required for the proposed project. MITIGATION MEASURES Based on City of Irvine thresholds of significance, no mitigation measures are required for the proposed project. 49
85 CONCLUSIONS The proposed 66 detached single-family dwelling unit project is forecast to generate 632 daily trips, which include 50 a.m. peak hour trips and 66 p.m. peak hour trips based on application of standard ITE trip generation rates. Trip generation based on the ITAM model forecast results in generation of 567 daily trips, which include 48 a.m. peak hour trips and 48 p.m. peak hour trips. The addition of project-generated trips is forecast to not result in a change in the level of service at any of the study intersections or study roadway segments for either short-term or buildout forecasts. Based on City-established thresholds of significance, the addition of projectgenerated trips is forecast to result in no significant impacts at the study intersections or roadways for any of the analysis scenarios; hence, no mitigation measures are required for the proposed project since the LOS for any intersection operating at a deficient LOS (LOS E or worse) does not change with implementation of the proposed project. The proposed project site is planned to link the existing pedestrian circulation system at the project access point. Pedestrian and bicyclist conditions will be improved along the project frontage on Michelson Drive since the proposed project plans to remove one of the existing project site driveways, thereby reducing the number of locations where potential conflicts between pedestrians/bicyclists and vehicles entering/exiting the project site occur. Additionally, since a connective pedestrian and bicycle trail already exists, implementation will enhance both the pedestrian and bicycle circulation system consistent with Circulation Objectives B-3 and B-4. The proposed lower density 54 detached single-family dwelling unit project alternative will generate 115 less daily trips, which consist of 10 less a.m. peak hour trips and 11 less p.m. peak hour trips compared to the 66 detached dwelling units. Therefore, any potential impacts caused by the proposed 54 detached single-family dwelling unit alternative project will be the same as or less than the proposed 66 detached single-family dwelling unit project. H:\pdata\ \Traffic\Admin\_Revised-Analysis_VV_ \Vista Verde TIA_ doc 50
86 APPENDIX A Existing Count Data
87 Intersection Count Data
88 AM PM AM PM INTERSECTION TURNING MOVEMENT COUNTS PREPARED BY: PACIFIC TRAFFIC DATA SERVICES DATE: LOCATION: IRVINE PROJECT #: CA /18/09 NORTH & SOUTH: CULVER LOCATION #: 1 WEDNESDAY EAST & WEST: MICHELSON CONTROL: SIGNAL NOTES: AM PM N MD W E OTHER S OTHER NORTHBOUND SOUTHBOUND EASTBOUND WESTBOUND U-TURNS CULVER CULVER MICHELSON MICHELSON NL NT NR SL ST SR EL ET ER WL WT WR TOTAL NB SB EB WB TTL LANES: X X X X 7:00 AM :15 AM :30 AM :45 AM , :00 AM :15 AM , :30 AM :45 AM ,053 0 VOLUMES 321 2, , , APPROACH % 13% 85% 2% 12% 68% 20% 47% 25% 28% 20% 31% 49% APP/DEPART 2,441 / 2,914 3,585 / 2, / 632 1,004 / 1,355 0 BEGIN PEAK HR VOLUMES 158 7:45 AM 1, , ,050 APPROACH % 13% 86% 1% 12% 66% 22% 49% 30% 21% 18% 36% 47% PEAK HR FACTOR APP/DEPART 1,193 / 1,485 1,887 / 1, / / :00 PM , :15 PM , :30 PM , :45 PM :00 PM , :15 PM , :30 PM , :45 PM ,362 0 VOLUMES 401 2, , , , APPROACH % 14% 84% 2% 28% 58% 14% 53% 29% 18% 25% 25% 50% APP/DEPART 2,942 / 3,956 3,359 / 2,533 1,962 / 1, / 1,085 0 BEGIN PEAK HR VOLUMES 214 5:00 PM 1, , ,105 APPROACH % 12% 85% 2% 29% 59% 12% 52% 31% 17% 25% 28% 46% PEAK HR FACTOR APP/DEPART 1,723 / 2,293 1,748 / 1,340 1,205 / / CULVER NORTH SIDE MICHELSON WEST SIDE EAST SIDE MICHELSON SOUTH SIDE CULVER PEDESTRIAN CROSSINGS PEDESTRIAN ACTIVATIONS BICYCLE CROSSINGS N SIDE S SIDE E SIDE W SIDE TOTAL N SIDE S SIDE E SIDE W SIDE TOTAL NS SS ES WS TOTAL 7:00 AM :15 AM :30 AM :45 AM :00 AM :15 AM :30 AM :45 AM TOTAL :00 PM :15 PM :30 PM :45 PM :00 PM :15 PM :30 PM :45 PM TOTAL
89 AM PM AM PM INTERSECTION TURNING MOVEMENT COUNTS PREPARED BY: PACIFIC TRAFFIC DATA SERVICES DATE: LOCATION: IRVINE PROJECT #: CA /19/09 NORTH & SOUTH: CULVER LOCATION #: 1 THURSDAY EAST & WEST: MICHELSON CONTROL: SIGNAL NOTES: AM PM N MD W E OTHER S OTHER NORTHBOUND SOUTHBOUND EASTBOUND WESTBOUND U-TURNS CULVER CULVER MICHELSON MICHELSON NL NT NR SL ST SR EL ET ER WL WT WR TOTAL NB SB EB WB TTL LANES: X X X X 7:00 AM :15 AM :30 AM :45 AM , :00 AM , :15 AM , :30 AM , :45 AM ,238 0 VOLUMES 307 2, , , APPROACH % 13% 86% 2% 12% 68% 20% 45% 29% 27% 20% 30% 51% APP/DEPART 2,451 / 3,014 3,866 / 3, / 725 1,125 / 1,412 0 BEGIN PEAK HR VOLUMES 201 8:00 AM 1, , ,008 APPROACH % 13% 85% 2% 11% 69% 20% 47% 23% 31% 20% 31% 49% PEAK HR FACTOR APP/DEPART 1,566 / 1,872 2,321 / 1, / / :00 PM , :15 PM :30 PM , :45 PM , :00 PM , :15 PM , :30 PM , :45 PM ,239 0 VOLUMES 272 2, , , , APPROACH % 9% 88% 2% 26% 62% 13% 54% 29% 17% 28% 27% 45% APP/DEPART 2,927 / 4,068 3,240 / 2,602 1,861 / 1,431 1,032 / BEGIN PEAK HR VOLUMES 149 5:00 PM 1, , ,892 APPROACH % 9% 88% 2% 25% 62% 14% 50% 33% 17% 28% 28% 45% PEAK HR FACTOR APP/DEPART 1,579 / 2,175 1,691 / 1,375 1,073 / / CULVER NORTH SIDE MICHELSON WEST SIDE EAST SIDE MICHELSON SOUTH SIDE CULVER PEDESTRIAN CROSSINGS PEDESTRIAN ACTIVATIONS BICYCLE CROSSINGS N SIDE S SIDE E SIDE W SIDE TOTAL N SIDE S SIDE E SIDE W SIDE TOTAL NS SS ES WS TOTAL 7:00 AM :15 AM :30 AM :45 AM :00 AM :15 AM :30 AM :45 AM TOTAL :00 PM :15 PM :30 PM :45 PM :00 PM :15 PM :30 PM :45 PM TOTAL
90 AM PM AM PM INTERSECTION TURNING MOVEMENT COUNTS PREPARED BY: PACIFIC TRAFFIC DATA SERVICES DATE: LOCATION: IRVINE PROJECT #: CA /19/09 NORTH & SOUTH: SANBURG LOCATION #: 2 THURSDAY EAST & WEST: MICHELSON CONTROL: 4-WAY STOP NOTES: AM PM N MD W E OTHER S OTHER NORTHBOUND SOUTHBOUND EASTBOUND WESTBOUND U-TURNS SANBURG SANBURG MICHELSON MICHELSON NL NT NR SL ST SR EL ET ER WL WT WR TOTAL NB SB EB WB TTL LANES: X X X X 7:00 AM :15 AM :30 AM :45 AM :00 AM :15 AM :30 AM :45 AM VOLUMES , APPROACH % 70% 8% 22% 18% 42% 40% 8% 51% 41% 16% 75% 9% APP/DEPART 273 / / / / BEGIN PEAK HR VOLUMES 130 7:30 AM APPROACH % 73% 6% 21% 24% 40% 37% 6% 50% 44% 17% 72% 11% PEAK HR FACTOR APP/DEPART 179 / / / / :00 PM :15 PM :30 PM :45 PM :00 PM :15 PM :30 PM :45 PM VOLUMES , APPROACH % 46% 20% 34% 26% 29% 46% 7% 77% 16% 13% 73% 14% APP/DEPART 309 / / 269 1,079 / / BEGIN PEAK HR VOLUMES 69 4:45 PM ,103 APPROACH % 42% 19% 39% 31% 31% 39% 6% 76% 17% 13% 73% 13% PEAK HR FACTOR APP/DEPART 165 / / / / SANBURG NORTH SIDE MICHELSON WEST SIDE EAST SIDE MICHELSON SOUTH SIDE SANBURG PEDESTRIAN CROSSINGS PEDESTRIAN ACTIVATIONS BICYCLE CROSSINGS N SIDE S SIDE E SIDE W SIDE TOTAL N SIDE S SIDE E SIDE W SIDE TOTAL NS SS ES WS TOTAL 7:00 AM :15 AM :30 AM :45 AM :00 AM :15 AM :30 AM :45 AM TOTAL :00 PM :15 PM :30 PM :45 PM :00 PM :15 PM :30 PM :45 PM TOTAL
91 AM PM AM PM INTERSECTION TURNING MOVEMENT COUNTS PREPARED BY: PACIFIC TRAFFIC DATA SERVICES DATE: LOCATION: IRVINE PROJECT #: CA /18/09 NORTH & SOUTH: SANDBURG LOCATION #: 2 WEDNESDAY EAST & WEST: MICHELSON CONTROL: 4-WAY STOP NOTES: AM PM N MD W E OTHER S OTHER NORTHBOUND SOUTHBOUND EASTBOUND WESTBOUND U-TURNS SANDBURG SANDBURG MICHELSON MICHELSON NL NT NR SL ST SR EL ET ER WL WT WR TOTAL NB SB EB WB TTL LANES: X X X X 7:00 AM :15 AM :30 AM :45 AM :00 AM :15 AM :30 AM :45 AM VOLUMES , APPROACH % 69% 10% 22% 9% 46% 45% 7% 51% 42% 15% 77% 8% APP/DEPART 260 / / / / BEGIN PEAK HR VOLUMES 121 7:30 AM APPROACH % 71% 6% 23% 13% 40% 46% 5% 49% 46% 17% 74% 9% PEAK HR FACTOR APP/DEPART 170 / / / / :00 PM :15 PM :30 PM :45 PM :00 PM :15 PM :30 PM :45 PM VOLUMES , APPROACH % 48% 19% 32% 20% 29% 50% 8% 76% 16% 12% 74% 14% APP/DEPART 284 / / 267 1,119 / / BEGIN PEAK HR VOLUMES 74 5:00 PM ,111 APPROACH % 49% 19% 32% 18% 31% 51% 9% 76% 16% 12% 73% 14% PEAK HR FACTOR APP/DEPART 152 / / / / SANDBURG NORTH SIDE MICHELSON WEST SIDE EAST SIDE MICHELSON SOUTH SIDE SANDBURG PEDESTRIAN CROSSINGS PEDESTRIAN ACTIVATIONS BICYCLE CROSSINGS N SIDE S SIDE E SIDE W SIDE TOTAL N SIDE S SIDE E SIDE W SIDE TOTAL NS SS ES WS TOTAL 7:00 AM :15 AM :30 AM :45 AM :00 AM :15 AM :30 AM :45 AM TOTAL :00 PM :15 PM :30 PM :45 PM :00 PM :15 PM :30 PM :45 PM TOTAL
92 AM PM AM PM INTERSECTION TURNING MOVEMENT COUNTS PREPARED BY: PACIFIC TRAFFIC DATA SERVICES DATE: LOCATION: IRVINE PROJECT #: CA /18/09 NORTH & SOUTH: YALE LOCATION #: 3 WEDNESDAY EAST & WEST: MICHELSON CONTROL: 4-WAY STOP NOTES: AM PM N MD W E OTHER S OTHER NORTHBOUND SOUTHBOUND EASTBOUND WESTBOUND U-TURNS YALE YALE MICHELSON MICHELSON NL NT NR SL ST SR EL ET ER WL WT WR TOTAL NB SB EB WB TTL LANES: X X X X 7:00 AM :15 AM :30 AM :45 AM :00 AM :15 AM :30 AM :45 AM VOLUMES APPROACH % 43% 14% 43% 57% 5% 38% 7% 76% 17% 7% 93% 0% APP/DEPART 51 / / / / BEGIN PEAK HR VOLUMES 9 7:45 AM APPROACH % 33% 22% 44% 73% 0% 27% 5% 81% 14% 6% 93% 1% PEAK HR FACTOR APP/DEPART 27 / / / / :00 PM :15 PM :30 PM :45 PM :00 PM :15 PM :30 PM :45 PM VOLUMES , APPROACH % 52% 6% 42% 33% 22% 44% 2% 94% 4% 7% 93% 0% APP/DEPART 64 / 15 9 / / / BEGIN PEAK HR VOLUMES 15 5:00 PM APPROACH % 47% 6% 47% 67% 0% 33% 2% 95% 4% 5% 95% 0% PEAK HR FACTOR APP/DEPART 32 / 9 3 / / / YALE NORTH SIDE MICHELSON WEST SIDE EAST SIDE MICHELSON SOUTH SIDE YALE PEDESTRIAN CROSSINGS PEDESTRIAN ACTIVATIONS BICYCLE CROSSINGS N SIDE S SIDE E SIDE W SIDE TOTAL N SIDE S SIDE E SIDE W SIDE TOTAL NS SS ES WS TOTAL 7:00 AM :15 AM :30 AM :45 AM :00 AM :15 AM :30 AM :45 AM TOTAL :00 PM :15 PM :30 PM :45 PM :00 PM :15 PM :30 PM :45 PM TOTAL
93 AM PM AM PM INTERSECTION TURNING MOVEMENT COUNTS PREPARED BY: PACIFIC TRAFFIC DATA SERVICES DATE: LOCATION: IRVINE PROJECT #: CA /19/09 NORTH & SOUTH: YALE LOCATION #: 3 THURSDAY EAST & WEST: MICHELSON CONTROL: 4-WAY STOP NOTES: AM PM N MD W E OTHER S OTHER NORTHBOUND SOUTHBOUND EASTBOUND WESTBOUND U-TURNS YALE YALE MICHELSON MICHELSON NL NT NR SL ST SR EL ET ER WL WT WR TOTAL NB SB EB WB TTL LANES: X X X X 7:00 AM :15 AM :30 AM :45 AM :00 AM :15 AM :30 AM :45 AM VOLUMES , APPROACH % 14% 51% 35% 31% 27% 42% 21% 65% 14% 17% 81% 2% APP/DEPART 135 / / / / BEGIN PEAK HR VOLUMES 13 7:45 AM APPROACH % 13% 62% 26% 30% 29% 41% 25% 59% 16% 20% 77% 3% PEAK HR FACTOR APP/DEPART 104 / / / / :00 PM :15 PM :30 PM :45 PM :00 PM :15 PM :30 PM :45 PM VOLUMES , APPROACH % 51% 8% 41% 21% 5% 74% 2% 95% 3% 8% 92% 0% APP/DEPART 63 / / / / BEGIN PEAK HR VOLUMES 15 5:00 PM APPROACH % 54% 0% 46% 0% 0% 100% 0% 96% 4% 2% 98% 0% PEAK HR FACTOR APP/DEPART 28 / 0 1 / / / YALE NORTH SIDE MICHELSON WEST SIDE EAST SIDE MICHELSON SOUTH SIDE YALE PEDESTRIAN CROSSINGS PEDESTRIAN ACTIVATIONS BICYCLE CROSSINGS N SIDE S SIDE E SIDE W SIDE TOTAL N SIDE S SIDE E SIDE W SIDE TOTAL NS SS ES WS TOTAL 7:00 AM :15 AM :30 AM :45 AM :00 AM :15 AM :30 AM :45 AM TOTAL :00 PM :15 PM :30 PM :45 PM :00 PM :15 PM :30 PM :45 PM TOTAL
94 AM PM AM PM INTERSECTION TURNING MOVEMENT COUNTS PREPARED BY: PACIFIC TRAFFIC DATA SERVICES DATE: LOCATION: IRVINE PROJECT #: CA /18/09 NORTH & SOUTH: YALE LOCATION #: 4 WEDNESDAY EAST & WEST: UNIVERSITY CONTROL: SIGNAL NOTES: AM PM N MD W E OTHER S OTHER NORTHBOUND SOUTHBOUND EASTBOUND WESTBOUND U-TURNS YALE YALE UNIVERSITY UNIVERSITY NL NT NR SL ST SR EL ET ER WL WT WR TOTAL NB SB EB WB TTL LANES: X X X 1 X X X 2 0 X X X X 7:00 AM :15 AM :30 AM :45 AM :00 AM :15 AM :30 AM :45 AM VOLUMES , , , APPROACH % 0% 0% 0% 39% 0% 61% 3% 97% 0% 0% 99% 1% APP/DEPART 0 / / 0 1,599 / 1,614 3,339 / 3,409 0 BEGIN PEAK HR VOLUMES 0 8:00 AM , ,925 APPROACH % 0% 0% 0% 33% 0% 67% 3% 97% 0% 0% 99% 1% PEAK HR FACTOR APP/DEPART 0 / / / 870 1,976 / 2, :00 PM :15 PM :30 PM :45 PM :00 PM :15 PM :30 PM :45 PM VOLUMES , , , APPROACH % 0% 0% 0% 31% 0% 69% 2% 98% 0% 0% 97% 3% APP/DEPART 0 / / 0 3,496 / 3,458 2,069 / 2,084 0 BEGIN PEAK HR VOLUMES 0 5:00 PM , , ,205 APPROACH % 0% 0% 0% 29% 0% 71% 2% 98% 0% 0% 98% 2% PEAK HR FACTOR APP/DEPART 0 / / 0 1,982 / 1,958 1,175 / 1,182 0 YALE NORTH SIDE UNIVERSITY WEST SIDE EAST SIDE UNIVERSITY SOUTH SIDE YALE PEDESTRIAN CROSSINGS PEDESTRIAN ACTIVATIONS BICYCLE CROSSINGS N SIDE S SIDE E SIDE W SIDE TOTAL N SIDE S SIDE E SIDE W SIDE TOTAL NS SS ES WS TOTAL 7:00 AM :15 AM :30 AM :45 AM :00 AM :15 AM :30 AM :45 AM TOTAL :00 PM :15 PM :30 PM :45 PM :00 PM :15 PM :30 PM :45 PM TOTAL
95 AM PM AM PM INTERSECTION TURNING MOVEMENT COUNTS PREPARED BY: PACIFIC TRAFFIC DATA SERVICES DATE: LOCATION: IRVINE PROJECT #: CA /19/09 NORTH & SOUTH: YALE LOCATION #: 4 THURSDAY EAST & WEST: UNIVERSITY CONTROL: SIGNAL NOTES: AM PM N MD W E OTHER S OTHER NORTHBOUND SOUTHBOUND EASTBOUND WESTBOUND U-TURNS YALE YALE UNIVERSITY UNIVERSITY NL NT NR SL ST SR EL ET ER WL WT WR TOTAL NB SB EB WB TTL LANES: X X X 1 X X X 2 0 X X X X 7:00 AM :15 AM :30 AM :45 AM :00 AM :15 AM :30 AM :45 AM VOLUMES , , , APPROACH % 0% 0% 0% 37% 0% 63% 6% 94% 0% 0% 99% 1% APP/DEPART 0 / / 0 1,673 / 1,680 3,606 / 3,753 0 BEGIN PEAK HR VOLUMES 0 7:45 AM , ,287 APPROACH % 0% 0% 0% 36% 0% 64% 8% 92% 0% 0% 98% 2% PEAK HR FACTOR APP/DEPART 0 / / 0 1,082 / 1,076 1,978 / 2, :00 PM :15 PM :30 PM :45 PM :00 PM :15 PM :30 PM :45 PM VOLUMES , , , APPROACH % 0% 0% 0% 34% 0% 66% 2% 98% 0% 0% 97% 3% APP/DEPART 0 / / 0 3,534 / 3,496 2,293 / 2,319 0 BEGIN PEAK HR VOLUMES 0 5:00 PM , , ,480 APPROACH % 0% 0% 0% 41% 0% 59% 3% 97% 0% 0% 97% 3% PEAK HR FACTOR APP/DEPART 0 / / 0 2,068 / 2,042 1,338 / 1,348 0 YALE NORTH SIDE UNIVERSITY WEST SIDE EAST SIDE UNIVERSITY SOUTH SIDE YALE PEDESTRIAN CROSSINGS PEDESTRIAN ACTIVATIONS BICYCLE CROSSINGS N SIDE S SIDE E SIDE W SIDE TOTAL N SIDE S SIDE E SIDE W SIDE TOTAL NS SS ES WS TOTAL 7:00 AM :15 AM :30 AM :45 AM :00 AM :15 AM :30 AM :45 AM TOTAL :00 PM :15 PM :30 PM :45 PM :00 PM :15 PM :30 PM :45 PM TOTAL
96 AM PM AM PM INTERSECTION TURNING MOVEMENT COUNTS PREPARED BY: PACIFIC TRAFFIC DATA SERVICES DATE: LOCATION: IRVINE PROJECT #: CA /18/09 NORTH & SOUTH: ROSA DREW LOCATION #: 5 WEDNESDAY EAST & WEST: MICHELSON CONTROL: 4-WAY STOP NOTES: AM PM N MD W E OTHER S OTHER NORTHBOUND SOUTHBOUND EASTBOUND WESTBOUND U-TURNS ROSA DREW ROSA DREW MICHELSON MICHELSON NL NT NR SL ST SR EL ET ER WL WT WR TOTAL NB SB EB WB TTL LANES: X X X X 7:00 AM :15 AM :30 AM :45 AM :00 AM :15 AM :30 AM :45 AM VOLUMES APPROACH % 33% 24% 43% 43% 31% 26% 8% 83% 10% 8% 86% 6% APP/DEPART 116 / / / / BEGIN PEAK HR VOLUMES 23 7:45 AM APPROACH % 38% 20% 43% 43% 30% 27% 11% 81% 9% 5% 89% 6% PEAK HR FACTOR APP/DEPART 61 / / / / :00 PM :15 PM :30 PM :45 PM :00 PM :15 PM :30 PM :45 PM VOLUMES , APPROACH % 35% 31% 34% 47% 23% 30% 10% 77% 13% 6% 83% 11% APP/DEPART 113 / / / / BEGIN PEAK HR VOLUMES 18 5:00 PM APPROACH % 32% 36% 32% 46% 23% 31% 10% 79% 11% 3% 85% 12% PEAK HR FACTOR APP/DEPART 56 / / / / ROSA DREW NORTH SIDE MICHELSON WEST SIDE EAST SIDE MICHELSON SOUTH SIDE ROSA DREW PEDESTRIAN CROSSINGS PEDESTRIAN ACTIVATIONS BICYCLE CROSSINGS N SIDE S SIDE E SIDE W SIDE TOTAL N SIDE S SIDE E SIDE W SIDE TOTAL NS SS ES WS TOTAL 7:00 AM :15 AM :30 AM :45 AM :00 AM :15 AM :30 AM :45 AM TOTAL :00 PM :15 PM :30 PM :45 PM :00 PM :15 PM :30 PM :45 PM TOTAL
97 AM PM AM PM INTERSECTION TURNING MOVEMENT COUNTS PREPARED BY: PACIFIC TRAFFIC DATA SERVICES DATE: LOCATION: IRVINE PROJECT #: CA /19/09 NORTH & SOUTH: ROSA DREW LOCATION #: 5 THURSDAY EAST & WEST: MICHELSON CONTROL: 4- WAY STOP NOTES: AM PM N MD W E OTHER S OTHER NORTHBOUND SOUTHBOUND EASTBOUND WESTBOUND U-TURNS ROSA DREW ROSA DREW MICHELSON MICHELSON NL NT NR SL ST SR EL ET ER WL WT WR TOTAL NB SB EB WB TTL LANES: X X X X 7:00 AM :15 AM :30 AM :45 AM :00 AM :15 AM :30 AM :45 AM VOLUMES APPROACH % 31% 27% 42% 40% 33% 26% 11% 78% 11% 10% 82% 8% APP/DEPART 138 / / / / BEGIN PEAK HR VOLUMES 21 7:45 AM APPROACH % 29% 28% 43% 41% 37% 23% 13% 78% 8% 7% 85% 8% PEAK HR FACTOR APP/DEPART 72 / / / / :00 PM :15 PM :30 PM :45 PM :00 PM :15 PM :30 PM :45 PM VOLUMES , APPROACH % 40% 22% 37% 40% 28% 32% 9% 79% 12% 7% 81% 11% APP/DEPART 129 / / / / BEGIN PEAK HR VOLUMES 20 5:00 PM APPROACH % 42% 19% 40% 36% 36% 28% 10% 80% 10% 4% 85% 11% PEAK HR FACTOR APP/DEPART 48 / / / / ROSA DREW NORTH SIDE MICHELSON WEST SIDE EAST SIDE MICHELSON SOUTH SIDE ROSA DREW PEDESTRIAN CROSSINGS PEDESTRIAN ACTIVATIONS BICYCLE CROSSINGS N SIDE S SIDE E SIDE W SIDE TOTAL N SIDE S SIDE E SIDE W SIDE TOTAL NS SS ES WS TOTAL 7:00 AM :15 AM :30 AM :45 AM :00 AM :15 AM :30 AM :45 AM TOTAL :00 PM :15 PM :30 PM :45 PM :00 PM :15 PM :30 PM :45 PM TOTAL
98 AM PM AM PM INTERSECTION TURNING MOVEMENT COUNTS PREPARED BY: PACIFIC TRAFFIC DATA SERVICES DATE: LOCATION: IRVINE PROJECT #: CA /18/09 NORTH & SOUTH: ROSA DREW LOCATION #: 6 WEDNESDAY EAST & WEST: UNIVERSITY CONTROL: SIGNAL NOTES: AM PM N MD W E OTHER S OTHER NORTHBOUND SOUTHBOUND EASTBOUND WESTBOUND U-TURNS ROSA DREW ROSA DREW UNIVERSITY UNIVERSITY NL NT NR SL ST SR EL ET ER WL WT WR TOTAL NB SB EB WB TTL LANES: X X X X 7:00 AM :15 AM :30 AM :45 AM :00 AM , :15 AM , :30 AM , :45 AM VOLUMES , , , , APPROACH % 7% 4% 89% 17% 38% 45% 3% 92% 5% 22% 78% 0% APP/DEPART 1,362 / / 1,038 1,614 / 2,728 4,064 / 3,334 0 BEGIN PEAK HR VOLUMES 54 7:45 AM , ,966 APPROACH % 7% 3% 89% 18% 33% 49% 2% 94% 4% 19% 81% 0% PEAK HR FACTOR APP/DEPART 750 / / / 1,511 2,248 / 1, :00 PM :15 PM :30 PM :45 PM :00 PM , :15 PM , :30 PM , :45 PM ,061 0 VOLUMES , , , APPROACH % 7% 7% 86% 21% 51% 29% 2% 95% 3% 32% 66% 2% APP/DEPART 1,086 / / 1,149 3,454 / 4,266 2,923 / 2,075 0 BEGIN PEAK HR VOLUMES 32 5:00 PM , , ,265 APPROACH % 6% 7% 88% 21% 49% 30% 2% 96% 2% 30% 68% 2% PEAK HR FACTOR APP/DEPART 556 / / 586 1,982 / 2,409 1,593 / 1,160 0 ROSA DREW NORTH SIDE UNIVERSITY WEST SIDE EAST SIDE UNIVERSITY SOUTH SIDE ROSA DREW PEDESTRIAN CROSSINGS PEDESTRIAN ACTIVATIONS BICYCLE CROSSINGS N SIDE S SIDE E SIDE W SIDE TOTAL N SIDE S SIDE E SIDE W SIDE TOTAL NS SS ES WS TOTAL 7:00 AM :15 AM :30 AM :45 AM :00 AM :15 AM :30 AM :45 AM TOTAL :00 PM :15 PM :30 PM :45 PM :00 PM :15 PM :30 PM :45 PM TOTAL
99 AM PM AM PM INTERSECTION TURNING MOVEMENT COUNTS PREPARED BY: PACIFIC TRAFFIC DATA SERVICES DATE: LOCATION: IRVINE PROJECT #: CA /19/09 NORTH & SOUTH: ROSA DREW LOCATION #: 6 THURSDAY EAST & WEST: UNIVERSITY CONTROL: SIGNAL NOTES: AM PM N MD W E OTHER S OTHER NORTHBOUND SOUTHBOUND EASTBOUND WESTBOUND U-TURNS ROSA DREW ROSA DREW UNIVERSITY UNIVERSITY NL NT NR SL ST SR EL ET ER WL WT WR TOTAL NB SB EB WB TTL LANES: X X X X 7:00 AM :15 AM :30 AM :45 AM , :00 AM , :15 AM , :30 AM , :45 AM VOLUMES , , , , APPROACH % 7% 4% 89% 16% 40% 44% 4% 93% 4% 21% 78% 0% APP/DEPART 1,421 / / 1,065 1,708 / 2,876 4,362 / 3,601 0 BEGIN PEAK HR VOLUMES 66 7:45 AM , ,316 APPROACH % 8% 4% 88% 12% 28% 60% 3% 94% 3% 19% 80% 1% PEAK HR FACTOR APP/DEPART 835 / / 509 1,061 / 1,745 2,338 / 1, :00 PM :15 PM :30 PM :45 PM :00 PM , :15 PM , :30 PM , :45 PM ,074 0 VOLUMES , , , APPROACH % 7% 8% 85% 21% 48% 30% 2% 95% 3% 30% 68% 2% APP/DEPART 1,155 / / 1,164 3,491 / 4,331 3,166 / 2,287 0 BEGIN PEAK HR VOLUMES 35 5:00 PM , , ,500 APPROACH % 6% 9% 85% 21% 49% 29% 2% 95% 3% 28% 71% 2% PEAK HR FACTOR APP/DEPART 586 / / 615 2,017 / 2,436 1,785 / 1,329 0 ROSA DREW NORTH SIDE UNIVERSITY WEST SIDE EAST SIDE UNIVERSITY SOUTH SIDE ROSA DREW PEDESTRIAN CROSSINGS PEDESTRIAN ACTIVATIONS BICYCLE CROSSINGS N SIDE S SIDE E SIDE W SIDE TOTAL N SIDE S SIDE E SIDE W SIDE TOTAL NS SS ES WS TOTAL 7:00 AM :15 AM :30 AM :45 AM :00 AM :15 AM :30 AM :45 AM TOTAL :00 PM :15 PM :30 PM :45 PM :00 PM :15 PM :30 PM :45 PM TOTAL
100 AM PM AM PM INTERSECTION TURNING MOVEMENT COUNTS PREPARED BY: PACIFIC TRAFFIC DATA SERVICES DATE: LOCATION: IRVINE PROJECT #: CA /18/09 NORTH & SOUTH: MICHELSON LOCATION #: 7 WEDNESDAY EAST & WEST: UNIVERSITY CONTROL: SIGNAL NOTES: AM PM N MD W E OTHER S OTHER NORTHBOUND SOUTHBOUND EASTBOUND WESTBOUND U-TURNS MICHELSON MICHELSON UNIVERSITY UNIVERSITY NL NT NR SL ST SR EL ET ER WL WT WR TOTAL NB SB EB WB TTL LANES: X X X X 7:00 AM :15 AM :30 AM :45 AM , :00 AM , :15 AM , :30 AM , :45 AM VOLUMES , , , APPROACH % 13% 7% 80% 90% 1% 9% 1% 98% 1% 1% 93% 6% APP/DEPART 30 / / 55 2,678 / 3,201 4,235 / 4,000 0 BEGIN PEAK HR VOLUMES 3 7:45 AM , , ,219 APPROACH % 16% 5% 79% 90% 1% 9% 1% 99% 0% 1% 93% 7% PEAK HR FACTOR APP/DEPART 19 / / 22 1,496 / 1,786 2,378 / 2, :00 PM :15 PM :30 PM :45 PM :00 PM , :15 PM , :30 PM , :45 PM ,197 0 VOLUMES , , , APPROACH % 20% 3% 77% 90% 1% 9% 1% 99% 0% 1% 84% 16% APP/DEPART 106 / / 38 4,246 / 4,973 3,349 / 2,893 0 BEGIN PEAK HR VOLUMES 11 5:00 PM , , ,737 APPROACH % 19% 4% 77% 91% 1% 8% 1% 99% 0% 0% 84% 16% PEAK HR FACTOR APP/DEPART 57 / / 11 2,404 / 2,808 1,854 / 1,595 0 MICHELSON NORTH SIDE UNIVERSITY WEST SIDE EAST SIDE UNIVERSITY SOUTH SIDE MICHELSON PEDESTRIAN CROSSINGS PEDESTRIAN ACTIVATIONS BICYCLE CROSSINGS N SIDE S SIDE E SIDE W SIDE TOTAL N SIDE S SIDE E SIDE W SIDE TOTAL NS SS ES WS TOTAL 7:00 AM :15 AM :30 AM :45 AM :00 AM :15 AM :30 AM :45 AM TOTAL :00 PM :15 PM :30 PM :45 PM :00 PM :15 PM :30 PM :45 PM TOTAL
101 AM PM AM PM INTERSECTION TURNING MOVEMENT COUNTS PREPARED BY: PACIFIC TRAFFIC DATA SERVICES DATE: LOCATION: IRVINE PROJECT #: CA /19/09 NORTH & SOUTH: MICHELSON LOCATION #: 7 THURSDAY EAST & WEST: UNIVERSITY CONTROL: SIGNAL NOTES: AM PM N MD W E OTHER S OTHER NORTHBOUND SOUTHBOUND EASTBOUND WESTBOUND U-TURNS MICHELSON MICHELSON UNIVERSITY UNIVERSITY NL NT NR SL ST SR EL ET ER WL WT WR TOTAL NB SB EB WB TTL LANES: X X X X 7:00 AM :15 AM :30 AM :45 AM , :00 AM , :15 AM , :30 AM , :45 AM ,057 0 VOLUMES , , , APPROACH % 23% 19% 58% 90% 1% 9% 1% 98% 1% 1% 94% 6% APP/DEPART 31 / / 60 2,846 / 3,347 4,545 / 4,311 0 BEGIN PEAK HR VOLUMES 1 7:45 AM , , ,438 APPROACH % 7% 7% 87% 92% 2% 7% 1% 98% 1% 1% 93% 6% PEAK HR FACTOR APP/DEPART 15 / / 35 1,643 / 1,918 2,455 / 2, :00 PM :15 PM :30 PM , :45 PM , :00 PM , :15 PM , :30 PM , :45 PM ,187 0 VOLUMES , , , APPROACH % 16% 4% 80% 87% 2% 12% 1% 99% 0% 1% 85% 15% APP/DEPART 116 / / 54 4,266 / 4,999 3,554 / 3,116 0 BEGIN PEAK HR VOLUMES 10 5:00 PM , , ,862 APPROACH % 16% 5% 79% 87% 1% 12% 1% 99% 0% 1% 84% 15% PEAK HR FACTOR APP/DEPART 61 / / 20 2,406 / 2,780 1,994 / 1,743 0 MICHELSON NORTH SIDE UNIVERSITY WEST SIDE EAST SIDE UNIVERSITY SOUTH SIDE MICHELSON PEDESTRIAN CROSSINGS PEDESTRIAN ACTIVATIONS BICYCLE CROSSINGS N SIDE S SIDE E SIDE W SIDE TOTAL N SIDE S SIDE E SIDE W SIDE TOTAL NS SS ES WS TOTAL 7:00 AM :15 AM :30 AM :45 AM :00 AM :15 AM :30 AM :45 AM TOTAL :00 PM :15 PM :30 PM :45 PM :00 PM :15 PM :30 PM :45 PM TOTAL
102 ADT Count Data
103 Average Daily Traffic Volumes WEDNESDAY - NOVEMBER 18, 2009 CITY: IRVINE PROJECT: CA ROSA DREW BTWN MICHELSON & UNIVERSITY Prepared by: Field Data Services of Arizona, Inc. AM Period NB SB EB WB PM Period NB SB EB WB 00: : : : : : : : : : : : : : : : : : : : : : : : : : : : : : : : : : : : : : : : : : : : : : : : : : : : : : : : : : : : : : : : : : : : : : : : : : : : : : : : : : : : : : : : : : : : : : : : Total Vol Daily Totals NB SB EB WB Combined AM PM Split % 58.3% 41.7% 35.7% 52.1% 47.9% 64.3% Peak Hour 09:00 07:15 09:00 14:15 15:15 14:45 Volume P.H.F PACIFIC TRAFFIC & TRANSIT DATA SERVICES
104 Average Daily Traffic Volumes THURSDAY - NOVEMBER 19, 2009 CITY: IRVINE PROJECT: CA ROSA DREW BTWN MICHELSON & UNIVERSITY Prepared by: Field Data Services of Arizona, Inc. AM Period NB SB EB WB PM Period NB SB EB WB 00: : : : : : : : : : : : : : : : : : : : : : : : : : : : : : : : : : : : : : : : : : : : : : : : : : : : : : : : : : : : : : : : : : : : : : : : : : : : : : : : : : : : : : : : : : : : : : : : Total Vol Daily Totals NB SB EB WB Combined AM PM Split % 48.9% 51.1% 34.5% 54.8% 45.2% 65.5% Peak Hour 07:30 07:30 07:30 14:45 16:00 14:45 Volume P.H.F PACIFIC TRAFFIC & TRANSIT DATA SERVICES
105 WEDNESDAY - NOVEMBER 18, 2009 Average Daily CITY: IRVINE Traffic Volumes PROJECT: MICHELSON E-O YALE Prepared by: Field Data Services of Arizona, Inc. AM Period NB SB EB WB PM Period NB SB EB WB 00: : : : : : : : : : : : : : : : : : : : : : : : : : : : : : : : : : : : : : : : : : : : : : : : : : : : : : : : : : : : : : : : : : : : : : : : : : : : : : : : : : : : : : : : : : : : : : : : Total Vol Daily Totals NB SB EB WB Combined AM PM Split % 51.6% 48.4% 30.6% 58.9% 41.1% 69.4% Peak Hour 08:45 08:45 08:45 17:15 16:45 17:15 Volume P.H.F PACIFIC TRAFFIC & TRANSIT DATA SERVICES CA
106 THURSDAY - NOVEMBER 19, 2009 Average Daily CITY: IRVINE Traffic Volumes PROJECT: MICHELSON E-O YALE Prepared by: Field Data Services of Arizona, Inc. AM Period NB SB EB WB PM Period NB SB EB WB 00: : : : : : : : : : : : : : : : : : : : : : : : : : : : : : : : : : : : : : : : : : : : : : : : : : : : : : : : : : : : : : : : : : : : : : : : : : : : : : : : : : : : : : : : : : : : : : : : Total Vol Daily Totals NB SB EB WB Combined AM PM Split % 50.0% 50.0% 31.5% 56.7% 43.3% 68.5% Peak Hour 07:45 07:45 07:45 17:15 16:45 17:00 Volume P.H.F PACIFIC TRAFFIC & TRANSIT DATA SERVICES CA
107 WEDNESDAY - NOVEMBER 18, 2009 Average Daily CITY: IRVINE Traffic Volumes PROJECT: MICHELSON E-O ROSA DREW Prepared by: Field Data Services of Arizona, Inc. AM Period NB SB EB WB PM Period NB SB EB WB 00: : : : : : : : : : : : : : : : : : : : : : : : : : : : : : : : : : : : : : : : : : : : : : : : : : : : : : : : : : : : : : : : : : : : : : : : : : : : : : : : : : : : : : : : : : : : : : : : Total Vol Daily Totals NB SB EB WB Combined AM PM Split % 53.9% 46.1% 33.1% 56.4% 43.6% 66.9% Peak Hour 08:45 08:45 08:45 17:15 17:15 17:15 Volume P.H.F PACIFIC TRAFFIC & TRANSIT DATA SERVICES CA
108 THURSDAY - NOVEMBER 19, 2009 Average Daily CITY: IRVINE Traffic Volumes PROJECT: MICHELSON E-O ROSA DREW Prepared by: Field Data Services of Arizona, Inc. AM Period NB SB EB WB PM Period NB SB EB WB 00: : : : : : : : : : : : : : : : : : : : : : : : : : : : : : : : : : : : : : : : : : : : : : : : : : : : : : : : : : : : : : : : : : : : : : : : : : : : : : : : : : : : : : : : : : : : : : : : Total Vol Daily Totals NB SB EB WB Combined AM PM Split % 54.6% 45.4% 31.4% 55.9% 44.1% 68.6% Peak Hour 07:45 07:45 07:45 17:15 17:15 17:15 Volume P.H.F PACIFIC TRAFFIC & TRANSIT DATA SERVICES CA
109 Counts Unlimited, Inc Jaclyn Avenue Moreno Valley, CA City of Irvine File Name: 236 Michelson Drive Site Code: B/ Culver Drive - Yale Avenue Date: Eastbound 24 Hour Directional Volume Count Westbound 9/23/ Minute Totals Hourly Totals 15 Minute Totals Hourly Totals Combined Totals Time Morning Afternoon Morning Afternoon Morning Afternoon Morning Afternoon Morning Afternoon 12: : : : : : : : : : : : : : : : : : : : : : : : : : : : : : : : : : : : : : : : : : : : : : : : Totals Combined Totals ADT 8400 AM Peak Hour 830 AM 830 AM Volume P.H.F PM Peak Hour 515 PM 300 PM Volume P.H.F Percentage 24.9% 75.1% 41.8% 58.2% Phone: counts@countsunlimited.com Fax:
110 Counts Unlimited, Inc Jaclyn Avenue Moreno Valley, CA City of Irvine File Name: 236 Michelson Drive Site Code: B/ Culver Drive - Yale Avenue 24 Hour Directional Volume Count Date: Eastbound Westbound 9/24/ Minute Totals Hourly Totals 15 Minute Totals Hourly Totals Combined Totals Time Morning Afternoon Morning Afternoon Morning Afternoon Morning Afternoon Morning Afternoon 12: : : : : : : : : : : : : : : : : : : : : : : : : : : : : : : : : : : : : : : : : : : : : : : : Totals Combined Totals ADT 8471 AM Peak Hour 745 AM 745 AM Volume P.H.F PM Peak Hour 500 PM 230 PM Volume P.H.F Percentage 25.0% 75.0% 41.2% 58.8% Phone: counts@countsunlimited.com Fax:
111 Counts Unlimited, Inc Jaclyn Avenue Moreno Valley, CA City of Irvine File Name: 278 University Drive Site Code: B/ Yale Avenue - Ridgeline Drive Date: Eastbound 24 Hour Directional Volume Count Westbound 10/21/ Minute Totals Hourly Totals 15 Minute Totals Hourly Totals Combined Totals Time Morning Afternoon Morning Afternoon Morning Afternoon Morning Afternoon Morning Afternoon 12: : : : : : : : : : : : : : : : : : : : : : : : : : : : : : : : : : : : : : : : : : : : : : : : Totals Combined Totals ADT AM Peak Hour 730 AM 745 AM Volume P.H.F PM Peak Hour 515 PM 500 PM Volume P.H.F Percentage 27.3% 72.7% 46.4% 53.6% Phone: counts@countsunlimited.com Fax:
112 Counts Unlimited, Inc Jaclyn Avenue Moreno Valley, CA City of Irvine File Name: 278 University Drive Site Code: B/ Yale Avenue - Ridgeline Drive 24 Hour Directional Volume Count Date: Eastbound Westbound 10/22/ Minute Totals Hourly Totals 15 Minute Totals Hourly Totals Combined Totals Time Morning Afternoon Morning Afternoon Morning Afternoon Morning Afternoon Morning Afternoon 12: : : : : : : : : : : : : : : : : : : : : : : : : : : : : : : : : : : : : : : : : : : : : : : : Totals Combined Totals ADT AM Peak Hour 800 AM 815 AM Volume P.H.F PM Peak Hour 500 PM 500 PM Volume P.H.F Percentage 28.1% 71.9% 46.9% 53.1% Phone: counts@countsunlimited.com Fax:
113 Counts Unlimited, Inc Jaclyn Avenue Moreno Valley, CA City of Irvine File Name: 279 University Drive Site Code: B/ Ridgeline Drive - Michelson Drive Date: Eastbound 24 Hour Directional Volume Count Westbound 10/21/ Minute Totals Hourly Totals 15 Minute Totals Hourly Totals Combined Totals Time Morning Afternoon Morning Afternoon Morning Afternoon Morning Afternoon Morning Afternoon 12: : : : : : : : : : : : : : : : : : : : : : : : : : : : : : : : : : : : : : : : : : : : : : : : Totals Combined Totals ADT AM Peak Hour 730 AM 745 AM Volume P.H.F PM Peak Hour 515 PM 500 PM Volume P.H.F Percentage 31.9% 68.1% 41.2% 58.8% Phone: counts@countsunlimited.com Fax:

114 Counts Unlimited, Inc Jaclyn Avenue Moreno Valley, CA City of Irvine File Name: 279 University Drive Site Code: B/ Ridgeline Drive - Michelson Drive 24 Hour Directional Volume Count Date: Eastbound Westbound 10/22/ Minute Totals Hourly Totals 15 Minute Totals Hourly Totals Combined Totals Time Morning Afternoon Morning Afternoon Morning Afternoon Morning Afternoon Morning Afternoon 12: : : : : : : : : : : : : : : : : : : : : : : : : : : : : : : : : : : : : : : : : : : : : : : : Totals Combined Totals ADT AM Peak Hour 800 AM 800 AM Volume P.H.F PM Peak Hour 500 PM 500 PM Volume P.H.F Percentage 32.4% 67.6% 41.7% 58.3% Phone: counts@countsunlimited.com Fax:
115 APPENDIX B LOS Analysis Sheets
116 Existing Conditions
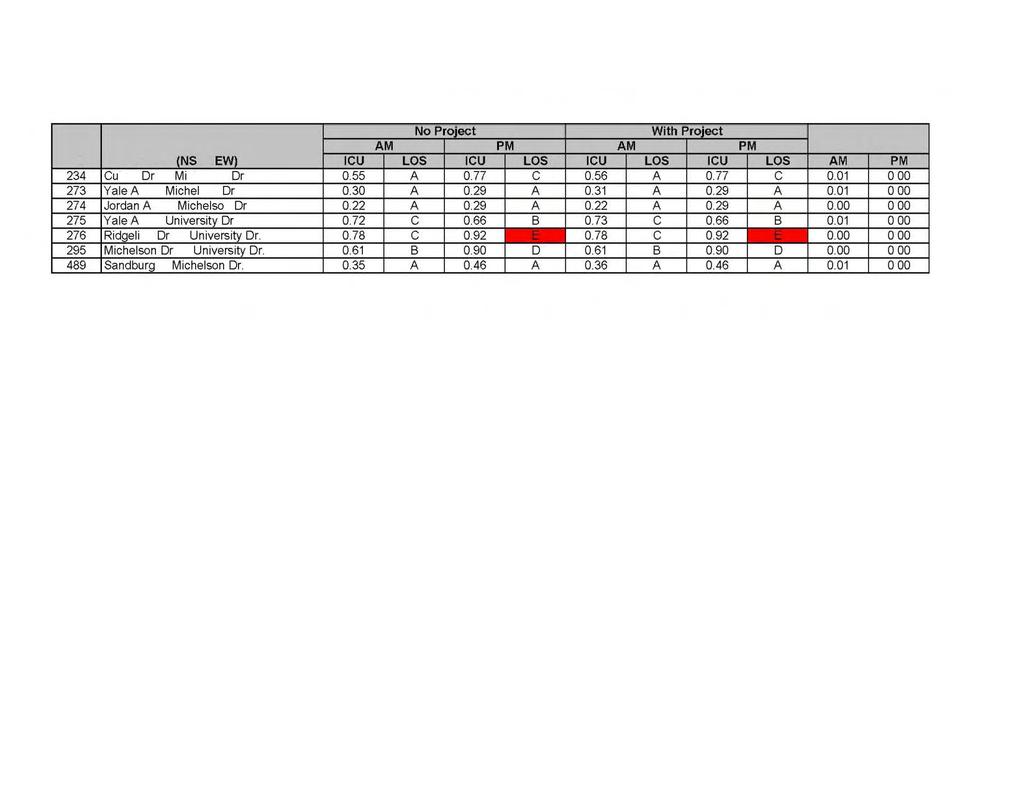
117
118
119
120
121 EX-AM Thu May 13, :37:33 Page VISTA VERDE EXISTING CONDITIONS AM PEAK HOUR Level Of Service Computation Report 2000 HCM 4-Way Stop Method (Base Volume Alternative) Intersection #2 SANDBURG/MICHELSON Cycle (sec): 100 Critical Vol./Cap.(X): Loss Time (sec): 0 (Y+R=4.0 sec) Average Delay (sec/veh): 10.4 Optimal Cycle: 0 Level Of Service: B Approach: North Bound South Bound East Bound West Bound Movement: L - T - R L - T - R L - T - R L - T - R Control: Stop Sign Stop Sign Stop Sign Stop Sign Rights: Include Include Include Include Min. Green: Lanes: 0 0 1! ! Volume Module: Base Vol: Growth Adj: Initial Bse: User Adj: PHF Adj: PHF Volume: Reduct Vol: Reduced Vol: PCE Adj: MLF Adj: FinalVolume: Saturation Flow Module: Adjustment: Lanes: Final Sat.: Capacity Analysis Module: Vol/Sat: Crit Moves: **** **** **** **** Delay/Veh: Delay Adj: AdjDel/Veh: LOS by Move: B B B A A A A A A A B A ApproachDel: Delay Adj: ApprAdjDel: LOS by Appr: B A A B AllWayAvgQ: Note: Queue reported is the number of cars per lane. EX-AM Thu May 13, :37:33 Page VISTA VERDE EXISTING CONDITIONS AM PEAK HOUR Level Of Service Computation Report 2000 HCM 4-Way Stop Method (Base Volume Alternative) Intersection #3 YALE/MICHELSON Cycle (sec): 100 Critical Vol./Cap.(X): Loss Time (sec): 0 (Y+R=4.0 sec) Average Delay (sec/veh): 10.6 Optimal Cycle: 0 Level Of Service: B Approach: North Bound South Bound East Bound West Bound Movement: L - T - R L - T - R L - T - R L - T - R Control: Stop Sign Stop Sign Stop Sign Stop Sign Rights: Include Include Include Include Min. Green: Lanes: Volume Module: Base Vol: Growth Adj: Initial Bse: User Adj: PHF Adj: PHF Volume: Reduct Vol: Reduced Vol: PCE Adj: MLF Adj: FinalVolume: Saturation Flow Module: Adjustment: Lanes: Final Sat.: Capacity Analysis Module: Vol/Sat: Crit Moves: **** **** **** **** Delay/Veh: Delay Adj: AdjDel/Veh: LOS by Move: B B A B B A B B A A B A ApproachDel: Delay Adj: ApprAdjDel: LOS by Appr: A A B B AllWayAvgQ: Note: Queue reported is the number of cars per lane.
122 EX-AM Thu May 13, :37:33 Page VISTA VERDE EXISTING CONDITIONS AM PEAK HOUR Level Of Service Computation Report 2000 HCM 4-Way Stop Method (Base Volume Alternative) Intersection #4 ROSA DREW/MICHELSON Cycle (sec): 100 Critical Vol./Cap.(X): Loss Time (sec): 0 (Y+R=4.0 sec) Average Delay (sec/veh): 8.9 Optimal Cycle: 0 Level Of Service: A Approach: North Bound South Bound East Bound West Bound Movement: L - T - R L - T - R L - T - R L - T - R Control: Stop Sign Stop Sign Stop Sign Stop Sign Rights: Include Include Include Include Min. Green: Lanes: 0 0 1! ! Volume Module: Base Vol: Growth Adj: Initial Bse: User Adj: PHF Adj: PHF Volume: Reduct Vol: Reduced Vol: PCE Adj: MLF Adj: FinalVolume: Saturation Flow Module: Adjustment: Lanes: Final Sat.: Capacity Analysis Module: Vol/Sat: Crit Moves: **** **** **** **** Delay/Veh: Delay Adj: AdjDel/Veh: LOS by Move: A A A A A A A A A A A A ApproachDel: Delay Adj: ApprAdjDel: LOS by Appr: A A A A AllWayAvgQ: Note: Queue reported is the number of cars per lane.
123 EX-PM Thu May 13, :37:39 Page VISTA VERDE EXISTING CONDITIONS PM PEAK HOUR Level Of Service Computation Report 2000 HCM 4-Way Stop Method (Base Volume Alternative) Intersection #2 SANDBURG/MICHELSON Cycle (sec): 100 Critical Vol./Cap.(X): Loss Time (sec): 0 (Y+R=4.0 sec) Average Delay (sec/veh): 15.3 Optimal Cycle: 0 Level Of Service: C Approach: North Bound South Bound East Bound West Bound Movement: L - T - R L - T - R L - T - R L - T - R Control: Stop Sign Stop Sign Stop Sign Stop Sign Rights: Include Include Include Include Min. Green: Lanes: 0 0 1! ! Volume Module: Base Vol: Growth Adj: Initial Bse: User Adj: PHF Adj: PHF Volume: Reduct Vol: Reduced Vol: PCE Adj: MLF Adj: FinalVolume: Saturation Flow Module: Adjustment: Lanes: Final Sat.: Capacity Analysis Module: Vol/Sat: Crit Moves: **** **** **** **** Delay/Veh: Delay Adj: AdjDel/Veh: LOS by Move: B B B A A A A C A A B A ApproachDel: Delay Adj: ApprAdjDel: LOS by Appr: B A C B AllWayAvgQ: Note: Queue reported is the number of cars per lane. EX-PM Thu May 13, :37:39 Page VISTA VERDE EXISTING CONDITIONS PM PEAK HOUR Level Of Service Computation Report 2000 HCM 4-Way Stop Method (Base Volume Alternative) Intersection #3 YALE/MICHELSON Cycle (sec): 100 Critical Vol./Cap.(X): Loss Time (sec): 0 (Y+R=4.0 sec) Average Delay (sec/veh): 12.5 Optimal Cycle: 0 Level Of Service: B Approach: North Bound South Bound East Bound West Bound Movement: L - T - R L - T - R L - T - R L - T - R Control: Stop Sign Stop Sign Stop Sign Stop Sign Rights: Include Include Include Include Min. Green: Lanes: Volume Module: Base Vol: Growth Adj: Initial Bse: User Adj: PHF Adj: PHF Volume: Reduct Vol: Reduced Vol: PCE Adj: MLF Adj: FinalVolume: Saturation Flow Module: Adjustment: Lanes: Final Sat.: Capacity Analysis Module: Vol/Sat: 0.03 xxxx 0.02 xxxx Crit Moves: **** **** **** **** Delay/Veh: Delay Adj: AdjDel/Veh: LOS by Move: A * A * * A * B A A B * ApproachDel: Delay Adj: ApprAdjDel: LOS by Appr: A A B B AllWayAvgQ: Note: Queue reported is the number of cars per lane.
124 EX-PM Thu May 13, :37:39 Page VISTA VERDE EXISTING CONDITIONS PM PEAK HOUR Level Of Service Computation Report 2000 HCM 4-Way Stop Method (Base Volume Alternative) Intersection #4 ROSA DREW/MICHELSON Cycle (sec): 100 Critical Vol./Cap.(X): Loss Time (sec): 0 (Y+R=4.0 sec) Average Delay (sec/veh): 10.9 Optimal Cycle: 0 Level Of Service: B Approach: North Bound South Bound East Bound West Bound Movement: L - T - R L - T - R L - T - R L - T - R Control: Stop Sign Stop Sign Stop Sign Stop Sign Rights: Include Include Include Include Min. Green: Lanes: 0 0 1! ! Volume Module: Base Vol: Growth Adj: Initial Bse: User Adj: PHF Adj: PHF Volume: Reduct Vol: Reduced Vol: PCE Adj: MLF Adj: FinalVolume: Saturation Flow Module: Adjustment: Lanes: Final Sat.: Capacity Analysis Module: Vol/Sat: Crit Moves: **** **** **** **** Delay/Veh: Delay Adj: AdjDel/Veh: LOS by Move: A A A A A A A B B A B B ApproachDel: Delay Adj: ApprAdjDel: LOS by Appr: A A B B AllWayAvgQ: Note: Queue reported is the number of cars per lane.
125 Existing Plus Project Conditions
126
127
128
129 EXWP-AM Thu May 13, :38:08 Page VISTA VERDE EXISTING WITH PROJECT CONDITIONS AM PEAK HOUR Level Of Service Computation Report 2000 HCM 4-Way Stop Method (Base Volume Alternative) Intersection #2 SANDBURG/MICHELSON Cycle (sec): 100 Critical Vol./Cap.(X): Loss Time (sec): 0 (Y+R=4.0 sec) Average Delay (sec/veh): 10.5 Optimal Cycle: 0 Level Of Service: B Approach: North Bound South Bound East Bound West Bound Movement: L - T - R L - T - R L - T - R L - T - R Control: Stop Sign Stop Sign Stop Sign Stop Sign Rights: Include Include Include Include Min. Green: Lanes: 0 0 1! ! Volume Module: Base Vol: Growth Adj: Initial Bse: User Adj: PHF Adj: PHF Volume: Reduct Vol: Reduced Vol: PCE Adj: MLF Adj: FinalVolume: Saturation Flow Module: Adjustment: Lanes: Final Sat.: Capacity Analysis Module: Vol/Sat: Crit Moves: **** **** **** **** Delay/Veh: Delay Adj: AdjDel/Veh: LOS by Move: B B B A A A A A A A B A ApproachDel: Delay Adj: ApprAdjDel: LOS by Appr: B A A B AllWayAvgQ: Note: Queue reported is the number of cars per lane. EXWP-AM Thu May 13, :38:08 Page VISTA VERDE EXISTING WITH PROJECT CONDITIONS AM PEAK HOUR Level Of Service Computation Report 2000 HCM 4-Way Stop Method (Base Volume Alternative) Intersection #3 YALE/MICHELSON Cycle (sec): 100 Critical Vol./Cap.(X): Loss Time (sec): 0 (Y+R=4.0 sec) Average Delay (sec/veh): 10.9 Optimal Cycle: 0 Level Of Service: B Approach: North Bound South Bound East Bound West Bound Movement: L - T - R L - T - R L - T - R L - T - R Control: Stop Sign Stop Sign Stop Sign Stop Sign Rights: Include Include Include Include Min. Green: Lanes: Volume Module: Base Vol: Growth Adj: Initial Bse: User Adj: PHF Adj: PHF Volume: Reduct Vol: Reduced Vol: PCE Adj: MLF Adj: FinalVolume: Saturation Flow Module: Adjustment: Lanes: Final Sat.: Capacity Analysis Module: Vol/Sat: Crit Moves: **** **** **** **** Delay/Veh: Delay Adj: AdjDel/Veh: LOS by Move: B B A B B A B B A B B A ApproachDel: Delay Adj: ApprAdjDel: LOS by Appr: A A B B AllWayAvgQ: Note: Queue reported is the number of cars per lane.
130 EXWP-AM Thu May 13, :38:08 Page VISTA VERDE EXISTING WITH PROJECT CONDITIONS AM PEAK HOUR Level Of Service Computation Report 2000 HCM 4-Way Stop Method (Base Volume Alternative) Intersection #4 ROSA DREW/MICHELSON Cycle (sec): 100 Critical Vol./Cap.(X): Loss Time (sec): 0 (Y+R=4.0 sec) Average Delay (sec/veh): 9.0 Optimal Cycle: 0 Level Of Service: A Approach: North Bound South Bound East Bound West Bound Movement: L - T - R L - T - R L - T - R L - T - R Control: Stop Sign Stop Sign Stop Sign Stop Sign Rights: Include Include Include Include Min. Green: Lanes: 0 0 1! ! Volume Module: Base Vol: Growth Adj: Initial Bse: User Adj: PHF Adj: PHF Volume: Reduct Vol: Reduced Vol: PCE Adj: MLF Adj: FinalVolume: Saturation Flow Module: Adjustment: Lanes: Final Sat.: Capacity Analysis Module: Vol/Sat: Crit Moves: **** **** **** **** Delay/Veh: Delay Adj: AdjDel/Veh: LOS by Move: A A A A A A A A A A A A ApproachDel: Delay Adj: ApprAdjDel: LOS by Appr: A A A A AllWayAvgQ: Note: Queue reported is the number of cars per lane.
131 EXWP-PM Thu May 13, :38:28 Page VISTA VERDE EXISTING WITH PROJECT CONDITIONS PM PEAK HOUR Level Of Service Computation Report 2000 HCM 4-Way Stop Method (Base Volume Alternative) Intersection #2 SANDBURG/MICHELSON Cycle (sec): 100 Critical Vol./Cap.(X): Loss Time (sec): 0 (Y+R=4.0 sec) Average Delay (sec/veh): 15.6 Optimal Cycle: 0 Level Of Service: C Approach: North Bound South Bound East Bound West Bound Movement: L - T - R L - T - R L - T - R L - T - R Control: Stop Sign Stop Sign Stop Sign Stop Sign Rights: Include Include Include Include Min. Green: Lanes: 0 0 1! ! Volume Module: Base Vol: Growth Adj: Initial Bse: User Adj: PHF Adj: PHF Volume: Reduct Vol: Reduced Vol: PCE Adj: MLF Adj: FinalVolume: Saturation Flow Module: Adjustment: Lanes: Final Sat.: Capacity Analysis Module: Vol/Sat: Crit Moves: **** **** **** **** Delay/Veh: Delay Adj: AdjDel/Veh: LOS by Move: B B B A A A A C A A B A ApproachDel: Delay Adj: ApprAdjDel: LOS by Appr: B A C B AllWayAvgQ: Note: Queue reported is the number of cars per lane. EXWP-PM Thu May 13, :38:28 Page VISTA VERDE EXISTING WITH PROJECT CONDITIONS PM PEAK HOUR Level Of Service Computation Report 2000 HCM 4-Way Stop Method (Base Volume Alternative) Intersection #3 YALE/MICHELSON Cycle (sec): 100 Critical Vol./Cap.(X): Loss Time (sec): 0 (Y+R=4.0 sec) Average Delay (sec/veh): 12.7 Optimal Cycle: 0 Level Of Service: B Approach: North Bound South Bound East Bound West Bound Movement: L - T - R L - T - R L - T - R L - T - R Control: Stop Sign Stop Sign Stop Sign Stop Sign Rights: Include Include Include Include Min. Green: Lanes: Volume Module: Base Vol: Growth Adj: Initial Bse: User Adj: PHF Adj: PHF Volume: Reduct Vol: Reduced Vol: PCE Adj: MLF Adj: FinalVolume: Saturation Flow Module: Adjustment: Lanes: Final Sat.: Capacity Analysis Module: Vol/Sat: 0.03 xxxx 0.03 xxxx Crit Moves: **** **** **** **** Delay/Veh: Delay Adj: AdjDel/Veh: LOS by Move: A * A * * A * B A A B * ApproachDel: Delay Adj: ApprAdjDel: LOS by Appr: A A B B AllWayAvgQ: Note: Queue reported is the number of cars per lane.
132 EXWP-PM Thu May 13, :38:28 Page VISTA VERDE EXISTING WITH PROJECT CONDITIONS PM PEAK HOUR Level Of Service Computation Report 2000 HCM 4-Way Stop Method (Base Volume Alternative) Intersection #4 ROSA DREW/MICHELSON Cycle (sec): 100 Critical Vol./Cap.(X): Loss Time (sec): 0 (Y+R=4.0 sec) Average Delay (sec/veh): 11.1 Optimal Cycle: 0 Level Of Service: B Approach: North Bound South Bound East Bound West Bound Movement: L - T - R L - T - R L - T - R L - T - R Control: Stop Sign Stop Sign Stop Sign Stop Sign Rights: Include Include Include Include Min. Green: Lanes: 0 0 1! ! Volume Module: Base Vol: Growth Adj: Initial Bse: User Adj: PHF Adj: PHF Volume: Reduct Vol: Reduced Vol: PCE Adj: MLF Adj: FinalVolume: Saturation Flow Module: Adjustment: Lanes: Final Sat.: Capacity Analysis Module: Vol/Sat: Crit Moves: **** **** **** **** Delay/Veh: Delay Adj: AdjDel/Veh: LOS by Move: A A A A A A A B B A B B ApproachDel: Delay Adj: ApprAdjDel: LOS by Appr: A A B B AllWayAvgQ: Note: Queue reported is the number of cars per lane.
133 Year 2015 Without Project Conditions
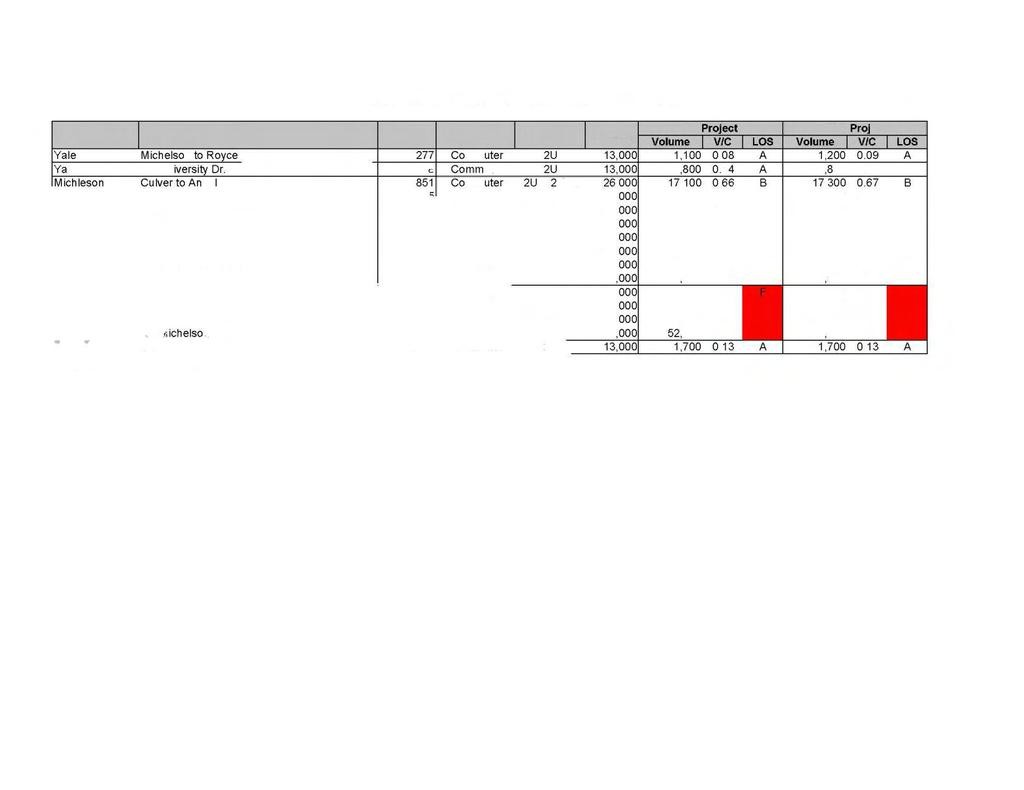
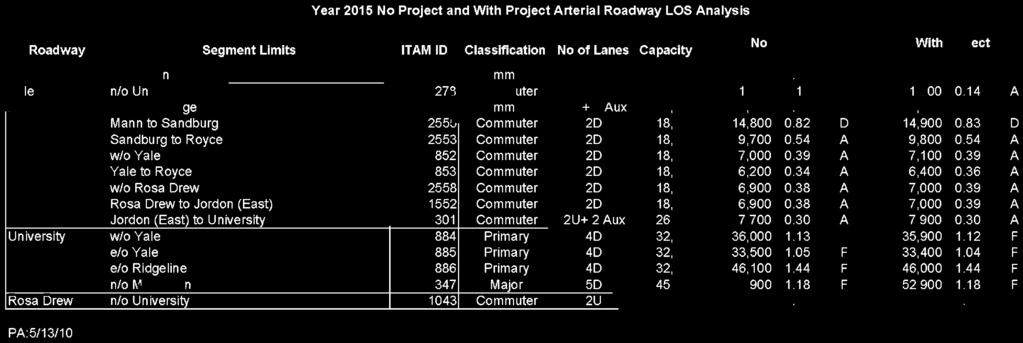
134
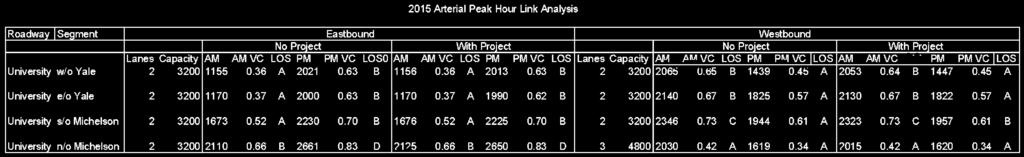
135
136
137
138
139 2015-AM Sat May 15, :56:50 Page VISTA VERDE 2015 WITHOUT PROJECT CONDITIONS AM PEAK HOUR Level Of Service Computation Report 2000 HCM 4-Way Stop Method (Base Volume Alternative) Intersection #2 SANDBURG/MICHELSON Cycle (sec): 100 Critical Vol./Cap.(X): Loss Time (sec): 0 (Y+R=4.0 sec) Average Delay (sec/veh): 13.0 Optimal Cycle: 0 Level Of Service: B Approach: North Bound South Bound East Bound West Bound Movement: L - T - R L - T - R L - T - R L - T - R Control: Stop Sign Stop Sign Stop Sign Stop Sign Rights: Include Include Include Include Min. Green: Lanes: 0 0 1! ! Volume Module: Base Vol: Growth Adj: Initial Bse: User Adj: PHF Adj: PHF Volume: Reduct Vol: Reduced Vol: PCE Adj: MLF Adj: FinalVolume: Saturation Flow Module: Adjustment: Lanes: Final Sat.: Capacity Analysis Module: Vol/Sat: Crit Moves: **** **** **** **** Delay/Veh: Delay Adj: AdjDel/Veh: LOS by Move: B B B B B B A B A A C A ApproachDel: Delay Adj: ApprAdjDel: LOS by Appr: B B B C AllWayAvgQ: Note: Queue reported is the number of cars per lane AM Sat May 15, :56:50 Page VISTA VERDE 2015 WITHOUT PROJECT CONDITIONS AM PEAK HOUR Level Of Service Computation Report 2000 HCM 4-Way Stop Method (Base Volume Alternative) Intersection #3 YALE/MICHELSON Cycle (sec): 100 Critical Vol./Cap.(X): Loss Time (sec): 0 (Y+R=4.0 sec) Average Delay (sec/veh): 13.5 Optimal Cycle: 0 Level Of Service: B Approach: North Bound South Bound East Bound West Bound Movement: L - T - R L - T - R L - T - R L - T - R Control: Stop Sign Stop Sign Stop Sign Stop Sign Rights: Include Include Include Include Min. Green: Lanes: Volume Module: Base Vol: Growth Adj: Initial Bse: User Adj: PHF Adj: PHF Volume: Reduct Vol: Reduced Vol: PCE Adj: MLF Adj: FinalVolume: Saturation Flow Module: Adjustment: Lanes: Final Sat.: Capacity Analysis Module: Vol/Sat: Crit Moves: **** **** **** **** Delay/Veh: Delay Adj: AdjDel/Veh: LOS by Move: B B A B B A B B A B C A ApproachDel: Delay Adj: ApprAdjDel: LOS by Appr: B B B C AllWayAvgQ: Note: Queue reported is the number of cars per lane.
140 2015-AM Sat May 15, :56:50 Page VISTA VERDE 2015 WITHOUT PROJECT CONDITIONS AM PEAK HOUR Level Of Service Computation Report 2000 HCM 4-Way Stop Method (Base Volume Alternative) Intersection #4 ROSA DREW/MICHELSON Cycle (sec): 100 Critical Vol./Cap.(X): Loss Time (sec): 0 (Y+R=4.0 sec) Average Delay (sec/veh): 10.8 Optimal Cycle: 0 Level Of Service: B Approach: North Bound South Bound East Bound West Bound Movement: L - T - R L - T - R L - T - R L - T - R Control: Stop Sign Stop Sign Stop Sign Stop Sign Rights: Include Include Include Include Min. Green: Lanes: 0 0 1! ! Volume Module: Base Vol: Growth Adj: Initial Bse: User Adj: PHF Adj: PHF Volume: Reduct Vol: Reduced Vol: PCE Adj: MLF Adj: FinalVolume: Saturation Flow Module: Adjustment: Lanes: Final Sat.: Capacity Analysis Module: Vol/Sat: Crit Moves: **** **** **** **** Delay/Veh: Delay Adj: AdjDel/Veh: LOS by Move: A A A A A A A B B A B B ApproachDel: Delay Adj: ApprAdjDel: LOS by Appr: A A B B AllWayAvgQ: Note: Queue reported is the number of cars per lane.
141 2015-PM Sat May 15, :56:53 Page VISTA VERDE 2015 WITHOUT PROJECT CONDITIONS PM PEAK HOUR Level Of Service Computation Report 2000 HCM 4-Way Stop Method (Base Volume Alternative) Intersection #2 SANDBURG/MICHELSON Cycle (sec): 100 Critical Vol./Cap.(X): Loss Time (sec): 0 (Y+R=4.0 sec) Average Delay (sec/veh): 28.0 Optimal Cycle: 0 Level Of Service: D Approach: North Bound South Bound East Bound West Bound Movement: L - T - R L - T - R L - T - R L - T - R Control: Stop Sign Stop Sign Stop Sign Stop Sign Rights: Include Include Include Include Min. Green: Lanes: 0 0 1! ! Volume Module: Base Vol: Growth Adj: Initial Bse: User Adj: PHF Adj: PHF Volume: Reduct Vol: Reduced Vol: PCE Adj: MLF Adj: FinalVolume: Saturation Flow Module: Adjustment: Lanes: Final Sat.: Capacity Analysis Module: Vol/Sat: Crit Moves: **** **** **** **** Delay/Veh: Delay Adj: AdjDel/Veh: LOS by Move: B B B B B B A E A A B A ApproachDel: Delay Adj: ApprAdjDel: LOS by Appr: B B E B AllWayAvgQ: Note: Queue reported is the number of cars per lane PM Sat May 15, :56:53 Page VISTA VERDE 2015 WITHOUT PROJECT CONDITIONS PM PEAK HOUR Level Of Service Computation Report 2000 HCM 4-Way Stop Method (Base Volume Alternative) Intersection #3 YALE/MICHELSON Cycle (sec): 100 Critical Vol./Cap.(X): Loss Time (sec): 0 (Y+R=4.0 sec) Average Delay (sec/veh): 16.9 Optimal Cycle: 0 Level Of Service: C Approach: North Bound South Bound East Bound West Bound Movement: L - T - R L - T - R L - T - R L - T - R Control: Stop Sign Stop Sign Stop Sign Stop Sign Rights: Include Include Include Include Min. Green: Lanes: Volume Module: Base Vol: Growth Adj: Initial Bse: User Adj: PHF Adj: PHF Volume: Reduct Vol: Reduced Vol: PCE Adj: MLF Adj: FinalVolume: Saturation Flow Module: Adjustment: Lanes: Final Sat.: Capacity Analysis Module: Vol/Sat: Crit Moves: **** **** **** **** Delay/Veh: Delay Adj: AdjDel/Veh: LOS by Move: B B A A A A A C A A B A ApproachDel: Delay Adj: ApprAdjDel: LOS by Appr: A A C B AllWayAvgQ: Note: Queue reported is the number of cars per lane.
142 2015-PM Sat May 15, :56:53 Page VISTA VERDE 2015 WITHOUT PROJECT CONDITIONS PM PEAK HOUR Level Of Service Computation Report 2000 HCM 4-Way Stop Method (Base Volume Alternative) Intersection #4 ROSA DREW/MICHELSON Cycle (sec): 100 Critical Vol./Cap.(X): Loss Time (sec): 0 (Y+R=4.0 sec) Average Delay (sec/veh): 15.8 Optimal Cycle: 0 Level Of Service: C Approach: North Bound South Bound East Bound West Bound Movement: L - T - R L - T - R L - T - R L - T - R Control: Stop Sign Stop Sign Stop Sign Stop Sign Rights: Include Include Include Include Min. Green: Lanes: 0 0 1! ! Volume Module: Base Vol: Growth Adj: Initial Bse: User Adj: PHF Adj: PHF Volume: Reduct Vol: Reduced Vol: PCE Adj: MLF Adj: FinalVolume: Saturation Flow Module: Adjustment: Lanes: Final Sat.: Capacity Analysis Module: Vol/Sat: Crit Moves: **** **** **** **** Delay/Veh: Delay Adj: AdjDel/Veh: LOS by Move: A A A A A A A C C A B B ApproachDel: Delay Adj: ApprAdjDel: LOS by Appr: A A C B AllWayAvgQ: Note: Queue reported is the number of cars per lane.
143 Year 2015 With Project Conditions
144
145
146
147 2015WP-AM Sat May 15, :56:56 Page VISTA VERDE 2015 WITH PROJECT CONDITIONS AM PEAK HOUR Level Of Service Computation Report 2000 HCM 4-Way Stop Method (Base Volume Alternative) Intersection #2 SANDBURG/MICHELSON Cycle (sec): 100 Critical Vol./Cap.(X): Loss Time (sec): 0 (Y+R=4.0 sec) Average Delay (sec/veh): 13.2 Optimal Cycle: 0 Level Of Service: B Approach: North Bound South Bound East Bound West Bound Movement: L - T - R L - T - R L - T - R L - T - R Control: Stop Sign Stop Sign Stop Sign Stop Sign Rights: Include Include Include Include Min. Green: Lanes: 0 0 1! ! Volume Module: Base Vol: Growth Adj: Initial Bse: User Adj: PHF Adj: PHF Volume: Reduct Vol: Reduced Vol: PCE Adj: MLF Adj: FinalVolume: Saturation Flow Module: Adjustment: Lanes: Final Sat.: Capacity Analysis Module: Vol/Sat: Crit Moves: **** **** **** **** Delay/Veh: Delay Adj: AdjDel/Veh: LOS by Move: B B B B B B A B A A C A ApproachDel: Delay Adj: ApprAdjDel: LOS by Appr: B B B C AllWayAvgQ: Note: Queue reported is the number of cars per lane. 2015WP-AM Sat May 15, :56:56 Page VISTA VERDE 2015 WITH PROJECT CONDITIONS AM PEAK HOUR Level Of Service Computation Report 2000 HCM 4-Way Stop Method (Base Volume Alternative) Intersection #3 YALE/MICHELSON Cycle (sec): 100 Critical Vol./Cap.(X): Loss Time (sec): 0 (Y+R=4.0 sec) Average Delay (sec/veh): 13.8 Optimal Cycle: 0 Level Of Service: B Approach: North Bound South Bound East Bound West Bound Movement: L - T - R L - T - R L - T - R L - T - R Control: Stop Sign Stop Sign Stop Sign Stop Sign Rights: Include Include Include Include Min. Green: Lanes: Volume Module: Base Vol: Growth Adj: Initial Bse: User Adj: PHF Adj: PHF Volume: Reduct Vol: Reduced Vol: PCE Adj: MLF Adj: FinalVolume: Saturation Flow Module: Adjustment: Lanes: Final Sat.: Capacity Analysis Module: Vol/Sat: Crit Moves: **** **** **** **** Delay/Veh: Delay Adj: AdjDel/Veh: LOS by Move: B B A B B A B B A B C A ApproachDel: Delay Adj: ApprAdjDel: LOS by Appr: B B B C AllWayAvgQ: Note: Queue reported is the number of cars per lane.
148 2015WP-AM Sat May 15, :56:56 Page VISTA VERDE 2015 WITH PROJECT CONDITIONS AM PEAK HOUR Level Of Service Computation Report 2000 HCM 4-Way Stop Method (Base Volume Alternative) Intersection #4 ROSA DREW/MICHELSON Cycle (sec): 100 Critical Vol./Cap.(X): Loss Time (sec): 0 (Y+R=4.0 sec) Average Delay (sec/veh): 10.8 Optimal Cycle: 0 Level Of Service: B Approach: North Bound South Bound East Bound West Bound Movement: L - T - R L - T - R L - T - R L - T - R Control: Stop Sign Stop Sign Stop Sign Stop Sign Rights: Include Include Include Include Min. Green: Lanes: 0 0 1! ! Volume Module: Base Vol: Growth Adj: Initial Bse: User Adj: PHF Adj: PHF Volume: Reduct Vol: Reduced Vol: PCE Adj: MLF Adj: FinalVolume: Saturation Flow Module: Adjustment: Lanes: Final Sat.: Capacity Analysis Module: Vol/Sat: Crit Moves: **** **** **** **** Delay/Veh: Delay Adj: AdjDel/Veh: LOS by Move: A A A A A A A B B A B B ApproachDel: Delay Adj: ApprAdjDel: LOS by Appr: A A B B AllWayAvgQ: Note: Queue reported is the number of cars per lane.
149 2015WP-PM Sat May 15, :56:58 Page VISTA VERDE 2015 WITH PROJECT CONDITIONS PM PEAK HOUR Level Of Service Computation Report 2000 HCM 4-Way Stop Method (Base Volume Alternative) Intersection #2 SANDBURG/MICHELSON Cycle (sec): 100 Critical Vol./Cap.(X): Loss Time (sec): 0 (Y+R=4.0 sec) Average Delay (sec/veh): 29.9 Optimal Cycle: 0 Level Of Service: D Approach: North Bound South Bound East Bound West Bound Movement: L - T - R L - T - R L - T - R L - T - R Control: Stop Sign Stop Sign Stop Sign Stop Sign Rights: Include Include Include Include Min. Green: Lanes: 0 0 1! ! Volume Module: Base Vol: Growth Adj: Initial Bse: User Adj: PHF Adj: PHF Volume: Reduct Vol: Reduced Vol: PCE Adj: MLF Adj: FinalVolume: Saturation Flow Module: Adjustment: Lanes: Final Sat.: Capacity Analysis Module: Vol/Sat: Crit Moves: **** **** **** **** Delay/Veh: Delay Adj: AdjDel/Veh: LOS by Move: B B B B B B A F A A B A ApproachDel: Delay Adj: ApprAdjDel: LOS by Appr: B B E B AllWayAvgQ: Note: Queue reported is the number of cars per lane. 2015WP-PM Sat May 15, :56:58 Page VISTA VERDE 2015 WITH PROJECT CONDITIONS PM PEAK HOUR Level Of Service Computation Report 2000 HCM 4-Way Stop Method (Base Volume Alternative) Intersection #3 YALE/MICHELSON Cycle (sec): 100 Critical Vol./Cap.(X): Loss Time (sec): 0 (Y+R=4.0 sec) Average Delay (sec/veh): 17.5 Optimal Cycle: 0 Level Of Service: C Approach: North Bound South Bound East Bound West Bound Movement: L - T - R L - T - R L - T - R L - T - R Control: Stop Sign Stop Sign Stop Sign Stop Sign Rights: Include Include Include Include Min. Green: Lanes: Volume Module: Base Vol: Growth Adj: Initial Bse: User Adj: PHF Adj: PHF Volume: Reduct Vol: Reduced Vol: PCE Adj: MLF Adj: FinalVolume: Saturation Flow Module: Adjustment: Lanes: Final Sat.: Capacity Analysis Module: Vol/Sat: Crit Moves: **** **** **** **** Delay/Veh: Delay Adj: AdjDel/Veh: LOS by Move: B B A A A A A C A A B A ApproachDel: Delay Adj: ApprAdjDel: LOS by Appr: A A C B AllWayAvgQ: Note: Queue reported is the number of cars per lane.
150 2015WP-PM Sat May 15, :56:58 Page VISTA VERDE 2015 WITH PROJECT CONDITIONS PM PEAK HOUR Level Of Service Computation Report 2000 HCM 4-Way Stop Method (Base Volume Alternative) Intersection #4 ROSA DREW/MICHELSON Cycle (sec): 100 Critical Vol./Cap.(X): Loss Time (sec): 0 (Y+R=4.0 sec) Average Delay (sec/veh): 15.6 Optimal Cycle: 0 Level Of Service: C Approach: North Bound South Bound East Bound West Bound Movement: L - T - R L - T - R L - T - R L - T - R Control: Stop Sign Stop Sign Stop Sign Stop Sign Rights: Include Include Include Include Min. Green: Lanes: 0 0 1! ! Volume Module: Base Vol: Growth Adj: Initial Bse: User Adj: PHF Adj: PHF Volume: Reduct Vol: Reduced Vol: PCE Adj: MLF Adj: FinalVolume: Saturation Flow Module: Adjustment: Lanes: Final Sat.: Capacity Analysis Module: Vol/Sat: Crit Moves: **** **** **** **** Delay/Veh: Delay Adj: AdjDel/Veh: LOS by Move: A A A A A A A C C A B B ApproachDel: Delay Adj: ApprAdjDel: LOS by Appr: A A C B AllWayAvgQ: Note: Queue reported is the number of cars per lane.
151 Year 2030 Without Project Conditions
152 Roadway Segment Limits ITAM ID Classification No of Lanes Capacity No Project With Project Volume V/C LOS Volume V/C LOS Yale Michelson to Royce 277 Secondary 4U 28,000 5, A 5, A Yale s/o Michelson 278 Secondary 4U 28,000 5, A 5, A Michleson Culver to Angel 851 Commuter 2U+2 Aux 26,000 18, B 18, B Mann to Sandburg 2555 Commuter 2D 18,000 15, D 15, D Sandburg to Royce 2553 Commuter 2D 18,000 10, A 10, A w/o Yale 852 Commuter 2D 18,000 7, A 8, A Yale to Royce 853 Commuter 2D 18,000 7, A 7, A w/o Rosa Drew 2558 Commuter 2D 18,000 8, A 8, A Rosa Drew to Jordon (East) 1552 Commuter 2D 18,000 8, A 8, A Jordon (East) to University 301 Commuter 2U+2 Aux 26,000 8, A 8, A University w/o Yale 884 Primary 5D 40,000 45, F 45, F e/o Yale 885 Primary 5D 40,000 39, E 39, E e/o Ridgeline 886 Primary 4D 32,000 51, F 51, F n/o Michelson 347 Major 6D 54,000 58, F 59, F Rosa Drew n/o University 1043 Commuter 2U 13,000 2, A 1, A PA:05/14/10 Post 2030 No Project and With Project Arterial Roadway LOS Analysis
153 Post 2030 Arterial Peak Hour Link Analysis Roadway Segment Eastbound Westbound No Project With Project No Project With Project Lanes Capacity AM AM VC LOS PM PM VC LOS0 AM AM VC LOS PM PM VC LOS Lanes Capacity AM AM VC LOS PM PM VC LOS AM AM VC LOS PM PM VC LOS University w/o Yale A B A B A A A A University e/o Yale A B A B A A A A University s/o Michelson A C A C D C D C University n/o Michelson A A A A A A A A
154
155
156
157 2030AM Wed May 26, :52:15 Page VISTA VERDE 2030 WITHOUT PROJECT CONDITIONS AM PEAK HOUR Level Of Service Computation Report 2000 HCM 4-Way Stop Method (Base Volume Alternative) Intersection #2 SANDBURG/MICHELSON Cycle (sec): 100 Critical Vol./Cap.(X): Loss Time (sec): 0 (Y+R=4.0 sec) Average Delay (sec/veh): 13.1 Optimal Cycle: 0 Level Of Service: B Approach: North Bound South Bound East Bound West Bound Movement: L - T - R L - T - R L - T - R L - T - R Control: Stop Sign Stop Sign Stop Sign Stop Sign Rights: Include Include Include Include Min. Green: Lanes: 0 0 1! ! Volume Module: Base Vol: Growth Adj: Initial Bse: User Adj: PHF Adj: PHF Volume: Reduct Vol: Reduced Vol: PCE Adj: MLF Adj: FinalVolume: Saturation Flow Module: Adjustment: Lanes: Final Sat.: Capacity Analysis Module: Vol/Sat: Crit Moves: **** **** **** **** Delay/Veh: Delay Adj: AdjDel/Veh: LOS by Move: B B B B B B A B A A C A ApproachDel: Delay Adj: ApprAdjDel: LOS by Appr: B B B B AllWayAvgQ: Note: Queue reported is the number of cars per lane. 2030AM Wed May 26, :52:15 Page VISTA VERDE 2030 WITHOUT PROJECT CONDITIONS AM PEAK HOUR Level Of Service Computation Report 2000 HCM 4-Way Stop Method (Base Volume Alternative) Intersection #3 YALE/MICHELSON Cycle (sec): 100 Critical Vol./Cap.(X): Loss Time (sec): 0 (Y+R=4.0 sec) Average Delay (sec/veh): 22.7 Optimal Cycle: 0 Level Of Service: C Approach: North Bound South Bound East Bound West Bound Movement: L - T - R L - T - R L - T - R L - T - R Control: Stop Sign Stop Sign Stop Sign Stop Sign Rights: Include Include Include Include Min. Green: Lanes: Volume Module: Base Vol: Growth Adj: Initial Bse: User Adj: PHF Adj: PHF Volume: Reduct Vol: Reduced Vol: PCE Adj: MLF Adj: FinalVolume: Saturation Flow Module: Adjustment: Lanes: Final Sat.: Capacity Analysis Module: Vol/Sat: Crit Moves: **** **** **** **** Delay/Veh: Delay Adj: AdjDel/Veh: LOS by Move: B C B D D C D C B C C B ApproachDel: Delay Adj: ApprAdjDel: LOS by Appr: C C C C AllWayAvgQ: Note: Queue reported is the number of cars per lane.
158 2030AM Wed May 26, :52:15 Page VISTA VERDE 2030 WITHOUT PROJECT CONDITIONS AM PEAK HOUR Level Of Service Computation Report 2000 HCM 4-Way Stop Method (Base Volume Alternative) Intersection #4 ROSA DREW/MICHELSON Cycle (sec): 100 Critical Vol./Cap.(X): Loss Time (sec): 0 (Y+R=4.0 sec) Average Delay (sec/veh): 14.3 Optimal Cycle: 0 Level Of Service: B Approach: North Bound South Bound East Bound West Bound Movement: L - T - R L - T - R L - T - R L - T - R Control: Stop Sign Stop Sign Stop Sign Stop Sign Rights: Include Include Include Include Min. Green: Lanes: 0 0 1! ! Volume Module: Base Vol: Growth Adj: Initial Bse: User Adj: PHF Adj: PHF Volume: Reduct Vol: Reduced Vol: PCE Adj: MLF Adj: FinalVolume: Saturation Flow Module: Adjustment: Lanes: Final Sat.: Capacity Analysis Module: Vol/Sat: Crit Moves: **** **** **** **** Delay/Veh: Delay Adj: AdjDel/Veh: LOS by Move: B B B B B B A C C A B B ApproachDel: Delay Adj: ApprAdjDel: LOS by Appr: B B C B AllWayAvgQ: Note: Queue reported is the number of cars per lane.
159 2030PM Wed May 26, :52:17 Page VISTA VERDE 2030 WITHOUT PROJECT CONDITIONS PM PEAK HOUR Level Of Service Computation Report 2000 HCM 4-Way Stop Method (Base Volume Alternative) Intersection #2 SANDBURG/MICHELSON Cycle (sec): 100 Critical Vol./Cap.(X): Loss Time (sec): 0 (Y+R=4.0 sec) Average Delay (sec/veh): 35.8 Optimal Cycle: 0 Level Of Service: E Approach: North Bound South Bound East Bound West Bound Movement: L - T - R L - T - R L - T - R L - T - R Control: Stop Sign Stop Sign Stop Sign Stop Sign Rights: Include Include Include Include Min. Green: Lanes: 0 0 1! ! Volume Module: Base Vol: Growth Adj: Initial Bse: User Adj: PHF Adj: PHF Volume: Reduct Vol: Reduced Vol: PCE Adj: MLF Adj: FinalVolume: Saturation Flow Module: Adjustment: Lanes: Final Sat.: Capacity Analysis Module: Vol/Sat: Crit Moves: **** **** **** **** Delay/Veh: Delay Adj: AdjDel/Veh: LOS by Move: B B B B B B A F A A B A ApproachDel: Delay Adj: ApprAdjDel: LOS by Appr: B B F B AllWayAvgQ: Note: Queue reported is the number of cars per lane. 2030PM Wed May 26, :52:17 Page VISTA VERDE 2030 WITHOUT PROJECT CONDITIONS PM PEAK HOUR Level Of Service Computation Report 2000 HCM 4-Way Stop Method (Base Volume Alternative) Intersection #3 YALE/MICHELSON Cycle (sec): 100 Critical Vol./Cap.(X): Loss Time (sec): 0 (Y+R=4.0 sec) Average Delay (sec/veh): 32.4 Optimal Cycle: 0 Level Of Service: D Approach: North Bound South Bound East Bound West Bound Movement: L - T - R L - T - R L - T - R L - T - R Control: Stop Sign Stop Sign Stop Sign Stop Sign Rights: Include Include Include Include Min. Green: Lanes: Volume Module: Base Vol: Growth Adj: Initial Bse: User Adj: PHF Adj: PHF Volume: Reduct Vol: Reduced Vol: PCE Adj: MLF Adj: FinalVolume: Saturation Flow Module: Adjustment: Lanes: Final Sat.: Capacity Analysis Module: Vol/Sat: Crit Moves: **** **** **** **** Delay/Veh: Delay Adj: AdjDel/Veh: LOS by Move: B C B C C B B F B B C B ApproachDel: Delay Adj: ApprAdjDel: LOS by Appr: C C F C AllWayAvgQ: Note: Queue reported is the number of cars per lane.
160 2030PM Wed May 26, :52:17 Page VISTA VERDE 2030 WITHOUT PROJECT CONDITIONS PM PEAK HOUR Level Of Service Computation Report 2000 HCM 4-Way Stop Method (Base Volume Alternative) Intersection #4 ROSA DREW/MICHELSON Cycle (sec): 100 Critical Vol./Cap.(X): Loss Time (sec): 0 (Y+R=4.0 sec) Average Delay (sec/veh): 20.4 Optimal Cycle: 0 Level Of Service: C Approach: North Bound South Bound East Bound West Bound Movement: L - T - R L - T - R L - T - R L - T - R Control: Stop Sign Stop Sign Stop Sign Stop Sign Rights: Include Include Include Include Min. Green: Lanes: 0 0 1! ! Volume Module: Base Vol: Growth Adj: Initial Bse: User Adj: PHF Adj: PHF Volume: Reduct Vol: Reduced Vol: PCE Adj: MLF Adj: FinalVolume: Saturation Flow Module: Adjustment: Lanes: Final Sat.: Capacity Analysis Module: Vol/Sat: Crit Moves: **** **** **** **** Delay/Veh: Delay Adj: AdjDel/Veh: LOS by Move: B B B A A A A D D A C C ApproachDel: Delay Adj: ApprAdjDel: LOS by Appr: B A C C AllWayAvgQ: Note: Queue reported is the number of cars per lane.
161 Year 2030 With Project Conditions
162
163
164
165 2030WP-AM Wed May 26, :52:19 Page VISTA VERDE 2030 WITH PROJECT CONDITIONS AM PEAK HOUR Level Of Service Computation Report 2000 HCM 4-Way Stop Method (Base Volume Alternative) Intersection #2 SANDBURG/MICHELSON Cycle (sec): 100 Critical Vol./Cap.(X): Loss Time (sec): 0 (Y+R=4.0 sec) Average Delay (sec/veh): 13.3 Optimal Cycle: 0 Level Of Service: B Approach: North Bound South Bound East Bound West Bound Movement: L - T - R L - T - R L - T - R L - T - R Control: Stop Sign Stop Sign Stop Sign Stop Sign Rights: Include Include Include Include Min. Green: Lanes: 0 0 1! ! Volume Module: Base Vol: Growth Adj: Initial Bse: User Adj: PHF Adj: PHF Volume: Reduct Vol: Reduced Vol: PCE Adj: MLF Adj: FinalVolume: Saturation Flow Module: Adjustment: Lanes: Final Sat.: Capacity Analysis Module: Vol/Sat: Crit Moves: **** **** **** **** Delay/Veh: Delay Adj: AdjDel/Veh: LOS by Move: B B B B B B A B A A C A ApproachDel: Delay Adj: ApprAdjDel: LOS by Appr: B B B B AllWayAvgQ: Note: Queue reported is the number of cars per lane. 2030WP-AM Wed May 26, :52:19 Page VISTA VERDE 2030 WITH PROJECT CONDITIONS AM PEAK HOUR Level Of Service Computation Report 2000 HCM 4-Way Stop Method (Base Volume Alternative) Intersection #3 YALE/MICHELSON Cycle (sec): 100 Critical Vol./Cap.(X): Loss Time (sec): 0 (Y+R=4.0 sec) Average Delay (sec/veh): 23.2 Optimal Cycle: 0 Level Of Service: C Approach: North Bound South Bound East Bound West Bound Movement: L - T - R L - T - R L - T - R L - T - R Control: Stop Sign Stop Sign Stop Sign Stop Sign Rights: Include Include Include Include Min. Green: Lanes: Volume Module: Base Vol: Growth Adj: Initial Bse: User Adj: PHF Adj: PHF Volume: Reduct Vol: Reduced Vol: PCE Adj: MLF Adj: FinalVolume: Saturation Flow Module: Adjustment: Lanes: Final Sat.: Capacity Analysis Module: Vol/Sat: Crit Moves: **** **** **** **** Delay/Veh: Delay Adj: AdjDel/Veh: LOS by Move: B C B D D C D C B C D B ApproachDel: Delay Adj: ApprAdjDel: LOS by Appr: C C C C AllWayAvgQ: Note: Queue reported is the number of cars per lane.
166 2030WP-AM Wed May 26, :52:19 Page VISTA VERDE 2030 WITH PROJECT CONDITIONS AM PEAK HOUR Level Of Service Computation Report 2000 HCM 4-Way Stop Method (Base Volume Alternative) Intersection #4 ROSA DREW/MICHELSON Cycle (sec): 100 Critical Vol./Cap.(X): Loss Time (sec): 0 (Y+R=4.0 sec) Average Delay (sec/veh): 14.6 Optimal Cycle: 0 Level Of Service: B Approach: North Bound South Bound East Bound West Bound Movement: L - T - R L - T - R L - T - R L - T - R Control: Stop Sign Stop Sign Stop Sign Stop Sign Rights: Include Include Include Include Min. Green: Lanes: 0 0 1! ! Volume Module: Base Vol: Growth Adj: Initial Bse: User Adj: PHF Adj: PHF Volume: Reduct Vol: Reduced Vol: PCE Adj: MLF Adj: FinalVolume: Saturation Flow Module: Adjustment: Lanes: Final Sat.: Capacity Analysis Module: Vol/Sat: Crit Moves: **** **** **** **** Delay/Veh: Delay Adj: AdjDel/Veh: LOS by Move: B B B B B B A C C A B B ApproachDel: Delay Adj: ApprAdjDel: LOS by Appr: B B C B AllWayAvgQ: Note: Queue reported is the number of cars per lane.
167 2030WP-PM Wed May 26, :52:22 Page VISTA VERDE 2030 WITH PROJECT CONDITIONS PM PEAK HOUR Level Of Service Computation Report 2000 HCM 4-Way Stop Method (Base Volume Alternative) Intersection #2 SANDBURG/MICHELSON Cycle (sec): 100 Critical Vol./Cap.(X): Loss Time (sec): 0 (Y+R=4.0 sec) Average Delay (sec/veh): 35.8 Optimal Cycle: 0 Level Of Service: E Approach: North Bound South Bound East Bound West Bound Movement: L - T - R L - T - R L - T - R L - T - R Control: Stop Sign Stop Sign Stop Sign Stop Sign Rights: Include Include Include Include Min. Green: Lanes: 0 0 1! ! Volume Module: Base Vol: Growth Adj: Initial Bse: User Adj: PHF Adj: PHF Volume: Reduct Vol: Reduced Vol: PCE Adj: MLF Adj: FinalVolume: Saturation Flow Module: Adjustment: Lanes: Final Sat.: Capacity Analysis Module: Vol/Sat: Crit Moves: **** **** **** **** Delay/Veh: Delay Adj: AdjDel/Veh: LOS by Move: B B B B B B A F A A B A ApproachDel: Delay Adj: ApprAdjDel: LOS by Appr: B B F B AllWayAvgQ: Note: Queue reported is the number of cars per lane. 2030WP-PM Wed May 26, :52:22 Page VISTA VERDE 2030 WITH PROJECT CONDITIONS PM PEAK HOUR Level Of Service Computation Report 2000 HCM 4-Way Stop Method (Base Volume Alternative) Intersection #3 YALE/MICHELSON Cycle (sec): 100 Critical Vol./Cap.(X): Loss Time (sec): 0 (Y+R=4.0 sec) Average Delay (sec/veh): 34.2 Optimal Cycle: 0 Level Of Service: D Approach: North Bound South Bound East Bound West Bound Movement: L - T - R L - T - R L - T - R L - T - R Control: Stop Sign Stop Sign Stop Sign Stop Sign Rights: Include Include Include Include Min. Green: Lanes: Volume Module: Base Vol: Growth Adj: Initial Bse: User Adj: PHF Adj: PHF Volume: Reduct Vol: Reduced Vol: PCE Adj: MLF Adj: FinalVolume: Saturation Flow Module: Adjustment: Lanes: Final Sat.: Capacity Analysis Module: Vol/Sat: Crit Moves: **** **** **** **** Delay/Veh: Delay Adj: AdjDel/Veh: LOS by Move: B C B C C B B F B B C B ApproachDel: Delay Adj: ApprAdjDel: LOS by Appr: C C F C AllWayAvgQ: Note: Queue reported is the number of cars per lane.
168 2030WP-PM Wed May 26, :52:22 Page VISTA VERDE 2030 WITH PROJECT CONDITIONS PM PEAK HOUR Level Of Service Computation Report 2000 HCM 4-Way Stop Method (Base Volume Alternative) Intersection #4 ROSA DREW/MICHELSON Cycle (sec): 100 Critical Vol./Cap.(X): Loss Time (sec): 0 (Y+R=4.0 sec) Average Delay (sec/veh): 20.7 Optimal Cycle: 0 Level Of Service: C Approach: North Bound South Bound East Bound West Bound Movement: L - T - R L - T - R L - T - R L - T - R Control: Stop Sign Stop Sign Stop Sign Stop Sign Rights: Include Include Include Include Min. Green: Lanes: 0 0 1! ! Volume Module: Base Vol: Growth Adj: Initial Bse: User Adj: PHF Adj: PHF Volume: Reduct Vol: Reduced Vol: PCE Adj: MLF Adj: FinalVolume: Saturation Flow Module: Adjustment: Lanes: Final Sat.: Capacity Analysis Module: Vol/Sat: Crit Moves: **** **** **** **** Delay/Veh: Delay Adj: AdjDel/Veh: LOS by Move: B B B A A A A D D A C C ApproachDel: Delay Adj: ApprAdjDel: LOS by Appr: B A D C AllWayAvgQ: Note: Queue reported is the number of cars per lane.
169 Year 2030 Pending Without Project Conditions
170
171
172
173 2030AM Mon Dec 13, :54:29 Page VISTA VERDE POST-2030 PENDING WITHOUT PROJECT CONDITIONS AM PEAK HOUR Level Of Service Computation Report 2000 HCM 4-Way Stop Method (Base Volume Alternative) Intersection #2 SANDBURG/MICHELSON Cycle (sec): 100 Critical Vol./Cap.(X): Loss Time (sec): 0 Average Delay (sec/veh): 12.9 Optimal Cycle: 0 Level Of Service: B Approach: North Bound South Bound East Bound West Bound Movement: L - T - R L - T - R L - T - R L - T - R Control: Stop Sign Stop Sign Stop Sign Stop Sign Rights: Include Include Include Include Min. Green: Lanes: 0 0 1! ! Volume Module: Base Vol: Growth Adj: Initial Bse: User Adj: PHF Adj: PHF Volume: Reduct Vol: Reduced Vol: PCE Adj: MLF Adj: FinalVolume: Saturation Flow Module: Adjustment: Lanes: Final Sat.: Capacity Analysis Module: Vol/Sat: Crit Moves: **** **** **** **** Delay/Veh: Delay Adj: AdjDel/Veh: LOS by Move: B B B B B B A B A A C A ApproachDel: Delay Adj: ApprAdjDel: LOS by Appr: B B B B AllWayAvgQ: Note: Queue reported is the number of cars per lane. 2030AM Mon Dec 13, :54:29 Page VISTA VERDE POST-2030 PENDING WITHOUT PROJECT CONDITIONS AM PEAK HOUR Level Of Service Computation Report 2000 HCM 4-Way Stop Method (Base Volume Alternative) Intersection #3 YALE/MICHELSON Cycle (sec): 100 Critical Vol./Cap.(X): Loss Time (sec): 0 Average Delay (sec/veh): 22.5 Optimal Cycle: 0 Level Of Service: C Approach: North Bound South Bound East Bound West Bound Movement: L - T - R L - T - R L - T - R L - T - R Control: Stop Sign Stop Sign Stop Sign Stop Sign Rights: Include Include Include Include Min. Green: Lanes: Volume Module: Base Vol: Growth Adj: Initial Bse: User Adj: PHF Adj: PHF Volume: Reduct Vol: Reduced Vol: PCE Adj: MLF Adj: FinalVolume: Saturation Flow Module: Adjustment: Lanes: Final Sat.: Capacity Analysis Module: Vol/Sat: Crit Moves: **** **** **** **** Delay/Veh: Delay Adj: AdjDel/Veh: LOS by Move: B C B D D C D C B C C B ApproachDel: Delay Adj: ApprAdjDel: LOS by Appr: C C C C AllWayAvgQ: Note: Queue reported is the number of cars per lane. Traffix (c) 2008 Dowling Assoc. Licensed to RBF CONSULTING, IRVINE Traffix (c) 2008 Dowling Assoc. Licensed to RBF CONSULTING, IRVINE
174 2030AM Mon Dec 13, :54:29 Page VISTA VERDE POST-2030 PENDING WITHOUT PROJECT CONDITIONS AM PEAK HOUR Level Of Service Computation Report 2000 HCM 4-Way Stop Method (Base Volume Alternative) Intersection #4 ROSA DREW/MICHELSON Cycle (sec): 100 Critical Vol./Cap.(X): Loss Time (sec): 0 Average Delay (sec/veh): 14.6 Optimal Cycle: 0 Level Of Service: B Approach: North Bound South Bound East Bound West Bound Movement: L - T - R L - T - R L - T - R L - T - R Control: Stop Sign Stop Sign Stop Sign Stop Sign Rights: Include Include Include Include Min. Green: Lanes: 0 0 1! ! Volume Module: Base Vol: Growth Adj: Initial Bse: User Adj: PHF Adj: PHF Volume: Reduct Vol: Reduced Vol: PCE Adj: MLF Adj: FinalVolume: Saturation Flow Module: Adjustment: Lanes: Final Sat.: Capacity Analysis Module: Vol/Sat: Crit Moves: **** **** **** **** Delay/Veh: Delay Adj: AdjDel/Veh: LOS by Move: B B B B B B A C C A B B ApproachDel: Delay Adj: ApprAdjDel: LOS by Appr: B B C B AllWayAvgQ: Note: Queue reported is the number of cars per lane.
175 2030PM Mon Dec 13, :55:56 Page VISTA VERDE POST-2030 PENDING WITHOUT PROJECT CONDITIONS PM PEAK HOUR Level Of Service Computation Report 2000 HCM 4-Way Stop Method (Base Volume Alternative) Intersection #2 SANDBURG/MICHELSON Cycle (sec): 100 Critical Vol./Cap.(X): Loss Time (sec): 0 Average Delay (sec/veh): 33.6 Optimal Cycle: 0 Level Of Service: D Approach: North Bound South Bound East Bound West Bound Movement: L - T - R L - T - R L - T - R L - T - R Control: Stop Sign Stop Sign Stop Sign Stop Sign Rights: Include Include Include Include Min. Green: Lanes: 0 0 1! ! Volume Module: Base Vol: Growth Adj: Initial Bse: User Adj: PHF Adj: PHF Volume: Reduct Vol: Reduced Vol: PCE Adj: MLF Adj: FinalVolume: Saturation Flow Module: Adjustment: Lanes: Final Sat.: Capacity Analysis Module: Vol/Sat: Crit Moves: **** **** **** **** Delay/Veh: Delay Adj: AdjDel/Veh: LOS by Move: B B B B B B A F A A B A ApproachDel: Delay Adj: ApprAdjDel: LOS by Appr: B B E B AllWayAvgQ: Note: Queue reported is the number of cars per lane. 2030PM Mon Dec 13, :55:56 Page VISTA VERDE POST-2030 PENDING WITHOUT PROJECT CONDITIONS PM PEAK HOUR Level Of Service Computation Report 2000 HCM 4-Way Stop Method (Base Volume Alternative) Intersection #3 YALE/MICHELSON Cycle (sec): 100 Critical Vol./Cap.(X): Loss Time (sec): 0 Average Delay (sec/veh): 31.3 Optimal Cycle: 0 Level Of Service: D Approach: North Bound South Bound East Bound West Bound Movement: L - T - R L - T - R L - T - R L - T - R Control: Stop Sign Stop Sign Stop Sign Stop Sign Rights: Include Include Include Include Min. Green: Lanes: Volume Module: Base Vol: Growth Adj: Initial Bse: User Adj: PHF Adj: PHF Volume: Reduct Vol: Reduced Vol: PCE Adj: MLF Adj: FinalVolume: Saturation Flow Module: Adjustment: Lanes: Final Sat.: Capacity Analysis Module: Vol/Sat: Crit Moves: **** **** **** **** Delay/Veh: Delay Adj: AdjDel/Veh: LOS by Move: B C B C C B B F B B C B ApproachDel: Delay Adj: ApprAdjDel: LOS by Appr: C C F C AllWayAvgQ: Note: Queue reported is the number of cars per lane. Traffix (c) 2008 Dowling Assoc. Licensed to RBF CONSULTING, IRVINE Traffix (c) 2008 Dowling Assoc. Licensed to RBF CONSULTING, IRVINE
176 2030PM Mon Dec 13, :55:56 Page VISTA VERDE POST-2030 PENDING WITHOUT PROJECT CONDITIONS PM PEAK HOUR Level Of Service Computation Report 2000 HCM 4-Way Stop Method (Base Volume Alternative) Intersection #4 ROSA DREW/MICHELSON Cycle (sec): 100 Critical Vol./Cap.(X): Loss Time (sec): 0 Average Delay (sec/veh): 20.0 Optimal Cycle: 0 Level Of Service: C Approach: North Bound South Bound East Bound West Bound Movement: L - T - R L - T - R L - T - R L - T - R Control: Stop Sign Stop Sign Stop Sign Stop Sign Rights: Include Include Include Include Min. Green: Lanes: 0 0 1! ! Volume Module: Base Vol: Growth Adj: Initial Bse: User Adj: PHF Adj: PHF Volume: Reduct Vol: Reduced Vol: PCE Adj: MLF Adj: FinalVolume: Saturation Flow Module: Adjustment: Lanes: Final Sat.: Capacity Analysis Module: Vol/Sat: Crit Moves: **** **** **** **** Delay/Veh: Delay Adj: AdjDel/Veh: LOS by Move: B B B A A A A D D A C C ApproachDel: Delay Adj: ApprAdjDel: LOS by Appr: B A C C AllWayAvgQ: Note: Queue reported is the number of cars per lane.
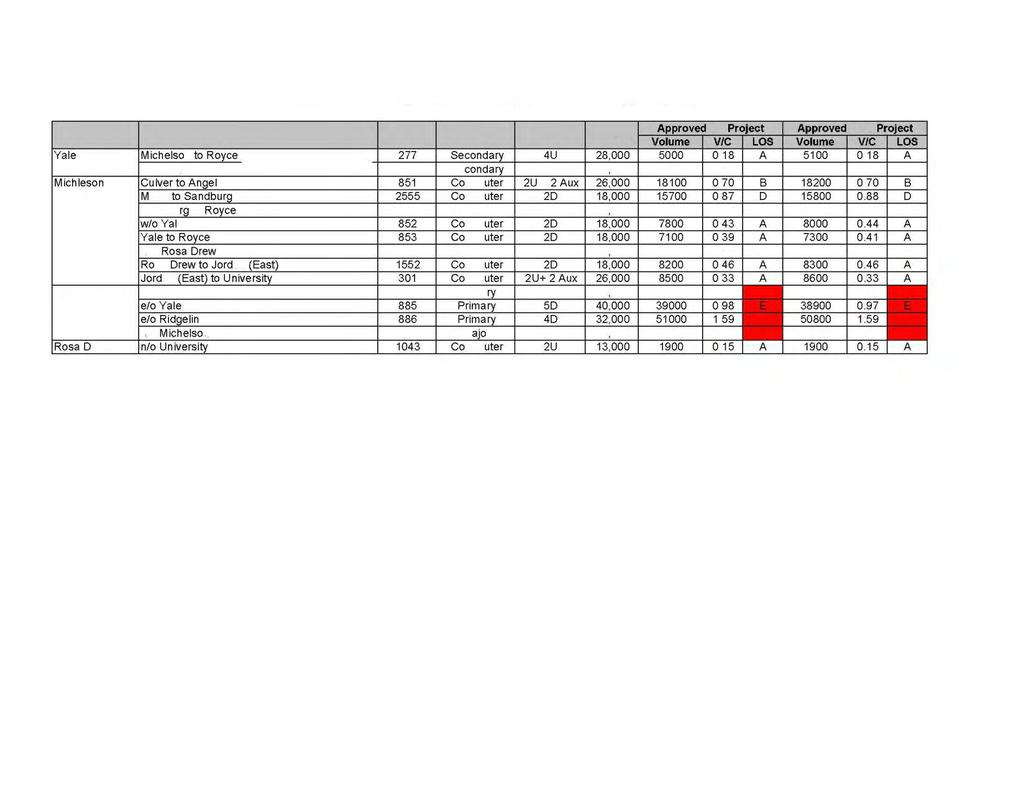
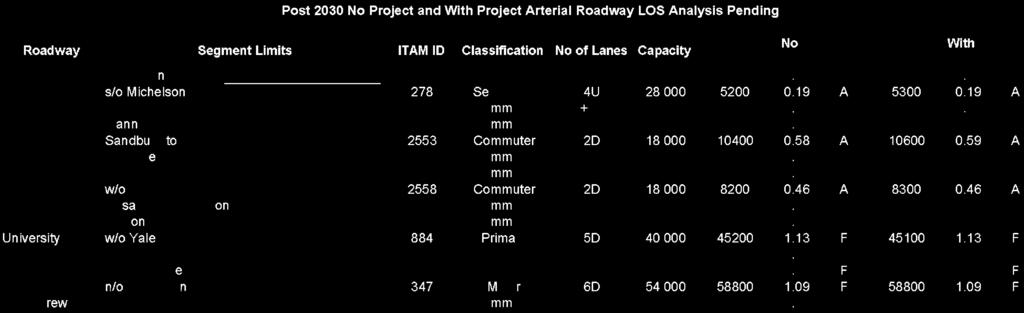
177
Escondido Marriott Hotel and Mixed-Use Condominium Project TRAFFIC IMPACT ANALYSIS REPORT
 Escondido Marriott Hotel and Mixed-Use Condominium Project TRAFFIC IMPACT ANALYSIS REPORT Prepared for Phelps Program Management 420 Sixth Avenue, Greeley, CO 80632 Prepared by 5050 Avenida Encinas, Suite
Appendix Q Traffic Study
 Appendices Appendix Q Traffic Study Crummer Site Subdivision Draft EIR City of Malibu Appendices This page intentionally left blank. The Planning Center April 2013 TRAFFIC IMPACT ANALYSIS Photo z here
APPENDIX B Traffic Analysis
 APPENDIX B Traffic Analysis Rim of the World Unified School District Reconfiguration Prepared for: Rim of the World School District 27315 North Bay Road, Blue Jay, CA 92317 Prepared by: 400 Oceangate,
Section 5.8 Transportation and Traffic
 Section 5.8 Transportation and Traffic 5.8 TRANSPORTATION AND TRAFFIC Generous This Section is based on the Topgolf Specific Plan Traffic Impact Analysis (RK Engineering Group, Inc., October 31, 2016);
Oakbrook Village Plaza City of Laguna Hills
 Oakbrook Village Plaza City of Laguna Hills Traffic Impact Analysis Prepared by: HDR Engineering 3230 El Camino Real, Suite 200 Irvine, CA 92602 October 2012 Revision 3 D-1 Oakbrook Village Plaza Laguna
Appendix C. Traffic Study
 Appendix C Traffic Study TABLE OF CONTENTS SECTION Executive Summary PAGE 1.0 Introduction... 1 1.1 Scope of Work... 1 1.2 Study Area... 2 2.0 Project Description... 3 2.1 Site Access... 4 2.2 Pedestrian
TALMONT TOWNHOMES MADISON KENNETH SPA TRAFFIC IMPACT STUDY. Sacramento, CA. Prepared For: MBK Homes. Prepared By:
 TALMONT TOWNHOMES MADISON KENNETH SPA TRAFFIC IMPACT STUDY Sacramento, CA Prepared For: MBK Homes Prepared By: KD Anderson & Associates 3853 Taylor Road, Suite G Loomis, California 95650 (916) 660-1555
4.14 TRANSPORTATION AND CIRCULATION
 4.14 TRANSPORTATION AND CIRCULATION 4.14.1 Summary Table 4.14-1 summarizes the identified environmental impacts, proposed mitigation measures, and residual impacts of the proposed project with regard to
Traffic Impact Analysis 5742 BEACH BOULEVARD MIXED USE PROJECT
 Traffic Impact Analysis 5742 BEACH BOULEVARD MIXED USE PROJECT CITY OF BUENA PARK Prepared by Project No. 14139 000 April 17 th, 2015 DKS Associates Jeffrey Heald, P.E. Rohit Itadkar, T.E. 2677 North Main
Traffic Impact Analysis. Alliance Cole Avenue Residential Site Dallas, Texas. Kimley-Horn and Associates, Inc. Dallas, Texas.
 Traffic Impact Analysis Alliance Cole Avenue Residential Site Dallas, Texas February 15, 2018 Kimley-Horn and Associates, Inc. Dallas, Texas Project #064524900 Registered Firm F-928 Traffic Impact Analysis
TRAFFIC IMPACT ANALYSIS 661 BEAR VALLEY. Escondido, California September 1, LLG Ref
 TRAFFIC IMPACT ANALYSIS 661 BEAR VALLEY Escondido, California September 1, 2015 LLG Ref. 3-13-2299 EXECUTIVE SUMMARY The Project (Project) proposes the development of 55 residential dwelling units on 40.88
Date: February 7, 2017 John Doyle, Z-Best Products Robert Del Rio. T.E. Z-Best Traffic Operations and Site Access Analysis
 Memorandum Date: February 7, 07 To: From: Subject: John Doyle, Z-Best Products Robert Del Rio. T.E. Z-Best Traffic Operations and Site Access Analysis Introduction Hexagon Transportation Consultants, Inc.
TRANSPORTATION STUDY FOR THE 8899 BEVERLY BOULEVARD PROJECT
 DRAFT TRANSPORTATION STUDY FOR THE 8899 BEVERLY BOULEVARD PROJECT WEST HOLLYWOOD, CALIFORNIA NOVEMBER 2013 PREPARED FOR BEVERLY BOULEVARD ASSOCIATION PREPARED BY DRAFT TRANSPORTATION STUDY FOR THE 8899
Lacey Gateway Residential Phase 1
 Lacey Gateway Residential Phase Transportation Impact Study April 23, 203 Prepared for: Gateway 850 LLC 5 Lake Bellevue Drive Suite 02 Bellevue, WA 98005 Prepared by: TENW Transportation Engineering West
FOR LEASE PROCTOR AVENUE City of Industry, CA ±217,464 /SF WAREHOUSE ACRES OF LAND. lee-associates.com
 FOR LEASE ±27,464 /SF WAREHOUSE 0.9 ACRES OF LAND 4505 PROCTOR AVENUE City of Industry, CA 9746 lee-associates.com LOCAL EXPERTISE. INTERNATIONAL REACH. WORLD CLASS. BUILDING CHARACTERISTICS PROPERTY HIGHLIGHTS
IV. ENVIRONMENTAL IMPACT ANALYSIS J. TRANSPORTATION AND TRAFFIC
 IV. ENVIRONMENTAL IMPACT ANALYSIS J. TRANSPORTATION AND TRAFFIC This Section summarizes the information provided in the Traffic Study for the Santa Monica College Bundy Campus Master Plan (Traffic Study),
King Soopers #116 Thornton, Colorado
 Traffic Impact Study King Soopers #116 Thornton, Colorado Prepared for: Galloway & Company, Inc. T R A F F I C I M P A C T S T U D Y King Soopers #116 Thornton, Colorado Prepared for Galloway & Company
Countdown to the Closure Extended 53-Hour Closure of I-405 Freeway Between U.S. 101 and I-10 Planned in Mid-July for Mulholland Bridge Demolition
 Countdown to the Closure Extended 3-Hour Closure of I-40 Freeway Between U.S. 0 and I-0 Planned in Mid-July for Mulholland Bridge Demolition Work Los Angeles, Calif. Plan Ahead, Avoid The Area, Or Stay
TRAFFIC IMPACT STUDY FOR SONIC DRIVE-IN RESTAURANT. Vallejo, CA. Prepared For:
 TRAFFIC IMPACT STUDY FOR SONIC DRIVE-IN RESTAURANT Vallejo, CA Prepared For: ELITE DRIVE-INS, INC. 2190 Meridian Park Blvd, Suite G Concord, CA 94520 Prepared By: KD Anderson & Associates 3853 Taylor Road,
LAWRENCE TRANSIT CENTER LOCATION ANALYSIS 9 TH STREET & ROCKLEDGE ROAD / 21 ST STREET & IOWA STREET LAWRENCE, KANSAS
 LAWRENCE TRANSIT CENTER LOCATION ANALYSIS 9 TH STREET & ROCKLEDGE ROAD / 21 ST STREET & IOWA STREET LAWRENCE, KANSAS TRAFFIC IMPACT STUDY FEBRUARY 214 OA Project No. 213-542 TABLE OF CONTENTS 1. INTRODUCTION...
APPENDICES. Appendix R Traffic Impact Analysis (January 2017)
") APPENDICES Appendix R Traffic Impact Analysis (January 2017) 661 Bear Valley Parkway EIR March 2017 APPENDICES This page intentionally left blank 661 Bear Valley Parkway EIR March 2017 TRAFFIC IMPACT ANALYSIS
APPENDICES Appendix R Traffic Impact Analysis (January 2017) 661 Bear Valley Parkway EIR March 2017 APPENDICES This page intentionally left blank 661 Bear Valley Parkway EIR March 2017 TRAFFIC IMPACT ANALYSIS
TIMBERVINE TRANSPORTATION IMPACT STUDY FORT COLLINS, COLORADO JANUARY Prepared for:
 TIMBERVINE TRANSPORTATION IMPACT STUDY FORT COLLINS, COLORADO JANUARY 2014 Prepared for: Hartford Companies 1218 W. Ash Street Suite A Windsor, Co 80550 Prepared by: DELICH ASSOCIATES 2272 Glen Haven Drive
LOTUS RANCH TRAFFIC IMPACT ANALYSIS. LLG Ref Senior Transportation Engineer & Charlene Sadiarin Transportation Engineer II
 TRAFFIC IMPACT ANALYSIS LOTUS RANCH El Centro, California July 31, 2015February 12, 2016 LLG Ref. 3-14-2392 Prepared by: KC Yellapu, P.E Senior Transportation Engineer & Charlene Sadiarin Transportation
Perris Apartments Traffic Impact Analysis City of Perris, California
 Perris Apartments Traffic Impact Analysis City of Perris, California Prepared for: JD Pierce Company, Inc. 2222 Martin St., Suite 100 Irvine, CA 92612 Prepared by: TJW ENGINEERING, INC. 540 N. Golden Circle
Table Existing Traffic Conditions for Arterial Segments along Construction Access Route. Daily
 5.8 TRAFFIC, ACCESS, AND CIRCULATION This section describes existing traffic conditions in the project area; summarizes applicable regulations; and analyzes the potential traffic, access, and circulation
Proposed location of Camp Parkway Commerce Center. Vicinity map of Camp Parkway Commerce Center Southampton County, VA
 Proposed location of Camp Parkway Commerce Center Vicinity map of Camp Parkway Commerce Center Southampton County, VA Camp Parkway Commerce Center is a proposed distribution and industrial center to be
2.0 Development Driveways. Movin Out June 2017
 Movin Out June 2017 1.0 Introduction The proposed Movin Out development is a mixed use development in the northeast quadrant of the intersection of West Broadway and Fayette Avenue in the City of Madison.
TABLE OF CONTENTS SECTION PAGE. Executive Summary... xii
 TABLE OF CONTENTS SECTION PAGE Executive Summary... xii 1.0 Introduction... 1 1.1 Study Area... 2 1.2 Traffic Impact Analysis Scenarios... 4 1.3 Study Area - City of Orange... 4 2.0 Project Description
The major roadways in the study area are State Route 166 and State Route 33, which are shown on Figure 1-1 and described below:
 3.5 TRAFFIC AND CIRCULATION 3.5.1 Existing Conditions 3.5.1.1 Street Network DRAFT ENVIRONMENTAL IMPACT REPORT The major roadways in the study area are State Route 166 and State Route 33, which are shown
APPENDIX C-2. Traffic Study Supplemental Analysis Memo
 APPENDIX C-2 Traffic Study Supplemental Analysis Memo The Mobility Group Transportation Strategies & Solutions Memorandum To: From: Subject: Tomas Carranza, LADOT Matthew Simons Traffic Review - Revised
EXECUTIVE SUMMARY. The following is an outline of the traffic analysis performed by Hales Engineering for the traffic conditions of this project.
 EXECUTIVE SUMMARY This study addresses the traffic impacts associated with the proposed Shopko redevelopment located in Sugarhouse, Utah. The Shopko redevelopment project is located between 1300 East and
The key roadways in the project vicinity are described below. Exhibit displays the existing number of lanes on the study roadways.
 4.2 TRAFFIC AND CIRCULATION This section presents the key assumptions, methods, and results of analysis for the transportation and circulation impacts of the proposed project. This section is based on
West Hills Shopping Centre Lowe s Expansion Traffic Impact Study
 West Hills Shopping Centre Lowe s Expansion Traffic Impact Study Prepared for: Armel Corporation January 2015 Paradigm Transportation Solutions Ltd. 22 King Street South, Suite 300 Waterloo ON N2J 1N8
TRAFFIC IMPACT ANALYSIS WESTMINSTER SEMINARY. Escondido, California June 25, LLG Ref Transportation Engineer II
 TRAFFIC IMPACT ANALYSIS WESTMINSTER SEMINARY Escondido, California June 25, 2015 LLG Ref. 3-15-2420 Prepared by: Pedram Massoudi Transportation Engineer II Under the Supervision of: John Boarman, P.E.
2. Valley Circle Boulevard/Andora Avenue/Baden Avenue and Lassen Street
 IV.J TRANSPORTATION 1. INTRODUCTION This section presents an overview of the existing traffic and circulation system in and surrounding the project site. This section also discusses the potential impacts
5.9 TRANSPORTATION AND TRAFFIC
 5.9 TRANSPORTATION AND TRAFFIC This section evaluates transportation- and traffic-related impacts that have the potential to result from the construction and operation of the Project. Information and analysis
Traffic Impact Statement (TIS)
") Traffic Impact Statement (TIS) Vincentian PUDA Collier County, FL 10/18/2013 Prepared for: Global Properties of Naples Prepared by: Trebilcock Consulting Solutions, PA 2614 Tamiami Trail N, Suite 615 1205
Traffic Impact Statement (TIS) Vincentian PUDA Collier County, FL 10/18/2013 Prepared for: Global Properties of Naples Prepared by: Trebilcock Consulting Solutions, PA 2614 Tamiami Trail N, Suite 615 1205
Clean Harbors Canada, Inc.
 Clean Harbors Canada, Inc. Proposed Lambton Landfill Expansion Environmental Assessment Terms of Reference Transportation Assessment St. Clair Township, Ontario September 2009 itrans Consulting Inc. 260
Volume 1 Traffic Impact Analysis Turtle Creek Boulevard Dallas, Texas. Kimley-Horn and Associates, Inc. Dallas, Texas.
 Volume 1 Traffic Impact Analysis 2727 Dallas, Texas June 18, 2018 Kimley-Horn and Associates, Inc. Dallas, Texas Project #064523000 Registered Firm F-928 Traffic Impact Analysis 2727 Dallas, Texas Prepared
APPENDIX I TRAFFIC IMPACT ANALYSIS
 I NITIAL S TUDY/MITIGATED NEGATIVE D ECLARATION NO. 1844 15 M ARCH 2018 K ILLEFER SQUARE A PARTMENTS C ITY OF ORANGE, COUNTY OF ORANGE, CALIFORNIA APPENDIX I TRAFFIC IMPACT ANALYSIS P:\WSH1601\March 2018\Killefer
IV. ENVIRONMENTAL IMPACT ANALYSIS B. TRAFFIC AND CIRCULATION
 IV. ENVIRONMENTAL IMPACT ANALYSIS B. TRAFFIC AND CIRCULATION 1. INTRODUCTION This section is based on the technical report, Traffic Study for 10131 Constellation Boulevard Residential Project, prepared
Quantitative analyses of weekday a.m. and p.m. commuter hour conditions have been conducted for the following five scenarios:
 6.1 TRANSPORTATION AND CIRCULATION 6.1.1 INTRODUCTION This section of the EIR presents the results of TJKM s traffic impact analysis of the proposed Greenbriar Development. The analysis includes consideration
APPENDIX E. Traffic Analysis Report
 APPENDIX E Traffic Analysis Report THIS PAGE INTENTIONALLY BLANK EAGLE RIVER TRAFFIC MITIGATION PHASE I OLD GLENN HIGHWAY/EAGLE RIVER ROAD INTERSECTION IMPROVEMENTS TRAFFIC ANALYSIS Eagle River, Alaska
APPENDIX C1 TRAFFIC ANALYSIS DESIGN YEAR TRAFFIC ANALYSIS
 APPENDIX C1 TRAFFIC ANALYSIS DESIGN YEAR TRAFFIC ANALYSIS DESIGN YEAR TRAFFIC ANALYSIS February 2018 Highway & Bridge Project PIN 6754.12 Route 13 Connector Road Chemung County February 2018 Appendix
LCPS Valley Service Center
 Traffic Impact Study LCPS Valley Service Center Loudoun County, Virginia November 4, 2015 Prepared For: Loudoun County Public Schools 21000 Education Court Ashburn, VA 20148 Prepared by: 1140 Connecticut
TRAFFIC IMPACT ANALYSIS FOR. McDONALD S RESTAURANT IN CARMICAEL Sacramento County, CA. Prepared For:
 TRAFFIC IMPACT ANALYSIS FOR McDONALD S RESTAURANT IN CARMICAEL Sacramento County, CA Prepared For: McDonald s USA, LLC Pacific Sierra Region 2999 Oak Road, Suite 900 Walnut Creek, CA 94597 Prepared By:
King County Metro. Columbia Street Transit Priority Improvements Alternative Analysis. Downtown Southend Transit Study. May 2014.
 King County Metro Columbia Street Transit Priority Improvements Alternative Analysis Downtown Southend Transit Study May 2014 Parametrix Table of Contents Introduction... 1 Methodology... 1 Study Area...
MINERVA PARK SITE TRAFFIC IMPACT STUDY M/I HOMES. September 2, 2015
 5500 New Albany Road Columbus, Ohio 43054 Phone: 614.775.4500 Fax: 614.775.4800 Toll Free: 1-888-775-EMHT emht.com 2015-1008 MINERVA PARK SITE TRAFFIC IMPACT STUDY M/I HOMES September 2, 2015 Engineers
APPENDIX H. Transportation Impact Study
 APPENDIX H Transportation Impact Study BUENA VISTA LAGOON ENHANCEMENT PROJECT TRANSPORTATION IMPACT STUDY Prepared for: San Diego Association of Governments Prepared by: VRPA Technologies, Inc. 9520 Padgett
4131 Chain Bridge Road
 Traffic Impact Study 4131 Chain Bridge Road City of Fairfax, VA 05/04/16 May 4, 2016 Prepared for: Paradigm 1415 North Taft Street Suite 100 Arlington, VA 22201 This report is printed on environmentally
IV. ENVIRONMENTAL IMPACT ANALYSIS N. TRANSPORTATION AND TRAFFIC
 IV. ENVIRONMENTAL IMPACT ANALYSIS N. TRANSPORTATION AND TRAFFIC The following section summarizes the information provided in the traffic report entitled Traffic Impact Analysis for a Proposed Residential
Marketing Analysis. A report on the accessibility of the. CFMC Network. Sample. Thursday, February 04, 2016
 Thursday, February 04, 2016 Marketing Analysis A report on the accessibility of the CFMC Network for the PPO of Sample Table of Contents i Accessibility summary...................... 1 Sample Facility
Traffic Impact Study Speedway Gas Station Redevelopment
 Traffic Impact Study Speedway Gas Station Redevelopment Warrenville, Illinois Prepared For: Prepared By: April 11, 2018 Table of Contents 1. Introduction... 1 2. Existing Conditions... 4 Site Location...
Existing Traffic Conditions
 May 14, 2014 Ms. Lorraine Weiss City of San Mateo 330 West 20 th Avenue San Mateo, CA 94403 Subject: Traffic Operational Study for the Proposed Tilton Avenue Residential Development in San Mateo, California
APPENDIX D- TRAFFIC STUDY
 APPENDIX D- TRAFFIC STUDY TRANSPORTATION IMPACT ANALYSIS IMPERIAL COUNTY OFFICE OF EDUCATION County of Imperial, California March 06, 2018 LLG Ref. 3-17-2831 Prepared by: Jose R. Nunez Transportation Planner
DRAFT TRANSPORTATION IMPACT STUDY CASTILIAN REDEVELOPMENT PROJECT
 DRAFT TRANSPORTATION IMPACT STUDY CASTILIAN REDEVELOPMENT PROJECT Prepared for: Submitted by: 299 Lava Ridge Ct. Suite 2 Roseville, CA. 95661 June 212 TABLE OF CONTENTS 1. Introduction... 1 Project Location
Diablo Vista Pumping Plant Replacement
 Diablo Vista Pumping Plant Replacement Traffic Study PHA Transportation Consultants 12-05-359 October 2012 Diablo Vista Pumping Plant Replacement Traffic Study For EBMUD October 2012 PHA Transportation
Traffic Impact Study for the Maria Drive Apartment Complex
 Traffic Impact Study for the Maria Drive Apartment Complex Prepared for the City of Petaluma Submitted by Whitlock & Weinberger Transportation, Inc. 490 Mendocino Avenue Suite 201 Santa Rosa, CA 95401
LOTUS RANCH TRAFFIC IMPACT ANALYSIS. LLG Ref Senior Transportation Engineer & Charlene Sadiarin Transportation Engineer II
 TRAFFIC IMPACT ANALYSIS LOTUS RANCH El Centro, California April 26, 2016 LLG Ref. 3-14-2392 Prepared by: KC Yellapu, P.E Senior Transportation Engineer & Charlene Sadiarin Transportation Engineer II Under
Traffic Engineering Study
 Traffic Engineering Study Bellaire Boulevard Prepared For: International Management District Technical Services, Inc. Texas Registered Engineering Firm F-3580 November 2009 Executive Summary has been requested
Appendix C-5: Proposed Refinements Rail Operations and Maintenance Facility (ROMF) Traffic Impact Analysis. Durham-Orange Light Rail Transit Project
 Traffic Impact Analysis. Durham-Orange Light Rail Transit Project") Appendix C-5: Proposed Refinements Rail Operations and Maintenance Facility (ROMF) Traffic Impact Analysis Durham-Orange Light Rail Transit Project July 25, 218 ROMF Transportation Impact Analysis Version
Appendix C-5: Proposed Refinements Rail Operations and Maintenance Facility (ROMF) Traffic Impact Analysis Durham-Orange Light Rail Transit Project July 25, 218 ROMF Transportation Impact Analysis Version
APPENDIX J LAKE WOHLFORD DAM REPLACEMENT PROJECT TRAFFIC IMPACT ANALYSIS (DAM REPLACEMENT) Lake Wohlford Dam Replacement Project EIR
 Lake Wohlford Dam Replacement Project EIR") APPENDIX J LAKE WOHLFORD DAM REPLACEMENT PROJECT TRAFFIC IMPACT ANALYSIS (DAM REPLACEMENT) Replacement Project EIR Appendices TRAFFIC IMPACT ANALYSIS LAKE WOHLFORD DAM Escondido, California December 19,
APPENDIX J LAKE WOHLFORD DAM REPLACEMENT PROJECT TRAFFIC IMPACT ANALYSIS (DAM REPLACEMENT) Replacement Project EIR Appendices TRAFFIC IMPACT ANALYSIS LAKE WOHLFORD DAM Escondido, California December 19,
TRAFFIC IMPACT ANALYSIS
 TRAFFIC IMPACT ANALYSIS Emerald Isle Commercial Development Prepared by SEPI Engineering & Construction Prepared for Ark Consulting Group, PLLC March 2016 I. Executive Summary A. Site Location The Emerald
L1TILE BEARS DAY CARE TRANSPORTATION IMPACT STUDY FORT COLLINS, COLORADO MAY Prepared for:
 L1TILE BEARS DAY CARE TRANSPORTATION IMPACT STUDY FORT COLLINS, COLORADO MAY 2012 Prepared for: Hillside Construction, Inc. 216 Hemlock Street, Suite B Fort Collins, CO 80534 Prepared by: DELICH ASSOCIATES
INDUSTRIAL DEVELOPMENT
 INDUSTRIAL DEVELOPMENT Traffic Impact Study Plainfield, Illinois August 2018 Prepared for: Seefried Industrial Properties, Inc. TABLE OF CONTENTS Executive Summary 2 Introduction 3 Existing Conditions
TRAFFIC IMPACT ANALYSIS RIZZO CONFERENCE CENTER EXPANSION FINAL REPORT
 TRAFFIC IMPACT ANALYSIS RIZZO CONFERENCE CENTER EXPANSION Chapel Hill, North Carolina FINAL REPORT Prepared for: The Town of Chapel Hill, NC Prepared by: Architects-Engineers-Planners, Inc. December 2010
MADERAS HOTEL TRANSPORTATION IMPACT ANALYSIS. LLG Ref Transportation Planner III & Jorge Cuyuch Transportation Engineer I
 TRANSPORTATION IMPACT ANALYSIS MADERAS HOTEL Poway, California June 21, 2016 LLG Ref. 3-16-2602 Prepared by: Amelia Giacalone Transportation Planner III & Jorge Cuyuch Transportation Engineer I Under the
TRAFFIC IMPACT STUDY DERRY GREEN CORPORATE BUSINESS PARK MILTON SECONDARY PLAN MODIFICATION
 TRAFFIC IMPACT STUDY DERRY GREEN CORPORATE BUSINESS PARK MILTON SECONDARY PLAN MODIFICATION TRAFFIC IMPACT STUDY DERRY GREEN CORPORATE BUSINESS PARK MILTON SECONDARY PLAN MODIFICATION DECEMBER 24 UPDATED
TRAFFIC IMPACT ANALYSIS SAFARI HIGHLANDS RANCH
 TRAFFIC IMPACT ANALYSIS SAFARI HIGHLANDS RANCH, California November 11, 2016 LLG Ref. 3-14-2334 EXECUTIVE SUMMARY The Project proposes the development of 550 luxury residential dwelling units, public trails,
MILLERSVILLE PARK TRAFFIC IMPACT ANALYSIS ANNE ARUNDEL COUNTY, MARYLAND
 MILLERSVILLE PARK TRAFFIC IMPACT ANALYSIS ANNE ARUNDEL COUNTY, MARYLAND Prepared for: Department of Public Works Anne Arundel County Prepared by: URS Corporation 4 North Park Drive, Suite 3 Hunt Valley,
Traffic Impact Analysis West Street Garden Plots Improvements and DuPage River Park Garden Plots Development Naperville, Illinois
 Traffic Impact Analysis West Street Garden Plots Improvements and DuPage River Park Garden Plots Development Naperville, Illinois Submitted by April 9, 2009 Introduction Kenig, Lindgren, O Hara, Aboona,
Task 5.1: Existing Conditions Review and Analysis
 City of Oceanside Coast Highway Corridor Task 5.1: Existing Conditions Review and Analysis Technical Memorandum August 2014 DOCUMENT CONTROL Client: Project Name: Report Title: City of Oceanside City of
TRAFFIC IMPACT STUDY FOR
 TRAFFIC IMPACT STUDY FOR YUBA CROSSINGS MIXED USE DEVELOPMENT Yuba City, CA Prepared For: Yuba Crossings LLC 1825 Del Paso Blvd Sacramento, CA 95815 Prepared By: KDAnderson & Associates, Inc. 3853 Taylor
TRAFFIC IMPACT ANALYSIS SHORTBREAD LOFTS 2009 MODIFICATION Chapel Hill, North Carolina
 TRAFFIC IMPACT ANALYSIS SHORTBREAD LOFTS 2009 MODIFICATION Chapel Hill, North Carolina Prepared for: The Town of Chapel Hill, NC Prepared by: Architects-Engineers-Planners, Inc. November 2009 Traffic Impact
Los Angeles Mission College Facilities Master Plan Draft Program Environmental Impact Report 3.13 TRANSPORTATION / TRAFFIC
 3.13 TRANSPORTATION / TRAFFIC As a result of the analysis undertaken in the Initial Study for the Los Angeles Mission College Facilities Master Plan, the (LACCD) determined that the proposed project may
NEWCASTLE MIDDLE SCHOOL Traffic Impact Analysis
 Gibson Traffic Consultants 2802 Wetmore Avenue Suite 220 Everett, WA 98201 425.339.8266 NEWCASTLE MIDDLE SCHOOL Traffic Impact Analysis Prepared for: Renton School District Jurisdiction: City of Newcastle
April 7, Mr. Blake Shutler Compass Homes Development LLC Summit Homes Construction, LLC PO Box 6539 Dillon, CO 80435
 Compass Homes Development LLC Summit Homes Construction, LLC PO Box 6539 Dillon, CO 80435 Re: Trip Generation Comparison West Hills Townhomes Keystone, Colorado FHU Reference No. 116388-01 Dear Mr. Shutler:
Draft Report: West Berkeley Bowl Project
 Draft Report: West Berkeley Bowl Project July 2004 Prepared for: The City of Berkeley 1031-1925 F EHR & PEERS TRANSPORTATION CONSULTANTS 3685 Mt. Diablo Blvd. #301 Lafayette, CA 94549 925-284-3200 Fax:
Transportation & Traffic Engineering
 Transportation & Traffic Engineering 1) Project Description This report presents a summary of findings for a Traffic Impact Analysis (TIA) performed by A+ Engineering, Inc. for the Hill Country Family
ZINFANDEL LANE / SILVERADO TRAIL INTERSECTION TRAFFIC ANALYSIS
 ZINFANDEL LANE / SILVERADO TRAIL INTERSECTION TRAFFIC ANALYSIS UPDATED TRAFFIC STUDY FOR THE PROPOSED RAYMOND VINEYARDS WINERY USE PERMIT MODIFICATION #P11-00156 AUGUST 5, 2014 PREPARED BY: OMNI-MEANS,
Appendix E TRAFFIC IMPACT ANALYSIS
 Appendix E TRAFFIC IMPACT ANALYSIS HENRY MAYO NEWHALL MEMORIAL HOSPITAL MASTER PLAN Traffic Impact Analysis MAY 2008 HENRY MAYO NEWHALL MEMORIAL HOSPITAL MASTER PLAN TRAFFIC IMPACT ANALYSIS Prepared by:
TRANSPORTATION TECHNICAL REPORT
 TRANSPORTATION TECHNICAL REPORT for Sunrise Elementary School Replacement PREPARED FOR: Puyallup School District PREPARED BY: 6544 NE 61 st Street, Seattle, WA 98115 ph: (26) 523-3939 fx: (26) 523-4949
MONTEREY BAY AQUARIUM RESEARCH INSTITUTE (MBARI) MASTER PLAN UPDATE MOSS LANDING, CALIFORNIA
 MASTER PLAN UPDATE MOSS LANDING, CALIFORNIA") MONTEREY BAY AQUARIUM RESEARCH INSTITUTE (MBARI) MASTER PLAN UPDATE MOSS LANDING, CALIFORNIA TRAFFIC IMPACT ANALYSIS Administrative Draft Report Prepared For Monterey Bay Aquarium Research Institute Moss
MONTEREY BAY AQUARIUM RESEARCH INSTITUTE (MBARI) MASTER PLAN UPDATE MOSS LANDING, CALIFORNIA TRAFFIC IMPACT ANALYSIS Administrative Draft Report Prepared For Monterey Bay Aquarium Research Institute Moss
Appendix B Traffic Impact Analysis, Asphalt Plant No. 1 Replacement and Modernization
 Appendix B Traffic Impact Analysis, Asphalt Plant No. 1 Replacement and Modernization REPORT Traffic Impact Analysis, Asphalt Plant No. 1 Replacement and Modernization Prepared for City of Los Angeles
MERIVALE PRIORITY SQUARE 2852 MERIVALE ROAD CITY OF OTTAWA TRANSPORTATION BRIEF. Prepared for: ONT Inc. 25 Winding Way Nepean, Ontario K2C 3H1
 MERIVALE PRIORITY SQUARE 2852 MERIVALE ROAD CITY OF OTTAWA TRANSPORTATION BRIEF Prepared for: 2190986ONT Inc. 25 Winding Way Nepean, Ontario K2C 3H1 October 6, 2010 110-502 Report_1.doc D. J. Halpenny
Appendix B Traffic Impact Analysis, Asphalt Plant No. 1 Replacement and Modernization
 Appendix B Traffic Impact Analysis, Asphalt Plant No. 1 Replacement and Modernization DRAFT REPORT Traffic Impact Analysis, Asphalt Plant No. 1 Replacement and Modernization Prepared for City of Los Angeles
Vanier Parkway and Presland Road Residential Development Transportation Impact Study
 Vanier Parkway and Presland Road Residential Development Transportation Impact Study Final Report (Revised) March 2011 Submitted to: Groupe Lépine Ottawa Project No. 09-1613 Submitted by: Groupe Lépine
4.12 TRAFFIC AND CIRCULATION Introduction
 4.12 TRAFFIC AND CIRCULATION 4.12.1 Introduction This section of the EIR describes the existing transportation and traffic conditions on roadways surrounding the project area, and analyzes the potential
Craig Scheffler, P.E., PTOE HNTB North Carolina, P.C. HNTB Project File: Subject
 TECHNICAL MEMORANDUM To Kumar Neppalli Traffic Engineering Manager Town of Chapel Hill From Craig Scheffler, P.E., PTOE HNTB North Carolina, P.C. Cc HNTB Project File: 38435 Subject Obey Creek TIS 2022
Appendix F: Traffic Impact Analysis
 City of Commerce - Commerce Walmart Project Draft EIR Appendix F: Traffic Impact Analysis Michael Brandman Associates H:\Client (PN-JN)\4147\41470001\EIR\4 - Screencheck2 DEIR\41470001 Sec99-00 Appendix
Table of Contents INTRODUCTION... 3 PROJECT STUDY AREA Figure 1 Vicinity Map Study Area... 4 EXISTING CONDITIONS... 5 TRAFFIC OPERATIONS...
 Crosshaven Drive Corridor Study City of Vestavia Hills, Alabama Table of Contents INTRODUCTION... 3 PROJECT STUDY AREA... 3 Figure 1 Vicinity Map Study Area... 4 EXISTING CONDITIONS... 5 TRAFFIC OPERATIONS...
VOA Vista Drive Residential housing Development TIA Project #13915 TABLE OF CONTENTS
 VOA Vista Drive Residential housing Development TIA Project #13915 TABLE OF CONTENTS Executive Summary... 2 Project Background... 2 Conditions... 2 Findings... 3 Recommendations... 4 Introduction... 6
Alpine Highway to North County Boulevard Connector Study
 Alpine Highway to North County Boulevard Connector Study prepared by Avenue Consultants March 16, 2017 North County Boulevard Connector Study March 16, 2017 Table of Contents 1 Summary of Findings... 1
MEMORANDUM. Project Description. Operational Trip Generation. Construction Trip Generation. Date: August 12, 2014 TG: To: From: Subject:
 MEMORANDUM Date: August 12, 2014 TG: 13329.01 To: From: Subject: Jeremy Krout EPD Solutions Inc. Rafik Albert EPD Solutions Inc. Rawad Hani Transpo Group AP North Lake Solar Project Traffic Scoping The
Traffic Impact Analysis Update
 Willow Bend Traffic Impact Analysis Update TABLE OF CONTENTS Page I. INTRODUCTION -------------------------------------------------------------------------------------------- 1 II. EXISTING CONDITIONS
Bennett Pit. Traffic Impact Study. J&T Consulting, Inc. Weld County, Colorado. March 3, 2017
 Bennett Pit Traffic Impact Study J&T Consulting, Inc. Weld County, Colorado March 3, 217 Prepared By: Sustainable Traffic Solutions, Inc. http://www.sustainabletrafficsolutions.com/ Joseph L. Henderson,
IV. ENVIRONMENTAL IMPACT ANALYSIS L. TRANSPORTATION/TRAFFIC
 IV. ENVIRONMENTAL IMPACT ANALYSIS L. TRANSPORTATION/TRAFFIC INTRODUCTION The following section summarizes the information provided in the traffic report entitled Traffic Impact Analysis for a Proposed
Section 5.0 Traffic Information
 Section 5.0 Traffic Information 10.0 TRANSPORTATION MDM Transportation Consultants, Inc. (MDM) has prepared an evaluation of transportation impacts for the proposed evaluation for the expansion of the
Appendix G Traffic and Parking Report
 Appendix G Traffic and Parking Report TABLE OF CONTENTS SECTION PAGE Executive Summary... v 1.0 Introduction... 1 1.1 Study Area... 3 2.0 Project Description... 4 2.1 Site Location... 4 2.2 Existing Project
MURRIETA APARTMENTS TRAFFIC IMPACT ANALYSIS CITY OF MURRIETA, CALIFORNIA
 MURRIETA APARTMENTS TRAFFIC IMPACT ANALYSIS CITY OF MURRIETA, CALIFORNIA SEPTEMBER 20, 2012 Prepared for: Golden Eagle Multi-Family Properties, LLC 6201 Oak Canyon Rd., Suite 250 Irvine, CA 92618 Prepared