Appendix E TRAFFIC IMPACT ANALYSIS
|
|
|
- Veronica Short
- 5 years ago
- Views:
Transcription

1 Appendix E TRAFFIC IMPACT ANALYSIS
2 HENRY MAYO NEWHALL MEMORIAL HOSPITAL MASTER PLAN Traffic Impact Analysis MAY 2008
3 HENRY MAYO NEWHALL MEMORIAL HOSPITAL MASTER PLAN TRAFFIC IMPACT ANALYSIS Prepared by: 2223 Wellington Avenue, Suite 300 Santa Ana, California (714) May 29, 2008
4 TABLE OF CONTENTS Page 1.0 INTRODUCTION PROJECT DESCRIPTION STUDY AREA METHODOLOGY PERFORMANCE CRITERIA Arterial Roads Freeway Segments DEFINITIONS REFERENCES TRANSPORTATION SETTING EXISTING CONDITIONS Existing Roadway System Existing Traffic Volumes and Levels of Service Public Transportation INTERIM YEAR TRANSPORTATION SYSTEM LONG-RANGE CUMULATIVE ANALYSIS PROJECT DESCRIPTION PROJECT OVERVIEW PROJECT TRIP GENERATION PROJECT TRIP DISTRIBUTION IMPACT ANALYSIS INTERIM YEAR ANALYSIS Interim Year No-Project Traffic Conditions Interim Year With-Project Traffic Conditions LONG-RANGE CUMULATIVE (2030) BUILDOUT ANALYSIS Long-Range Cumulative No-Project Traffic Conditions Long-Range Cumulative With-Project Traffic Conditions SPECIAL ISSUES SITE CIRCULATION Site Access Existing Conditions Site Access Future Conditions CMP ANALYSIS STATE HIGHWAYS Project Volumes OPERATIONAL ANALYSIS MITIGATION PROJECT MITIGATION BRIDGE AND THOROUGHFARE DISTRICT APPENDIX A: Intersection Capacity Utilization Worksheets APPENDIX B: Operational Analysis Worksheets APPENDIX C: Traffic Count Comparison Henry Mayo Newhall Memorial Hospital Master Plan i Traffic Impact Analysis rpt.doc
5 LIST OF FIGURES 1-1 Project Site Location Study Area Intersections Intersection Existing Conditions Average Daily Traffic Volumes Existing Conditions AM Peak Hour Intersection Volumes Existing Conditions PM Peak Hour Intersection Volumes Existing Conditions Existing Campus Master Plan Proposed Campus Master Plan (Project) AM Peak Hour Intersection Volumes Proposed Project PM Peak Hour Intersection Volumes Proposed Project ADT Volumes Proposed Project AM Peak Hour Intersection Volumes Interim Year (No-Project) PM Peak Hour Intersection Volumes Interim Year (No-Project) ADT Volumes Interim Year (No-Project) AM Peak Hour Intersection Volumes Interim Year with Project PM Peak Hour Intersection Volumes Interim Year with Project ADT Volumes Interim Year with Project ADT Volumes Long-Range Cumulative (No-Project) ADT Volumes Long-Range Cumulative with Project Net Change in ADT Volumes Due to the Project (Long-Range Cumulative Conditions) AM Peak Hour Intersection Volumes Existing Conditions at Project Driveways PM Peak Hour Intersection Volumes Existing Conditions at Project Driveways Intersection Existing Project Driveways AM Peak Hour Intersection Volumes Interim Year Conditions at Project Driveways PM Peak Hour Intersection Volumes Interim Year Conditions at Project Driveways Intersection Project Driveways A-1 Intersection Study Locations...A-2 Page Henry Mayo Newhall Memorial Hospital Master Plan ii Traffic Impact Analysis rpt.doc
6 LIST OF TABLES 1-1 Level of Service Descriptions Arterial Intersection Performance Criteria Arterial Roadway Performance Criteria ICU Summary Existing Conditions Project Trip Generation Summary Master Plan Buildout Project Trip Generation Summary By Building Existing Traffic Volume Summary (On-Site) ICU and LOS Summary Interim Year Conditions (With and Without Project) ADT LOS Summary Long-Range Cumulative (2030) Buildout Conditions (With and Without Project) ICU and LOS Summary Long-Range Cumulative (2030) Buildout Conditions (With and Without Project) ICU Summary Project Driveways, Project Volumes on State Highways Operational Analysis Delay and LOS Summary ICU and LOS Summary with Project Mitigation Share Summary C-1 ADT Comparison 2004, 2005 and 2007 Counts... C-2 C-2 ICU and LOS Comparison 2004, 2005, 2006 and 2007 Counts... C-3 Page Henry Mayo Newhall Memorial Hospital Master Plan iii Traffic Impact Analysis rpt.doc
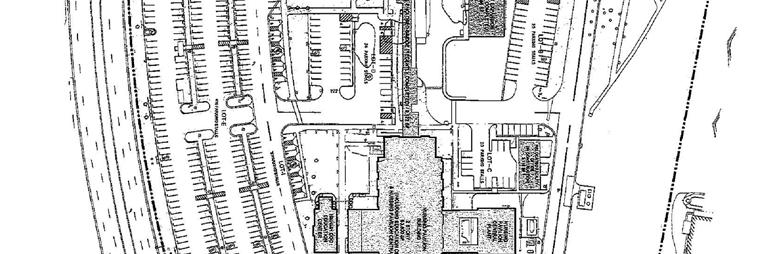
7 1.0 INTRODUCTION This report presents the results of a traffic study carried out to evaluate the Henry Mayo Newhall Memorial Hospital (HMNMH) Master Plan project located in the City of Santa Clarita. It provides the traffic and circulation material for the Environmental Impact Report (EIR) prepared for this project. 1.1 PROJECT DESCRIPTION A detailed description of this project and the resulting California Environmental Quality Act (CEQA) requirements addressed here can be found in the Notice of Preparation and in the EIR itself. The Henry Mayo Newhall Memorial Hospital and G&L Realty have proposed a Master Plan to guide future development of the inpatient (hospital), outpatient medical office buildings and administrative medical facilities at the existing HMNMH medical campus. Currently, the project site is developed with the existing HMNMH medical campus. The project proposes to increase the existing square footage of the hospital campus (30.39 acres) from 332,992 square feet to 660,355 square feet, a 327,363 square-foot increase. The 327,363 square-foot total for the proposed HMNMH Master Plan buildings is comprised of the following: Inpatient Building A (IBA) Medical Office Building 1 (MOB 1) Medical Office Building 2 (MOB 2) Medical Office Building 3 (MOB 3) Central Plant Foundation Building (to be demolished) 125,363 square feet 80,000 square feet 60,000 square feet 60,000 square feet 10,000 square feet (8,000 square feet) As shown above, the net build out of the medical campus totals results in 127,363 square feet of new hospital area and 200,000 square feet of new medical office area. Henry Mayo Newhall Memorial Hospital Master Plan 1-1 Traffic Impact Analysis rpt.doc
8 The project site is generally located north of the intersection of Orchard Village Drive and McBean Parkway, and is one mile east of the Interstate 5 (I-5) freeway in the City of Santa Clarita. The project area is within the existing HMNMH medical campus located at McBean Parkway and is generally surrounded by residential uses. Figure 1-1 illustrates the location of the site in relation to the surrounding roadway system. 1.2 STUDY AREA The study area includes the roadways and intersections near to the project site and those locations where project-generated traffic could cause a significant impact. Figure 1-2 illustrates the intersections selected for study through consultations with the City s Transportation and Engineering Services staff. The selection criteria is generally based on the project generating 50 or more new peak hour trips in the peak direction at an intersection. Several intersections with fewer than 50 project peak hour/peak direction trips have also been included as determined on a case-by-case basis. 1.3 METHODOLOGY The traffic analysis evaluates the proposed project for an Interim Year horizon (approximately 10 to 15 years in the future), and for a long-range cumulative (approximately year 2030) buildout time frame. The distribution of project traffic and the future year forecasts are derived using the Santa Clarita Valley Consolidated Traffic Model (SCVCTM). The SCVCTM was developed jointly by the City of Santa Clarita and the County of Los Angeles and is the primary tool used for forecasting traffic volumes for the Santa Clarita Valley. The impact analysis is based on specific performance criteria which are outlined in the following section. Where appropriate, mitigation measures are identified for those scenarios in which significant impacts are determined based on the established impact thresholds. Henry Mayo Newhall Memorial Hospital Master Plan 1-2 Traffic Impact Analysis rpt.doc
9
10
11 1.4 PERFORMANCE CRITERIA For CEQA purposes, defined performance criteria are utilized to determine if a proposed project causes a significant impact. In most traffic studies, performance criteria are based on two primary measures. The first is capacity, which establishes the vehicle carrying ability of a roadway and the second is volume. The volume measure is either a traffic count (in the case of existing volumes) or a forecast for a future point in time. The ratio between the volume and the capacity gives a volume/capacity (V/C) ratio and based on that V/C ratio, a corresponding level of service (LOS) is defined. Traffic LOS is designated A through F with LOS A representing free flow conditions and LOS F representing severe traffic congestion. Traffic flow quality for each LOS is described in Table 1-1. Both the V/C ratio and the LOS are used in determining impact significance. Certain LOS values are deemed unacceptable by the City and increases in the V/C ratio which cause or contribute to the LOS being unacceptable are defined as a significant impact (see following sections for details) Arterial Roads For the arterial system, a number of techniques are available to establish suitable V/C ratios and define the corresponding LOS. These definitions and procedures are established by individual local jurisdictions or by regional programs such as the Congestion Management Program (CMP). The analysis of the arterial road system is based on peak hour intersection performance and on total average daily traffic (ADT). For intersections, the intersection capacity utilization (ICU) methodology is applied, providing a planning level basis for determining V/C and LOS. This methodology sums the V/C ratios for the critical movements of an intersection and is the preferred procedure for intersection analysis by the City of Santa Clarita. The ICU methodology is generally compatible with the intersection capacity analysis methodology outlined in the HCM For roadway ADT, LOS is determined using capacities identified in the City s Circulation Element and traffic volumes from the SCVCTM. Henry Mayo Newhall Memorial Hospital Master Plan 1-5 Traffic Impact Analysis rpt.doc
12 Table 1-1 LEVEL OF SERVICE DESCRIPTIONS LOS Arterial Roads Freeway Segments A Describes primarily free-flow operations at average travel speeds, usually about 90 percent of the free-flow speed for the given street class. Vehicles are completely unimpeded in their ability to maneuver within the traffic stream. Control delay at signalized intersections is minimal. Describes free-flow operations. Free-flow speeds prevail. Vehicles are almost completely unimpeded in their ability to maneuver within the traffic stream. The effects of incidents or point breakdowns are easily absorbed at this level. B Describes reasonably unimpeded operations at average travel speeds, usually about 70 percent of the free-flow speed for the street class. The ability to maneuver within the traffic stream is only slightly restricted, and control delays at signalized intersections are not significant. Represents reasonably free flow, and free-flow speeds are maintained. The ability to maneuver within the traffic stream is only slightly restricted, and the general level of physical and psychological comfort provided to drivers is still high. The effects of minor incidents and point breakdowns are still easily absorbed. C D Describes stable operations; however, ability to maneuver and change lanes in midblock locations may be more restricted than at LOS B, and longer queues, adverse signal coordination, or both may contribute to lower average travel speeds of about 50 percent of the free-flow speed for the street class. Borders on a range in which small increases in flow may cause substantial increases in delay and decreases in travel speed. LOS D may be due to adverse signal progression, inappropriate signal timing, high volumes, or a combination of these factors. Average travel speeds are about 40 percent of free-flow speed. Provides for flow with speeds at or near the freeflow speed of the freeway. Freedom to maneuver within the traffic stream is noticeably restricted, and lane changes require more care and vigilance on the part of the driver. Minor incidents may still be absorbed, but the local deterioration in service will be substantial. Queues may be expected to form behind any significant blockage. The level at which speeds begin to decline slightly with increasing flows and density begins to increase somewhat more quickly. Freedom to maneuver within the traffic stream is more noticeably limited, and the driver experiences reduced physical and psychological comfort levels. Even minor incidents can be expected to create queuing, because the traffic stream has little space to absorb disruptions. (cont.) Henry Mayo Newhall Memorial Hospital Master Plan 1-6 Traffic Impact Analysis rpt.doc
13 Table 1-1 (cont.) LEVEL OF SERVICE DESCRIPTIONS LOS Arterial Roads Freeway Segments E Characterized by significant delays and At its highest density value, LOS E describes average travel speeds of 33 percent or less of the free-flow speed. Such operations are caused by a combination of adverse operation at capacity. Operations at this level are volatile, because there are virtually no usable gaps in the traffic stream. Vehicles are closely signal progression, high signal density, spaced, leaving little room to maneuver within high volumes, extensive delays at critical intersections, and inappropriate signal timing. the traffic stream at speeds that still exceed 49 miles per hour. Any disruption of the traffic stream, such as vehicles entering from a ramp or a vehicle changing lanes, can establish a disruption wave that propagates throughout the upstream traffic flow. At capacity, the traffic stream has no ability to dissipate even the most minor disruption, and any incident can be expected to produce a serious breakdown with extensive queuing. Maneuverability within the traffic stream is extremely limited, and the level of physical and psychological comfort afforded the driver is poor. F Characterized by urban street flow at extremely low speeds, typically one-third to one-fourth of the free-flow speed. Intersection congestion is likely at critical signalized locations, with high delays, high volumes, and extensive queuing. Describes breakdowns in vehicular flow. Such conditions generally exist within queues forming behind breakdown points. LOS F operations within a queue are the result of a breakdown or bottleneck at a downstream point. LOS F is also used to describe conditions at the point of the breakdown or bottleneck and the queue discharge flow that occurs at speeds lower than the lowest speed for LOS E, as well as the operations within the queue that forms upstream. Whenever LOS F conditions exist, they have the potential to extend upstream for significant distances. Source: Highway Capacity Manual 2000 (HCM 2000), Transportation Research Board, National Research Council. Henry Mayo Newhall Memorial Hospital Master Plan 1-7 Traffic Impact Analysis rpt.doc
14 The ICU calculation methodology and associated impact criteria for the study area arterial system are summarized in Table 1-2. For locations where arterial roadways intersect with freeway on- and offramps, the same ICU methodology is utilized. The performance criteria utilized for the evaluation of roadway segments for long-range cumulative (2030) buildout conditions is provided in Table Freeway Segments For the freeway system, the peak hour is the accepted time period used for impact evaluation. The procedures for determining LOS are established by the State of California Department of Transportation (Caltrans) and by regional programs such as the CMP. The Caltrans guidelines for the preparation of traffic impact studies (see Reference 4 in Section 1.6) define the transition between LOS C and LOS D as the target LOS to be maintained. Caltrans acknowledges that this may not always be feasible and allows for an alternative target LOS when appropriate. If an existing freeway is operating at less (worse) than the appropriate target LOS, the guidelines state that the existing measure of effectiveness (MOE) should be maintained. The CMP guidelines for a transportation impact analysis (see Reference 8 in Section 1.6) require a simplified analysis of freeway impacts that consists of a demand-to-capacity calculation for the affected CMP monitoring locations. The CMP defines a significant impact occurring when the proposed project increases traffic demand by two percent of capacity (V/C.02), causing or worsening LOS F. Henry Mayo Newhall Memorial Hospital Master Plan 1-8 Traffic Impact Analysis rpt.doc
15 Table 1-2 ARTERIAL INTERSECTION PERFORMANCE CRITERIA V/C Calculation Methodology Level of service to be based on peak hour intersection capacity utilization (ICU) values calculated using the following assumptions: Saturation Flow Rates: 1,750 vehicles/hour/lane for all lanes Clearance Interval:.10 (source: City of Santa Clarita Preliminary Traffic Impact Report Guidelines) Performance Standard LOS D or existing LOS, whichever is greater. (source: City of Santa Clarita General Plan Circulation Element, Policy 1.8) Impact Thresholds An intersection is considered to be significantly impacted if: 1. The intersection is forecast to operate deficiently (i.e., worse than the performance standard), and 2. Compared to the ICU in the no-project alternative, the ICU in the with-project alternative increases the ICU by the following: With-Project ICU Project Increment (LOS D) greater than or equal to or more (LOS E & F) greater than or equal to.01 (source: City of Santa Clarita General Plan Circulation Element, Policy 1.8) Abbreviations: V/C Volume/Capacity Ratio LOS Level of Service ICU Intersection Capacity Utilization Henry Mayo Newhall Memorial Hospital Master Plan 1-9 Traffic Impact Analysis rpt.doc
16 Table 1-3 ARTERIAL ROADWAY PERFORMANCE CRITERIA V/C Calculation Methodology Level of service to be based on mid-block V/C ratios calculated using the following capacity assumptions: 8-Lane 6-Lane 4-Lane 4-Lane 2-Lane LOS Divided Divided Divided Undivided Undivided A 48,000 36,000 24,000 16,000 5,000 (28,000) B 54,000 40,400 27,000 18,000 7,500 (32,000) C 60,000 45,000 30,000 20,000 10,000 (36,000) D 66,000 49,500 33,000 22,000 12,500 (40,000) E 72,000 54,000 36,000 24,000 15,000 (44,000) F This condition represents system breakdown and does not have a specific relationship to service volumes. Source: City of Santa Clarita Circulation Element Notes: (XX,XXX) = Capacity with limited access on a 4-Lane Divided arterial. Values shown for LOS E represent the maximum roadway capacity. Performance Standard LOS D Abbreviations: V/C Volume/Capacity Ratio LOS Level of Service Henry Mayo Newhall Memorial Hospital Master Plan 1-10 Traffic Impact Analysis rpt.doc
17 1.5 DEFINITIONS Certain terms used throughout this report are defined below to clarify their intended meaning: ADT Average Daily Traffic. Generally used to measure the total two-directional traffic volumes passing a given point on a roadway. CMP Congestion Management Program. A state mandated program administered by the Los Angeles County Metropolitan Transportation Authority (MTA) that provides a mechanism for coordinating land use and development decisions. ICU Intersection Capacity Utilization. A measure of the volume to capacity ratio for an intersection. Typically used to determine the peak hour level of service for a given set of intersection volumes. LOS Level of Service. A scale used to evaluate circulation system performance based on intersection ICU values or volume/capacity ratios of arterial segments. Peak Hour This refers to the hour during the AM peak period (typically 7 AM - 9 AM) or the PM peak period (typically 3 PM - 6 PM) in which the greatest number of vehicle trips are generated by a given land use or are traveling on a given roadway. Tripend A trip generation measure which represents the total trips entering and leaving a location. V/C Volume to Capacity Ratio. This is typically used to describe the percentage of capacity utilized by existing or projected traffic on a segment of an arterial or intersection. VPH Vehicles Per Hour. Used for roadway volumes (counts or forecasts) and trip generation estimates. Measures the number of vehicles in a one-hour period, typically the AM or PM peak hour. Henry Mayo Newhall Memorial Hospital Master Plan 1-11 Traffic Impact Analysis rpt.doc
18 1.6 REFERENCES 1. Highway Capacity Manual 2000, Transportation Research Board, National Research Council, Trip Generation 7 th Edition, Institute of Transportation Engineers, Caltrans Highway Design Manual, Caltrans, July Guide for the Preparation of Traffic Impact Studies, Caltrans, December Preliminary Traffic Impact Report Guidelines, City of Santa Clarita, August Santa Clarita Valley Consolidated Traffic Model Report, County of Los Angeles Department of Public Works, Draft Santa Clarita Valley Consolidated Traffic Model 2004 Update and Validation, City of Santa Clarita and County of Los Angeles Department of Public Works, March Congestion Management Program for Los Angeles County, Los Angeles County Metropolitan Transportation Authority, July City of Santa Clarita General Plan Circulation Element, City of Santa Clarita, December North County Combined Highway Corridors Study Final Report, Los Angeles County Metropolitan Transportation Authority, June Draft Project Report I-5 HOV & Truck Lane Project from SR-14 to Parker Road in Los Angeles County, Caltrans, March Henry Mayo Newhall Memorial Hospital Master Plan 1-12 Traffic Impact Analysis rpt.doc
19 2.0 TRANSPORTATION SETTING This chapter describes the transportation setting for the traffic analysis. Existing conditions are first discussed, public transportation is addressed and then a description is given of the future circulation systems used in this analysis. 2.1 EXISTING CONDITIONS The following section describes existing traffic conditions in the study area. It includes a description of the study area roadway system, existing traffic volumes and corresponding levels of service as defined by the performance criteria outlined in the previous chapter Existing Roadway System The existing roadway network in the study area is illustrated in Figure 2-1 in the form of midblock lanes and intersection lane configurations for the intersections being studied. Major arterial streets near the project site consist of McBean Parkway, Orchard Village Road and Rockwell Canyon Road/Tournament Road. Interstate 5 (I-5) provides regional access for vehicles traveling to and from the project site. The I-5 Freeway is located west the project site and can be accessed from the project site via a full interchange at McBean Parkway Existing Traffic Volumes and Levels of Service The existing conditions average daily traffic (ADT) volumes on the study area roadway system are illustrated in Figure 2-2. Illustrations of existing peak hour turning movement volumes for each study area intersection can be found in Figures 2-3 and 2-4 for the AM and PM peak hours, respectively. The counts were collected between May 2003 and January 2005 for the purpose of this study. For a comparison of these counts to conditions in 2007, see Appendix C. Henry Mayo Newhall Memorial Hospital Master Plan 2-1 Traffic Impact Analysis rpt.doc
20
21
22
23
24 The data tabulated in Appendix C indicates that the average annual change in traffic volumes range from a decrease of 4 percent to an increase of 21 percent. The greatest increases occur in the Copper Hill/Rye Canyon Road area which is experiencing new development activity. Mature areas, such as the Orchard Village Road and Soledad Canyon Road areas show little to no increase in traffic volumes. As discussed in the section on performance criteria in Chapter 1.0, level of service (LOS) is a concept developed to quantify the degree of comfort afforded to drivers as they travel on a given roadway. The degree of comfort includes such elements as travel time, number of stops, total amount of stopped delay, etc. As defined in the HCM 2000, six grades are used to denote the various LOS. The six are denoted A through F and a discussion on these was also given in Chapter 1.0. The results of the ICU LOS analyses for the study area intersections are shown in Table 2-1 (ICU worksheets are provided in Appendix A). The table shows that each intersection currently meets the performance standard of the City Public Transportation Santa Clarita Transit currently provides fixed-route transit immediately adjacent to the project site. Routes 5 and 6 pass through the intersection of Orchard Village Drive and McBean Parkway and provide service to the Stevenson Ranch Area, Hart High School, the Valencia Town Center and Canyon Country. The nearest transit centers are the McBean Transfer Station (MTS), which is located on McBean Parkway approximately one mile north of the project site at the Valencia Town Center, and the Newhall Metrolink station located near Lyons Avenue. 2.2 INTERIM YEAR TRANSPORTATION SYSTEM The Interim Year transportation system consists of roadway improvements and future infrastructure consistent with the cumulative projects included within the horizon year. Generally, this horizon year corresponds to a level of development approximately 10 to 15 years in the future. While this horizon does not coincide specifically with the buildout of the project, it represents the best timeframe for Henry Mayo Newhall Memorial Hospital Master Plan 2-6 Traffic Impact Analysis rpt.doc
25 Table 2-1 ICU SUMMARY EXISTING CONDITIONS AM Peak Hour PM Peak Hour Location ICU LOS ICU LOS Count Date Freeway On/Off Ramp Intersections 14. I-5 SB Ramps & McBean.55 A.64 B Jan I-5 NB Ramps & McBean.40 A.65 B Jan. 2005/Sept Intersections 42. Rockwell & McBean.45 A.74 C Jan. 2005/Sept McBean & Valencia.61 B.73 C Jan. 2005/Sept McBean & Magic Mtn.57 A.87 D Jan. 2005/Sept Wiley & Lyons.49 A.74 C April Tournament & Wiley.38 A.45 A April Orchard Village & Lyons.49 A.60 A April Orchard Village & Wiley.46 A.76 C Jan Orchard Village & McBean.57 A.76 C Jan. 2005/Sept Newhall & Lyons.60 A.60 A May Valencia & Magic Mtn.62 B.77 C April 2004/Sept Level of service ranges: A B C D E Above 1.00 F Henry Mayo Newhall Memorial Hospital Master Plan 2-7 Traffic Impact Analysis rpt.doc
26 planning purposes since it includes a comprehensive set of cumulative development projects that have been incorporated into the SCVCTM. With this, a conservative scenario is established for analyzing the impacts of the proposed project combined with projected and approved growth on a reasonably expanded circulation system. Future roadways that affect the study area include the extension of Newhall Ranch Road east to Golden Valley Road/Soledad Canyon Road, the connection of Via Princessa between its current western terminus (near San Fernando Road) and its current eastern terminus (near Rainbow Glenn Drive), and the extension of Magic Mountain Parkway to Via Princessa (coinciding with the initial development of the Whitaker-Bermite Site). 2.3 LONG-RANGE CUMULATIVE ANALYSIS The City s Circulation Element includes significant future roadway projects throughout the Valley that will affect traffic patterns of both existing and future trips. Future roadways such as the Via Princessa connection and Santa Clarita Parkway will have an effect on traffic volumes within the study area. The I-5 freeway is part of a recent study prepared by the Los Angeles County Metropolitan Transportation Authority (Metro) and Caltrans (see Reference 10 in Section 1.6) in which it was recommended that the I-5 corridor between SR-14 and SR-126 West will ultimately double from the current four lanes in each direction to eight lanes in each direction. Two of the eight lanes would be for high occupancy vehicles (HOVs), two lanes for trucks, and four lanes for general use. A project is currently in the development stages that will add truck climbing lanes to the I-5 segment between SR-14 and Calgrove Boulevard as well as one HOV lane in each direction through the entire Santa Clarita Valley. Henry Mayo Newhall Memorial Hospital Master Plan 2-8 Traffic Impact Analysis rpt.doc
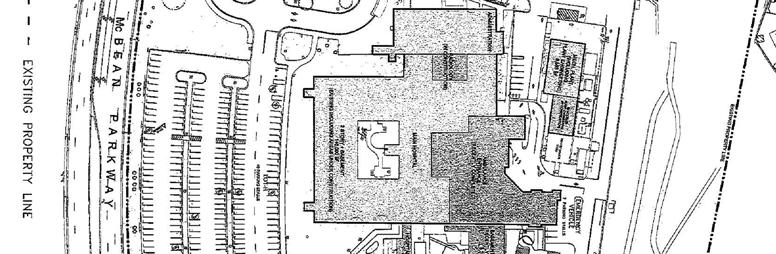
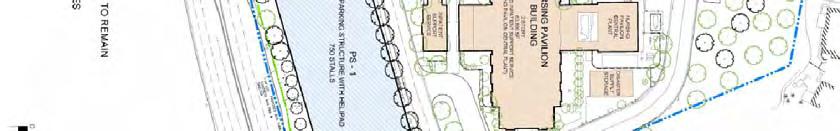
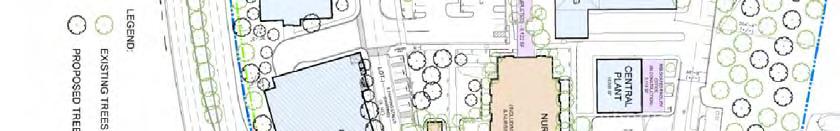
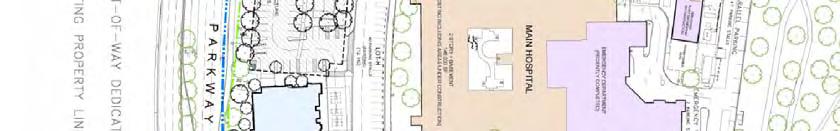
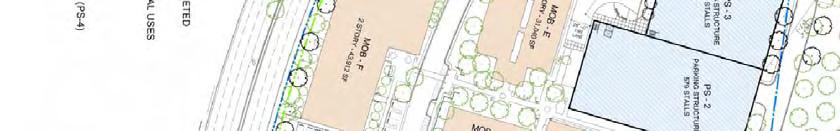
27 3.0 PROJECT DESCRIPTION This chapter describes the project in terms of its transportation characteristics. Land use and trip generation for the project is summarized and the distribution of project trips on the study area roadway network is presented. 3.1 PROJECT OVERVIEW The project site is generally located north of the intersection of Orchard Village Drive and McBean Parkway, and is one mile east of the Interstate 5 (I-5) freeway in the City of Santa Clarita. The project area is within the existing HMNMH medical campus located at McBean Parkway and is generally surrounded by residential uses. The location of the site in relation to the surrounding roadway system was illustrated in Chapter 1.0. Currently, the project site is developed with the existing HMNMH medical campus as illustrated in Figure 3-1. The project proposes to increase the existing square footage of the hospital campus (30.39 acres) from 332,992 square feet to 660,355 square feet, a 327,363 square-foot increase. The 327,363 square-foot total for the proposed HMNMH Master Plan buildings is comprised of the following: Inpatient Building A (IBA) Medical Office Building 1 (MOB 1) Medical Office Building 2 (MOB 2) Medical Office Building 3 (MOB 3) Central Plant Foundation Building (to be demolished) 125,363 square feet 80,000 square feet 60,000 square feet 60,000 square feet 10,000 square feet (8,000 square feet) As shown above, the net build out of the medical campus totals results in 127,363 square feet of new hospital area and 200,000 square feet of new medical office area. Figure 3-2 illustrates the proposed site plan. Henry Mayo Newhall Memorial Hospital Master Plan 3-1 Traffic Impact Analysis rpt.doc
28


29
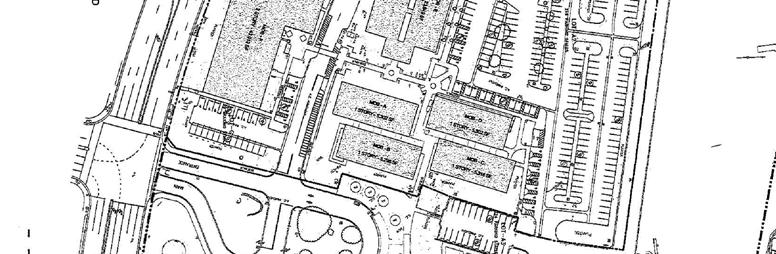
30 Access for the site is via five project driveways located on McBean Parkway. The main entrance for the project is provided at a four-way signalized intersection with Orchard Village Drive. Orchard Village Drive is a four-lane roadway in the vicinity of the project and terminates at the project entrance. A second four-way signalized intersection with McBean Parkway is located at Avenida Navarre, a twolane local street serving the residential uses south of the project boundary. Three tee-intersections (project driveways) are located along McBean Parkway, one west of the Orchard Village Drive main entrance which provides full access and two east of the Avenida Navarre entrance which provide limited access. 3.2 PROJECT TRIP GENERATION Land use and trip generation estimates for the proposed project are shown in Table 3-1. Trip generation is calculated using published data from the Institute of Transportation Engineers (ITE), Seventh Edition, Trip Generation Manual (see Reference 2 in Section 1.6). Trip generation estimates by building are shown in Table 3-2, which become relevant for Chapter 6.0 for the phasing of project mitigation measures. The volume of trips calculated by the ITE trip rates represents the total number of trips for each unique use of the site (i.e., hospital and medical office), as if the uses were stand-alone facilities. Since these uses share a common site, one component of the total trip generation represents the trips between the hospital and the medical offices, which in some cases can be quite substantial. For example, actual field measurements of the existing HMNMH site showed that this on-site trip capture can represent as much as one-third of the total trip generation, as shown in Table 3-2. Since the project s proposed Master Plan land use retains the mix of hospital and medical office facilities, future on-site trip capture is accounted for in the traffic forecasts using a factor of 20 percent, which is a more conservative estimate than the on-site trip capture that has been observed as occurring today. A conservative factor of 20 percent was determined as appropriate since it accounts for the on-site trip capture known to occur while still providing a margin of safety in regards to determining capacity needs for the site and City roadways. Off-site estimates are used in this analysis to represent the project s impacts on the analysis area circulation system. The off-site ADT volume of approximately 7,571 ADT represents 80 percent of the project total (with 20 percent remaining on-site as trips between the hospital and medical offices as discussed above). In the AM and PM peak hours, the off-site volumes of 519 (429 inbound) and 715 (554 outbound), respectively, are also 80 percent of the peak hour totals. Henry Mayo Newhall Memorial Hospital Master Plan 3-4 Traffic Impact Analysis rpt.doc
31 Table 3-1 PROJECT TRIP GENERATION SUMMARY MASTER PLAN BUILDOUT AM Peak Hour PM Peak Hour Land Use Type Amount In Out Total In Out Total ADT Proposed Project (Net Increase) Medical Office TSF ,226 Hospital TSF ,238 On-Site Volume -- (65) (65) (130) (89) (89) (179) (1,893) Total (Off-site) ,571 Trip Rates 1 Medical Office TSF Hospital TSF TRIP RATE SOURCES: Medical Office - ITE "Trip Generation", 7th Edition, Category 720 (Medical-Dental Office Building) Hospital - ITE "Trip Generation", 7th Edition, Category 810 (Hospital) Henry Mayo Newhall Memorial Hospital Master Plan 3-5 Traffic Impact Analysis rpt.doc
32 Table 3-2 PROJECT TRIP GENERATION SUMMARY BY BUILDING AM Peak Hour PM Peak Hour Land Use Type Amount In Out Total In Out Total ADT MOB 1 80 TSF ,890 On-Site Volume Total (MOB 1) , % MOB 2 60 TSF ,168 On-Site Volume Total (MOB 1 & 2) , % Inpatient Building (IB) ,378 On-Site Volume Total (MOB 1 & 2 & IB) , % MOB 3 60 TSF ,168 Hospital Demoltion -8 TSF On-Site Volume Total (All Buildings) , % 1 TRIP RATE SOURCES: Medical Office - ITE "Trip Generation", 7th Edition, Category 720 (Medical-Dental Office Building) Hospital - ITE "Trip Generation", 7th Edition, Category 810 (Hospital) Henry Mayo Newhall Memorial Hospital Master Plan 3-6 Traffic Impact Analysis rpt.doc
33 Table 3-3 EXISTING TRAFFIC VOLUME SUMMARY (ON-SITE) AM Peak Hour PM Peak Hour Type Amount In Out Total In Out Total ADT EXISTING CAMPUS TRIP GENERATION AS STAND-ALONE FACILITIES Medical Office TSF ,508 Medical Office TSF ,577 Hospital TSF ,078 Total TSF ,003 11,163 PROJECT DRIVEWAY VOLUMES FOR PROJECT SITE (EXISTING) Field Survey ,900 Percent Difference % % -29% TRIP RATES 3 Medical Office TSF Hospital TSF Notes: 1 TSF = Thousand Square Feet 2 Non-Master Plan component (two buildings located east of Avenida Navarre). 3 Trip Rate Source: Medical Office - ITE "Trip Generation", 7th Edition, Category 720 (Medical-Dental Office Building) Hospital - ITE "Trip Generation", 7th Edition, Category 810 (Hospital) Henry Mayo Newhall Memorial Hospital Master Plan 3-7 Traffic Impact Analysis rpt.doc
34 3.3 PROJECT TRIP DISTRIBUTION The geographic distribution of project-generated trips was determined using the SCVCTM. The Interim Year version of the SCVCTM provided the background conditions for a select zone run, with adjustments made to the modeled volumes to account for the specific trip generation characteristics of the ITE trip rates noted in the previous section. The model takes into account the specific type of land use proposed for the site and how that land use would interact with the other land uses in the City. The volumes presented in this section represent the net volume of off-site trips and do not include the on-site trips discussed in Section 3.2. Figures 3-4 and 3-5 illustrate the project-generated trips for the AM and PM peak hours, respectively, for the study area intersections. Figure 3-6 illustrates the distribution percentages together with the project-generated average daily trips (ADT) for the project. Since the SCVCTM performs separate assignments for the AM peak hour, the PM peak hour and the offpeak period, the specific volumes for any individual time period will not precisely match the values noted in the distribution percentages. Approximately 49 percent of the trips generated by the project are assigned west of the project via McBean Parkway and approximately 25 percent of the trips are assigned to the east along McBean Parkway. South of the project, approximately 26 percent of the trips are assigned to Orchard Village Road. Approximately 23 percent of the trips are ultimately assigned to the I-5 freeway (11 percent north of McBean Parkway and 12 percent south of McBean Parkway) while the remainder of the trips utilize arterial roadways in the Santa Clarita Valley. When using a traffic-forecasting model to produce future traffic projections with and without a proposed land use development project, separate runs of the traffic model are typically performed with and without the project. These separate runs assume that no changes occur to the surrounding land uses or to traffic generation within or beyond the study area, other than on the project site. Hence, while there is a net increase in trip generation locally due to the project, many trips within the study area are redirected to the project site and therefore are not necessarily new trips as far as the study area circulation system is concerned. In other words, the project traffic is not merely added to no-project traffic conditions by the model, but instead the project trips interact with surrounding land uses in a manner that changes the distribution patterns of non-project trips. Henry Mayo Newhall Memorial Hospital Master Plan 3-8 Traffic Impact Analysis rpt.doc
35
36
37
38 In order to reflect the interaction that would occur between existing development, the proposed project, and all other approved and unapproved future cumulative development that is forecast by the long-range cumulative (2030) buildout version of the SCVCTM, separate traffic model runs were prepared for the no-project and with-project settings as discussed above. These separate model runs result in the redistribution patterns that will occur due to the project and they are discussed in Chapter 4.0. Henry Mayo Newhall Memorial Hospital Master Plan 3-12 Traffic Impact Analysis rpt.doc
39 4.0 IMPACT ANALYSIS This chapter addresses the traffic impacts of the proposed project. Traffic conditions with and without the proposed project are described in the following sections. Project impacts are identified using the criteria outlined in Chapter INTERIM YEAR ANALYSIS The Interim Year traffic conditions are based on the SCVCTM forecasts described in Section 2.2. This setting forms the basis for identifying the potential peak hour traffic impacts of the proposed project at the study area intersections identified in Chapter 1.0. The following sections discuss Interim Year noproject and with-project conditions Interim Year No-Project Traffic Conditions The Interim Year (no-project) peak hour turning movement volumes for the intersections in the study area are illustrated in Figures 4-1 and 4-2 for the AM and PM peak hours, respectively. These volumes include the existing land uses located on the project site. Interim Year ADT volumes for noproject conditions are illustrated in Figure Interim Year With-Project Traffic Conditions The project impacts have been determined based on comparing a no-project condition, which is based on the project sites current uses (see previous section), and a with-project condition that was derived by adding the proposed hospital and medical office expansion to the model. As shown in Chapter 3, the project represents a net increase (when compared to existing) of 7,571 ADT and peak hour increases of approximately 519 AM trips (429 inbound) and 715 PM trips (554 outbound). Illustrations of Interim Year (with project) peak hour intersection volumes are provided in Figures 4-4 and 4-5 for the AM and PM peak hours, respectively. Interim Year ADT volumes for withproject conditions are illustrated in Figure 4-6. Henry Mayo Newhall Memorial Hospital Master Plan 4-1 Traffic Impact Analysis rpt.doc
40
41
42
43
44
45
46 Peak hour ICU values can be found in Table 4-1 which provides a comparison between Interim Year no-project and with-project conditions (see Appendix A for the corresponding ICU worksheets). Given the City s significant impact criteria, significant impacts of the proposed project have been identified for the following four locations for Interim Year conditions: McBean Parkway at Magic Mountain Parkway Orchard Village Road at Wiley Canyon Road Orchard Village Road at McBean Parkway Valencia Boulevard at Magic Mountain Parkway Mitigation that addresses these impacts is presented in Chapter LONG-RANGE CUMULATIVE (2030) BUILDOUT ANALYSIS The Long-Range Cumulative (2030) Buildout traffic conditions are based on the long-range setting described in Section 2.4. This setting includes the buildout of the City s General Plan, including the Circulation Element, and forms the basis for identifying the potential traffic impacts of the proposed project. The following sections discuss the long-range no-project and with-project conditions Long-Range Cumulative No-Project Traffic Conditions The ADT volumes for the long-range cumulative (no-project) conditions are illustrated in Figure 4-7. These volumes include the existing land uses located on the project site Long-Range Cumulative With-Project Traffic Conditions As discussed in Chapter 3.0, the proposed project will generate approximately 7,571 vehicle trips per day. This is the forecast used to represent the project s off-site impacts on the analysis area circulation system. The ADT volumes for the long-range cumulative conditions with the proposed project are illustrated in Figure 4-8. (The project-generated volumes were given previously in Chapter 3.0). Henry Mayo Newhall Memorial Hospital Master Plan 4-8 Traffic Impact Analysis rpt.doc
47 Table 4-1 ICU AND LOS SUMMARY INTERIM YEAR CONDITIONS (WITH AND WITHOUT PROJECT) Interim Year (No-Project) Interim Year (With-Project) Increase Intersection AM PM AM PM AM PM Freeway On/Off Ramp Intersections 14. I-5 SB Ramps & McBean.61 B.74 C.61 B.77 C I-5 NB Ramps & McBean.48 A.75 C.51 A.77 C Intersections 42. Rockwell & McBean.74 C.75 C.75 C.78 C McBean & Valencia.87 D.86 D.87 D.86 D McBean & Magic Mtn.98 E 1.08 F.98 E 1.09 F.00.01* 51. Wiley & Lyons.67 B.83 D.67 B.83 D Tournament & Wiley.44 A.72 C.44 A.72 C Orchard Village & Lyons.57 A.70 B.57 A.72 C Orchard Village & Wiley.71 C 1.05 F.74 C 1.11 F.03.06* 55. Orchard Village & McBean.70 B.87 D.73 C 1.00 E.03.13* 56. Newhall & Lyons.69 B.69 B.70 B.69 B Valencia & Magic Mtn 1.13 F 1.15 F 1.14 F 1.15 F.01*.00 1 Values in parenthesis represent conditions with eastbound McBean Parkway re-striped to two through lanes and one dedicated right-turn lane (with right-turn overlap phasing). *Significant Impact (See Table 1-2 for impact criteria). Level of service ranges: A B C D E Above 1.00 F Henry Mayo Newhall Memorial Hospital Master Plan 4-9 Traffic Impact Analysis rpt.doc
48
49
50 As discussed in Chapter 3, a redistribution of non-project traffic occurs when project-generated traffic is added to the circulation system and interacts with the surrounding land uses. The result is a change of travel patterns for some trips that will be occurring with or without the project in place. That is, some existing trips are redistributed to the project site from other similar locations, as well as some nonproject trips that will change travel routes due to the influence of the new project traffic. This results in a net change in traffic volume on the arterial roadway system that is less than the gross amount of new trips generated by the project. This net change, which is due to the addition of the hospital Master Plan Buildout (project-generated) trips, is illustrated in Figure 4-9 in the form of ADT. Table 4-2 summarizes the total roadway ADT volumes for the long-range cumulative time frame, both with and without project-generated traffic. Also shown here are the number of traffic lanes, roadway capacities and levels of service for each roadway section based on buildout of the City s Circulation Element. As shown in the table, multiple roadway segments do not achieve the City s target level of service of D for the projected total daily traffic volumes. Following is a list of roadways that show a measurable change due to the proposed project and result in the roadway exceeding the target level of service of D for long-range cumulative (2030) buildout conditions. McBean Parkway between I-5 NB Ramps and Rockwell Canyon Road Valencia Boulevard between McBean Parkway and Citrus Drive Since the defining capacity limitation of an urban arterial roadway is the capacity of its intersections, major intersections within the roadway segments listed above have been evaluated in regards to peak hour performance. Peak hour intersection performance is also the criteria used by the City to define significant project impacts. This intersection evaluation is based on buildout of the arterial roadway network as outlined in the Circulation Element of the City s General Plan, and the purpose is to identify locations where the proposed project may result in significant impacts in a long-range setting. The results are summarized in Table 4-3, which shows that during the critical peak hour time periods, the following two locations are significantly impacted by the proposed project. McBean Parkway at Valencia Boulevard Orchard Village Road at McBean Parkway Mitigation that addresses these impacts is presented in Chapter 6.0. Henry Mayo Newhall Memorial Hospital Master Plan 4-12 Traffic Impact Analysis rpt.doc
51
52 Table 4-2 ADT LOS SUMMARY - LONG-RANGE CUMULATIVE (2030) BUILDOUT CONDITIONS (WITH AND WITHOUT PROJECT) Location ID # Mid-block Lanes Capacity (000 s) No-Project With-Project Change Due to Project Volume Volume Volume (000 s) LOS (000 s) LOS (total) V/C Bouquet Cyn s/o Soledad ,000 46,100 D 46,000 D Bouquet Cyn s/o Newhall Ranch ,000 71,800 E 72,000 E Bouquet Cyn w/o Seco ,000 54,900 C 55,000 C Copper Hill e/o Newhall Ranch ,000 56,000 F 56,000 F Golden Valley e/o Newhall Ranch ,000 25,000 B 25,000 B Golden Valley n/o Soledad ,000 73,000 F 73,000 F Golden Valley s/o Soledad ,000 16,000 A 16,000 A Golden Valley w/o SR ,000 30,900 A 31,000 A Lyons e/o I-5 NB Ramps ,000 52,200 E 52,000 E Lyons e/o Wiley ,000 44,100 D 44,000 D Lyons e/o Orchard Village ,000 50,700 E 51,000 E Lyons e/o San Fernando ,000 23,900 A 24,000 A Magic Mtn w/o Old Road ,000 80,900 F 81,000 F Magic Mtn e/o I ,000 62,100 D 62,000 D Magic Mtn e/o Tourney ,000 52,100 C 52,000 C Magic Mtn w/o Citrus ,000 47,100 B 47,000 B (Cont.) Henry Mayo Newhall Memorial Hospital Master Plan 4-14 Traffic Impact Analysis rpt.doc
53 Table 4-2 (Cont.) ADT LOS SUMMARY - LONG-RANGE CUMULATIVE (2030) BUILDOUT CONDITIONS (WITH AND WITHOUT PROJECT) Location ID # Mid-block Lanes Capacity (000 s) No-Project With-Project Change Due to Project Volume Volume Volume (000 s) LOS (000 s) LOS (total) V/C Magic Mtn w/o Valencia ,000 45,100 B 45,000 B Magic Mtn w/o San Fernando ,000 53,100 E 53,000 E Magic Mtn e/o San Fernando ,000 45,100 D 45,000 D Magic Mtn n/o Via Princessa ,000 32,000 A 32,000 A McBean w/o Old Road ,000 26,700 A 27,000 A McBean w/o I ,000 37,900 B 39,000 C 1, McBean w/o Rockwell ,000 47,700 D 51,000 E 3, McBean e/o Rockwell ,000 31,900 A 36,000 B 4, McBean n/o Orchard Village ,000 35,400 B 37,000 B 1, McBean s/o Valencia ,000 45,800 D 47,000 D 1, McBean s/o Town Center ,000 56,500 C 57,000 C McBean n/o Magic Mtn ,000 68,600 E 69,000 E McBean s/o Ave Scott ,000 71,600 E 72,000 E McBean s/o Newhall Ranch ,000 60,600 D 61,000 D McBean n/o Newhall Ranch ,000 46,800 D 47,000 D Newhall Ranch e/o I ,000 64,000 D 64,000 D (Cont.) Henry Mayo Newhall Memorial Hospital Master Plan 4-15 Traffic Impact Analysis rpt.doc
JCE 4600 Basic Freeway Segments
 JCE 4600 Basic Freeway Segments HCM Applications What is a Freeway? divided highway with full control of access two or more lanes for the exclusive use of traffic in each direction no signalized or stop-controlled
Traffic Impact Analysis 5742 BEACH BOULEVARD MIXED USE PROJECT
 Traffic Impact Analysis 5742 BEACH BOULEVARD MIXED USE PROJECT CITY OF BUENA PARK Prepared by Project No. 14139 000 April 17 th, 2015 DKS Associates Jeffrey Heald, P.E. Rohit Itadkar, T.E. 2677 North Main
The major roadways in the study area are State Route 166 and State Route 33, which are shown on Figure 1-1 and described below:
 3.5 TRAFFIC AND CIRCULATION 3.5.1 Existing Conditions 3.5.1.1 Street Network DRAFT ENVIRONMENTAL IMPACT REPORT The major roadways in the study area are State Route 166 and State Route 33, which are shown
APPENDIX B Traffic Analysis
 APPENDIX B Traffic Analysis Rim of the World Unified School District Reconfiguration Prepared for: Rim of the World School District 27315 North Bay Road, Blue Jay, CA 92317 Prepared by: 400 Oceangate,
Oakbrook Village Plaza City of Laguna Hills
 Oakbrook Village Plaza City of Laguna Hills Traffic Impact Analysis Prepared by: HDR Engineering 3230 El Camino Real, Suite 200 Irvine, CA 92602 October 2012 Revision 3 D-1 Oakbrook Village Plaza Laguna
Alpine Highway to North County Boulevard Connector Study
 Alpine Highway to North County Boulevard Connector Study prepared by Avenue Consultants March 16, 2017 North County Boulevard Connector Study March 16, 2017 Table of Contents 1 Summary of Findings... 1
Escondido Marriott Hotel and Mixed-Use Condominium Project TRAFFIC IMPACT ANALYSIS REPORT
 Escondido Marriott Hotel and Mixed-Use Condominium Project TRAFFIC IMPACT ANALYSIS REPORT Prepared for Phelps Program Management 420 Sixth Avenue, Greeley, CO 80632 Prepared by 5050 Avenida Encinas, Suite
2. Valley Circle Boulevard/Andora Avenue/Baden Avenue and Lassen Street
 IV.J TRANSPORTATION 1. INTRODUCTION This section presents an overview of the existing traffic and circulation system in and surrounding the project site. This section also discusses the potential impacts
MEMORANDUM. Figure 1. Roundabout Interchange under Alternative D
 MEMORANDUM Date: To: Liz Diamond, Dokken Engineering From: Subject: Dave Stanek, Fehr & Peers Western Placerville Interchanges 2045 Analysis RS08-2639 Fehr & Peers has completed a transportation analysis
Appendix C. Traffic Study
 Appendix C Traffic Study TABLE OF CONTENTS SECTION Executive Summary PAGE 1.0 Introduction... 1 1.1 Scope of Work... 1 1.2 Study Area... 2 2.0 Project Description... 3 2.1 Site Access... 4 2.2 Pedestrian
EXECUTIVE SUMMARY. The following is an outline of the traffic analysis performed by Hales Engineering for the traffic conditions of this project.
 EXECUTIVE SUMMARY This study addresses the traffic impacts associated with the proposed Shopko redevelopment located in Sugarhouse, Utah. The Shopko redevelopment project is located between 1300 East and
Craig Scheffler, P.E., PTOE HNTB North Carolina, P.C. HNTB Project File: Subject
 TECHNICAL MEMORANDUM To Kumar Neppalli Traffic Engineering Manager Town of Chapel Hill From Craig Scheffler, P.E., PTOE HNTB North Carolina, P.C. Cc HNTB Project File: 38435 Subject Obey Creek TIS 2022
Quantitative analyses of weekday a.m. and p.m. commuter hour conditions have been conducted for the following five scenarios:
 6.1 TRANSPORTATION AND CIRCULATION 6.1.1 INTRODUCTION This section of the EIR presents the results of TJKM s traffic impact analysis of the proposed Greenbriar Development. The analysis includes consideration
TRANSPORTATION STUDY FOR THE 8899 BEVERLY BOULEVARD PROJECT
 DRAFT TRANSPORTATION STUDY FOR THE 8899 BEVERLY BOULEVARD PROJECT WEST HOLLYWOOD, CALIFORNIA NOVEMBER 2013 PREPARED FOR BEVERLY BOULEVARD ASSOCIATION PREPARED BY DRAFT TRANSPORTATION STUDY FOR THE 8899
Appendix Q Traffic Study
 Appendices Appendix Q Traffic Study Crummer Site Subdivision Draft EIR City of Malibu Appendices This page intentionally left blank. The Planning Center April 2013 TRAFFIC IMPACT ANALYSIS Photo z here
TABLE OF CONTENTS SECTION PAGE. Executive Summary... xii
 TABLE OF CONTENTS SECTION PAGE Executive Summary... xii 1.0 Introduction... 1 1.1 Study Area... 2 1.2 Traffic Impact Analysis Scenarios... 4 1.3 Study Area - City of Orange... 4 2.0 Project Description
MILLERSVILLE PARK TRAFFIC IMPACT ANALYSIS ANNE ARUNDEL COUNTY, MARYLAND
 MILLERSVILLE PARK TRAFFIC IMPACT ANALYSIS ANNE ARUNDEL COUNTY, MARYLAND Prepared for: Department of Public Works Anne Arundel County Prepared by: URS Corporation 4 North Park Drive, Suite 3 Hunt Valley,
Table Existing Traffic Conditions for Arterial Segments along Construction Access Route. Daily
 5.8 TRAFFIC, ACCESS, AND CIRCULATION This section describes existing traffic conditions in the project area; summarizes applicable regulations; and analyzes the potential traffic, access, and circulation
TRAFFIC IMPACT ANALYSIS
 TRAFFIC IMPACT ANALYSIS Emerald Isle Commercial Development Prepared by SEPI Engineering & Construction Prepared for Ark Consulting Group, PLLC March 2016 I. Executive Summary A. Site Location The Emerald
INDUSTRIAL DEVELOPMENT
 INDUSTRIAL DEVELOPMENT Traffic Impact Study Plainfield, Illinois August 2018 Prepared for: Seefried Industrial Properties, Inc. TABLE OF CONTENTS Executive Summary 2 Introduction 3 Existing Conditions
Proposed location of Camp Parkway Commerce Center. Vicinity map of Camp Parkway Commerce Center Southampton County, VA
 Proposed location of Camp Parkway Commerce Center Vicinity map of Camp Parkway Commerce Center Southampton County, VA Camp Parkway Commerce Center is a proposed distribution and industrial center to be
King Soopers #116 Thornton, Colorado
 Traffic Impact Study King Soopers #116 Thornton, Colorado Prepared for: Galloway & Company, Inc. T R A F F I C I M P A C T S T U D Y King Soopers #116 Thornton, Colorado Prepared for Galloway & Company
ZINFANDEL LANE / SILVERADO TRAIL INTERSECTION TRAFFIC ANALYSIS
 ZINFANDEL LANE / SILVERADO TRAIL INTERSECTION TRAFFIC ANALYSIS UPDATED TRAFFIC STUDY FOR THE PROPOSED RAYMOND VINEYARDS WINERY USE PERMIT MODIFICATION #P11-00156 AUGUST 5, 2014 PREPARED BY: OMNI-MEANS,
APPENDIX C1 TRAFFIC ANALYSIS DESIGN YEAR TRAFFIC ANALYSIS
 APPENDIX C1 TRAFFIC ANALYSIS DESIGN YEAR TRAFFIC ANALYSIS DESIGN YEAR TRAFFIC ANALYSIS February 2018 Highway & Bridge Project PIN 6754.12 Route 13 Connector Road Chemung County February 2018 Appendix
Volume 1 Traffic Impact Analysis Turtle Creek Boulevard Dallas, Texas. Kimley-Horn and Associates, Inc. Dallas, Texas.
 Volume 1 Traffic Impact Analysis 2727 Dallas, Texas June 18, 2018 Kimley-Horn and Associates, Inc. Dallas, Texas Project #064523000 Registered Firm F-928 Traffic Impact Analysis 2727 Dallas, Texas Prepared
Section 5.8 Transportation and Traffic
 Section 5.8 Transportation and Traffic 5.8 TRANSPORTATION AND TRAFFIC Generous This Section is based on the Topgolf Specific Plan Traffic Impact Analysis (RK Engineering Group, Inc., October 31, 2016);
Traffic Impact Statement (TIS)
") Traffic Impact Statement (TIS) Vincentian PUDA Collier County, FL 10/18/2013 Prepared for: Global Properties of Naples Prepared by: Trebilcock Consulting Solutions, PA 2614 Tamiami Trail N, Suite 615 1205
Traffic Impact Statement (TIS) Vincentian PUDA Collier County, FL 10/18/2013 Prepared for: Global Properties of Naples Prepared by: Trebilcock Consulting Solutions, PA 2614 Tamiami Trail N, Suite 615 1205
Date: February 7, 2017 John Doyle, Z-Best Products Robert Del Rio. T.E. Z-Best Traffic Operations and Site Access Analysis
 Memorandum Date: February 7, 07 To: From: Subject: John Doyle, Z-Best Products Robert Del Rio. T.E. Z-Best Traffic Operations and Site Access Analysis Introduction Hexagon Transportation Consultants, Inc.
TIMBERVINE TRANSPORTATION IMPACT STUDY FORT COLLINS, COLORADO JANUARY Prepared for:
 TIMBERVINE TRANSPORTATION IMPACT STUDY FORT COLLINS, COLORADO JANUARY 2014 Prepared for: Hartford Companies 1218 W. Ash Street Suite A Windsor, Co 80550 Prepared by: DELICH ASSOCIATES 2272 Glen Haven Drive
The key roadways in the project vicinity are described below. Exhibit displays the existing number of lanes on the study roadways.
 4.2 TRAFFIC AND CIRCULATION This section presents the key assumptions, methods, and results of analysis for the transportation and circulation impacts of the proposed project. This section is based on
Traffic Engineering Study
 Traffic Engineering Study Bellaire Boulevard Prepared For: International Management District Technical Services, Inc. Texas Registered Engineering Firm F-3580 November 2009 Executive Summary has been requested
West Hills Shopping Centre Lowe s Expansion Traffic Impact Study
 West Hills Shopping Centre Lowe s Expansion Traffic Impact Study Prepared for: Armel Corporation January 2015 Paradigm Transportation Solutions Ltd. 22 King Street South, Suite 300 Waterloo ON N2J 1N8
IV. ENVIRONMENTAL IMPACT ANALYSIS B. TRAFFIC AND CIRCULATION
 IV. ENVIRONMENTAL IMPACT ANALYSIS B. TRAFFIC AND CIRCULATION 1. INTRODUCTION This section is based on the technical report, Traffic Study for 10131 Constellation Boulevard Residential Project, prepared
APPENDIX E. Traffic Analysis Report
 APPENDIX E Traffic Analysis Report THIS PAGE INTENTIONALLY BLANK EAGLE RIVER TRAFFIC MITIGATION PHASE I OLD GLENN HIGHWAY/EAGLE RIVER ROAD INTERSECTION IMPROVEMENTS TRAFFIC ANALYSIS Eagle River, Alaska
LAWRENCE TRANSIT CENTER LOCATION ANALYSIS 9 TH STREET & ROCKLEDGE ROAD / 21 ST STREET & IOWA STREET LAWRENCE, KANSAS
 LAWRENCE TRANSIT CENTER LOCATION ANALYSIS 9 TH STREET & ROCKLEDGE ROAD / 21 ST STREET & IOWA STREET LAWRENCE, KANSAS TRAFFIC IMPACT STUDY FEBRUARY 214 OA Project No. 213-542 TABLE OF CONTENTS 1. INTRODUCTION...
TRAFFIC IMPACT ANALYSIS SAFARI HIGHLANDS RANCH
 TRAFFIC IMPACT ANALYSIS SAFARI HIGHLANDS RANCH, California November 11, 2016 LLG Ref. 3-14-2334 EXECUTIVE SUMMARY The Project proposes the development of 550 luxury residential dwelling units, public trails,
Appendix 5. Haymeadow Interim Traffic Analysis
 Appendix 5 Haymeadow Interim Traffic Analysis 20 MEMORANDUM To: From: Rick Pylman Gary Brooks Bill Fox Date: September 15, 2016 Project: Subject: Haymeadow Evaluation of interim access configuration Currently
Traffic Impact Analysis. Alliance Cole Avenue Residential Site Dallas, Texas. Kimley-Horn and Associates, Inc. Dallas, Texas.
 Traffic Impact Analysis Alliance Cole Avenue Residential Site Dallas, Texas February 15, 2018 Kimley-Horn and Associates, Inc. Dallas, Texas Project #064524900 Registered Firm F-928 Traffic Impact Analysis
4.14 TRANSPORTATION AND CIRCULATION
 4.14 TRANSPORTATION AND CIRCULATION 4.14.1 Summary Table 4.14-1 summarizes the identified environmental impacts, proposed mitigation measures, and residual impacts of the proposed project with regard to
Appendix B Traffic Impact Analysis, Asphalt Plant No. 1 Replacement and Modernization
 Appendix B Traffic Impact Analysis, Asphalt Plant No. 1 Replacement and Modernization REPORT Traffic Impact Analysis, Asphalt Plant No. 1 Replacement and Modernization Prepared for City of Los Angeles
IRSCH REEN Hirsch/Green Transportation Consulting, Inc.
 IRSCH REEN Hirsch/Green Transportation Consulting, Inc. February 6, 2013 Mr. David Weil Director of Finance St. Matthew s Parish School 1031 Bienveneda Avenue Pacific Palisades, California 90272 RE: Trip
Subarea Study. Manning Avenue (CSAH 15) Corridor Management and Safety Improvement Project. Final Version 1. Washington County.
 Corridor Management and Safety Improvement Project. Final Version 1. Washington County.") Subarea Study Manning Avenue (CSAH 15) Corridor Management and Safety Improvement Project Final Version 1 Washington County June 12, 214 SRF No. 138141 Table of Contents Introduction... 1 Forecast Methodology
Subarea Study Manning Avenue (CSAH 15) Corridor Management and Safety Improvement Project Final Version 1 Washington County June 12, 214 SRF No. 138141 Table of Contents Introduction... 1 Forecast Methodology
Appendix B Traffic Impact Analysis, Asphalt Plant No. 1 Replacement and Modernization
 Appendix B Traffic Impact Analysis, Asphalt Plant No. 1 Replacement and Modernization DRAFT REPORT Traffic Impact Analysis, Asphalt Plant No. 1 Replacement and Modernization Prepared for City of Los Angeles
IV. ENVIRONMENTAL IMPACT ANALYSIS N. TRANSPORTATION AND TRAFFIC
 IV. ENVIRONMENTAL IMPACT ANALYSIS N. TRANSPORTATION AND TRAFFIC The following section summarizes the information provided in the traffic report entitled Traffic Impact Analysis for a Proposed Residential
5.9 TRANSPORTATION AND TRAFFIC
 5.9 TRANSPORTATION AND TRAFFIC This section evaluates transportation- and traffic-related impacts that have the potential to result from the construction and operation of the Project. Information and analysis
IV. ENVIRONMENTAL IMPACT ANALYSIS C. TRAFFIC CIRCULATION AND PARKING
 IV. ENVIRONMENTAL IMPACT ANALYSIS C. TRAFFIC CIRCULATION AND PARKING 1. INTRODUCTION This section is based on the technical report Traffic Impact Study Health Sciences Campus Project, City of Los Angeles,
APPENDIX H. Transportation Impact Study
 APPENDIX H Transportation Impact Study BUENA VISTA LAGOON ENHANCEMENT PROJECT TRANSPORTATION IMPACT STUDY Prepared for: San Diego Association of Governments Prepared by: VRPA Technologies, Inc. 9520 Padgett
TRAFFIC IMPACT STUDY DERRY GREEN CORPORATE BUSINESS PARK MILTON SECONDARY PLAN MODIFICATION
 TRAFFIC IMPACT STUDY DERRY GREEN CORPORATE BUSINESS PARK MILTON SECONDARY PLAN MODIFICATION TRAFFIC IMPACT STUDY DERRY GREEN CORPORATE BUSINESS PARK MILTON SECONDARY PLAN MODIFICATION DECEMBER 24 UPDATED
Traffic Impact Analysis for 2171 Rosecrans Avenue
 Traffic Impact Analysis for 2171 Rosecrans Avenue Prepared for: Continental Development Corporation Revised May 2016 LA16-2831 Prepared by: Fehr & Peers 600 Wilshire Blvd, Suite 1050 Los Angeles, CA 90017
L1TILE BEARS DAY CARE TRANSPORTATION IMPACT STUDY FORT COLLINS, COLORADO MAY Prepared for:
 L1TILE BEARS DAY CARE TRANSPORTATION IMPACT STUDY FORT COLLINS, COLORADO MAY 2012 Prepared for: Hillside Construction, Inc. 216 Hemlock Street, Suite B Fort Collins, CO 80534 Prepared by: DELICH ASSOCIATES
Traffic Study for the United California, California and Bradley ( UCCB ) Energy Project, Orcutt, CA
 Energy Project, Orcutt, CA") Stantec Consulting Services Inc. 111 East Victoria Street, Santa Barbara CA 93101-2018 June 25, 2015 File: 2064107000 Erik Vasquez PetroRock, LLC 4700 Stockdale Highway, Suite 120 Bakersfield, CA. 93309
Stantec Consulting Services Inc. 111 East Victoria Street, Santa Barbara CA 93101-2018 June 25, 2015 File: 2064107000 Erik Vasquez PetroRock, LLC 4700 Stockdale Highway, Suite 120 Bakersfield, CA. 93309
MEMO VIA . Ms. Amy Roth DPS Director, City of Three Rivers. To:
 MEMO To: Ms. Amy Roth DPS Director, City of Three Rivers VIA EMAIL From: Michael J. Labadie, PE Julie M. Kroll, PE, PTOE Brandon Hayes, PE, P.Eng. Fleis & VandenBrink Date: January 5, 2017 Re: Proposed
Impacts to street segments were analyzed based on procedures detailed in the Highway Capacity Manual for levels of service related to roadways.
 4.7 Transportation and Circulation This report documents the results of a study of the potential traffic impacts created by the Whittier Main Oil Field Development Project. The study is included as Appendix
Table of Contents INTRODUCTION... 3 PROJECT STUDY AREA Figure 1 Vicinity Map Study Area... 4 EXISTING CONDITIONS... 5 TRAFFIC OPERATIONS...
 Crosshaven Drive Corridor Study City of Vestavia Hills, Alabama Table of Contents INTRODUCTION... 3 PROJECT STUDY AREA... 3 Figure 1 Vicinity Map Study Area... 4 EXISTING CONDITIONS... 5 TRAFFIC OPERATIONS...
DRAFT TRANSPORTATION IMPACT STUDY CASTILIAN REDEVELOPMENT PROJECT
 DRAFT TRANSPORTATION IMPACT STUDY CASTILIAN REDEVELOPMENT PROJECT Prepared for: Submitted by: 299 Lava Ridge Ct. Suite 2 Roseville, CA. 95661 June 212 TABLE OF CONTENTS 1. Introduction... 1 Project Location
Appendix C. Traffic Impact Study
 Appendix C Traffic Impact Study TRAFFIC STUDY FOR THE EAGLE ROCK AGGREGATE TERMINAL Prepared by: FEHR & PEERS 201 Santa Monica Blvd. Suite 500 Santa Monica, CA 90401-2213 T. (310) 458-9916 F. (310) 394-7663
Chapter 6. CEE 320 Anne Goodchild. Spring 2008 CEE 320
 Chapter 6 Freeway Level of Service Anne Goodchild Definitions Level of Service (LOS) Chief measure of quality of service Describes operational conditions within a traffic stream. Does not include safety
Interstate Operations Study: Fargo-Moorhead Metropolitan Area Simulation Output
 NDSU Dept #2880 PO Box 6050 Fargo, ND 58108-6050 Tel 701-231-8058 Fax 701-231-6265 www.ugpti.org www.atacenter.org Interstate Operations Study: Fargo-Moorhead Metropolitan Area 2015 Simulation Output Technical
PROJECT: Wilkinson Road Corridor Improvement Traffic Management Planning Project SUBJECT: Traffic Analysis
 TECHNICAL MEMORANDUM DATE: September 10, 2014 PROJECT 5861.03 NO: PROJECT: Wilkinson Road Corridor Improvement Traffic Management Planning Project SUBJECT: Traffic Analysis TO: Steve Holroyd - District
King County Metro. Columbia Street Transit Priority Improvements Alternative Analysis. Downtown Southend Transit Study. May 2014.
 King County Metro Columbia Street Transit Priority Improvements Alternative Analysis Downtown Southend Transit Study May 2014 Parametrix Table of Contents Introduction... 1 Methodology... 1 Study Area...
TABLE OF CONTENTS 1.0 INTRODUCTION AND SUMMARY Purpose of Report and Study Objectives... 2
 TABLE OF CONTENTS 1.0 INTRODUCTION AND SUMMARY 1 1.1 Purpose of Report and Study Objectives... 2 1.2 Executive Summary... 3 1.2.1 Site Location and Study Area... 3 1.2.2 Development Description... 3 1.2.3
BERKELEY DOWNTOWN AREA PLAN PROGRAM ENVIRONMENTAL IMPACT REPORT TRAFFIC IMPACT ANALYSIS
 BERKELEY DOWNTOWN AREA PLAN PROGRAM ENVIRONMENTAL IMPACT REPORT TRAFFIC IMPACT ANALYSIS Prepared for: City of Berkeley Prepared by: REVISED JANUARY 9, 2009 Berkeley Downtown Area Plan Program EIR Traffic
April 7, Mr. Blake Shutler Compass Homes Development LLC Summit Homes Construction, LLC PO Box 6539 Dillon, CO 80435
 Compass Homes Development LLC Summit Homes Construction, LLC PO Box 6539 Dillon, CO 80435 Re: Trip Generation Comparison West Hills Townhomes Keystone, Colorado FHU Reference No. 116388-01 Dear Mr. Shutler:
HUMC/Mountainside Hospital Redevelopment Plan
 Traffic and Parking Analysis HUMC/Mountainside Hospital Redevelopment Plan in Glen Ridge Borough and Montclair Township PREPARED FOR H2M 119 Cherry Hill Road, Suite 110 Parsippany, NJ 07054 862.207.5900
LOTUS RANCH TRAFFIC IMPACT ANALYSIS. LLG Ref Senior Transportation Engineer & Charlene Sadiarin Transportation Engineer II
 TRAFFIC IMPACT ANALYSIS LOTUS RANCH El Centro, California July 31, 2015February 12, 2016 LLG Ref. 3-14-2392 Prepared by: KC Yellapu, P.E Senior Transportation Engineer & Charlene Sadiarin Transportation
Appendix G: Transportation/Traffic
 City of Irvine - William Lyon Homes: Vista Verde Draft EIR Appendix G: Transportation/Traffic Michael Brandman Associates H:\Client (PN-JN)\0006\00060034\EIR\3 - DEIR\00060034 Sec99-00 Appendix Dividers
Interstate Operations Study: Fargo-Moorhead Metropolitan Area Simulation Results
 NDSU Dept #2880 PO Box 6050 Fargo, ND 58108-6050 Tel 701-231-8058 Fax 701-231-6265 www.ugpti.org www.atacenter.org Interstate Operations Study: Fargo-Moorhead Metropolitan Area 2025 Simulation Results
MADERAS HOTEL TRANSPORTATION IMPACT ANALYSIS. LLG Ref Transportation Planner III & Jorge Cuyuch Transportation Engineer I
 TRANSPORTATION IMPACT ANALYSIS MADERAS HOTEL Poway, California June 21, 2016 LLG Ref. 3-16-2602 Prepared by: Amelia Giacalone Transportation Planner III & Jorge Cuyuch Transportation Engineer I Under the
Lacey Gateway Residential Phase 1
 Lacey Gateway Residential Phase Transportation Impact Study April 23, 203 Prepared for: Gateway 850 LLC 5 Lake Bellevue Drive Suite 02 Bellevue, WA 98005 Prepared by: TENW Transportation Engineering West
APPENDICES. Appendix R Traffic Impact Analysis (January 2017)
") APPENDICES Appendix R Traffic Impact Analysis (January 2017) 661 Bear Valley Parkway EIR March 2017 APPENDICES This page intentionally left blank 661 Bear Valley Parkway EIR March 2017 TRAFFIC IMPACT ANALYSIS
APPENDICES Appendix R Traffic Impact Analysis (January 2017) 661 Bear Valley Parkway EIR March 2017 APPENDICES This page intentionally left blank 661 Bear Valley Parkway EIR March 2017 TRAFFIC IMPACT ANALYSIS
TALMONT TOWNHOMES MADISON KENNETH SPA TRAFFIC IMPACT STUDY. Sacramento, CA. Prepared For: MBK Homes. Prepared By:
 TALMONT TOWNHOMES MADISON KENNETH SPA TRAFFIC IMPACT STUDY Sacramento, CA Prepared For: MBK Homes Prepared By: KD Anderson & Associates 3853 Taylor Road, Suite G Loomis, California 95650 (916) 660-1555
Traffic Impact Analysis West Street Garden Plots Improvements and DuPage River Park Garden Plots Development Naperville, Illinois
 Traffic Impact Analysis West Street Garden Plots Improvements and DuPage River Park Garden Plots Development Naperville, Illinois Submitted by April 9, 2009 Introduction Kenig, Lindgren, O Hara, Aboona,
Section 5.0 ENVIRONMENTAL ANALYSIS
 Section 5.0 ENVIRONMENTAL ANALYSIS 5.2 TRANSPORTATION/CIRCULATION/PARKING This section evaluates potential traffic-related and parking impacts associated with the proposed project. The following discussion
TRAFFIC SIGNAL DESIGN REPORT KING OF PRUSSIA ROAD & RAIDER ROAD RADNOR TOWNSHIP PENNSYLVANIA
 TRAFFIC SIGNAL DESIGN REPORT KING OF PRUSSIA ROAD & RAIDER ROAD RADNOR TOWNSHIP PENNSYLVANIA PREPARED FOR: UNIVERSITY OF PENNSYLVANIA HEALTH SYSTEM 34 CIVIC CENTER BOULEVARD PHILADELPHIA, PA 1987 (61)
Table of Contents. Traffic Impact Analysis Capital One Building at Schilling Place
 Traffic Impact Analysis Capital One Building at Schilling Place Table of Contents Executive Summary... 1 1. Introduction... 4 2. Project Description... 4 3. Background Information... 4 4. Study Scope...
TRAFFIC IMPACT STUDY FOR SONIC DRIVE-IN RESTAURANT. Vallejo, CA. Prepared For:
 TRAFFIC IMPACT STUDY FOR SONIC DRIVE-IN RESTAURANT Vallejo, CA Prepared For: ELITE DRIVE-INS, INC. 2190 Meridian Park Blvd, Suite G Concord, CA 94520 Prepared By: KD Anderson & Associates 3853 Taylor Road,
2016 Congestion Report
 2016 Congestion Report Metropolitan Freeway System May 2017 2016 Congestion Report 1 Table of Contents Purpose and Need...3 Introduction...3 Methodology...4 2016 Results...5 Explanation of Percentage Miles
MINERVA PARK SITE TRAFFIC IMPACT STUDY M/I HOMES. September 2, 2015
 5500 New Albany Road Columbus, Ohio 43054 Phone: 614.775.4500 Fax: 614.775.4800 Toll Free: 1-888-775-EMHT emht.com 2015-1008 MINERVA PARK SITE TRAFFIC IMPACT STUDY M/I HOMES September 2, 2015 Engineers
I-405 Corridor Master Plan
 Southern California Association of Governments I-405 Corridor Master Plan Presentation to Streets and Freeways Subcommittee October 13, 2015 1 Presentation Overview Expectations and Approach Corridor Performance
1. INTRODUCTION 2. PROJECT DESCRIPTION CUBES SELF-STORAGE MILL CREEK TRIP GENERATION COMPARISON
 CUBES SELF-STORAGE MILL CREEK TRIP GENERATION COMPARISON 1. INTRODUCTION This report summarizes traffic impacts of the proposed CUBES Self-Storage Mill Creek project in comparison to the traffic currently
CHAPTER 9: VEHICULAR ACCESS CONTROL Introduction and Goals Administration Standards
 9.00 Introduction and Goals 9.01 Administration 9.02 Standards 9.1 9.00 INTRODUCTION AND GOALS City streets serve two purposes that are often in conflict moving traffic and accessing property. The higher
IV. ENVIRONMENTAL IMPACT ANALYSIS L. TRANSPORTATION/TRAFFIC
 IV. ENVIRONMENTAL IMPACT ANALYSIS L. TRANSPORTATION/TRAFFIC INTRODUCTION The following section summarizes the information provided in the traffic report entitled Traffic Impact Analysis for a Proposed
Section 3.12 Traffic and Transportation
 Section. Traffic and Transportation SECTION SUMMARY This section describes existing ground transportation within the Port and surrounding area associated with implementation of the proposed Project. An
V. DEVELOPMENT OF CONCEPTS
 Martin Luther King, Jr. Drive Extension FINAL Feasibility Study Page 9 V. DEVELOPMENT OF CONCEPTS Throughout the study process several alternative alignments were developed and eliminated. Initial discussion
MONTEREY BAY AQUARIUM RESEARCH INSTITUTE (MBARI) MASTER PLAN UPDATE MOSS LANDING, CALIFORNIA
 MASTER PLAN UPDATE MOSS LANDING, CALIFORNIA") MONTEREY BAY AQUARIUM RESEARCH INSTITUTE (MBARI) MASTER PLAN UPDATE MOSS LANDING, CALIFORNIA TRAFFIC IMPACT ANALYSIS Administrative Draft Report Prepared For Monterey Bay Aquarium Research Institute Moss
MONTEREY BAY AQUARIUM RESEARCH INSTITUTE (MBARI) MASTER PLAN UPDATE MOSS LANDING, CALIFORNIA TRAFFIC IMPACT ANALYSIS Administrative Draft Report Prepared For Monterey Bay Aquarium Research Institute Moss
STH 60 Northern Reliever Route Feasibility Study Report
 #233087 v3 STH 60 Northern Reliever Route Feasibility Study Report Washington County Public Works Committee Meeting September 28, 2016 1 STH 60 Northern Reliever Route Feasibility Study Hartford Area Development
APPENDIX J LAKE WOHLFORD DAM REPLACEMENT PROJECT TRAFFIC IMPACT ANALYSIS (DAM REPLACEMENT) Lake Wohlford Dam Replacement Project EIR
 Lake Wohlford Dam Replacement Project EIR") APPENDIX J LAKE WOHLFORD DAM REPLACEMENT PROJECT TRAFFIC IMPACT ANALYSIS (DAM REPLACEMENT) Replacement Project EIR Appendices TRAFFIC IMPACT ANALYSIS LAKE WOHLFORD DAM Escondido, California December 19,
APPENDIX J LAKE WOHLFORD DAM REPLACEMENT PROJECT TRAFFIC IMPACT ANALYSIS (DAM REPLACEMENT) Replacement Project EIR Appendices TRAFFIC IMPACT ANALYSIS LAKE WOHLFORD DAM Escondido, California December 19,
Clean Harbors Canada, Inc.
 Clean Harbors Canada, Inc. Proposed Lambton Landfill Expansion Environmental Assessment Terms of Reference Transportation Assessment St. Clair Township, Ontario September 2009 itrans Consulting Inc. 260
IV. ENVIRONMENTAL IMPACT ANALYSIS J. TRANSPORTATION AND TRAFFIC
 IV. ENVIRONMENTAL IMPACT ANALYSIS J. TRANSPORTATION AND TRAFFIC This Section summarizes the information provided in the Traffic Study for the Santa Monica College Bundy Campus Master Plan (Traffic Study),
Metropolitan Freeway System 2013 Congestion Report
 Metropolitan Freeway System 2013 Congestion Report Metro District Office of Operations and Maintenance Regional Transportation Management Center May 2014 Table of Contents PURPOSE AND NEED... 1 INTRODUCTION...
TRAFFIC IMPACT ANALYSIS 661 BEAR VALLEY. Escondido, California September 1, LLG Ref
 TRAFFIC IMPACT ANALYSIS 661 BEAR VALLEY Escondido, California September 1, 2015 LLG Ref. 3-13-2299 EXECUTIVE SUMMARY The Project (Project) proposes the development of 55 residential dwelling units on 40.88
Bennett Pit. Traffic Impact Study. J&T Consulting, Inc. Weld County, Colorado. March 3, 2017
 Bennett Pit Traffic Impact Study J&T Consulting, Inc. Weld County, Colorado March 3, 217 Prepared By: Sustainable Traffic Solutions, Inc. http://www.sustainabletrafficsolutions.com/ Joseph L. Henderson,
Energy Technical Memorandum
 Southeast Extension Project Lincoln Station to RidgeGate Parkway Prepared for: Federal Transit Administration Prepared by: Denver Regional Transportation District May 2014 Table of Contents Page No. Chapter
I-820 (East) Project Description. Fort Worth District. Reconstruct Southern I-820/SH 121 Interchange
 Project Description. Fort Worth District. Reconstruct Southern I-820/SH 121 Interchange") I-820 (East) Project Description Fort Worth District Reconstruct Southern I-820/SH 121 Interchange I-820 from approximately 2,000 feet north of Pipeline Road/Glenview Drive to approximately 3,200 feet
I-820 (East) Project Description Fort Worth District Reconstruct Southern I-820/SH 121 Interchange I-820 from approximately 2,000 feet north of Pipeline Road/Glenview Drive to approximately 3,200 feet
APPENDIX C-2. Traffic Study Supplemental Analysis Memo
 APPENDIX C-2 Traffic Study Supplemental Analysis Memo The Mobility Group Transportation Strategies & Solutions Memorandum To: From: Subject: Tomas Carranza, LADOT Matthew Simons Traffic Review - Revised
Traffic Impact Study Speedway Gas Station Redevelopment
 Traffic Impact Study Speedway Gas Station Redevelopment Warrenville, Illinois Prepared For: Prepared By: April 11, 2018 Table of Contents 1. Introduction... 1 2. Existing Conditions... 4 Site Location...
3.8 TRANSPORTATION, CIRCULATION AND PARKING
 3.8 TRANSPORTATION, CIRCULATION AND PARKING This section provides an overview of traffic, circulation and parking impacts and evaluates the construction and operational impacts associated with the Proposed
P07033 US 50 EB Weaving Analysis between El Dorado Hills and Silva Valley Ramp Metering Analysis for US 50 EB On-Ramp at Latrobe Road
 180 Grand Avenue, Suite 250 428 J Street, Suite 500 Oakland, CA 94612 Sacramento, CA 95814 510.839.1742 916.266.2190 510.839.0871 fax 916.266.2195 Dowling Associates, Inc. www.dowlinginc.com traffic@dowlinginc.com
Diablo Vista Pumping Plant Replacement
 Diablo Vista Pumping Plant Replacement Traffic Study PHA Transportation Consultants 12-05-359 October 2012 Diablo Vista Pumping Plant Replacement Traffic Study For EBMUD October 2012 PHA Transportation
Los Angeles Mission College Facilities Master Plan Draft Program Environmental Impact Report 3.13 TRANSPORTATION / TRAFFIC
 3.13 TRANSPORTATION / TRAFFIC As a result of the analysis undertaken in the Initial Study for the Los Angeles Mission College Facilities Master Plan, the (LACCD) determined that the proposed project may