Tijuana River Valley Regional Park Campground and Education Center
|
|
|
- Helen Owens
- 5 years ago
- Views:
Transcription

1 Tijuana River Valley Regional Park Campground and Education Center Draft Report September 2018 Prepared for: County of San Diego 5500 Overland Avenue, Suite 410 San Diego, CA Prepared by: 3900 Fifth Avenue, Suite 310 San Diego, CA 92103
2 Page ii Tijuana River Valley Regional Park Campground
3 Table of Contents 1.0 Introduction Project Description Analysis Methodology Level of Service Definition Unsignalized Intersection Analysis Determination of Significant Impacts Existing Conditions Project Study Area Existing Study Area Traffic Volumes Existing Traffic Operations Analysis Proposed Project Project Trip Generation Trip Distribution & Assignment Existing Plus Project Conditions Existing Plus Project Study Area Traffic Volumes Existing Plus Project Traffic Operations Analysis Impact Significance and Mitigation Cumulative Conditions Project Driveways and Sight Distance Analysis Sight Distance Field Review/Calculations Summary of Findings Conclusions Appendices Appendix A Traffic Counts Appendix B Peak Hour Intersection Capacity Worksheets Existing Conditions Appendix C Trip Generation Excerpts from the Bayside Performance Park Enhancement Project Appendix D Peak Hour Intersection Capacity Worksheets Existing Plus Project Conditions Page i Tijuana River Valley Regional Park Campground
4 List of Tables Table 2.1 Level of Service Definitions... 5 Table 2.2 County of San Diego Roadway Classification and LOS Standards... 6 Table 2.3 Unsignalized Intersection LOS Criteria... 7 Table 2.4 Measures of Significant Project Impacts to Congestion Allowable Increases on Congested Road Segments... 7 Table 3.1 Roadway Segment Level of Service Existing Conditions Table 3.2 Peak Hour Intersection Level of Service Results Existing Conditions Table 4-1 Proposed Project Tip Generation Table 5.1 Roadway Segment Level of Service Existing Plus Project Conditions Table 5.2 Peak Hour Intersection Level of Service Results Existing Plus Project Conditions Table 7.1 Standard Corner Sight Distance at Intersections Table 7.2 Standard Stopping Sight Distance at Intersections Table 7.3 Sight Distance Analysis Results List of Figures Figure 1-1 Project Regional Location... 2 Figure 1-2 Project Site Plan... 3 Figure 1-3 Project Study Area... 4 Figure 3-1 Existing Roadway Geometrics... 9 Figure 3-2 Existing Traffic Volumes Figure 4-1 Proposed Project Trip Distribution Figure 4-2 Proposed Project Trip Assignment Figure 5-1 Existing Plus Project Traffic Volumes Figure 7-1 Corner Sight Distance Looking East on Monument Road from Driveway # Figure 7-2 Corner Sight Distance Looking West on Monument Road from Driveway # Figure 7-3 Stopping Sight Distance Looking West on Monument Road towards Driveway # Figure 7-4 Stopping Sight Distance Looking East on Monument Road towards Driveway # Figure 7-5 Corner Sight Distance Looking North on Saturn Boulevard from Driveway # Figure 7-6 Corner Sight Distance Looking South on Saturn Boulevard from Driveway # Figure 7-7 Stopping Sight Distance Looking North on Saturn Boulevard towards Driveway # Figure 7-8 Stopping Sight Distance Looking South on Saturn Boulevard towards Driveway # Page ii Tijuana River Valley Regional Park Campground
5 1.0 Introduction The purpose of this report is to identify any vehicular impacts associated with the proposed Tijuana River Valley Regional Park Campground and Education Center (Proposed Project), to be developed by the County of San Diego Department of Parks and Recreation. 1.1 Project Description The Proposed Project is located in the City of San Diego s Tijuana River Valley community. The Proposed Project involves the development of a 79-acre campground and education center near the western boundary of the Tijuana River Valley Regional Park and just east of the Border Field State Park, west of Hollister Street and north of Monument Road. The campground and education center will be operated by the County of San Diego Department of Parks and Recreation. The campground is expected to serve lower income families from local neighborhoods, as well as the greater San Diego County region. The nature education center is intended for families and school/youth groups, including disadvantaged youth who may not have had the opportunity to experience camping in a natural environment. The Proposed Project will include 79 campsites that will serve a variety of uses including: multi-use campsites, tent campsites, yurts (round tents), and equestrian campsites. Each campsite will include a picnic table, barbecue, and fire ring. No hookups for power, water, etc. will be included at any campsite. Site amenities are expected to include restrooms/coin-showers, an office, entry booth, and circulation roads. Nature play and interpretive areas will serve as gathering places for all campers. The Proposed Project will feature a day-use outdoor nature education center available to local residents and visitors. Campers, families, and school/youth groups will have access to a nature trail with interpretive panels, an amphitheater for educational programs, and nature play areas for kids and youth. Adjacent to the day-use area, a group camping area will provide overnight accommodations in a yurt village for school/youth groups and large families. Site activities are anticipated to be associated with primitive camping, trail use (hiking and equestrian) and use of the outdoor nature education areas. Large events will not be allowed at the site. The Proposed Project s regional location is shown in Figure 1-1, while Figure 1-2 and Figure 1-3 display the Proposed Project site plan and study area, respectively. Page 1 Tijuana River Valley Regional Park Campground
6 City of Oceanside City of Vista 15 City of Carlsbad }þ 78 City of San Marcos City of Escondido 5 City of Encinitas Unincorporated County City of Solana Beach City of Del Mar }þ 56 City of Poway City of San Diego 805 }þ 52 City of Santee }þ 67 }þ City of La Mesa }þ 125 City of El Cajon City of Coronado }þ 94 City of Lemon Grove }þ 94 City of National City }þ 54 N0 2 4 Miles Tijuana River Valley Park Campground Project Site City of Imperial Beach 5 ^ }þ 905 City of Chula Vista 805 City of San Diego }þ 125 Tijuana, B.C., Mexico Figure 1-1 Project Regional Location


7 Tijuana River Valley Park Campground Figure 1-2 Project Site Plan
8 Project Area Study Roadway Segment! Study Intersection!( Driveway HOLLISTER ST Project Driveway #1 Project Site Project Driveway #2!( 2 SATURN BLVD!( 1 MONUMENT RD! 1 N ,000 Feet Tijuana River Valley Park Campground Figure 1-3 Project Study Area
9 2.0 Analysis Methodology The traffic analyses prepared for this technical memorandum were performed in accordance with the County of San Diego Traffic Impact Guidelines and the California Environmental Quality Act (CEQA) project review process, as the Proposed Project involves development of a County of San Diego park. Considering the study area includes an intersection and roadway segments located within the City of San Diego, the intersection and roadway segment analyses were prepared consistent City of San Diego Traffic Impact Study Manual. County Guidelines require that the project study area includes all County Mobility Element roadways and intersections where the Proposed Project is projected to add 25 or more peak hour trips in addition to 200 or more average daily trips (ADT). 2.1 Level of Service Definition Level of Service (LOS) is a quantitative measure describing operational conditions within a traffic stream, and the motorist s and/or passenger s perception of operations. A LOS definition generally describes these conditions in terms of such factors as delay, speed, travel time, freedom to maneuver, interruptions in traffic flow, queuing, comfort, and convenience. Table 2.1 describes generalized definitions of the various LOS categories (A through F) as applied to roadway operations. Table 2.1 Level of Service Definitions LOS Category A B C D E F Definition of Operation This LOS represents a completely free-flow condition, where the operation of vehicles is virtually unaffected by the presence of other vehicles and only constrained by the geometric features of the highway and by driver preferences. This LOS represents a relatively free-flow condition, although the presence of other vehicles becomes noticeable. Average travel speeds are the same as in LOS A, but drivers have slightly less freedom to maneuver. At this LOS, the influence of traffic density on operations becomes marked. The ability to maneuver within the traffic stream is clearly affected by other vehicles. At this LOS, the ability to maneuver is notably restricted due to traffic congestion, and only minor disruptions can be absorbed without extensive queues forming and the service deteriorating. This LOS represents operations at or near capacity. LOS E is an unstable level, with vehicles operating with minimum spacing for maintaining uniform flow. At LOS E, disruptions cannot be dissipated readily thus causing deterioration down to LOS F. At this LOS, forced or breakdown of traffic flow occurs, although operations appear to be at capacity, queues form behind these breakdowns. Operations within queues are highly unstable, with vehicles experiencing brief periods of movement followed by stoppages. Source: Highway Capacity Manual (2010) Page 5 Tijuana River Valley Regional Park Campground
10 Roadway Segment Level of Service Thresholds Roadway segment LOS standards and thresholds provide the basis for analysis of roadway segment performance. The LOS analysis is based on the functional classification of the roadway, the maximum capacity, roadway geometrics, and existing or forecast ADT. Table 2.2 displays the roadway segment capacity and LOS standards utilized to analyze roadway segments within the City of San Diego. The two study area roadway segments, Monument Road and Hollister Street, were both analyzed as 2- Lane Collector (w/o Two-Way Left-Turn Lane) roadways. Table 2.2 City of San Diego Roadway Segment Daily Capacity and Level of Service Standards Roadway Functional Classification Lanes Level of Service A B C D E Freeway 8 60,000 84, , , ,000 Freeway 6 45,000 63,000 90, , ,000 Freeway 4 30,000 42,000 60,000 70,000 80,000 Expressway 6 30,000 42,000 60,000 70,000 80,000 Prime Arterial 8 35,000 50,000 70,000 75,000 80,000 Prime Arterial 6 25,000 35,000 50,000 55,000 60,000 Major Arterial 7 22,500 31,500 45,000 50,000 55,000 Major Arterial 6 20,000 28,000 40,000 45,000 50,000 Major Arterial 5 17,500 24,500 35,000 40,000 45,000 Major Arterial 4 15,000 21,000 30,000 35,000 40,000 Major Arterial 3 11,250 15,750 22,500 26,250 30,000 Major Arterial 2 7,500 10,500 15,000 17,500 20,000 Major Arterial (one-way) 3 12,500 16,500 22,500 25,000 27,500 Major Arterial (one-way) 2 10,000 13,000 17,500 20,000 22,500 Collector (w/ two-way left turn lane) 4 10,000 14,000 20,000 25,000 30,000 Collector (w/ two-way left turn lane) 3 7,500 10,500 15,000 18,750 22,500 Collector (w/ two-way left turn lane) 2 5,000 7,000 10,000 13,000 15,000 Collector (w/o two-way left turn lane) 4 5,000 7,000 10,000 13,000 15,000 Collector (w/o two-way left turn lane) 3 4,000 5,000 7,500 10,000 11,000 Collector (w/o two-way left turn lane) 2 2,500 3,500 5,000 6,500 8,000 Collector (w/o two-way left turn lane) no fronting property 2 4,000 5,500 7,500 9,000 10,000 Collector (one-way) 3 11,000 14,000 19,000 22,500 26,000 Collector (one-way) 2 7,500 9,500 12,500 15,500 17,500 Collector (one-way) 1 2,500 3,500 5,000 6,500 7,500 Sub-Collector (single-family) , Source: City of San Diego Traffic Impact Study Manual (1998); Updated with input from City of San Diego Planning Department Mobility Staff (2017) Page 6 Tijuana River Valley Regional Park Campground
11 2.2 Unsignalized Intersection Analysis The unsignalized intersection of Hollister Street and Monument Road was analyzed using the 2010 Highway Capacity Manual unsignalized intersection analysis methodology. The SYNCHRO 10.0 Traffic Analysis software supports this methodology and was utilized to produce LOS results. The LOS for a side street stop controlled (SSSC) intersection is determined by the computed control delay and is defined for each minor movement. Table 2.3 summarizes the LOS criteria for unsignalized intersections. Table 2.3 Unsignalized Intersection LOS Criteria Average Control Delay (sec/veh) Level of Service (LOS) <10.0 A B C D E >50.0 F Source: Highway Capacity Manual (2010) 2.3 Determination of Significant Impacts This section outlines the thresholds for determining significant project-related impacts to roadways, intersections, and freeways in the City of San Diego. A significant impact is identified when the addition of a project s traffic results in a level of service dropping from LOS D or better to LOS E or F. Table 2.5 summarizes the significant impact thresholds for facilities operating at substandard level of service with and without the project. Where a roadway segment operates at LOS E or F, if the intersections at the ends of the segment and a peak hour arterial analysis for the same segment result in acceptable LOS with the project; then the project impacts would be less than significant. If either the intersections or segment under arterial analysis do not operate acceptably, the impact would be significant. LOS with Project Table 2.5 City of San Diego Measures of Significant Project Traffic Impacts Allowable Change Due to Impact Freeways Roadway Segments Intersections Ramp Metering* V/C Speed (mph) V/C Speed (mph) Delay (sec) Delay (min) E F Source: CEQA Significance Determination Thresholds, City of San Diego Development Services Department (2007) Note: * For metered freeway ramps, LOS does not apply. However, ramp meter delays above 15 minutes are considered excessive. Page 7 Tijuana River Valley Regional Park Campground
12 3.0 Existing Conditions This section describes the study area segments and intersection, existing daily roadway and peak hour intersection traffic volume information, as well as the LOS analysis results under the Existing Conditions. 3.1 Project Study Area Existing Roadway Network Monument Road is an east-west roadway, running between the Pacific Ocean and Old Dairy Mart Road in the southwestern corner of San Diego County, near the US-Mexico International Border. Within the project study area, Monument Road is a 2-Lane Collector (w/o Two-Way Left-Turn Lane) roadway with a posted speed limit of 35 MPH between Saturn Boulevard and Hollister Street and a posted speed limit of 15 MPH in front of the Proposed Project site, west of Saturn Boulevard. Parking restrictions are not posted within the study area, nor are there bicycle facilities or sidewalks present. Hollister Street is a north-south roadway, running between Coronado Avenue at the I-5 Overpass and Monument Road. Within the project study area, Hollister Street a 2-Lane Collector (w/o Two-Way Left- Turn Lane) roadway with a posted speed limit of 35 MPH. Parking restrictions are not posted within the study area, nor are there bicycle facilities or sidewalks present. Study Intersections 1. Hollister Street/Monument Road 3.2 Existing Study Area Traffic Volumes Study area roadway segment and study area intersection traffic counts were conducted in November 2017 and are provided in Appendix A. Figure 3-1 displays the existing roadway geometrics, while Figure 3-2 displays the existing traffic volumes. Page 8 Tijuana River Valley Regional Park Campground
13 2-Lane Collector w/o TWLTL 2-Lane Collector w/o TWLTL Project Site Tijuana River Valley Park Campground! 1 Figure 3-1 Existing Roadway Geometrics HOLLISTER ST 2-Lane Collector w/o TWLTL MONUMENT RD SATURN BLVD Lane Geometry Stop Sign N ,000 Feet
14 XX,XXX Daily Traffic Volumes AM / PM AM / PM AM / PM Peak Hour Intersection Turning Movements HOLLISTER ST Project Site 184 SATURN BLVD MONUMENT RD! 1 11 / 9 4 / / 38 2 / 3 10 / 7 1 / 3 N ,000 Feet Tijuana River Valley Park Campground Figure 3-2 Existing Traffic Volumes
15 3.3 Existing Traffic Operations Analysis Level of Service analyses under Existing Conditions were conducted using the methodologies described in the previous chapter. Roadway segments and intersection LOS analysis results are discussed separately. Roadway Segment Analysis Table 3.1 displays the LOS analysis results for study area roadway segments under Existing Conditions. Table 3.1 Roadway Segment Level of Service Existing Conditions Roadway Segment ADT LOS Threshold (LOS E) Hollister Street North of Monument Road 752 8,000 A Monument Road East of Hollister Street 576 8,000 A West of Saturn Boulevard 184 8,000 A Saturn Boulevard to Hollister Street 368 8,000 A LOS Source: NDS (2017); Chen Ryan Associates (2018) As shown, all of the study area roadway segments currently operate at acceptable LOS A under Existing Conditions. Intersection Analysis Table 3.2 displays intersection LOS and average vehicle delay results for the study area intersection under Existing Conditions. LOS calculation worksheets for Existing Conditions are provided in Appendix B. Intersection Table 3.2 Peak Hour Intersection Level of Service Results Existing Conditions Traffic Control AM Peak Hour PM Peak Hour Avg. Delay (sec) LOS Avg. Delay (sec) LOS 1. Hollister Street/Monument Road SSSC 8.5 A 8.8 A Source: NDS (2017); Chen Ryan Associates (2018) Notes: SSSC = Side Street Stop Control. For SSSC intersections, the delay shown is the worst delay experienced by any of the approaches. As shown, the study intersection currently operates at an acceptable LOS A during both the AM and PM peak hours under Existing Conditions. Page 11 Tijuana River Valley Regional Park Campground
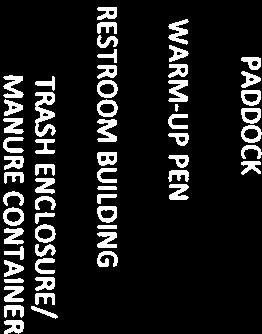
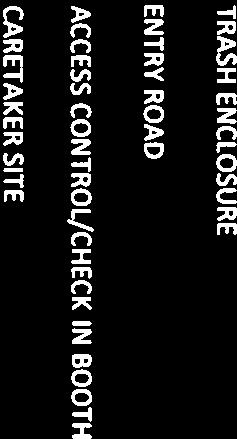
16 4.0 Proposed Project The Proposed Project consists of the following features: 79 campsites (67 on the western portion of the site + 12 at the equestrian site), including: o 25 campsites o 38 multi-use sites (12 at equestrian site) o 8 large yurts o 8 small yurts Site Amenities o Horse corral and pasture with parking for day use (up to twenty day-users anticipated) o 1 caretaker site o 1 restroom / shower / administrative office site o 1 restroom building (equestrian site) o Picnic tables, barbeques, fire rings, horseshoe pits, shade structures, and playgrounds o 22-mile trail system access Nature Education Center o Amphitheater for educational programs o Nature trail, interpretive panels, and a centrally located communal fire ring Site activities are anticipated to be associated with primitive camping, trail use (hiking and equestrian) and use of the outdoor nature education areas. Large events will not be allowed at the site. 4.1 Project Trip Generation The Proposed Project includes three land use categories that will generate vehicular trips: campsites, an outdoor nature center and a horse corral and pasture for campers and day users. Trip generation rates for the campsites were developed utilizing SANDAG s (Not So) Brief Guide of Vehicular Traffic Generation Rates for the San Diego Region (2002), while the AM/PM peak hour in- and out-trip ratios were derived from the ITE Trip Generation Manual (2012). Of the 79 total campsites, 38 are intended as multi-use sites. Considering the multi-use sites may consist of vehicles with trailers and/or recreational vehicles (RVs), a passenger car equivalent (PCE) of 2.5 was applied to these 38 sites to be conservative. The small yurts are 16 in diameter, providing a similar capacity to that of a general campsite. Therefore, the general campsite trip generation rate was utilized. The large yurts are 24 in diameter. The campsite trip generation rate was doubled for the large yurts to reflect the increased capacity of these eight sites. The AM/PM peak hour in- and out-trip ratios from the general campsite was applied to both yurt types. SANDAG, ITE, nor the City of San Diego have a trip generation rate for an outdoor nature center/amphitheater or similar facility. Trip generation rates for the outdoor nature center/amphitheater were developed by referencing the Unified Port District of San Diego s Bayside Performance Park Enhancement Project (outdoor amphitheater). A survey conducted in support of the Bayside Performance Park Enhancement Project determined 2.5 attendees arrive per car, on average. One arrival and one departure trip are assumed per seat, resulting in 2 total person trips per seat. Using the average vehicle occupancy information derived from the Bayside Performance Park Enhancement Project survey, a vehicular trip generation rate per seat was determined (2-person trips / 2.5-people per vehicle). Relevant excerpts from the Bayside Performance Park Enhancement Project are provided as Appendix C. Page 12 Tijuana River Valley Regional Park Campground
17 As a worst-case scenario, it was assumed that all nature center attendees would exit the project site during the PM peak period. Discussions with County staff indicated up to twenty (20) day users are also anticipated on a peak day for the horse corral and pasture. Considering these users are likely to arrive in vehicles with trailers, a PCE of 2.5 was applied for these day users, while the AM/PM peak hour in- and out-trip ratios for parks were used to better reflect the day use nature of these visitors. In addition to the trip generating land uses previously described, discussions with County staff indicated 2-3 employees will staff the Proposed Project site throughout the day. As a worst-case scenario, it was assumed that all three employees would use separate vehicles and arrive and depart during the AM and PM peak periods, respectively. Table 4-1 displays the Proposed Project trip generation, including ADT projections and AM and PM peak hour volumes. As shown, the Proposed Project is estimated to generate a total of 762 ADT on a peak day, including 58 AM peak hour trips (27-in / 32-out) and 117 PM peak hour trips (33-in / 84-out). Table 4-1 Proposed Project Tip Generation Daily AM PM Use Quantity PCE Trip Rate Trips % Trips % Trips General Campsites / site 100 7% % (3-in / 4-out) (5-in / 6-out) Multi-Use Campsites / site 380 7% % (11-in / 16-out) (18-in / 24-out) Large Yurts / site 64 7% % (2-in / 3-out) (3-in / 4-out) Small Yurts / site 32 7% % (1-in / 2-out) (2-in / 2-out) Horse Corral Day Use / user % % (7-in / 7-out) (5-in / 5-out) Nature Center / seat 80 0% % (0-in / 0-out) (0-in / 40-out) Staff / staff 6 50% % (3-in / 0-out) (0-in / 3-out) Total (27-in / 32-out) (33-in / 84-out) Source: SANDAG (Not So) Brief Guide (2002); ITE Trip Generation Manual (2012); Chen Ryan Associates (2018) 4.2 Trip Distribution & Assignment The roadway network provides two points of ingress and egress to the Proposed Project site: Hollister Street to the north, and Monument Road to the east. Both of these roads lead to Interstate 5, while Hollister Street also provides access to State Route 905. The Proposed Project trip distribution was developed considering these access points and greater network connections as well as the Proposed Project intent to serve lower income families from local neighborhoods. The trip distribution also reflects the location of the two entrances (one on Monument Road, the other on Saturn Boulevard) and the traffic associated with each entrance based on the site plan depicted in Figure 1-2. Figure 4-1 displays the Proposed Project trip distribution. Daily traffic and AM/PM peak hour project trips were assigned to the roadway network based on the Proposed Project trip distribution. Figure 4-2 displays the Proposed Project trip assignment. Page 13 Tijuana River Valley Regional Park Campground
18 Project Area Study Roadway Segment! Study Intersection HOLLISTER ST Project Driveway #1!( 1 Project Site 71% Project Driveway #2!( 2 29% SATURN BLVD 100% 40% MONUMENT RD 60%! 1 N ,000 Feet Tijuana River Valley Park Campground Figure 4-1 Proposed Project Trip Distribution
19 XX,XXX Daily Traffic Volumes AM / PM AM / PM AM / PM Peak Hour Intersection Turning Movements HOLLISTER ST Project Driveway #1!( 1 Project Site 20 / / 22 Project Driveway #2!( SATURN BLVD 12 / / MONUMENT RD 458! 1 16 / 20 0 / 0 0 / 0 11 / 13 N ,000 Feet 19 / / 34 Tijuana River Valley Park Campground Figure 4-2 Proposed Project Trip Assignment
20 5.0 Existing Plus Project Conditions This section provides an analysis of existing traffic conditions with the addition of traffic from the Proposed Project. 5.1 Existing Plus Project Study Area Traffic Volumes Existing Plus Project traffic volumes were derived by combining the existing traffic volumes (displayed in Figure 3-1) and the project trip assignment volumes (displayed in Figure 4-1). Figure 5-1 displays Existing Plus Project traffic volumes. 5.2 Existing Plus Project Traffic Operations Analysis Level of Service analyses under Existing Plus Project Conditions were conducted using the methodologies described in Chapter 2. Roadway segments and intersection LOS analysis results are discussed separately. Roadway Segment Analysis Table 5.1 displays the LOS analysis results for study area roadway segments under Existing Plus Project Conditions. Table 5.1 Roadway Segment Level of Service Existing Plus Project Conditions Roadway Segment ADT Hollister Street Monument Road LOS Threshold (LOS E) LOS Existing Conditions ADT Increase in ADT Significant Impact? North of Monument Road 1,210 8,000 A No East of Hollister Street 881 8,000 A No West of Saturn Boulevard 946 8,000 A No Saturn Boulevard to Hollister Street 910 8,000 A No Source: NDS (2017); Chen Ryan Associates (2018) As shown, all of the study area roadway segments are anticipated to operate at acceptable LOS A under Existing Plus Project conditions. Page 16 Tijuana River Valley Regional Park Campground
21 XX,XXX Daily Traffic Volumes AM / PM AM / PM AM / PM Peak Hour Intersection Turning Movements HOLLISTER ST Project Driveway #1 Project Site 946 Project Driveway #2!( 2 SATURN BLVD 11 / 11 0 / 0 0 / 0 0 / 0 12 / 13 1,210!( 1 N ,000 Feet 0 / 0 20 / 71 0 / 0 11 / / / MONUMENT RD! 1 27 / 29 4 / / / / / 16 Tijuana River Valley Park Campground Figure 5-1 Existing Plus Project Traffic Volumes
22 Intersection Analysis Table 5.2 displays intersection LOS and average vehicle delay results for the study area intersection and two Proposed Project Driveways under Existing Plus Project Conditions. LOS calculation worksheets for Existing Plus Project Conditions are provided in Appendix D. Intersection Table 5.2 Peak Hour Intersection Level of Service Results Existing Plus Project Conditions Traffic Control AM Peak Hour Avg. Delay (sec) LOS PM Peak Hour Avg. Delay (sec) LOS Existing Delay (AM/PM) Change in Delay Significant Impact? 1. Hollister Street/Monument Road SSSC 8.6 A 9.4 A 8.5 / / 0.6 No 2. Driveway #1/Monument Road SSSC 8.8 A 9.0 A N/A N/A No 3. Driveway #2/Saturn Boulevard SSSC 8.4 A 8.4 A N/A N/A No Source: Chen Ryan Associates (2018) Notes: SSSC = Side-Street-Stop Control. For SSSC intersections, the delay shown is the worst delay experienced by any of the approaches. As shown in Table 5.2, the study intersection and Proposed Project Driveways are anticipated to operate at an acceptable LOS A during the AM and PM peak hours under the Existing Plus Project Conditions. 5.3 Impact Significance and Mitigation Based upon the significance criteria presented Section 2.3 of this report, the addition of Proposed Project traffic would not be associated with any identified significant traffic-related impacts. Therefore, no mitigation measures would be required under Existing Plus Project Conditions. Page 18 Tijuana River Valley Regional Park Campground
23 6.0 Cumulative Conditions The Proposed Project is located at the southwestern most point in the United States, just north of the US- Mexico International Border and west of the Pacific Ocean, and is surrounded by lands conserved by federal, state and local jurisdictions, greatly limiting the potential for neighboring developments. Discussions with County of San Diego and City of San Diego staff did not indicate any cumulative projects in the vicinity of the Proposed Project site. The Cumulative Conditions analysis was therefore determined to be equivalent to the Existing Conditions analysis, and the Cumulative Plus Project Conditions analysis equivalent to the Existing Plus Project Conditions analysis, consequently no subsequent analyses are required. Further, the Proposed Project is consistent with the County of San Diego s General Plan and the City of San Diego s General Plan Recreation Element to develop a Regional Park, therefore, no Horizon Year analysis is required. Page 19 Tijuana River Valley Regional Park Campground
24 7.0 Project Driveways and Sight Distance Analysis The Proposed Project includes two driveways as shown in Figure 1-2 and Figure 1-3. Driveway #1 will serve as the primary campground access control/check-in booth and will be located along the north side of Monument Road, where a driveway currently exists. Driveway #2 will provide access to the equestrian sites, corral and day use parking lot, located along the west side of Saturn Boulevard, approximately 290 north of Monument Road. The following comments are based upon review of the Proposed Project site plan and conditions observed in the field: Existing vegetation and potential signage surrounding each Proposed Project driveway must be considered when constructing the driveway locations. Existing vegetation precludes adequate sight distance at Driveway #1 and #2 and should be removed or maintained in a manner that it does not obstruct sight distance. A County-controlled gate currently restricts access north of Driveway #2 along Saturn Boulevard. If this gate is anticipated to remain locked, site distance north of the driveway may not be necessary. Both Proposed Project Driveways should be side street stop-controlled intersections. The Proposed Project Driveways should be designed in accordance County standards and should have sufficient storage for traffic exiting the Proposed Project. 7.1 Sight Distance A sight distance study was performed utilizing intersection sight distance criteria found in the Caltrans Highway Design Manual to evaluate both corner and stopping sight distance. Corner Sight Distance - is measured along the direction of travel from a point on the minor road at least 10 feet from the edge of the major road pavement. It is measured from an eye height of 3.5 feet on the minor road to a height of an object 4.25 feet on the major road. Stopping Sight Distance - is measured from the driver's eyes, which are assumed to be 3½ feet above the pavement surface, to an object ½-foot high on the road. Speed - the roadway design speed is used to determine the minimum sight distance requirement, which shall be the greater than the current prevailing speed (if known) and the minimum design speed of the respective road classification. Caltrans Highway Design Manual sight distance criteria is displayed in Table 7.1 and 7.2. Page 20 Tijuana River Valley Regional Park Campground
25 Table 7.1 Standard Corner Sight Distance at Intersections Design Speed (mph) Minimum Corner Intersection Sight Distance (ft) Source: Caltrans Highway Design Manual (2016) Table 7.2 Standard Stopping Sight Distance at Intersections Design Speed (mph) Minimum Stopping Sight Distance (ft) Source: Caltrans Highway Design Manual (2016) 7.2 Field Review/Calculations An engineering field study was conducted for the Proposed Project Driveways utilizing the aforementioned methods to determine the corner sight distance. Along the Proposed Project frontage, Monument Road is a 2-lane roadway with no median and 10-foot wide travel lanes in each direction. The posted speed limit on Monument Road, just east of Driveway #1 is 15 MPH. Saturn Boulevard is an unimproved 2-lane dirt road with no posted speed limit. To be conservative, a speed limit of 25 MPH was assumed for both Monument Road and Saturn Boulevard. Figures 7-1 through Figure 7-4 display the driver s view from Proposed Project Driveway #1 looking towards the east-west directions, as well as the view of a driver approaching the Proposed Project Driveway along Monument Road. Figures 7-5 through Figure 7-8 display the driver s view from Proposed Project Driveway #2 looking towards the north-south directions, as well as the view of a driver approaching the Proposed Project Driveway along Saturn Boulevard. Page 21 Tijuana River Valley Regional Park Campground


26 Figure 7-1 Corner Sight Distance Looking East on Monument Road from Driveway #1 70 Figure 7-2 Corner Sight Distance Looking West on Monument Road from Driveway #1 117 Page 22 Tijuana River Valley Regional Park Campground


27 Figure 7-3 Stopping Sight Distance Looking West on Monument Road towards Driveway #1 63 Figure 7-4 Stopping Sight Distance Looking East on Monument Road towards Driveway #1 123 Page 23 Tijuana River Valley Regional Park Campground


28 Figure 7-5 Corner Sight Distance Looking North on Saturn Boulevard from Driveway #2 430 Figure 7-6 Corner Sight Distance Looking South on Saturn Boulevard from Driveway #2 205 Page 24 Tijuana River Valley Regional Park Campground


29 Figure 7-7 Stopping Sight Distance Looking North on Saturn Boulevard towards Driveway #2 315 Figure 7-8 Stopping Sight Distance Looking South on Saturn Boulevard towards Driveway #2 197 Page 25 Tijuana River Valley Regional Park Campground
30 Table 7.3 displays the design speed, the measured sight distances, the respective minimum corner and stopping sight distance requirements, and whether or not the existing sight distance is adequate. Location Speed Limit Table 7.3 Sight Distance Analysis Results Measured (ft) Corner Sight Distance Required (ft) Adequate? Measured (ft) Stopping Sight Distance Required (ft) Adequate? East of Driveway # No No West of Driveway # No No North of Driveway # No Yes South of Driveway # Yes Yes Source: Caltrans Highway Design Manual (2016); Chen Ryan Associates (2018) As shown in the table above, with the exception of south of Proposed Project Driveway #2, the Proposed Project Driveways do not currently meet Caltrans sight distance requirements due to the presence of vegetation. Following Proposed Project construction, yet prior to Proposed Project opening, it is recommended that the vegetation is removed or trimmed and maintained, and a new sight distance study is conducted showing adequate sight distances are provided in accordance with Caltrans standards. Page 26 Tijuana River Valley Regional Park Campground
31 8.0 Summary of Findings The following points summarize the roadway segment analysis: 1. Existing Conditions All roadway segments within the project study area operate at LOS A under the Existing Conditions and are projected to continue operating at LOS A under Existing Plus Project Conditions. 2. Cumulative Conditions (Near-Term) No cumulative projects were identified within the vicinity of the project study area. Additional neighboring development(s) are not likely due to the conservation of land adjacent to the Proposed Project site and throughout the Tijuana River Valley by federal, state and local jurisdictions. Cumulative Conditions were therefore determined to be equivalent to Existing Conditions, and Cumulative Plus Project Conditions equivalent to Existing Plus Project Conditions. Consequently, roadway segments within the project study area are projected to continue operating at LOS A under Cumulative and Cumulative Plus Project Conditions. The following points summarize the intersection analysis: 1. Existing Conditions The study intersection currently operates at LOS A under Existing Conditions and is projected to continue to operate at LOS A under Existing Plus Project Conditions. Additionally, both Proposed Project Driveways are projected to operate at LOS A under Existing Plus Project Conditions. 2. Cumulative Conditions (Near-Term) Conditions No cumulative projects were identified within the vicinity of the project study area. Additional neighboring development(s) are not likely due to the conservation of land adjacent to the Proposed Project site and throughout the Tijuana River Valley by federal, state and local jurisdictions. Cumulative Conditions were therefore determined to be equivalent to Existing Conditions, and Cumulative Plus Project Conditions equivalent to Existing Plus Project Conditions. Consequently, the study intersection and Proposed Project Driveways are projected to continue to operate at LOS A under Cumulative and Cumulative Plus Project Conditions. The following point summarizes the sight distance analysis: 1. The Proposed Project Driveways do not currently meet Caltrans sight distance requirements due to the presence of vegetation. Following Proposed Project construction, yet prior to Proposed Project opening, it is recommended that a new sight distance study be conducted showing adequate sight distances are provided in accordance with Caltrans standards. 8.1 Conclusions As noted in the previous chapters, it was found that the Proposed Project trip generation would not be sufficient to result in traffic impacts at the study area roadway segments and intersection and Proposed Project Driveways. Therefore, the development of the Proposed Project will not be associated with any significant transportation related impacts. Sight distance was obstructed by existing vegetation at both Proposed Project Driveways. Following Proposed Project construction, yet prior to Proposed Project opening, it is recommended that the vegetation is removed or trimmed and maintained, and a new sight distance study is conducted showing adequate sight distances are provided in accordance with Caltrans standards. Page 27 Tijuana River Valley Regional Park Campground
32 Appendix A Traffic Counts Tijuana River Valley Regional Park Campground
33 Day: Wednesday Date: 11/1/2017 DAILY TOTALS Prepared by NDS/ATD VOLUME Monument Rd Fronting the Proposed Project Site W/O Saturn Blvd NB SB EB WB City: San Diego Project #: CA17_4336_001 Total 184 AM Period NB SB EB WB TOTAL PM Period NB SB EB WB 00: : : : : : : : : : : : : : : : : : : : : : : : : : : : : : : : : : : : : : : : : : : : : : : : : : : : : : : : : : : : : : : : : : : : : : : : : : : : : : : : : : : : : : : : : : : : : : : : TOTALS TOTALS SPLIT % 50.7% 49.3% 39.7% SPLIT % 53.2% 46.8% 60.3% DAILY TOTALS DAILY TOTALS NB SB EB WB AM Peak Hour 09:45 10:30 10:30 PM Peak Hour 14:15 14:00 14:00 AM Pk Volume PM Pk Volume Pk Hr Factor Pk Hr Factor Volume Volume Peak Hour 08:00 08:00 08: Peak Hour 17:00 16:00 16: Pk Volume Pk Volume Pk Hr Factor Pk Hr Factor TOTAL Total 184
34 Day: Wednesday Date: 11/1/2017 Prepared by NDS/ATD VOLUME Monument Rd W/O Hollister St City: San Diego Project #: CA17_4336_002 DAILY TOTALS NB SB EB WB Total 368 AM Period NB SB EB WB TOTAL PM Period NB SB EB WB 00: : : : : : : : : : : : : : : : : : : : : : : : : : : : : : : : : : : : : : : : : : : : : : : : : : : : : : : : : : : : : : : : : : : : : : : : : : : : : : : : : : : : : : : : : : : : : : : : TOTALS TOTALS SPLIT % 47.3% 52.7% 44.8% SPLIT % 55.2% 44.8% 55.2% DAILY TOTALS DAILY TOTALS NB SB EB WB AM Peak Hour 11:00 10:30 10:30 PM Peak Hour 14:45 13:45 14:15 AM Pk Volume PM Pk Volume Pk Hr Factor Pk Hr Factor Volume Volume Peak Hour 07:00 07:00 07: Peak Hour 16:00 16:00 16: Pk Volume Pk Volume Pk Hr Factor Pk Hr Factor TOTAL Total 368
35 Day: Wednesday Date: 11/1/2017 Prepared by NDS/ATD VOLUME Monument Rd E/O Hollister St City: San Diego Project #: CA17_4336_003 DAILY TOTALS NB SB EB WB Total 576 AM Period NB SB EB WB TOTAL PM Period NB SB EB WB 00: : : : : : : : : : : : : : : : : : : : : : : : : : : : : : : : : : : : : : : : : : : : : : : : : : : : : : : : : : : : : : : : : : : : : : : : : : : : : : : : : : : : : : : : : : : : : : : : TOTALS TOTALS SPLIT % 39.3% 60.7% 30.0% SPLIT % 46.9% 53.1% 70.0% DAILY TOTALS DAILY TOTALS NB SB EB WB AM Peak Hour 11:30 08:45 08:45 PM Peak Hour 13:30 14:30 15:30 AM Pk Volume PM Pk Volume Pk Hr Factor Pk Hr Factor Volume Volume Peak Hour 08:00 07:00 08: Peak Hour 16:00 16:00 16: Pk Volume Pk Volume Pk Hr Factor Pk Hr Factor TOTAL Total 576
36 Day: Wednesday Date: 11/1/2017 Prepared by NDS/ATD VOLUME Hollister St N/O Monument Rd City: San Diego Project #: CA17_4336_004 DAILY TOTALS NB SB EB WB Total 752 AM Period NB SB EB WB TOTAL PM Period NB SB EB WB 00: : : : : : : : : : : : : : : : : : : : : : : : : : : : : : : : : : : : : : : : : : : : : : : : : : : : : : : : : : : : : : : : : : : : : : : : : : : : : : : : : : : : : : : : : : : : : : : : TOTALS TOTALS SPLIT % 53.9% 46.1% 33.8% SPLIT % 55.0% 45.0% 66.2% DAILY TOTALS DAILY TOTALS NB SB EB WB AM Peak Hour 11:45 08:45 11:45 PM Peak Hour 14:30 14:15 14:30 AM Pk Volume PM Pk Volume Pk Hr Factor Pk Hr Factor Volume Volume Peak Hour 07:00 08:00 07: Peak Hour 16:00 16:00 16: Pk Volume Pk Volume Pk Hr Factor Pk Hr Factor TOTAL Total 752

37 ID: City: San Diego Prepared by National Data & Surveying Services Hollister St & Monument Rd Peak Hour Turning Movement Count Hollister St SOUTHBOUND Day: Wednesday Date: 11/01/2017 PEAK HOURS 07:00 AM - 08:00 AM NONE 04:00 PM - 05:00 PM AM AM NOON NOON PM PM 07:00 AM - 09:00 AM NONE 04:00 PM - 06:00 PM COUNT PERIODS AM NOON PM PM NOON AM Monument Rd EASTBOUND CONTROL Way Stop(SB) TEV AM NOON PM PHF WESTBOUND Monument Rd AM NOON PM PM NOON AM Total Vehicles (AM) Total Vehicles (NOON) PM PM NOON NOON AM AM NORTHBOUND Hollister St Total Vehicles (AM) Total Vehicles (NOON) Pedestrians (Crosswalks) Total Vehicles (PM) PM NOON AM AM NOON PM PM NOON AM AM NOON PM Total Vehicles (PM) PM NOON AM AM NOON PM PM NOON AM AM NOON PM `
38 Appendix B Peak Hour Intersection Capacity Worksheets Existing Conditions Tijuana River Valley Regional Park Campground
39 HCM 2010 TWSC 1: Monument Road & Hollister Street 09/20/2018 Intersection Int Delay, s/veh 4.7 Movement EBL EBT WBT WBR SBL SBR Lane Configurations Traffic Vol, veh/h Future Vol, veh/h Conflicting Peds, #/hr Sign Control Free Free Free Free Stop Stop RT Channelized - None - None - None Storage Length Veh in Median Storage, # Grade, % Peak Hour Factor Heavy Vehicles, % Mvmt Flow Major/Minor Major1 Major2 Minor2 Conflicting Flow All Stage Stage Critical Hdwy Critical Hdwy Stg Critical Hdwy Stg Follow-up Hdwy Pot Cap-1 Maneuver Stage Stage Platoon blocked, % Mov Cap-1 Maneuver Mov Cap-2 Maneuver Stage Stage Approach EB WB SB HCM Control Delay, s HCM LOS A Minor Lane/Major Mvmt EBL EBT WBT WBR SBLn1 Capacity (veh/h) HCM Lane V/C Ratio HCM Control Delay (s) HCM Lane LOS A A - - A HCM 95th %tile Q(veh) Existing AM AM Base.syn Synchro 10 Report
40 HCM 2010 TWSC 1: Monument Road & Hollister Street 09/20/2018 Intersection Int Delay, s/veh 4.3 Movement EBL EBT WBT WBR SBL SBR Lane Configurations Traffic Vol, veh/h Future Vol, veh/h Conflicting Peds, #/hr Sign Control Free Free Free Free Stop Stop RT Channelized - None - None - None Storage Length Veh in Median Storage, # Grade, % Peak Hour Factor Heavy Vehicles, % Mvmt Flow Major/Minor Major1 Major2 Minor2 Conflicting Flow All Stage Stage Critical Hdwy Critical Hdwy Stg Critical Hdwy Stg Follow-up Hdwy Pot Cap-1 Maneuver Stage Stage Platoon blocked, % Mov Cap-1 Maneuver Mov Cap-2 Maneuver Stage Stage Approach EB WB SB HCM Control Delay, s HCM LOS A Minor Lane/Major Mvmt EBL EBT WBT WBR SBLn1 Capacity (veh/h) HCM Lane V/C Ratio HCM Control Delay (s) HCM Lane LOS A A - - A HCM 95th %tile Q(veh) Existing PM PM Base.syn Synchro 10 Report
Bennett Pit. Traffic Impact Study. J&T Consulting, Inc. Weld County, Colorado. March 3, 2017
 Bennett Pit Traffic Impact Study J&T Consulting, Inc. Weld County, Colorado March 3, 217 Prepared By: Sustainable Traffic Solutions, Inc. http://www.sustainabletrafficsolutions.com/ Joseph L. Henderson,
Traffic Impact Analysis Update
 Willow Bend Traffic Impact Analysis Update TABLE OF CONTENTS Page I. INTRODUCTION -------------------------------------------------------------------------------------------- 1 II. EXISTING CONDITIONS
D & B COMMERCIAL TRAFFIC IMPACT ANALYSIS
 D & B COMMERCIAL TRAFFIC IMPACT ANALYSIS TABLE OF CONTENTS I. Introduction...3 II. Project Description...3 III. Existing Conditions...3 IV. Future Traffic Conditions...8 V. Conclusions and Mitigation...14
One Harbor Point Residential
 Residential Gig Harbor, WA Transportation Impact Analysis January 23, 2017 Prepared for: Neil Walter Company PO Box 2181 Tacoma, WA 98401 Prepared by: TENW Transportation Engineering NorthWest 11400 SE
APPENDIX A LEVEL OF SERVICE CONCEPTS, ANALYSIS METHODOLOGIES,STANDARDS OF SIGNIFICANCE
 APPENDIX A LEVEL OF SERVICE CONCEPTS, ANALYSIS METHODOLOGIES,STANDARDS OF SIGNIFICANCE Roadway Segment Level of Service Definitions LOS V/C Congestion/Delay Traffic Description (Used for surface streets,
830 Main Street Halifax Regional Municipality
 830 Main Street Halifax Regional Municipality Traffic Impact Statement Final Report Prepared by: GRIFFIN transportation group inc. 30 Bonny View Drive Fall River, NS B2T 1R2 www.griffininc.ca Prepared
APPENDICES. No Cumulative Impact Project Alternative Traffic Analysis Memorandum (May 2016)
") APPENDICES Appendix T No Cumulative Impact Project Alternative Traffic Analysis Memorandum (May 2016) 661 Bear Valley Parkway EIR March 2017 APPENDICES This page intentionally left blank 661 Bear Valley
APPENDICES Appendix T No Cumulative Impact Project Alternative Traffic Analysis Memorandum (May 2016) 661 Bear Valley Parkway EIR March 2017 APPENDICES This page intentionally left blank 661 Bear Valley
Weaver Road Senior Housing Traffic Impact Analysis
 Gibson Traffic Consultants, Inc. 2813 Rockefeller Avenue Suite B Everett, WA 9821 425.339.8266 Weaver Road Senior Housing Traffic Impact Analysis Jurisdiction: City of Snohomish January 218 GTC #17-37
LOST LAKE CORRIDOR REVIEW
 LOST LAKE CORRIDOR REVIEW Prepared for: Prepared by: Broadview Developments Inc. c/o Westbrook Consulting Watt Consulting Group Our File: 2064.B01 Date: October 31, 2016 TABLE OF CONTENTS 1.0 INTRODUCTION...
June 21, Mr. Jeff Mark The Landhuis Company 212 North Wahsatch Avenue, Suite 301. Colorado Springs, CO 80903
 LSC TRANSPORTATION CONSULTANTS, INC. 545 East Pikes Peak Avenue, Suite 210 Colorado Springs, CO 80903 (719) 633-2868 FAX (719) 633-5430 E-mail: lsc@lsctrans.com Website: http://www.lsctrans.com June 21,
 Traffic Analysis For Approved Uses within the St. Lucie West DRI Aldi Port St. Lucie, FL Prepared for: Bohler Engineering, LLC 1000 Corporate Drive Suite 250 Fort Lauderdale, FL 33334 Prepared by: 10795
Ryan Coyne, PE City Engineer City of Rye 1051 Boston Post Road Rye, NY Boston Post Road Realignment and Roundabout Design Report
 March 6, 2015 Ryan Coyne, PE City Engineer City of Rye 1051 Boston Post Road Rye, NY 10580 RE: JMC Project 14108 Boston Post Road Roundabout Boston Post Road and Parsons Street City of Rye, NY Dear Ryan:
Table Existing Traffic Conditions for Arterial Segments along Construction Access Route. Daily
 5.8 TRAFFIC, ACCESS, AND CIRCULATION This section describes existing traffic conditions in the project area; summarizes applicable regulations; and analyzes the potential traffic, access, and circulation
Proposed Pit Development
 July 5, 2017 via email: sam@greenwoodconst.ca CCTA File 114239 Sam Greenwood Greenwood Aggregates 205467 County Road 109 Amaranth, ON L9W 0V1 Re: Proposed Violet Hill Gravel Pit, Town of Mono Traffic Review
APPENDIX J LAKE WOHLFORD DAM REPLACEMENT PROJECT TRAFFIC IMPACT ANALYSIS (DAM REPLACEMENT) Lake Wohlford Dam Replacement Project EIR
 Lake Wohlford Dam Replacement Project EIR") APPENDIX J LAKE WOHLFORD DAM REPLACEMENT PROJECT TRAFFIC IMPACT ANALYSIS (DAM REPLACEMENT) Replacement Project EIR Appendices TRAFFIC IMPACT ANALYSIS LAKE WOHLFORD DAM Escondido, California December 19,
APPENDIX J LAKE WOHLFORD DAM REPLACEMENT PROJECT TRAFFIC IMPACT ANALYSIS (DAM REPLACEMENT) Replacement Project EIR Appendices TRAFFIC IMPACT ANALYSIS LAKE WOHLFORD DAM Escondido, California December 19,
Escondido Marriott Hotel and Mixed-Use Condominium Project TRAFFIC IMPACT ANALYSIS REPORT
 Escondido Marriott Hotel and Mixed-Use Condominium Project TRAFFIC IMPACT ANALYSIS REPORT Prepared for Phelps Program Management 420 Sixth Avenue, Greeley, CO 80632 Prepared by 5050 Avenida Encinas, Suite
Oakbrook Village Plaza City of Laguna Hills
 Oakbrook Village Plaza City of Laguna Hills Traffic Impact Analysis Prepared by: HDR Engineering 3230 El Camino Real, Suite 200 Irvine, CA 92602 October 2012 Revision 3 D-1 Oakbrook Village Plaza Laguna
APPENDIX B Traffic Analysis
 APPENDIX B Traffic Analysis Rim of the World Unified School District Reconfiguration Prepared for: Rim of the World School District 27315 North Bay Road, Blue Jay, CA 92317 Prepared by: 400 Oceangate,
L1TILE BEARS DAY CARE TRANSPORTATION IMPACT STUDY FORT COLLINS, COLORADO MAY Prepared for:
 L1TILE BEARS DAY CARE TRANSPORTATION IMPACT STUDY FORT COLLINS, COLORADO MAY 2012 Prepared for: Hillside Construction, Inc. 216 Hemlock Street, Suite B Fort Collins, CO 80534 Prepared by: DELICH ASSOCIATES
MADERAS HOTEL TRANSPORTATION IMPACT ANALYSIS. LLG Ref Transportation Planner III & Jorge Cuyuch Transportation Engineer I
 TRANSPORTATION IMPACT ANALYSIS MADERAS HOTEL Poway, California June 21, 2016 LLG Ref. 3-16-2602 Prepared by: Amelia Giacalone Transportation Planner III & Jorge Cuyuch Transportation Engineer I Under the
Parking/Traffic Assessment Study
 Brock Road Industrial Mall 985 Brock Road South City of Pickering Parking/Traffic Assessment Study Prepared by: Tranplan Associates, Toronto Toronto 416-670-2005 Sudbury 705-522-0272 Peterborough 705-874-3638
Aldridge Transportation Consultants, LLC Advanced Transportation Planning and Traffic Engineering
 Aldridge Transportation Consultants, LLC Advanced Transportation Planning and Traffic Engineering John M.W. Aldridge, PE, PTOE, AICP 1082 Chimney Rock Road Colorado Registered Professional Engineer Highlands
Traffic Engineering Study
 Traffic Engineering Study Bellaire Boulevard Prepared For: International Management District Technical Services, Inc. Texas Registered Engineering Firm F-3580 November 2009 Executive Summary has been requested
Date: February 7, 2017 John Doyle, Z-Best Products Robert Del Rio. T.E. Z-Best Traffic Operations and Site Access Analysis
 Memorandum Date: February 7, 07 To: From: Subject: John Doyle, Z-Best Products Robert Del Rio. T.E. Z-Best Traffic Operations and Site Access Analysis Introduction Hexagon Transportation Consultants, Inc.
TRAFFIC IMPACT ANALYSIS FOR. McDONALD S RESTAURANT IN CARMICAEL Sacramento County, CA. Prepared For:
 TRAFFIC IMPACT ANALYSIS FOR McDONALD S RESTAURANT IN CARMICAEL Sacramento County, CA Prepared For: McDonald s USA, LLC Pacific Sierra Region 2999 Oak Road, Suite 900 Walnut Creek, CA 94597 Prepared By:
DIVISION STREET PLAT TRAFFIC IMPACT ANALYSIS
 DIVISION STREET PLAT TRAFFIC IMPACT ANALYSIS TABLE OF CONTENTS 1. Introduction...3 2. Project Description...3 3. Existing Conditions...3 4. Forecast Traffic Demand and Analysis...12 5. Conclusions and
KUM & GO 6400 WESTOWN PARKWAY WEST DES MOINES, IOWA 50266
 KUM & GO #300 PECOS STREET & 88 TH AVENUE THORNTON, COLORADO TRAFFIC IMPACT STUDY REVISION 1 PREPARED FOR KUM & GO 6400 WESTOWN PARKWAY WEST DES MOINES, IOWA 50266 JANUARY 23, 2014 OA PROJECT NO. 013-1721
TRAFFIC IMPACT ANALYSIS SAFARI HIGHLANDS RANCH
 TRAFFIC IMPACT ANALYSIS SAFARI HIGHLANDS RANCH, California November 11, 2016 LLG Ref. 3-14-2334 EXECUTIVE SUMMARY The Project proposes the development of 550 luxury residential dwelling units, public trails,
LAWRENCE TRANSIT CENTER LOCATION ANALYSIS 9 TH STREET & ROCKLEDGE ROAD / 21 ST STREET & IOWA STREET LAWRENCE, KANSAS
 LAWRENCE TRANSIT CENTER LOCATION ANALYSIS 9 TH STREET & ROCKLEDGE ROAD / 21 ST STREET & IOWA STREET LAWRENCE, KANSAS TRAFFIC IMPACT STUDY FEBRUARY 214 OA Project No. 213-542 TABLE OF CONTENTS 1. INTRODUCTION...
APPENDIX C1 TRAFFIC ANALYSIS DESIGN YEAR TRAFFIC ANALYSIS
 APPENDIX C1 TRAFFIC ANALYSIS DESIGN YEAR TRAFFIC ANALYSIS DESIGN YEAR TRAFFIC ANALYSIS February 2018 Highway & Bridge Project PIN 6754.12 Route 13 Connector Road Chemung County February 2018 Appendix
Traffic Impact Analysis 5742 BEACH BOULEVARD MIXED USE PROJECT
 Traffic Impact Analysis 5742 BEACH BOULEVARD MIXED USE PROJECT CITY OF BUENA PARK Prepared by Project No. 14139 000 April 17 th, 2015 DKS Associates Jeffrey Heald, P.E. Rohit Itadkar, T.E. 2677 North Main
Quantitative analyses of weekday a.m. and p.m. commuter hour conditions have been conducted for the following five scenarios:
 6.1 TRANSPORTATION AND CIRCULATION 6.1.1 INTRODUCTION This section of the EIR presents the results of TJKM s traffic impact analysis of the proposed Greenbriar Development. The analysis includes consideration
The major roadways in the study area are State Route 166 and State Route 33, which are shown on Figure 1-1 and described below:
 3.5 TRAFFIC AND CIRCULATION 3.5.1 Existing Conditions 3.5.1.1 Street Network DRAFT ENVIRONMENTAL IMPACT REPORT The major roadways in the study area are State Route 166 and State Route 33, which are shown
ZINFANDEL LANE / SILVERADO TRAIL INTERSECTION TRAFFIC ANALYSIS
 ZINFANDEL LANE / SILVERADO TRAIL INTERSECTION TRAFFIC ANALYSIS UPDATED TRAFFIC STUDY FOR THE PROPOSED RAYMOND VINEYARDS WINERY USE PERMIT MODIFICATION #P11-00156 AUGUST 5, 2014 PREPARED BY: OMNI-MEANS,
APPENDIX H. Transportation Impact Study
 APPENDIX H Transportation Impact Study BUENA VISTA LAGOON ENHANCEMENT PROJECT TRANSPORTATION IMPACT STUDY Prepared for: San Diego Association of Governments Prepared by: VRPA Technologies, Inc. 9520 Padgett
FIRGROVE ELEMENTARY TRAFFIC IMPACT ANALYSIS
 1 FIRGROVE ELEMENTARY TRAFFIC IMPACT ANALYSIS TABLE OF CONTENTS I. Introduction... 3 II. Project Description... 3 III. Existing Conditions... 6 IV. Future Traffic Demand... 10 V. Conclusions and Mitigation...
Sweetwater Landing Traffic Impact Analysis
 Gibson Traffic Consultants, Inc. 8 Rockefeller Avenue Suite B Everett, WA 98 45.9.8 Sweetwater Landing Traffic Impact Analysis Jurisdiction: City of Snohomish February 8 GTC #7-87 Sweetwater Landing Traffic
INTERCHANGE OPERTIONS STUDY Interstate 77 / Wallings Road Interchange
 INTERCHANGE OPERTIONS STUDY Interstate 77 / Wallings Road Interchange City of Broadview Heights, Cuyahoga County, Ohio Prepared For: City of Broadview Heights Department of Engineering 9543 Broadview Road
TALMONT TOWNHOMES MADISON KENNETH SPA TRAFFIC IMPACT STUDY. Sacramento, CA. Prepared For: MBK Homes. Prepared By:
 TALMONT TOWNHOMES MADISON KENNETH SPA TRAFFIC IMPACT STUDY Sacramento, CA Prepared For: MBK Homes Prepared By: KD Anderson & Associates 3853 Taylor Road, Suite G Loomis, California 95650 (916) 660-1555
Alpine Highway to North County Boulevard Connector Study
 Alpine Highway to North County Boulevard Connector Study prepared by Avenue Consultants March 16, 2017 North County Boulevard Connector Study March 16, 2017 Table of Contents 1 Summary of Findings... 1
TRAFFIC IMPACT ANALYSIS 661 BEAR VALLEY. Escondido, California September 1, LLG Ref
 TRAFFIC IMPACT ANALYSIS 661 BEAR VALLEY Escondido, California September 1, 2015 LLG Ref. 3-13-2299 EXECUTIVE SUMMARY The Project (Project) proposes the development of 55 residential dwelling units on 40.88
Traffic Impact Study Hudson Street Parking Garage MC Project No.: A Table of Contents
 Traffic Impact Study Hudson Street Parking Garage MC Project No.: 15001714A Table of Contents Table of Contents I. INTRODUCTION... 1 II. EXISTING CONDITIONS... 4 III. 2015 EXISTING TRAFFIC CONDITIONS...
JOHNSON RANCH RAPID CITY, SOUTH DAKOTA TRAFFIC IMPACT ANALYSIS
 JOHNSON RANCH RAPID CITY, SOUTH DAKOTA TRAFFIC IMPACT ANALYSIS Prepared for: KTM Design Solutions 528 Kansas City Street, Suite 1 Rapid City, SD 57701 Prepared by: Felsburg Holt & Ullevig 6300 South Syracuse
EXECUTIVE SUMMARY. The following is an outline of the traffic analysis performed by Hales Engineering for the traffic conditions of this project.
 EXECUTIVE SUMMARY This study addresses the traffic impacts associated with the proposed Shopko redevelopment located in Sugarhouse, Utah. The Shopko redevelopment project is located between 1300 East and
APPENDIX E. Traffic Analysis Report
 APPENDIX E Traffic Analysis Report THIS PAGE INTENTIONALLY BLANK EAGLE RIVER TRAFFIC MITIGATION PHASE I OLD GLENN HIGHWAY/EAGLE RIVER ROAD INTERSECTION IMPROVEMENTS TRAFFIC ANALYSIS Eagle River, Alaska
TRAFFIC IMPACT ANALYSIS WESTMINSTER SEMINARY. Escondido, California June 25, LLG Ref Transportation Engineer II
 TRAFFIC IMPACT ANALYSIS WESTMINSTER SEMINARY Escondido, California June 25, 2015 LLG Ref. 3-15-2420 Prepared by: Pedram Massoudi Transportation Engineer II Under the Supervision of: John Boarman, P.E.
10 th Street Residences Development Traffic Impact Analysis
 Gibson Traffic Consultants, Inc. 2813 Rockefeller Avenue Suite B Everett, WA 98201 425.339.8266 10 th Street Residences Development Traffic Impact Analysis Jurisdiction: City of Snohomish September 2018
V. DEVELOPMENT OF CONCEPTS
 Martin Luther King, Jr. Drive Extension FINAL Feasibility Study Page 9 V. DEVELOPMENT OF CONCEPTS Throughout the study process several alternative alignments were developed and eliminated. Initial discussion
TRAFFIC IMPACT STUDY FOR SONIC DRIVE-IN RESTAURANT. Vallejo, CA. Prepared For:
 TRAFFIC IMPACT STUDY FOR SONIC DRIVE-IN RESTAURANT Vallejo, CA Prepared For: ELITE DRIVE-INS, INC. 2190 Meridian Park Blvd, Suite G Concord, CA 94520 Prepared By: KD Anderson & Associates 3853 Taylor Road,
Winnetka Avenue Bike Lanes Traffic Impact Analysis
 Winnetka Avenue Bike Lanes Traffic Impact Analysis January 4, 2019 Prepared by City of Los Angeles Department of Transportation Active Transportation Division Winnetka Ave Bike Lanes Traffic Impact Analysis
TRAFFIC SIGNAL DESIGN REPORT KING OF PRUSSIA ROAD & RAIDER ROAD RADNOR TOWNSHIP PENNSYLVANIA
 TRAFFIC SIGNAL DESIGN REPORT KING OF PRUSSIA ROAD & RAIDER ROAD RADNOR TOWNSHIP PENNSYLVANIA PREPARED FOR: UNIVERSITY OF PENNSYLVANIA HEALTH SYSTEM 34 CIVIC CENTER BOULEVARD PHILADELPHIA, PA 1987 (61)
King Soopers #116 Thornton, Colorado
 Traffic Impact Study King Soopers #116 Thornton, Colorado Prepared for: Galloway & Company, Inc. T R A F F I C I M P A C T S T U D Y King Soopers #116 Thornton, Colorado Prepared for Galloway & Company
MEMORANDUM. Date: November 4, Cheryl Burrell, Pebble Beach Company. Rob Rees, P.E. Inclusionary Housing Transportation Analysis WC
 MEMORANDUM Date: November 4, 2013 To: From: Subject: Cheryl Burrell, Pebble Beach Company Rob Rees, P.E. Inclusionary Housing Transportation Analysis As requested, Fehr & Peers is providing clarification
County State Aid Highway 30 (Diffley Road) and Dodd Road Intersection Study
 and Dodd Road Intersection Study") County State Aid Highway 30 (Diffley Road) and Dodd Road Intersection Study City of Eagan, Dakota County, Minnesota Date: March 2012 Project No. 14957.000 444 Cedar Street, Suite 1500 Saint Paul, MN 55101
County State Aid Highway 30 (Diffley Road) and Dodd Road Intersection Study City of Eagan, Dakota County, Minnesota Date: March 2012 Project No. 14957.000 444 Cedar Street, Suite 1500 Saint Paul, MN 55101
Table of Contents. Traffic Impact Analysis Capital One Building at Schilling Place
 Traffic Impact Analysis Capital One Building at Schilling Place Table of Contents Executive Summary... 1 1. Introduction... 4 2. Project Description... 4 3. Background Information... 4 4. Study Scope...
MILLERSVILLE PARK TRAFFIC IMPACT ANALYSIS ANNE ARUNDEL COUNTY, MARYLAND
 MILLERSVILLE PARK TRAFFIC IMPACT ANALYSIS ANNE ARUNDEL COUNTY, MARYLAND Prepared for: Department of Public Works Anne Arundel County Prepared by: URS Corporation 4 North Park Drive, Suite 3 Hunt Valley,
Craig Scheffler, P.E., PTOE HNTB North Carolina, P.C. HNTB Project File: Subject
 TECHNICAL MEMORANDUM To Kumar Neppalli Traffic Engineering Manager Town of Chapel Hill From Craig Scheffler, P.E., PTOE HNTB North Carolina, P.C. Cc HNTB Project File: 38435 Subject Obey Creek TIS 2022
MEMORANDUM. Figure 1. Roundabout Interchange under Alternative D
 MEMORANDUM Date: To: Liz Diamond, Dokken Engineering From: Subject: Dave Stanek, Fehr & Peers Western Placerville Interchanges 2045 Analysis RS08-2639 Fehr & Peers has completed a transportation analysis
Section 5.0 ENVIRONMENTAL ANALYSIS
 Section 5.0 ENVIRONMENTAL ANALYSIS 5.2 TRANSPORTATION/CIRCULATION/PARKING This section evaluates potential traffic-related and parking impacts associated with the proposed project. The following discussion
IV. REVISIONS TO THE DRAFT IS/MND
 IV. REVISIONS TO THE DRAFT IS/MND 1. REVISIONS TO THE DRAFT IS/MND This section presents corrections and clarifications that have been made to the text of the Draft IS/MND. These changes include revisions
Half Moon Bay North Apartment Block Transportation Impact Assessment. Full Report. March 15, Prepared for: Mattamy Homes.
 Half Moon Bay North Apartment Block Transportation Impact Assessment Full Report March 15, 2018 Prepared for: Mattamy Homes Prepared by: Stantec Consulting Ltd. Table of Contents 1.0 SCREENING... 1 1.1
Section 5.0 Traffic Information
 Section 5.0 Traffic Information 10.0 TRANSPORTATION MDM Transportation Consultants, Inc. (MDM) has prepared an evaluation of transportation impacts for the proposed evaluation for the expansion of the
APPENDICES. Appendix R Traffic Impact Analysis (January 2017)
") APPENDICES Appendix R Traffic Impact Analysis (January 2017) 661 Bear Valley Parkway EIR March 2017 APPENDICES This page intentionally left blank 661 Bear Valley Parkway EIR March 2017 TRAFFIC IMPACT ANALYSIS
APPENDICES Appendix R Traffic Impact Analysis (January 2017) 661 Bear Valley Parkway EIR March 2017 APPENDICES This page intentionally left blank 661 Bear Valley Parkway EIR March 2017 TRAFFIC IMPACT ANALYSIS
Traffic Impact Statement (TIS)
") Traffic Impact Statement (TIS) Vincentian PUDA Collier County, FL 10/18/2013 Prepared for: Global Properties of Naples Prepared by: Trebilcock Consulting Solutions, PA 2614 Tamiami Trail N, Suite 615 1205
Traffic Impact Statement (TIS) Vincentian PUDA Collier County, FL 10/18/2013 Prepared for: Global Properties of Naples Prepared by: Trebilcock Consulting Solutions, PA 2614 Tamiami Trail N, Suite 615 1205
4.14 TRANSPORTATION AND CIRCULATION
 4.14 TRANSPORTATION AND CIRCULATION 4.14.1 Summary Table 4.14-1 summarizes the identified environmental impacts, proposed mitigation measures, and residual impacts of the proposed project with regard to
Proposed location of Camp Parkway Commerce Center. Vicinity map of Camp Parkway Commerce Center Southampton County, VA
 Proposed location of Camp Parkway Commerce Center Vicinity map of Camp Parkway Commerce Center Southampton County, VA Camp Parkway Commerce Center is a proposed distribution and industrial center to be
INDUSTRIAL DEVELOPMENT
 INDUSTRIAL DEVELOPMENT Traffic Impact Study Plainfield, Illinois August 2018 Prepared for: Seefried Industrial Properties, Inc. TABLE OF CONTENTS Executive Summary 2 Introduction 3 Existing Conditions
Rockingham Ridge Plaza Commercial Development Halifax Regional Municipality
 Rockingham Ridge Plaza Commercial Development Halifax Regional Municipality Traffic Impact Study Final Draft Report Prepared by: GRIFFIN transportation group inc. 30 Bonny View Drive Fall River, NS B2T
Appendix H: Construction Impacts H-2 Transportation
 Appendix H: Construction Impacts H-2 Transportation \ AECOM 71 W. 23 rd Street New York, NY 10010 www.aecom.com 212 366 6200 tel 212 366 6214 fax Memorandum To CC Subject Robert Conway Donald Tone Construction
APPENDICES. APPENDIX D Synchro Level of Service Output Sheets
 APPENDICES APPENDIX D Synchro Level of Service Output Sheets Lanes, Volumes, Timings NO BUILD 2016 PM 8: 10th St & Thain Rd 10/05/2016 Lane Group NBL NBT NBR SBL SBT SBR SEL SET SER NWL NWT NWR
Lacey Gateway Residential Phase 1
 Lacey Gateway Residential Phase Transportation Impact Study April 23, 203 Prepared for: Gateway 850 LLC 5 Lake Bellevue Drive Suite 02 Bellevue, WA 98005 Prepared by: TENW Transportation Engineering West
Traffic Impact Study Speedway Gas Station Redevelopment
 Traffic Impact Study Speedway Gas Station Redevelopment Warrenville, Illinois Prepared For: Prepared By: April 11, 2018 Table of Contents 1. Introduction... 1 2. Existing Conditions... 4 Site Location...
TIMBERVINE TRANSPORTATION IMPACT STUDY FORT COLLINS, COLORADO JANUARY Prepared for:
 TIMBERVINE TRANSPORTATION IMPACT STUDY FORT COLLINS, COLORADO JANUARY 2014 Prepared for: Hartford Companies 1218 W. Ash Street Suite A Windsor, Co 80550 Prepared by: DELICH ASSOCIATES 2272 Glen Haven Drive
Aldridge Transportation Consultants, LLC Advanced Transportation Planning and Traffic Engineering
 Aldridge Transportation Consultants, LLC Advanced Transportation Planning and Traffic Engineering John M.W. Aldridge, PE, PTOE, AICP 1082 Chimney Rock Road Colorado Registered Professional Engineer Highlands
LOTUS RANCH TRAFFIC IMPACT ANALYSIS. LLG Ref Senior Transportation Engineer & Charlene Sadiarin Transportation Engineer II
 TRAFFIC IMPACT ANALYSIS LOTUS RANCH El Centro, California July 31, 2015February 12, 2016 LLG Ref. 3-14-2392 Prepared by: KC Yellapu, P.E Senior Transportation Engineer & Charlene Sadiarin Transportation
Date: December 20, Project #:
 To: Craig Rottenberg Long s Jewelers 60A South Avenue Burlington, MA 01803 From: Patrick Dunford, P.E. Senior Project Manager Date: December 20, 2018 Project #: 14416.00 Re: Burlington Mall Proposed Long
MEMO VIA . Ms. Amy Roth DPS Director, City of Three Rivers. To:
 MEMO To: Ms. Amy Roth DPS Director, City of Three Rivers VIA EMAIL From: Michael J. Labadie, PE Julie M. Kroll, PE, PTOE Brandon Hayes, PE, P.Eng. Fleis & VandenBrink Date: January 5, 2017 Re: Proposed
5.9 TRANSPORTATION AND TRAFFIC
 5.9 TRANSPORTATION AND TRAFFIC This section evaluates transportation- and traffic-related impacts that have the potential to result from the construction and operation of the Project. Information and analysis
TRANSPORTATION STUDY FOR THE 8899 BEVERLY BOULEVARD PROJECT
 DRAFT TRANSPORTATION STUDY FOR THE 8899 BEVERLY BOULEVARD PROJECT WEST HOLLYWOOD, CALIFORNIA NOVEMBER 2013 PREPARED FOR BEVERLY BOULEVARD ASSOCIATION PREPARED BY DRAFT TRANSPORTATION STUDY FOR THE 8899
Transportation & Traffic Engineering
 Transportation & Traffic Engineering 1) Project Description This report presents a summary of findings for a Traffic Impact Analysis (TIA) performed by A+ Engineering, Inc. for the Hill Country Family
INTERSECTION ANALYSIS PARK AVENUE AND BRADDOCK ROAD (FROSTBURG, MD) FOR LENHART TRAFFIC CONSULTING, INC.
 FOR LENHART TRAFFIC CONSULTING, INC.") INTERSECTION ANALYSIS FOR PARK AVENUE AND BRADDOCK ROAD (FROSTBURG, MD) Prepared for: City of Frostburg, Maryland & Allegany County Commissioners Prepared by: LENHART TRAFFIC CONSULTING, INC. TRAFFIC ENGINEERING
INTERSECTION ANALYSIS FOR PARK AVENUE AND BRADDOCK ROAD (FROSTBURG, MD) Prepared for: City of Frostburg, Maryland & Allegany County Commissioners Prepared by: LENHART TRAFFIC CONSULTING, INC. TRAFFIC ENGINEERING
King County Metro. Columbia Street Transit Priority Improvements Alternative Analysis. Downtown Southend Transit Study. May 2014.
 King County Metro Columbia Street Transit Priority Improvements Alternative Analysis Downtown Southend Transit Study May 2014 Parametrix Table of Contents Introduction... 1 Methodology... 1 Study Area...
Traffic Impact Analysis West Street Garden Plots Improvements and DuPage River Park Garden Plots Development Naperville, Illinois
 Traffic Impact Analysis West Street Garden Plots Improvements and DuPage River Park Garden Plots Development Naperville, Illinois Submitted by April 9, 2009 Introduction Kenig, Lindgren, O Hara, Aboona,
Traffic Impact Study. Residences at Bancroft Block 14, Lot 2 Borough of Haddonfield, Camden County, New Jersey
 Traffic Impact Study Residences at Bancroft Block 14, Lot 2 April 30, 2018 REVISED: JANUARY 17, 2019 Prepared For 2 Hopkins Lane, LLC 2701 Renaissance Boulevard King of Prussia, PA 19406 Prepared By Maser
CHAPTER 9: VEHICULAR ACCESS CONTROL Introduction and Goals Administration Standards
 9.00 Introduction and Goals 9.01 Administration 9.02 Standards 9.1 9.00 INTRODUCTION AND GOALS City streets serve two purposes that are often in conflict moving traffic and accessing property. The higher
Lakeside Terrace Development
 Lakeside Terrace Development City of Barrie, County of Simcoe Traffic Brief for: Type of Document: Final Report Project Number: JDE 1617 Date Submitted: April 29 th, 216 4/29/16 John Northcote, P.Eng.
Table of Contents INTRODUCTION... 3 PROJECT STUDY AREA Figure 1 Vicinity Map Study Area... 4 EXISTING CONDITIONS... 5 TRAFFIC OPERATIONS...
 Crosshaven Drive Corridor Study City of Vestavia Hills, Alabama Table of Contents INTRODUCTION... 3 PROJECT STUDY AREA... 3 Figure 1 Vicinity Map Study Area... 4 EXISTING CONDITIONS... 5 TRAFFIC OPERATIONS...
RESPONSE TO TRAFFIC IMPACT STUDY COMMENTS
 RESPONSE TO TRAFFIC IMPACT STUDY COMMENTS Proposed Gas Station 40 Arthur Street (Highway 26), Town of the Blue Mountains (Thornbury), County of Grey, Ontario AUGUST 2013 August 27, 2013 MR. REG RUSSWURM
The key roadways in the project vicinity are described below. Exhibit displays the existing number of lanes on the study roadways.
 4.2 TRAFFIC AND CIRCULATION This section presents the key assumptions, methods, and results of analysis for the transportation and circulation impacts of the proposed project. This section is based on
TRAFFIC DATA. Existing Derousse Ave./River Rd. AM LOS Analysis Existing Derousse Ave./River Rd. PM LOS Analysis
 Appendix E NJ TRANSIT Pennsauken Junction Transit Center and Park & Ride RiverLINE and Atlantic City Line Pennsauken Township, Camden County, New Jersey TRAFFIC DATA Background Traffic Information for
886 March Road McDonald's Transportation Study
 McDonald's Restaurants of Canada Limited March 2013 886 March Road McDonald's Transportation Study Submitted by: HDR Corporation 100 York Boulevard, Suite 300 Richmond Hill, ON L4B 1J8 (905) 882-4100 www.hdrinc.com
MURRIETA APARTMENTS TRAFFIC IMPACT ANALYSIS CITY OF MURRIETA, CALIFORNIA
 MURRIETA APARTMENTS TRAFFIC IMPACT ANALYSIS CITY OF MURRIETA, CALIFORNIA SEPTEMBER 20, 2012 Prepared for: Golden Eagle Multi-Family Properties, LLC 6201 Oak Canyon Rd., Suite 250 Irvine, CA 92618 Prepared
Appendix Q Traffic Study
 Appendices Appendix Q Traffic Study Crummer Site Subdivision Draft EIR City of Malibu Appendices This page intentionally left blank. The Planning Center April 2013 TRAFFIC IMPACT ANALYSIS Photo z here
Appendix C. Traffic Study
 Appendix C Traffic Study TABLE OF CONTENTS SECTION Executive Summary PAGE 1.0 Introduction... 1 1.1 Scope of Work... 1 1.2 Study Area... 2 2.0 Project Description... 3 2.1 Site Access... 4 2.2 Pedestrian
Interstate Operations Study: Fargo-Moorhead Metropolitan Area Simulation Output
 NDSU Dept #2880 PO Box 6050 Fargo, ND 58108-6050 Tel 701-231-8058 Fax 701-231-6265 www.ugpti.org www.atacenter.org Interstate Operations Study: Fargo-Moorhead Metropolitan Area 2015 Simulation Output Technical
TABLE OF CONTENTS SECTION PAGE. Executive Summary... xii
 TABLE OF CONTENTS SECTION PAGE Executive Summary... xii 1.0 Introduction... 1 1.1 Study Area... 2 1.2 Traffic Impact Analysis Scenarios... 4 1.3 Study Area - City of Orange... 4 2.0 Project Description
Traffic Impact Analysis
 Traffic Impact Analysis Congregate Care Facility Billerica, Massachusetts Prepared For: Hawthorn Development, LLC 35 Kettle Court Salem, OR 973 Prepared By: Sebago Technics, Inc. 75 John Roberts Road,
APPENDIX G TRAFFIC STUDY TECHNICAL MEMORANDUM
 APPENDIX G TRAFFIC STUDY TECHNICAL MEMORANDUM TECHNICAL MEMORANDUM To: From: Date: Subject: Jerry Flores - AECOM Brian A. Marchetti, AICP September 9, 5 DRAFT Traffic Study LABOE Channel 5 Studio Relocation
PROJECT: Wilkinson Road Corridor Improvement Traffic Management Planning Project SUBJECT: Traffic Analysis
 TECHNICAL MEMORANDUM DATE: September 10, 2014 PROJECT 5861.03 NO: PROJECT: Wilkinson Road Corridor Improvement Traffic Management Planning Project SUBJECT: Traffic Analysis TO: Steve Holroyd - District
BARRHAVEN FELLOWSHIP CRC 3058 JOCKVALE ROAD OTTAWA, ONTARIO TRANSPORTATION BRIEF. Prepared for:
 BARRHAVEN FELLOWSHIP CRC 3058 JOCKVALE ROAD OTTAWA, ONTARIO TRANSPORTATION BRIEF Prepared for: Barrhaven Fellowship CRC 3058 Jockvale Road Ottawa, ON K2J 2W7 December 7, 2016 116-649 Report_1.doc D. J.