APPENDIX A LEVEL OF SERVICE CONCEPTS, ANALYSIS METHODOLOGIES,STANDARDS OF SIGNIFICANCE
|
|
|
- Maude Caldwell
- 5 years ago
- Views:
Transcription
1 APPENDIX A LEVEL OF SERVICE CONCEPTS, ANALYSIS METHODOLOGIES,STANDARDS OF SIGNIFICANCE
2 Roadway Segment Level of Service Definitions LOS V/C Congestion/Delay Traffic Description (Used for surface streets, freeways, expressways and conventional highways) "A" <0.41 None Free flow. "B" > None Free to stable flow, light to moderate volumes. "C" > None to minimal Stable flow, moderate volumes, freedom to maneuver noticeably restricted. "D" > Minimal to substantial Approaches unstable flow, heavy volumes, very limited freedom to maneuver. "E" > Significant Extremely unstable flow, maneuverability and psychological comfort extremely poor. (Used for surface streets and conventional highways) "F" >1.00 Considerable (Used for freeways and expressways) "F(0)" > "F(1)" > "F(2)" > "F(3)" >1.45 Source: Caltrans, Considerable 0-1 hour delay Severe 1-2 hour delay Very Severe 2-3 hour delay Extremely Severe 3+ hours of delay Forced or breakdown flow. Delay measured in average travel speed (MPH). Signalized segments experience delays >60.0 seconds/vehicle. Forced flow, heavy congestion, long queues form behind breakdown points, stop and go. Very heavy congestion, very long queues. Extremely heavy congestion, longer queues, more numerous breakdown points, longer stop periods. Gridlock LEVEL OF SERVICE (LOS) DEFINITIONS The concept of LOS is defined as a qualitative measure describing operational conditions within a traffic stream, and the motorist's and/or passengers' perception of operations. A LOS definition generally describes these conditions in terms of such factors as speed, travel time, freedom to maneuver, comfort, convenience, and safety. Levels of service for freeway segments can generally be categorized as shown in the table above.
3 Signalized Intersection Level of Service Highway Capacity Manual Operational Analysis Method The operational analysis method for evaluation of signalized intersections presented in the 2000 Highway Capacity Manual (Transportation Research Board Special Report 209) defines level of service in terms of delay, or more specifically, control stopped delay per vehicle. Delay is a measure of driver and/or passenger discomfort, frustration, fuel consumption, and lost travel time. Control Stopped Delay Per Level of Service (LOS) Characteristics Vehicle (seconds) <10 LOS A describes operations with very low delay. This occurs when progression is extremely favorable, and most vehicles do not stop at all. Short cycle lengths may also contribute to low delay. >10 20 LOS B describes operations with generally good progression and/or short cycle lengths. More vehicles stop than for LOS A, causing higher levels of average delay. >20 35 LOS C describes operations with higher delays, which may result from fair progression and/or longer cycle lengths. Individual cycle failures may begin to appear at this level. The number of vehicles stopping is significant at this level, although many still pass through the intersection without stopping. >35 55 LOS D describes operations with high delay, resulting from some combination of unfavorable progression, long cycle lengths, or high volumes. The influence of congestion becomes more noticeable, and individual cycle failures are noticeable. >55 80 LOS E is considered to be the limit of acceptable delay. Individual cycle failures are frequent occurrences. >80 LOS F describes a condition of excessively high delay, considered unacceptable to most drivers. This condition often occurs when arrival flow rates exceed the capacity of the intersection. Poor progression and long cycle lengths may also be major contributing causes to such delay. Source: Highway Capacity Manual 2000, Exhibit 16-2
4 Minor Street Stop and All-Way Stop Controlled Intersection Level of Service Highway Capacity Manual Operational Analysis Method The Highway Capacity Manual (HCM) analysis method for evaluating minor street stop intersections is based on the average total delay for each impeded movement. For all-way stop controlled intersections it is based on the average total delay for the entire intersection. As used here, total delay is defined as the total elapsed time from when a when a vehicle stops at the end of a queue until the vehicle departs from the stop line; this time includes the time required for the vehicle to travel from the last-in-queue to the first-in-queue position. The average total delay for any particular minor movement is a function of the service rate or capacity of the approach and the degree of saturation. The resulting delay is used to determine the level of service as shown in the following table. Average Total Delay Level of Service (LOS) Characteristics 0-10 LOS A Little or no delay >10 15 LOS B Short traffic delay >15 25 LOS C Average traffic delay >25 35 LOS D Long traffic delays >35 50 LOS E Very long traffic delays >50 LOS F When the demand exceeds the capacity of the lane, extreme delays will be encountered and queuing may cause severe congestion to the intersection. Source: Highway Capacity Manual 2000, Exhibit 17-22
5
6
7 APPENDIX B TRAFFIC COUNT DATA
8 AM PM AM PM INTERSECTION TURNING MOVEMENT COUNTS PREPARED BY: PACIFIC TECHNICAL DATA DATE: LOCATION: ESCONDIDO PROJECT #: PTD /3/14 NORTH & SOUTH: CHARISE LOCATION #: 1 WEDNESDAY EAST & WEST: BROTHERTON CONTROL: 1-WAY STOP (SB) NOTES: AM PM N MD W OTHER S OTHER NORTHBOUND SOUTHBOUND EASTBOUND WESTBOUND U-TURNS CHARISE CHARISE BROTHERTON BROTHERTON NL NT NR SL ST SR EL ET ER WL WT WR TOTAL NB SB EB WB TTL LANES: X X X 0.5 X X X 1 0 X X X X 7:00 AM :15 AM :30 AM :45 AM :00 AM :15 AM :30 AM :45 AM VOLUMES APPROACH % 0% 0% 0% 65% 0% 35% 21% 79% 0% 0% 90% 10% APP/DEPART 0 / / 0 38 / / 61 0 BEGIN PEAK HR VOLUMES 0 7:30 AM APPROACH % 0% 0% 0% 58% 0% 42% 25% 75% 0% 0% 90% 10% PEAK HR FACTOR APP/DEPART 0 / / 0 28 / / :00 PM :15 PM :30 PM :45 PM :00 PM :15 PM :30 PM :45 PM VOLUMES APPROACH % 0% 0% 0% 47% 0% 53% 41% 59% 0% 0% 82% 18% APP/DEPART 0 / / 0 46 / / 88 0 BEGIN PEAK HR VOLUMES 0 5:00 PM APPROACH % 0% 0% 0% 40% 0% 60% 42% 58% 0% 0% 81% 19% PEAK HR FACTOR APP/DEPART 0 / / 0 26 / / 53 0 CHARISE NORTH SIDE BROTHERTON WEST SIDE EAST SIDE BROTHERTON SOUTH SIDE CHARISE PEDESTRIAN CROSSINGS PEDESTRIAN ACTIVATIONS BICYCLE CROSSINGS N SIDE S SIDE E SIDE W SIDE TOTAL N SIDE S SIDE E SIDE W SIDE TOTAL NS SS ES WS TOTAL 7:00 AM :15 AM :30 AM :45 AM :00 AM :15 AM :30 AM :45 AM TOTAL :00 PM :15 PM :30 PM :45 PM :00 PM :15 PM :30 PM :45 PM TOTAL
9 AM PM AM PM INTERSECTION TURNING MOVEMENT COUNTS PREPARED BY: PACIFIC TECHNICAL DATA DATE: LOCATION: ESCONDIDO PROJECT #: PTD /3/14 NORTH & SOUTH: SOUTH CENTRE CITY PKWY LOCATION #: 2 WEDNESDAY EAST & WEST: BROTHERTON CONTROL: 1-WAY STOP (NB) NOTES: AM PM N MD W OTHER S OTHER NORTHBOUND SOUTHBOUND EASTBOUND WESTBOUND U-TURNS SOUTH CENTRE CITY PKWY SOUTH CENTRE CITY PKWY BROTHERTON BROTHERTON NL NT NR SL ST SR EL ET ER WL WT WR TOTAL NB SB EB WB TTL LANES: 0.5 X 0.5 X X X X X X X X X 7:00 AM :15 AM :30 AM :45 AM :00 AM :15 AM :30 AM :45 AM VOLUMES APPROACH % 100% 0% 0% 0% 0% 0% 0% 77% 23% 37% 63% 0% APP/DEPART 2 / 0 0 / / / 59 0 BEGIN PEAK HR VOLUMES 2 7:30 AM APPROACH % 100% 0% 0% 0% 0% 0% 0% 90% 10% 47% 53% 0% PEAK HR FACTOR APP/DEPART 2 / 0 0 / / / :00 PM :15 PM :30 PM :45 PM :00 PM :15 PM :30 PM :45 PM VOLUMES APPROACH % 80% 0% 20% 0% 0% 0% 0% 83% 17% 19% 81% 0% APP/DEPART 10 / 0 0 / / / 96 0 BEGIN PEAK HR VOLUMES 3 5:00 PM APPROACH % 75% 0% 25% 0% 0% 0% 0% 89% 11% 15% 85% 0% PEAK HR FACTOR APP/DEPART 4 / 0 0 / / / 58 0 SOUTH CENTRE CITY PKWY NORTH SIDE BROTHERTON WEST SIDE EAST SIDE BROTHERTON SOUTH SIDE SOUTH CENTRE CITY PKWY PEDESTRIAN CROSSINGS PEDESTRIAN ACTIVATIONS BICYCLE CROSSINGS N SIDE S SIDE E SIDE W SIDE TOTAL N SIDE S SIDE E SIDE W SIDE TOTAL NS SS ES WS TOTAL 7:00 AM :15 AM :30 AM :45 AM :00 AM :15 AM :30 AM :45 AM TOTAL :00 PM :15 PM :30 PM :45 PM :00 PM :15 PM :30 PM :45 PM TOTAL
10 AM PM AM PM INTERSECTION TURNING MOVEMENT COUNTS PREPARED BY: PACIFIC TECHNICAL DATA DATE: LOCATION: ESCONDIDO PROJECT #: PTD /3/14 NORTH & SOUTH: CENTRE CITY PKWY LOCATION #: 3 WEDNESDAY EAST & WEST: BROTHERTON CONTROL: 2-WAY STOP (EW) NOTES: AM PM N MD W OTHER S OTHER NORTHBOUND SOUTHBOUND EASTBOUND WESTBOUND U-TURNS CENTRE CITY PKWY CENTRE CITY PKWY BROTHERTON BROTHERTON NL NT NR SL ST SR EL ET ER WL WT WR TOTAL NB SB EB WB TTL LANES: X X 1 X X 1 X X X X 7:00 AM :15 AM :30 AM :45 AM :00 AM :15 AM :30 AM :45 AM VOLUMES 21 1, , , APPROACH % 2% 94% 4% 2% 95% 3% 0% 0% 100% 0% 0% 100% APP/DEPART 1,289 / 1,235 2,264 / 2, / / 91 0 BEGIN PEAK HR VOLUMES 8 7:15 AM , ,964 APPROACH % 1% 94% 5% 1% 95% 3% 0% 0% 100% 0% 0% 100% PEAK HR FACTOR APP/DEPART 681 / 649 1,249 / 1, / / :00 PM :15 PM :30 PM :45 PM :00 PM :15 PM :30 PM :45 PM VOLUMES 44 2, , , APPROACH % 2% 86% 12% 5% 91% 4% 0% 0% 100% 0% 0% 100% APP/DEPART 2,593 / 2,309 1,515 / 1, / / BEGIN PEAK HR VOLUMES 25 4:45 PM 1, ,338 APPROACH % 2% 86% 12% 5% 89% 5% 0% 0% 100% 0% 0% 100% PEAK HR FACTOR APP/DEPART 1,459 / 1, / / / 67 0 CENTRE CITY PKWY NORTH SIDE BROTHERTON WEST SIDE EAST SIDE BROTHERTON SOUTH SIDE CENTRE CITY PKWY PEDESTRIAN CROSSINGS PEDESTRIAN ACTIVATIONS BICYCLE CROSSINGS N SIDE S SIDE E SIDE W SIDE TOTAL N SIDE S SIDE E SIDE W SIDE TOTAL NS SS ES WS TOTAL 7:00 AM :15 AM :30 AM :45 AM :00 AM :15 AM :30 AM :45 AM TOTAL :00 PM :15 PM :30 PM :45 PM :00 PM :15 PM :30 PM :45 PM TOTAL
11 AM PM AM PM INTERSECTION TURNING MOVEMENT COUNTS PREPARED BY: PACIFIC TECHNICAL DATA DATE: LOCATION: ESCONDIDO PROJECT #: PTD /3/14 NORTH & SOUTH: SOUTH CENTRE CITY PKWY LOCATION #: 4 WEDNESDAY EAST & WEST: CITRACADO CONTROL: 2-WAY STOP (NS) NOTES: AM PM N MD W OTHER S OTHER NORTHBOUND SOUTHBOUND EASTBOUND WESTBOUND SOUTH CENTRE CITY PKWY SOUTH CENTRE CITY PKWY CITRACADO CITRACADO NL NT NR SL ST SR EL ET ER WL WT WR TOTAL NB SB EB WB TTL LANES: X X X X 7:00 AM :15 AM :30 AM :45 AM :00 AM :15 AM :30 AM :45 AM VOLUMES APPROACH % 59% 2% 39% 72% 2% 26% 9% 88% 3% 5% 89% 6% APP/DEPART 44 / / / / BEGIN PEAK HR VOLUMES 17 7:15 AM APPROACH % 61% 4% 36% 64% 3% 33% 11% 85% 4% 5% 88% 7% PEAK HR FACTOR APP/DEPART 28 / / / / :00 PM :15 PM :30 PM :45 PM :00 PM :15 PM :30 PM :45 PM VOLUMES APPROACH % 26% 9% 66% 80% 3% 17% 4% 94% 3% 7% 86% 7% APP/DEPART 35 / / / / BEGIN PEAK HR VOLUMES 6 4:45 PM APPROACH % 32% 11% 58% 78% 3% 20% 3% 95% 2% 8% 84% 8% PEAK HR FACTOR APP/DEPART 19 / / / / SOUTH CENTRE CITY PKWY NORTH SIDE CITRACADO WEST SIDE EAST SIDE CITRACADO SOUTH SIDE SOUTH CENTRE CITY PKWY U-TURNS PEDESTRIAN CROSSINGS PEDESTRIAN ACTIVATIONS BICYCLE CROSSINGS N SIDE S SIDE E SIDE W SIDE TOTAL N SIDE S SIDE E SIDE W SIDE TOTAL NS SS ES WS TOTAL 7:00 AM :15 AM :30 AM :45 AM :00 AM :15 AM :30 AM :45 AM TOTAL :00 PM :15 PM :30 PM :45 PM :00 PM :15 PM :30 PM :45 PM TOTAL
12 AM PM AM PM INTERSECTION TURNING MOVEMENT COUNTS PREPARED BY: PACIFIC TECHNICAL DATA DATE: LOCATION: ESCONDIDO PROJECT #: PTD /3/14 NORTH & SOUTH: CENTRE CITY PKWY LOCATION #: 5 WEDNESDAY EAST & WEST: CITRACADO CONTROL: SIGNAL NOTES: AM PM N MD W OTHER S OTHER NORTHBOUND SOUTHBOUND EASTBOUND WESTBOUND CENTRE CITY PKWY CENTRE CITY PKWY CITRACADO CITRACADO NL NT NR SL ST SR EL ET ER WL WT WR TOTAL NB SB EB WB TTL LANES: X X X X 7:00 AM :15 AM :30 AM :45 AM :00 AM :15 AM :30 AM :45 AM VOLUMES 42 1, , , APPROACH % 3% 93% 4% 1% 93% 6% 52% 31% 17% 64% 31% 5% APP/DEPART 1,240 / 1,287 2,190 / 2, / / BEGIN PEAK HR VOLUMES 24 7:00 AM , ,263 APPROACH % 4% 92% 4% 1% 94% 6% 46% 32% 22% 61% 34% 5% PEAK HR FACTOR APP/DEPART 600 / 618 1,245 / 1, / / :00 PM :15 PM :30 PM :45 PM :00 PM :15 PM :30 PM :45 PM VOLUMES 42 2, , , APPROACH % 2% 92% 6% 4% 89% 7% 47% 42% 10% 56% 33% 11% APP/DEPART 2,519 / 2,567 1,378 / 1, / / BEGIN PEAK HR VOLUMES 29 5:00 PM 1, ,569 APPROACH % 2% 91% 7% 4% 89% 7% 48% 40% 12% 54% 33% 13% PEAK HR FACTOR APP/DEPART 1,488 / 1, / / / CENTRE CITY PKWY NORTH SIDE CITRACADO WEST SIDE EAST SIDE CITRACADO SOUTH SIDE CENTRE CITY PKWY U-TURNS PEDESTRIAN CROSSINGS PEDESTRIAN ACTIVATIONS BICYCLE CROSSINGS N SIDE S SIDE E SIDE W SIDE TOTAL N SIDE S SIDE E SIDE W SIDE TOTAL NS SS ES WS TOTAL 7:00 AM :15 AM :30 AM :45 AM :00 AM :15 AM :30 AM :45 AM TOTAL :00 PM :15 PM :30 PM :45 PM :00 PM :15 PM :30 PM :45 PM TOTAL
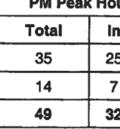
13 WEDNESDAY, SEPTEMBER 3RD, 2014 CITY: ESCONDIDO PROJECT: S. CENTRE CITY PKWY BTN BROTHERTON & CITRACADO AM Period NB SB EB WB PM Period NB SB EB WB 00: : : : : : : : : : : : : : : : : : : : : : : : : : : : : : : : : : : : : : : : : : : : : : : : : : : : : : : : : : : : : : : : : : : : : : : : : : : : : : : : : : : : : : : : : : : : : : : : Total Vol Daily Totals NB SB EB WB Combined AM Split % 14.3% 85.7% 50.2% 36.5% 63.5% 49.8% Peak Hour 09:15 08:00 07:30 14:00 16:00 16:00 Volume P.H.F PACIFIC TECHNICAL DATA PM PTD
14 WEDNESDAY, SEPTEMBER 3RD, 2014 CITY: ESCONDIDO PROJECT: CENTRE CITY PKWY N-O BROTHERTON AM Period NB SB EB WB PM Period NB SB EB WB 00: : : : : : : : : : : : : : : : : : : : : : : : : : : : : : : : : : : : : : : : : : : : : : : : : : : : : : : : : : : : : : : : : : : : : : : : : : : : : : : : : : : : : : : : : : : : : : : : Total Vol Daily Totals NB SB EB WB Combined AM Split % 37.5% 62.5% 38.7% 60.3% 39.7% 61.3% Peak Hour 07:45 06:45 07:15 16:45 16:45 16:45 Volume P.H.F PACIFIC TECHNICAL DATA PM PTD
15 WEDNESDAY, SEPTEMBER 3RD, 2014 CITY: ESCONDIDO PROJECT: CENTRE CITY PKWY BTN BROTHERTON & CITRACADO AM Period NB SB EB WB PM Period NB SB EB WB 00: : : : : : : : : : : : : : : : : : : : : : : : : : : : : : : : : : : : : : : : : : : : : : : : : : : : : : : : : : : : : : : : : : : : : : : : : : : : : : : : : : : : : : : : : : : : : : : : Total Vol Daily Totals NB SB EB WB Combined AM Split % 38.3% 61.7% 38.5% 62.4% 37.6% 61.5% Peak Hour 07:45 06:45 06:45 17:00 16:15 17:00 Volume P.H.F PACIFIC TECHNICAL DATA PM PTD
16 WEDNESDAY, SEPTEMBER 3RD, 2014 CITY: ESCONDIDO PROJECT: CENTRE CITY PKWY S-O CITRACADO AM Period NB SB EB WB PM Period NB SB EB WB 00: : : : : : : : : : : : : : : : : : : : : : : : : : : : : : : : : : : : : : : : : : : : : : : : : : : : : : : : : : : : : : : : : : : : : : : : : : : : : : : : : : : : : : : : : : : : : : : : Total Vol Daily Totals NB SB EB WB Combined AM Split % 35.2% 64.8% 39.1% 60.7% 39.3% 60.9% Peak Hour 11:45 06:45 06:45 17:00 16:15 16:45 Volume P.H.F PACIFIC TECHNICAL DATA PM PTD
17 WEDNESDAY, SEPTEMBER 3RD, 2014 CITY: ESCONDIDO PROJECT: BROTHERTON BTN CHARISE & S. CENTRE CITY PKWY AM Period NB SB EB WB PM Period NB SB EB WB 00: : : : : : : : : : : : : : : : : : : : : : : : : : : : : : : : : : : : : : : : : : : : : : : : : : : : : : : : : : : : : : : : : : : : : : : : : : : : : : : : : : : : : : : : : : : : : : : : Total Vol Daily Totals NB SB EB WB Combined AM Split % 43.9% 56.1% 36.4% 24.5% 75.5% 63.6% Peak Hour 07:30 07:00 07:15 12:45 16:45 16:45 Volume P.H.F PACIFIC TECHNICAL DATA PM PTD
18 WEDNESDAY, SEPTEMBER 3RD, 2014 CITY: ESCONDIDO PROJECT: F. BROTHERTON BTN S. CENTRE CITY PKWY & CENTRE CITY AM Period NB SB EB WB PM Period NB SB EB WB 00: : : : : : : : : : : : : : : : : : : : : : : : : : : : : : : : : : : : : : : : : : : : : : : : : : : : : : : : : : : : : : : : : : : : : : : : : : : : : : : : : : : : : : : : : : : : : : : : Total Vol Daily Totals NB SB EB WB Combined AM Split % 40.1% 59.9% 38.4% 28.1% 71.9% 61.6% Peak Hour 07:30 07:15 07:30 12:30 17:00 17:00 Volume P.H.F PACIFIC TECHNICAL DATA PM PTD
19 WEDNESDAY, SEPTEMBER 3RD, 2014 CITY: ESCONDIDO PROJECT: CITRACADO BTN S. CENTRE CITY PKWY & CENTRE CITY AM Period NB SB EB WB PM Period NB SB EB WB 00: : : : : : : : : : : : : : : : : : : : : : : : : : : : : : : : : : : : : : : : : : : : : : : : : : : : : : : : : : : : : : : : : : : : : : : : : : : : : : : : : : : : : : : : : : : : : : : : Total Vol Daily Totals NB SB EB WB Combined AM Split % 39.7% 60.3% 34.5% 53.8% 46.2% 65.5% Peak Hour 11:45 07:00 11:45 16:45 14:15 15:15 Volume P.H.F PACIFIC TECHNICAL DATA PM PTD
20 APPENDIX C TRIP GENERATION
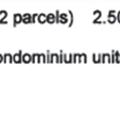
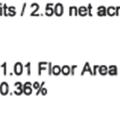
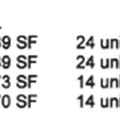
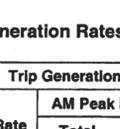
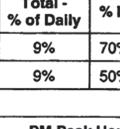
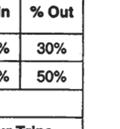
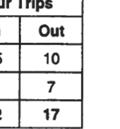
21 Land Use Intensity Unit Condominium (6-20 DU/AC) Daily Rate Daily Trips AM Peak Hour PM Peak Hour Total In Out Total In Out Rate % 80% % 30% 113 DU 8 trips Per DU 904 Trips Source (Trip Rate): SANDAG (not so) Brief Guide of Vehicular Traffic Generation Rates for the San Diego Region (April 2002). Note: Numbers may not total due to rounding.
22 APPENDIX D CUMULATIVE PROJECT INFORMATION

23
24


25

26 Land Use Proposed Project Quantity Daily Trip Ends (ADT) Rate TABLE 4 PROJECT TRIP GENERATION SUMMARY Volume % of ADT In:Out Split AM Peak Hour PM Peak Hour Volume % of In:Out Volume In Out Total ADT Split In Out Total Car Wash 1 Site 900 / Site 900 4% 5: % 5: Oil Change 2 Stall 40 /Stall 80 7% 6: % 5: Restaurant 4,156 SF 160 /KSF 665 8% 5: % 6: Total Trips 1, Pass By Restaurant (Daily and AM: 10% and PM Peak hour: 20%) Subtotal Primary Trips 1, Fast Food Alternative Fast Food Restaurant 6,000 SF 700 /KSF 4,200 5% 6: % 5: Pass By Restaurant (Daily and AM: 20% and PM Peak hour: 40%) (-) 840 (-) 21 (-) 21 (-) 42 (-) 59 (-) 59 (-) 118 Subtotal Primary Trips 3, Difference 1, N:\1944\Report\Ltr Rep.1944.doc
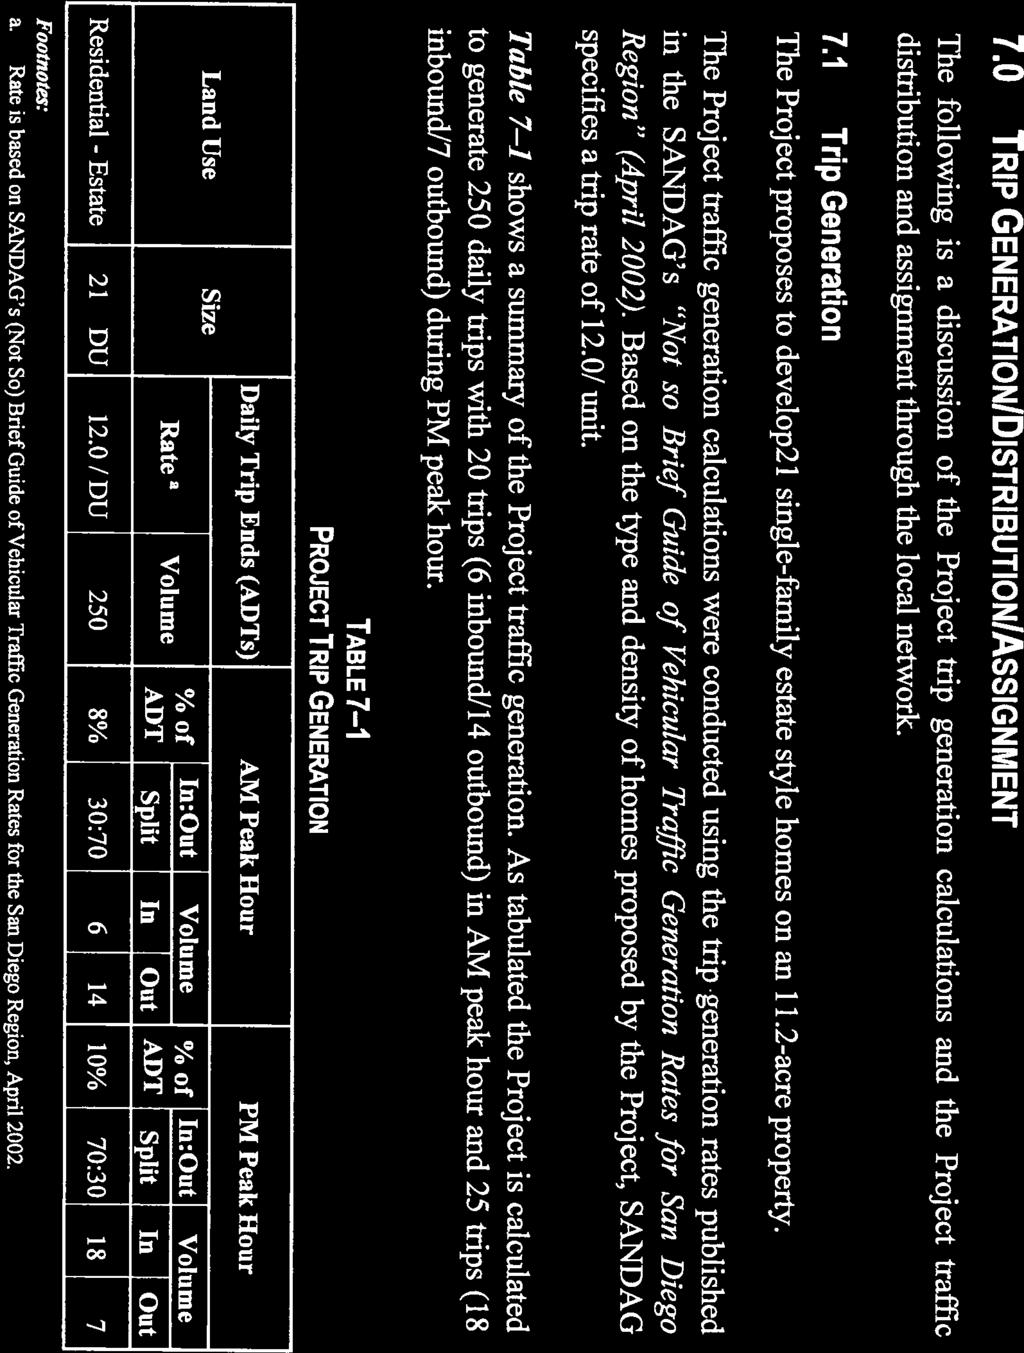
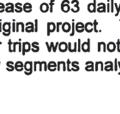
27 7.0 TRIP GENERATION/DISTRIBUTION/ASSIGNMENT The following is a discussion of the project trip generation calculations and the project traffic distribution and assignment through the local network. 7.1 Trip Generation The project proposes to develop 65 single-family estate style homes on an 41.4-acre property. Homes will be constructed to City of Escondido R-E-40 (Residential Estates- 40,000 SF minimum lot size) and R-E-20 (Residential Estates- 20,000 SF minimum lot size) zoning standards. The project traffic generation calculations were conducted using the trip generation rates published in the SANDAG s Not so Brief Guide of Vehicular Traffic Generation Rates for San Diego Region (April 2002). Based on the type and density of homes proposed by the project, SANDAG specifies a trip rate of 12.0/ unit. Table 7 1 shows a summary of the project traffic generation. As tabulated the proposed project is calculated to generate 780 daily trips with 62 trips (19 inbound/43 outbound) in AM peak hour and 78 trips (55 inbound/23 outbound) during PM peak hour. TABLE 7 1 PROJECT TRIP GENERATION Land Use Size a Daily Trip Ends (ADTs) AM Peak Hour PM Peak Hour Rate b Volume % of ADT In:Out Volume % of In:Out Volume Split In Out ADT Split In Out Residential - Estate 65 DU 12.0 /DU 780 8% 30: % 70: Footnotes: a. The project as currently proposed is 65 units. The capacity analyses in this report are based on the original proposal of 66 units, and are therefore conservative. b. Rate is based on SANDAG s (Not So) Brief Guide of Vehicular Traffic Generation Rates for the San Diego Region, April Trip Distribution/Assignment The Project traffic was distributed to the local street system based on the roadway network, employment centers, commercial areas, local schools and traffic circulation. Existing peak hour traffic volumes and travel patterns in the immediate vicinity of the project site were utilized to estimate the Project s driveway distribution, as were travel time study results based on travel from the site to the two I-15 interchanges (Gamble Lane/Citracado Parkway to the north and Via Rancho Parkway to the south). LINSCOTT,LAW &GREENSPAN, engineers LLG Ref Oak Creek Project N:\2208\Report\2208 Report update July 2014.doc
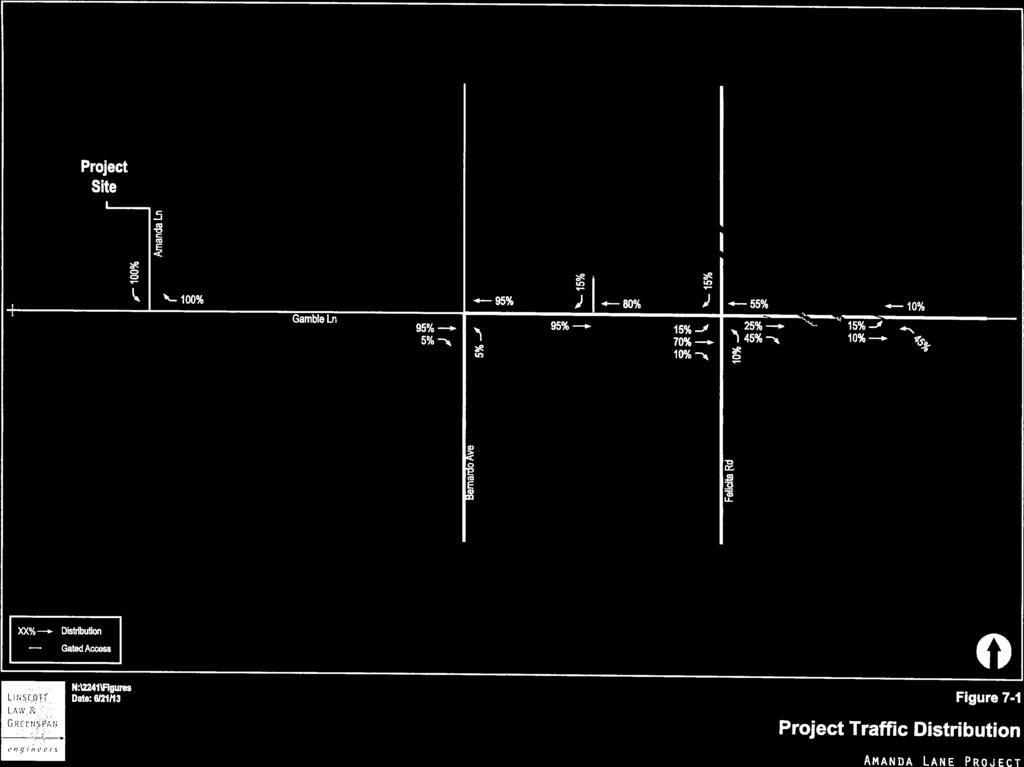
28 Based on the site location and possible access to I-15, the majority of commuter trips destined to the south were assigned to the Gamble Lane/Citracado Parkway interchange located north of the site with the remaining trips assigned to the Via Rancho Parkway interchange. This route is geographically out-of-direction for southbound trips; however existing congestion and commuter patterns (corroborated with field reviews and travel time studies LLG) indicate that this is a reasonable and likely scenario. LLG observed that trips from the site to I-15 SB via Gamble Lane/Citracado Parkway could save up to 1.5 minutes of travel time as opposed using Via Rancho parkway. Some trips were also assigned locally to Hamilton Lane and Citracado Parkway. Figure 7 1 shows the project trip distribution percentages. Figure 7 2 shows the AM/PM peak hour project traffic volumes. Figure 7 3 shows existing + project traffic volumes. LINSCOTT,LAW &GREENSPAN, engineers LLG Ref Oak Creek Project N:\2208\Report\2208 Report update July 2014.doc
29 15% 15% XX% Project Traffic Distribution Gamble Ln W. Citracado Pkwy 5%! 1! 2 72%! 4 Felicita Rd! 3 10% Hamilton Ln Project Site 32%! 5 15 Clarence Ln 23% 10%! 6 13% Via RanchoPkwy 45% N:\2208\Figures Date: 3/18/13 Figure 7-1 Project Traffic Distribution Oak Creek
30 ! 1 Gamble Ln! 2 Gamble Ln! 3! 4! 5! 6 1 / 3 3 / 8 W. Citracado Pkwy 7 / 4 4 / 2 Hamilton Ln 3 / 8 Clarence Ln 3 / 8 14 / / 5 I-15 NB Ramps Felicita Rd I-15 SB Off-Ramp Ï Felicita Rd Felicita Rd 7 / 4 26 / 14 Ï Ï 4 / 13 2 / 1 6 / / 18 8 / 23 2 / 6 Gamble Ln W. Citracado Pkwy 40! 1! 2 570! 4 Felicita Rd !!!!!! Project Site Project Dwy! Hamilton Ln! 3 Clarence Ln!# AM / PM X,XXX 80 Study Intersections AM / PM Intersection Peak Hour Volumes Average Daily Trips 4 / 2 6 / 3 Via Rancho Pkwy 2 / 6 2 / 7! 6 Via Rancho Pkwy Felicita Rd N:\2208\Figures Date: 3/13/13 Figure 7-2 Project Traffic Volumes Oak Creek
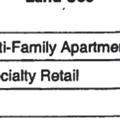
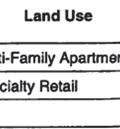
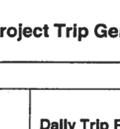
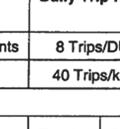
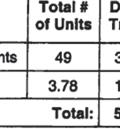
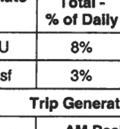
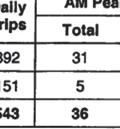
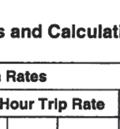
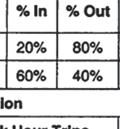
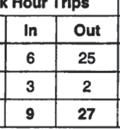
31 Center City Development Trip Generation Trip Generation Rates AM Peak Hour Trip Rate PM Peak Hour Trip Rate Total - % of Total - % of Land Use Daily Trip Rate Daily % In % Out Daily % In % Out Multi-Family Apartments 8 Trips/DU 8% 20% 80% 10% 70% 30% Land Use Total # of Units Daily Trips Trip Generation AM Peak Hour Trip Rate PM Peak Hour Trip Rate Total In Out Total In Out Multi-Family Apartments Source (Trip Rate): SANDAG (not so) Brief Guide of Vehicular Traffic Generation Rates for the San Diego Region (April 2002). Note: Numbers may not total due to rounding.


32
33
34 APPENDIX E PEAK HOUR INTERSECTION ANALYSIS WORKSHEETS EXISTING CONDITIONS
35 Existing Conditions AM 1: Brotherton Road & Charise Street 8/24/2015 Existing Conditions AM 2: S Centre City Parkway & Brotherton Road 8/24/2015 Intersection Int Delay, s/veh 2.8 Movement EBL EBT WBT WBR SBL SBR Vol, veh/h Conflicting Peds, #/hr Sign Control Free Free Free Free Stop Stop RT Channelized - None - None - None Storage Length Veh in Median Storage, # Grade, % Peak Hour Factor Heavy Vehicles, % Mvmt Flow Major/Minor Major1 Major2 Minor2 Conflicting Flow All Stage Stage Critical Hdwy Critical Hdwy Stg Critical Hdwy Stg Follow-up Hdwy Pot Cap-1 Maneuver Stage Stage Platoon blocked, % Mov Cap-1 Maneuver Mov Cap-2 Maneuver Stage Stage Approach EB WB SB HCM Control Delay, s HCM LOS A Minor Lane/Major Mvmt EBL EBT WBT WBR SBLn1 Capacity (veh/h) HCM Lane V/C Ratio HCM Control Delay (s) HCM Lane LOS A A - - A HCM 95th %tile Q(veh) Intersection Int Delay, s/veh 2.3 Movement EBT EBR WBL WBT NBL NBR Vol, veh/h Conflicting Peds, #/hr Sign Control Free Free Free Free Stop Stop RT Channelized - None - None - None Storage Length Veh in Median Storage, # Grade, % Peak Hour Factor Heavy Vehicles, % Mvmt Flow Major/Minor Major1 Major2 Minor1 Conflicting Flow All Stage Stage Critical Hdwy Critical Hdwy Stg Critical Hdwy Stg Follow-up Hdwy Pot Cap-1 Maneuver Stage Stage Platoon blocked, % Mov Cap-1 Maneuver Mov Cap-2 Maneuver Stage Stage Approach EB WB NB HCM Control Delay, s HCM LOS A Minor Lane/Major Mvmt NBLn1 EBT EBR WBL WBT Capacity (veh/h) HCM Lane V/C Ratio HCM Control Delay (s) HCM Lane LOS A - - A A HCM 95th %tile Q(veh) Del Prado 5:00 pm 7/31/2015 Baseline Synchro 9 Report Ryan Page 1 Del Prado 5:00 pm 7/31/2015 Baseline Synchro 9 Report Ryan Page 2
36 Existing Conditions AM 3: Centre City Parkway/Centre City Pkwy & Brotherton Road 8/24/2015 Existing Conditions AM 4: W Citracado Pkwy/W Citracado Parkway & S Centre City Pkwy 8/24/2015 Intersection Int Delay, s/veh 0.3 Movement EBL EBT EBR WBL WBT WBR NBL NBT NBR SBL SBT SBR Vol, veh/h Conflicting Peds, #/hr Sign Control Stop Stop Stop Stop Stop Stop Free Free Free Free Free Free RT Channelized - - Stop - - Stop - - None - - None Storage Length Veh in Median Storage, # Grade, % Peak Hour Factor Heavy Vehicles, % Mvmt Flow Major/Minor Minor2 Minor1 Major1 Major2 Conflicting Flow All Stage Stage Critical Hdwy Critical Hdwy Stg Critical Hdwy Stg Follow-up Hdwy Pot Cap-1 Maneuver Stage Stage Platoon blocked, % Mov Cap-1 Maneuver Mov Cap-2 Maneuver Stage Stage Approach EB WB NB SB HCM Control Delay, s HCM LOS B B Minor Lane/Major Mvmt NBL NBT NBR EBLn1WBLn1 SBL SBT SBR Capacity (veh/h) HCM Lane V/C Ratio HCM Control Delay (s) HCM Lane LOS B - - B B A - - HCM 95th %tile Q(veh) Intersection Int Delay, s/veh 2.3 Movement EBL EBT EBR WBL WBT WBR NBL NBT NBR SBL SBT SBR Vol, veh/h Conflicting Peds, #/hr Sign Control Free Free Free Free Free Free Stop Stop Stop Stop Stop Stop RT Channelized - - None - - None - - None - - None Storage Length Veh in Median Storage, # Grade, % Peak Hour Factor Heavy Vehicles, % Mvmt Flow Major/Minor Major1 Major2 Minor1 Minor2 Conflicting Flow All Stage Stage Critical Hdwy Critical Hdwy Stg Critical Hdwy Stg Follow-up Hdwy Pot Cap-1 Maneuver Stage Stage Platoon blocked, % Mov Cap-1 Maneuver Mov Cap-2 Maneuver Stage Stage Approach EB WB NB SB HCM Control Delay, s HCM LOS B B Minor Lane/Major Mvmt NBLn1 EBL EBT EBR WBL WBT WBR SBLn1 Capacity (veh/h) HCM Lane V/C Ratio HCM Control Delay (s) HCM Lane LOS B A A - A A - B HCM 95th %tile Q(veh) Del Prado 5:00 pm 7/31/2015 Baseline Synchro 9 Report Ryan Page 3 Del Prado 5:00 pm 7/31/2015 Baseline Synchro 9 Report Ryan Page 4
37 Existing Conditions AM 5: W Citracado Parkway & Centre City Parkway 8/24/2015 Movement EBL EBT EBR WBL WBT WBR NBL NBT NBR SBL SBT SBR Lane Configurations Volume (veh/h) Number Initial Q (Qb), veh Ped-Bike Adj(A_pbT) Parking Bus, Adj Adj Sat Flow, veh/h/ln Adj Flow Rate, veh/h Adj No. of Lanes Peak Hour Factor Percent Heavy Veh, % Cap, veh/h Arrive On Green Sat Flow, veh/h Grp Volume(v), veh/h Grp Sat Flow(s),veh/h/ln Q Serve(g_s), s Cycle Q Clear(g_c), s Prop In Lane Lane Grp Cap(c), veh/h V/C Ratio(X) Avail Cap(c_a), veh/h HCM Platoon Ratio Upstream Filter(I) Uniform Delay (d), s/veh Incr Delay (d2), s/veh Initial Q Delay(d3),s/veh %ile BackOfQ(50%),veh/ln LnGrp Delay(d),s/veh LnGrp LOS C C C C C A A A A A A Approach Vol, veh/h Approach Delay, s/veh Approach LOS C C A A Timer Assigned Phs Phs Duration (G+Y+Rc), s Change Period (Y+Rc), s Max Green Setting (Gmax), s Max Q Clear Time (g_c+i1), s Green Ext Time (p_c), s Intersection Summary HCM 2010 Ctrl Delay 10.1 HCM 2010 LOS B Del Prado 5:00 pm 7/31/2015 Baseline Synchro 9 Report Ryan Page 5
38 Existing Conditions PM 1: Brotherton Road & Charise Street 8/24/2015 Existing Conditions PM 2: S Centre City Parkway & Brotherton Road 8/24/2015 Intersection Int Delay, s/veh 1.8 Movement EBL EBT WBT WBR SBL SBR Vol, veh/h Conflicting Peds, #/hr Sign Control Free Free Free Free Stop Stop RT Channelized - None - None - None Storage Length Veh in Median Storage, # Grade, % Peak Hour Factor Heavy Vehicles, % Mvmt Flow Major/Minor Major1 Major2 Minor2 Conflicting Flow All Stage Stage Critical Hdwy Critical Hdwy Stg Critical Hdwy Stg Follow-up Hdwy Pot Cap-1 Maneuver Stage Stage Platoon blocked, % Mov Cap-1 Maneuver Mov Cap-2 Maneuver Stage Stage Approach EB WB SB HCM Control Delay, s HCM LOS A Minor Lane/Major Mvmt EBL EBT WBT WBR SBLn1 Capacity (veh/h) HCM Lane V/C Ratio HCM Control Delay (s) HCM Lane LOS A A - - A HCM 95th %tile Q(veh) Intersection Int Delay, s/veh 1.2 Movement EBT EBR WBL WBT NBL NBR Vol, veh/h Conflicting Peds, #/hr Sign Control Free Free Free Free Stop Stop RT Channelized - None - None - None Storage Length Veh in Median Storage, # Grade, % Peak Hour Factor Heavy Vehicles, % Mvmt Flow Major/Minor Major1 Major2 Minor1 Conflicting Flow All Stage Stage Critical Hdwy Critical Hdwy Stg Critical Hdwy Stg Follow-up Hdwy Pot Cap-1 Maneuver Stage Stage Platoon blocked, % Mov Cap-1 Maneuver Mov Cap-2 Maneuver Stage Stage Approach EB WB NB HCM Control Delay, s HCM LOS A Minor Lane/Major Mvmt NBLn1 EBT EBR WBL WBT Capacity (veh/h) HCM Lane V/C Ratio HCM Control Delay (s) HCM Lane LOS A - - A A HCM 95th %tile Q(veh) Del Prado 5:00 pm 7/31/2015 Baseline Synchro 9 Report Ryan Page 1 Del Prado 5:00 pm 7/31/2015 Baseline Synchro 9 Report Ryan Page 2
39 Existing Conditions PM 3: Centre City Parkway/Centre City Pkwy & Brotherton Road 8/24/2015 Existing Conditions PM 4: W Citracado Pkwy/W Citracado Parkway & S Centre City Pkwy 8/24/2015 Intersection Int Delay, s/veh 0.8 Movement EBL EBT EBR WBL WBT WBR NBL NBT NBR SBL SBT SBR Vol, veh/h Conflicting Peds, #/hr Sign Control Stop Stop Stop Stop Stop Stop Free Free Free Free Free Free RT Channelized - - Stop - - Stop - - None - - None Storage Length Veh in Median Storage, # Grade, % Peak Hour Factor Heavy Vehicles, % Mvmt Flow Major/Minor Minor2 Minor1 Major1 Major2 Conflicting Flow All Stage Stage Critical Hdwy Critical Hdwy Stg Critical Hdwy Stg Follow-up Hdwy Pot Cap-1 Maneuver Stage Stage Platoon blocked, % Mov Cap-1 Maneuver Mov Cap-2 Maneuver Stage Stage Approach EB WB NB SB HCM Control Delay, s HCM LOS B C Minor Lane/Major Mvmt NBL NBT NBR EBLn1WBLn1 SBL SBT SBR Capacity (veh/h) HCM Lane V/C Ratio HCM Control Delay (s) HCM Lane LOS A - - B C B - - HCM 95th %tile Q(veh) Intersection Int Delay, s/veh 1.9 Movement EBL EBT EBR WBL WBT WBR NBL NBT NBR SBL SBT SBR Vol, veh/h Conflicting Peds, #/hr Sign Control Free Free Free Free Free Free Stop Stop Stop Stop Stop Stop RT Channelized - - None - - None - - None - - None Storage Length Veh in Median Storage, # Grade, % Peak Hour Factor Heavy Vehicles, % Mvmt Flow Major/Minor Major1 Major2 Minor1 Minor2 Conflicting Flow All Stage Stage Critical Hdwy Critical Hdwy Stg Critical Hdwy Stg Follow-up Hdwy Pot Cap-1 Maneuver Stage Stage Platoon blocked, % Mov Cap-1 Maneuver Mov Cap-2 Maneuver Stage Stage Approach EB WB NB SB HCM Control Delay, s HCM LOS B B Minor Lane/Major Mvmt NBLn1 EBL EBT EBR WBL WBT WBR SBLn1 Capacity (veh/h) HCM Lane V/C Ratio HCM Control Delay (s) HCM Lane LOS B A A - A A - B HCM 95th %tile Q(veh) Del Prado 5:00 pm 7/31/2015 Baseline Synchro 9 Report Ryan Page 3 Del Prado 5:00 pm 7/31/2015 Baseline Synchro 9 Report Ryan Page 4
40 Existing Conditions PM 5: W Citracado Parkway & Centre City Parkway 8/24/2015 Movement EBL EBT EBR WBL WBT WBR NBL NBT NBR SBL SBT SBR Lane Configurations Volume (veh/h) Number Initial Q (Qb), veh Ped-Bike Adj(A_pbT) Parking Bus, Adj Adj Sat Flow, veh/h/ln Adj Flow Rate, veh/h Adj No. of Lanes Peak Hour Factor Percent Heavy Veh, % Cap, veh/h Arrive On Green Sat Flow, veh/h Grp Volume(v), veh/h Grp Sat Flow(s),veh/h/ln Q Serve(g_s), s Cycle Q Clear(g_c), s Prop In Lane Lane Grp Cap(c), veh/h V/C Ratio(X) Avail Cap(c_a), veh/h HCM Platoon Ratio Upstream Filter(I) Uniform Delay (d), s/veh Incr Delay (d2), s/veh Initial Q Delay(d3),s/veh %ile BackOfQ(50%),veh/ln LnGrp Delay(d),s/veh LnGrp LOS C C C C C C A A A B A A Approach Vol, veh/h Approach Delay, s/veh Approach LOS C C A A Timer Assigned Phs Phs Duration (G+Y+Rc), s Change Period (Y+Rc), s Max Green Setting (Gmax), s Max Q Clear Time (g_c+i1), s Green Ext Time (p_c), s Intersection Summary HCM 2010 Ctrl Delay 9.8 HCM 2010 LOS A Del Prado 5:00 pm 7/31/2015 Baseline Synchro 9 Report Ryan Page 5
41 Existing + Project AM 1: P. Drwy1/Charise Street & Brotherton Road 8/24/2015 Existing + Project AM 2: S Centre City Parkway & Brotherton Road 8/24/2015 Intersection Int Delay, s/veh 5.1 Movement EBL EBT EBR WBL WBT WBR NBL NBT NBR SBL SBT SBR Vol, veh/h Conflicting Peds, #/hr Sign Control Free Free Free Free Free Free Stop Stop Stop Stop Stop Stop RT Channelized - - None - - None - - None - - None Storage Length Veh in Median Storage, # Grade, % Peak Hour Factor Heavy Vehicles, % Mvmt Flow Major/Minor Major1 Major2 Minor1 Minor2 Conflicting Flow All Stage Stage Critical Hdwy Critical Hdwy Stg Critical Hdwy Stg Follow-up Hdwy Pot Cap-1 Maneuver Stage Stage Platoon blocked, % Mov Cap-1 Maneuver Mov Cap-2 Maneuver Stage Stage Approach EB WB NB SB HCM Control Delay, s HCM LOS A A Minor Lane/Major Mvmt NBLn1 EBL EBT EBR WBL WBT WBR SBLn1 Capacity (veh/h) HCM Lane V/C Ratio HCM Control Delay (s) HCM Lane LOS A A A - A A - A HCM 95th %tile Q(veh) Intersection Int Delay, s/veh 1.7 Movement EBT EBR WBL WBT NBL NBR Vol, veh/h Conflicting Peds, #/hr Sign Control Free Free Free Free Stop Stop RT Channelized - None - None - None Storage Length Veh in Median Storage, # Grade, % Peak Hour Factor Heavy Vehicles, % Mvmt Flow Major/Minor Major1 Major2 Minor1 Conflicting Flow All Stage Stage Critical Hdwy Critical Hdwy Stg Critical Hdwy Stg Follow-up Hdwy Pot Cap-1 Maneuver Stage Stage Platoon blocked, % Mov Cap-1 Maneuver Mov Cap-2 Maneuver Stage Stage Approach EB WB NB HCM Control Delay, s HCM LOS A Minor Lane/Major Mvmt NBLn1 EBT EBR WBL WBT Capacity (veh/h) HCM Lane V/C Ratio HCM Control Delay (s) HCM Lane LOS A - - A A HCM 95th %tile Q(veh) Del Prado 7/31/2015 Baseline Synchro 9 Report Ryan Page 1 Del Prado 7/31/2015 Baseline Synchro 9 Report Ryan Page 2
42 Existing + Project AM 3: Centre City Pkwy 8/24/2015 Existing + Project AM 4: W Citracado Pkwy & S Centre City Pkwy 8/24/2015 Intersection Int Delay, s/veh 0.5 Movement EBL EBT EBR WBL WBT WBR NBL NBT NBR SBL SBT SBR Vol, veh/h Conflicting Peds, #/hr Sign Control Stop Stop Stop Stop Stop Stop Free Free Free Free Free Free RT Channelized - - Stop - - Stop - - None - - None Storage Length Veh in Median Storage, # Grade, % Peak Hour Factor Heavy Vehicles, % Mvmt Flow Major/Minor Minor2 Minor1 Major1 Major2 Conflicting Flow All Stage Stage Critical Hdwy Critical Hdwy Stg Critical Hdwy Stg Follow-up Hdwy Pot Cap-1 Maneuver Stage Stage Platoon blocked, % Mov Cap-1 Maneuver Mov Cap-2 Maneuver Stage Stage Approach EB WB NB SB HCM Control Delay, s HCM LOS B B Minor Lane/Major Mvmt NBL NBT NBR EBLn1WBLn1 SBL SBT SBR Capacity (veh/h) HCM Lane V/C Ratio HCM Control Delay (s) HCM Lane LOS B - - B B A - - HCM 95th %tile Q(veh) Intersection Int Delay, s/veh 3.2 Movement EBL EBT EBR WBL WBT WBR NBL NBT NBR SBL SBT SBR Vol, veh/h Conflicting Peds, #/hr Sign Control Free Free Free Free Free Free Stop Stop Stop Stop Stop Stop RT Channelized - - None - - None - - None - - None Storage Length Veh in Median Storage, # Grade, % Peak Hour Factor Heavy Vehicles, % Mvmt Flow Major/Minor Major1 Major2 Minor1 Minor2 Conflicting Flow All Stage Stage Critical Hdwy Critical Hdwy Stg Critical Hdwy Stg Follow-up Hdwy Pot Cap-1 Maneuver Stage Stage Platoon blocked, % Mov Cap-1 Maneuver Mov Cap-2 Maneuver Stage Stage Approach EB WB NB SB HCM Control Delay, s HCM LOS B B Minor Lane/Major Mvmt NBLn1 EBL EBT EBR WBL WBT WBR SBLn1 Capacity (veh/h) HCM Lane V/C Ratio HCM Control Delay (s) HCM Lane LOS B A A - A A - B HCM 95th %tile Q(veh) Del Prado 7/31/2015 Baseline Synchro 9 Report Ryan Page 3 Del Prado 7/31/2015 Baseline Synchro 9 Report Ryan Page 4
43 Existing + Project AM 5: W Citracado Pkwy & Centre City Pkwy 8/24/2015 Existing + Project AM 6: S Centre City Pkwy & P Drwy 3 8/24/2015 Movement EBL EBT EBR WBL WBT WBR NBL NBT NBR SBL SBT SBR Lane Configurations Volume (veh/h) Number Initial Q (Qb), veh Ped-Bike Adj(A_pbT) Parking Bus, Adj Adj Sat Flow, veh/h/ln Adj Flow Rate, veh/h Adj No. of Lanes Peak Hour Factor Percent Heavy Veh, % Cap, veh/h Arrive On Green Sat Flow, veh/h Grp Volume(v), veh/h Grp Sat Flow(s),veh/h/ln Q Serve(g_s), s Cycle Q Clear(g_c), s Prop In Lane Lane Grp Cap(c), veh/h V/C Ratio(X) Avail Cap(c_a), veh/h HCM Platoon Ratio Upstream Filter(I) Uniform Delay (d), s/veh Incr Delay (d2), s/veh Initial Q Delay(d3),s/veh %ile BackOfQ(50%),veh/ln LnGrp Delay(d),s/veh LnGrp LOS C C C C C D A A D B A Approach Vol, veh/h Approach Delay, s/veh Approach LOS C C A B Timer Assigned Phs Phs Duration (G+Y+Rc), s Change Period (Y+Rc), s Max Green Setting (Gmax), s Max Q Clear Time (g_c+i1), s Green Ext Time (p_c), s Intersection Summary HCM 2010 Ctrl Delay 13.7 HCM 2010 LOS B Intersection Int Delay, s/veh 3.6 Movement EBL EBR NBL NBT SBT SBR Vol, veh/h Conflicting Peds, #/hr Sign Control Stop Stop Free Free Free Free RT Channelized - None - None - None Storage Length Veh in Median Storage, # Grade, % Peak Hour Factor Heavy Vehicles, % Mvmt Flow Major/Minor Minor2 Major1 Major2 Conflicting Flow All Stage Stage Critical Hdwy Critical Hdwy Stg Critical Hdwy Stg Follow-up Hdwy Pot Cap-1 Maneuver Stage Stage Platoon blocked, % Mov Cap-1 Maneuver Mov Cap-2 Maneuver Stage Stage Approach EB NB SB HCM Control Delay, s HCM LOS A Minor Lane/Major Mvmt NBL NBT EBLn1 SBT SBR Capacity (veh/h) HCM Lane V/C Ratio HCM Control Delay (s) HCM Lane LOS A A A - - HCM 95th %tile Q(veh) Del Prado 7/31/2015 Baseline Synchro 9 Report Ryan Page 5 Del Prado 7/31/2015 Baseline Synchro 9 Report Ryan Page 7
44 Existing + Project PM 1: P. Drwy1/Charise Street & Brotherton Road 8/24/2015 Existing + Project PM 2: S Centre City Parkway & Brotherton Road 8/24/2015 Intersection Int Delay, s/veh 4.1 Movement EBL EBT EBR WBL WBT WBR NBL NBT NBR SBL SBT SBR Vol, veh/h Conflicting Peds, #/hr Sign Control Free Free Free Free Free Free Stop Stop Stop Stop Stop Stop RT Channelized - - None - - None - - None - - None Storage Length Veh in Median Storage, # Grade, % Peak Hour Factor Heavy Vehicles, % Mvmt Flow Major/Minor Major1 Major2 Minor1 Minor2 Conflicting Flow All Stage Stage Critical Hdwy Critical Hdwy Stg Critical Hdwy Stg Follow-up Hdwy Pot Cap-1 Maneuver Stage Stage Platoon blocked, % Mov Cap-1 Maneuver Mov Cap-2 Maneuver Stage Stage Approach EB WB NB SB HCM Control Delay, s HCM LOS A A Minor Lane/Major Mvmt NBLn1 EBL EBT EBR WBL WBT WBR SBLn1 Capacity (veh/h) HCM Lane V/C Ratio HCM Control Delay (s) HCM Lane LOS A A A - A A - A HCM 95th %tile Q(veh) Intersection Int Delay, s/veh 1.5 Movement EBT EBR WBL WBT NBL NBR Vol, veh/h Conflicting Peds, #/hr Sign Control Free Free Free Free Stop Stop RT Channelized - None - None - None Storage Length Veh in Median Storage, # Grade, % Peak Hour Factor Heavy Vehicles, % Mvmt Flow Major/Minor Major1 Major2 Minor1 Conflicting Flow All Stage Stage Critical Hdwy Critical Hdwy Stg Critical Hdwy Stg Follow-up Hdwy Pot Cap-1 Maneuver Stage Stage Platoon blocked, % Mov Cap-1 Maneuver Mov Cap-2 Maneuver Stage Stage Approach EB WB NB HCM Control Delay, s HCM LOS A Minor Lane/Major Mvmt NBLn1 EBT EBR WBL WBT Capacity (veh/h) HCM Lane V/C Ratio HCM Control Delay (s) HCM Lane LOS A - - A A HCM 95th %tile Q(veh) Del Prado 7/31/2015 Baseline Synchro 9 Report Ryan Page 1 Del Prado 7/31/2015 Baseline Synchro 9 Report Ryan Page 2
45 Existing + Project PM 3: Centre City Pkwy 8/24/2015 Existing + Project PM 4: W Citracado Pkwy & S Centre City Pkwy 8/24/2015 Intersection Int Delay, s/veh 0.9 Movement EBL EBT EBR WBL WBT WBR NBL NBT NBR SBL SBT SBR Vol, veh/h Conflicting Peds, #/hr Sign Control Stop Stop Stop Stop Stop Stop Free Free Free Free Free Free RT Channelized - - Stop - - Stop - - None - - None Storage Length Veh in Median Storage, # Grade, % Peak Hour Factor Heavy Vehicles, % Mvmt Flow Major/Minor Minor2 Minor1 Major1 Major2 Conflicting Flow All Stage Stage Critical Hdwy Critical Hdwy Stg Critical Hdwy Stg Follow-up Hdwy Pot Cap-1 Maneuver Stage Stage Platoon blocked, % Mov Cap-1 Maneuver Mov Cap-2 Maneuver Stage Stage Approach EB WB NB SB HCM Control Delay, s HCM LOS B C Minor Lane/Major Mvmt NBL NBT NBR EBLn1WBLn1 SBL SBT SBR Capacity (veh/h) HCM Lane V/C Ratio HCM Control Delay (s) HCM Lane LOS A - - B C B - - HCM 95th %tile Q(veh) Intersection Int Delay, s/veh 2.5 Movement EBL EBT EBR WBL WBT WBR NBL NBT NBR SBL SBT SBR Vol, veh/h Conflicting Peds, #/hr Sign Control Free Free Free Free Free Free Stop Stop Stop Stop Stop Stop RT Channelized - - None - - None - - None - - None Storage Length Veh in Median Storage, # Grade, % Peak Hour Factor Heavy Vehicles, % Mvmt Flow Major/Minor Major1 Major2 Minor1 Minor2 Conflicting Flow All Stage Stage Critical Hdwy Critical Hdwy Stg Critical Hdwy Stg Follow-up Hdwy Pot Cap-1 Maneuver Stage Stage Platoon blocked, % Mov Cap-1 Maneuver Mov Cap-2 Maneuver Stage Stage Approach EB WB NB SB HCM Control Delay, s HCM LOS B B Minor Lane/Major Mvmt NBLn1 EBL EBT EBR WBL WBT WBR SBLn1 Capacity (veh/h) HCM Lane V/C Ratio HCM Control Delay (s) HCM Lane LOS B A A - A A - B HCM 95th %tile Q(veh) Del Prado 7/31/2015 Baseline Synchro 9 Report Ryan Page 3 Del Prado 7/31/2015 Baseline Synchro 9 Report Ryan Page 4
46 Existing + Project PM 5: W Citracado Pkwy & Centre City Pkwy 8/24/2015 Existing + Project PM 6: S Centre City Pkwy & P Drwy 3 8/24/2015 Movement EBL EBT EBR WBL WBT WBR NBL NBT NBR SBL SBT SBR Lane Configurations Volume (veh/h) Number Initial Q (Qb), veh Ped-Bike Adj(A_pbT) Parking Bus, Adj Adj Sat Flow, veh/h/ln Adj Flow Rate, veh/h Adj No. of Lanes Peak Hour Factor Percent Heavy Veh, % Cap, veh/h Arrive On Green Sat Flow, veh/h Grp Volume(v), veh/h Grp Sat Flow(s),veh/h/ln Q Serve(g_s), s Cycle Q Clear(g_c), s Prop In Lane Lane Grp Cap(c), veh/h V/C Ratio(X) Avail Cap(c_a), veh/h HCM Platoon Ratio Upstream Filter(I) Uniform Delay (d), s/veh Incr Delay (d2), s/veh Initial Q Delay(d3),s/veh %ile BackOfQ(50%),veh/ln LnGrp Delay(d),s/veh LnGrp LOS C C C C C C D B A D A A Approach Vol, veh/h Approach Delay, s/veh Approach LOS C C B A Timer Assigned Phs Phs Duration (G+Y+Rc), s Change Period (Y+Rc), s Max Green Setting (Gmax), s Max Q Clear Time (g_c+i1), s Green Ext Time (p_c), s Intersection Summary HCM 2010 Ctrl Delay 14.2 HCM 2010 LOS B Intersection Int Delay, s/veh 3.3 Movement EBL EBR NBL NBT SBT SBR Vol, veh/h Conflicting Peds, #/hr Sign Control Stop Stop Free Free Free Free RT Channelized - None - None - None Storage Length Veh in Median Storage, # Grade, % Peak Hour Factor Heavy Vehicles, % Mvmt Flow Major/Minor Minor2 Major1 Major2 Conflicting Flow All Stage Stage Critical Hdwy Critical Hdwy Stg Critical Hdwy Stg Follow-up Hdwy Pot Cap-1 Maneuver Stage Stage Platoon blocked, % Mov Cap-1 Maneuver Mov Cap-2 Maneuver Stage Stage Approach EB NB SB HCM Control Delay, s HCM LOS A Minor Lane/Major Mvmt NBL NBT EBLn1 SBT SBR Capacity (veh/h) HCM Lane V/C Ratio HCM Control Delay (s) HCM Lane LOS A A A - - HCM 95th %tile Q(veh) Del Prado 7/31/2015 Baseline Synchro 9 Report Ryan Page 5 Del Prado 7/31/2015 Baseline Synchro 9 Report Ryan Page 7
47 APPENDIX F PEAK HOUR INTERSECTION ANALYSIS WORKSHEETS NEAR-TERM CONDITIONS
48 Near Term AM 1: Brotherton Road & Charise Street 8/24/2015 Near Term AM 2: S Centre City Parkway & Brotherton Road 8/24/2015 Intersection Int Delay, s/veh 2.2 Movement EBL EBT WBT WBR SBL SBR Vol, veh/h Conflicting Peds, #/hr Sign Control Free Free Free Free Stop Stop RT Channelized - None - None - None Storage Length Veh in Median Storage, # Grade, % Peak Hour Factor Heavy Vehicles, % Mvmt Flow Major/Minor Major1 Major2 Minor2 Conflicting Flow All Stage Stage Critical Hdwy Critical Hdwy Stg Critical Hdwy Stg Follow-up Hdwy Pot Cap-1 Maneuver Stage Stage Platoon blocked, % Mov Cap-1 Maneuver Mov Cap-2 Maneuver Stage Stage Approach EB WB SB HCM Control Delay, s HCM LOS A Minor Lane/Major Mvmt EBL EBT WBT WBR SBLn1 Capacity (veh/h) HCM Lane V/C Ratio HCM Control Delay (s) HCM Lane LOS A A - - A HCM 95th %tile Q(veh) Intersection Int Delay, s/veh 1.1 Movement EBT EBR WBL WBT NBL NBR Vol, veh/h Conflicting Peds, #/hr Sign Control Free Free Free Free Stop Stop RT Channelized - None - None - None Storage Length Veh in Median Storage, # Grade, % Peak Hour Factor Heavy Vehicles, % Mvmt Flow Major/Minor Major1 Major2 Minor1 Conflicting Flow All Stage Stage Critical Hdwy Critical Hdwy Stg Critical Hdwy Stg Follow-up Hdwy Pot Cap-1 Maneuver Stage Stage Platoon blocked, % Mov Cap-1 Maneuver Mov Cap-2 Maneuver Stage Stage Approach EB WB NB HCM Control Delay, s HCM LOS B Minor Lane/Major Mvmt NBLn1 EBT EBR WBL WBT Capacity (veh/h) HCM Lane V/C Ratio HCM Control Delay (s) HCM Lane LOS B - - A A HCM 95th %tile Q(veh) Del Prado 5:00 pm 7/31/2015 Baseline Synchro 9 Report Ryan Page 1 Del Prado 5:00 pm 7/31/2015 Baseline Synchro 9 Report Ryan Page 2
49 Near Term AM 3: Centre City Parkway/Centre City Pkwy & Brotherton Road 8/24/2015 Near Term AM 4: W Citracado Pkwy/W Citracado Parkway & S Centre City Pkwy 8/24/2015 Intersection Int Delay, s/veh 0.8 Movement EBL EBT EBR WBL WBT WBR NBL NBT NBR SBL SBT SBR Vol, veh/h Conflicting Peds, #/hr Sign Control Stop Stop Stop Stop Stop Stop Free Free Free Free Free Free RT Channelized - - Stop - - Stop - - None - - None Storage Length Veh in Median Storage, # Grade, % Peak Hour Factor Heavy Vehicles, % Mvmt Flow Major/Minor Minor2 Minor1 Major1 Major2 Conflicting Flow All Stage Stage Critical Hdwy Critical Hdwy Stg Critical Hdwy Stg Follow-up Hdwy Pot Cap-1 Maneuver Stage Stage Platoon blocked, % Mov Cap-1 Maneuver Mov Cap-2 Maneuver Stage Stage Approach EB WB NB SB HCM Control Delay, s HCM LOS B B Minor Lane/Major Mvmt NBL NBT NBR EBLn1WBLn1 SBL SBT SBR Capacity (veh/h) HCM Lane V/C Ratio HCM Control Delay (s) HCM Lane LOS B - - B B A - - HCM 95th %tile Q(veh) Intersection Int Delay, s/veh 3.2 Movement EBL EBT EBR WBL WBT WBR NBL NBT NBR SBL SBT SBR Vol, veh/h Conflicting Peds, #/hr Sign Control Free Free Free Free Free Free Stop Stop Stop Stop Stop Stop RT Channelized - - None - - None - - None - - None Storage Length Veh in Median Storage, # Grade, % Peak Hour Factor Heavy Vehicles, % Mvmt Flow Major/Minor Major1 Major2 Minor1 Minor2 Conflicting Flow All Stage Stage Critical Hdwy Critical Hdwy Stg Critical Hdwy Stg Follow-up Hdwy Pot Cap-1 Maneuver Stage Stage Platoon blocked, % Mov Cap-1 Maneuver Mov Cap-2 Maneuver Stage Stage Approach EB WB NB SB HCM Control Delay, s HCM LOS B B Minor Lane/Major Mvmt NBLn1 EBL EBT EBR WBL WBT WBR SBLn1 Capacity (veh/h) HCM Lane V/C Ratio HCM Control Delay (s) HCM Lane LOS B A A - A A - B HCM 95th %tile Q(veh) Del Prado 5:00 pm 7/31/2015 Baseline Synchro 9 Report Ryan Page 3 Del Prado 5:00 pm 7/31/2015 Baseline Synchro 9 Report Ryan Page 4
50 Near Term AM 5: W Citracado Parkway & Centre City Parkway 8/24/2015 Movement EBL EBT EBR WBL WBT WBR NBL NBT NBR SBL SBT SBR Lane Configurations Volume (veh/h) Number Initial Q (Qb), veh Ped-Bike Adj(A_pbT) Parking Bus, Adj Adj Sat Flow, veh/h/ln Adj Flow Rate, veh/h Adj No. of Lanes Peak Hour Factor Percent Heavy Veh, % Cap, veh/h Arrive On Green Sat Flow, veh/h Grp Volume(v), veh/h Grp Sat Flow(s),veh/h/ln Q Serve(g_s), s Cycle Q Clear(g_c), s Prop In Lane Lane Grp Cap(c), veh/h V/C Ratio(X) Avail Cap(c_a), veh/h HCM Platoon Ratio Upstream Filter(I) Uniform Delay (d), s/veh Incr Delay (d2), s/veh Initial Q Delay(d3),s/veh %ile BackOfQ(50%),veh/ln LnGrp Delay(d),s/veh LnGrp LOS C C C C C C B A A A A A Approach Vol, veh/h Approach Delay, s/veh Approach LOS C C A A Timer Assigned Phs Phs Duration (G+Y+Rc), s Change Period (Y+Rc), s Max Green Setting (Gmax), s Max Q Clear Time (g_c+i1), s Green Ext Time (p_c), s Intersection Summary HCM 2010 Ctrl Delay 11.3 HCM 2010 LOS B Del Prado 5:00 pm 7/31/2015 Baseline Synchro 9 Report Ryan Page 5
51 Near Term PM 1: Brotherton Road & Charise Street 8/24/2015 Near Term PM 2: S Centre City Parkway & Brotherton Road 8/24/2015 Intersection Int Delay, s/veh 1.4 Movement EBL EBT WBT WBR SBL SBR Vol, veh/h Conflicting Peds, #/hr Sign Control Free Free Free Free Stop Stop RT Channelized - None - None - None Storage Length Veh in Median Storage, # Grade, % Peak Hour Factor Heavy Vehicles, % Mvmt Flow Major/Minor Major1 Major2 Minor2 Conflicting Flow All Stage Stage Critical Hdwy Critical Hdwy Stg Critical Hdwy Stg Follow-up Hdwy Pot Cap-1 Maneuver Stage Stage Platoon blocked, % Mov Cap-1 Maneuver Mov Cap-2 Maneuver Stage Stage Approach EB WB SB HCM Control Delay, s HCM LOS A Minor Lane/Major Mvmt EBL EBT WBT WBR SBLn1 Capacity (veh/h) HCM Lane V/C Ratio HCM Control Delay (s) HCM Lane LOS A A - - A HCM 95th %tile Q(veh) Intersection Int Delay, s/veh 0.7 Movement EBT EBR WBL WBT NBL NBR Vol, veh/h Conflicting Peds, #/hr Sign Control Free Free Free Free Stop Stop RT Channelized - None - None - None Storage Length Veh in Median Storage, # Grade, % Peak Hour Factor Heavy Vehicles, % Mvmt Flow Major/Minor Major1 Major2 Minor1 Conflicting Flow All Stage Stage Critical Hdwy Critical Hdwy Stg Critical Hdwy Stg Follow-up Hdwy Pot Cap-1 Maneuver Stage Stage Platoon blocked, % Mov Cap-1 Maneuver Mov Cap-2 Maneuver Stage Stage Approach EB WB NB HCM Control Delay, s HCM LOS A Minor Lane/Major Mvmt NBLn1 EBT EBR WBL WBT Capacity (veh/h) HCM Lane V/C Ratio HCM Control Delay (s) HCM Lane LOS A - - A A HCM 95th %tile Q(veh) Del Prado 5:00 pm 7/31/2015 Baseline Synchro 9 Report Ryan Page 1 Del Prado 5:00 pm 7/31/2015 Baseline Synchro 9 Report Ryan Page 2
52 Near Term PM 3: Centre City Parkway/Centre City Pkwy & Brotherton Road 8/24/2015 Near Term PM 4: W Citracado Pkwy/W Citracado Parkway & S Centre City Pkwy 8/24/2015 Intersection Int Delay, s/veh 1.1 Movement EBL EBT EBR WBL WBT WBR NBL NBT NBR SBL SBT SBR Vol, veh/h Conflicting Peds, #/hr Sign Control Stop Stop Stop Stop Stop Stop Free Free Free Free Free Free RT Channelized - - Stop - - Stop - - None - - None Storage Length Veh in Median Storage, # Grade, % Peak Hour Factor Heavy Vehicles, % Mvmt Flow Major/Minor Minor2 Minor1 Major1 Major2 Conflicting Flow All Stage Stage Critical Hdwy Critical Hdwy Stg Critical Hdwy Stg Follow-up Hdwy Pot Cap-1 Maneuver Stage Stage Platoon blocked, % Mov Cap-1 Maneuver Mov Cap-2 Maneuver Stage Stage Approach EB WB NB SB HCM Control Delay, s HCM LOS B C Minor Lane/Major Mvmt NBL NBT NBR EBLn1WBLn1 SBL SBT SBR Capacity (veh/h) HCM Lane V/C Ratio HCM Control Delay (s) HCM Lane LOS A - - B C B - - HCM 95th %tile Q(veh) Intersection Int Delay, s/veh 2.9 Movement EBL EBT EBR WBL WBT WBR NBL NBT NBR SBL SBT SBR Vol, veh/h Conflicting Peds, #/hr Sign Control Free Free Free Free Free Free Stop Stop Stop Stop Stop Stop RT Channelized - - None - - None - - None - - None Storage Length Veh in Median Storage, # Grade, % Peak Hour Factor Heavy Vehicles, % Mvmt Flow Major/Minor Major1 Major2 Minor1 Minor2 Conflicting Flow All Stage Stage Critical Hdwy Critical Hdwy Stg Critical Hdwy Stg Follow-up Hdwy Pot Cap-1 Maneuver Stage Stage Platoon blocked, % Mov Cap-1 Maneuver Mov Cap-2 Maneuver Stage Stage Approach EB WB NB SB HCM Control Delay, s HCM LOS B B Minor Lane/Major Mvmt NBLn1 EBL EBT EBR WBL WBT WBR SBLn1 Capacity (veh/h) HCM Lane V/C Ratio HCM Control Delay (s) HCM Lane LOS B A A - A A - B HCM 95th %tile Q(veh) Del Prado 5:00 pm 7/31/2015 Baseline Synchro 9 Report Ryan Page 3 Del Prado 5:00 pm 7/31/2015 Baseline Synchro 9 Report Ryan Page 4
53 Near Term PM 5: W Citracado Parkway & Centre City Parkway 8/24/2015 Movement EBL EBT EBR WBL WBT WBR NBL NBT NBR SBL SBT SBR Lane Configurations Volume (veh/h) Number Initial Q (Qb), veh Ped-Bike Adj(A_pbT) Parking Bus, Adj Adj Sat Flow, veh/h/ln Adj Flow Rate, veh/h Adj No. of Lanes Peak Hour Factor Percent Heavy Veh, % Cap, veh/h Arrive On Green Sat Flow, veh/h Grp Volume(v), veh/h Grp Sat Flow(s),veh/h/ln Q Serve(g_s), s Cycle Q Clear(g_c), s Prop In Lane Lane Grp Cap(c), veh/h V/C Ratio(X) Avail Cap(c_a), veh/h HCM Platoon Ratio Upstream Filter(I) Uniform Delay (d), s/veh Incr Delay (d2), s/veh Initial Q Delay(d3),s/veh %ile BackOfQ(50%),veh/ln LnGrp Delay(d),s/veh LnGrp LOS C C C C C C A A A B A A Approach Vol, veh/h Approach Delay, s/veh Approach LOS C C A A Timer Assigned Phs Phs Duration (G+Y+Rc), s Change Period (Y+Rc), s Max Green Setting (Gmax), s Max Q Clear Time (g_c+i1), s Green Ext Time (p_c), s Intersection Summary HCM 2010 Ctrl Delay 10.2 HCM 2010 LOS B Del Prado 5:00 pm 7/31/2015 Baseline Synchro 9 Report Ryan Page 5
54 Near Term + Project AM 1: P. Drwy1/Charise Street & Brotherton Road 8/24/2015 Near Term + Project AM 2: S Centre City Parkway & Brotherton Road 8/24/2015 Intersection Int Delay, s/veh 4.3 Movement EBL EBT EBR WBL WBT WBR NBL NBT NBR SBL SBT SBR Vol, veh/h Conflicting Peds, #/hr Sign Control Free Free Free Free Free Free Stop Stop Stop Stop Stop Stop RT Channelized - - None - - None - - None - - None Storage Length Veh in Median Storage, # Grade, % Peak Hour Factor Heavy Vehicles, % Mvmt Flow Major/Minor Major1 Major2 Minor1 Minor2 Conflicting Flow All Stage Stage Critical Hdwy Critical Hdwy Stg Critical Hdwy Stg Follow-up Hdwy Pot Cap-1 Maneuver Stage Stage Platoon blocked, % Mov Cap-1 Maneuver Mov Cap-2 Maneuver Stage Stage Approach EB WB NB SB HCM Control Delay, s HCM LOS A A Minor Lane/Major Mvmt NBLn1 EBL EBT EBR WBL WBT WBR SBLn1 Capacity (veh/h) HCM Lane V/C Ratio HCM Control Delay (s) HCM Lane LOS A A A - A A - A HCM 95th %tile Q(veh) Intersection Int Delay, s/veh 1 Movement EBT EBR WBL WBT NBL NBR Vol, veh/h Conflicting Peds, #/hr Sign Control Free Free Free Free Stop Stop RT Channelized - None - None - None Storage Length Veh in Median Storage, # Grade, % Peak Hour Factor Heavy Vehicles, % Mvmt Flow Major/Minor Major1 Major2 Minor1 Conflicting Flow All Stage Stage Critical Hdwy Critical Hdwy Stg Critical Hdwy Stg Follow-up Hdwy Pot Cap-1 Maneuver Stage Stage Platoon blocked, % Mov Cap-1 Maneuver Mov Cap-2 Maneuver Stage Stage Approach EB WB NB HCM Control Delay, s HCM LOS B Minor Lane/Major Mvmt NBLn1 EBT EBR WBL WBT Capacity (veh/h) HCM Lane V/C Ratio HCM Control Delay (s) HCM Lane LOS B - - A A HCM 95th %tile Q(veh) Del Prado 7/31/2015 Baseline Synchro 9 Report Ryan Page 1 Del Prado 7/31/2015 Baseline Synchro 9 Report Ryan Page 2
55 Near Term + Project AM 3: Centre City Pkwy 8/24/2015 Near Term + Project AM 4: W Citracado Pkwy & S Centre City Pkwy 8/24/2015 Intersection Int Delay, s/veh 0.9 Movement EBL EBT EBR WBL WBT WBR NBL NBT NBR SBL SBT SBR Vol, veh/h Conflicting Peds, #/hr Sign Control Stop Stop Stop Stop Stop Stop Free Free Free Free Free Free RT Channelized - - Stop - - Stop - - None - - None Storage Length Veh in Median Storage, # Grade, % Peak Hour Factor Heavy Vehicles, % Mvmt Flow Major/Minor Minor2 Minor1 Major1 Major2 Conflicting Flow All Stage Stage Critical Hdwy Critical Hdwy Stg Critical Hdwy Stg Follow-up Hdwy Pot Cap-1 Maneuver Stage Stage Platoon blocked, % Mov Cap-1 Maneuver Mov Cap-2 Maneuver Stage Stage Approach EB WB NB SB HCM Control Delay, s HCM LOS C B Minor Lane/Major Mvmt NBL NBT NBR EBLn1WBLn1 SBL SBT SBR Capacity (veh/h) HCM Lane V/C Ratio HCM Control Delay (s) HCM Lane LOS B - - C B A - - HCM 95th %tile Q(veh) Intersection Int Delay, s/veh 4 Movement EBL EBT EBR WBL WBT WBR NBL NBT NBR SBL SBT SBR Vol, veh/h Conflicting Peds, #/hr Sign Control Free Free Free Free Free Free Stop Stop Stop Stop Stop Stop RT Channelized - - None - - None - - None - - None Storage Length Veh in Median Storage, # Grade, % Peak Hour Factor Heavy Vehicles, % Mvmt Flow Major/Minor Major1 Major2 Minor1 Minor2 Conflicting Flow All Stage Stage Critical Hdwy Critical Hdwy Stg Critical Hdwy Stg Follow-up Hdwy Pot Cap-1 Maneuver Stage Stage Platoon blocked, % Mov Cap-1 Maneuver Mov Cap-2 Maneuver Stage Stage Approach EB WB NB SB HCM Control Delay, s HCM LOS B B Minor Lane/Major Mvmt NBLn1 EBL EBT EBR WBL WBT WBR SBLn1 Capacity (veh/h) HCM Lane V/C Ratio HCM Control Delay (s) HCM Lane LOS B A A - A A - B HCM 95th %tile Q(veh) Del Prado 7/31/2015 Baseline Synchro 9 Report Ryan Page 3 Del Prado 7/31/2015 Baseline Synchro 9 Report Ryan Page 4
56 Near Term + Project AM 5: W Citracado Pkwy & Centre City Pkwy 8/24/2015 Near Term + Project AM 6: S Centre City Pkwy & P Drwy 3 8/24/2015 Movement EBL EBT EBR WBL WBT WBR NBL NBT NBR SBL SBT SBR Lane Configurations Volume (veh/h) Number Initial Q (Qb), veh Ped-Bike Adj(A_pbT) Parking Bus, Adj Adj Sat Flow, veh/h/ln Adj Flow Rate, veh/h Adj No. of Lanes Peak Hour Factor Percent Heavy Veh, % Cap, veh/h Arrive On Green Sat Flow, veh/h Grp Volume(v), veh/h Grp Sat Flow(s),veh/h/ln Q Serve(g_s), s Cycle Q Clear(g_c), s Prop In Lane Lane Grp Cap(c), veh/h V/C Ratio(X) Avail Cap(c_a), veh/h HCM Platoon Ratio Upstream Filter(I) Uniform Delay (d), s/veh Incr Delay (d2), s/veh Initial Q Delay(d3),s/veh %ile BackOfQ(50%),veh/ln LnGrp Delay(d),s/veh LnGrp LOS C C C C C C D A A D B A Approach Vol, veh/h Approach Delay, s/veh Approach LOS C C A B Timer Assigned Phs Phs Duration (G+Y+Rc), s Change Period (Y+Rc), s Max Green Setting (Gmax), s Max Q Clear Time (g_c+i1), s Green Ext Time (p_c), s Intersection Summary HCM 2010 Ctrl Delay 15.0 HCM 2010 LOS B Intersection Int Delay, s/veh 3.6 Movement EBL EBR NBL NBT SBT SBR Vol, veh/h Conflicting Peds, #/hr Sign Control Stop Stop Free Free Free Free RT Channelized - None - None - None Storage Length Veh in Median Storage, # Grade, % Peak Hour Factor Heavy Vehicles, % Mvmt Flow Major/Minor Minor2 Major1 Major2 Conflicting Flow All Stage Stage Critical Hdwy Critical Hdwy Stg Critical Hdwy Stg Follow-up Hdwy Pot Cap-1 Maneuver Stage Stage Platoon blocked, % Mov Cap-1 Maneuver Mov Cap-2 Maneuver Stage Stage Approach EB NB SB HCM Control Delay, s HCM LOS A Minor Lane/Major Mvmt NBL NBT EBLn1 SBT SBR Capacity (veh/h) HCM Lane V/C Ratio HCM Control Delay (s) HCM Lane LOS A A A - - HCM 95th %tile Q(veh) Del Prado 7/31/2015 Baseline Synchro 9 Report Ryan Page 5 Del Prado 7/31/2015 Baseline Synchro 9 Report Ryan Page 7
57 Near Term + Project PM 1: P. Drwy1/Charise Street & Brotherton Road 8/24/2015 Near Term + Project PM 2: S Centre City Parkway & Brotherton Road 8/24/2015 Intersection Int Delay, s/veh 3.5 Movement EBL EBT EBR WBL WBT WBR NBL NBT NBR SBL SBT SBR Vol, veh/h Conflicting Peds, #/hr Sign Control Free Free Free Free Free Free Stop Stop Stop Stop Stop Stop RT Channelized - - None - - None - - None - - None Storage Length Veh in Median Storage, # Grade, % Peak Hour Factor Heavy Vehicles, % Mvmt Flow Major/Minor Major1 Major2 Minor1 Minor2 Conflicting Flow All Stage Stage Critical Hdwy Critical Hdwy Stg Critical Hdwy Stg Follow-up Hdwy Pot Cap-1 Maneuver Stage Stage Platoon blocked, % Mov Cap-1 Maneuver Mov Cap-2 Maneuver Stage Stage Approach EB WB NB SB HCM Control Delay, s HCM LOS A A Minor Lane/Major Mvmt NBLn1 EBL EBT EBR WBL WBT WBR SBLn1 Capacity (veh/h) HCM Lane V/C Ratio HCM Control Delay (s) HCM Lane LOS A A A - A A - A HCM 95th %tile Q(veh) Intersection Int Delay, s/veh 0.9 Movement EBT EBR WBL WBT NBL NBR Vol, veh/h Conflicting Peds, #/hr Sign Control Free Free Free Free Stop Stop RT Channelized - None - None - None Storage Length Veh in Median Storage, # Grade, % Peak Hour Factor Heavy Vehicles, % Mvmt Flow Major/Minor Major1 Major2 Minor1 Conflicting Flow All Stage Stage Critical Hdwy Critical Hdwy Stg Critical Hdwy Stg Follow-up Hdwy Pot Cap-1 Maneuver Stage Stage Platoon blocked, % Mov Cap-1 Maneuver Mov Cap-2 Maneuver Stage Stage Approach EB WB NB HCM Control Delay, s HCM LOS B Minor Lane/Major Mvmt NBLn1 EBT EBR WBL WBT Capacity (veh/h) HCM Lane V/C Ratio HCM Control Delay (s) HCM Lane LOS B - - A A HCM 95th %tile Q(veh) Del Prado 7/31/2015 Baseline Synchro 9 Report Ryan Page 1 Del Prado 7/31/2015 Baseline Synchro 9 Report Ryan Page 2
58 Near Term + Project PM 3: Centre City Pkwy 8/24/2015 Near Term + Project PM 4: W Citracado Pkwy & S Centre City Pkwy 8/24/2015 Intersection Int Delay, s/veh 1.2 Movement EBL EBT EBR WBL WBT WBR NBL NBT NBR SBL SBT SBR Vol, veh/h Conflicting Peds, #/hr Sign Control Stop Stop Stop Stop Stop Stop Free Free Free Free Free Free RT Channelized - - Stop - - Stop - - None - - None Storage Length Veh in Median Storage, # Grade, % Peak Hour Factor Heavy Vehicles, % Mvmt Flow Major/Minor Minor2 Minor1 Major1 Major2 Conflicting Flow All Stage Stage Critical Hdwy Critical Hdwy Stg Critical Hdwy Stg Follow-up Hdwy Pot Cap-1 Maneuver Stage Stage Platoon blocked, % Mov Cap-1 Maneuver Mov Cap-2 Maneuver Stage Stage Approach EB WB NB SB HCM Control Delay, s HCM LOS B C Minor Lane/Major Mvmt NBL NBT NBR EBLn1WBLn1 SBL SBT SBR Capacity (veh/h) HCM Lane V/C Ratio HCM Control Delay (s) HCM Lane LOS A - - B C B - - HCM 95th %tile Q(veh) Intersection Int Delay, s/veh 3.4 Movement EBL EBT EBR WBL WBT WBR NBL NBT NBR SBL SBT SBR Vol, veh/h Conflicting Peds, #/hr Sign Control Free Free Free Free Free Free Stop Stop Stop Stop Stop Stop RT Channelized - - None - - None - - None - - None Storage Length Veh in Median Storage, # Grade, % Peak Hour Factor Heavy Vehicles, % Mvmt Flow Major/Minor Major1 Major2 Minor1 Minor2 Conflicting Flow All Stage Stage Critical Hdwy Critical Hdwy Stg Critical Hdwy Stg Follow-up Hdwy Pot Cap-1 Maneuver Stage Stage Platoon blocked, % Mov Cap-1 Maneuver Mov Cap-2 Maneuver Stage Stage Approach EB WB NB SB HCM Control Delay, s HCM LOS B B Minor Lane/Major Mvmt NBLn1 EBL EBT EBR WBL WBT WBR SBLn1 Capacity (veh/h) HCM Lane V/C Ratio HCM Control Delay (s) HCM Lane LOS B A A - A A - B HCM 95th %tile Q(veh) Del Prado 7/31/2015 Baseline Synchro 9 Report Ryan Page 3 Del Prado 7/31/2015 Baseline Synchro 9 Report Ryan Page 4
59 Near Term + Project PM 5: W Citracado Pkwy & Centre City Pkwy 8/24/2015 Near Term + Project PM 6: S Centre City Pkwy & P Drwy 3 8/24/2015 Movement EBL EBT EBR WBL WBT WBR NBL NBT NBR SBL SBT SBR Lane Configurations Volume (veh/h) Number Initial Q (Qb), veh Ped-Bike Adj(A_pbT) Parking Bus, Adj Adj Sat Flow, veh/h/ln Adj Flow Rate, veh/h Adj No. of Lanes Peak Hour Factor Percent Heavy Veh, % Cap, veh/h Arrive On Green Sat Flow, veh/h Grp Volume(v), veh/h Grp Sat Flow(s),veh/h/ln Q Serve(g_s), s Cycle Q Clear(g_c), s Prop In Lane Lane Grp Cap(c), veh/h V/C Ratio(X) Avail Cap(c_a), veh/h HCM Platoon Ratio Upstream Filter(I) Uniform Delay (d), s/veh Incr Delay (d2), s/veh Initial Q Delay(d3),s/veh %ile BackOfQ(50%),veh/ln LnGrp Delay(d),s/veh LnGrp LOS C C C C C C D B A D A A Approach Vol, veh/h Approach Delay, s/veh Approach LOS C C B A Timer Assigned Phs Phs Duration (G+Y+Rc), s Change Period (Y+Rc), s Max Green Setting (Gmax), s Max Q Clear Time (g_c+i1), s Green Ext Time (p_c), s Intersection Summary HCM 2010 Ctrl Delay 14.7 HCM 2010 LOS B Intersection Int Delay, s/veh 3.3 Movement EBL EBR NBL NBT SBT SBR Vol, veh/h Conflicting Peds, #/hr Sign Control Stop Stop Free Free Free Free RT Channelized - None - None - None Storage Length Veh in Median Storage, # Grade, % Peak Hour Factor Heavy Vehicles, % Mvmt Flow Major/Minor Minor2 Major1 Major2 Conflicting Flow All Stage Stage Critical Hdwy Critical Hdwy Stg Critical Hdwy Stg Follow-up Hdwy Pot Cap-1 Maneuver Stage Stage Platoon blocked, % Mov Cap-1 Maneuver Mov Cap-2 Maneuver Stage Stage Approach EB NB SB HCM Control Delay, s HCM LOS A Minor Lane/Major Mvmt NBL NBT EBLn1 SBT SBR Capacity (veh/h) HCM Lane V/C Ratio HCM Control Delay (s) HCM Lane LOS A A A - - HCM 95th %tile Q(veh) Del Prado 7/31/2015 Baseline Synchro 9 Report Ryan Page 5 Del Prado 7/31/2015 Baseline Synchro 9 Report Ryan Page 7

60 DEL PRADO ESCONDIDO TRAFFIC IMPACT STUDY August
61 DEL PRADO ESCONDIDO TRAFFIC IMPACT STUDY August 2015 Prepared for: Touchstone Communities Stowe Drive Suite 130 Poway, CA Prepared by: KOA Corporation 5095 Murphy Canyon Road, Suite 330 San Diego, CA (619) Fax: (619) Job No.: JB42056
62 Table of Contents CHAPTER 1THE PROJECT...1 PROJECT DESCRIPTION...1 STUDY AREA...1 Roadway Segments...1 Intersections...1 PROJECT TRIP GENERATION...1 TRIP DISTRIBUTION AND ASSIGNMENT...2 PROJECT ACCESS...2 CHAPTER 2METHODOLOGIES...11 STUDY SCENARIOS...11 ANALYSIS METHODOLOGIES...11 Roadway Segment Capacity Analysis...11 Intersection Capacity Analysis...11 Signalized Intersections...12 Two-Way Stop-Controlled Intersections...12 Analysis of Significance...12 CHAPTER 3EXISTING CONDITIONS...13 ROADWAY NETWORK...13 TRAFFIC VOLUMES...13 CHAPTER 4NEAR-TERM CONDITIONS...23 NEAR-TERM TRAFFIC VOLUMES...23 NEAR-TERM CIRCULATION NETWORK...23 CHAPTER 5ON-SITE CIRCULATION,PEDESTRIAN,TRANSIT,BICYCLE AND PARKING...32 ON-SITE CIRCULATION...32 PEDESTRIAN...32 TRANSIT...32 BICYCLE...32 PARKING...32 CHAPTER 6SUMMARY OF ANALYSIS...33 CHAPTER 7RECOMMENDATIONS...35 KOA Corporation i August 2015
63 List of Figures FIGURE 1-1 PROJECT STUDY AREA...3 FIGURE 1-2 PROJECT SITE PLAN...4 FIGURE 1-3 PROJECT OUTBOUND TRIP DISTRIBUTION...6 FIGURE 1-4 PROJECT INBOUND TRIP DISTRIBUTION...7 FIGURE 1-5 DAILY PROJECT TRIPS...8 FIGURE 1-6 AM PEAK HOUR PROJECT TRIPS...9 FIGURE 1-7 PM PEAK HOUR PROJECT TRIPS...10 FIGURE 3-1 EXISTING CIRCULATION NETWORK...16 FIGURE 3-2 EXISTING ROADWAY SEGMENT VOLUMES...17 FIGURE 3-3 EXISTING AM PEAK HOUR INTERSECTION VOLUMES...18 FIGURE 3-4 EXISTING PM PEAK HOUR INTERSECTION VOLUMES...19 FIGURE 3-5 EXISTING ROADWAY SEGMENT VOLUMES WITH PROJECT...20 FIGURE 3-6 EXISTING AM PEAK HOUR INTERSECTION VOLUMES WITH PROJECT...21 FIGURE 3-7 EXISTING PM PEAK HOUR INTERSECTION VOLUMES WITH PROJECT...22 FIGURE 4-1 NEAR-TERM ROADWAY SEGMENT VOLUMES WITHOUT PROJECT...26 FIGURE 4-2 NEAR-TERM AM PEAK HOUR INTERSECTION VOLUMES WITHOUT PROJECT...27 FIGURE 4-3 NEAR-TERM PM PEAK HOUR INTERSECTION VOLUMES WITHOUT PROJECT...28 FIGURE 4-4 NEAR-TERM ROADWAY SEGMENT VOLUMES WITH PROJECT...29 FIGURE 4-5 NEAR-TERM AM PEAK HOUR INTERSECTION VOLUMES WITH PROJECT...30 FIGURE 4-6 NEAR-TERM PM PEAK HOUR INTERSECTION VOLUMES WITH PROJECT...31 List of Tables TABLE 1-1 PROJECT TRIP GENERATION...2 TABLE 3-1 EXISTING ROADWAY SEGMENT CONDITIONS...14 TABLE 3-2 EXISTING INTERSECTION CONDITIONS...15 TABLE 4-1 CUMULATIVE PROJECTS...23 TABLE 4-2 NEAR-TERM ROADWAY SEGMENT CONDITIONS...24 TABLE 4-3 NEAR-TERM INTERSECTION CONDITIONS...25 TABLE 6-1 SUMMARY OF ROADWAY SEGMENT CONDITIONS...33 TABLE 6-2 SUMMARY OF INTERSECTION CONDITIONS BEFORE MITIGATION...34 Appendices APPENDIX A LEVEL OF SERVICE CONCEPTS,ANALYSIS METHODOLOGIES,STANDARDS OF SIGNIFICANCE APPENDIX B TRAFFIC COUNT DATA APPENDIX C TRIP GENERATION APPENDIX D CUMULATIVE PROJECT INFORMATION APPENDIX E PEAK HOUR INTERSECTION ANALYSIS WORKSHEETS EXISTING CONDITIONS APPENDIX F PEAK HOUR INTERSECTION ANALYSIS WORKSHEETS NEAR-TERM CONDITIONS KOA Corporation ii August 2015
64 Del Prado Escondido TIS The Project CHAPTER 1 THE PROJECT This traffic impact analysis has been prepared for the proposed Del Prado Escondido residential development in the City of Escondido. The proposed project is located on the southwest corner of Brotherton Road and South Centre City Parkway. Access to the project site is provided by two project driveways with one on South Centre City Parkway and one on Brotherton Road. Centre City Parkway is a major arterial that connect the project to other arterials. Interstate 15 (I-15) provides regional access to the project site. Figure 1-1 shows the project study area. Figure 1-2 shows the project site plan. PROJECT DESCRIPTION The project consists of 113 multi-family attached condominiums. The major part of the project site is currently vacant with one single family detached home located at the northwest corner of the project site. The project generates a total of 904 daily driveway trips. STUDY AREA The study area for this project includes those locations that are expected to be affected by this project. The scope of the study area is based on the City of Escondido Traffic Impact Analysis Guideline, discussions with City staff and a working knowledge of the local transportation system. The specific study area includes eight roadway segments and five intersections: Roadway Segments South Centre City Parkway from Brotherton Road to Citracado Parkway Centre City Parkway north of Brotherton Road Centre City Parkway from Brotherton Road to Citracado Parkway Centre City Parkway south of Citracado Parkway Brotherton Road from Charise Street to South Center Parkway Brotherton Road from South Center Parkway to Centre City Parkway Citracado Parkway west of South Centre City Parkway Citracado Parkway from South Centre City Parkway to Centre City Parkway Intersections Charise Street/Project Driveway #1 at Brotherton Road South Centre City Parkway at Brotherton Road Centre City Parkway at Brotherton Road South Centre City Parkway at Citracado Parkway Centre City Parkway at Citracado Parkway PROJECT TRIP GENERATION Trip generation is a measure or forecast of the number of trips that begin or end at the project site. The traffic generated is a function of the extent and type of development proposed for the site. These trips will result in some traffic increases on the streets where they occur. Vehicular traffic generation characteristics for projects are estimated based on established rates. These rates identify the probable KOA Corporation 1 August 2015
65 Del Prado Escondido TIS The Project traffic generation of various land uses based studies of developments in comparable settings. The rates used in this analysis were determined based on rates contained in the (SANDAG) (Not So) Brief Guide of Vehicular Traffic Generation Rates for the San Diego Region (2002). The manual provide standards and recommendations for the probable traffic generation of various land uses based upon local, regional and nationwide studies of existing developments in comparable settings. Appendix C contains excerpts from the manual. Land Use Intensity Unit Daily Rate Table 1-1 Project Trip Generation Daily Trips AM Peak Hour PM Peak Hour Total In Out Total In Out Condominium (6- Rate % 80% % 30% 113 DU 8 trips Per DU DU/AC) Trips Source (Trip Rate): SANDAG (not so) Brief Guide of Vehicular Traffic Generation Rates for the San Diego Region (April 2002). Note: Numbers may not total due to rounding. TRIP DISTRIBUTION AND ASSIGNMENT Trip distribution and assignment is the process of identifying the probable destinations, directions and traffic routes that project related traffic will likely affect. Trip distribution and assignment information has been estimated from observed traffic patterns for this project. Once the proposed developments trips have been estimated, they are assigned to the study area network. The trip distribution and assignment for this project is based on observed traffic patterns and engineering judgment. The trip distribution and assignment for the project-related trips is shown in Figure 1-3 and 1-4. Figures 1-5 through 1-7 show the resulting daily and peak hour project trips. PROJECT ACCESS The proposed project will be accessed through two driveways, one on South Centre City Parkway and one on Brotherton Road. Currently one driveway on South Centre City Parkway exists. The driveway on Brotherton Road would align to Charise Street to form the south leg of the Brotherton Road and Charise Street intersection. KOA Corporation 2 August 2015
66 S Escondido Blvd W Felicita Ave Centre City Pkwy Brotherton Rd Charise St Felicita Ave 15 W Citracado Pkwy S Centre City Pkwy Centre City Pkwy 5 S Escondido Blvd LEGEND # # Project Site One-Way Street Study Intersection Project Driveway J:\KOA-SD\JB42056-Escondido_DelPrado/Figures/JB42056_Figures.ai NOT TO SCALE KOA CORPORATION PLANNING & ENGINEERING Del Prado Escondido, Traffic Impact Study Escondido, CA Page 3 Figure 1-1 Project Study Area
67 J:\KOA-SD\JB42056-Escondido_DelPrado/Figures/JB42056_Figures.ai NOT TO SCALE KOA CORPORATION PLANNING & ENGINEERING Del Prado Escondido, Traffic Impact Study Escondido, CA Page 4 Figure 1-2 Project Site Plan
68 J:\KOA-SD\JB42056-Escondido_DelPrado/Figures/JB42056_Figures.ai NOT TO SCALE KOA CORPORATION PLANNING & ENGINEERING Del Prado Escondido, Traffic Impact Study Escondido, CA Page 5 Figure 1-2 cont. Project Site Plan
69 25% 5% S Escondido Blvd W Felicita Ave Centre City Pkwy 30% Brotherton Rd 5% Charise St 67% Felicita Ave 15 15% 5% W Citracado Pkwy 20% 72% 28% 63% S Centre City Pkwy 35% 43% 13% 32% Centre City Pkwy 30% S Escondido Blvd 45% LEGEND # XX% Project Site One-Way Street Study Intersection Trip Distribution Percentage J:\KOA-SD\JB42056-Escondido_DelPrado/Figures/JB42056_Figures.ai KOA CORPORATION PLANNING & ENGINEERING Del Prado Escondido, Traffic Impact Study Escondido, CA Page 6 NOT TO SCALE Figure 1-3 Project Outbound Trip Distribution
70 25% 5% S Escondido Blvd W Felicita Ave Centre City Pkwy 30% 15% Brotherton Rd 5% Charise St 67% 30% 72% 8% 13% Felicita Ave 15 W Citracado Pkwy 20% 28% S Centre City Pkwy 20% 33% 13% Centre City Pkwy 32% S Escondido Blvd 5% 45% LEGEND # XX% Project Site One-Way Street Study Intersection Trip Distribution Percentage J:\KOA-SD\JB42056-Escondido_DelPrado/Figures/JB42056_Figures.ai KOA CORPORATION PLANNING & ENGINEERING Del Prado Escondido, Traffic Impact Study Escondido, CA Page 7 NOT TO SCALE Figure 1-4 Project Inbound Trip Distribution
71 406 S Escondido Blvd W Felicita Ave Centre City Pkwy Brotherton Rd Charise St Felicita Ave 15 W Citracado Pkwy S Centre City Pkwy 250 Centre City Pkwy S Escondido Blvd LEGEND XX Project Site One-Way Street Daily Project Trips J:\KOA-SD\JB42056-Escondido_DelPrado/Figures/JB42056_Figures.ai NOT TO SCALE KOA CORPORATION PLANNING & ENGINEERING Del Prado Escondido, Traffic Impact Study Escondido, CA Page 8 Figure 1-5 Daily Project Trips
72 4 Brotherton Rd Charise St Felicita Ave 15 W Citracado Pkwy S Centre City Pkwy 4 6 Centre City Pkwy 5 S Escondido Blvd J:\KOA-SD\JB42056-Escondido_DelPrado/Figures/JB42056_Figures.ai NOT TO SCALE KOA CORPORATION PLANNING & ENGINEERING Del Prado Escondido, Traffic Impact Study Escondido, CA Page 9 Figure 1-6 AM Peak Hour Project Trips
73 Brotherton Rd Charise St Felicita Ave 15 W Citracado Pkwy S Centre City Pkwy 4 6 Centre City Pkwy 5 S Escondido Blvd J:\KOA-SD\JB42056-Escondido_DelPrado/Figures/JB42056_Figures.ai KOA CORPORATION PLANNING & ENGINEERING Del Prado Escondido, Traffic Impact Study Escondido, CA Page 10 NOT TO SCALE Figure 1-7 PM Peak Hour Project Trips
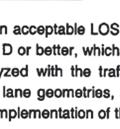
74 Del Prado Escondido TIS Methodologies CHAPTER 2 METHODOLOGIES This chapter documents the methodologies and assumptions used to conduct the traffic impact analysis for the project. Study methodology and analysis is based on the City of Escondido Traffic Impact Analysis Guideline (October, 2013), San Diego Traffic Engineer s Council (SANTEC) and Institute of Transportation Engineers (ITE) guidelines adopted in March The latter two guidelines are used to determine the project s conformance with County of San Diego Public Facility Element policies and evaluate whether a project s impact is perceptible to the average driver. This section contains the following background information: Study scenarios Study time periods Capacity analysis methodologies STUDY SCENARIOS This report presents an analysis of the following analysis scenarios: Existing Conditions Existing Conditions With Project Near-Term Without Project Near-Term With Project Since the proposed project is slightly less dense than the General Plan Land Use Element, the project would have less of an impact on the study intersections and segments. Hence the Horizon Year 2035 conditions scenario was not included in this study report. ANALYSIS METHODOLOGIES Street system operating conditions are typically described in terms of level of service. Level of service is a report-card scale used to indicate the quality of traffic flow on roadway segments and at intersections. Level of service (LOS) ranges from LOS A (free flow, little congestion) to LOS F (forced flow, extreme congestion). A more detailed description of the concepts described in this section is provided in Appendix A of this document. The following methods are outlined in this publication and used in this study. Roadway Segment Capacity Analysis The City of Escondido guidelines have published daily traffic volume standards for roadways within its jurisdiction. To determine service levels on study area roadway segments, we compared the appropriate average daily traffic thresholds for level of service to the daily capacity of the study area roadway segments, and the existing and future volumes in the study area. The thresholds for determining level of service used in this analysis are summarized in Appendix A. Intersection Capacity Analysis The analysis of peak hour intersection performance was conducted using the Synchro analysis software program, which uses methodologies defined in the 2010 Highway Capacity Manual (HCM) KOA Corporation 11 August 2015
75 Del Prado Escondido TIS Methodologies to calculate results. Level of service (LOS) for intersections is determined by control delay. Control delay is defined as the total elapsed time from when a vehicle stops at the end of a queue to the time the vehicle departs from the stop line. The total elapsed time includes the time required for the vehicle to travel from the last-in-queue position to the first-in-queue position, including deceleration of vehicles from free-flow speed to the speed of vehicles in the queue. Appendix A lists the HCM delay/los criteria for both signalized and unsignalized intersections. Signalized Intersections The HCM analysis methodology for evaluating signalized intersections is based on the operational analysis procedure. This technique uses 1,900 passenger cars per hour of green per lane (pcphgpl) as the maximum saturation flow of a single lane at an intersection. This saturation flow rate is adjusted to account for lane width, on-street parking, conflicting pedestrian flow, traffic composition, (e.g., the percentage of vehicles that are trucks) and shared lane movements (e.g., through and rightturn movements from the same lane). Average control delay is calculated by taking a volumeweighted average of all the delays for all vehicles entering the intersection. Two-Way Stop-Controlled Intersections The HCM analysis methodology for evaluating two-way stop-controlled (TWSC) intersections is based on gap acceptance and conflicting traffic for vehicles stopped on the minor-street approaches. The critical gap (or minimum gap that would be acceptable) is defined as the minimum time interval in the major-street traffic stream that allows intersection entry for one minor-street vehicle. Average control delay and LOS for the worst approach are reported. Level of service is not defined for the intersection as a whole. Analysis of Significance To determine direct project impacts, the SANTEC/ITE guidelines have developed a series of thresholds based on allowable increases in volume-to-capacity ratios that become more stringent as level of service worsens. Appendix A summarizes these thresholds. Where roadway segments and intersections operate at LOS C or better impacts are not considered significant. KOA Corporation 12 August 2015
76 Del Prado Escondido TIS Existing Conditions CHAPTER 3 EXISTING CONDITIONS ROADWAY NETWORK The principal roadways in the project study area are described briefly below. The description includes the physical characteristics, adjacent land uses, and traffic control devices along these roadways. The existing roadway geometry and control conditions are shown in Figure 3-1. Additional details regarding specific intersection operating conditions can be found on the capacity analysis worksheets in Appendix E. Centre City Parkway runs north/south splitting off from I-15 close to south limit of the City. It runs east of and parallel to I-15 and passes through downtown Escondido. The street runs past the northern limits of the City and parallel to the I-15 Freeway. The street functions as a four-lane divided major arterial street with bike lanes and with parking restricted. There is no sidewalk and no posted speed limit signs were observed in the vicinity of the project area. The street has frontage roads on either side south of Brotherton Road and on east side north of Brotherton Road, in the vicinity of the project area. The land use west of the street is mainly residential. South Centre City Parkway is a two-way frontage street which runs north/south parallel to and on the west side of Centre City Parkway. The street currently functions as 2 lane undivided local collector. The street has sidewalk and parking is permitted on west side of the street. The roadway provides driveway access to adjacent land uses, which currently consist of retail and a day care center. Citracado Parkway runs east/west and connects Centre City Parkway on the east and I-15 on the west. The street currently functions as 2 lane undivided local collector between Centre City Parkway and Miller Avenue and as a 4 lane divided collector between I-15 northbound ramps and Felicita Road. There is sidewalk on some segments of the street and parking is restricted on both sides of the street. The speed limit is posted at 30 mph at the east end of Citracado Parkway. The street provides driveway access to adjacent land uses which consist of residential uses, a hospital and doctors offices, and a church. Brotherton Road runs east/west intersecting Centre City Parkway on the east and dead ends on the east side of the I-15 freeway on the west. The street currently functions as a 2 lane local collector. There is sidewalk and parking allowed on some segments of the street. No posted speed signs were observed but assumed prima facie 25 mph. The street provides driveway access to adjacent land uses which consist of residential, school and church uses. TRAFFIC VOLUMES The intersection turning movement counts were conducted during the weekday morning peak period from 7:00 AM to 9:00 AM and during the weekday evening peak period from 4:00 PM to 6:00 PM in September Average daily traffic volumes were obtained through machine data collection. Appendix B maintains all traffic count data. The daily traffic volumes are shown in Figure 3-2. The resultant existing weekday morning and evening peak hour intersection volumes are shown in Figures 3-3 and 3-4. KOA Corporation 13 August 2015
77 Del Prado Escondido TIS Existing Conditions Table 3-1 Existing Roadway Segment Conditions Roadway Segment S Centre City Pkwy From Brotherton Rd to Citracado Pkwy Centre City Pkwy Lanes/ Class LOS E Capacity Existing Without Project Existing With Project Comparison Project Signi ADT V/C LOS Traffic ADT V/C LOS ficant? 2LC 10, A A No North of Brotherton Rd 4MA 37,000 23, C , C No From Brotherton Rd to Citracado Pkwy 4MA 37,000 24, C , C No South of Citracado Pkwy 4MA 37,000 24, C , C No Brotherton Rd From Charise St to S Centre City Pkwy From S Centre City Pkwy to Centre City Pkwy 2LC 10, A 618 1, A No 2LC 10, A 428 1, A No Citracado Pkwy/Gamble Ln From S Center City Pkwy To Centre City Pkwy 2LC 10,000 4, B 250 5, B No Abbreviations: 2LC: 2 Local Collector, 3C: 3 Lane Collector, 4C: 4 Lane Collector, 4MA: 4 Lane Major Arterial KOA Corporation 14 August 2015
78 Del Prado Escondido TIS Existing Conditions Table 3-2 Existing Intersection Conditions Intersection Existing Conditions Existing + Project Delay Delay LOS Delay LOS Significant AM Peak Hour 1. Brotherton Rd & Charise St / Project Driveway # A 9.1 A 0.3 No PM Peak Hour 2. Brotherton Rd & S. Centre City Pkwy A 9.5 A 0.3 No 3. Brotherton Rd & Centre City Pkwy B 14.3 B 0.5 No 4. W. Citracado Pkwy & S. Centre City Pkwy B 11.4 B 0.5 No 5. W. Citracado Pkwy & Centre City Pkwy B 13.7 B 3.6 No 6. S. Centre City Pkwy & Project Driveway # A 8.5 No 1. Brotherton Rd & Charise St / Project Driveway # A 9.2 A 0.4 No 2. Brotherton Rd & S. Centre City Pkwy A 9.5 A 0.6 No 3. Brotherton Rd & Centre City Pkwy C 16.8 C 0.1 No 4. W. Citracado Pkwy & S. Centre City Pkwy B 12.1 B 0.5 No 5. W. Citracado Pkwy & Centre City Pkwy A 14.2 B 4.4 No 6. S. Centre City Pkwy & Project Driveway # A 8.4 No 1 Side Street Stop Controlled 2 All-Way Stop Controlled 3 Signalized Intersection KOA Corporation 15 August 2015
79 Brotherton Rd Charise St Felicita Ave 15 W Citracado Pkwy S Centre City Pkwy 4 Centre City Pkwy 5 S Escondido Blvd 4 5 D S D D # S D LEGEND Project Site Study Intersection Signalized Intersection Stop Sign Defacto Right Turn Lane Geometry Roadway Classification 2 Local Collector 4 Lane Major Arterial Non-Study Segment J:\KOA-SD\JB42056-Escondido_DelPrado/Figures/JB42056_Figures.ai KOA CORPORATION PLANNING & ENGINEERING Del Prado Escondido, Traffic Impact Study Escondido, CA Page 16 NOT TO SCALE Figure 3-1 Existing Circulation Network
80 24,378 S Escondido Blvd W Felicita Ave Centre City Pkwy Brotherton Rd Charise St 23, ,280 Felicita Ave 15 W Citracado Pkwy 209 S Centre City Pkwy 4,758 Centre City Pkwy S Escondido Blvd LEGEND XX Project Site One-Way Street Average Daily Traffic J:\KOA-SD\JB42056-Escondido_DelPrado/Figures/JB42056_Figures.ai KOA CORPORATION PLANNING & ENGINEERING Del Prado Escondido, Traffic Impact Study Escondido, CA Page 17 NOT TO SCALE Figure 3-2 Existing Roadway Segment Volumes
81 Brotherton Rd Charise St Felicita Ave 15 W Citracado Pkwy S Centre City Pkwy 4 Centre City Pkwy 5 S Escondido Blvd J:\KOA-SD\JB42056-Escondido_DelPrado/Figures/JB42056_Figures.ai KOA CORPORATION PLANNING & ENGINEERING Del Prado Escondido, Traffic Impact Study Escondido, CA Page 18 NOT TO SCALE Figure 3-3 Existing AM Peak Hour Intersection Volumes
82 Brotherton Rd Charise St Felicita Ave 15 W Citracado Pkwy S Centre City Pkwy 4 Centre City Pkwy 5 S Escondido Blvd J:\KOA-SD\JB42056-Escondido_DelPrado/Figures/JB42056_Figures.ai KOA CORPORATION PLANNING & ENGINEERING Del Prado Escondido, Traffic Impact Study Escondido, CA Page 19 NOT TO SCALE Figure 3-4 Existing PM Peak Hour Intersection Volumes
83 24,784 S Escondido Blvd W Felicita Ave Centre City Pkwy Brotherton Rd Charise St 23,735 1,382 1,266 24,708 Felicita Ave 15 W Citracado Pkwy 639 S Centre City Pkwy 5,008 Centre City Pkwy S Escondido Blvd LEGEND XX Project Site One-Way Street Average Daily Traffic J:\KOA-SD\JB42056-Escondido_DelPrado/Figures/JB42056_Figures.ai KOA CORPORATION PLANNING & ENGINEERING Del Prado Escondido, Traffic Impact Study Escondido, CA Page 20 NOT TO SCALE Figure 3-5 Existing Roadway Segment Volumes With Project
84 Brotherton Rd Charise St Felicita Ave 15 W Citracado Pkwy S Centre City Pkwy 4 6 Centre City Pkwy 5 S Escondido Blvd J:\KOA-SD\JB42056-Escondido_DelPrado/Figures/JB42056_Figures.ai KOA CORPORATION PLANNING & ENGINEERING Del Prado Escondido, Traffic Impact Study Escondido, CA Page 21 NOT TO SCALE Figure 3-6 Existing AM Peak Hour Intersection Volumes With Project
85 Brotherton Rd Charise St Felicita Ave 15 W Citracado Pkwy S Centre City Pkwy 4 6 Centre City Pkwy 5 S Escondido Blvd J:\KOA-SD\JB42056-Escondido_DelPrado/Figures/JB42056_Figures.ai KOA CORPORATION PLANNING & ENGINEERING Del Prado Escondido, Traffic Impact Study Escondido, CA Page 22 NOT TO SCALE Figure 3-7 Existing PM Peak Hour Intersection Volumes With Project
86 Del Prado Escondido TIS Near-Term Conditions CHAPTER 4 NEAR-TERM CONDITIONS Near-term conditions represent opening day of the proposed project. Project traffic is added to the near-term base volumes to create the with project scenario. NEAR-TERM TRAFFIC VOLUMES Traffic growth on area roadways is a function of the expected land development, economic activity, and changes in demographics. Several methods can be used to estimate this growth. For the analysis of this study, trips from cumulative projects in the vicinity of the project area were added to the project intersections and segments. The cumulative projects were identified and provided by the City. Table 4-1 shows a list of specific cumulative projects and Appendix D contains the source information for the cumulative projects. NEAR-TERM CIRCULATION NETWORK No circulation network changes were assumed. The effect of the proposed project on the study area circulation network was evaluated for the nearterm conditions. Table 4-2 and 4-3 summarize the results of this analysis. Figures 4-1 through 4-6 show the near-term roadway segment and intersection without and with the proposed project. Additional details regarding specific intersection operating conditions can be found on the capacity analysis worksheets in Appendix F. Table 4-1 Cumulative Projects Project Name Land Use Quantity Units Oak Creek Single-Family Detached 65 DU Talk of the Town Car Wash Oil Change Restaurant 1 2 4,156 Site Stall SF Centre City Parkway Multi-Family Apartments 76 DU Amanda Lane Residential - Estate 21 DU KOA Corporation 23 August 2015
87 Del Prado Escondido TIS Table 4-2 Near-Term Roadway Segment Conditions Near-Term Conditions Roadway Segment S Centre City Pkwy From Brotherton Rd to Citracado Pkwy Centre City Pkwy Lanes/ Class LOS E Capacity Near Term Near Term Comparison Without Project With Project Project Signi Traffic ADT V/C LOS ADT V/C LOS fican t? 2LC 10, A 430 1, A No North of Brotherton Rd 4MA 37,000 24, C , C No From Brotherton Rd to Citracado Pkwy 4MA 37,000 25, C , C No South of Citracado Pkwy 4MA 37,000 25, C , C No Brotherton Rd From Charise St to S Centre City Pkwy From S Centre City Pkwy to Centre City Pkwy 2LC 10,000 2, A 618 2, A No 2LC 10,000 1, A 428 2, A No Citracado Pkwy/Gamble Ln From S Center City Pkwy To Centre City Pkwy 2LC 10,000 5, C 250 5, C No Abbreviations: 2LC: 2 Local Collector, 3C: 3 Lane Collector, 4C: 4 Lane Collector, 4MA: 4 Lane Major Arterial KOA Corporation 24 August 2015
88 Del Prado Escondido TIS Near-term Conditions Table 4-3 Near-Term Intersection Conditions Near Term - W/O Project Near Term W/ Project Delay Intersection Significant Delay LOS Delay LOS AM Peak Hour 1. Brotherton Rd & Charise St / Project Driveway # A 9.3 A 0.4 No PM Peak Hour 2. Brotherton Rd & S. Centre City Pkwy B 10.4 B 0.3 No 3. Brotherton Rd & Centre City Pkwy B 15.2 C 0.5 No 4. W. Citracado Pkwy & S. Centre City Pkwy B 12.7 B 0.6 No 5. W. Citracado Pkwy & Centre City Pkwy B 15.0 B 3.7 No 6. S. Centre City Pkwy & Project Driveway # A 8.5 No 1. Brotherton Rd & Charise St / Project Driveway # A 9.4 A 0.5 No 2. Brotherton Rd & S. Centre City Pkwy A 10.5 B 0.7 No 3. Brotherton Rd & Centre City Pkwy C 17.2 C 0.0 No 4. W. Citracado Pkwy & S. Centre City Pkwy B 13.8 B 0.8 No 5. W. Citracado Pkwy & Centre City Pkwy B 14.7 B 4.5 No 6. S. Centre City Pkwy & Project Driveway # A 8.4 No 1 Side Street Stop Controlled 2 All-Way Stop Controlled 3 Signalized Intersection KOA Corporation 25 August 2015
89 25,223 S Escondido Blvd W Felicita Ave Centre City Pkwy Brotherton Rd Charise St 24,253 2,224 1,868 25,310 Felicita Ave 15 W Citracado Pkwy 639 S Centre City Pkwy 5,448 Centre City Pkwy S Escondido Blvd LEGEND XX Project Site One-Way Street Average Daily Traffic J:\KOA-SD\JB42056-Escondido_DelPrado/Figures/JB42056_Figures.ai KOA CORPORATION PLANNING & ENGINEERING Del Prado Escondido, Traffic Impact Study Escondido, CA Page 26 NOT TO SCALE Figure 4-1 Near-Term Roadway Segment Volumes Without Project
90 Brotherton Rd Charise St Felicita Ave 15 W Citracado Pkwy S Centre City Pkwy 4 Centre City Pkwy 5 S Escondido Blvd J:\KOA-SD\JB42056-Escondido_DelPrado/Figures/JB42056_Figures.ai KOA CORPORATION PLANNING & ENGINEERING Del Prado Escondido, Traffic Impact Study Escondido, CA Page 27 NOT TO SCALE Figure 4-2 Near Term AM Peak Hour Intersection Volumes Without Project
91 Brotherton Rd Charise St Felicita Ave 15 W Citracado Pkwy S Centre City Pkwy 4 Centre City Pkwy 5 S Escondido Blvd J:\KOA-SD\JB42056-Escondido_DelPrado/Figures/JB42056_Figures.ai KOA CORPORATION PLANNING & ENGINEERING Del Prado Escondido, Traffic Impact Study Escondido, CA Page 28 NOT TO SCALE Figure 4-3 Near Term PM Peak Hour Intersection Volumes Without Project
92 2,842 2,296 25,629 S Escondido Blvd W Felicita Ave Centre City Pkwy Brotherton Rd Charise St 24,525 25,738 Felicita Ave 15 W Citracado Pkwy 1,069 S Centre City Pkwy 5,698 Centre City Pkwy S Escondido Blvd LEGEND XX Project Site One-Way Street Average Daily Traffic J:\KOA-SD\JB42056-Escondido_DelPrado/Figures/JB42056_Figures.ai KOA CORPORATION PLANNING & ENGINEERING Del Prado Escondido, Traffic Impact Study Escondido, CA Page 29 NOT TO SCALE Figure 4-4 Near-Term Roadway Segment Volumes With Project
93 Brotherton Rd Charise St Felicita Ave 15 W Citracado Pkwy S Centre City Pkwy 4 6 Centre City Pkwy 5 S Escondido Blvd J:\KOA-SD\JB42056-Escondido_DelPrado/Figures/JB42056_Figures.ai KOA CORPORATION PLANNING & ENGINEERING Del Prado Escondido, Traffic Impact Study Escondido, CA Page 30 NOT TO SCALE Figure 4-5 Near-Term AM Peak Hour Intersection Volumes With Project
94 Brotherton Rd Charise St Felicita Ave 15 W Citracado Pkwy S Centre City Pkwy 4 6 Centre City Pkwy 5 S Escondido Blvd J:\KOA-SD\JB42056-Escondido_DelPrado/Figures/JB42056_Figures.ai KOA CORPORATION PLANNING & ENGINEERING Del Prado Escondido, Traffic Impact Study Escondido, CA Page 31 NOT TO SCALE Figure 4-6 Near-Term PM Peak Hour Intersection Volumes With Project
95 Del Prado Escondido TIS On-Site Circulation, Pedestrian, Transit, Bicycle and Parking CHAPTER 5 ON-SITE CIRCULATION, PEDESTRIAN, TRANSIT, BICYCLE AND PARKING ON-SITE CIRCULATION The southern part of the project site, which consists of 32 dwelling units, has one driveway access on South Centre City Parkway. The northern part of the project site which consists of 81 dwelling units has one driveway access on Brotherton Road across from Charise Street. Altogether, the project has 113 dwelling units. Both driveways are two way driveways, and the internal streets leading to the driveways have sufficient storage space to hold peak hour traffic demand. The access streets leading to the driveways are connected with each other by internal circulation streets; however the north and south project sites do not have any internal circulation streets connecting them. The layout of the project is designed in such a way that all the dwelling units are conveniently located to access the driveways. PEDESTRIAN The project will provide internal walkways that connect the proposed land uses to pedestrian facilities within the public right-of-way. There is currently sidewalk on the west side of South Centre City Parkway adjacent to the project site. Sidewalk on the south side of Brotherton Road, which does not exist currently, will be built per City of Escondido Standards. TRANSIT The closest bus stop to the project site is located approximately one mile from the site at the Escondido Boulevard and Sunset Drive intersection. The bus stop is served by bus route 350, operated by the North County Transit District (NCTD), which connects the Del Lago Transit Station and the Escondido Transit Center. The bus has peak-hour headways of 15 minutes during the weekday and 30 minutes headways during the weekend. The Escondido Transit Center, which is approximately 2.8 miles from the project site, has a park and ride facility. The transit center has transfer opportunities to other buses, Sprinter and Greyhound buses. The transit center has bus and train services that connect to other cities in San Diego County. BICYCLE Centre City Parkway has a class II bike path starting from Cranston Drive to the north city limits. There are no other dedicated bike facilities in the project study area. PARKING The project proposes parking for all the residents within the structures. Guest parking spaces are also included for guests of residents, per city requirements. KOA Corporation 32 August 2015
96 Del Prado Escondido TIS Summary of Analysis CHAPTER 6 SUMMARY OF ANALYSIS This chapter summarizes the operations at the study intersections and segments. Table 6-1 shows the summary of roadway segment conditions for each scenario. Table 6-2 shows the summary of intersection conditions for each scenario. Table 6-1 Summary of Roadway Segment Conditions Roadway Segment Existing Without Project Existing With Project Near-Term Without Project Near-Term Without Project V/C LOS V/C LOS V/C LOS V/C LOS S Centre City Pkwy From Brotherton Rd to Citracado Pkwy A A A A Centre City Pkwy North of Brotherton Rd C C C C From Brotherton Rd to Citracado Pkwy C C C C South of Citracado Pkwy C C C C Brotherton Rd From Charise St to S Centre City Pkwy A A A A From S Centre City Pkwy to Centre City Pkwy A A A A Citracado Pkwy/Gamble Ln From S Center City Pkwy To Centre City Pkwy B B C C KOA Corporation 33 August 2015
97 Del Prado Escondido TIS Summary of Analysis Table 6-2 Summary of Intersection Conditions before Mitigation Existing Conditions Existing + Project Near Term - W/O Project Near Term W/ Project Intersection Delay LOS Delay LOS Delay LOS Delay LOS AM Peak Hour 1. Brotherton Rd & Charise St / Project Driveway # A 9.1 A 8.9 A 9.3 A PM Peak Hour 2. Brotherton Rd & S. Centre City Pkwy A 9.5 A 10.1 B 10.4 B 3. Brotherton Rd & Centre City Pkwy B 14.3 B 14.7 B 15.2 C 4. W. Citracado Pkwy & S. Centre City Pkwy B 11.4 B 12.1 B 12.7 B 5. W. Citracado Pkwy & Centre City Pkwy B 13.7 B 11.3 B 15.0 B 6. S. Centre City Pkwy & Project Driveway # A 8.5 A 1. Brotherton Rd & Charise St / Project Driveway # A 9.2 A 8.9 A 9.4 A 2. Brotherton Rd & S. Centre City Pkwy A 9.5 A 9.8 A 10.5 B 3. Brotherton Rd & Centre City Pkwy C 16.8 C 17.2 C 17.2 C 4. W. Citracado Pkwy & S. Centre City Pkwy B 12.1 B 13.0 B 13.8 B 5. W. Citracado Pkwy & Centre City Pkwy A 14.2 B 10.2 B 14.7 B 6. S. Centre City Pkwy & Project Driveway # A 8.4 A 1 Side Street Stop Controlled 2 All-Way Stop Controlled 3 Signalized Intersection KOA Corporation 34 August 2015

98 Del Prado Escondido TIS Recommendations CHAPTER 7 RECOMMENDATIONS Based on the preceding analysis of existing and near-term year traffic conditions for the proposed Del Prado project in the City of Escondido, the project has no impacts that require mitigation. Prepared By: Arnold Torma, P.E. Senior Transportation Engineer Ryan Whipple Assistant Transportation Engineer Anya Diamond Assistant Transportation Planner Balaji Shivaji Assistant Transportation Engineer KOA Corporation 35 August 2015
Aldridge Transportation Consultants, LLC Advanced Transportation Planning and Traffic Engineering
 Aldridge Transportation Consultants, LLC Advanced Transportation Planning and Traffic Engineering John M.W. Aldridge, PE, PTOE, AICP 1082 Chimney Rock Road Colorado Registered Professional Engineer Highlands
JOHNSON RANCH RAPID CITY, SOUTH DAKOTA TRAFFIC IMPACT ANALYSIS
 JOHNSON RANCH RAPID CITY, SOUTH DAKOTA TRAFFIC IMPACT ANALYSIS Prepared for: KTM Design Solutions 528 Kansas City Street, Suite 1 Rapid City, SD 57701 Prepared by: Felsburg Holt & Ullevig 6300 South Syracuse
Bennett Pit. Traffic Impact Study. J&T Consulting, Inc. Weld County, Colorado. March 3, 2017
 Bennett Pit Traffic Impact Study J&T Consulting, Inc. Weld County, Colorado March 3, 217 Prepared By: Sustainable Traffic Solutions, Inc. http://www.sustainabletrafficsolutions.com/ Joseph L. Henderson,
Traffic Impact Analysis Update
 Willow Bend Traffic Impact Analysis Update TABLE OF CONTENTS Page I. INTRODUCTION -------------------------------------------------------------------------------------------- 1 II. EXISTING CONDITIONS
DIVISION STREET PLAT TRAFFIC IMPACT ANALYSIS
 DIVISION STREET PLAT TRAFFIC IMPACT ANALYSIS TABLE OF CONTENTS 1. Introduction...3 2. Project Description...3 3. Existing Conditions...3 4. Forecast Traffic Demand and Analysis...12 5. Conclusions and
Aldridge Transportation Consultants, LLC Advanced Transportation Planning and Traffic Engineering
 Aldridge Transportation Consultants, LLC Advanced Transportation Planning and Traffic Engineering John M.W. Aldridge, PE, PTOE, AICP 1082 Chimney Rock Road Colorado Registered Professional Engineer Highlands
One Harbor Point Residential
 Residential Gig Harbor, WA Transportation Impact Analysis January 23, 2017 Prepared for: Neil Walter Company PO Box 2181 Tacoma, WA 98401 Prepared by: TENW Transportation Engineering NorthWest 11400 SE
APPENDICES. No Cumulative Impact Project Alternative Traffic Analysis Memorandum (May 2016)
") APPENDICES Appendix T No Cumulative Impact Project Alternative Traffic Analysis Memorandum (May 2016) 661 Bear Valley Parkway EIR March 2017 APPENDICES This page intentionally left blank 661 Bear Valley
APPENDICES Appendix T No Cumulative Impact Project Alternative Traffic Analysis Memorandum (May 2016) 661 Bear Valley Parkway EIR March 2017 APPENDICES This page intentionally left blank 661 Bear Valley
Winnetka Avenue Bike Lanes Traffic Impact Analysis
 Winnetka Avenue Bike Lanes Traffic Impact Analysis January 4, 2019 Prepared by City of Los Angeles Department of Transportation Active Transportation Division Winnetka Ave Bike Lanes Traffic Impact Analysis
D & B COMMERCIAL TRAFFIC IMPACT ANALYSIS
 D & B COMMERCIAL TRAFFIC IMPACT ANALYSIS TABLE OF CONTENTS I. Introduction...3 II. Project Description...3 III. Existing Conditions...3 IV. Future Traffic Conditions...8 V. Conclusions and Mitigation...14
SR 104/Paradise Bay-Shine Road Intersection Safety Improvements Intersection Control Evaluation
 SR 104/Paradise Bay-Shine Road Intersection Safety Improvements Intersection Control Evaluation Background and Project Needs SR 104 is functionally classified as a rural-principal arterial. It is a limited
Prescott Plaza Traffic Impact Analysis APPENDIX 1.1: APPROVED TRAFFIC STUDY SCOPING AGREEMENT TIA Report.docx
 Prescott Plaza Traffic Impact Analysis APPENDIX 1.1: APPROVED TRAFFIC STUDY SCOPING AGREEMENT 11897-05 TIA Report.docx Prescott Plaza Traffic Impact Analysis This page is intentionally left blank 11897-05
Addendum to Traffic Impact Analysis for Port Marigny Site Mandeville, LA
 Addendum to Traffic Impact Analysis for Port Marigny Site Mandeville, LA (St. Tammany Parish Mandeville, LA) Prepared For The Pittman Companies Michael N Pittman, MD 328 East Boston St Covington, LA 70433
TRAFFIC IMPACT ANALYSIS FOR. RESIDENCE INN PROJECT Davis, CA. Prepared For: JACKSON PROPERTIES 155 Cadillac Drive, Suite 100 Sacramento, CA 95825
 TRAFFIC IMPACT ANALYSIS FOR RESIDENCE INN PROJECT Davis, CA Prepared For: JACKSON PROPERTIES 155 Cadillac Drive, Suite 100 Sacramento, CA 95825 Prepared By: KD Anderson & Associates, Inc. 3853 Taylor Road,
BUCKLEY ANNEX REDEVELOPMENT PLAN TRANSPORTATION ANALYSIS ADDENDUM
 BUCKLEY ANNEX REDEVELOPMENT PLAN TRANSPORTATION ANALYSIS ADDENDUM Prepared for: City and County of Denver Prepared by: Contact: Brian Bern, P.E., PTOE 303.572.0200 On Behalf of: Lowry Redevelopment Authority
Parking/Traffic Assessment Study
 Brock Road Industrial Mall 985 Brock Road South City of Pickering Parking/Traffic Assessment Study Prepared by: Tranplan Associates, Toronto Toronto 416-670-2005 Sudbury 705-522-0272 Peterborough 705-874-3638
 Traffic Analysis For Approved Uses within the St. Lucie West DRI Aldi Port St. Lucie, FL Prepared for: Bohler Engineering, LLC 1000 Corporate Drive Suite 250 Fort Lauderdale, FL 33334 Prepared by: 10795
TECHNICAL MEMORANDUM
 TECHNICAL MEMORANDUM TO: Merrimack Valley Metropolitan Planning Organization FROM: James Terlizzi, P.E., Transportation Planning Engineer DATE: March 6, 2017 SUBJECT: Further analysis of the recommendations
Weaver Road Senior Housing Traffic Impact Analysis
 Gibson Traffic Consultants, Inc. 2813 Rockefeller Avenue Suite B Everett, WA 9821 425.339.8266 Weaver Road Senior Housing Traffic Impact Analysis Jurisdiction: City of Snohomish January 218 GTC #17-37
APPENDICES. APPENDIX D Synchro Level of Service Output Sheets
 APPENDICES APPENDIX D Synchro Level of Service Output Sheets Lanes, Volumes, Timings NO BUILD 2016 PM 8: 10th St & Thain Rd 10/05/2016 Lane Group NBL NBT NBR SBL SBT SBR SEL SET SER NWL NWT NWR
Ryan Coyne, PE City Engineer City of Rye 1051 Boston Post Road Rye, NY Boston Post Road Realignment and Roundabout Design Report
 March 6, 2015 Ryan Coyne, PE City Engineer City of Rye 1051 Boston Post Road Rye, NY 10580 RE: JMC Project 14108 Boston Post Road Roundabout Boston Post Road and Parsons Street City of Rye, NY Dear Ryan:
June 21, Mr. Jeff Mark The Landhuis Company 212 North Wahsatch Avenue, Suite 301. Colorado Springs, CO 80903
 LSC TRANSPORTATION CONSULTANTS, INC. 545 East Pikes Peak Avenue, Suite 210 Colorado Springs, CO 80903 (719) 633-2868 FAX (719) 633-5430 E-mail: lsc@lsctrans.com Website: http://www.lsctrans.com June 21,
KUM & GO 6400 WESTOWN PARKWAY WEST DES MOINES, IOWA 50266
 KUM & GO #300 PECOS STREET & 88 TH AVENUE THORNTON, COLORADO TRAFFIC IMPACT STUDY REVISION 1 PREPARED FOR KUM & GO 6400 WESTOWN PARKWAY WEST DES MOINES, IOWA 50266 JANUARY 23, 2014 OA PROJECT NO. 013-1721
LOST LAKE CORRIDOR REVIEW
 LOST LAKE CORRIDOR REVIEW Prepared for: Prepared by: Broadview Developments Inc. c/o Westbrook Consulting Watt Consulting Group Our File: 2064.B01 Date: October 31, 2016 TABLE OF CONTENTS 1.0 INTRODUCTION...
Proposed Pit Development
 July 5, 2017 via email: sam@greenwoodconst.ca CCTA File 114239 Sam Greenwood Greenwood Aggregates 205467 County Road 109 Amaranth, ON L9W 0V1 Re: Proposed Violet Hill Gravel Pit, Town of Mono Traffic Review
830 Main Street Halifax Regional Municipality
 830 Main Street Halifax Regional Municipality Traffic Impact Statement Final Report Prepared by: GRIFFIN transportation group inc. 30 Bonny View Drive Fall River, NS B2T 1R2 www.griffininc.ca Prepared
MEMORANDUM. Saint Edward Ballfields Traffic and Parking Analysis (Updated)
") MEMORANDUM Date: May 26, 2016 To: From: Subject: Debbie Bent and Kris Overleese, City of Kenmore Kendra Breiland and Sarah Keenan, Fehr & Peers Saint Edward Ballfields Traffic and Parking Analysis (Updated)
MEMORANDUM Date: May 26, 2016 To: From: Subject: Debbie Bent and Kris Overleese, City of Kenmore Kendra Breiland and Sarah Keenan, Fehr & Peers Saint Edward Ballfields Traffic and Parking Analysis (Updated)
1 st Street Intersection Study
 TRAFFIC ENGINEERING ASSISTANCE PROGRAM 1 st Street Intersection Study Prepared for: City of Independence In Cooperation With: Iowa Department of Transportation & Iowa Department of Public Safety Governor
Sweetwater Landing Traffic Impact Analysis
 Gibson Traffic Consultants, Inc. 8 Rockefeller Avenue Suite B Everett, WA 98 45.9.8 Sweetwater Landing Traffic Impact Analysis Jurisdiction: City of Snohomish February 8 GTC #7-87 Sweetwater Landing Traffic
HONDA DEALERSHIP LAKE ELSINORE, CALIFORNIA. Prepared by:
 LOS ANGELES 21 S. Figueroa St, Suite 24 Los Angeles, CA 912 213.337.368 Fax :213.337.3679 ONTARIO 4141 E. Inland Empire Blvd, Suite 25 Ontario, CA 91764 99.481.575 Fax :99.481.5757 SAN DIEGO 6 B St, Suite
Tijuana River Valley Regional Park Campground and Education Center
 Tijuana River Valley Regional Park Campground and Education Center Draft Report September 2018 Prepared for: County of San Diego 5500 Overland Avenue, Suite 410 San Diego, CA 92123 Prepared by: 3900 Fifth
Rockingham Ridge Plaza Commercial Development Halifax Regional Municipality
 Rockingham Ridge Plaza Commercial Development Halifax Regional Municipality Traffic Impact Study Final Draft Report Prepared by: GRIFFIN transportation group inc. 30 Bonny View Drive Fall River, NS B2T
10 th Street Residences Development Traffic Impact Analysis
 Gibson Traffic Consultants, Inc. 2813 Rockefeller Avenue Suite B Everett, WA 98201 425.339.8266 10 th Street Residences Development Traffic Impact Analysis Jurisdiction: City of Snohomish September 2018
MEMORANDUM. Date: November 4, Cheryl Burrell, Pebble Beach Company. Rob Rees, P.E. Inclusionary Housing Transportation Analysis WC
 MEMORANDUM Date: November 4, 2013 To: From: Subject: Cheryl Burrell, Pebble Beach Company Rob Rees, P.E. Inclusionary Housing Transportation Analysis As requested, Fehr & Peers is providing clarification
Sugarland Crossing Gwinnett County, Georgia
 Sugarland Crossing Gwinnett County, Georgia S IGNAL W ARRANT A NALYSIS For the Intersection of: Sugarloaf Parkway / Richards Middle School Driveway / Sugarland Crossing Main Site Driveway Prepared for:
SUBJECT: EMERALD NECKLACE IMPLEMENTATION PLAN PHASE 1 TRAFFIC ASSESSMENT SUMMARY OF FINDINGS. May 9, 2016
 May 9, 2016 Mr. Jesus "Freddie" Olmos ECORP CONSULTING, INC. 215 North 5 th Street Redlands, CA 92374 SUBJECT: EMERALD NECKLACE IMPLEMENTATION PLAN PHASE 1 TRAFFIC ASSESSMENT Dear Mr. Jesus "Freddie" Olmos:
886 March Road McDonald's Transportation Study
 McDonald's Restaurants of Canada Limited March 2013 886 March Road McDonald's Transportation Study Submitted by: HDR Corporation 100 York Boulevard, Suite 300 Richmond Hill, ON L4B 1J8 (905) 882-4100 www.hdrinc.com
FORT MYERS CITY COUNCIL OSCAR M. CORBIN, JR. CITY HALL, 2200 SECOND STREET FORT MYERS, FLORIDA
 Agenda City Council Special Mee ng March 18, 2019 1:00 PM Historic Preserva on Commission Appeal - Virginia Avenue/ McGregor Boulevard Roundabout MAYOR Randall P. Henderson, Jr. Ward 1 Teresa Watkins Brown
Quantitative analyses of weekday a.m. and p.m. commuter hour conditions have been conducted for the following five scenarios:
 6.1 TRANSPORTATION AND CIRCULATION 6.1.1 INTRODUCTION This section of the EIR presents the results of TJKM s traffic impact analysis of the proposed Greenbriar Development. The analysis includes consideration
Half Moon Bay North Apartment Block Transportation Impact Assessment. Full Report. March 15, Prepared for: Mattamy Homes.
 Half Moon Bay North Apartment Block Transportation Impact Assessment Full Report March 15, 2018 Prepared for: Mattamy Homes Prepared by: Stantec Consulting Ltd. Table of Contents 1.0 SCREENING... 1 1.1
FOCUSED TRAFFIC REPORT VVSD ESCONDIDO. Escondido, California December 18, LLG Ref
 FOCUSED TRAFFIC REPORT VVSD ESCONDIDO Escondido, California December 18, 2014 LLG Ref. 3-14-2404 EXECUTIVE SUMMARY The Veterans Village of San Diego (VVSD) Escondido residential project ( Project ) is
L1TILE BEARS DAY CARE TRANSPORTATION IMPACT STUDY FORT COLLINS, COLORADO MAY Prepared for:
 L1TILE BEARS DAY CARE TRANSPORTATION IMPACT STUDY FORT COLLINS, COLORADO MAY 2012 Prepared for: Hillside Construction, Inc. 216 Hemlock Street, Suite B Fort Collins, CO 80534 Prepared by: DELICH ASSOCIATES
Date: December 20, Project #:
 To: Craig Rottenberg Long s Jewelers 60A South Avenue Burlington, MA 01803 From: Patrick Dunford, P.E. Senior Project Manager Date: December 20, 2018 Project #: 14416.00 Re: Burlington Mall Proposed Long
Oakbrook Village Plaza City of Laguna Hills
 Oakbrook Village Plaza City of Laguna Hills Traffic Impact Analysis Prepared by: HDR Engineering 3230 El Camino Real, Suite 200 Irvine, CA 92602 October 2012 Revision 3 D-1 Oakbrook Village Plaza Laguna
Traffic Impact Study. Residences at Bancroft Block 14, Lot 2 Borough of Haddonfield, Camden County, New Jersey
 Traffic Impact Study Residences at Bancroft Block 14, Lot 2 April 30, 2018 REVISED: JANUARY 17, 2019 Prepared For 2 Hopkins Lane, LLC 2701 Renaissance Boulevard King of Prussia, PA 19406 Prepared By Maser
INTERSECTION ANALYSIS PARK AVENUE AND BRADDOCK ROAD (FROSTBURG, MD) FOR LENHART TRAFFIC CONSULTING, INC.
 FOR LENHART TRAFFIC CONSULTING, INC.") INTERSECTION ANALYSIS FOR PARK AVENUE AND BRADDOCK ROAD (FROSTBURG, MD) Prepared for: City of Frostburg, Maryland & Allegany County Commissioners Prepared by: LENHART TRAFFIC CONSULTING, INC. TRAFFIC ENGINEERING
INTERSECTION ANALYSIS FOR PARK AVENUE AND BRADDOCK ROAD (FROSTBURG, MD) Prepared for: City of Frostburg, Maryland & Allegany County Commissioners Prepared by: LENHART TRAFFIC CONSULTING, INC. TRAFFIC ENGINEERING
Table 1 - Land Use Comparisons - Proposed King s Wharf Development. Retail (SF) Office (SF) 354 6,000 10, Land Uses 1
 Office (SF) 354 6,000 10, Land Uses 1") Ref. No. 171-6694 Phase 2 November 23, 217 Mr. David Quilichini, Vice President Fares & Co. Developments Inc. 31 Place Keelson Sales Centre DARTMOUTH NS B2Y C1 Sent Via Email to David@faresinc.com RE:
Ref. No. 171-6694 Phase 2 November 23, 217 Mr. David Quilichini, Vice President Fares & Co. Developments Inc. 31 Place Keelson Sales Centre DARTMOUTH NS B2Y C1 Sent Via Email to David@faresinc.com RE:
Appendix E: Emission Reduction Calculations
 Derr Road and Home Road Conversion Feasibility Study Springfield, OH Appendix E: Emission Reduction Calculations Derr Road and Home Road Conversion Feasibility Study Springfield, OH Emission Reduction
ZINFANDEL LANE / SILVERADO TRAIL INTERSECTION TRAFFIC ANALYSIS
 ZINFANDEL LANE / SILVERADO TRAIL INTERSECTION TRAFFIC ANALYSIS UPDATED TRAFFIC STUDY FOR THE PROPOSED RAYMOND VINEYARDS WINERY USE PERMIT MODIFICATION #P11-00156 AUGUST 5, 2014 PREPARED BY: OMNI-MEANS,
APPENDIX G TRAFFIC STUDY TECHNICAL MEMORANDUM
 APPENDIX G TRAFFIC STUDY TECHNICAL MEMORANDUM TECHNICAL MEMORANDUM To: From: Date: Subject: Jerry Flores - AECOM Brian A. Marchetti, AICP September 9, 5 DRAFT Traffic Study LABOE Channel 5 Studio Relocation
Alpine Highway to North County Boulevard Connector Study
 Alpine Highway to North County Boulevard Connector Study prepared by Avenue Consultants March 16, 2017 North County Boulevard Connector Study March 16, 2017 Table of Contents 1 Summary of Findings... 1
Critical Movement* Delay (sec/veh) Critical Movement* LOS 8 a.m. 9 a.m. B 25.2 C. 3 p.m. 4 p.m. B 17.3 B
 Critical Movement* LOS 8 a.m. 9 a.m. B 25.2 C. 3 p.m. 4 p.m. B 17.3 B") Memorandum DATE: AUGUST 1, 2013 TO: PAUL TILTON, P.E., SANDWICH DPW DIRECTOR/TOWN ENGINEER FROM: LEV MALAKHOFF, SR. TRANSPORTATION ENGINEER RE: ROUTE 130/QUAKER MEETINGHOUSE ROAD INTERSECTION Paul: Per
Memorandum DATE: AUGUST 1, 2013 TO: PAUL TILTON, P.E., SANDWICH DPW DIRECTOR/TOWN ENGINEER FROM: LEV MALAKHOFF, SR. TRANSPORTATION ENGINEER RE: ROUTE 130/QUAKER MEETINGHOUSE ROAD INTERSECTION Paul: Per
RESPONSE TO TRAFFIC IMPACT STUDY COMMENTS
 RESPONSE TO TRAFFIC IMPACT STUDY COMMENTS Proposed Gas Station 40 Arthur Street (Highway 26), Town of the Blue Mountains (Thornbury), County of Grey, Ontario AUGUST 2013 August 27, 2013 MR. REG RUSSWURM
TRAFFIC IMPACT ANALYSIS 661 BEAR VALLEY. Escondido, California September 1, LLG Ref
 TRAFFIC IMPACT ANALYSIS 661 BEAR VALLEY Escondido, California September 1, 2015 LLG Ref. 3-13-2299 EXECUTIVE SUMMARY The Project (Project) proposes the development of 55 residential dwelling units on 40.88
Appendix I: The Project Traffic Impact Study report by TJKM Transportation Consultants
 Appendix I: The Project Traffic Impact Study report by TJKM Transportation Consultants TJKM Transportation Consultants Draft Report Traffic Impact Study for the Residential Development at 4659 Proctor
FIRGROVE ELEMENTARY TRAFFIC IMPACT ANALYSIS
 1 FIRGROVE ELEMENTARY TRAFFIC IMPACT ANALYSIS TABLE OF CONTENTS I. Introduction... 3 II. Project Description... 3 III. Existing Conditions... 6 IV. Future Traffic Demand... 10 V. Conclusions and Mitigation...
TRAFFIC IMPACT ANALYSIS WESTMINSTER SEMINARY. Escondido, California June 25, LLG Ref Transportation Engineer II
 TRAFFIC IMPACT ANALYSIS WESTMINSTER SEMINARY Escondido, California June 25, 2015 LLG Ref. 3-15-2420 Prepared by: Pedram Massoudi Transportation Engineer II Under the Supervision of: John Boarman, P.E.
MURRIETA APARTMENTS TRAFFIC IMPACT ANALYSIS CITY OF MURRIETA, CALIFORNIA
 MURRIETA APARTMENTS TRAFFIC IMPACT ANALYSIS CITY OF MURRIETA, CALIFORNIA SEPTEMBER 20, 2012 Prepared for: Golden Eagle Multi-Family Properties, LLC 6201 Oak Canyon Rd., Suite 250 Irvine, CA 92618 Prepared
ARVADA TRIANGLE REDEVELOPMENT TRAFFIC IMPACT ANALYSIS
 ARVADA TRIANGLE REDEVELOPMENT TRAFFIC IMPACT ANALYSIS Prepared for: Arvada Urban Renewal Authority 5601 Olde Wadsworth Boulevard, Suite 210 Arvada, Colorado 80002 (720) 898-7062 Prepared by: Felsburg Holt
INTERCHANGE OPERTIONS STUDY Interstate 77 / Wallings Road Interchange
 INTERCHANGE OPERTIONS STUDY Interstate 77 / Wallings Road Interchange City of Broadview Heights, Cuyahoga County, Ohio Prepared For: City of Broadview Heights Department of Engineering 9543 Broadview Road
Traffic Impact Study Hudson Street Parking Garage MC Project No.: A Table of Contents
 Traffic Impact Study Hudson Street Parking Garage MC Project No.: 15001714A Table of Contents Table of Contents I. INTRODUCTION... 1 II. EXISTING CONDITIONS... 4 III. 2015 EXISTING TRAFFIC CONDITIONS...
APPENDICES. Appendix R Traffic Impact Analysis (January 2017)
") APPENDICES Appendix R Traffic Impact Analysis (January 2017) 661 Bear Valley Parkway EIR March 2017 APPENDICES This page intentionally left blank 661 Bear Valley Parkway EIR March 2017 TRAFFIC IMPACT ANALYSIS
APPENDICES Appendix R Traffic Impact Analysis (January 2017) 661 Bear Valley Parkway EIR March 2017 APPENDICES This page intentionally left blank 661 Bear Valley Parkway EIR March 2017 TRAFFIC IMPACT ANALYSIS
Traffic Impact Study Proposed Commercial Development Ballwin, Missouri. Technical Memorandum for Traffic Impact Study
 Traffic Impact Study Proposed Commercial Development Ballwin, Missouri Technical Memorandum for Traffic Impact Study Crawford, Bunte, Brammeier May 1, 2009 MEMORANDUM Date: April 24, 2009 To: From: Subject:
TRAFFIC IMPACT ANALYSIS SAFARI HIGHLANDS RANCH
 TRAFFIC IMPACT ANALYSIS SAFARI HIGHLANDS RANCH, California November 11, 2016 LLG Ref. 3-14-2334 EXECUTIVE SUMMARY The Project proposes the development of 550 luxury residential dwelling units, public trails,
Village of Richmond Transportation Brief
 Village of Richmond Transportation Brief GENIVAR Project Number 111-18482-00 June 21 st, 2011 www.genivar.com GENIVAR 15 Fitzgerald Road, Suite 100 Ottawa, Ontario, CANADA K2H 9G1 Telephone: 613-829-2800
APPENDIX G. Traffic Data
 APPENDIX G Traffic Data HCM Signalized Intersection Capacity Analysis 2: Duanesburg Road & I-88 Ramps 10/7/2004 Movement EBL EBT EBR WBL WBT WBR NBL NBT NBR SBL SBT SBR Lane Configurations Ideal Flow (vphpl)
Appendix H: Construction Impacts H-2 Transportation
 Appendix H: Construction Impacts H-2 Transportation \ AECOM 71 W. 23 rd Street New York, NY 10010 www.aecom.com 212 366 6200 tel 212 366 6214 fax Memorandum To CC Subject Robert Conway Donald Tone Construction
TRAFFIC IMPACT STUDY DERRY GREEN CORPORATE BUSINESS PARK MILTON SECONDARY PLAN MODIFICATION
 TRAFFIC IMPACT STUDY DERRY GREEN CORPORATE BUSINESS PARK MILTON SECONDARY PLAN MODIFICATION TRAFFIC IMPACT STUDY DERRY GREEN CORPORATE BUSINESS PARK MILTON SECONDARY PLAN MODIFICATION DECEMBER 2014 UPDATED
Escondido Marriott Hotel and Mixed-Use Condominium Project TRAFFIC IMPACT ANALYSIS REPORT
 Escondido Marriott Hotel and Mixed-Use Condominium Project TRAFFIC IMPACT ANALYSIS REPORT Prepared for Phelps Program Management 420 Sixth Avenue, Greeley, CO 80632 Prepared by 5050 Avenida Encinas, Suite
Traffic Impact Analysis 5742 BEACH BOULEVARD MIXED USE PROJECT
 Traffic Impact Analysis 5742 BEACH BOULEVARD MIXED USE PROJECT CITY OF BUENA PARK Prepared by Project No. 14139 000 April 17 th, 2015 DKS Associates Jeffrey Heald, P.E. Rohit Itadkar, T.E. 2677 North Main
MERIVALE PRIORITY SQUARE 2852 MERIVALE ROAD CITY OF OTTAWA TRANSPORTATION BRIEF. Prepared for: ONT Inc. 25 Winding Way Nepean, Ontario K2C 3H1
 MERIVALE PRIORITY SQUARE 2852 MERIVALE ROAD CITY OF OTTAWA TRANSPORTATION BRIEF Prepared for: 2190986ONT Inc. 25 Winding Way Nepean, Ontario K2C 3H1 October 6, 2010 110-502 Report_1.doc D. J. Halpenny
County State Aid Highway 30 (Diffley Road) and Dodd Road Intersection Study
 and Dodd Road Intersection Study") County State Aid Highway 30 (Diffley Road) and Dodd Road Intersection Study City of Eagan, Dakota County, Minnesota Date: March 2012 Project No. 14957.000 444 Cedar Street, Suite 1500 Saint Paul, MN 55101
County State Aid Highway 30 (Diffley Road) and Dodd Road Intersection Study City of Eagan, Dakota County, Minnesota Date: March 2012 Project No. 14957.000 444 Cedar Street, Suite 1500 Saint Paul, MN 55101
JMC. November 7, Chairman John P. Ewasutyn and Members of the Planning Board Town of Newburgh Town Hall 308 Gardnertown Road Newburgh, NY 12550
 JMC JOHN MEYER CONSULTING, PC Site Planning n Civil Engineering n Landscape Architecture Land Surveying n Transportation Engineering n Environmental Studies n Permitting n Construction Services November
Proposed Office Building Traffic Impact Study Chicago Avenue Evanston, Illinois
 Proposed Office Building Traffic Impact Study 1714-1720 Chicago Avenue Evanston, Illinois Prepared For: HOLABIRD & ROOT, LLC Prepared by: Eriksson Engineering Associates, Ltd. 145 Commerce Drive, Ste A,
MEMO. McCORMICK RANKIN CORPORATION. File FROM: Keyur Shah DATE: February 1, 2010 COPIES: OUR FILE: SUBJECT: TO:
 McCORMICK RANKIN CORPORATION 2655 North Sheridan Way Mississauga, Ontario, L5K 2P8 Tel: (905)823-8500 Fax: (905) 823-8503 E-mail: mrc@mrc.ca Website: www.mrc.ca MEMO TO: File FROM: Keyur Shah DATE: February
Downtown One Way Street Conversion Technical Feasibility Report
 Downtown One Way Street Conversion Technical Feasibility Report As part of the City s Transportation Master Plan, this report reviews the technical feasibility of the proposed conversion of the current
TRAFFIC DATA. Existing Derousse Ave./River Rd. AM LOS Analysis Existing Derousse Ave./River Rd. PM LOS Analysis
 Appendix E NJ TRANSIT Pennsauken Junction Transit Center and Park & Ride RiverLINE and Atlantic City Line Pennsauken Township, Camden County, New Jersey TRAFFIC DATA Background Traffic Information for
(A) Project Manager, Infrastructure Approvals
 Project Manager, Infrastructure Approvals") February 14th, 2014 BY E-MAIL: wally.dubyk@ottawa.ca City of Ottawa Planning and Growth Management Branch 110 Laurier Ave. W., 4 th Floor, Ottawa, Ontario K1P 1J1 Attention: Wally Dubyk, C.E.T (A) Project
February 14th, 2014 BY E-MAIL: wally.dubyk@ottawa.ca City of Ottawa Planning and Growth Management Branch 110 Laurier Ave. W., 4 th Floor, Ottawa, Ontario K1P 1J1 Attention: Wally Dubyk, C.E.T (A) Project
TRAFFIC AND TRANSPORTATION TECHNICAL MEMORANDUM
 TRAFFIC AND TRANSPORTATION TECHNICAL MEMORANDUM for ENVIRONMENTAL ASSESSMENT US 460 Bypass Interchange and Southgate Drive Relocation State Project No.: 0460-150-204, P101, R201, C501, B601; UPC 99425
Traffic Impact Study. Eastern Springs. A Proposed Development in Manorville, NY. April Haas Group Inc Transportation Planners and Engineers
 Traffic Impact Study For Eastern Springs A Proposed Development in Manorville, NY April 2018 Haas Group Inc Transportation Planners and Engineers Table of Contents 1) Executive Summary... 2 2) Study Purpose...
Traffic Impact Study Morgan Road Commerce Park Pasco County, Florida
 Traffic Impact Study Morgan Road Commerce Park Pasco County, Florida Summary Report June 2008 Prepared by: 12909 N 56 th Street # 201 Tampa, FL 33617 Ph: (813) 988-3180 Fax: (813) 343-6854 Morgan Road
MADERAS HOTEL TRANSPORTATION IMPACT ANALYSIS. LLG Ref Transportation Planner III & Jorge Cuyuch Transportation Engineer I
 TRANSPORTATION IMPACT ANALYSIS MADERAS HOTEL Poway, California June 21, 2016 LLG Ref. 3-16-2602 Prepared by: Amelia Giacalone Transportation Planner III & Jorge Cuyuch Transportation Engineer I Under the
April Salvation Army Barrhaven Church 102 Bill Leathem Drive Transportation Brief
 April 26 Salvation Army Barrhaven Church 2 Bill Leathem Drive Transportation Brief Salvation Army Barrhaven Church 2 Bill Leathem Drive Transportation Brief prepared for: The Salvation Army 2 Overlea Blvd.
Memorandum. Megan Costa, SOCPA Sam Gordon, Town of DeWitt Jeanie Gleisner, CNYRPDB Meghan Vitale DATE: April 20, 2017
 TO: FROM: Megan Costa, SOCPA Sam Gordon, Town of DeWitt Jeanie Gleisner, CNYRPDB Meghan Vitale DATE: April 20, 2017 RE: Syracuse Metropolitan Transportation Council 100 Clinton Square 126 N. Salina Street,
Barrhaven Honda Dealership. Dealership Drive, Ottawa, ON. Transportation Brief
 Barrhaven Honda Dealership Dealership Drive, Ottawa, ON Transportation Brief Prepared By: NOVATECH Suite 200, 240 Michael Cowpland Drive Ottawa, Ontario K2M 1P6 September, 2015 File: 115136 Ref: R-2015-152
CastleGlenn Consultants Inc.
 CastleGlenn Consultants Inc. Engineers, Project Managers & Planners March 11 th, 2013 Domenic Idone, P. Eng Planning Manager R.W. Tomlinson Ltd. 5597 Power Road Ottawa, Ontario K1G 3N4 Dear Mr. Idone:
Traffic Impact Analysis
 Traffic Impact Analysis Congregate Care Facility Billerica, Massachusetts Prepared For: Hawthorn Development, LLC 35 Kettle Court Salem, OR 973 Prepared By: Sebago Technics, Inc. 75 John Roberts Road,
LATSON INTERCHANGE DEVELOPMENT TRAFFIC STUDIES. Genoa Township, Livingston County, MI
 LATSON INTERCHANGE DEVELOPMENT TRAFFIC STUDIES Genoa Township, Livingston County, MI DRAFT TRAFFIC STUDY FOR I-96 AT LATSON RD INTERCHANGE Livingston County CS 47065 JN 101622C Submitted to: Michigan Department
Provide an overview of the development proposal including projected site traffic volumes;
 December 19, 2013 File: 163600935 Attention: Troy Elliott Carl Elliott Limited 15-1831 Robertson Road PO Box 11117 Nepean, Ontario K1H 7T8 Dear Mr. Elliott, Reference: 2235 and 2265 Robertson Road Transportation
MEMO. McCORMICK RANKIN CORPORATION. File Mark VanderSluis, Keyur Shah DATE: October 26, 2009 COPIES: OUR FILE: TO: FROM: Jack Thompson
 McCORMICK RANKIN CORPORATION 2655 North Sheridan Way Mississauga, Ontario, L5K 2P8 Tel: (95)823-85 Fax: (95) 823-853 E-mail: mrc@mrc.ca Website: www.mrc.ca MEMO TO: FROM: File Mark VanderSluis, Keyur Shah
APPENDIX J LAKE WOHLFORD DAM REPLACEMENT PROJECT TRAFFIC IMPACT ANALYSIS (DAM REPLACEMENT) Lake Wohlford Dam Replacement Project EIR
 Lake Wohlford Dam Replacement Project EIR") APPENDIX J LAKE WOHLFORD DAM REPLACEMENT PROJECT TRAFFIC IMPACT ANALYSIS (DAM REPLACEMENT) Replacement Project EIR Appendices TRAFFIC IMPACT ANALYSIS LAKE WOHLFORD DAM Escondido, California December 19,
APPENDIX J LAKE WOHLFORD DAM REPLACEMENT PROJECT TRAFFIC IMPACT ANALYSIS (DAM REPLACEMENT) Replacement Project EIR Appendices TRAFFIC IMPACT ANALYSIS LAKE WOHLFORD DAM Escondido, California December 19,
Ref. No Task 3. April 28, Mr. Cesar Saleh, P. Eng. VP Planning and Design W.M. Fares Group th
 Ref. No. 151-00564 Task 3 April 28, 2015 Mr. Cesar Saleh, P. Eng. VP Planning and Design W.M. Fares Group th 3480 Joseph Howe Drive, 5 Floor HALIFAX NS B3L 4H7 Sent via Email to ceasr.saleh@wmfares.com
EXECUTIVE SUMMARY. The following is an outline of the traffic analysis performed by Hales Engineering for the traffic conditions of this project.
 EXECUTIVE SUMMARY This study addresses the traffic impacts associated with the proposed Shopko redevelopment located in Sugarhouse, Utah. The Shopko redevelopment project is located between 1300 East and
HCM Unsignalized Intersection Capacity Analysis 6: Brian Street & LC 111 5/26/2009
 6: Brian Street & LC 111 5/26/2009 Movement EBL EBR NBL NBT SBT SBR Volume (veh/h) 116 20 8 405 137 56 Sign Control Stop Free Free Grade 0% 0% 0% Peak Hour Factor 0.81 0.81 0.67 0.67 0.89 0.89 Hourly flow
Wellington Street West
 Transportation Brief prepared for: 185 Davenport Road Suite 300 Toronto, ON M5R 1J1 prepared by: 1223 Michael Street Suite 100 Ottawa, ON K1J 7T2 November 5, 2013 TO3131TOH Transportation Brief November
MEMORANDUM November 19, 2012
 COUNCIL OF GOVERNMENTS CENTRAL NAUGATUCK VALLEY 60 NORTH MAIN ST 3RD Floor WATERBURY, CT 06702-1403 (203)757-0535 Web Site: www.cogcnv.org E-Mail: cogcnv@cogcnv.org November 19, 2012 MEMORANDUM 111912
Freeway Weaving and Ramp Junction Analysis
 TEXAS TECH UNIVERSITY Freeway Weaving and Ramp Junction Analysis Along IH 27 at Plainview, TX Hao Xu, Jared A. Squyres, Wesley Kumfer, and Hongchao Liu 7/15/2011 Table of Contents Project Description...
JRL consulting. March Hartland Developments Limited 1993 Hammonds Plains Road Hammonds Plains, NS B4B 1P3
 March 2015 Prepared for Hartland Developments Limited 1993 Hammonds Plains Road Hammonds Plains, NS B4B 1P3 JRL consulting JRL consulting TABLE OF CONTENTS 1 INTRODUCTION... 2 1.1 BACKGROUND... 2 2 EXISTING
Appendix B: Traffic Reports
 Appendix B: Traffic Reports 407 TRANSITWAY - KENNEDY ROAD TO BROCK ROAD MINISTRY OF TRANSPORTATION - CENTRAL REGION Report Markham Road Station Traffic Study Prepared for Ministry of Transportation, Ontario
Lakeside Terrace Development
 Lakeside Terrace Development City of Barrie, County of Simcoe Traffic Brief for: Type of Document: Final Report Project Number: JDE 1617 Date Submitted: April 29 th, 216 4/29/16 John Northcote, P.Eng.