Traffic Impact Study. Eastern Springs. A Proposed Development in Manorville, NY. April Haas Group Inc Transportation Planners and Engineers
|
|
|
- Edith Spencer
- 5 years ago
- Views:
Transcription
1 Traffic Impact Study For Eastern Springs A Proposed Development in Manorville, NY April 2018 Haas Group Inc Transportation Planners and Engineers
2 Table of Contents 1) Executive Summary ) Study Purpose ) Project Description ) Project Location ) Proposed Development... 5 a. Exit Alternative... 5 b. Shuttle Bus Alternative ) Trip Generation ) Trip Assignment ) Roadway Designs ) Operational Analysis...12 a. Mitigations...15 b. Results ) Conclusion
3 1) Executive Summary: The site that Haas Group Inc. studied as part of this traffic impact study is located in Manorville, NY. The town of Manorville is a suburban neighborhood located on Long Island, an island extending east 115 miles off the coast of New York City. Manorville s population sits around 14,000 with around 4,000 households and a median income of almost $87,000. Manorville consists of largely residential districts with some commercial and office districts. Like most of Long Island, the majority of residents in Manorville rely on personal vehicles to get around, reserving public transportation like the Long Island Rail Road to commute to and from work in New York City. The site of the proposed development is located between a variety of major transportation infrastructure serving Long Island. The Long Island Expressway and Sunrise highway are two pieces of infrastructure that span the island, serving as major arteries for travel in the East-West direction. The Long Island Rail Road is also in close proximity, again spanning the length of the island. All three pieces of infrastructure connect all of long island with the New York metropolitan region. An analysis of the existing roadway conditions in the impacted traffic network was completed. This preliminary analysis was used alongside a projected traffic network model to simulate the effects of building a development of this size in the Manorville area. The results were as follows: The existing traffic network will be under substantial strain if the proposed development is built. In order to alleviate the network, Haas Group Inc. recommends the addition of an exit/entry ramp off the Long Island Expressway between exits 68 and 69. A new ramp off the expressway will allow direct access to the development and take as many trips off the existing roads as possible. This report and its recommendations can be used for guidance of development and prioritizing decisions as the plans for Eastern Springs move forward. 2) Study Purpose: This document is to serve as a Traffic Impact Analysis for a proposed development on the southern side of the Long Island Expressway bounded by Weeks Ave, Middle Island Road, and North St in Manorville, NY. This Traffic Impact Analysis outlines the existing site, the proposed development project, land use and zoning changes, the existing transportation network conditions, the proposed transportation network, operational analysis, and alternative project proposals. 3) Project Description: 2

4 The proposed development known as Eastern Springs will be a mixed use project occupying the majority of the existing 660 acre site. The development aims to create jobs and bring life to an unused space while providing multiple land uses to minimize the impact on the existing transportation network. Eastern Springs will feature 6 land-uses including residential, high end retail, hospitality, museum, Cineplex, and public park space. Within the development there will be public bathrooms, public seating/rest areas, landscaped roads/parking lots/sidewalks, a network of biking and walking trails, along with open-air public plazas within the retail and hospitality space. Eastern Springs will be partitioned into 3 distinct regions: the northern development region, the southwestern development region, and the park. All three regions will be served by one large parking lot around the exterior of the development. Four pedestrian crosswalks on each side will exist to allow access from the parking lot to the development. The northern and southwestern development region will be divided by an expansive public pavilion acting as the main entrance for the development. From this pavilion, visitors can choose to explore the northern or southwestern region of the development or continue straight through to the public park. Figure 1: Eastern Springs Concept Plan 3
5 The retail space known as The Outlets at Eastern Springs will be present on both the northern and southwestern development region with parking options at either locations. The Outlets at Eastern Springs will all exist on the ground floor of the public plaza and consist of high end, designer shops. The residential space known as The Residences at Eastern Springs will be located in the southwestern development region on the second floor above the shops. Tenants will have access to a private garden as well as parking options solely for the residences as well as within the main parking space for the development. The hospitality space will exist on the northern development region and consist of a variety of fast food and sit down restaurant options. The museum space will be on the park-side of the northern development region with sweeping views of the state park. The Cineplex will exist at the edge of the northern development region extending from the parking lot to the park. The passive park space known as Eastern Springs State Park will be accessible from the main public plaza or from a variety of separate parking lots around the perimeter. Eastern Springs State Park will feature a main outer walking and biking loops with an inner walking loop surrounding a central lake. The outer walking/biking loop will be emergency vehicle accessible. See Table 1 for land-use sizes. Table 1: Eastern Springs Land Uses Residential Space 300 Dwelling Units Retail Space 1,651,000 ft 2 Hospitality Space 412,750 ft 2 Museum Space 522,439 ft 2 Cineplex Passive Park Space 4,000 Seats 312 Acres 4) Project Location: The proposed development site (see Figure 2) is located in Manorville, NY. A town in Suffolk County on the eastern end of long island about 70 miles outside of New York City. The site is bordered on the western side by a heavily residential region of land. Manorville is a suburban town with a population of about 14,000. Its proximity to the Hamptons and Montauk should be noted considering trips there will most likely pass through Manorville. For this analysis, it was assumed that the majority of trips were coming from the direction of New York City and the rest of Long Island. 4

6 Figure 2: Development Location The proposed site is bordered immediately on the north by the Long Island Expressway. Also close by is the Sunrise highway to the south. Both the Long Island Expressway and the Sunrise Highway are major transportation arteries of east-west travel on Long Island. The proposed development site is also situated nearby the Long Island Railroad Ronkonkoma branch, with two stops relatively close by. The Yaphank stop is 4 miles west of the development, about a 10 minute drive. The Riverhead stop is 15 miles east of the development and would be about an 18 minute drive. The Brookhaven Calabro Airport, a small public airport, is also situated about 1.5 miles south of the proposed development. 5) Proposed Development: Eastern Springs is a proposed multi-use development in Manorville, NY on the eastern end of Long Island. The development site sits on a 660 acre plot of land immediately beneath the Long Island Expressway between Exits 68 and 69. The proposed development has two transit alternatives. Peak period for both alternatives was determined to be Saturday. a. Exit Alternative: The Exit Alternative involves building an exit off the Long Island Expressway between Exits 68 and 69 for direct access to the development and to ease congestion on existing roads. Due to land restrictions, construction can only take place on the southern side of the Long Island Expressway. This results in access strictly to the eastbound lanes of the expressway. 5

7 Figure 3: Proposed LIE Exit into Eastern Springs b. Shuttle Bus Alternative: The Shuttle Bus Alternative involves creating a shuttle bus system with separate routes from the development to the two nearest Long Island Railroad stations (Yaphank and Riverhead). These trips will run at a frequency of 15 trips per hour. Two bus routes will operate within the development, both on a one-way loop system. The Yaphank Route will run from the Yaphank LIRR station onto Middle Island road, turning left onto North Street, right onto Point Road, then left onto Perimeter Road where the shuttle will drive along the development until reaching the Yaphank Route Bus Stop. The bus will then turn left onto Spring Street and left again onto North Street where the bus will exit the development and head back to the Yaphank LIRR Station. The Riverhead Route will run in a similar fashion running from the Riverhead LIRR Station onto South Street, continuing onto North Street, and turning left onto Compass Street and Perimeter Road where the bus will continue along the development until reaching the Riverhead Route Bus Stop. The bus will then turn right onto Spring Street and right again onto North Street where it will head back to the Riverhead LIRR station. 6

8 Riverhead Bus Stop Yaphank Bus Stop Figure 4: Proposed Shuttle Bus Network 6) Trip Generation: The following trip generations (Table 2) for the Eastern Springs development were obtained from the ITE 9th Edition Trip Generation Manual as well as CEQR Table All projected trips are assumed to be 100% auto trips. For the following analyses, Saturday Peak Hour trips will be used. 7
9 Table 2: Trip Generation Values PROJECT PROPOSED BUILD TRAFFIC VOLUMES COMPONENTS DESCRIPTION SIZE Total Generated Trips AM Peak PM Peak Saturday Peak (X) AM Peak Hour PM Peak Hour Saturday Peak Hour IN OUT IN OUT IN OUT 1 Apartments 0.51*X 0.67*X 0.60*X 20% 80% 65% 35% 65% 35% Residential Space ITE Land Use: Dwelling Units 2 Factory Outlet Center 0.67*(X/1000) 2.29*(X/1000) 3*(X/1000) 73% 27% 47% 53% 70% 30% Retail Space ITE Land Use: 823 1,651, SF 3 High Turnover/Sit Down Restaurant 10.81*X 9.85*X 10*X 55% 45% 60% 40% 60% 40% Food Restaurant ITE Land Use: Space KSF2 4 Museum Space (0.28/1000)*X (0.18/1000)*X 0.20*(X/1000) 86% 14% 16% 84% 80% 20% Museum ITE Land Use: , SF 5 Multiplex Movie Theater 0.01*X 0.08*X 0.08*X 36% 64% 36% 64% 27% 73% Cineplex ITE Land Use: 445 4, CEQR Table 16-2 Seats 6 Passive Park Space 0.15*X 0.20*X 62*X* % 43% 45% 55% 95% 5% Park Space CEQR Table ITE Land Use: 417 Acres NET VEHICULAR TRIP GENERATION* PEAK HOUR From our resources, it was found that the museum space, retail space, and park space all have Saturday peak hours. Given the large volume of trips being generated by the retail space, Saturday peak hour was used throughout the analysis. All values highlighted in yellow were values assumed based off of other given peak hour values. 7) Trip Assignment: Using the peak hour traffic volumes found above, a trip assignment network was developed for both alternatives with and surrounding the proposed development. The percentage of trips in and out of the development found for the Saturday peak hour were used to determine the modal split of the trips as seen in Table 3. Table 3: Modal Split LIE Exit Alternative Shuttle Bus Alternative Cars Trucks Transit Bike 96% 3.5% 0% 0.5% In Out 69% 3.5% 31% 0.5% In Out 8
10 The Shuttle Bus Alternative has a percentage of transit that the LIE Exit Alternative lacks, relieving the network of a portion of the trips made by cars. The trip assignment networks (Figure 5 through 8) were developed on the basis of existing density immediately surrounding the development as well as the assumption that the majority of the trips are going to be coming from and going to the west (i.e. New York City as well as nearly the entirety of Long Island). Given the layout of the network, it was assumed that the majority of these western originating trips will enter/exit at the LIE Exit for the Exit Alternative and at the intersection of Middle Island Road with Perimeter Road or North Street for the Shuttle Alternative. For both alternatives, the remaining trips will be split up to enter/exit the network at all other access points. Furthermore, bikes will only enter at the southern portion of the network (due to the larger residential land use). Figure 5: External Trip Assignments, Exit Alternative 9
11 Figure 6: Internal Trip Assignments, Exit Alternative Figure 7: External Trip Assignment, Shuttle Alternative 10
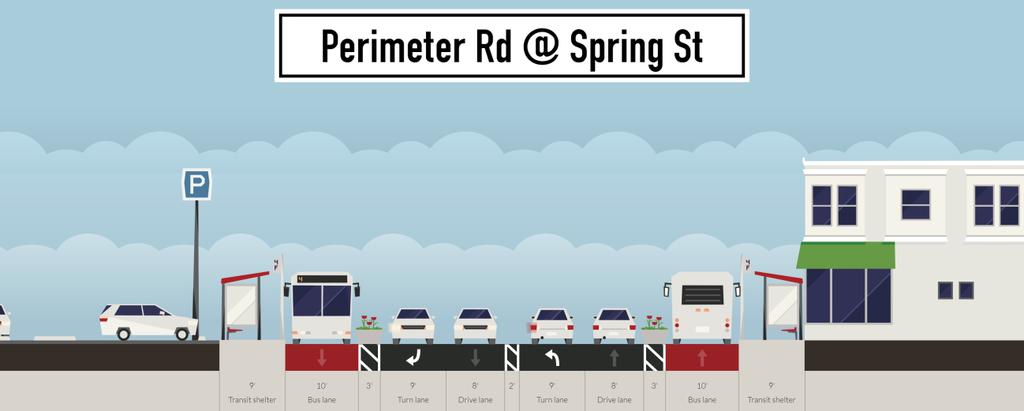
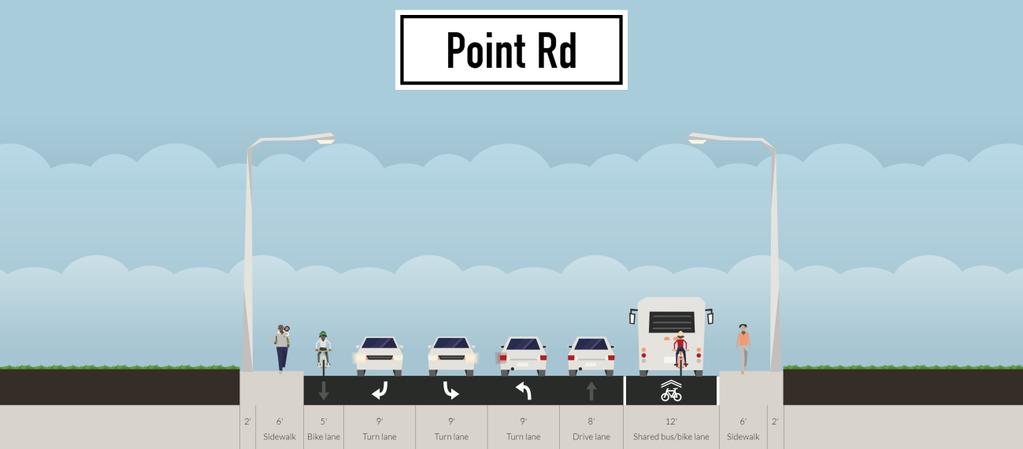
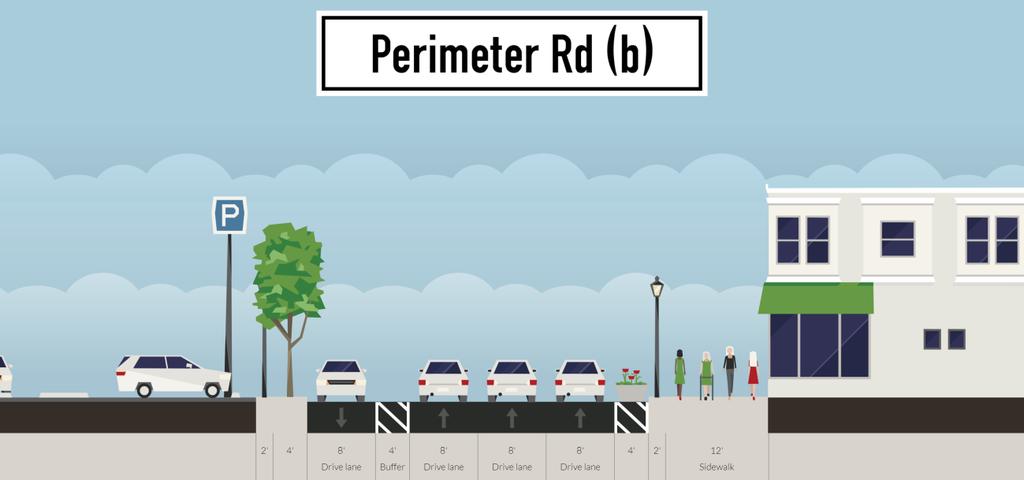
12 Figure 8: Internal Trip Assignment, Shuttle Alternative The trip assignments exemplify the critical intersections occurring at the intersection of Spring St and North St in both Shuttle and Exit Alternatives (south-bound through) as well as the intersection of Middle-Island Rd and William Floyd Parkway in the Shuttle Alternative (southbound left). 8) Roadway Designs: Within Eastern Springs, a small road network must be built to service the major development as well as access points for the state park. These roadways (Located in the Appendix) were designed using the software Streetmix with a signalized flow speed of 900 vph per lane. If over 200 vph were assigned to make a left hand turn then a protected left hand turn was implemented. Figures 9 and 10 showcase some differences between alternatives on Perimeter Road. 11


13 Figure 9: Roadway Design, Shuttle Alternative 9) Operational Analysis: Figure 10: Roadway Design: Exit Alternative In order to determine if the traffic network could handle the trips imposed on it due to the development of Eastern Springs, an analysis of its signalized intersections needed to be performed. This analysis was carried out via the software Synchro 10 for both the Shuttle Alternative and Exit Alternative. Due to the use of a Student Version, the maximum amount of intersections to be modeled was limited to 10. The 10 most important intersections in the traffic network were then chosen and modeled. Figures display two critical intersections simulated in Synchro for each alternative before mitigations. 12
")
 13")
14 Figure 11: Middle Island North St (Shuttle Alternative) Figure 12: Middle Island North St (Exit Alternative) 13


15 Figure 13: North Spring St (Shuttle Alternative) Figure 14: North Spring St (Exit Alternative) 14


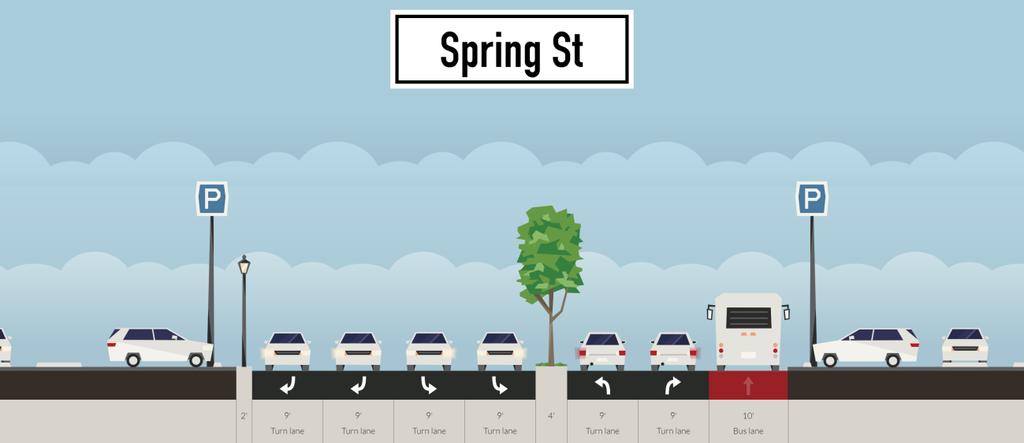
16 a. Mitigations: Analysis of critical intersections with Synchro 10 determined the level of service (LOS) and volume to capacity (v/c) ratio of each intersection. A LOS of A through E is considered acceptable while LOS F does not provide an adequate level of service. Similarly, a v/c ratio of 1.0 or larger is considered unacceptable. After performing an initial operational analysis, it was clear that the traffic network in both alternatives could not handle the trips generated by the development and mitigations had to be made. For both alternatives, the intersection of Middle Island Road and North Street could not handle the amount of trips entering and exiting the development. To mitigate this, Perimeter Road was extended south to form an additional connector road with Middle Island Road (Figure 12) to allow an alternative entrance to Eastern Springs and alleviate the single intersection. Figure 15: Extension of Perimeter Road While this reduced the amount of trips entering/exiting at a single intersection, many of the intersections in the traffic network still presented a LOS F or v/c over 1.0. The trip assignment network was rebalanced in an attempt to remove many of the trips from the existing roads and place them onto proposed roads to be built, in the Exit Alternative case. The mitigated trip assignment networks are shown in Figure 13 and 14. The proposed roadway off the proposed LIE Exit onto Spring Street must be expanded to accommodate the larger number of trips (Figure 15). 15
17 Figure 16: Mitigated External Assignments Figure 17: Mitigated Internal Assignments 16
18 Figure 18: Mitigated Spring St b. Results: The results in Tables 4 and 5 display the operational status of each intersection before and after mitigation, for both the Exit Alternative and the Shuttle Alternative. Table 4: Operational Analysis Summary for Shuttle Alternative Intersection Middle Island Weeks Avenue William Flloyd Middle Island Road Middle Island Perimeter Road North Point Road Lane Group Non-Mitigated LOS Delay (sec) Lane Group Mitigated LOS Delay (sec) EB B 14.2 EB A 7.5 WB A 9.5 WB C 26.1 NB B 13.3 NB C 31.8 SB A 3 SB A 7.9 EB A 8.7 EB F WB A 9.8 WB F NB A 0.2 NB F SB F 1054 SB D 38.2 EB - - EB F WB - - WB B 11.1 NB - - NB - - SB - - SB F EB - - EB - - WB E 55.1 WB F NB F NB F SB F SB C 31 Weeks South Street EB F EB C
19 WB F WB B 10.7 NB B 11 NB F 98.8 SB B 17.4 SB B 16.7 EB F EB - - Wading River South Street WB - - WB - - NB C 34.1 NB - - SB A 9.1 SB - - EB F 5402 EB F Middle Island North Street WB B 11.3 WB F 600 NB - - NB - - SB F 128 SB F EB B 12.8 EB A 8.1 Compass North Street WB F WB F NB E 58.7 NB B 17.2 SB - - SB - - EB F EB F Spring North Street WB F WB F NB F NB F SB - - SB - - EB E 71.1 EB F Perimeter Spring Street WB A 1.9 WB A 0.5 NB - - NB - - SB F SB B 15.1 Table 5: Operational Analysis Summary for Exit Alternative Intersection Middle Island Weeks Avenue William Flloyd Middle Island Road Lane Group Non-Mitigated LOS Delay (sec) Lane Group Mitigated LOS Delay (sec) EB B 10 EB A 3.2 WB B 10.6 WB C 23.7 NB B 15.3 NB C 30.7 SB A 2.8 SB B 17.9 EB A 9.9 EB B 10.1 WB A 9.8 WB B 10 NB A 3.1 NB A
20 Middle Island Perimeter Road North Point Road Weeks South Street Wading River South Street Middle Island North Street Compass North Street Spring North Street Perimeter Spring Street SB A 9.8 SB A 8.1 EB - - EB E 55 WB - - WB A 1.7 NB - - NB - - SB - - SB A 0.2 EB - - EB - - WB A 6.4 WB C 21.1 NB A 8.7 NB A 3 SB F SB D 38.6 EB F EB B 12.1 WB F WB B 16.5 NB B 10.4 NB B 15.3 SB A 9.6 SB A 6.5 EB A 10 EB - - WB - - WB - - NB E 69 NB - - SB C 23.8 SB - - EB F EB D 50.6 WB B 13.8 WB A 2.6 NB - - NB - - SB A 0.6 SB B 11.5 EB A 4 EB - - WB F 1733 WB C 20.1 NB D 48.5 NB A 0.5 SB - - SB - - EB C 28.3 EB C 24.2 WB - - WB F 91.5 NB F NB C 30.7 SB F SB B 14.7 EB F EB D 37.2 WB A 0.6 WB A 0.6 NB - - NB - - SB F SB C
21 10) Conclusion: Due to the shear amount of trips generated by the Eastern Springs Proposed Development, the existing intersections have to be spared as much as possible since their capacity cannot be altered. The intersections of Weeks Avenue at North Street and Middle Island Road at North Street cannot serve as the development s main access points in their current state. In the Shuttle Alternative, though the number of vehicle trips is reduced due to the higher capacity of buses, the above stated intersections still serve as the sole access points and cannot handle the volume imposed. For these reasons, Haas Group Inc. recommends the LIE Exit alternative to alleviate the existing intersections as much as possible. In this alternative, the main access point for Eastern Springs is the proposed Long Island Expressway Exit onto Spring Street. Given that this is a proposed roadway, it can be constructed to a size that can handle the volume of trips generated by a development of this magnitude. 20
22 List of Figures Figure 1: Eastern Springs Concept Plan 3 Figure 2: Development Location 5 Figure 3: Proposed LIE Exit into Eastern Springs 6 Figure 4: Proposed Shuttle Bus Network 7 Figure 5: External Trip Assignments, Exit Alternative 9 Figure 6: Internal Trip Assignments, Exit Alternative 10 Figure 7: External Trip Assignment, Shuttle Alternative 10 Figure 8: Internal Trip Assignment, Shuttle Alternative 11 Figure 9: Roadway Design, Shuttle Alternative 12 Figure 10: Roadway Design: Exit Alternative 12 Figure 11: Middle Island North St (Shuttle Alternative) 13 Figure 12: Middle Island North St (Exit Alternative) 13 Figure 13: North Spring St (Shuttle Alternative) 14 Figure 14: North Spring St (Exit Alternative) 14 Figure 15: Extension of Perimeter Road 15 Figure 16: Mitigated External Assignments 16 Figure 17: Mitigated Internal Assignments 16 Figure 18: Mitigated Spring St 17 29
23 List of Tables Table 1: Eastern Springs Land Uses 4 Table 2: Trip Generation Values 8 Table 3: Modal Split 8 Table 4: Operational Analysis Summary for Shuttle Alternative 17 Table 5: Operational Analysis Summary for Exit Alternative 18 30
24 Appendix: Shuttle Bus Alternative Roadway Designs 21
25 22
26 23
27 24

28 Long Island Expressway Exit Alternative Roadway Designs 25
29 26
30 27

31 28
32 Shuttle Alternative - Unmitigated 04/22/2018 Lane Group EBL EBT EBR WBL WBT WBR NBL NBT NBR SBL SBT SBR Lane Configurations Traffic Volume (vph) Future Volume (vph) Ideal Flow (vphpl) Lane Util. Factor Frt Flt Protected Satd. Flow (prot) Flt Permitted Satd. Flow (perm) Right Turn on Red Yes Yes Yes Yes Satd. Flow (RTOR) Link Speed (mph) Link Distance (ft) Travel Time (s) Peak Hour Factor Adj. Flow (vph) Shared Lane Traffic (%) Lane Group Flow (vph) Enter Blocked Intersection No No No No No No No No No No No No Lane Alignment Left Left Right Left Left Right Left Left Right Left Left Right Median Width(ft) Link Offset(ft) Crosswalk Width(ft) Two way Left Turn Lane Headway Factor Turning Speed (mph) Turn Type Perm NA Perm NA Perm NA Perm NA Protected Phases Permitted Phases Minimum Split (s) Total Split (s) Total Split (%) 50.0% 50.0% 50.0% 50.0% 50.0% 50.0% 50.0% 50.0% Maximum Green (s) Yellow Time (s) All-Red Time (s) Lost Time Adjust (s) Total Lost Time (s) Lead/Lag Lead-Lag Optimize? Walk Time (s) Flash Dont Walk (s) Pedestrian Calls (#/hr) Act Effct Green (s) Actuated g/c Ratio v/c Ratio Control Delay Queue Delay Total Educational Delay 14.2 Use Only Page 1
33 Shuttle Alternative - Unmitigated 04/22/2018 Lane Group EBL EBT EBR WBL WBT WBR NBL NBT NBR SBL SBT SBR LOS B A B A Approach Delay Approach LOS B A B A Intersection Summary Area Type: Other Cycle Length: 45 Actuated Cycle Length: 45 Offset: 0 (0%), Referenced to phase 2:NBTL and 6:SBTL, Start of Green Natural Cycle: 45 Control Type: Pretimed Maximum v/c Ratio: 0.57 Intersection Signal Delay: 11.9 Intersection LOS: B Intersection Capacity Utilization 64.7% ICU Level of Service C Analysis Period (min) 15 Splits and Phases: 9: Middle Island Rd & Weeks Ave. Educational Use Only Page 2
34 Shuttle Alternative - Unmitigated 04/22/2018 Lane Group EBL EBT EBR WBL WBT WBR NBL NBT NBR SBL SBT SBR Lane Configurations Traffic Volume (vph) Future Volume (vph) Ideal Flow (vphpl) Lane Util. Factor Frt Flt Protected Satd. Flow (prot) Flt Permitted Satd. Flow (perm) Right Turn on Red Yes Yes Yes Yes Satd. Flow (RTOR) Link Speed (mph) Link Distance (ft) Travel Time (s) Peak Hour Factor Adj. Flow (vph) Shared Lane Traffic (%) Lane Group Flow (vph) Enter Blocked Intersection No No No No No No No No No No No No Lane Alignment Left Left Right Left Left Right Left Left Right Left Left Right Median Width(ft) Link Offset(ft) Crosswalk Width(ft) Two way Left Turn Lane Headway Factor Turning Speed (mph) Turn Type Perm NA Perm NA Perm Perm Perm Perm Perm Protected Phases Permitted Phases Minimum Split (s) Total Split (s) Total Split (%) 50.0% 50.0% 50.0% 50.0% 50.0% 50.0% 50.0% 50.0% 50.0% 50.0% 50.0% Maximum Green (s) Yellow Time (s) All-Red Time (s) Lost Time Adjust (s) Total Lost Time (s) Lead/Lag Lead-Lag Optimize? Walk Time (s) Flash Dont Walk (s) Pedestrian Calls (#/hr) Act Effct Green (s) Actuated g/c Ratio v/c Ratio Control Delay Queue Delay Total Educational Delay 8.7 Use 11.8Only Page 3
35 Shuttle Alternative - Unmitigated 04/22/2018 Lane Group EBL EBT EBR WBL WBT WBR NBL NBT NBR SBL SBT SBR LOS A B B A A F Approach Delay Approach LOS A A A F Intersection Summary Area Type: Other Cycle Length: 45 Actuated Cycle Length: 45 Offset: 0 (0%), Referenced to phase 2:NBTL and 6:SBTL, Start of Green Natural Cycle: 150 Control Type: Pretimed Maximum v/c Ratio: 3.31 Intersection Signal Delay: Intersection LOS: F Intersection Capacity Utilization 116.3% ICU Level of Service H Analysis Period (min) 15 Splits and Phases: 10: William Floyd Pkwy & Middle Island Rd. Educational Use Only Page 4
36 Shuttle Alternative - Unmitigated 04/22/2018 Lane Group WBL WBR NBT NBR SBL SBT Lane Configurations Traffic Volume (vph) Future Volume (vph) Ideal Flow (vphpl) Lane Util. Factor Frt Flt Protected Satd. Flow (prot) Flt Permitted Satd. Flow (perm) Right Turn on Red Yes Yes Satd. Flow (RTOR) 121 Link Speed (mph) Link Distance (ft) Travel Time (s) Peak Hour Factor Adj. Flow (vph) Shared Lane Traffic (%) Lane Group Flow (vph) Enter Blocked Intersection No No No No No No Lane Alignment Left Right Left Right Left Left Median Width(ft) Link Offset(ft) Crosswalk Width(ft) Two way Left Turn Lane Headway Factor Turning Speed (mph) Turn Type Prot Perm NA Perm NA Protected Phases Permitted Phases 8 6 Minimum Split (s) Total Split (s) Total Split (%) 50.0% 50.0% 50.0% 50.0% 50.0% Maximum Green (s) Yellow Time (s) All-Red Time (s) Lost Time Adjust (s) Total Lost Time (s) Lead/Lag Lead-Lag Optimize? Walk Time (s) Flash Dont Walk (s) Pedestrian Calls (#/hr) Act Effct Green (s) Actuated g/c Ratio v/c Ratio Control Delay Queue Delay Total Educational Delay 55.1 Use Only Page 5
37 Shuttle Alternative - Unmitigated 04/22/2018 Lane Group WBL WBR NBT NBR SBL SBT LOS E F F Approach Delay Approach LOS E F F Intersection Summary Area Type: Other Cycle Length: 45 Actuated Cycle Length: 45 Offset: 0 (0%), Referenced to phase 2:NBT and 6:SBTL, Start of Green Natural Cycle: 50 Control Type: Pretimed Maximum v/c Ratio: 8.81 Intersection Signal Delay: Intersection LOS: F Intersection Capacity Utilization 303.4% ICU Level of Service H Analysis Period (min) 15 Splits and Phases: 17: North St./North St & Point Rd Educational Use Only Page 6
38 Shuttle Alternative - Unmitigated 04/22/2018 Lane Group EBL EBT EBR WBL WBT WBR NBL NBT NBR SBL SBT SBR Lane Configurations Traffic Volume (vph) Future Volume (vph) Ideal Flow (vphpl) Lane Util. Factor Frt Flt Protected Satd. Flow (prot) Flt Permitted Satd. Flow (perm) Right Turn on Red Yes Yes Yes Yes Satd. Flow (RTOR) Link Speed (mph) Link Distance (ft) Travel Time (s) Peak Hour Factor Adj. Flow (vph) Shared Lane Traffic (%) Lane Group Flow (vph) Enter Blocked Intersection No No No No No No No No No No No No Lane Alignment Left Left Right Left Left Right Left Left Right Left Left Right Median Width(ft) Link Offset(ft) Crosswalk Width(ft) Two way Left Turn Lane Headway Factor Turning Speed (mph) Turn Type Perm NA Perm NA Perm NA Perm NA Protected Phases Permitted Phases Minimum Split (s) Total Split (s) Total Split (%) 50.0% 50.0% 50.0% 50.0% 50.0% 50.0% 50.0% 50.0% Maximum Green (s) Yellow Time (s) All-Red Time (s) Lost Time Adjust (s) Total Lost Time (s) Lead/Lag Lead-Lag Optimize? Walk Time (s) Flash Dont Walk (s) Pedestrian Calls (#/hr) Act Effct Green (s) Actuated g/c Ratio v/c Ratio Control Delay Queue Delay Total Educational Delay Use Only Page 7
39 Shuttle Alternative - Unmitigated 04/22/2018 Lane Group EBL EBT EBR WBL WBT WBR NBL NBT NBR SBL SBT SBR LOS F F B B Approach Delay Approach LOS F F B B Intersection Summary Area Type: Other Cycle Length: 45 Actuated Cycle Length: 45 Offset: 0 (0%), Referenced to phase 2:NBTL and 6:SBTL, Start of Green Natural Cycle: 110 Control Type: Pretimed Maximum v/c Ratio: 2.49 Intersection Signal Delay: Intersection LOS: F Intersection Capacity Utilization 131.2% ICU Level of Service H Analysis Period (min) 15 Splits and Phases: 19: Weeks Ave. & South St Educational Use Only Page 8
40 Shuttle Alternative - Unmitigated 04/22/2018 Lane Group EBL EBR NBL NBT SBT SBR Lane Configurations Traffic Volume (vph) Future Volume (vph) Ideal Flow (vphpl) Lane Util. Factor Frt Flt Protected Satd. Flow (prot) Flt Permitted Satd. Flow (perm) Right Turn on Red Yes Yes Satd. Flow (RTOR) Link Speed (mph) Link Distance (ft) Travel Time (s) Peak Hour Factor Adj. Flow (vph) Shared Lane Traffic (%) Lane Group Flow (vph) Enter Blocked Intersection No No No No No No Lane Alignment Left Right Left Left Left Right Median Width(ft) Link Offset(ft) Crosswalk Width(ft) Two way Left Turn Lane Headway Factor Turning Speed (mph) Turn Type Prot Perm NA NA Protected Phases Permitted Phases 2 Minimum Split (s) Total Split (s) Total Split (%) 50.0% 50.0% 50.0% 50.0% Maximum Green (s) Yellow Time (s) All-Red Time (s) Lost Time Adjust (s) Total Lost Time (s) Lead/Lag Lead-Lag Optimize? Walk Time (s) Flash Dont Walk (s) Pedestrian Calls (#/hr) Act Effct Green (s) Actuated g/c Ratio v/c Ratio Control Delay Queue Delay Total Educational Delay Use 34.1Only 9.1 Page 9
41 Shuttle Alternative - Unmitigated 04/22/2018 Lane Group EBL EBR NBL NBT SBT SBR LOS F C A Approach Delay Approach LOS F C A Intersection Summary Area Type: Other Cycle Length: 45 Actuated Cycle Length: 45 Offset: 0 (0%), Referenced to phase 2:NBTL and 6:SBT, Start of Green Natural Cycle: 65 Control Type: Pretimed Maximum v/c Ratio: 1.84 Intersection Signal Delay: Intersection LOS: F Intersection Capacity Utilization 152.1% ICU Level of Service H Analysis Period (min) 15 Splits and Phases: 20: Wading River Rd & South St Educational Use Only Page 10
42 Shuttle Alternative - Unmitigated 04/22/2018 Lane Group EBL EBT WBT WBR SBL SBR Lane Configurations Traffic Volume (vph) Future Volume (vph) Ideal Flow (vphpl) Lane Util. Factor Frt Flt Protected Satd. Flow (prot) Flt Permitted Satd. Flow (perm) Right Turn on Red Yes Yes Satd. Flow (RTOR) Link Speed (mph) Link Distance (ft) Travel Time (s) Peak Hour Factor Adj. Flow (vph) Shared Lane Traffic (%) Lane Group Flow (vph) Enter Blocked Intersection No No No No No No Lane Alignment Left Left Left Right Left Right Median Width(ft) Link Offset(ft) Crosswalk Width(ft) Two way Left Turn Lane Headway Factor Turning Speed (mph) Turn Type Perm NA NA Prot Protected Phases Permitted Phases 4 Minimum Split (s) Total Split (s) Total Split (%) 50.0% 50.0% 50.0% 50.0% Maximum Green (s) Yellow Time (s) All-Red Time (s) Lost Time Adjust (s) Total Lost Time (s) Lead/Lag Lead-Lag Optimize? Walk Time (s) Flash Dont Walk (s) Pedestrian Calls (#/hr) Act Effct Green (s) Actuated g/c Ratio v/c Ratio Control Delay Queue Delay Total Educational Delay Use 11.3 Only Page 11
43 Shuttle Alternative - Unmitigated 04/22/2018 Lane Group EBL EBT WBT WBR SBL SBR LOS F B F Approach Delay Approach LOS F B F Intersection Summary Area Type: Other Cycle Length: 45 Actuated Cycle Length: 45 Offset: 0 (0%), Referenced to phase 2: and 6:SBL, Start of Green Natural Cycle: 120 Control Type: Pretimed Maximum v/c Ratio: Intersection Signal Delay: Intersection LOS: F Intersection Capacity Utilization 293.6% ICU Level of Service H Analysis Period (min) 15 Splits and Phases: 24: Middle Island Rd & North St. Educational Use Only Page 12
44 Shuttle Alternative - Unmitigated 04/22/2018 Lane Group EBT EBR WBL WBT NBL NBR Lane Configurations Traffic Volume (vph) Future Volume (vph) Ideal Flow (vphpl) Lane Util. Factor Frt Flt Protected Satd. Flow (prot) Flt Permitted Satd. Flow (perm) Right Turn on Red Yes Yes Satd. Flow (RTOR) 764 Link Speed (mph) Link Distance (ft) Travel Time (s) Peak Hour Factor Adj. Flow (vph) Shared Lane Traffic (%) Lane Group Flow (vph) Enter Blocked Intersection No No No No No No Lane Alignment Left Right Left Left Left Right Median Width(ft) Link Offset(ft) Crosswalk Width(ft) Two way Left Turn Lane Headway Factor Turning Speed (mph) Turn Type NA Perm NA Prot Protected Phases Permitted Phases 8 Minimum Split (s) Total Split (s) Total Split (%) 50.0% 50.0% 50.0% 50.0% Maximum Green (s) Yellow Time (s) All-Red Time (s) Lost Time Adjust (s) Total Lost Time (s) Lead/Lag Lead-Lag Optimize? Walk Time (s) Flash Dont Walk (s) Pedestrian Calls (#/hr) Act Effct Green (s) Actuated g/c Ratio v/c Ratio Control Delay Queue Delay Total Educational Delay 12.8 Use 783.5Only 58.7 Page 13
45 Shuttle Alternative - Unmitigated 04/22/2018 Lane Group EBT EBR WBL WBT NBL NBR LOS B F E Approach Delay Approach LOS B F E Intersection Summary Area Type: Other Cycle Length: 45 Actuated Cycle Length: 45 Offset: 0 (0%), Referenced to phase 2:NBL and 6:, Start of Green Natural Cycle: 150 Control Type: Pretimed Maximum v/c Ratio: 2.70 Intersection Signal Delay: Intersection LOS: F Intersection Capacity Utilization 154.3% ICU Level of Service H Analysis Period (min) 15 Splits and Phases: 30: Compass St. & North St Educational Use Only Page 14
46 Shuttle Alternative - Unmitigated 04/22/2018 Lane Group EBT EBR WBL WBT NBL NBR Lane Configurations Traffic Volume (vph) Future Volume (vph) Ideal Flow (vphpl) Lane Util. Factor Frt Flt Protected Satd. Flow (prot) Flt Permitted Satd. Flow (perm) Right Turn on Red Yes Yes Satd. Flow (RTOR) Link Speed (mph) Link Distance (ft) Travel Time (s) Peak Hour Factor Adj. Flow (vph) Shared Lane Traffic (%) Lane Group Flow (vph) Enter Blocked Intersection No No No No No No Lane Alignment Left Right Left Left Left Right Median Width(ft) Link Offset(ft) Crosswalk Width(ft) Two way Left Turn Lane Headway Factor Turning Speed (mph) Turn Type NA Perm NA Prot Perm Protected Phases Permitted Phases 8 2 Minimum Split (s) Total Split (s) Total Split (%) 50.0% 50.0% 50.0% 50.0% 50.0% Maximum Green (s) Yellow Time (s) All-Red Time (s) Lost Time Adjust (s) Total Lost Time (s) Lead/Lag Lead-Lag Optimize? Walk Time (s) Flash Dont Walk (s) Pedestrian Calls (#/hr) Act Effct Green (s) Actuated g/c Ratio v/c Ratio Control Delay Queue Delay Total Educational Delay Use 469.6Only Page 15
47 Shuttle Alternative - Unmitigated 04/22/2018 Lane Group EBT EBR WBL WBT NBL NBR LOS F F F A Approach Delay Approach LOS F F F Intersection Summary Area Type: Other Cycle Length: 45 Actuated Cycle Length: 45 Offset: 0 (0%), Referenced to phase 2:NBL and 6:, Start of Green Natural Cycle: 45 Control Type: Pretimed Maximum v/c Ratio: 2.00 Intersection Signal Delay: Intersection LOS: F Intersection Capacity Utilization 200.2% ICU Level of Service H Analysis Period (min) 15 Splits and Phases: 32: Spring St. & North St. Educational Use Only Page 16
48 Shuttle Alternative - Unmitigated 04/22/2018 Lane Group EBL EBT WBT WBR SBL SBR Lane Configurations Traffic Volume (vph) Future Volume (vph) Ideal Flow (vphpl) Lane Util. Factor Frt Flt Protected Satd. Flow (prot) Flt Permitted Satd. Flow (perm) Right Turn on Red Yes Yes Satd. Flow (RTOR) Link Speed (mph) Link Distance (ft) Travel Time (s) Peak Hour Factor Adj. Flow (vph) Shared Lane Traffic (%) Lane Group Flow (vph) Enter Blocked Intersection No No No No No No Lane Alignment Left Left Left Right Left Right Median Width(ft) Link Offset(ft) Crosswalk Width(ft) Two way Left Turn Lane Headway Factor Turning Speed (mph) Turn Type Perm Perm Prot Perm Protected Phases Permitted Phases Minimum Split (s) Total Split (s) Total Split (%) 50.0% 50.0% 50.0% 50.0% 50.0% 50.0% Maximum Green (s) Yellow Time (s) All-Red Time (s) Lost Time Adjust (s) Total Lost Time (s) Lead/Lag Lead-Lag Optimize? Walk Time (s) Flash Dont Walk (s) Pedestrian Calls (#/hr) Act Effct Green (s) Actuated g/c Ratio v/c Ratio Control Delay Queue Delay Total Educational Delay 71.1 Use 1.9Only Page 17
49 Shuttle Alternative - Unmitigated 04/22/2018 Lane Group EBL EBT WBT WBR SBL SBR LOS E A F A Approach Delay Approach LOS E A F Intersection Summary Area Type: Other Cycle Length: 45 Actuated Cycle Length: 45 Offset: 0 (0%), Referenced to phase 2: and 6:SBL, Start of Green Natural Cycle: 100 Control Type: Pretimed Maximum v/c Ratio: 1.49 Intersection Signal Delay: Intersection LOS: F Intersection Capacity Utilization 93.2% ICU Level of Service F Analysis Period (min) 15 Splits and Phases: 33: Perimeter Rd & Spring St. Educational Use Only Page 18
50 Shuttle Alternative Mitigated 04/22/2018 Lane Group EBL EBT WBT WBR SBL SBR Lane Configurations Traffic Volume (vph) Future Volume (vph) Ideal Flow (vphpl) Lane Util. Factor Frt Flt Protected Satd. Flow (prot) Flt Permitted Satd. Flow (perm) Right Turn on Red Yes Yes Satd. Flow (RTOR) Link Speed (mph) Link Distance (ft) Travel Time (s) Peak Hour Factor Adj. Flow (vph) Shared Lane Traffic (%) Lane Group Flow (vph) Enter Blocked Intersection No No No No No No Lane Alignment Left Left Left Right Left Right Median Width(ft) Link Offset(ft) Crosswalk Width(ft) Two way Left Turn Lane Headway Factor Turning Speed (mph) Turn Type Perm NA NA Prot Protected Phases Permitted Phases 4 Minimum Split (s) Total Split (s) Total Split (%) 81.3% 81.3% 81.3% 18.7% Maximum Green (s) Yellow Time (s) All-Red Time (s) Lost Time Adjust (s) Total Lost Time (s) Lead/Lag Lead-Lag Optimize? Walk Time (s) Flash Dont Walk (s) Pedestrian Calls (#/hr) Act Effct Green (s) Actuated g/c Ratio v/c Ratio Control Delay Queue Delay Total Educational Delay Use 11.1 Only Page 1
51 Shuttle Alternative Mitigated 04/22/2018 Lane Group EBL EBT WBT WBR SBL SBR LOS F B F Approach Delay Approach LOS F B F Intersection Summary Area Type: Other Cycle Length: 150 Actuated Cycle Length: 150 Offset: 0 (0%), Referenced to phase 2: and 6:SBL, Start of Green Natural Cycle: 45 Control Type: Pretimed Maximum v/c Ratio: 4.20 Intersection Signal Delay: Intersection LOS: F Intersection Capacity Utilization 170.1% ICU Level of Service H Analysis Period (min) 15 Splits and Phases: 3: Middle Island Rd & Perimeter Rd Educational Use Only Page 2
52 Shuttle Alternative Mitigated 04/22/2018 Lane Group EBL EBT EBR WBL WBT WBR NBL NBT NBR SBL SBT SBR Lane Configurations Traffic Volume (vph) Future Volume (vph) Ideal Flow (vphpl) Lane Util. Factor Frt Flt Protected Satd. Flow (prot) Flt Permitted Satd. Flow (perm) Right Turn on Red Yes Yes Yes Yes Satd. Flow (RTOR) Link Speed (mph) Link Distance (ft) Travel Time (s) Peak Hour Factor Adj. Flow (vph) Shared Lane Traffic (%) Lane Group Flow (vph) Enter Blocked Intersection No No No No No No No No No No No No Lane Alignment Left Left Right Left Left Right Left Left Right Left Left Right Median Width(ft) Link Offset(ft) Crosswalk Width(ft) Two way Left Turn Lane Headway Factor Turning Speed (mph) Turn Type Perm NA Perm NA Perm NA Perm NA Protected Phases Permitted Phases Minimum Split (s) Total Split (s) Total Split (%) 54.5% 54.5% 54.5% 54.5% 45.5% 45.5% 45.5% 45.5% Maximum Green (s) Yellow Time (s) All-Red Time (s) Lost Time Adjust (s) Total Lost Time (s) Lead/Lag Lead-Lag Optimize? Walk Time (s) Flash Dont Walk (s) Pedestrian Calls (#/hr) Act Effct Green (s) Actuated g/c Ratio v/c Ratio Control Delay Queue Delay Total Educational Delay 7.5 Use Only Page 3
53 Shuttle Alternative Mitigated 04/22/2018 Lane Group EBL EBT EBR WBL WBT WBR NBL NBT NBR SBL SBT SBR LOS A C C A Approach Delay Approach LOS A C C A Intersection Summary Area Type: Other Cycle Length: 55 Actuated Cycle Length: 55 Offset: 0 (0%), Referenced to phase 2:NBTL and 6:SBTL, Start of Green Natural Cycle: 55 Control Type: Pretimed Maximum v/c Ratio: 0.86 Intersection Signal Delay: 24.5 Intersection LOS: C Intersection Capacity Utilization 77.2% ICU Level of Service D Analysis Period (min) 15 Splits and Phases: 9: Middle Island Rd & Weeks Ave. Educational Use Only Page 4
54 Shuttle Alternative Mitigated 04/22/2018 Lane Group EBL EBT EBR WBL WBT WBR NBL NBT NBR SBL SBT SBR Lane Configurations Traffic Volume (vph) Future Volume (vph) Ideal Flow (vphpl) Lane Util. Factor Frt Flt Protected Satd. Flow (prot) Flt Permitted Satd. Flow (perm) Right Turn on Red Yes Yes Yes Yes Satd. Flow (RTOR) Link Speed (mph) Link Distance (ft) Travel Time (s) Peak Hour Factor Heavy Vehicles (%) 2% 4% 2% 2% 4% 2% 2% 2% 2% 2% 2% 2% Adj. Flow (vph) Shared Lane Traffic (%) Lane Group Flow (vph) Enter Blocked Intersection No No No No No No No No No No No No Lane Alignment Left Left Right Left Left Right Left Left Right Left Left Right Median Width(ft) Link Offset(ft) Crosswalk Width(ft) Two way Left Turn Lane Headway Factor Turning Speed (mph) Turn Type Perm NA Perm NA Perm Perm Perm Perm Perm Protected Phases Permitted Phases Minimum Split (s) Total Split (s) Total Split (%) 58.7% 58.7% 58.7% 58.7% 58.7% 41.3% 41.3% 41.3% 41.3% 41.3% 41.3% Maximum Green (s) Yellow Time (s) All-Red Time (s) Lost Time Adjust (s) Total Lost Time (s) Lead/Lag Lead-Lag Optimize? Walk Time (s) Flash Dont Walk (s) Pedestrian Calls (#/hr) Act Effct Green (s) Actuated g/c Ratio v/c Ratio Control Delay Queue Educational Delay 0.0 Use 0.0Only Page 5
 Traffic Analysis For Approved Uses within the St. Lucie West DRI Aldi Port St. Lucie, FL Prepared for: Bohler Engineering, LLC 1000 Corporate Drive Suite 250 Fort Lauderdale, FL 33334 Prepared by: 10795
MEMO. McCORMICK RANKIN CORPORATION. File FROM: Keyur Shah DATE: February 1, 2010 COPIES: OUR FILE: SUBJECT: TO:
 McCORMICK RANKIN CORPORATION 2655 North Sheridan Way Mississauga, Ontario, L5K 2P8 Tel: (905)823-8500 Fax: (905) 823-8503 E-mail: mrc@mrc.ca Website: www.mrc.ca MEMO TO: File FROM: Keyur Shah DATE: February
Provide an overview of the development proposal including projected site traffic volumes;
 December 19, 2013 File: 163600935 Attention: Troy Elliott Carl Elliott Limited 15-1831 Robertson Road PO Box 11117 Nepean, Ontario K1H 7T8 Dear Mr. Elliott, Reference: 2235 and 2265 Robertson Road Transportation
APPENDICES. APPENDIX D Synchro Level of Service Output Sheets
 APPENDICES APPENDIX D Synchro Level of Service Output Sheets Lanes, Volumes, Timings NO BUILD 2016 PM 8: 10th St & Thain Rd 10/05/2016 Lane Group NBL NBT NBR SBL SBT SBR SEL SET SER NWL NWT NWR
Final Technical Report US 17 Corridor Study Update (Market Street Road Diet)
") Market Street Road Diet Wilmington, NC 2016 Final Technical Report US 17 Corridor Study Update (Market Street Road Diet) Wilmington, NC Parsons Brinckerhoff January 2016 FINAL TECHNICAL REPORT US 17 Corridor
Market Street Road Diet Wilmington, NC 2016 Final Technical Report US 17 Corridor Study Update (Market Street Road Diet) Wilmington, NC Parsons Brinckerhoff January 2016 FINAL TECHNICAL REPORT US 17 Corridor
APPENDIX G. Traffic Data
 APPENDIX G Traffic Data HCM Signalized Intersection Capacity Analysis 2: Duanesburg Road & I-88 Ramps 10/7/2004 Movement EBL EBT EBR WBL WBT WBR NBL NBT NBR SBL SBT SBR Lane Configurations Ideal Flow (vphpl)
Proposed Office Building Traffic Impact Study Chicago Avenue Evanston, Illinois
 Proposed Office Building Traffic Impact Study 1714-1720 Chicago Avenue Evanston, Illinois Prepared For: HOLABIRD & ROOT, LLC Prepared by: Eriksson Engineering Associates, Ltd. 145 Commerce Drive, Ste A,
Table 1 - Land Use Comparisons - Proposed King s Wharf Development. Retail (SF) Office (SF) 354 6,000 10, Land Uses 1
 Office (SF) 354 6,000 10, Land Uses 1") Ref. No. 171-6694 Phase 2 November 23, 217 Mr. David Quilichini, Vice President Fares & Co. Developments Inc. 31 Place Keelson Sales Centre DARTMOUTH NS B2Y C1 Sent Via Email to David@faresinc.com RE:
Ref. No. 171-6694 Phase 2 November 23, 217 Mr. David Quilichini, Vice President Fares & Co. Developments Inc. 31 Place Keelson Sales Centre DARTMOUTH NS B2Y C1 Sent Via Email to David@faresinc.com RE:
Traffic Impact Analysis Farmington Center Village
 Traffic Impact Analysis Farmington Center Village Route 4 (Farmington Avenue) Farmington, Connecticut Prepared for: The Town of Farmington, CT Prepared By: BL Companies Meriden, Connecticut December 2016
Traffic Impact Study Morgan Road Commerce Park Pasco County, Florida
 Traffic Impact Study Morgan Road Commerce Park Pasco County, Florida Summary Report June 2008 Prepared by: 12909 N 56 th Street # 201 Tampa, FL 33617 Ph: (813) 988-3180 Fax: (813) 343-6854 Morgan Road
MEMORANDUM November 19, 2012
 COUNCIL OF GOVERNMENTS CENTRAL NAUGATUCK VALLEY 60 NORTH MAIN ST 3RD Floor WATERBURY, CT 06702-1403 (203)757-0535 Web Site: www.cogcnv.org E-Mail: cogcnv@cogcnv.org November 19, 2012 MEMORANDUM 111912
LOST LAKE CORRIDOR REVIEW
 LOST LAKE CORRIDOR REVIEW Prepared for: Prepared by: Broadview Developments Inc. c/o Westbrook Consulting Watt Consulting Group Our File: 2064.B01 Date: October 31, 2016 TABLE OF CONTENTS 1.0 INTRODUCTION...
Salvini Consulting Inc. 459 Deer Ridge Drive Kitchener, ON N2P 0A November 8, 2017 Revised December 20, 2017
 Salvini Consulting Inc. 459 Deer Ridge Drive Kitchener, ON N2P 0A7 519-591-0426 November 8, 2017 Revised December 20, 2017 Laurie Wills, PEng Deputy Director of Public Works Town of Cobourg 740 Division
Re: Residential Development - Ogilvie/Cummings Transportation Overview
 1223 Michael Street, Suite 100, Ottawa, ON K1J 7T2 Tel: 613.738.4160 Fax: 613.739.7105 www.delcan.com March 28, 2012 OUR REF: TO3088TOY Barry J. Hobin & Architects 63 Pamilla Street Ottawa, ON K1S 3K7
Ref. No Task 3. April 28, Mr. Cesar Saleh, P. Eng. VP Planning and Design W.M. Fares Group th
 Ref. No. 151-00564 Task 3 April 28, 2015 Mr. Cesar Saleh, P. Eng. VP Planning and Design W.M. Fares Group th 3480 Joseph Howe Drive, 5 Floor HALIFAX NS B3L 4H7 Sent via Email to ceasr.saleh@wmfares.com
TRAFFIC IMPACT STUDY DERRY GREEN CORPORATE BUSINESS PARK MILTON SECONDARY PLAN MODIFICATION
 TRAFFIC IMPACT STUDY DERRY GREEN CORPORATE BUSINESS PARK MILTON SECONDARY PLAN MODIFICATION TRAFFIC IMPACT STUDY DERRY GREEN CORPORATE BUSINESS PARK MILTON SECONDARY PLAN MODIFICATION DECEMBER 2014 UPDATED
886 March Road McDonald's Transportation Study
 McDonald's Restaurants of Canada Limited March 2013 886 March Road McDonald's Transportation Study Submitted by: HDR Corporation 100 York Boulevard, Suite 300 Richmond Hill, ON L4B 1J8 (905) 882-4100 www.hdrinc.com
Barrhaven Honda Dealership. Dealership Drive, Ottawa, ON. Transportation Brief
 Barrhaven Honda Dealership Dealership Drive, Ottawa, ON Transportation Brief Prepared By: NOVATECH Suite 200, 240 Michael Cowpland Drive Ottawa, Ontario K2M 1P6 September, 2015 File: 115136 Ref: R-2015-152
Weaver Road Senior Housing Traffic Impact Analysis
 Gibson Traffic Consultants, Inc. 2813 Rockefeller Avenue Suite B Everett, WA 9821 425.339.8266 Weaver Road Senior Housing Traffic Impact Analysis Jurisdiction: City of Snohomish January 218 GTC #17-37
HCM Unsignalized Intersection Capacity Analysis 6: Brian Street & LC 111 5/26/2009
 6: Brian Street & LC 111 5/26/2009 Movement EBL EBR NBL NBT SBT SBR Volume (veh/h) 116 20 8 405 137 56 Sign Control Stop Free Free Grade 0% 0% 0% Peak Hour Factor 0.81 0.81 0.67 0.67 0.89 0.89 Hourly flow
Re: Cyrville Road Car Dealership
 1223 Michael Street, Suite 100, Ottawa, ON K1J 7T2 Tel: 613.738.4160 Fax: 613.739.7105 www.delcan.com February 25, 2013 OUR REF: TO3098TOE Mark Motors of Ottawa 611 Montreal Road Ottawa, ON K1K 0T8 Attention:
Wellings Communities Holding Inc and Extendicare (Canada) Inc Hazeldean Road. Transportation Impact Study. Ottawa, Ontario. Project ID
 Inc Hazeldean Road. Transportation Impact Study. Ottawa, Ontario. Project ID") Wellings Communities Holding Inc and Extendicare (Canada) Inc. 5731 Hazeldean Road Transportation Impact Study Ottawa, Ontario Project ID 160401195 Prepared by: Stantec Consulting Ltd. March 2016 WELLINGS
Wellings Communities Holding Inc and Extendicare (Canada) Inc. 5731 Hazeldean Road Transportation Impact Study Ottawa, Ontario Project ID 160401195 Prepared by: Stantec Consulting Ltd. March 2016 WELLINGS
JRL consulting. March Hartland Developments Limited 1993 Hammonds Plains Road Hammonds Plains, NS B4B 1P3
 March 2015 Prepared for Hartland Developments Limited 1993 Hammonds Plains Road Hammonds Plains, NS B4B 1P3 JRL consulting JRL consulting TABLE OF CONTENTS 1 INTRODUCTION... 2 1.1 BACKGROUND... 2 2 EXISTING
Paisley & Whitelaw - Paisley Park OPA / ZBA for Mixed Density Residential Use
 Paisley & Whitelaw - Paisley Park OPA / ZBA for Mixed Density Residential Use Transportation Impact Study City of Guelph Prepared for: Armel Corporation August 2018 Table of Contents 1 Introduction...
ARVADA TRIANGLE REDEVELOPMENT TRAFFIC IMPACT ANALYSIS
 ARVADA TRIANGLE REDEVELOPMENT TRAFFIC IMPACT ANALYSIS Prepared for: Arvada Urban Renewal Authority 5601 Olde Wadsworth Boulevard, Suite 210 Arvada, Colorado 80002 (720) 898-7062 Prepared by: Felsburg Holt
TRAFFIC AND TRANSPORTATION TECHNICAL MEMORANDUM
 TRAFFIC AND TRANSPORTATION TECHNICAL MEMORANDUM for ENVIRONMENTAL ASSESSMENT US 460 Bypass Interchange and Southgate Drive Relocation State Project No.: 0460-150-204, P101, R201, C501, B601; UPC 99425
LATSON INTERCHANGE DEVELOPMENT TRAFFIC STUDIES. Genoa Township, Livingston County, MI
 LATSON INTERCHANGE DEVELOPMENT TRAFFIC STUDIES Genoa Township, Livingston County, MI DRAFT TRAFFIC STUDY FOR I-96 AT LATSON RD INTERCHANGE Livingston County CS 47065 JN 101622C Submitted to: Michigan Department
Sugarland Crossing Gwinnett County, Georgia
 Sugarland Crossing Gwinnett County, Georgia S IGNAL W ARRANT A NALYSIS For the Intersection of: Sugarloaf Parkway / Richards Middle School Driveway / Sugarland Crossing Main Site Driveway Prepared for:
Bennett Pit. Traffic Impact Study. J&T Consulting, Inc. Weld County, Colorado. March 3, 2017
 Bennett Pit Traffic Impact Study J&T Consulting, Inc. Weld County, Colorado March 3, 217 Prepared By: Sustainable Traffic Solutions, Inc. http://www.sustainabletrafficsolutions.com/ Joseph L. Henderson,
Date: December 20, Project #:
 To: Craig Rottenberg Long s Jewelers 60A South Avenue Burlington, MA 01803 From: Patrick Dunford, P.E. Senior Project Manager Date: December 20, 2018 Project #: 14416.00 Re: Burlington Mall Proposed Long
KUM & GO 6400 WESTOWN PARKWAY WEST DES MOINES, IOWA 50266
 KUM & GO #300 PECOS STREET & 88 TH AVENUE THORNTON, COLORADO TRAFFIC IMPACT STUDY REVISION 1 PREPARED FOR KUM & GO 6400 WESTOWN PARKWAY WEST DES MOINES, IOWA 50266 JANUARY 23, 2014 OA PROJECT NO. 013-1721
MEMORANDUM. Date: November 4, Cheryl Burrell, Pebble Beach Company. Rob Rees, P.E. Inclusionary Housing Transportation Analysis WC
 MEMORANDUM Date: November 4, 2013 To: From: Subject: Cheryl Burrell, Pebble Beach Company Rob Rees, P.E. Inclusionary Housing Transportation Analysis As requested, Fehr & Peers is providing clarification
Traffic Impact Study Proposed Commercial Development Ballwin, Missouri. Technical Memorandum for Traffic Impact Study
 Traffic Impact Study Proposed Commercial Development Ballwin, Missouri Technical Memorandum for Traffic Impact Study Crawford, Bunte, Brammeier May 1, 2009 MEMORANDUM Date: April 24, 2009 To: From: Subject:
C. iv) Analysis/Results
 Analysis/Results") The Pettengill Road project is located outside the borders of the model in an external zone. As a result, inserting all Pettengill Road trip generation assumptions into the NRPC model and running a new
The Pettengill Road project is located outside the borders of the model in an external zone. As a result, inserting all Pettengill Road trip generation assumptions into the NRPC model and running a new
Ingraham High School Parking and Traffic Analysis
 Parking and Traffic Analysis Seattle, WA Prepared for: URS Corporation 1501 4th Avenue, Suite 1400 Seattle, WA 98101-1616 Mirai Transportation Planning & Engineering 11410 NE 122nd Way, Suite 320 Kirkland,
Appendix B: Traffic Reports
 Appendix B: Traffic Reports 407 TRANSITWAY - KENNEDY ROAD TO BROCK ROAD MINISTRY OF TRANSPORTATION - CENTRAL REGION Report Markham Road Station Traffic Study Prepared for Ministry of Transportation, Ontario
Rockingham Ridge Plaza Commercial Development Halifax Regional Municipality
 Rockingham Ridge Plaza Commercial Development Halifax Regional Municipality Traffic Impact Study Final Draft Report Prepared by: GRIFFIN transportation group inc. 30 Bonny View Drive Fall River, NS B2T
10 th Street Residences Development Traffic Impact Analysis
 Gibson Traffic Consultants, Inc. 2813 Rockefeller Avenue Suite B Everett, WA 98201 425.339.8266 10 th Street Residences Development Traffic Impact Analysis Jurisdiction: City of Snohomish September 2018
Village of Richmond Transportation Brief
 Village of Richmond Transportation Brief GENIVAR Project Number 111-18482-00 June 21 st, 2011 www.genivar.com GENIVAR 15 Fitzgerald Road, Suite 100 Ottawa, Ontario, CANADA K2H 9G1 Telephone: 613-829-2800
Traffic Impact Study Hudson Street Parking Garage MC Project No.: A Table of Contents
 Traffic Impact Study Hudson Street Parking Garage MC Project No.: 15001714A Table of Contents Table of Contents I. INTRODUCTION... 1 II. EXISTING CONDITIONS... 4 III. 2015 EXISTING TRAFFIC CONDITIONS...
L1TILE BEARS DAY CARE TRANSPORTATION IMPACT STUDY FORT COLLINS, COLORADO MAY Prepared for:
 L1TILE BEARS DAY CARE TRANSPORTATION IMPACT STUDY FORT COLLINS, COLORADO MAY 2012 Prepared for: Hillside Construction, Inc. 216 Hemlock Street, Suite B Fort Collins, CO 80534 Prepared by: DELICH ASSOCIATES
Sweetwater Landing Traffic Impact Analysis
 Gibson Traffic Consultants, Inc. 8 Rockefeller Avenue Suite B Everett, WA 98 45.9.8 Sweetwater Landing Traffic Impact Analysis Jurisdiction: City of Snohomish February 8 GTC #7-87 Sweetwater Landing Traffic
Wellington Street West
 Transportation Brief prepared for: 185 Davenport Road Suite 300 Toronto, ON M5R 1J1 prepared by: 1223 Michael Street Suite 100 Ottawa, ON K1J 7T2 November 5, 2013 TO3131TOH Transportation Brief November
267 O Connor Street Residential Development
 M a y 2014 267 O Connor Street Residential Development Transportation Brief Google 2014 Bing 2014 Prepared for: MASTERCRAFT STARWOOD Prepared by: Study 267 O'Connor Type Street May 2014 Study Residential
Oakbrook Village Plaza City of Laguna Hills
 Oakbrook Village Plaza City of Laguna Hills Traffic Impact Analysis Prepared by: HDR Engineering 3230 El Camino Real, Suite 200 Irvine, CA 92602 October 2012 Revision 3 D-1 Oakbrook Village Plaza Laguna
(A) Project Manager, Infrastructure Approvals
 Project Manager, Infrastructure Approvals") February 14th, 2014 BY E-MAIL: wally.dubyk@ottawa.ca City of Ottawa Planning and Growth Management Branch 110 Laurier Ave. W., 4 th Floor, Ottawa, Ontario K1P 1J1 Attention: Wally Dubyk, C.E.T (A) Project
February 14th, 2014 BY E-MAIL: wally.dubyk@ottawa.ca City of Ottawa Planning and Growth Management Branch 110 Laurier Ave. W., 4 th Floor, Ottawa, Ontario K1P 1J1 Attention: Wally Dubyk, C.E.T (A) Project
MEMO. McCORMICK RANKIN CORPORATION. File Mark VanderSluis, Keyur Shah DATE: October 26, 2009 COPIES: OUR FILE: TO: FROM: Jack Thompson
 McCORMICK RANKIN CORPORATION 2655 North Sheridan Way Mississauga, Ontario, L5K 2P8 Tel: (95)823-85 Fax: (95) 823-853 E-mail: mrc@mrc.ca Website: www.mrc.ca MEMO TO: FROM: File Mark VanderSluis, Keyur Shah
June 21, Mr. Jeff Mark The Landhuis Company 212 North Wahsatch Avenue, Suite 301. Colorado Springs, CO 80903
 LSC TRANSPORTATION CONSULTANTS, INC. 545 East Pikes Peak Avenue, Suite 210 Colorado Springs, CO 80903 (719) 633-2868 FAX (719) 633-5430 E-mail: lsc@lsctrans.com Website: http://www.lsctrans.com June 21,
Alpine Highway to North County Boulevard Connector Study
 Alpine Highway to North County Boulevard Connector Study prepared by Avenue Consultants March 16, 2017 North County Boulevard Connector Study March 16, 2017 Table of Contents 1 Summary of Findings... 1
One Harbor Point Residential
 Residential Gig Harbor, WA Transportation Impact Analysis January 23, 2017 Prepared for: Neil Walter Company PO Box 2181 Tacoma, WA 98401 Prepared by: TENW Transportation Engineering NorthWest 11400 SE
Intersection LOS Delay (Sec) LOS Delay (Sec.) US 3/ Hawthorne Drive N B 16.1 B 17.5
 LOS Delay (Sec.) US 3/ Hawthorne Drive N B 16.1 B 17.5") Intersection No- LOS Delay (Sec) LOS Delay (Sec.) US 3/ Hawthorne Drive N B 16.1 B 17.5 Ü Intersection No- LOS Delay (Sec) LOS Delay (Sec.) US 3/ Hawthorne Drive S C 32.6 D 43.0 Intersection No- LOS Delay
Intersection No- LOS Delay (Sec) LOS Delay (Sec.) US 3/ Hawthorne Drive N B 16.1 B 17.5 Ü Intersection No- LOS Delay (Sec) LOS Delay (Sec.) US 3/ Hawthorne Drive S C 32.6 D 43.0 Intersection No- LOS Delay
April Salvation Army Barrhaven Church 102 Bill Leathem Drive Transportation Brief
 April 26 Salvation Army Barrhaven Church 2 Bill Leathem Drive Transportation Brief Salvation Army Barrhaven Church 2 Bill Leathem Drive Transportation Brief prepared for: The Salvation Army 2 Overlea Blvd.
Proposed Hotel and Restaurant Development
 Traffic Impact Study Proposed Hotel and Restaurant Development Marbledale Road Tuckahoe, NY PREPARED FOR BILLWIN DEVELOPMENT AFFILIATES, LLC 365 WHITE PLAINS ROAD EASTCHESTER, NY. 10709 PREPARED BY Engineering
BUCKLEY ANNEX REDEVELOPMENT PLAN TRANSPORTATION ANALYSIS ADDENDUM
 BUCKLEY ANNEX REDEVELOPMENT PLAN TRANSPORTATION ANALYSIS ADDENDUM Prepared for: City and County of Denver Prepared by: Contact: Brian Bern, P.E., PTOE 303.572.0200 On Behalf of: Lowry Redevelopment Authority
MURRIETA APARTMENTS TRAFFIC IMPACT ANALYSIS CITY OF MURRIETA, CALIFORNIA
 MURRIETA APARTMENTS TRAFFIC IMPACT ANALYSIS CITY OF MURRIETA, CALIFORNIA SEPTEMBER 20, 2012 Prepared for: Golden Eagle Multi-Family Properties, LLC 6201 Oak Canyon Rd., Suite 250 Irvine, CA 92618 Prepared
Downtown One Way Street Conversion Technical Feasibility Report
 Downtown One Way Street Conversion Technical Feasibility Report As part of the City s Transportation Master Plan, this report reviews the technical feasibility of the proposed conversion of the current
ZINFANDEL LANE / SILVERADO TRAIL INTERSECTION TRAFFIC ANALYSIS
 ZINFANDEL LANE / SILVERADO TRAIL INTERSECTION TRAFFIC ANALYSIS UPDATED TRAFFIC STUDY FOR THE PROPOSED RAYMOND VINEYARDS WINERY USE PERMIT MODIFICATION #P11-00156 AUGUST 5, 2014 PREPARED BY: OMNI-MEANS,
MEMORANDUM BOSTON REGION METROPOLITAN PLANNING ORGANIZATION. DATE March 1, 2012
 BOSTON REGION METROPOLITAN PLANNING ORGANIZATION State Transportation Building Ten Park Plaza, Suite 2150 Boston, MA 02116-3968 Tel. (617) 973-7100 Fax (617) 973-8855 TTY (617) 973-7089 www.bostonmpo.org
1012 & 1024 McGarry Terrace
 December 217 112 & 124 McGarry Terrace Transportation Impact Study 112 & 124 McGarry Terrace Transportation Impact Study prepared for: Lépine Corporation 32 March Road Kanata, ON K2K 2E3 prepared by: 1223
2.0 Development Driveways. Movin Out June 2017
 Movin Out June 2017 1.0 Introduction The proposed Movin Out development is a mixed use development in the northeast quadrant of the intersection of West Broadway and Fayette Avenue in the City of Madison.
Zachary Bugg, PhD, Diego Arguea, PE, and Phill Worth University of Oregon North Campus Conditional Use Permit Application Transportation Assessment
 MEMORANDUM Date: June 22, 2018 Project #: 21562 To: Colin McArthur, AICP From: Project: Subject: Zachary Bugg, PhD, Diego Arguea, PE, and Phill Worth University of Oregon North Campus Conditional Use Permit
Appendix H: Construction Impacts H-2 Transportation
 Appendix H: Construction Impacts H-2 Transportation \ AECOM 71 W. 23 rd Street New York, NY 10010 www.aecom.com 212 366 6200 tel 212 366 6214 fax Memorandum To CC Subject Robert Conway Donald Tone Construction
TECHNICAL MEMORANDUM Upper Broadway Road Diet Summary of Findings
 TECHNICAL MEMORANDUM Summary of Findings Date: June 17, 2014 Project #: 17121.15 To: Si Lau, P.E.; City of Oakland, CA From: Erin Ferguson, P.E.; Aaron Elias, P.E.; Daphne Dethier; and Mark Bowman, P.E.;
1140 Wellington Street West Transportation Brief
 1140 Wellington Street West Transportation Brief October 2013 Study 1140 Wellington Type Street West October 2013 Study Transportation Name Brief February 2011 TB Check List TIS / TB/ CTS Check List prepared
700 Hunt Club Road. Transportation Impact Study - Addendum #1. Submitted by:
 700 Hunt Club Road Transportation Impact Study - Addendum #1 Submitted by: 14 June 2013 1223 Michael Street, Suite 100, Ottawa, ON K1J 7T2 Tel: 613.738.4160 Fax: 613.739.7105 www.delcan.com 14 June 2013
RESPONSE TO TRAFFIC IMPACT STUDY COMMENTS
 RESPONSE TO TRAFFIC IMPACT STUDY COMMENTS Proposed Gas Station 40 Arthur Street (Highway 26), Town of the Blue Mountains (Thornbury), County of Grey, Ontario AUGUST 2013 August 27, 2013 MR. REG RUSSWURM
TRANSPORTATION ANALYSIS. Wawa US 441 and Morningside Drive. Prepared for: Brightwork Real Estate, Inc.
 TRANSPORTATION ANALYSIS Wawa US 441 and Morningside Drive Prepared for: Brightwork Real Estate, Inc. TABLE OF CONTENTS Introduction... 1 Project Description... 1 Estimated Daily Project Traffic... 3 Estimated
Interstate 80 Corridor Study
 Interstate 80 Corridor Study Final Technical Memorandum 5: Traffic Volumes, Accident Locations and Operational Deficiencies West Verdi (SR 425) Interchange to West McCarran Boulevard (SR 651) and East
Traffic Impact Analysis Update
 Willow Bend Traffic Impact Analysis Update TABLE OF CONTENTS Page I. INTRODUCTION -------------------------------------------------------------------------------------------- 1 II. EXISTING CONDITIONS
Appendix E: Emission Reduction Calculations
 Derr Road and Home Road Conversion Feasibility Study Springfield, OH Appendix E: Emission Reduction Calculations Derr Road and Home Road Conversion Feasibility Study Springfield, OH Emission Reduction
Proposed location of Camp Parkway Commerce Center. Vicinity map of Camp Parkway Commerce Center Southampton County, VA
 Proposed location of Camp Parkway Commerce Center Vicinity map of Camp Parkway Commerce Center Southampton County, VA Camp Parkway Commerce Center is a proposed distribution and industrial center to be
INTERSECTION ANALYSIS PARK AVENUE AND BRADDOCK ROAD (FROSTBURG, MD) FOR LENHART TRAFFIC CONSULTING, INC.
 FOR LENHART TRAFFIC CONSULTING, INC.") INTERSECTION ANALYSIS FOR PARK AVENUE AND BRADDOCK ROAD (FROSTBURG, MD) Prepared for: City of Frostburg, Maryland & Allegany County Commissioners Prepared by: LENHART TRAFFIC CONSULTING, INC. TRAFFIC ENGINEERING
INTERSECTION ANALYSIS FOR PARK AVENUE AND BRADDOCK ROAD (FROSTBURG, MD) Prepared for: City of Frostburg, Maryland & Allegany County Commissioners Prepared by: LENHART TRAFFIC CONSULTING, INC. TRAFFIC ENGINEERING
MMM Group Limited. Communities. Transportation. Buildings. Infrastructure
 MMM Group Limited Traffic Study CASA MIA Community Care Facility Vancouver, BC Communities Transportation Buildings Infrastructure February 2013 5011001-033 STANDARD LIMITATIONS This report was prepared
County State Aid Highway 30 (Diffley Road) and Dodd Road Intersection Study
 and Dodd Road Intersection Study") County State Aid Highway 30 (Diffley Road) and Dodd Road Intersection Study City of Eagan, Dakota County, Minnesota Date: March 2012 Project No. 14957.000 444 Cedar Street, Suite 1500 Saint Paul, MN 55101
County State Aid Highway 30 (Diffley Road) and Dodd Road Intersection Study City of Eagan, Dakota County, Minnesota Date: March 2012 Project No. 14957.000 444 Cedar Street, Suite 1500 Saint Paul, MN 55101
STANDARD LIMITATIONS
 STANDARD LIMITATIONS This report was prepared by MMM Group (MMM) for the account of Spire Construction Inc. (the Client). The disclosure of any information contained in this report is the sole responsibility
Addendum to Traffic Impact Analysis for Port Marigny Site Mandeville, LA
 Addendum to Traffic Impact Analysis for Port Marigny Site Mandeville, LA (St. Tammany Parish Mandeville, LA) Prepared For The Pittman Companies Michael N Pittman, MD 328 East Boston St Covington, LA 70433
Aldridge Transportation Consultants, LLC Advanced Transportation Planning and Traffic Engineering
 Aldridge Transportation Consultants, LLC Advanced Transportation Planning and Traffic Engineering John M.W. Aldridge, PE, PTOE, AICP 1082 Chimney Rock Road Colorado Registered Professional Engineer Highlands
D & B COMMERCIAL TRAFFIC IMPACT ANALYSIS
 D & B COMMERCIAL TRAFFIC IMPACT ANALYSIS TABLE OF CONTENTS I. Introduction...3 II. Project Description...3 III. Existing Conditions...3 IV. Future Traffic Conditions...8 V. Conclusions and Mitigation...14
APPENDIX A LEVEL OF SERVICE CONCEPTS, ANALYSIS METHODOLOGIES,STANDARDS OF SIGNIFICANCE
 APPENDIX A LEVEL OF SERVICE CONCEPTS, ANALYSIS METHODOLOGIES,STANDARDS OF SIGNIFICANCE Roadway Segment Level of Service Definitions LOS V/C Congestion/Delay Traffic Description (Used for surface streets,
April 7, Mr. Blake Shutler Compass Homes Development LLC Summit Homes Construction, LLC PO Box 6539 Dillon, CO 80435
 Compass Homes Development LLC Summit Homes Construction, LLC PO Box 6539 Dillon, CO 80435 Re: Trip Generation Comparison West Hills Townhomes Keystone, Colorado FHU Reference No. 116388-01 Dear Mr. Shutler:
City of Fairfax, Virginia City Council Work Session
 City of Fairfax, Virginia City Council Work Session Agenda Item # City Council Meeting 8g 9/29/2015 TO: FROM: SUBJECT: ISSUE(S): SUMMARY: Honorable Mayor and Members of City Council Robert Sisson, City
EXECUTIVE SUMMARY. The following is an outline of the traffic analysis performed by Hales Engineering for the traffic conditions of this project.
 EXECUTIVE SUMMARY This study addresses the traffic impacts associated with the proposed Shopko redevelopment located in Sugarhouse, Utah. The Shopko redevelopment project is located between 1300 East and
Craig Scheffler, P.E., PTOE HNTB North Carolina, P.C. HNTB Project File: Subject
 TECHNICAL MEMORANDUM To Kumar Neppalli Traffic Engineering Manager Town of Chapel Hill From Craig Scheffler, P.E., PTOE HNTB North Carolina, P.C. Cc HNTB Project File: 38435 Subject Obey Creek TIS 2022
Parking/Traffic Assessment Study
 Brock Road Industrial Mall 985 Brock Road South City of Pickering Parking/Traffic Assessment Study Prepared by: Tranplan Associates, Toronto Toronto 416-670-2005 Sudbury 705-522-0272 Peterborough 705-874-3638
Quantitative analyses of weekday a.m. and p.m. commuter hour conditions have been conducted for the following five scenarios:
 6.1 TRANSPORTATION AND CIRCULATION 6.1.1 INTRODUCTION This section of the EIR presents the results of TJKM s traffic impact analysis of the proposed Greenbriar Development. The analysis includes consideration
BERKELEY DOWNTOWN AREA PLAN PROGRAM ENVIRONMENTAL IMPACT REPORT TRAFFIC IMPACT ANALYSIS
 BERKELEY DOWNTOWN AREA PLAN PROGRAM ENVIRONMENTAL IMPACT REPORT TRAFFIC IMPACT ANALYSIS Prepared for: City of Berkeley Prepared by: REVISED JANUARY 9, 2009 Berkeley Downtown Area Plan Program EIR Traffic
Winnetka Avenue Bike Lanes Traffic Impact Analysis
 Winnetka Avenue Bike Lanes Traffic Impact Analysis January 4, 2019 Prepared by City of Los Angeles Department of Transportation Active Transportation Division Winnetka Ave Bike Lanes Traffic Impact Analysis
Aldridge Transportation Consultants, LLC Advanced Transportation Planning and Traffic Engineering
 Aldridge Transportation Consultants, LLC Advanced Transportation Planning and Traffic Engineering John M.W. Aldridge, PE, PTOE, AICP 1082 Chimney Rock Road Colorado Registered Professional Engineer Highlands
TRAFFIC IMPACT ANALYSIS
 TRAFFIC IMPACT ANALYSIS Emerald Isle Commercial Development Prepared by SEPI Engineering & Construction Prepared for Ark Consulting Group, PLLC March 2016 I. Executive Summary A. Site Location The Emerald
appendix 4: Parking Management Study, Phase II
 appendix 4: Parking Management Study, Phase II A4-1 A4-2 Eastlake Parking Management Study Final Phase 2 Report Future Parking Demand & Supply January 6, 2017 Submitted by Denver Corp Center III 7900 E.
THE CORNERSTONE APARTMENTS TRAFFIC IMPACT STUDY R&M PROJECT NO
 THE CORNERSTONE APARTMENTS SITUATED AT N/E/C OF STAUDERMAN AVENUE AND FOREST AVENUE VILLAGE OF LYNBROOK NASSAU COUNTY, NEW YORK TRAFFIC IMPACT STUDY R&M PROJECT NO. 2018-089 September 2018 50 Elm Street,
BROWARD BOULEVARD CORRIDOR TRANSIT STUDY
 BROWARD BOULEVARD CORRIDOR TRANSIT STUDY FM # 42802411201 EXECUTIVE SUMMARY July 2012 GOBROWARD Broward Boulevard Corridor Transit Study FM # 42802411201 Executive Summary Prepared For: Ms. Khalilah Ffrench,
TECHNICAL MEMORANDUM
 TECHNICAL MEMORANDUM TO: Merrimack Valley Metropolitan Planning Organization FROM: James Terlizzi, P.E., Transportation Planning Engineer DATE: March 6, 2017 SUBJECT: Further analysis of the recommendations
MERIVALE PRIORITY SQUARE 2852 MERIVALE ROAD CITY OF OTTAWA TRANSPORTATION BRIEF. Prepared for: ONT Inc. 25 Winding Way Nepean, Ontario K2C 3H1
 MERIVALE PRIORITY SQUARE 2852 MERIVALE ROAD CITY OF OTTAWA TRANSPORTATION BRIEF Prepared for: 2190986ONT Inc. 25 Winding Way Nepean, Ontario K2C 3H1 October 6, 2010 110-502 Report_1.doc D. J. Halpenny
Lacey Gateway Residential Phase 1
 Lacey Gateway Residential Phase Transportation Impact Study April 23, 203 Prepared for: Gateway 850 LLC 5 Lake Bellevue Drive Suite 02 Bellevue, WA 98005 Prepared by: TENW Transportation Engineering West
Traffic Impact Analysis. Alliance Cole Avenue Residential Site Dallas, Texas. Kimley-Horn and Associates, Inc. Dallas, Texas.
 Traffic Impact Analysis Alliance Cole Avenue Residential Site Dallas, Texas February 15, 2018 Kimley-Horn and Associates, Inc. Dallas, Texas Project #064524900 Registered Firm F-928 Traffic Impact Analysis
Traffic Impact Analysis West Street Garden Plots Improvements and DuPage River Park Garden Plots Development Naperville, Illinois
 Traffic Impact Analysis West Street Garden Plots Improvements and DuPage River Park Garden Plots Development Naperville, Illinois Submitted by April 9, 2009 Introduction Kenig, Lindgren, O Hara, Aboona,
INTERCHANGE OPERTIONS STUDY Interstate 77 / Wallings Road Interchange
 INTERCHANGE OPERTIONS STUDY Interstate 77 / Wallings Road Interchange City of Broadview Heights, Cuyahoga County, Ohio Prepared For: City of Broadview Heights Department of Engineering 9543 Broadview Road
Memorandum. 1 Short List Analysis Background. James Hinkamp and Tony Coe, City of Lafayette Steering Committee
 To Copies James Hinkamp and Tony Coe, City of Lafayette Steering Committee Date August 26, 2016 Reference number 243381 From Mike Iswalt, Vanessa Peers, Will Baumgardner File reference 4-05 Subject Lafayette
Appendix A City of Sammamish Town Center Sub-Area Plan FEIS September 2007
 Appendix A City of Sammamish Town Center Sub-Area Plan FEIS September 2007 5309 Shilshole Avenue NW Suite 200 Seattle, WA 98107 206.789.9658 phone 206.789.9684 fax www.adolfson.com Memorandum date March