MEMO. McCORMICK RANKIN CORPORATION. File Mark VanderSluis, Keyur Shah DATE: October 26, 2009 COPIES: OUR FILE: TO: FROM: Jack Thompson
|
|
|
- Edward Gibbs
- 5 years ago
- Views:
Transcription

1 McCORMICK RANKIN CORPORATION 2655 North Sheridan Way Mississauga, Ontario, L5K 2P8 Tel: (95) Fax: (95) Website: MEMO TO: FROM: File Mark VanderSluis, Keyur Shah DATE: October 26, 29 COPIES: OUR FILE: SUBJECT: Jack Thompson W:\7k\7359 City Center BRT Functional Planning\ Transport\ Technical Memos\7359-mv-PM PK Future Sq One- Memo doc Afternoon peak hour traffic analysis for City Centre Mississauga BRT Background: The City of Mississauga, in conjunction with the Province of Ontario and Government of Canada, is preparing for the construction of the Mississauga Bus Rapid Transit (BRT) Project. The proposed BRT facility will extend from Winston Churchill Boulevard in the west to Renforth Drive in the east, running parallel to Highway 43, Eastgate Parkway and Eglinton Avenue. Through the Mississauga City Centre, the proposed BRT facility will include a median dedicated bus right-of-way on Rathburn Road between approximately Duke of York Boulevard and Shipp Drive. MRC previously conducted a Traffic Impact Analysis to assess the potential impact of the BRT operation to traffic conditions on Rathburn Road for the morning peak hour. It is noted that the traffic volumes along Rathburn Road with the proposed BRT network and assumed diversion are higher in the morning peak hour and thus presented the worst case analysis in assessing the 2 GPL + BRT concept operations. The existing signalized intersection at Hammerson Drive (Square One north entrance) and Rathburn Road was proposed in the preliminary design to be converted to a right-in right out intersection (RIRO). This design has conflict with Stakeholder s development interest; therefore a traffic analysis was requested in order to assess the impact the signalized intersection would have on BRT operations. At Square One-Mississauga City Centre, two major developments were recently proposed in the vicinity of the Hammerson Drive/Rathburn Road intersection (the received details are presented in Appendix A). These developments include: Whole-foods Grocery Store (4, sq.ft) Crate & Barrel (24,128 sq.ft) To measure the impact of the proposed development and associated in-bound traffic destined to the retail market from the signalised intersection at Hammerson Drive/Rathburn Road, a p.m. peak hour analysis was undertaken to reflect the afternoon retail and commuter trips.
2 Memo To: Date: October 26, 29 Page 2 This memorandum documents the traffic analysis undertaken to assess the potential impact to traffic operations that may arise from BRT facility in the City Centre with the proposed development and intersection design at City Centre during p.m. peak hour. This memorandum also presents results for the sensitivity analysis for BRT operations with the signalized intersection vs. right-in-right-out intersection at Hammerson Drive/Rathburn Road. 1. Analysis Introduction This study makes use of the VISSIM micro-simulation software for various scenarios relating to the proposed BRT route through the City Centre. The following lists the p.m. peak hour scenarios that were analyzed using the VISSIM model: Scenario 1: Existing Traffic Conditions (28 Volume) on existing road network Scenario 2: Opening day traffic analysis (Existing Traffic+ Site Traffic) on existing road network (overview analysis only) Scenario 3: Existing traffic volume (28) on Proposed BRT Network Scenario 4: Background traffic conditions (Existing traffic + 3% growth) on existing road network. Scenario 5: Background traffic scenario - (Existing traffic + 3% growth) on BRT network. This scenario involves a sensitivity analysis relating to two different intersection configurations at Hammerson Drive and Rathburn Road Signalized Intersection at Hammerson Drive and Rathburn Road 5.2 Right-in-right out (un-signalized) intersection at Hammerson Drive (Square One North Entrance) and Rathburn Road. Scenario 6: Total traffic scenario (Background +Site Traffic -Whole Foods Market, Crate and Barrel) on BRT network. This scenario involves an analysis relating to two different intersection configurations at Hammerson Drive and Rathburn Road. 6.1 Signalized T-Intersection, this includes sensitivity analysis with: A: 3 vehicles on westbound left turn on Rathburn Road to Hammerson Drive. B: 35 vehicles on westbound left turn on Rathburn Road to Hammerson Drive Four-leg signalized intersection at Rathburn Road and Hammerson Drive The projected 3% growth represents a 2% growth per annum over a fifteen year period. This memorandum gives a detailed description of each of the scenarios including volume assumptions and calculations, levels of service for intersections and BRT travel times for the future scenarios.
3 Memo To: Date: October 26, 29 Page 3 2. PM Peak Hour Analysis Scenario 1: Existing Traffic Conditions (28 Traffic Volume on Existing Road Network) Road Network: The existing road network at City Center was coded into the VISSIM model. Traffic Volume Balancing: The existing traffic counts reflect the weekday traffic counts undertaken by the City of Mississauga during 27 and 28. These traffic counts were balanced using the 28 traffic counts as the control point. The balanced volumes can be found in Appendix B. The intersections included for the analysis are: Station Gate Road with Centre View Drive, Station Gate Road with Rathburn Road, Hammerson Drive with Rathburn Road, City Centre/Centre View Drive with Rathburn Road. Transit Network: The 28 bus operations were coded into the VISSIM model. Signal Timings: The existing pm peak hour signal timing plans were used for the traffic analysis. Results: The intersection Levels of Service (LOS) and Delay for the existing operational analysis are presented in Table 1. Only four of the intersections are included as they are most relevant to the area of study. Table 1: Intersection Capacity Analysis Results Existing Traffic on Existing Network Intersection Critical Movement LOS Delay (Sec) LOS Queue Length 95% Movement Rathburn and Station Gate B 1.5 A 3 EBT Rathburn and Hammerson Dr B B 15 WBL Rathburn and City Centre E B 56 WBT Centre View and Station Gate B A 13 WBT The results show that the Rathburn Road and City Centre Drive intersection is operating at a saturated Level of Service E. The other three intersections are operating at an acceptable level of service, and with relatively small queue lengths. The results of the intersection operational analysis for this scenario are presented in Appendix C.
4 Memo To: Date: October 26, 29 Page 4 Scenario 2: Opening day Traffic Conditions on Existing Road Network Traffic Volume Balancing: As per information received, Crate & Barrel is proposed to open before commencement of the BRT operation. The p.m. peak hour trip generation for Crate & Barrel was estimated using rates outlined for a Furniture Showroom in the ITE Trip Generation guide. We note that for the p.m. peak hour, the trip generation rate is.53 trips / 1 sq.ft. Crate & Barrel is proposed to be 24,128 sq.ft. which results in trips. With a rate of 5% entrance and 5% exit, there will only be six to seven vehicles added to those entering/existing the Square One area. With two entrances and exits in the vicinity, the generated traffic will not adversely affect the traffic operations at Square One-City Centre. Therefore, it was not necessary to use a VISSIM model to analyse this operational scenario.

 /Rathburn Road is analyzed with a signalized intersection instead of a right-in-right-out as")
5 Memo To: Date: October 26, 29 Page 5 Scenario 3: Existing Traffic on Proposed BRT Network The third analysis consisted of 28 traffic volume on the proposed BRT network. Road Network: As per the preliminary design for the BRT facility, Rathburn Road was proposed to be reduced to 1 lane for the general traffic between Duke of York Boulevard and Hurontario Road. The proposed BRT facility in the Mississauga City Centre is shown in Appendix D. It should be noted that for this scenario, the intersection at Hammerson Drive (Square-One north entrance) /Rathburn Road is analyzed with a signalized intersection instead of a right-in-right-out as identified in the Preliminary Design. The Preliminary Design indicated that Station Gate Road be turned into an exclusive bus only area, and the ramp from Hurontario Street to the intersection at Centre View Drive and Rathburn Road be altered so the ramp turned north onto Centre View and only allowed vehicles to travel in that direction. The coded network in VISSIM for the proposed BRT facility is presented in Figure 1. Duke of York Blvd. Station Gate Road Centre View Dr. Rathburn Road Hammerson Dr. City Centre Dr. Figure 1: Proposed BRT Network coded in VISSIM
6 Memo To: Date: October 26, 29 Page 6 Traffic Volume Balancing: To assess the impact of the traffic diversion to alternative routes due to the BRT network, further intersections were added for the analysis. These intersections include: Rathburn Road and Duke of York Boulevard, City Centre Drive and the East entrance of Square One Drive, Centre View Drive and Duke of York Boulevard, Duke of York Boulevard and the West entrance of Square-One Drive. The volumes at these intersections were then balanced to match with the previous balanced traffic flows. The adjusted 28 traffic volume with BRT road network is presented in Appendix B. The majority of the through traffic and all of the right turning traffic initially coming from the Hurontario Street off-ramp was assigned to travel north-west along Centre View Drive. A portion of the through traffic originally coming from Hurontario Street was determined to be turning left onto Hammerson Drive off of Rathburn. This traffic was reassigned along with the Hurontario ramp left turning traffic to travel south down Hurontario Street. Then this volume was diverted westbound onto Square One Drive. The traffic was then split between left turn and through movements at WB Square One Drive E. and City Centre Drive. Since BRT lanes are provided along Rathburn Road, all vehicle traffic assigned to Station Gate Road were diverted. The right and left turns from Rathburn Road onto Station Gate Road and from Station Gate Road onto Rathburn Road were revised to right and left turns onto and out of Duke of York Boulevard. Similarly, the right and left turns from Centre View Drive onto Station Gate Road and from Station Gate Road onto Centre View Drive were revised to right and left turns onto and out of Duke of York Boulevard at Centre View Drive. Transit Network: The existing 28 bus operations were coded into the VISSIM model. Signal Timings: Volumes were inputted into a Synchro model of the City Centre area and signal timings were optimized with the effect of the proposed BRT network. Results: The results were simulated using VISSIM. The intersection Levels of Service (LOS) and Delay are presented in Table 2. The LOS and Queue Lengths for the critical movements at each intersection are also included. The results of the intersection analysis for this scenario are presented in the Appendix C Analysis Results.
7 Memo To: Date: October 26, 29 Page 7 Table 2: Intersection Capacity Analysis Results - Existing Traffic on BRT Network Intersection Critical Movement LOS Delay (Sec) LOS Queue Length 95% Movement Rathburn and DOY Blvd C C 39 NBL Rathburn and Station Gate B 1.65 B 54 EBT Rathburn and Hammerson Dr B B 1 WBL Rathburn and City Centre C B 16 WBT City Centre and Square One East B B 47 NBT Centre View and Station Gate A.34 A WBT Centre View and DOY Blvd A 9.44 B 42 NBL Changing the configuration of the Rathburn Road and City Centre Drive intersection positively affects the performance of the intersection with less average delay with the Level of Service improving to C from the existing Level of Service E. This is due to the removal of one phase in the cycle which frees up time for all the other movements. Although the queue length for the westbound through movement increases, this increase can be attributed to the fact that the receiving lanes on the other side shrink from two to one thereby reducing the capacity of the through movement. All other intersections operate at acceptable levels with minimal queues and without significant change in average delay.
8 Memo To: Date: October 26, 29 Page 8 Scenario 4: Background Traffic Conditions on Existing Road Network Road Network: The existing road network was used for this Scenario. Traffic Volume Balancing: The balanced traffic from Scenario 1 was increased by 3% for the future traffic growth to obtain the background traffic. Transit Network: The existing bus operations were coded into the VISSIM model as the BRT network and BRT transit service are not operational. Signal Timings: The existing p.m. peak hour signal timing plans were used for the traffic analysis. Results: The intersection Levels of Service (LOS) and Delay for the future operational analysis are presented in Table 3. Only four of the intersections are included as they are most relevant to the area of study. Table 3: Intersection Capacity Analysis Results Future Traffic on Existing Road Network Intersection Critical Movement LOS Delay (Sec) LOS Queue Length 95% Movement Rathburn and Station Gate B 11.2 B 38 EBT Rathburn and Hammerson Dr B B 17 WBL Rathburn and City Centre F C 234 WBT Centre View and Station Gate B A 14 WBT The results indicate a Do-Nothing Scenario at the Rathburn Road and City Centre Drive intersection will degrade the level of service from E to F. The queue lengths and average delay will also increase significantly at this intersection. The other three intersections will still operate at acceptable levels of service, have roughly the same delays and have relatively small queue lengths at the critical movements. The results of the future operational analysis are presented in Appendix C.

 as per preliminary design.")
9 Memo To: Date: October 26, 29 Page 9 Scenario 5: Background Traffic Conditions on Proposed BRT Network Road Network: For Scenario 5, two sub-scenarios were analysed. Scenario 5.1: T-intersection (signalized) at Hammerson Drive and Rathburn Road This scenario used the same road network as Scenario 3. Scenario 5.2: RIRO (un-signalized) at Hammerson Drive and Rathburn Road In this scenario, the signalized t-intersection at Hammerson Drive (Square One North Entrance) and Rathburn Road was converted into a right-in-right-out intersection. Therefore, the in-bound and out-bound left turning movements from Hammerson Drive were banned with a right-inright-out (RIRO) as per preliminary design. Figure 2 shows a VISSIM representation of this intersection. Figure 2: RIRO Intersection at Rathburn Road and Hammerson Drive
10 Memo To: Date: October 26, 29 Page 1 Traffic Volume Balancing: Traffic Volume Balancing for Scenario 5.1: To estimate background traffic, the traffic volume for Scenario 3 was used and an additional 3% additional traffic was added to each movement. The WB left turning movement at Rathburn Road and City Centre Drive was reduced to 35 vehicles from 446 as experience suggest to be the maximum volume that a single left turn lane could provide before significant delay results (Highway Capacity Manual 2 suggests Double exclusive left turns for traffic volume greater than 3). This adjustment provided the balanced volume distribution for the future scenario with a signalized Hammerson Drive and Rathburn Road intersection. Traffic Volume Balancing for Scenario 5.2: The northbound left turning movement out of Hammerson Drive was redistributed to a right turning movement at Square One Drive West with Duke of York Boulevard. This additional volume was then split proportionally between northbound through and left turning movements at the Duke of York Boulevard/Rathburn Road intersection. The split was proportional to westbound through and right turning traffic at the same intersection. For the future analysis, the 2 vehicles forecast to be turning left from Rathburn Road to Hammerson Drive were reassigned. Due to limited capacity at Rathburn Road and City Centre Drive, the 5 of the vehicles were assigned to the westbound left turning movement at the intersection of City Centre Drive and Rathburn Road. The other 15 vehicles were assumed to turning left at Rathburn Road and Shipp Drive, travelling south to Robert Speck Parkway and then west towards Centre View Drive. The 15 vehicles were then diverted north where the vehicles were assigned to a north bound left turning movement at the intersection of Square One Drive East entrance and City Centre Drive. Transit Network: The a.m. peak hour BRT and local bus operation assumptions were utilised for the p.m. peak hour VISSIM analysis. Signal Timings: Traffic volumes were input into a Synchro model of the City Centre area and signal timings were optimized. For both of the options considered in this scenario, BRT lanes were given an exclusive phase at the end of the signal cycle. The phase for the buses were 18 seconds and buses coded such that they cannot travel through the intersections outside of their exclusive phase. Results: The results were simulated using VISSIM. The intersection Levels of Service (LOS) and Delay for Scenario 5.1 and Scenario 5.2 are presented in Table 4 and Table 5 respectively. The LOS and Queue Lengths for the critical movements at each intersection are also included.
11 Memo To: Date: October 26, 29 Page 11 Table 4: Intersection Capacity Analysis Results for Scenario 5.1 Signalized Square One Dr Intersection Critical Movement LOS Delay (Sec) LOS Queue Length 95% Movement Rathburn and DOY Blvd D D 123 NBL Rathburn and Station Gate C D 314 EBT Rathburn and Hammerson Dr C 23.1 E 59 WBL Rathburn and City Centre D E 39 WBT City Centre and Square One East E F 17 NBT Centre View and Station Gate A 2.52 A 11 WBT Centre View and DOY Blvd B B 62 NBL Square One West and DOY Blvd B D 51 WBL Table 5: Intersection Capacity Analysis Results for Scenario 5.2 RIRO Square One Dr Intersection Critical Movement LOS Delay (Sec) LOS Queue Length 95% Movement Rathburn and DOY Blvd D 4.21 D 154 NBL Rathburn and Station Gate B 18.4 C 215 EBT Rathburn and Hammerson Dr A 6.4 N/A N/A WBL Rathburn and City Centre D E 27 WBT City Centre and Square One East D 39.1 C 9 NBT Centre View and Station Gate A 2.7 A 12 WBT Centre View and DOY Blvd B B 52 NBL Square One West and DOY Blvd B C 5 WBL All the intersections Levels of Service increase by one grade compared to existing traffic on BRT network, with the exception of City Centre and Square One East which goes from B to E and Centre View and Station Gate which remains at a LOS A. Changing the Rathburn Road/ Hammerson Drive intersection to an unsignalized RIRO improves the LOS, Delay and Queue Lengths for all intersections except Rathburn Road and Duke of York Boulevard. However, this intersection only experiences a minor degradation in Delay and Queue Lengths, while Levels of Service remain the same. The comparison of background traffic without the BRT network and with the BRT network is presented in Table 6. The intersection at Rathburn Road/Hammerson Drive is assumed to be a Signalized T-intersection for this comparison. Table 6 : Comparison of Intersection Operation Analysis with and without BRT network Without BRT Network Scenario 4 With BRT Network- Scenario 5 LOS Delay (Sec) LOS Delay (Sec) Rathburn and Station Gate B 11.2 C Rathburn and Hammerson Dr B C 23.1 Rathburn and City Centre F D Centre View and Station Gate B A 2.52
12 Memo To: Date: October 26, 29 Page 12 Scenario 6: Future Traffic with Additional Volume from Proposed Developments Road Network: For Scenario 6, two sub-scenarios were analysed. Scenario 6.1 T-Intersection at Hammerson Drive with Rathburn Road This scenario used the same base road network as Scenario 3 modified to undertake the following operational sensitivity tests. 6.1 A: 3 vehicles on westbound left turn at Rathburn Road/ Hammerson Drive 6.1 B: 35 vehicles on westbound left turn at Rathburn Road/ Hammerson Drive Scenario 6.2 Four-Leg Intersection at Rathburn Road/ Hammerson Drive This scenario used the same road network as Scenario 3 with an additional leg northbound at Rathburn Road and Hammerson Drive. Traffic Volume Balancing: This scenario dealt with the additional traffic volume that would be produced as a result of the proposed Whole Foods development added to the background traffic growth. For this scenario, MRC conducted a traffic count survey at a Whole Foods market in Oakville to observe traffic entering and exiting the plaza. A memo was created which presented the results of this study called Whole Foods Traffic Counts/Trip Generation Analysis found in Appendix E. This memo presents trip rates along with the other findings of the study. To calculate the additional volumes, the trip rates for the road peak hour were used. For vehicles coming into the Whole Foods parking lot, a trip generation rate of 3.29 vehicles/1 square feet of building space was used. For vehicles exiting the Whole Foods parking lot, a trip generation rate of 2.98 vehicles/1 square feet was used. For the purposes of this study, we assumed the Whole Foods market to be built at Square One would be approximately the same size as the other Whole Foods market in Oakville. The Whole Foods Market in Oakville (Cornwall Road and Reynolds St) was measured in Google Earth to be approximately 38,2 square feet. Subsequent to the analysis presented in Appendix E, we have received a plan of the proposed City Centre Whole Foods market which shows it to be 4, square feet. Since the difference is minimal, an updated analysis using this number was not completed. Using the same trip generation rates, the estimated vehicle trip attraction was 126 vehicles and the estimated vehicle trip origin was 114 vehicles each hour.
13 Memo To: Date: October 26, 29 Page 13 Two analysis Scenarios include: Scenario 6.1 A: 3 vehicles on westbound left turn at Rathburn Road/Hammerson Drive The first Scenario assumes 1 vehicles added to the WB left turning movement at Rathburn Road and Hammerson Drive (to obtain 3 left turning vehicles) and the other 26 vehicles added to the EB right turning movement. The additional 114 vehicles departing the new development were split proportionally between right and left turns at this intersection. Scenario 6.1 B: 35 vehicles on westbound left turn at Rathburn Road/ Hammerson Drive The second scenario was similar, however instead of 3 left turning vehicles; the volume was increased to 35, the increased left turns provided a sensitivity analysis to account for higher trips and proposed development of Crate and Barrel. Scenario 6.2: Four leg intersection at Rathburn Road/ Hammerson Drive Scenario 6.2 included assessing the Rathburn Road/Hammerson Drive intersection as a four-leg intersection. This intersection design was proposed given the possibility of a new condominium building being built on the north east corner of this area. To successfully complete the analysis, additional volumes were added to the six new movements (EB left, NB through, WB right, SB left, through and right). It should be noted that vehicles going into the new roadway are much higher then those exiting due to the nature of the analysis, more people will generally be coming home from work then leaving the complex for a work or shopping purpose. The balanced volumes used in these scenarios can be found in Appendix B. Road Network: For Scenario 6.1 A and Scenario 6.1 B, the same road network as Scenario 3 was used. For Scenario 6.2, the T-intersection at Rathburn Road and Hammerson Drive is converted into a four-leg intersection. An additional leg added north of Rathburn Road will simulate an entranceway to the proposed condominium building. A VISSIM image of this is shown in Figure 3.
14 Memo To: Date: October 26, 29 Page 14 Figure 3: Four Way Intersection at Rathburn Road and Hammerson Drive Transit Network: The future bus operations as used in Scenario 5 was used for the BRT network analysis. Signal Timings: Volumes were input into a Synchro model of the City Centre area and signal timings were optimized. For both of the options in this scenario, BRT lanes were given an exclusive phase at the end of the cycles. Phase times of 18 seconds were assigned to the buses. The buses were restricted from traveling through the intersections outside of their exclusive phase. Results: The results were simulated using VISSIM. The intersection Levels of Service (LOS) and Delay for Scenario 6.1 A and 6.1 B are presented in Table 7 and Table 8. The LOS and Queue Lengths for the critical movements at each intersection are also included. Table 7: Intersection Capacity Analysis Results for Scenario 6.1 A 3 Left Turns into Square One Intersection Critical Movement LOS Delay (Sec) LOS Queue Length 95% Movement Rathburn and DOY Blvd D 53.6 D 151 NBL Rathburn and Station Gate C 3.3 E 335 EBT Rathburn and Hammerson Dr D F 18 WBL Rathburn and City Centre F F 444 WBT City Centre and Square One East E F 15 NBT Centre View and Station Gate A 2.14 A 8 WBT Centre View and DOY Blvd B B 51 NBL Square One West and DOY Blvd C D 6 WBL
15 Memo To: Date: October 26, 29 Page 15 Table 8: Intersection Capacity Analysis Results for Scenario 6.1 B 35 Left Turns Into Square One Intersection Critical Movement LOS Delay (Sec) LOS Queue Length 95% Movement Rathburn and DOY Blvd E D 187 NBL Rathburn and Station Gate C 34.3 E 372 EBT Rathburn and Hammerson Dr D 42.9 F 29 WBL Rathburn and City Centre F 12.2 F 445 WBT City Centre and Square One East E 63.3 F 17 NBT Centre View and Station Gate A 2.53 A 13 WBT Centre View and DOY Blvd B B 48 NBL Square One West and DOY Blvd C 3.92 D 62 WBL Referencing back to the results from Scenario 3, increasing the Rathburn Road WB left turn volume at Hammerson Drive affects the LOS and Queue Lengths of both the Rathburn Road/Hammerson Drive intersection and the Rathburn Road/City Centre Drive intersection. The other intersections experience slight increase in Queue Lengths which correspond to the minimal increase in volume coming through. Table 9: Intersection Capacity Analysis Results for Scenario 6.2 Intersection Critical Movement LOS Delay (Sec) LOS Queue Length 95% Movement Rathburn and DOY Blvd E E 159 NBL Rathburn and Station Gate D E 344 EBT Rathburn and Hammerson Dr E 55.2 F 188 WBL Rathburn and City Centre F F 445 WBT City Centre and Square One East E 71.9 F 146 NBT Centre View and Station Gate A 2.5 A 12 WBT Centre View and DOY Blvd C B 46 NBL Square One West and DOY Blvd C E N/A WBL The results for Scenario 6.2, shows a decrease in Queue Length for the WB left turn movement at Rathburn Road and Hammerson Drive from the previous analysis for Scenario 6.1 A. To accommodate the new movement the signal timings were revised. Although the WB left turn movement reflects a decreased Queue Length, the overall LOS increases to LOS E as the average Delay increased from 43 seconds to 55 seconds. This indicates that any additional developments will results in more delay to the existing intersections. The critical movements at the intersection experienced only minor increases or decreases in Queue Lengths, as these movements were operating in a congested state. The detailed analysis results can be found in Appendix C.
 and going between points B and A (WB). Point A is located on the Eastern edge of Station Gate Road on Rathburn Road.")
 and Points B and A (WB) EB BRT WB BRT Total Average BRT BRT Bus Travel BRT Bus")
16 Memo To: Date: October 26, 29 Page 16 3: BRT Travel Times The BRT bus travel time results from Scenario 5 and Scenario 6 are summarized in Table 1, providing a summary of all BRT bus travel times going between points A and B (EB) and going between points B and A (WB). Point A is located on the Eastern edge of Station Gate Road on Rathburn Road. Point B is located on the Western edge of City Centre Drive on Rathburn Road. Figure 4 shows a VISSIM image indicating the placement of these points. Point A Point B Figure 4: BRT Travel Time Point Table 1: Summary of BRT Bus Travel Times between Points A and B (EB) and Points B and A (WB) EB BRT WB BRT Total Average BRT BRT Bus Travel BRT Bus Travel Scenario Bus Weighted Travel Volume Time (Sec) Volume Time (Sec) Volume Time (Sec) Future Volume Signalized (Scenario 5.1) Future Volume RIRO (Scenario 5.2) Future With Development (3 LT Scenario 6.1A) Future With Development (35 LT Scenario 6.1 B) Future With Development (4 leg Int. Scenario 6.2)
17 Memo To: Date: October 26, 29 Page 17 The results of the BRT bus travel time analysis show a steady decrease in travel time as additional development occurs along the roadway with a signalized intersection at Hammerson Drive/ Rathburn Road. Scenario 5.1 ( Future Volume Signalized ) represents results from the future volume on the proposed BRT network with a T-Intersection at Hammerson Drive and Rathburn Road. This is the base scenario against which the others are measured. Table 1 indicates that revising the intersection design at Rathburn Road/Hammerson Drive to an RIRO (right in-right out) will provide less delay to the BRT line. The average travel time is decreased by 87 seconds. This decrease in time results as the buses no longer have to wait for their phase in the cycle to cross through the intersection. Conversely, adding the additional volume that the Whole Foods Market development will produce increased bus travel time. By adding an additional 1 left turning vehicles into the development, and increasing the vehicles leaving by 114, more time must be allocated to those turning movements resulting in decreased amount of time given to the buses and increasing the average travel time per bus by 39 seconds. It is also noted that adding 5 additional in-bound left turning vehicles for the proposed development results in bus time increasing by an average time of 44 seconds. The last scenario involves revising the T-intersection design at Rathburn Road and Hammerson Drive into a four-leg signalized intersection. The four-leg signalized intersection design results in the bus phases receiving a smaller percentage of green time. Thus bus travel times will increase from 192 seconds to 262 seconds. This difference of 7 seconds is very significant in that more then an extra minute is added to the travel time for each bus over a very small distance.
18 Memo To: Date: October 26, 29 Page 18 Conclusion: Buses travelling through the study area (Rathburn Road from Station Gate Road to City Centre Drive) will experience increased travel times due to the development of both the Whole Foods Market development and the possible residential development on the north east corner of the intersection. With the Whole Foods Market and Crate and Barrel development, travel times for buses increase on average by 44 seconds per bus. With these two developments, and the possible residential development, bus travel time will increased by 7 seconds per bus. It should be noted that revising the intersection design at Rathburn Road/Hammerson Drive from a T-intersection to an un-signalized RIRO intersection reduces bus travel time by 87 seconds and increases in conjunction with increased development levels. The intersection analyses indicate that significant delays are to be expected at the Rathburn Road/City Centre Drive intersection and the Rathburn Road/Hammerson Drive intersection after development of the Whole Foods Market and Crate & Barrel showroom. With the implementation of the BRT network, the intersection average delay at Rathburn Road/City Centre Drive/Centre View Drive was estimated to be reduced for the existing and background traffic scenarios. Thus, the proposed design would not adversely affect the traffic operational analysis.
19 APPENDIX A PROPOSED DEVELOPMENT AT SQUARE ONE
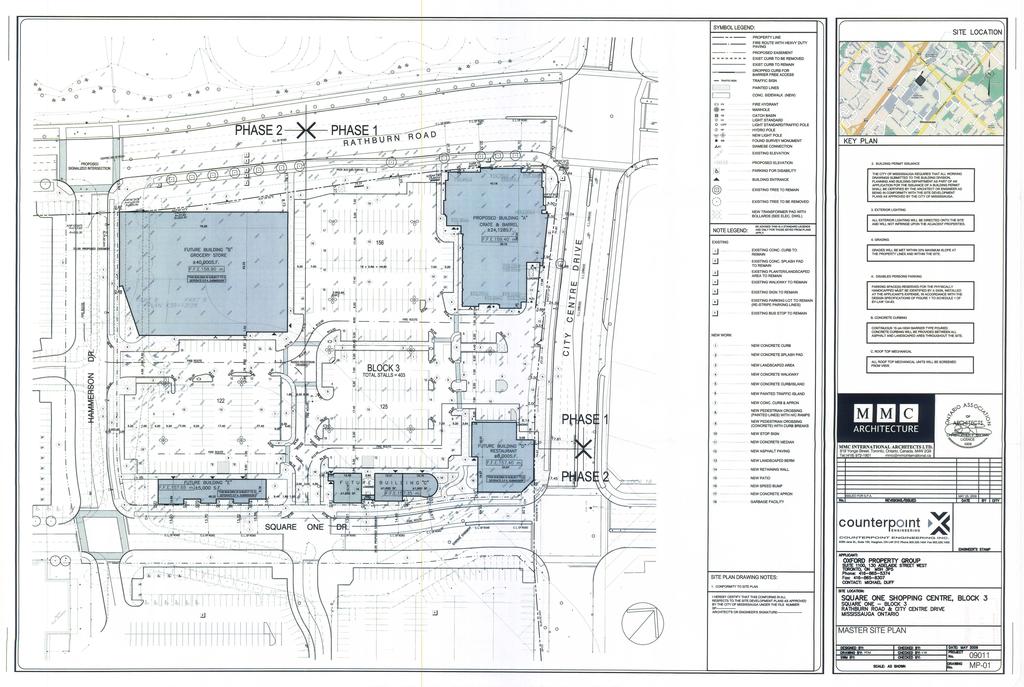
20
21 APPENDIX B VOLUME BALANCING SUMMARY
22 Scenario 1 - Existing Traffic Conditions (28 Volume) on Existing Road Network SQUARE ONE
23 Scenario 3 - Existing Traffic Volume (28) on Proposed BRT Network () () SQUARE ONE
24 Scenario 4 - Background Traffic Conditions (Existing Traffic + 3% Growth) on Existing Road Network SQUARE ONE
25 Scenario Background Traffic Scenario on BRT Network - Signalized T-Intersection at Hammerson Drive and Rathburn Road SQUARE ONE
26 Scenario Background Traffic Scenario on BRT Network - RIRO Intersection at Hammerson Drive and Rathburn Road SQUARE ONE
27 Scenario 6.1A - Total Traffic Scenario on BRT Network - 3 LT Vehicles at Hammerson Drive and Rathburn Road SQUARE ONE
28 Scenario 6.1B - Total Traffic Scenario on BRT Network - 35 LT Vehicles at Hammerson Drive and Rathburn Road SQUARE ONE
29 Scenario Total Traffic Scenario on BRT Network - Four-Way Intersection at Hammerson Drive and Rathburn Road SQUARE ONE
30 APPENDIX C INTERSECTION ANALYSIS RESULTS
31 Operational Anaylsis Level of Service, Vehicle Delay, Queue PM Peak Hour Analysis Scenario 1: Existing Traffic Conditions ( 28 Volume) on existing road network Summary-avg 1/14/29 Rathburn Road at Station Gate Road Movements EBL EBT WBL WBT WBR NBL NBR SBL SBR OVERALL Travel Time Segment Queue Counter Hourly Volume (vph) Vehicle Delay (s) Queue Length 95th (m) Level of Service (LOS) C A A A A D D D B B Rathburn Road at Hammerson Drive Movements EBT EBR WBL WBT NBL NBR OVERALL Travel Time Segment Queue Counter Hourly Volume (vph) Vehicle Delay (s) Queue Length 95th (m) Level of Service (LOS) B A B B D A B Rathburn Road at City Centre Drive Movements EBL EBT EBR WBL1 WBT1 WBR1 NBL NBT NBR SBL SBT SBR WBL2 WBT2 WBR2 OVERALL Travel Time Segment Queue Counter Hourly Volume (vph) Vehicle Delay (s) Queue Length 95th (m) Level of Service (LOS) D D C C B B F F F F D D D C E Centre View Drive at Station Gate Road Movements EBT EBR WBL WBT NBL NBR OVERALL Travel Time Segment Queue Counter Hourly Volume (vph) Vehicle Delay (s) Queue Length 95th (m) Level of Service (LOS) A A A A D A B W:\7k\7359 City Center BRT Functional Planning\ Transport\ Technical Analysis\VISSIM files\7359-pm Peak Hours\7359-mv-28 Analysis-pm\sb\7359-mv-28-pmdelay-los /1
32 Summary-avg 1/14/29 Operational Anaylsis Level of Service, Vehicle Delay, Queue PM Peak Hour Analysis - Future Network Scenario 3: Existing Traffic Volume (28) on Proposed BRT Network Rathburn Road at Duke of York Blvd. Movements EBL EBT EBR WBL WBT WBR NBL NBT NBR SBL SBT SBR OVERALL Travel Time Segment Queue Counter Hourly Volume (vph) Vehicle Delay (s) Queue Length 95th (m) Level of Service (LOS) C B B C B B C C C C D C C Rathburn Road at Station Gate Road Movements EBT WBL WBT WBR NBL NBR SBL SBR OVERALL Travel Time Segment Queue Counter Hourly Volume (vph) Vehicle Delay (s) Queue Length 95th (m) Level of Service (LOS) B A D C D B Rathburn Road at Hammerson Drive Movements EBT EBR WBL WBT NBL NBR OVERALL Travel Time Segment Queue Counter Hourly Volume (vph) Vehicle Delay (s) Queue Length 95th (m) Level of Service (LOS) B B B A D B B Rathburn Road at City Centre Drive Movements EBL EBT EBR WBL1 WBT1 WBR1 NBL NBT NBR SBL SBT SBR WBL2 WBT2 WBR2 OVERALL Travel Time Segment Queue Counter Hourly Volume (vph) Vehicle Delay (s) Queue Length 95th (m) Level of Service (LOS) C C D C B A B D D D D A C City Centre Drive at Square One West Entrance Movements EBL EBT EBR WBL WBT WBR NBL NBT NBR SBL SBT SBR OVERALL Travel Time Segment Queue Counter Hourly Volume (vph) Vehicle Delay (s) Queue Length 95th (m) Level of Service (LOS) B A A C B A B B B C B B B Centre View Drive at Station Gate Road Movements EBT EBR WBL WBT NBL NBR OVERALL Travel Time Segment Queue Counter Hourly Volume (vph) Vehicle Delay (s) Queue Length 95th (m) Level of Service (LOS) A A A A E A Centre View Drive at Duke of York Blvd. Movements EBT EBR WBL WBT NBL NBR OVERALL Travel Time Segment Queue Counter Hourly Volume (vph) Vehicle Delay (s) Queue Length 95th (m) Level of Service (LOS) A A A A B B A W:\7k\7359 City Center BRT Functional Planning\ Transport\ Technical Analysis\VISSIM files\7359-pm Peak Hours\7359-mv-Fut Ntwrk-28 vol-pm\7359-mv-28pm future ntwrk-vs /1
33 Operational Anaylsis Level of Service, Vehicle Delay, Queue 28 PM Peak Hour Analysis Scenario 4: Background Traffic Conditions (Existing Traffic + 3% Growth) on Existing Road Network Summary-avg 1/14/29 Rathburn Road at City Center Transit Terminal Movements EBL EBT WBL WBT WBR NBL NBR SBL SBR OVERALL Travel Time Segment Queue Counter Hourly Volume (vph) Vehicle Delay (s) Queue Length 95th (m) Level of Service (LOS) C B B A A D D C B B Rathburn Road at Square One North Entrance Movements EBT EBR WBL WBT NBL NBR OVERALL Travel Time Segment Queue Counter Hourly Volume (vph) Vehicle Delay (s) Queue Length 95th (m) Level of Service (LOS) B A B B D B B Rathburn Road at City Centre Drive Movements EBL EBT EBR WBL1 WBT1 WBR1 NBL NBT NBR SBL SBT SBR WBL2 WBT2 WBR2 OVERALL Travel Time Segment Queue Counter Hourly Volume (vph) Vehicle Delay (s) Queue Length 95th (m) Level of Service (LOS) E D D F C C F F F F D E E E F Centre View Drive at Station Gate Road Movements EBT EBR WBL WBT NBL NBR OVERALL Travel Time Segment Queue Counter Hourly Volume (vph) Vehicle Delay (s) Queue Length 95th (m) Level of Service (LOS) A A A A D A B W:\7k\7359 City Center BRT Functional Planning\ Transport\ Technical Analysis\VISSIM files\7359-pm Peak Hours\7359-mv-PM-Fut Vol-Exstng Ntwrk\sb\7359-mv-28ntwrk-fut vol /1
34 Scenario Signalized Intersection at Hammerson Drive and Rathburn Road 1/14/29 Operational Anaylsis Level of Service, Vehicle Delay, Queue 231 PM Peak Hour Analysis Scenario Background Traffic Scenario (Existing Traffic + 3% Growth) on BRT Network - Signalized Intersection at Hammerson Drive and Rathburn Road Rathburn Road at Duke of York Blvd. Movements EBL EBT EBR WBL WBT WBR NBL NBT NBR SBL SBT SBR OVERALL Travel Time Segment Queue Counter Hourly Volume (vph) Vehicle Delay (s) Queue Length 95th (m) Level of Service (LOS) D E E D B B D D E D D A D Rathburn Road at Station Gate Movements EBT EBBusT WBT WBBusL WBBusT WBBusR NBBusL NBusR SBBusL SBBusR OVERALL Travel Time Segment Queue Counter Hourly Volume (vph) Vehicle Delay (s) Queue Length 95th (m) Level of Service (LOS) D A A D F F E C E C Rathburn Road at Hammerson Movements EBT EBR WBL WBT NBL NBR OVERALL Travel Time Segment Queue Counter Hourly Volume (vph) Vehicle Delay (s) Queue Length 95th (m) Level of Service (LOS) C C E B E C C Rathburn Road at City Centre Drive Movements EBL EBT EBR WBL1 WBT1 WBR1 NBL NBT NBR SBL SBT SBR WBBusT EBBusT OVERALL Travel Time Segment Queue Counter Hourly Volume (vph) Vehicle Delay (s) Queue Length 95th (m) Level of Service (LOS) B C C D E E F F E E E E D D City Centre Drive at Square One West Entrance Movements EBL EBT EBR WBL WBT WBR NBL NBT NBR SBL SBT SBR OVERALL Travel Time Segment Queue Counter Hourly Volume (vph) Vehicle Delay (s) Queue Length 95th (m) Level of Service (LOS) E D D E C D D F F D C B E 1/2
35 Centre View Drive at Station Gate Road Scenario Signalized Intersection at Hammerson Drive and Rathburn Road 1/14/29 Movements EBT EBR WBL WBT NBL NBR OVERALL Travel Time Segment Queue Counter Hourly Volume (vph) Vehicle Delay (s) Queue Length 95th (m) Level of Service (LOS) A A A A D B A Centre View Drive at Duke of York Blvd. Movements EBT EBR WBL WBT NBL NBR OVERALL Travel Time Segment Queue Counter Hourly Volume (vph) Vehicle Delay (s) Queue Length 95th (m) Level of Service (LOS) B B A A B B B Square One Drive at Duke of York Blvd. Movements SBT SBL WBL WBR NBR NBT OVERALL Travel Time Segment Queue Counter Hourly Volume (vph) Vehicle Delay (s) Queue Length 95th (m) Level of Service (LOS) A C D B B B B BRT Lane - Rathburn Movements EBBus WBBus WBBusL EBGPL WBGPL OVERALL Travel Time Segment Queue Counter Hourly Volume (vph) Vehicle Delay (s) Queue Length 95th (m) Travel Time (Sec) Level of Service (LOS) F F F D B C 2/2
36 Scenario Right-In-Right-Out Intersection at Hammerson Drive and Rathburn Road 1/14/29 Operational Anaylsis Level of Service, Vehicle Delay, Queue 231 PM Peak Hour Analysis Scenario Background Traffic Scenario (Existing Traffic + 3% Growth) on BRT Network - Right-In-Right-Out Intersection at Hammerson Drive and Rathburn Road Rathburn Road at Duke of York Blvd. Movements EBL EBT EBR WBL WBT WBR NBL NBT NBR SBL SBT SBR OVERALL Travel Time Segment Queue Counter Hourly Volume (vph) Vehicle Delay (s) Queue Length 95th (m) Level of Service (LOS) D F F C C B D C D D C A D Rathburn Road at Station Gate Movements EBT EBBusT WBT WBBusL WBBusT WBBusR NBBusL NBusR SBBusL SBBusR OVERALL Travel Time Segment Queue Counter Hourly Volume (vph) Vehicle Delay (s) Queue Length 95th (m) Level of Service (LOS) C B A A E E C B D B Rathburn Road at Hammerson Control Type: Unsignalized RIRO Movements EBT EBR WBT NBR OVERALL Travel Time Segment Queue Counter Hourly Volume (vph) Vehicle Delay (s) Queue Length 95th (m) Level of Service (LOS) A A A D A Rathburn Road at City Centre Drive Movements EBL EBT EBR WBL1 WBT1 WBR1 NBL NBT NBR SBL SBT SBR WBBusT EBBusT OVERALL Travel Time Segment Queue Counter Hourly Volume (vph) Vehicle Delay (s) Queue Length 95th (m) Level of Service (LOS) B D D E E D D D C C C E D City Centre Drive at Square One West Entrance Movements EBL EBT EBR WBL WBT WBR NBL NBT NBR SBL SBT SBR OVERALL Travel Time Segment Queue Counter Hourly Volume (vph) Vehicle Delay (s) Queue Length 95th (m) Level of Service (LOS) E D D E C C C C C C B B D 1/2
37 Centre View Drive at Station Gate Road Scenario Right-In-Right-Out Intersection at Hammerson Drive and Rathburn Road 1/14/29 Movements EBT EBR WBL WBT NBL NBR OVERALL Travel Time Segment Queue Counter Hourly Volume (vph) Vehicle Delay (s) Queue Length 95th (m) Level of Service (LOS) A A A A D B A Centre View Drive at Duke of York Blvd. Movements EBT EBR WBL WBT NBL NBR OVERALL Travel Time Segment Queue Counter Hourly Volume (vph) Vehicle Delay (s) Queue Length 95th (m) Level of Service (LOS) A B B A B B B Square One Drive at Duke of York Blvd. Movements SBT SBL WBL WBR NBR NBT OVERALL Travel Time Segment Queue Counter Hourly Volume (vph) Vehicle Delay (s) Queue Length 95th (m) Level of Service (LOS) A B C C B B B BRT Lane - Rathburn Control Type: RIRO Movements EBBus WBBus WBBusL EBGPL WBGPL OVERALL Travel Time Segment Queue Counter Hourly Volume (vph) Vehicle Delay (s) Queue Length 95th (m) Travel Time (Sec) Level of Service (LOS) E E B E A C 2/2
38 Operational Anaylsis Level of Service, Vehicle Delay, Queue 231 PM Peak Hour Analysis Scenario 6.1A - Total Traffic Scenario (Background + Site Traffic) on BRT Network - 3 LT Vehicles at Rathburn & Hammerson T-Intersection Scenario 6.1A - T-Intersection at Rathburn Hammerson 1/14/29 Rathburn Road at Duke of York Blvd. Movements EBL EBT EBR WBL WBT WBR NBL NBT NBR SBL SBT SBR OVERALL Travel Time Segment Queue Counter Hourly Volume (vph) Vehicle Delay (s) Queue Length 95th (m) Level of Service (LOS) E F F D C B D E F E D B D Rathburn Road at Station Gate Movements EBT EBBusT WBT WBBusL WBBusT WBBusR NBBusL NBusR SBBusL SBBusR OVERALL Travel Time Segment Queue Counter Hourly Volume (vph) Vehicle Delay (s) Queue Length 95th (m) Level of Service (LOS) E B A D F F E D E C Rathburn Road at Hammerson Movements EBT EBR WBL WBT NBL NBR OVERALL Travel Time Segment Queue Counter Hourly Volume (vph) Vehicle Delay (s) Queue Length 95th (m) Level of Service (LOS) C C F B F C D Rathburn Road at City Centre Drive Movements EBL EBT EBR WBL1 WBT1 WBR1 NBL NBT NBR SBL SBT SBR WBBusT EBBusT OVERALL Travel Time Segment Queue Counter Hourly Volume (vph) Vehicle Delay (s) Queue Length 95th (m) Level of Service (LOS) C C C F F F F F E D E E F F City Centre Drive at Square One West Entrance Movements EBL EBT EBR WBL WBT WBR NBL NBT NBR SBL SBT SBR OVERALL Travel Time Segment Queue Counter Hourly Volume (vph) Vehicle Delay (s) Queue Length 95th (m) Level of Service (LOS) E D D D C D E F F D C C E 1/2
39 Centre View Drive at Station Gate Road Scenario 6.1A - T-Intersection at Rathburn Hammerson 1/14/29 Movements EBT EBR WBL WBT NBL NBR OVERALL Travel Time Segment Queue Counter Hourly Volume (vph) Vehicle Delay (s) Queue Length 95th (m) Level of Service (LOS) A A A D B A Centre View Drive at Duke of York Blvd. Movements EBT EBR WBL WBT NBL NBR OVERALL Travel Time Segment Queue Counter Hourly Volume (vph) Vehicle Delay (s) Queue Length 95th (m) Level of Service (LOS) B B B A B B B Square One Drive at Duke of York Blvd. Movements SBT SBL WBL WBR NBR NBT OVERALL Travel Time Segment Queue Counter Hourly Volume (vph) Vehicle Delay (s) Queue Length 95th (m) Level of Service (LOS) A D D D C C C BRT Lane - Rathburn Movements EBBus WBBus WBBusL EBGPL WBGPL OVERALL Travel Time Segment Queue Counter Hourly Volume (vph) Vehicle Delay (s) Queue Length 95th (m) Travel Time (Sec) Level of Service (LOS) F F F E B D 2/2
40 Operational Anaylsis Level of Service, Vehicle Delay, Queue 231 PM Peak Hour Analysis Scenario 6.1B - Total Traffic Scenario (Background + Site Traffic) on BRT Network - 35 LT Vehicles at Rathburn & Hammerson T-Intersection Scenario 6.1B - T-Intersection at Rathburn Hammerson 1/14/29 Rathburn Road at Duke of York Blvd. Movements EBL EBT EBR WBL WBT WBR NBL NBT NBR SBL SBT SBR OVERALL Travel Time Segment Queue Counter Hourly Volume (vph) Vehicle Delay (s) Queue Length 95th (m) Level of Service (LOS) F F F D C B D E F E D A E Rathburn Road at Station Gate Movements EBT EBBusT WBT WBBusL WBBusT WBBusR NBBusL NBusR SBBusL SBBusR OVERALL Travel Time Segment Queue Counter Hourly Volume (vph) Vehicle Delay (s) Queue Length 95th (m) Level of Service (LOS) E C A E F F F D E C Rathburn Road at Hammerson Movements EBT EBR WBL WBT NBL NBR OVERALL Travel Time Segment Queue Counter Hourly Volume (vph) Vehicle Delay (s) Queue Length 95th (m) Level of Service (LOS) C C F B F C D Rathburn Road at City Centre Drive Movements EBL EBT EBR WBL1 WBT1 WBR1 NBL NBT NBR SBL SBT SBR WBBusT EBBusT OVERALL Travel Time Segment Queue Counter Hourly Volume (vph) Vehicle Delay (s) Queue Length 95th (m) Level of Service (LOS) C C C F F F F F E E E F F F City Centre Drive at Square One West Entrance Movements EBL EBT EBR WBL WBT WBR NBL NBT NBR SBL SBT SBR OVERALL Travel Time Segment Queue Counter Hourly Volume (vph) Vehicle Delay (s) Queue Length 95th (m) Level of Service (LOS) E D D E C D E F F D C B E 1/2
41 Centre View Drive at Station Gate Road Scenario 6.1B - T-Intersection at Rathburn Hammerson 1/14/29 Movements EBT EBR WBL WBT NBL NBR OVERALL Travel Time Segment Queue Counter Hourly Volume (vph) Vehicle Delay (s) Queue Length 95th (m) Level of Service (LOS) A A A A D B A Centre View Drive at Duke of York Blvd. Movements EBT EBR WBL WBT NBL NBR OVERALL Travel Time Segment Queue Counter Hourly Volume (vph) Vehicle Delay (s) Queue Length 95th (m) Level of Service (LOS) B B B B B B B Square One Drive at Duke of York Blvd. Movements SBT SBL WBL WBR NBR NBT OVERALL Travel Time Segment Queue Counter Hourly Volume (vph) Vehicle Delay (s) Queue Length 95th (m) Level of Service (LOS) A D D D C D C BRT Lane - Rathburn Movements EBBus WBBus WBBusL EBGPL WBGPL OVERALL Travel Time Segment Queue Counter Hourly Volume (vph) Vehicle Delay (s) Queue Length 95th (m) Travel Time (Sec) Level of Service (LOS) F F F E B D 2/2
42 Operational Anaylsis Level of Service, Vehicle Delay, Queue 231 PM Peak Hour Analysis Scenario Total Traffic Scenario (Background + Site Traffic) on BRT Network - Four-Way Intersection at Rathburn & Hammerson Scenario Four-Way Intersection at Rathburn Hammerson 1/14/29 Rathburn Road at Duke of York Blvd. Movements EBL EBT EBR WBL WBT WBR NBL NBT NBR SBL SBT SBR OVERALL Travel Time Segment Queue Counter Hourly Volume (vph) Vehicle Delay (s) Queue Length 95th (m) Level of Service (LOS) F F F E C B E E E F F C E Rathburn Road at Station Gate Movements EBT EBBusT WBT WBBusL WBBusT WBBusR NBBusL NBusR SBBusL SBBusR OVERALL Travel Time Segment Queue Counter Hourly Volume (vph) Vehicle Delay (s) Queue Length 95th (m) Level of Service (LOS) E B A F F F F D E D Rathburn Road at Hammerson Movements EBL EBT EBR WBL WBT WBR NBL NBT NBR SBL SBT SBR OVERALL Travel Time Segment Queue Counter Hourly Volume (vph) Vehicle Delay (s) Queue Length 95th (m) Level of Service (LOS) C C C F C B F F E F E D E Rathburn Road at City Centre Drive Movements EBL EBT EBR WBL1 WBT1 WBR1 NBL NBT NBR SBL SBT SBR WBBusT EBBusT OVERALL Travel Time Segment Queue Counter Hourly Volume (vph) Vehicle Delay (s) Queue Length 95th (m) Level of Service (LOS) C C C F F F F F F E E F F F City Centre Drive at Square One West Entrance Movements EBL EBT EBR WBL WBT WBR NBL NBT NBR SBL SBT SBR OVERALL Travel Time Segment Queue Counter Hourly Volume (vph) Vehicle Delay (s) Queue Length 95th (m) Level of Service (LOS) E D D E C E E F F E C B E 1/2
43 Centre View Drive at Station Gate Road Scenario Four-Way Intersection at Rathburn Hammerson 1/14/29 Movements EBT EBR WBL WBT NBL NBR OVERALL Travel Time Segment Queue Counter Hourly Volume (vph) Vehicle Delay (s) Queue Length 95th (m) Level of Service (LOS) A A A D B A Centre View Drive at Duke of York Blvd. Movements EBT EBR WBL WBT NBL NBR OVERALL Travel Time Segment Queue Counter Hourly Volume (vph) Vehicle Delay (s) Queue Length 95th (m) Level of Service (LOS) D D B B B B C Square One Drive at Duke of York Blvd. Movements SBT SBL WBL WBR NBR NBT OVERALL Travel Time Segment Queue Counter Hourly Volume (vph) Vehicle Delay (s) Queue Length 95th (m) Level of Service (LOS) B E E C B C C BRT Lane - Rathburn Movements EBBus WBBus WBBusL EBGPL WBGPL OVERALL Travel Time Segment Queue Counter Hourly Volume (vph) Vehicle Delay (s) Queue Length 95th (m) Travel Time (Sec) Level of Service (LOS) F F F E C D 2/2
44 APPENDIX D PRELIMINARY DESIGN PLAN FOR PROPOSED BRT FACILITY
45
46 APPENDIX E MEMORANDUM ON WHOLE FOODS TRIP GENERATION
47 McCORMICK RANKIN CORPORATION 2655 North Sheridan Way Mississauga, Ontario, L5K 2P8 Tel: (95) Fax: (95) Website: MEMO TO: FROM: File Alex Mereu DATE: August 28, 29 COPIES: OUR FILE: WO SUBJECT: Whole Foods Traffic Counts/ Trip Generation Analysis W:\7k\7359 City Center BRT Functional Planning\ Transport\ Technical Memos\17359_am_Whole Foods Traffic Count Memo august28.doc Purpose/Location A traffic count survey was conducted on Thursday, August 13, 29 to determine the automobile trip generation of the shopping centre east of Trafalgar road on Cornwall Road in Oakville. These counts were undertaken from 7:3 AM to 9:3 AM, from 1: AM to 1: PM, and from 2: PM to 5:3 PM. The temperature was 3ºC and the sky was clear. The data that was collected includes all vehicle traffic movements from all directions for three different access points to the shopping centre (refer to Figure 1 on page 2): 1. The intersection of Reynolds Street and Cornwall Road 2. The main entrance to the shopping centre from Cornwall Road 3. The intersection of Allan Street and Cornwall Road The Shopping centre has three different retail destinations. It has been assumed that the traffic entering the shopping centre at the three access points are arriving at one of these three retail destinations (refer to Figure 1 on page 2). A. Supermarket (Whole Foods) B. Strip Plaza (Includes Starbucks, and Blockbuster) C. Drug Store (Shoppers Drug Mart) The Google Earth image on the following page indicates the locations of the three intersections and the three retail destinations.

48 Figure 1: Location Map C 3 B 2 A 1 Source: Google Earth
MEMO. McCORMICK RANKIN CORPORATION. File FROM: Keyur Shah DATE: February 1, 2010 COPIES: OUR FILE: SUBJECT: TO:
 McCORMICK RANKIN CORPORATION 2655 North Sheridan Way Mississauga, Ontario, L5K 2P8 Tel: (905)823-8500 Fax: (905) 823-8503 E-mail: mrc@mrc.ca Website: www.mrc.ca MEMO TO: File FROM: Keyur Shah DATE: February
Table 1 - Land Use Comparisons - Proposed King s Wharf Development. Retail (SF) Office (SF) 354 6,000 10, Land Uses 1
 Office (SF) 354 6,000 10, Land Uses 1") Ref. No. 171-6694 Phase 2 November 23, 217 Mr. David Quilichini, Vice President Fares & Co. Developments Inc. 31 Place Keelson Sales Centre DARTMOUTH NS B2Y C1 Sent Via Email to David@faresinc.com RE:
Ref. No. 171-6694 Phase 2 November 23, 217 Mr. David Quilichini, Vice President Fares & Co. Developments Inc. 31 Place Keelson Sales Centre DARTMOUTH NS B2Y C1 Sent Via Email to David@faresinc.com RE:
Appendix H: Construction Impacts H-2 Transportation
 Appendix H: Construction Impacts H-2 Transportation \ AECOM 71 W. 23 rd Street New York, NY 10010 www.aecom.com 212 366 6200 tel 212 366 6214 fax Memorandum To CC Subject Robert Conway Donald Tone Construction
Bennett Pit. Traffic Impact Study. J&T Consulting, Inc. Weld County, Colorado. March 3, 2017
 Bennett Pit Traffic Impact Study J&T Consulting, Inc. Weld County, Colorado March 3, 217 Prepared By: Sustainable Traffic Solutions, Inc. http://www.sustainabletrafficsolutions.com/ Joseph L. Henderson,
RESPONSE TO TRAFFIC IMPACT STUDY COMMENTS
 RESPONSE TO TRAFFIC IMPACT STUDY COMMENTS Proposed Gas Station 40 Arthur Street (Highway 26), Town of the Blue Mountains (Thornbury), County of Grey, Ontario AUGUST 2013 August 27, 2013 MR. REG RUSSWURM
886 March Road McDonald's Transportation Study
 McDonald's Restaurants of Canada Limited March 2013 886 March Road McDonald's Transportation Study Submitted by: HDR Corporation 100 York Boulevard, Suite 300 Richmond Hill, ON L4B 1J8 (905) 882-4100 www.hdrinc.com
Ingraham High School Parking and Traffic Analysis
 Parking and Traffic Analysis Seattle, WA Prepared for: URS Corporation 1501 4th Avenue, Suite 1400 Seattle, WA 98101-1616 Mirai Transportation Planning & Engineering 11410 NE 122nd Way, Suite 320 Kirkland,
Ref. No Task 3. April 28, Mr. Cesar Saleh, P. Eng. VP Planning and Design W.M. Fares Group th
 Ref. No. 151-00564 Task 3 April 28, 2015 Mr. Cesar Saleh, P. Eng. VP Planning and Design W.M. Fares Group th 3480 Joseph Howe Drive, 5 Floor HALIFAX NS B3L 4H7 Sent via Email to ceasr.saleh@wmfares.com
 Traffic Analysis For Approved Uses within the St. Lucie West DRI Aldi Port St. Lucie, FL Prepared for: Bohler Engineering, LLC 1000 Corporate Drive Suite 250 Fort Lauderdale, FL 33334 Prepared by: 10795
MEMORANDUM. Date: November 4, Cheryl Burrell, Pebble Beach Company. Rob Rees, P.E. Inclusionary Housing Transportation Analysis WC
 MEMORANDUM Date: November 4, 2013 To: From: Subject: Cheryl Burrell, Pebble Beach Company Rob Rees, P.E. Inclusionary Housing Transportation Analysis As requested, Fehr & Peers is providing clarification
Downtown One Way Street Conversion Technical Feasibility Report
 Downtown One Way Street Conversion Technical Feasibility Report As part of the City s Transportation Master Plan, this report reviews the technical feasibility of the proposed conversion of the current
Alpine Highway to North County Boulevard Connector Study
 Alpine Highway to North County Boulevard Connector Study prepared by Avenue Consultants March 16, 2017 North County Boulevard Connector Study March 16, 2017 Table of Contents 1 Summary of Findings... 1
Oakbrook Village Plaza City of Laguna Hills
 Oakbrook Village Plaza City of Laguna Hills Traffic Impact Analysis Prepared by: HDR Engineering 3230 El Camino Real, Suite 200 Irvine, CA 92602 October 2012 Revision 3 D-1 Oakbrook Village Plaza Laguna
Prepared For: Toronto Transit Commission 1138 Bathurst Street Toronto, Ontario M5R 3H2. Prepared By:
 TRAFFIC IMPACT STUDY FOR THE TTC MCNICOLL BUS GARAGE CITY OF TORONTO Prepared For: Toronto Transit Commission 1138 Bathurst Street Toronto, Ontario M5R 3H2 Prepared By: Canada Inc. 4th Floor, 3 Leek Crescent
L1TILE BEARS DAY CARE TRANSPORTATION IMPACT STUDY FORT COLLINS, COLORADO MAY Prepared for:
 L1TILE BEARS DAY CARE TRANSPORTATION IMPACT STUDY FORT COLLINS, COLORADO MAY 2012 Prepared for: Hillside Construction, Inc. 216 Hemlock Street, Suite B Fort Collins, CO 80534 Prepared by: DELICH ASSOCIATES
V. DEVELOPMENT OF CONCEPTS
 Martin Luther King, Jr. Drive Extension FINAL Feasibility Study Page 9 V. DEVELOPMENT OF CONCEPTS Throughout the study process several alternative alignments were developed and eliminated. Initial discussion
TRAFFIC IMPACT STUDY DERRY GREEN CORPORATE BUSINESS PARK MILTON SECONDARY PLAN MODIFICATION
 TRAFFIC IMPACT STUDY DERRY GREEN CORPORATE BUSINESS PARK MILTON SECONDARY PLAN MODIFICATION TRAFFIC IMPACT STUDY DERRY GREEN CORPORATE BUSINESS PARK MILTON SECONDARY PLAN MODIFICATION DECEMBER 2014 UPDATED
TRAFFIC AND TRANSPORTATION TECHNICAL MEMORANDUM
 TRAFFIC AND TRANSPORTATION TECHNICAL MEMORANDUM for ENVIRONMENTAL ASSESSMENT US 460 Bypass Interchange and Southgate Drive Relocation State Project No.: 0460-150-204, P101, R201, C501, B601; UPC 99425
Provide an overview of the development proposal including projected site traffic volumes;
 December 19, 2013 File: 163600935 Attention: Troy Elliott Carl Elliott Limited 15-1831 Robertson Road PO Box 11117 Nepean, Ontario K1H 7T8 Dear Mr. Elliott, Reference: 2235 and 2265 Robertson Road Transportation
Craig Scheffler, P.E., PTOE HNTB North Carolina, P.C. HNTB Project File: Subject
 TECHNICAL MEMORANDUM To Kumar Neppalli Traffic Engineering Manager Town of Chapel Hill From Craig Scheffler, P.E., PTOE HNTB North Carolina, P.C. Cc HNTB Project File: 38435 Subject Obey Creek TIS 2022
Re: Residential Development - Ogilvie/Cummings Transportation Overview
 1223 Michael Street, Suite 100, Ottawa, ON K1J 7T2 Tel: 613.738.4160 Fax: 613.739.7105 www.delcan.com March 28, 2012 OUR REF: TO3088TOY Barry J. Hobin & Architects 63 Pamilla Street Ottawa, ON K1S 3K7
Re: Cyrville Road Car Dealership
 1223 Michael Street, Suite 100, Ottawa, ON K1J 7T2 Tel: 613.738.4160 Fax: 613.739.7105 www.delcan.com February 25, 2013 OUR REF: TO3098TOE Mark Motors of Ottawa 611 Montreal Road Ottawa, ON K1K 0T8 Attention:
June 21, Mr. Jeff Mark The Landhuis Company 212 North Wahsatch Avenue, Suite 301. Colorado Springs, CO 80903
 LSC TRANSPORTATION CONSULTANTS, INC. 545 East Pikes Peak Avenue, Suite 210 Colorado Springs, CO 80903 (719) 633-2868 FAX (719) 633-5430 E-mail: lsc@lsctrans.com Website: http://www.lsctrans.com June 21,
Traffic Impact Analysis Update
 Willow Bend Traffic Impact Analysis Update TABLE OF CONTENTS Page I. INTRODUCTION -------------------------------------------------------------------------------------------- 1 II. EXISTING CONDITIONS
One Harbor Point Residential
 Residential Gig Harbor, WA Transportation Impact Analysis January 23, 2017 Prepared for: Neil Walter Company PO Box 2181 Tacoma, WA 98401 Prepared by: TENW Transportation Engineering NorthWest 11400 SE
Memorandum. 1 Short List Analysis Background. James Hinkamp and Tony Coe, City of Lafayette Steering Committee
 To Copies James Hinkamp and Tony Coe, City of Lafayette Steering Committee Date August 26, 2016 Reference number 243381 From Mike Iswalt, Vanessa Peers, Will Baumgardner File reference 4-05 Subject Lafayette
Traffic Impact Study Proposed Commercial Development Ballwin, Missouri. Technical Memorandum for Traffic Impact Study
 Traffic Impact Study Proposed Commercial Development Ballwin, Missouri Technical Memorandum for Traffic Impact Study Crawford, Bunte, Brammeier May 1, 2009 MEMORANDUM Date: April 24, 2009 To: From: Subject:
INTERSECTION ANALYSIS PARK AVENUE AND BRADDOCK ROAD (FROSTBURG, MD) FOR LENHART TRAFFIC CONSULTING, INC.
 FOR LENHART TRAFFIC CONSULTING, INC.") INTERSECTION ANALYSIS FOR PARK AVENUE AND BRADDOCK ROAD (FROSTBURG, MD) Prepared for: City of Frostburg, Maryland & Allegany County Commissioners Prepared by: LENHART TRAFFIC CONSULTING, INC. TRAFFIC ENGINEERING
INTERSECTION ANALYSIS FOR PARK AVENUE AND BRADDOCK ROAD (FROSTBURG, MD) Prepared for: City of Frostburg, Maryland & Allegany County Commissioners Prepared by: LENHART TRAFFIC CONSULTING, INC. TRAFFIC ENGINEERING
Traffic Impact Study. Eastern Springs. A Proposed Development in Manorville, NY. April Haas Group Inc Transportation Planners and Engineers
 Traffic Impact Study For Eastern Springs A Proposed Development in Manorville, NY April 2018 Haas Group Inc Transportation Planners and Engineers Table of Contents 1) Executive Summary... 2 2) Study Purpose...
APPENDIX C1 TRAFFIC ANALYSIS DESIGN YEAR TRAFFIC ANALYSIS
 APPENDIX C1 TRAFFIC ANALYSIS DESIGN YEAR TRAFFIC ANALYSIS DESIGN YEAR TRAFFIC ANALYSIS February 2018 Highway & Bridge Project PIN 6754.12 Route 13 Connector Road Chemung County February 2018 Appendix
Sugarland Crossing Gwinnett County, Georgia
 Sugarland Crossing Gwinnett County, Georgia S IGNAL W ARRANT A NALYSIS For the Intersection of: Sugarloaf Parkway / Richards Middle School Driveway / Sugarland Crossing Main Site Driveway Prepared for:
Appendix B: Traffic Reports
 Appendix B: Traffic Reports 407 TRANSITWAY - KENNEDY ROAD TO BROCK ROAD MINISTRY OF TRANSPORTATION - CENTRAL REGION Report Markham Road Station Traffic Study Prepared for Ministry of Transportation, Ontario
PROJECT: Wilkinson Road Corridor Improvement Traffic Management Planning Project SUBJECT: Traffic Analysis
 TECHNICAL MEMORANDUM DATE: September 10, 2014 PROJECT 5861.03 NO: PROJECT: Wilkinson Road Corridor Improvement Traffic Management Planning Project SUBJECT: Traffic Analysis TO: Steve Holroyd - District
Lakeside Terrace Development
 Lakeside Terrace Development City of Barrie, County of Simcoe Traffic Brief for: Type of Document: Final Report Project Number: JDE 1617 Date Submitted: April 29 th, 216 4/29/16 John Northcote, P.Eng.
Proposed location of Camp Parkway Commerce Center. Vicinity map of Camp Parkway Commerce Center Southampton County, VA
 Proposed location of Camp Parkway Commerce Center Vicinity map of Camp Parkway Commerce Center Southampton County, VA Camp Parkway Commerce Center is a proposed distribution and industrial center to be
April Salvation Army Barrhaven Church 102 Bill Leathem Drive Transportation Brief
 April 26 Salvation Army Barrhaven Church 2 Bill Leathem Drive Transportation Brief Salvation Army Barrhaven Church 2 Bill Leathem Drive Transportation Brief prepared for: The Salvation Army 2 Overlea Blvd.
Freeway Weaving and Ramp Junction Analysis
 TEXAS TECH UNIVERSITY Freeway Weaving and Ramp Junction Analysis Along IH 27 at Plainview, TX Hao Xu, Jared A. Squyres, Wesley Kumfer, and Hongchao Liu 7/15/2011 Table of Contents Project Description...
Village of Richmond Transportation Brief
 Village of Richmond Transportation Brief GENIVAR Project Number 111-18482-00 June 21 st, 2011 www.genivar.com GENIVAR 15 Fitzgerald Road, Suite 100 Ottawa, Ontario, CANADA K2H 9G1 Telephone: 613-829-2800
JOHNSON RANCH RAPID CITY, SOUTH DAKOTA TRAFFIC IMPACT ANALYSIS
 JOHNSON RANCH RAPID CITY, SOUTH DAKOTA TRAFFIC IMPACT ANALYSIS Prepared for: KTM Design Solutions 528 Kansas City Street, Suite 1 Rapid City, SD 57701 Prepared by: Felsburg Holt & Ullevig 6300 South Syracuse
830 Main Street Halifax Regional Municipality
 830 Main Street Halifax Regional Municipality Traffic Impact Statement Final Report Prepared by: GRIFFIN transportation group inc. 30 Bonny View Drive Fall River, NS B2T 1R2 www.griffininc.ca Prepared
D & B COMMERCIAL TRAFFIC IMPACT ANALYSIS
 D & B COMMERCIAL TRAFFIC IMPACT ANALYSIS TABLE OF CONTENTS I. Introduction...3 II. Project Description...3 III. Existing Conditions...3 IV. Future Traffic Conditions...8 V. Conclusions and Mitigation...14
County State Aid Highway 30 (Diffley Road) and Dodd Road Intersection Study
 and Dodd Road Intersection Study") County State Aid Highway 30 (Diffley Road) and Dodd Road Intersection Study City of Eagan, Dakota County, Minnesota Date: March 2012 Project No. 14957.000 444 Cedar Street, Suite 1500 Saint Paul, MN 55101
County State Aid Highway 30 (Diffley Road) and Dodd Road Intersection Study City of Eagan, Dakota County, Minnesota Date: March 2012 Project No. 14957.000 444 Cedar Street, Suite 1500 Saint Paul, MN 55101
Aldridge Transportation Consultants, LLC Advanced Transportation Planning and Traffic Engineering
 Aldridge Transportation Consultants, LLC Advanced Transportation Planning and Traffic Engineering John M.W. Aldridge, PE, PTOE, AICP 1082 Chimney Rock Road Colorado Registered Professional Engineer Highlands
Parking/Traffic Assessment Study
 Brock Road Industrial Mall 985 Brock Road South City of Pickering Parking/Traffic Assessment Study Prepared by: Tranplan Associates, Toronto Toronto 416-670-2005 Sudbury 705-522-0272 Peterborough 705-874-3638
Traffic Impact Analysis Farmington Center Village
 Traffic Impact Analysis Farmington Center Village Route 4 (Farmington Avenue) Farmington, Connecticut Prepared for: The Town of Farmington, CT Prepared By: BL Companies Meriden, Connecticut December 2016
Proposed Hotel and Restaurant Development
 Traffic Impact Study Proposed Hotel and Restaurant Development Marbledale Road Tuckahoe, NY PREPARED FOR BILLWIN DEVELOPMENT AFFILIATES, LLC 365 WHITE PLAINS ROAD EASTCHESTER, NY. 10709 PREPARED BY Engineering
Barrhaven Honda Dealership. Dealership Drive, Ottawa, ON. Transportation Brief
 Barrhaven Honda Dealership Dealership Drive, Ottawa, ON Transportation Brief Prepared By: NOVATECH Suite 200, 240 Michael Cowpland Drive Ottawa, Ontario K2M 1P6 September, 2015 File: 115136 Ref: R-2015-152
Proposed Office Building Traffic Impact Study Chicago Avenue Evanston, Illinois
 Proposed Office Building Traffic Impact Study 1714-1720 Chicago Avenue Evanston, Illinois Prepared For: HOLABIRD & ROOT, LLC Prepared by: Eriksson Engineering Associates, Ltd. 145 Commerce Drive, Ste A,
To: File From: Adrian Soo, P. Eng. Markham, ON File: Date: August 18, 2015
 Memo To: From: Adrian Soo, P. Eng. Markham, ON : 165620021 Date: Reference: E.C. Row Expressway, Dominion Boulevard Interchange, Dougall Avenue Interchange, and Howard 1. Review of Interchange Geometry
ARVADA TRIANGLE REDEVELOPMENT TRAFFIC IMPACT ANALYSIS
 ARVADA TRIANGLE REDEVELOPMENT TRAFFIC IMPACT ANALYSIS Prepared for: Arvada Urban Renewal Authority 5601 Olde Wadsworth Boulevard, Suite 210 Arvada, Colorado 80002 (720) 898-7062 Prepared by: Felsburg Holt
1012 & 1024 McGarry Terrace
 December 217 112 & 124 McGarry Terrace Transportation Impact Study 112 & 124 McGarry Terrace Transportation Impact Study prepared for: Lépine Corporation 32 March Road Kanata, ON K2K 2E3 prepared by: 1223
Weaver Road Senior Housing Traffic Impact Analysis
 Gibson Traffic Consultants, Inc. 2813 Rockefeller Avenue Suite B Everett, WA 9821 425.339.8266 Weaver Road Senior Housing Traffic Impact Analysis Jurisdiction: City of Snohomish January 218 GTC #17-37
KUM & GO 6400 WESTOWN PARKWAY WEST DES MOINES, IOWA 50266
 KUM & GO #300 PECOS STREET & 88 TH AVENUE THORNTON, COLORADO TRAFFIC IMPACT STUDY REVISION 1 PREPARED FOR KUM & GO 6400 WESTOWN PARKWAY WEST DES MOINES, IOWA 50266 JANUARY 23, 2014 OA PROJECT NO. 013-1721
267 O Connor Street Residential Development
 M a y 2014 267 O Connor Street Residential Development Transportation Brief Google 2014 Bing 2014 Prepared for: MASTERCRAFT STARWOOD Prepared by: Study 267 O'Connor Type Street May 2014 Study Residential
TRAFFIC IMPACT STUDY DERRY GREEN CORPORATE BUSINESS PARK MILTON SECONDARY PLAN MODIFICATION
 TRAFFIC IMPACT STUDY DERRY GREEN CORPORATE BUSINESS PARK MILTON SECONDARY PLAN MODIFICATION TRAFFIC IMPACT STUDY DERRY GREEN CORPORATE BUSINESS PARK MILTON SECONDARY PLAN MODIFICATION DECEMBER 24 UPDATED
Winnetka Avenue Bike Lanes Traffic Impact Analysis
 Winnetka Avenue Bike Lanes Traffic Impact Analysis January 4, 2019 Prepared by City of Los Angeles Department of Transportation Active Transportation Division Winnetka Ave Bike Lanes Traffic Impact Analysis
TRAFFIC IMPACT ANALYSIS
 TRAFFIC IMPACT ANALYSIS Emerald Isle Commercial Development Prepared by SEPI Engineering & Construction Prepared for Ark Consulting Group, PLLC March 2016 I. Executive Summary A. Site Location The Emerald
LAWRENCE TRANSIT CENTER LOCATION ANALYSIS 9 TH STREET & ROCKLEDGE ROAD / 21 ST STREET & IOWA STREET LAWRENCE, KANSAS
 LAWRENCE TRANSIT CENTER LOCATION ANALYSIS 9 TH STREET & ROCKLEDGE ROAD / 21 ST STREET & IOWA STREET LAWRENCE, KANSAS TRAFFIC IMPACT STUDY FEBRUARY 214 OA Project No. 213-542 TABLE OF CONTENTS 1. INTRODUCTION...
Traffic Impact Study Hudson Street Parking Garage MC Project No.: A Table of Contents
 Traffic Impact Study Hudson Street Parking Garage MC Project No.: 15001714A Table of Contents Table of Contents I. INTRODUCTION... 1 II. EXISTING CONDITIONS... 4 III. 2015 EXISTING TRAFFIC CONDITIONS...
MURRIETA APARTMENTS TRAFFIC IMPACT ANALYSIS CITY OF MURRIETA, CALIFORNIA
 MURRIETA APARTMENTS TRAFFIC IMPACT ANALYSIS CITY OF MURRIETA, CALIFORNIA SEPTEMBER 20, 2012 Prepared for: Golden Eagle Multi-Family Properties, LLC 6201 Oak Canyon Rd., Suite 250 Irvine, CA 92618 Prepared
Wellington Street West
 Transportation Brief prepared for: 185 Davenport Road Suite 300 Toronto, ON M5R 1J1 prepared by: 1223 Michael Street Suite 100 Ottawa, ON K1J 7T2 November 5, 2013 TO3131TOH Transportation Brief November
RE: 3605 Paul Anka Drive Addendum #2 to the December 2012 Traffic Impact Study
 19 May 2015 BY EMAIL: asaggarwal@gmail.com Manor Park Management 231 Brittany Drive, Suite D Ottawa, ON K1K 0R8 Attention: Mr. Anand Aggarwal RE: 3605 Paul Anka Drive Addendum #2 to the December 2012 Traffic
Re: Addendum No. 4 Transportation Overview 146 Mountshannon Drive Ottawa, Ontario
 April 18 th, 2017 Mr. Kevin Yemm Vice President, Land Development Richraft Group of Companies 2280 St. Laurent Boulevard, Suite 201 Ottawa, Ontario (Tel: 613.739.7111 / e-mail: keviny@richcraft.com) Re:
CastleGlenn Consultants Inc.
 CastleGlenn Consultants Inc. Engineers, Project Managers & Planners March 11 th, 2013 Domenic Idone, P. Eng Planning Manager R.W. Tomlinson Ltd. 5597 Power Road Ottawa, Ontario K1G 3N4 Dear Mr. Idone:
APPENDIX E. Traffic Analysis Report
 APPENDIX E Traffic Analysis Report THIS PAGE INTENTIONALLY BLANK EAGLE RIVER TRAFFIC MITIGATION PHASE I OLD GLENN HIGHWAY/EAGLE RIVER ROAD INTERSECTION IMPROVEMENTS TRAFFIC ANALYSIS Eagle River, Alaska
BUCKLEY ANNEX REDEVELOPMENT PLAN TRANSPORTATION ANALYSIS ADDENDUM
 BUCKLEY ANNEX REDEVELOPMENT PLAN TRANSPORTATION ANALYSIS ADDENDUM Prepared for: City and County of Denver Prepared by: Contact: Brian Bern, P.E., PTOE 303.572.0200 On Behalf of: Lowry Redevelopment Authority
Proposed Pit Development
 July 5, 2017 via email: sam@greenwoodconst.ca CCTA File 114239 Sam Greenwood Greenwood Aggregates 205467 County Road 109 Amaranth, ON L9W 0V1 Re: Proposed Violet Hill Gravel Pit, Town of Mono Traffic Review
Rockingham Ridge Plaza Commercial Development Halifax Regional Municipality
 Rockingham Ridge Plaza Commercial Development Halifax Regional Municipality Traffic Impact Study Final Draft Report Prepared by: GRIFFIN transportation group inc. 30 Bonny View Drive Fall River, NS B2T
West Hills Shopping Centre Lowe s Expansion Traffic Impact Study
 West Hills Shopping Centre Lowe s Expansion Traffic Impact Study Prepared for: Armel Corporation January 2015 Paradigm Transportation Solutions Ltd. 22 King Street South, Suite 300 Waterloo ON N2J 1N8
LATSON INTERCHANGE DEVELOPMENT TRAFFIC STUDIES. Genoa Township, Livingston County, MI
 LATSON INTERCHANGE DEVELOPMENT TRAFFIC STUDIES Genoa Township, Livingston County, MI DRAFT TRAFFIC STUDY FOR I-96 AT LATSON RD INTERCHANGE Livingston County CS 47065 JN 101622C Submitted to: Michigan Department
EXECUTIVE SUMMARY. The following is an outline of the traffic analysis performed by Hales Engineering for the traffic conditions of this project.
 EXECUTIVE SUMMARY This study addresses the traffic impacts associated with the proposed Shopko redevelopment located in Sugarhouse, Utah. The Shopko redevelopment project is located between 1300 East and
Transit City Etobicoke - Finch West LRT
 Delcan Corporation Transit City Etobicoke - Finch West LRT APPENDIX D Microsimulation Traffic Modeling Report March 2010 March 2010 Appendix D CONTENTS 1.0 STUDY CONTEXT... 2 Figure 1 Study Limits... 2
BARRHAVEN FELLOWSHIP CRC 3058 JOCKVALE ROAD OTTAWA, ONTARIO TRANSPORTATION BRIEF. Prepared for:
 BARRHAVEN FELLOWSHIP CRC 3058 JOCKVALE ROAD OTTAWA, ONTARIO TRANSPORTATION BRIEF Prepared for: Barrhaven Fellowship CRC 3058 Jockvale Road Ottawa, ON K2J 2W7 December 7, 2016 116-649 Report_1.doc D. J.
Traffic Impact Analysis. Alliance Cole Avenue Residential Site Dallas, Texas. Kimley-Horn and Associates, Inc. Dallas, Texas.
 Traffic Impact Analysis Alliance Cole Avenue Residential Site Dallas, Texas February 15, 2018 Kimley-Horn and Associates, Inc. Dallas, Texas Project #064524900 Registered Firm F-928 Traffic Impact Analysis
LOST LAKE CORRIDOR REVIEW
 LOST LAKE CORRIDOR REVIEW Prepared for: Prepared by: Broadview Developments Inc. c/o Westbrook Consulting Watt Consulting Group Our File: 2064.B01 Date: October 31, 2016 TABLE OF CONTENTS 1.0 INTRODUCTION...
JRL consulting. March Hartland Developments Limited 1993 Hammonds Plains Road Hammonds Plains, NS B4B 1P3
 March 2015 Prepared for Hartland Developments Limited 1993 Hammonds Plains Road Hammonds Plains, NS B4B 1P3 JRL consulting JRL consulting TABLE OF CONTENTS 1 INTRODUCTION... 2 1.1 BACKGROUND... 2 2 EXISTING
Addendum to Traffic Impact Analysis for Port Marigny Site Mandeville, LA
 Addendum to Traffic Impact Analysis for Port Marigny Site Mandeville, LA (St. Tammany Parish Mandeville, LA) Prepared For The Pittman Companies Michael N Pittman, MD 328 East Boston St Covington, LA 70433
King Soopers #116 Thornton, Colorado
 Traffic Impact Study King Soopers #116 Thornton, Colorado Prepared for: Galloway & Company, Inc. T R A F F I C I M P A C T S T U D Y King Soopers #116 Thornton, Colorado Prepared for Galloway & Company
Date: December 20, Project #:
 To: Craig Rottenberg Long s Jewelers 60A South Avenue Burlington, MA 01803 From: Patrick Dunford, P.E. Senior Project Manager Date: December 20, 2018 Project #: 14416.00 Re: Burlington Mall Proposed Long
Salvini Consulting Inc. 459 Deer Ridge Drive Kitchener, ON N2P 0A November 8, 2017 Revised December 20, 2017
 Salvini Consulting Inc. 459 Deer Ridge Drive Kitchener, ON N2P 0A7 519-591-0426 November 8, 2017 Revised December 20, 2017 Laurie Wills, PEng Deputy Director of Public Works Town of Cobourg 740 Division
Wellings Communities Holding Inc and Extendicare (Canada) Inc Hazeldean Road. Transportation Impact Study. Ottawa, Ontario. Project ID
 Inc Hazeldean Road. Transportation Impact Study. Ottawa, Ontario. Project ID") Wellings Communities Holding Inc and Extendicare (Canada) Inc. 5731 Hazeldean Road Transportation Impact Study Ottawa, Ontario Project ID 160401195 Prepared by: Stantec Consulting Ltd. March 2016 WELLINGS
Wellings Communities Holding Inc and Extendicare (Canada) Inc. 5731 Hazeldean Road Transportation Impact Study Ottawa, Ontario Project ID 160401195 Prepared by: Stantec Consulting Ltd. March 2016 WELLINGS
Traffic Impact Statement (TIS)
") Traffic Impact Statement (TIS) Vincentian PUDA Collier County, FL 10/18/2013 Prepared for: Global Properties of Naples Prepared by: Trebilcock Consulting Solutions, PA 2614 Tamiami Trail N, Suite 615 1205
Traffic Impact Statement (TIS) Vincentian PUDA Collier County, FL 10/18/2013 Prepared for: Global Properties of Naples Prepared by: Trebilcock Consulting Solutions, PA 2614 Tamiami Trail N, Suite 615 1205
Re: Sainte-Geneviève Elementary School (2198 Arch Street) Transportation Overview
 Transportation Overview") 2 March 2015 OUR REF: TO3205TOB00 Conseil des écoles catholiques du Centre-Est (CECCE) 4000 rue Labelle Ottawa, Ontario K1J 1A1 Attention: Maguy Eustache Dear Maguy: Re: Sainte-Geneviève Elementary School
2 March 2015 OUR REF: TO3205TOB00 Conseil des écoles catholiques du Centre-Est (CECCE) 4000 rue Labelle Ottawa, Ontario K1J 1A1 Attention: Maguy Eustache Dear Maguy: Re: Sainte-Geneviève Elementary School
Interstate Operations Study: Fargo-Moorhead Metropolitan Area Simulation Results
 NDSU Dept #2880 PO Box 6050 Fargo, ND 58108-6050 Tel 701-231-8058 Fax 701-231-6265 www.ugpti.org www.atacenter.org Interstate Operations Study: Fargo-Moorhead Metropolitan Area 2025 Simulation Results
Traffic Engineering Study
 Traffic Engineering Study Bellaire Boulevard Prepared For: International Management District Technical Services, Inc. Texas Registered Engineering Firm F-3580 November 2009 Executive Summary has been requested
BUS RAPID TRANSIT (BRT) MISSISSAUGA SEGMENT IMPLEMENTATION PLAN
 MISSISSAUGA SEGMENT IMPLEMENTATION PLAN") APPENDIX 1 CITY OF MISSISSAUGA BUS RAPID TRANSIT (BRT) MISSISSAUGA SEGMENT IMPLEMENTATION PLAN Executive Summary McCORMICK RANKIN May 2003 Introduction This executive summary highlights the findings and
APPENDIX 1 CITY OF MISSISSAUGA BUS RAPID TRANSIT (BRT) MISSISSAUGA SEGMENT IMPLEMENTATION PLAN Executive Summary McCORMICK RANKIN May 2003 Introduction This executive summary highlights the findings and
RTE. 1 at RTE. 637 & RTE. 639
 INTERSECTION SAFETY STUDY Prepared for: Virginia Department of Transportation Central Region Operations Traffic Engineering (UPC #81378, TO 12-092) DAVENPORT Project Number: 13-368 / /2014 RTE. 1 at RTE.
MEMO VIA . Ms. Amy Roth DPS Director, City of Three Rivers. To:
 MEMO To: Ms. Amy Roth DPS Director, City of Three Rivers VIA EMAIL From: Michael J. Labadie, PE Julie M. Kroll, PE, PTOE Brandon Hayes, PE, P.Eng. Fleis & VandenBrink Date: January 5, 2017 Re: Proposed
Interstate Operations Study: Fargo-Moorhead Metropolitan Area Simulation Output
 NDSU Dept #2880 PO Box 6050 Fargo, ND 58108-6050 Tel 701-231-8058 Fax 701-231-6265 www.ugpti.org www.atacenter.org Interstate Operations Study: Fargo-Moorhead Metropolitan Area 2015 Simulation Output Technical
MERIVALE PRIORITY SQUARE 2852 MERIVALE ROAD CITY OF OTTAWA TRANSPORTATION BRIEF. Prepared for: ONT Inc. 25 Winding Way Nepean, Ontario K2C 3H1
 MERIVALE PRIORITY SQUARE 2852 MERIVALE ROAD CITY OF OTTAWA TRANSPORTATION BRIEF Prepared for: 2190986ONT Inc. 25 Winding Way Nepean, Ontario K2C 3H1 October 6, 2010 110-502 Report_1.doc D. J. Halpenny
Trafalgar Road & Lower Base Line Transportation Study Ontario Inc.
 Trafalgar Road & Lower Base Line Transportation Study 1255723 Ontario Inc. Trafalgar Road & Lower Base Line Transportation Study 1255723 Ontario Inc. 1465 Pickering Parkway Suite 200 Pickering ON L1V 7G7
Traffic Impact Study Morgan Road Commerce Park Pasco County, Florida
 Traffic Impact Study Morgan Road Commerce Park Pasco County, Florida Summary Report June 2008 Prepared by: 12909 N 56 th Street # 201 Tampa, FL 33617 Ph: (813) 988-3180 Fax: (813) 343-6854 Morgan Road
Aldridge Transportation Consultants, LLC Advanced Transportation Planning and Traffic Engineering
 Aldridge Transportation Consultants, LLC Advanced Transportation Planning and Traffic Engineering John M.W. Aldridge, PE, PTOE, AICP 1082 Chimney Rock Road Colorado Registered Professional Engineer Highlands
STANDARD LIMITATIONS
 STANDARD LIMITATIONS This report was prepared by MMM Group (MMM) for the account of Spire Construction Inc. (the Client). The disclosure of any information contained in this report is the sole responsibility
Paisley & Whitelaw - Paisley Park OPA / ZBA for Mixed Density Residential Use
 Paisley & Whitelaw - Paisley Park OPA / ZBA for Mixed Density Residential Use Transportation Impact Study City of Guelph Prepared for: Armel Corporation August 2018 Table of Contents 1 Introduction...
2.0 Development Driveways. Movin Out June 2017
 Movin Out June 2017 1.0 Introduction The proposed Movin Out development is a mixed use development in the northeast quadrant of the intersection of West Broadway and Fayette Avenue in the City of Madison.
APPENDIX G. Traffic Data
 APPENDIX G Traffic Data HCM Signalized Intersection Capacity Analysis 2: Duanesburg Road & I-88 Ramps 10/7/2004 Movement EBL EBT EBR WBL WBT WBR NBL NBT NBR SBL SBT SBR Lane Configurations Ideal Flow (vphpl)
Traffic Analysis for Bon Air Bridge Mitigation Magnolia Storm Water Quality Project
 Memo To: Paul DiDonato, ATI Architects and Engineers From: David Parisi, PE and Ashley Tam, EIT Date: February 23, 216 Subject: Traffic Analysis for Bon Air Bridge Mitigation Magnolia Storm Water Quality
Half Moon Bay North Apartment Block Transportation Impact Assessment. Full Report. March 15, Prepared for: Mattamy Homes.
 Half Moon Bay North Apartment Block Transportation Impact Assessment Full Report March 15, 2018 Prepared for: Mattamy Homes Prepared by: Stantec Consulting Ltd. Table of Contents 1.0 SCREENING... 1 1.1
RICHMOND OAKS HEALTH CENTRE 6265 PERTH STREET OTTAWA, ONTARIO TRANSPORTATION BRIEF. Prepared for: Guycoki (Eastern) Limited.
 Limited.") RICHMOND OAKS HEALTH CENTRE 6265 PERTH STREET OTTAWA, ONTARIO TRANSPORTATION BRIEF Prepared for: Guycoki (Eastern) Limited June 16, 2016 116-638 Brief_1.doc D. J. Halpenny & Associates Ltd. Consulting
RICHMOND OAKS HEALTH CENTRE 6265 PERTH STREET OTTAWA, ONTARIO TRANSPORTATION BRIEF Prepared for: Guycoki (Eastern) Limited June 16, 2016 116-638 Brief_1.doc D. J. Halpenny & Associates Ltd. Consulting