June 21, Mr. Jeff Mark The Landhuis Company 212 North Wahsatch Avenue, Suite 301. Colorado Springs, CO 80903
|
|
|
- David Patrick
- 6 years ago
- Views:
Transcription
1
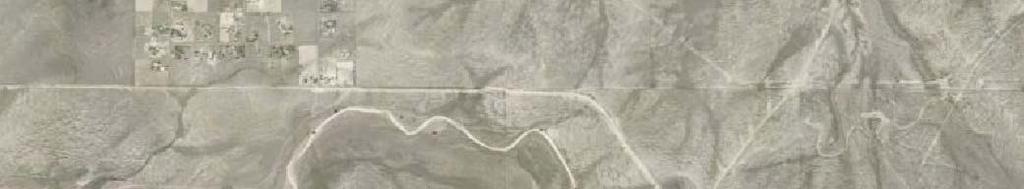
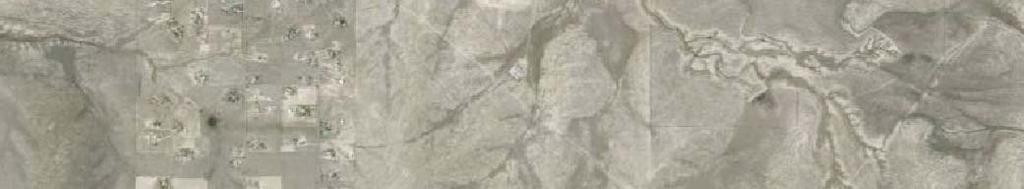
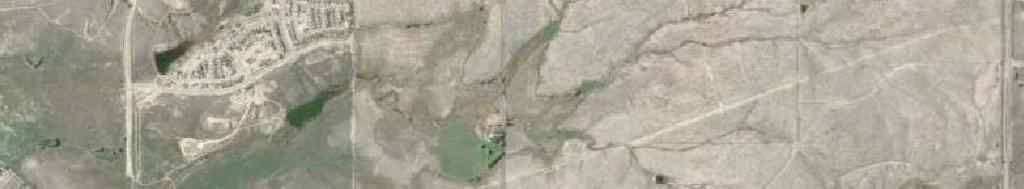
2 LSC TRANSPORTATION CONSULTANTS, INC. 545 East Pikes Peak Avenue, Suite 210 Colorado Springs, CO (719) FAX (719) Website: June 21, 2017 Mr. Jeff Mark The Landhuis Company 212 North Wahsatch Avenue, Suite 301 Colorado Springs, CO Dear Mr. Mark: RE: Carriage Meadows South El Paso County, Colorado Updated Traffic Impact and Access Analysis LSC # LSC Transportation Consultants, Inc. has prepared this updated traffic impact analysis for the 234- lot Carriage Meadows South residential development to be located south of Fontaine Boulevard and east of Marksheffel Road within the Lorson Ranch development in El Paso County, Colorado. The site location is shown on Figure 1. REPORT CONTENTS The report contains the following: $ Recent/current street and traffic conditions adjacent to and in the vicinity of the site including the street widths, lane geometries, traffic controls, posted speed limits, street classification, etc. $ Existing traffic volumes at the key intersections in the vicinity of the site and estimates of short-term and 2040 background traffic volumes. $ The projected average weekday and peak-hour vehicle-trips to be generated by the site. $ The assignment of the projected trips to the adjacent street system. $ The resulting short-term and 2040 total traffic volumes on the street system. $ The resulting traffic impacts. The traffic impacts have been quantified by determining the future levels of service at the intersections of Marksheffel Road/Lorson Boulevard, Marksheffel Road/Fontaine Boulevard, the proposed street connection to Fontaine Boulevard, and the proposed site access point intersections on Lorson Boulevard. $ Recommendations for street functional classification, the Lorson Boulevard intersections, traffic controls, and auxiliary turn lanes.
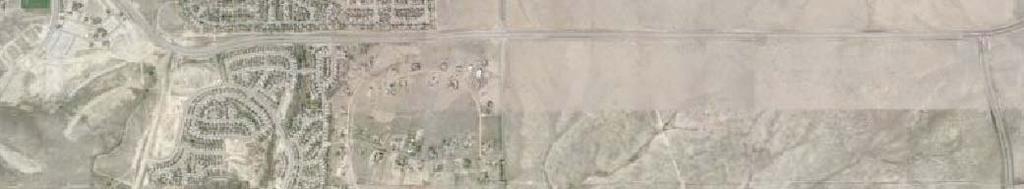
3 Mr. Jeff Mark Page 2 June 21, 2017 Carriage Meadows South Updated Traffic Impact and Access Analysis SITE DEVELOPMENT AND LAND USE The Carriage Meadows South site is planned to be developed with 234 lots for single-family homes. A street connection is proposed to Fontaine Boulevard about 1,080 feet east of Marksheffel Road. Staff has indicated this street connection will require a deviation to the El Paso County Engineering Criteria Manual. A deviation request has been prepared and included with this resubmittal. Public street access points to the future Lorson Boulevard are planned at about 900 and 1,900 feet east of Marksheffel Road. The site plan is shown in Figure 2. ROADWAY AND TRAFFIC CONDITIONS Area Roadways Figure 1 shows the roadways in the vicinity of the site. The major roadways are identified below, followed by a brief description of each. $ Marksheffel Road extends north from the Link Road/C&S Road intersection in Fountain, Colorado to north of Woodmen Road. Marksheffel Road is shown as a future four-lane Expressway on the County Major Transportation Corridors Plan (MTCP). The posted speed limit on Marksheffel Road at Fontaine Boulevard is 45 miles per hour (mph). The PPRTA is currently upgrading Marksheffel Road between Mesa Ridge Parkway and Bradley Road. Road construction is underway. This includes intersection improvements at the Fontaine Boulevard intersection. $ Fontaine Boulevard is designated as a four-lane Urban Principal Arterial from Marksheffel Road east to Stingray Lane and has been constructed as such. The applicant will be dedicating 130 feet of right-of-way east of Stingray Lane for a future four-lane Principal Arterial. The north half-section will be constructed as development progresses east. The section west of Marksheffel is shown on the Major Transportation Corridors Plan as a two-lane Minor Arterial. The cross section from Marksheffel to Cottonwood Grove Drive has been constructed as a mix of rural and urban cross sections and the section between Cottonwood Grove Drive and Powers is a rural two-lane roadway section. The posted speed limit on Fontaine Boulevard is 35 mph just east of (and a short distance west of) Marksheffel Road. The speed limit increases to 45 mph just east of the bridge over Jimmy Camp Creek. $ Lorson Boulevard is a planned continuous roadway that will extend from Marksheffel Road about one-half mile south of Fontaine Boulevard east across both Jimmy Camp Creek and the East Tributary. Lorson Boulevard will be classified as an Urban Non-Residential Collector Street. The street width will be modified for a 44-foot street width rather than the standard 52-foot street width per the approved deviation. In the short term, Lorson Boulevard is planned to extend through this project, across Jimmy Camp Creek to Stingray Lane.
4 Mr. Jeff Mark Page 3 June 21, 2017 Carriage Meadows South Updated Traffic Impact and Access Analysis Existing Traffic Conditions Figure 3 shows the recent traffic volumes at the intersection of Marksheffel Road/Fontaine Boulevard. The traffic volumes were based on traffic counts conducted by LSC in March The traffic count reports are attached. Existing Levels of Service Level of service (LOS) is a quantitative measure of the level of congestion or delay at an intersection. Level of service is indicated on a scale from A to F. LOS A represents control delay of less than 10 seconds for unsignalized and signalized intersections. LOS F represents control delay of more than 50 seconds for unsignalized intersections and more than 80 seconds for signalized intersections. Table 1 shows the level of service delay ranges. Table 1 Intersection Levels of Service Delay Ranges Level of Service Signalized Intersections Average Control Delay (seconds per vehicle) V/C (1) Unsignalized Intersections Average Control Delay (seconds per vehicle) (2) A 10.0 sec or less less than sec or less B sec sec C sec sec D sec sec E sec sec F 80.1 sec or more 1.00 and greater 50.1 sec or more (1) Source: Transportation Research Circular 212 (2) For unsignalized intersections if V/C ratio is greater than 1.0 the level of service is LOS F regardless of the projected average control delay per vehicle. The intersection of Marksheffel/Fontaine was analyzed to determine the existing levels of service using Synchro. Figure 3 shows the level of service analysis results. As shown on the figure all movements this intersection are currently operating at a level of service C or better during the peak hours. The level of service (LOS) reports are attached. SHORT-TERM (YEAR 2020) BACKGROUND TRAFFIC Background traffic is the traffic estimated to be on the roadways without the Carriage Meadows South traffic. Background traffic includes the existing traffic and increases in through traffic on Marksheffel Road due to both regional growth and the extension of Mesa Ridge Parkway east to Marksheffel Road. The portion of the existing traffic volumes were also assumed to be rerouted
5 Mr. Jeff Mark Page 4 June 21, 2017 Carriage Meadows South Updated Traffic Impact and Access Analysis due to the extension of Mesa Ridge Parkway east to Marksheffel Road. A portion of the existing traffic that currently travels to and from the west on Fontaine Boulevard was assumed to shift to travel to and from the south on Marksheffel Road to this new connection. The short-term background traffic also includes additional traffic generated by buildout of the residential portion of Lorson Ranch subdivisions north of Lorson Boulevard between Jimmy Camp Creek and the East Tributary and the Carriage Meadows North subdivision located north of Fontaine Boulevard and east of Marksheffel Road but assumes zero traffic for parcels east of the east tributary and zero traffic generated by Carriage Meadows South. The short-term background volumes assume Lorson Boulevard has been extended across and east of Jimmy Camp Creek to Stingray Lane. A portion of the existing traffic was assumed to be rerouted to use this new connection. Note: This scenario assuming a new bridge across Jimmy Camp Creek prior to any new subdivisions after Carriage Meadows South has been carried through from earlier Carriage Meadows reports, however as noted in the recently completed Lorson East report, another potential scenario would be development of dwelling units in Lorson Ranch East until the dwelling unit cap is reached prior to the construction of the bridge over Jimmy Camp Creek. Under the scenario in the Lorson Ranch East report, the bridge over the East Tributary would be constructed before the bridge over the main channel of Jimmy Camp Creek. The short-term background traffic volumes are shown in Figure BACKGROUND TRAFFIC Figure 5a shows the projected 2040 background traffic volumes. The 2040 background traffic volumes are based on estimates of traffic projected to be generated at buildout of the Lorson Ranch Sketch Plan and traffic volumes shown in the Marksheffel Road South Corridor Preservation Plan dated July 2014.The 2040 background volumes assume Lorson Boulevard has been extended east of Jimmy Camp Creek and the East Tributary. Figure 5b shows the 2040 lane geometry and projected level of service for the intersections of Marksheffel/Lorson, Marksheffel/Fontaine and Fontaine/Carriage Meadows. TRIP GENERATION Estimates of the traffic volumes expected to be generated by the site have been made using the nationally published trip generation rates found in Trip Generation, 9 th Edition, 2012 by the Institute of Transportation Engineers (ITE). Table 1 shows the results of the trip generation estimates. As shown in Table 2, the site could be expected to generate about 2,228 new vehicle-trips on the average weekday, with about 1,114 vehicles entering and 1,114 vehicles exiting in a 24-hour period. During the morning peak hour, which generally occurs for one hour between 6:30 and 8:30 a.m., about 44 vehicles would enter and 132 vehicles would exit the site. During the afternoon peak hour, which generally occurs for one hour between 4:30 and 6:30 p.m., about 147 vehicles would enter and 87 vehicles would exit the site.
6 Mr. Jeff Mark Page 5 June 21, 2017 Carriage Meadows South Updated Traffic Impact and Access Analysis TRIP DISTRIBUTION AND ASSIGNMENT The directional distribution of the site-generated traffic volumes on the street and roadway system serving the site is one of the most important factors in determining the site=s traffic impacts. Figure 6 shows the external trip distribution estimates (external to Lorson Ranch). The directional distribution estimates have been based on the location of the site with respect to the regional residential employment, commercial, and activity centers; the land use proposed; the access/roadway connections assumed; and the roadway network system. The directional distribution estimate assumes Mesa Ridge Parkway has been extended east to Marksheffel Road. When the external trip distribution percentages (from Figure 6) are applied to the trip generation estimates (from Table 2), the resulting site-generated traffic volumes can be determined. Figures 7 and 8 show the short-term and long-term site-generated traffic volume estimates, respectively. The short-term site-generated traffic volumes assume all trips generated by Carriage Meadows South have origins and destinations outside of Lorson Ranch. The long-term site-generated volumes assume a portion of the trips will travel within the Lorson Ranch Development to and from the planned commercial areas to be located near the intersection of Carriage Meadows Drive/Fontaine Boulevard and the planned school site located north of Fontaine Boulevard and east of the east tributary. The number of vehicle-trips assigned within the Lorson Ranch development were based on the internal trip estimates shown in Table 2 of the Lorson Ranch Sketch Plan Traffic Technical Memorandum by LSC dated April 15, Internal trips from this site are shown in Table 2. PROJECTED TOTAL TRAFFIC Figure 9a shows the short-term (year 2020) total traffic volumes. These short-term volumes are the sum of the short-term background traffic volumes (from Figure 4) plus the short-term sitegenerated traffic volumes (from Figure 7). Figure 10a shows the 2040 total traffic volumes. These 2040 total traffic volumes are the sum of the 2040 background traffic volumes (from Figure 5a) plus the long-term site-generated traffic volumes (from Figure 8). Figure 10a also shows the projected 2040 traffic volumes at the intersection of Fontaine/Carriage Meadows assuming the future retail parcels within Lorson Ranch have not been developed by These volumes are for use in the traffic signal warrant analysis for this intersection only. PROJECTED LEVELS OF SERVICE The intersections of Marksheffel/Lorson, Marksheffel Road/Fontaine Boulevard, and Fontaine Boulevard/Carriage Meadows and the two site access points to Lorson Boulevard have been analyzed to determine the projected levels of service for the short-term and 2040 background and total traffic volumes based on the signalized method of analysis from Synchro and the unsignalized method of analysis procedures outlined in the Highway Capacity Manual, 2010 Edition by the Transportation Research Board. The level of service reports are attached. The results of the analysis are shown in Figures 4, 5b, 9b and 10b.
7 Mr. Jeff Mark Page 6 June 21, 2017 Carriage Meadows South Updated Traffic Impact and Access Analysis Figure 9b shows the short-term lane geometry and projected level of service for the intersections of Marksheffel/Lorson, Marksheffel/Fontaine, Fontaine/Carriage Meadows, and the site access points to Lorson Boulevard. Figure 10b shows the 2040 lane geometry and projected level of service for the intersections of Marksheffel/Lorson, Marksheffel/Fontaine, Fontaine/Carriage Meadows, and the site access points to Lorson Boulevard. Marksheffel/Fontaine The signal-controlled Marksheffel Road/Fontaine Boulevard intersection is projected to continue to operate at a level of service D overall or better based on the short-term and 2040 background and total traffic conditions. Marksheffel/Lorson Based on the projected short-term total traffic volumes all movements at the intersection of Marksheffel/Lorson are projected to operate at LOS C or better during the peak hours as a Stopsign-controlled intersection (Stop-sign on the westbound approach). By 2040, it was assumed that this intersection would be signal controlled. As a signalized intersection all movements are projected to operate at LOS D or better during the peak hours based on the projected 2040 background and total traffic volumes. Fontaine/Carriage Meadows Based on the projected short-term total traffic volumes all movements at the intersection of Fontaine/Carriage Meadows are projected to operate at LOS C or better during the peak hours as a two-way Stop-sign-controlled intersection. By 2040, it was assumed that this intersection would be signal controlled. As a signalized intersection all movements are projected to operate at LOS D or better during the peak hours based on the projected 2040 background and total traffic volumes. Lorson Boulevard Site Access Points The proposed site access points to Lorson Boulevard are projected to operate at level of service B or better as Stop-sign-controlled intersections based on the projected short-term total traffic volumes. By 2040 the northbound approaches at both access points are projected to operate at LOS E during the afternoon peak hour. TRAFFIC SIGNAL WARRANT ANALYSIS Lorson Boulevard/Fontaine Boulevard The intersection of Marksheffel/Lorson was analyzed to determine if a Four-Hour Vehicular Volume Traffic Signal Warrant threshold would be reached or exceeded based on the projected short-term morning and afternoon peak-hour total traffic volumes. The results of the analysis are
8 Mr. Jeff Mark Page 7 June 21, 2017 Carriage Meadows South Updated Traffic Impact and Access Analysis shown in Figure 11. The traffic volumes shown are based on the short-term total traffic volumes shown in Figure 9a. The minor approach volumes were assumed to include the westbound leftturn movements only. As shown in the figure, the thresholds for a Four-Hour Vehicular Volume Traffic Signal Warrant are projected to be exceeded based on the morning and afternoon peak hours. This analysis using the peak hours is intended to provide an indication that a warrant may be met or is close to being met. In order for a Four-Hour Traffic Signal Warrant to be satisfied, the volume threshold would need to be met for two additional hours of the day. For example, the fourhour warrant would be satisfied with the volume thresholds met for one hour in the morning, two hours (instead of the one-hour peak) during the afternoon peak period, and an hour during the midafternoon. Figure 11 also shows the projected short-term peak-hour volumes under another potential scenario presented in the recently submitted Lorson Ranch East traffic impact study. Under this scenario the bridge over the East Tributary would be constructed before the bridge over the main channel of Jimmy Camp Creek. The short-term volumes on the minor approach of the intersection of Marksheffel/Lorson for this scenario include traffic projected to be generated by Carriage Meadows South and the future townhomes to be located south of Fontaine Boulevard and east of Carriage Meadows Drive only. As shown in Figure 11, the thresholds for a Four-Hour Vehicular Volume Traffic Signal Warrant are projected to be met for the morning peak hour only under the scenario where Lorson Boulevard is not constructed across the main channel of Jimmy Camp Creek. The afternoon peak hour is just above the minimum 80-vehicle-per-hour threshold. It is unlikely that three other hours could be found that would meet the threshold if Lorson Boulevard is not extended across the Jimmy Camp Creek main channel. Fontaine Boulevard/Carriage Meadows South The intersection of Fontaine/Carriage Meadows was analyzed to determine if a Four-Hour Vehicular Volume Traffic Signal Warrant threshold would be reached or exceeded based on the projected 2040 morning and afternoon peak-hour total traffic volumes with and without development of the retail parcels within the Lorson Ranch development. The results of the analysis are shown in Figure 12. The traffic volumes shown are based on the 2040 total traffic volumes shown in Figure 10a. The minor approach volumes were assumed to include the northbound leftturn movements, the northbound through movements, and fifty percent of the northbound rightturn movements. As shown in the figure, the thresholds for a Four-Hour Vehicular Volume Traffic Signal Warrant are only projected to be exceeded based on the morning and afternoon peak hours once the commercial parcel southwest of the intersection of Fontaine/Carriage Meadows is developed. QUEUING A queuing analysis was performed using Synchro/SimTraffic to determine the vehicle queue lengths that could be expected at the site access points to Lorson Boulevard. The projected 2040 morning and afternoon peak-hour traffic volumes were used in the model. The simulation was run five times. The queuing report is attached.
9 Mr. Jeff Mark Page 8 June 21, 2017 Carriage Meadows South Updated Traffic Impact and Access Analysis The results of the queuing analysis show that the maximum southbound queue length is about 52 feet long at the east access point and 63 feet at the west access point. There is about 100 feet of storage available between Lorson Boulevard and the first internal street (Becksworth Drive) at both the east and west intersections. LORSON BOULEVARD FUNCTIONAL CLASSIFICATION AND CROSS SECTION Lorson Boulevard will be classified as an Urban Non-Residential Collector Street. The street width will be modified for a 44-foot-wide street rather than the standard 52-foot-wide street per the approved deviation. The projected 2040 total daily traffic volume on Lorson Boulevard just east of Marksheffel Road is 12,880 vehicles per day. This volume could be accommodated by a threelane cross section (one through lane in each direction with a center two-way left-turn lane and right-turn lanes where warranted). The striped center turn lane would be 12 feet wide. The through lanes would be 14 feet wide (exclusive of curb and gutter). Travel lanes would be for shared use (bicycles). RECOMMENDED INTERNAL STREET CLASSIFICATIONS Figure 13 shows the estimated average weekday traffic volumes and recommended street classifications for the Carriage Meadows South internal streets and the street connection to the north to Fontaine Boulevard. TRAFFIC SIGNAL ESCROW PERCENTAGES/AMOUNTS Lorson Boulevard/Fontaine Boulevard As shown in Figure 11, the intersection of Marksheffel/Lorson is likely to meet a traffic signal warrant based on the short-term total traffic volumes, however, those volumes assume a new bridge across Jimmy Camp Creek prior to any new subdivisions after Carriage Meadows South. As noted in the recently completed Lorson East report, another potential scenario would be development of dwelling units in Lorson Ranch East until the dwelling unit cap is reached prior to the construction of the bridge over Jimmy Camp Creek. Under this scenario a traffic signal is not projected to be warranted at the intersection of Lorson/Fontaine in the short-term. The need for a traffic signal and the escrow amounts towards that signal should be evaluated once the timing of the bridge construction is determined. Fontaine Boulevard/Carriage Meadows South Table 3 shows the projected total traffic volumes on the minor approach volumes at the intersection of Fontaine/Carriage Meadows by development at the time a traffic signal will likely be warranted. This analysis assumes buildout of all of the residential areas of Lorson Ranch, development of the school parcel, and development of the retail parcel southwest of the intersection of Carriage Meadows Drive/Fontaine Boulevard only. The minor approach volumes were assumed to include the northbound and southbound left-turn and through movements plus 50 percent of the right-turn movements. As shown in Table 3, the Carriage Meadows South development is projected to
10 Mr. Jeff Mark Page 9 June 21, 2017 Carriage Meadows South Updated Traffic Impact and Access Analysis contribute about 18.4 percent of the traffic on the northbound and southbound approaches to the intersection of Fontaine Boulevard/Carriage Meadows Drive. Assuming a total signal cost of $300,000, a fair share contribution towards a future signal at this intersection would be $55,200.The timing of a future traffic signal at Fontaine/Carriage Meadows and the escrow amounts towards that signal should be reevaluated with the development of the retail parcel southwest the intersection and/or development of the multi-family residential development southeast of the intersection. CONCLUSIONS AND RECOMMENDATIONS Trip Generation $ The Carriage Meadows South site is expected to generate about 2,228 new vehicle-trips on the average weekday, with about 1,114 vehicles entering and 1,114 vehicles exiting in a 24- hour period. During the morning peak hour, which generally occurs for one hour between 6:30 and 8:30 a.m., about 44 vehicles would enter and 132 vehicles would exit the site. During the afternoon peak hour, which generally occurs for one hour between 4:30 and 6:30 p.m., about 147 vehicles would enter and 87 vehicles would exit the site. Projected Levels of Service $ The signal-controlled Marksheffel Road/Fontaine Boulevard intersection is projected to continue to operate at level of service D or better based on the short-term and 2040 background and total traffic conditions. $ Based on the projected short-term total traffic volumes all movements at the intersection of Marksheffel/Lorson are projected to operate at LOS C or better during the peak hours as a two-way Stop-sign-controlled intersection. By 2040, it was assumed that this intersection would be signal controlled. As a signalized intersection all movements are projected to operate a LOS D or better during the peak hours based on the projected 2040 background and total traffic volumes. $ Based on the projected short-term total traffic volumes all movements at the intersection of Fontaine/Carriage Meadows are projected to operate at a LOS C or better during the peak hours as a two-way Stop-sign-controlled intersection. By 2040, it was assumed that this intersection would be signal controlled. As a signalized intersection all movements are projected to operate at LOS D or better during the peak hours based on the projected 2040 background and total traffic volumes. $ The proposed site access points to Lorson Boulevard are projected to operate at level of service B or better as Stop-sign-controlled intersections based on the projected short-term total traffic volumes. By 2040 the northbound approaches at both access points are projected to operate at LOS E during the afternoon peak hour. The traffic signal at the intersection of Marksheffel/Lorson will likely help to create gaps to help these movements occur more easily.
11 Mr. Jeff Mark Page 10 June 21, 2017 Carriage Meadows South Updated Traffic Impact and Access Analysis Auxiliary Turn Lanes Lorson Boulevard/Marksheffel Road $ Based on the projected short-term total traffic volumes a northbound right-turn deceleration lane should be constructed on Marksheffel Road approaching Lorson Boulevard. This lane should be 290 feet long plus a 240-foot taper. $ Marksheffel Road should be restriped to provide a dedicated southbound left-turn lane approaching Lorson Boulevard. This lane should be 440 feet long plus a 240-foot taper. Fontaine/Carriage Meadows $ There is currently adequate pavement width for a continuous right-turn acceleration/ deceleration lane on Fontaine Boulevard between Marksheffel Road and Carriage Meadows Drive. The section of Fontaine Boulevard just west of Carriage Meadows Boulevard will need to be restriped with this development. $ There is an existing 325-foot-long westbound left-turn lane on Fontaine Boulevard approaching Carriage Meadows Drive. This turn lane will meet the criteria contained in the ECM based on a design speed of 50 mph for Fontaine Boulevard and the projected 2040 total westbound left-turn volume at this intersection. Lorson Boulevard Access Points $ A center striped two-way left-turn lane will be provided on Lorson Boulevard. This will provide left-turn lanes for the access points. $ Right-turn deceleration lanes would be not required on Lorson Boulevard approaching either of the site access points. $ ECM-standard intersection sight distance at these access point intersections should be initially provided and maintained across the inside of the horizontal curves. Traffic Signal Escrow Percentages/Amounts $ Please refer to the above section for calculated fair-share amounts to be escrowed for a future traffic signal at Fontaine/Carriage Meadows. $ The fair-share amounts towards a future traffic signal at Marksheffel/Lorson Boulevard should be calculated once the timing of the construction of a bridge over the main channel of the Jimmy Camp is determined. Street Classification
12 Mr. Jeff Mark Page 11 June 21, 2017 Carriage Meadows South Updated Traffic Impact and Access Analysis $ Figure 13 presents the recommended street classification for Carriage Meadows South. * * * * * Please contact me if you have any questions or need further assistance. Sincerely, LSC TRANSPORTATION CONSULTANTS, INC. By Jeffrey C. Hodsdon, P.E., PTOE Principal JCH:KDF:bjwb Enclosures: Tables 2 and 3 Figures 1-13 Traffic Count Reports Level of Service Reports Queuing Reports
13 Table 2 Trip Generation Estimate Carriage Meadows Internal Trips Trip Generation Rates (1) Total Trips Generated With Long-Term Buildout of Lorson Ranch Total External Trips Generated Land Land Trip Average Morning Afternoon Average Morning Afternoon Internal Average Morning Afternoon Average Morning Afternoon Use Use Generation Weekday Peak Hour Peak Hour Weekday Peak Hour Peak Hour Trips Weekday Peak Hour Peak Hour Weekday Peak Hour Peak Hour Code Description Units Traffic In Out In Out Traffic In Out In Out (%) Traffic In Out In Out Traffic In Out In Out 210 Single-Family Detached Housing 234 DU (2) , % , Notes: (1) Source: "Trip Generation, 9th Edition, 2012 " by the Institute of Transportation Engineers (ITE) (2) DU = dwelling unit Source: LSC Transportation Consultants, Inc.
14 AM Table 3 Carriage Meadows/Fontaine Future Traffic Signal Contributions Carriage Meadows TOTAL (Includes 50% of RT) Development NB LT NB TH NB RT SB LT SB TH SB RT veh/hr % Carraige Meadows South % Carriage Meadows North % Future Townhomes SE Carriage % Meadows/Fontaine 16 South Retail % Carraige Meadows South % Carriage Meadows North % PM Future Townhomes SE Carriage Meadows/Fontaine 3.5% South Retail % Carraige Meadows South % Carriage Meadows North % AM + PM Future Townhomes SE Carriage % Meadows/Fontaine South Retail % Source: LSC Transportation Consultants, Inc.

15
16
17
18
19
20
21
22
23
24
25
26
27
28
29
30
31
32
33
34
35
36
37
38
39 LSC Transportation Consultants, Inc. Marksheffel Rd From North LSC Transportation Consultants, Inc. 545 E. Pikes Peak Ave., #210 Colorado Springs, CO (719) Groups Printed- Unshifted Fontaine Blvd From East File Name : Marksheffel - Fontaine Blvd AM Site Code : Start Date : 03/21/2017 Page No : 1 Marksheffel Rd From South Fontain Blvd From West Start Time Right Thru Left Peds Right Thru Left Peds Right Thru Left Peds Right Thru Left Peds Int. Total Factor :30 AM :45 AM Total :00 AM :15 AM :30 AM :45 AM Total :00 AM :15 AM Grand Total Apprch % Total %
40 LSC Transportation Consultants, Inc. 545 E. Pikes Peak Ave., #210 Colorado Springs, CO (719) File Name : Marksheffel - Fontaine Blvd AM Site Code : Start Date : 03/21/2017 Page No : 2 Marksheffel Rd From North Fontaine Blvd From East Start Rig Thr Lef Pe App. Rig Thr Lef Pe Time ht u t ds Total ht u t ds Peak Hour From 06:30 AM to 08:15 AM - Peak 1 of 1 Intersecti on 06:45 AM App. Total Rig ht Marksheffel Rd From South Thr Lef Pe App. u t ds Total Rig ht Thr u Fontain Blvd From West Lef Pe t ds Volume Percent : Volume Peak Factor High Int. 07:00 AM 06:45 AM 07:15 AM 07:30 AM Volume Peak Factor App. Total Int. Total Marksheffel Rd Out In Total Right 92 Thru 39 Left 0 Peds Fontain Blvd Out In Total Left 140 Thru 49 Right 0 Peds 3/21/2017 6:45:00 AM 3/21/2017 7:30:00 AM Unshifted North Right 125 Thru Left Peds Out In Total Fontaine Blvd Left 41 Thru 184 Right 11 Peds Out In Total Marksheffel Rd
41 LSC Transportation Consultants, Inc. Marksheffel Rd From North LSC Transportation Consultants, Inc. 545 E. Pikes Peak Ave., #210 Colorado Springs, CO (719) Groups Printed- Unshifted Fontaine Blvd From East File Name : Marksheffel - Fontaine Blvd PM Site Code : Start Date : 03/20/2017 Page No : 1 Marksheffel Rd From South Fontaine Blvd From West Start Time Right Thru Left Peds Right Thru Left Peds Right Thru Left Peds Right Thru Left Peds Int. Total Factor :00 PM :15 PM :30 PM :45 PM Total :00 PM :15 PM :30 PM :45 PM Total Grand Total Apprch % Total %
42 LSC Transportation Consultants, Inc. 545 E. Pikes Peak Ave., #210 Colorado Springs, CO (719) File Name : Marksheffel - Fontaine Blvd PM Site Code : Start Date : 03/20/2017 Page No : 2 Marksheffel Rd From North Fontaine Blvd From East Start Rig Thr Lef Pe App. Rig Thr Lef Pe Time ht u t ds Total ht u t ds Peak Hour From 04:00 PM to 05:45 PM - Peak 1 of 1 Intersecti on 04:45 PM App. Total Rig ht Marksheffel Rd From South Thr Lef Pe App. u t ds Total Rig ht Fontaine Blvd From West Lef Pe t ds Volume Percent :15 Volume Peak Factor High Int. 05:15 PM 05:15 PM 05:30 PM 04:45 PM Volume Peak Factor Thr u App. Total Int. Total Marksheffel Rd Out In Total Right 139 Thru 90 Left 0 Peds Fontaine Blvd Out In Total Left 344 Thru 64 Right 0 Peds 3/20/2017 4:45:00 PM 3/20/2017 5:30:00 PM Unshifted North Right 49 Thru Left Peds Out In Total Fontaine Blvd Left 31 Thru 79 Right 32 Peds Out In Total Marksheffel Rd
43 Timings Existing Traffic 1: Marksheffel Rd & Fountaine Blvd AM Peak Hour Lane Group EBL EBT EBR WBL WBT WBR NBL NBT NBR SBL SBT SBR Lane Configurations Traffic Volume (vph) Future Volume (vph) Turn Type Perm NA Perm Perm NA Perm Perm NA Perm Perm NA Perm Protected Phases Permitted Phases Detector Phase Switch Phase Minimum Initial (s) Minimum Split (s) Total Split (s) Total Split (%) 33.3% 33.3% 33.3% 33.3% 33.3% 33.3% 66.7% 66.7% 66.7% 66.7% 66.7% 66.7% Yellow Time (s) All-Red Time (s) Lost Time Adjust (s) Total Lost Time (s) Lead/Lag Lead-Lag Optimize? Recall Mode None None None None None None Max Max Max Max Max Max Act Effct Green (s) Actuated g/c Ratio v/c Ratio Control Delay Queue Delay Total Delay LOS C C A C C A A A A A A A Approach Delay Approach LOS C C A A Intersection Summary Cycle Length: 90 Actuated Cycle Length: 79.1 Natural Cycle: 40 Control Type: Semi Act-Uncoord Maximum v/c Ratio: 0.58 Intersection Signal Delay: 18.5 Intersection Capacity Utilization 43.8% Analysis Period (min) 15 Intersection LOS: B ICU Level of Service A Splits and Phases: 1: Marksheffel Rd & Fountaine Blvd 1: Marksheffel Rd & Fountaine Blvd Synchro 8 Report Existing Traffic AM Peak Hour KDF
44 Timings Existing Traffic 1: Marksheffel Rd & Fountaine Blvd PM Peak Hour Lane Group EBL EBT EBR WBL WBT WBR NBL NBT NBR SBL SBT SBR Lane Configurations Traffic Volume (vph) Future Volume (vph) Turn Type Perm NA Perm Perm NA Perm Perm NA Perm Perm NA Perm Protected Phases Permitted Phases Detector Phase Switch Phase Minimum Initial (s) Minimum Split (s) Total Split (s) Total Split (%) 33.3% 33.3% 33.3% 33.3% 33.3% 33.3% 66.7% 66.7% 66.7% 66.7% 66.7% 66.7% Yellow Time (s) All-Red Time (s) Lost Time Adjust (s) Total Lost Time (s) Lead/Lag Lead-Lag Optimize? Recall Mode None None None None None None Max Max Max Max Max Max Act Effct Green (s) Actuated g/c Ratio v/c Ratio Control Delay Queue Delay Total Delay LOS C C A C C A A A A A A A Approach Delay Approach LOS C C A A Intersection Summary Cycle Length: 90 Actuated Cycle Length: 78.1 Natural Cycle: 40 Control Type: Semi Act-Uncoord Maximum v/c Ratio: 0.59 Intersection Signal Delay: 18.3 Intersection Capacity Utilization 38.9% Analysis Period (min) 15 Intersection LOS: B ICU Level of Service A Splits and Phases: 1: Marksheffel Rd & Fountaine Blvd 1: Marksheffel Rd & Fountaine Blvd Synchro 8 Report Existing Traffic PM Peak Hour KDF
45 Timings 2020 Background Traffic 1: Marksheffel Rd & Fountaine Blvd AM Peak Hour Lane Group EBL EBT EBR WBL WBT WBR NBL NBT NBR SBL SBT SBR Lane Configurations Traffic Volume (vph) Future Volume (vph) Turn Type pm+pt NA Perm pm+pt NA Perm Perm NA Perm Perm NA Perm Protected Phases Permitted Phases Detector Phase Switch Phase Minimum Initial (s) Minimum Split (s) Total Split (s) Total Split (%) 11.1% 28.9% 28.9% 15.6% 33.3% 33.3% 55.6% 55.6% 55.6% 55.6% 55.6% 55.6% Yellow Time (s) All-Red Time (s) Lost Time Adjust (s) Total Lost Time (s) Lead/Lag Lead Lag Lag Lead Lag Lag Lead-Lag Optimize? Yes Yes Yes Yes Yes Yes Recall Mode None None None None None None Max Max Max Max Max Max Act Effct Green (s) Actuated g/c Ratio v/c Ratio Control Delay Queue Delay Total Delay LOS C C A D C A A A A A A A Approach Delay Approach LOS C C A A Intersection Summary Cycle Length: 90 Actuated Cycle Length: 75.8 Natural Cycle: 40 Control Type: Semi Act-Uncoord Maximum v/c Ratio: 0.76 Intersection Signal Delay: 18.7 Intersection Capacity Utilization 49.7% Analysis Period (min) 15 Intersection LOS: B ICU Level of Service A Splits and Phases: 1: Marksheffel Rd & Fountaine Blvd 1: Marksheffel Rd & Fountaine Blvd Synchro 9 Report 2020 Background Traffic AM Peak Hour KDF
46 HCM 2010 TWSC 2020 Background Traffic 5: Marksheffel Rd & Lorson Blvd AM Peak Hour Intersection Int Delay, s/veh 1 Movement WBL WBR NBT NBR SBL SBT Lane Configurations Traffic Vol, veh/h Future Vol, veh/h Conflicting Peds, #/hr Sign Control Stop Stop Free Free Free Free RT Channelized - None - None - None Storage Length Veh in Median Storage, # Grade, % Peak Hour Factor Heavy Vehicles, % Mvmt Flow Major/Minor Minor1 Major1 Major2 Conflicting Flow All Stage Stage Critical Hdwy Critical Hdwy Stg Critical Hdwy Stg Follow-up Hdwy Pot Cap-1 Maneuver Stage Stage Platoon blocked, % Mov Cap-1 Maneuver Mov Cap-2 Maneuver Stage Stage Approach WB NB SB HCM Control Delay, s HCM LOS B Minor Lane/Major Mvmt NBT NBRWBLn1WBLn2 SBL SBT Capacity (veh/h) HCM Lane V/C Ratio HCM Control Delay (s) HCM Lane LOS - - B A A - HCM 95th %tile Q(veh) : Marksheffel Rd & Lorson Blvd Synchro 9 Report 2020 Background Traffic AM Peak Hour KDF
47 HCM 2010 TWSC 2020 Background Traffic 8: Fountaine Blvd & Carriage Meadows AM Peak Hour Intersection Int Delay, s/veh 1 Movement EBL EBT WBT WBR SBL SBR Lane Configurations Traffic Vol, veh/h Future Vol, veh/h Conflicting Peds, #/hr Sign Control Free Free Free Free Stop Stop RT Channelized - None - None - None Storage Length Veh in Median Storage, # Grade, % Peak Hour Factor Heavy Vehicles, % Mvmt Flow Major/Minor Major1 Major2 Minor2 Conflicting Flow All Stage Stage Critical Hdwy Critical Hdwy Stg Critical Hdwy Stg Follow-up Hdwy Pot Cap-1 Maneuver Stage Stage Platoon blocked, % Mov Cap-1 Maneuver Mov Cap-2 Maneuver Stage Stage Approach EB WB SB HCM Control Delay, s HCM LOS B Minor Lane/Major Mvmt EBL EBT WBT WBR SBLn1 SBLn2 Capacity (veh/h) HCM Lane V/C Ratio HCM Control Delay (s) HCM Lane LOS A A B HCM 95th %tile Q(veh) : Fountaine Blvd & Carriage Meadows Synchro 9 Report 2020 Background Traffic AM Peak Hour KDF
48 Timings 2020 Background Traffic 1: Marksheffel Rd & Fountaine Blvd PM Peak Hour Lane Group EBL EBT EBR WBL WBT WBR NBL NBT NBR SBL SBT SBR Lane Configurations Traffic Volume (vph) Future Volume (vph) Turn Type pm+pt NA Perm pm+pt NA Perm Perm NA Perm Perm NA Perm Protected Phases Permitted Phases Detector Phase Switch Phase Minimum Initial (s) Minimum Split (s) Total Split (s) Total Split (%) 11.1% 28.9% 28.9% 15.6% 33.3% 33.3% 55.6% 55.6% 55.6% 55.6% 55.6% 55.6% Yellow Time (s) All-Red Time (s) Lost Time Adjust (s) Total Lost Time (s) Lead/Lag Lead Lag Lag Lead Lag Lag Lead-Lag Optimize? Yes Yes Yes Yes Yes Yes Recall Mode None None None None None None Max Max Max Max Max Max Act Effct Green (s) Actuated g/c Ratio v/c Ratio Control Delay Queue Delay Total Delay LOS B D A C C A A A A B B A Approach Delay Approach LOS C C A A Intersection Summary Cycle Length: 90 Actuated Cycle Length: 80.7 Natural Cycle: 40 Control Type: Semi Act-Uncoord Maximum v/c Ratio: 0.55 Intersection Signal Delay: 16.0 Intersection Capacity Utilization 45.4% Analysis Period (min) 15 Intersection LOS: B ICU Level of Service A Splits and Phases: 1: Marksheffel Rd & Fountaine Blvd 1: Marksheffel Rd & Fountaine Blvd Synchro 9 Report 2020 Background Traffic PM Peak Hour KDF
49 HCM 2010 TWSC 2020 Background Traffic 5: Marksheffel Rd & Lorson Blvd PM Peak Hour Intersection Int Delay, s/veh 0.6 Movement WBL WBR NBT NBR SBL SBT Lane Configurations Traffic Vol, veh/h Future Vol, veh/h Conflicting Peds, #/hr Sign Control Stop Stop Free Free Free Free RT Channelized - None - None - None Storage Length Veh in Median Storage, # Grade, % Peak Hour Factor Heavy Vehicles, % Mvmt Flow Major/Minor Minor1 Major1 Major2 Conflicting Flow All Stage Stage Critical Hdwy Critical Hdwy Stg Critical Hdwy Stg Follow-up Hdwy Pot Cap-1 Maneuver Stage Stage Platoon blocked, % Mov Cap-1 Maneuver Mov Cap-2 Maneuver Stage Stage Approach WB NB SB HCM Control Delay, s HCM LOS B Minor Lane/Major Mvmt NBT NBRWBLn1WBLn2 SBL SBT Capacity (veh/h) HCM Lane V/C Ratio HCM Control Delay (s) HCM Lane LOS - - B A A - HCM 95th %tile Q(veh) : Marksheffel Rd & Lorson Blvd Synchro 9 Report 2020 Background Traffic PM Peak Hour KDF
50 HCM 2010 TWSC 2020 Background Traffic 8: Fountaine Blvd & Carriage Meadows PM Peak Hour Intersection Int Delay, s/veh 0.9 Movement EBL EBT WBT WBR SBL SBR Lane Configurations Traffic Vol, veh/h Future Vol, veh/h Conflicting Peds, #/hr Sign Control Free Free Free Free Stop Stop RT Channelized - None - None - None Storage Length Veh in Median Storage, # Grade, % Peak Hour Factor Heavy Vehicles, % Mvmt Flow Major/Minor Major1 Major2 Minor2 Conflicting Flow All Stage Stage Critical Hdwy Critical Hdwy Stg Critical Hdwy Stg Follow-up Hdwy Pot Cap-1 Maneuver Stage Stage Platoon blocked, % Mov Cap-1 Maneuver Mov Cap-2 Maneuver Stage Stage Approach EB WB SB HCM Control Delay, s HCM LOS A Minor Lane/Major Mvmt EBL EBT WBT WBR SBLn1 SBLn2 Capacity (veh/h) HCM Lane V/C Ratio HCM Control Delay (s) HCM Lane LOS A A A HCM 95th %tile Q(veh) : Fountaine Blvd & Carriage Meadows Synchro 9 Report 2020 Background Traffic PM Peak Hour KDF
51 Timings 2020 Total Traffic 1: Marksheffel Rd & Fountaine Blvd AM Peak Hour Lane Group EBL EBT EBR WBL WBT WBR NBL NBT NBR SBL SBT SBR Lane Configurations Traffic Volume (vph) Future Volume (vph) Turn Type pm+pt NA Perm pm+pt NA Perm Perm NA Perm Perm NA Perm Protected Phases Permitted Phases Detector Phase Switch Phase Minimum Initial (s) Minimum Split (s) Total Split (s) Total Split (%) 11.1% 28.9% 28.9% 15.6% 33.3% 33.3% 55.6% 55.6% 55.6% 55.6% 55.6% 55.6% Yellow Time (s) All-Red Time (s) Lost Time Adjust (s) Total Lost Time (s) Lead/Lag Lead Lag Lag Lead Lag Lag Lead-Lag Optimize? Yes Yes Yes Yes Yes Yes Recall Mode None None None None None None Max Max Max Max Max Max Act Effct Green (s) Actuated g/c Ratio v/c Ratio Control Delay Queue Delay Total Delay LOS C C A D C A A A A A A A Approach Delay Approach LOS C C A A Intersection Summary Cycle Length: 90 Actuated Cycle Length: 76 Natural Cycle: 40 Control Type: Semi Act-Uncoord Maximum v/c Ratio: 0.76 Intersection Signal Delay: 18.4 Intersection Capacity Utilization 50.4% Analysis Period (min) 15 Intersection LOS: B ICU Level of Service A Splits and Phases: 1: Marksheffel Rd & Fountaine Blvd 2020 Total Traffic Synchro 9 Report AM Peak Hour KDF
Bennett Pit. Traffic Impact Study. J&T Consulting, Inc. Weld County, Colorado. March 3, 2017
 Bennett Pit Traffic Impact Study J&T Consulting, Inc. Weld County, Colorado March 3, 217 Prepared By: Sustainable Traffic Solutions, Inc. http://www.sustainabletrafficsolutions.com/ Joseph L. Henderson,
Weaver Road Senior Housing Traffic Impact Analysis
 Gibson Traffic Consultants, Inc. 2813 Rockefeller Avenue Suite B Everett, WA 9821 425.339.8266 Weaver Road Senior Housing Traffic Impact Analysis Jurisdiction: City of Snohomish January 218 GTC #17-37
 Traffic Analysis For Approved Uses within the St. Lucie West DRI Aldi Port St. Lucie, FL Prepared for: Bohler Engineering, LLC 1000 Corporate Drive Suite 250 Fort Lauderdale, FL 33334 Prepared by: 10795
LOST LAKE CORRIDOR REVIEW
 LOST LAKE CORRIDOR REVIEW Prepared for: Prepared by: Broadview Developments Inc. c/o Westbrook Consulting Watt Consulting Group Our File: 2064.B01 Date: October 31, 2016 TABLE OF CONTENTS 1.0 INTRODUCTION...
Traffic Impact Analysis Update
 Willow Bend Traffic Impact Analysis Update TABLE OF CONTENTS Page I. INTRODUCTION -------------------------------------------------------------------------------------------- 1 II. EXISTING CONDITIONS
APPENDICES. APPENDIX D Synchro Level of Service Output Sheets
 APPENDICES APPENDIX D Synchro Level of Service Output Sheets Lanes, Volumes, Timings NO BUILD 2016 PM 8: 10th St & Thain Rd 10/05/2016 Lane Group NBL NBT NBR SBL SBT SBR SEL SET SER NWL NWT NWR
Sweetwater Landing Traffic Impact Analysis
 Gibson Traffic Consultants, Inc. 8 Rockefeller Avenue Suite B Everett, WA 98 45.9.8 Sweetwater Landing Traffic Impact Analysis Jurisdiction: City of Snohomish February 8 GTC #7-87 Sweetwater Landing Traffic
One Harbor Point Residential
 Residential Gig Harbor, WA Transportation Impact Analysis January 23, 2017 Prepared for: Neil Walter Company PO Box 2181 Tacoma, WA 98401 Prepared by: TENW Transportation Engineering NorthWest 11400 SE
KUM & GO 6400 WESTOWN PARKWAY WEST DES MOINES, IOWA 50266
 KUM & GO #300 PECOS STREET & 88 TH AVENUE THORNTON, COLORADO TRAFFIC IMPACT STUDY REVISION 1 PREPARED FOR KUM & GO 6400 WESTOWN PARKWAY WEST DES MOINES, IOWA 50266 JANUARY 23, 2014 OA PROJECT NO. 013-1721
D & B COMMERCIAL TRAFFIC IMPACT ANALYSIS
 D & B COMMERCIAL TRAFFIC IMPACT ANALYSIS TABLE OF CONTENTS I. Introduction...3 II. Project Description...3 III. Existing Conditions...3 IV. Future Traffic Conditions...8 V. Conclusions and Mitigation...14
Aldridge Transportation Consultants, LLC Advanced Transportation Planning and Traffic Engineering
 Aldridge Transportation Consultants, LLC Advanced Transportation Planning and Traffic Engineering John M.W. Aldridge, PE, PTOE, AICP 1082 Chimney Rock Road Colorado Registered Professional Engineer Highlands
APPENDICES. No Cumulative Impact Project Alternative Traffic Analysis Memorandum (May 2016)
") APPENDICES Appendix T No Cumulative Impact Project Alternative Traffic Analysis Memorandum (May 2016) 661 Bear Valley Parkway EIR March 2017 APPENDICES This page intentionally left blank 661 Bear Valley
APPENDICES Appendix T No Cumulative Impact Project Alternative Traffic Analysis Memorandum (May 2016) 661 Bear Valley Parkway EIR March 2017 APPENDICES This page intentionally left blank 661 Bear Valley
Rockingham Ridge Plaza Commercial Development Halifax Regional Municipality
 Rockingham Ridge Plaza Commercial Development Halifax Regional Municipality Traffic Impact Study Final Draft Report Prepared by: GRIFFIN transportation group inc. 30 Bonny View Drive Fall River, NS B2T
ARVADA TRIANGLE REDEVELOPMENT TRAFFIC IMPACT ANALYSIS
 ARVADA TRIANGLE REDEVELOPMENT TRAFFIC IMPACT ANALYSIS Prepared for: Arvada Urban Renewal Authority 5601 Olde Wadsworth Boulevard, Suite 210 Arvada, Colorado 80002 (720) 898-7062 Prepared by: Felsburg Holt
Date: December 20, Project #:
 To: Craig Rottenberg Long s Jewelers 60A South Avenue Burlington, MA 01803 From: Patrick Dunford, P.E. Senior Project Manager Date: December 20, 2018 Project #: 14416.00 Re: Burlington Mall Proposed Long
10 th Street Residences Development Traffic Impact Analysis
 Gibson Traffic Consultants, Inc. 2813 Rockefeller Avenue Suite B Everett, WA 98201 425.339.8266 10 th Street Residences Development Traffic Impact Analysis Jurisdiction: City of Snohomish September 2018
L1TILE BEARS DAY CARE TRANSPORTATION IMPACT STUDY FORT COLLINS, COLORADO MAY Prepared for:
 L1TILE BEARS DAY CARE TRANSPORTATION IMPACT STUDY FORT COLLINS, COLORADO MAY 2012 Prepared for: Hillside Construction, Inc. 216 Hemlock Street, Suite B Fort Collins, CO 80534 Prepared by: DELICH ASSOCIATES
Ryan Coyne, PE City Engineer City of Rye 1051 Boston Post Road Rye, NY Boston Post Road Realignment and Roundabout Design Report
 March 6, 2015 Ryan Coyne, PE City Engineer City of Rye 1051 Boston Post Road Rye, NY 10580 RE: JMC Project 14108 Boston Post Road Roundabout Boston Post Road and Parsons Street City of Rye, NY Dear Ryan:
MEMO. McCORMICK RANKIN CORPORATION. File FROM: Keyur Shah DATE: February 1, 2010 COPIES: OUR FILE: SUBJECT: TO:
 McCORMICK RANKIN CORPORATION 2655 North Sheridan Way Mississauga, Ontario, L5K 2P8 Tel: (905)823-8500 Fax: (905) 823-8503 E-mail: mrc@mrc.ca Website: www.mrc.ca MEMO TO: File FROM: Keyur Shah DATE: February
Traffic Impact Study Proposed Commercial Development Ballwin, Missouri. Technical Memorandum for Traffic Impact Study
 Traffic Impact Study Proposed Commercial Development Ballwin, Missouri Technical Memorandum for Traffic Impact Study Crawford, Bunte, Brammeier May 1, 2009 MEMORANDUM Date: April 24, 2009 To: From: Subject:
Sugarland Crossing Gwinnett County, Georgia
 Sugarland Crossing Gwinnett County, Georgia S IGNAL W ARRANT A NALYSIS For the Intersection of: Sugarloaf Parkway / Richards Middle School Driveway / Sugarland Crossing Main Site Driveway Prepared for:
Aldridge Transportation Consultants, LLC Advanced Transportation Planning and Traffic Engineering
 Aldridge Transportation Consultants, LLC Advanced Transportation Planning and Traffic Engineering John M.W. Aldridge, PE, PTOE, AICP 1082 Chimney Rock Road Colorado Registered Professional Engineer Highlands
Parking/Traffic Assessment Study
 Brock Road Industrial Mall 985 Brock Road South City of Pickering Parking/Traffic Assessment Study Prepared by: Tranplan Associates, Toronto Toronto 416-670-2005 Sudbury 705-522-0272 Peterborough 705-874-3638
Provide an overview of the development proposal including projected site traffic volumes;
 December 19, 2013 File: 163600935 Attention: Troy Elliott Carl Elliott Limited 15-1831 Robertson Road PO Box 11117 Nepean, Ontario K1H 7T8 Dear Mr. Elliott, Reference: 2235 and 2265 Robertson Road Transportation
830 Main Street Halifax Regional Municipality
 830 Main Street Halifax Regional Municipality Traffic Impact Statement Final Report Prepared by: GRIFFIN transportation group inc. 30 Bonny View Drive Fall River, NS B2T 1R2 www.griffininc.ca Prepared
Table 1 - Land Use Comparisons - Proposed King s Wharf Development. Retail (SF) Office (SF) 354 6,000 10, Land Uses 1
 Office (SF) 354 6,000 10, Land Uses 1") Ref. No. 171-6694 Phase 2 November 23, 217 Mr. David Quilichini, Vice President Fares & Co. Developments Inc. 31 Place Keelson Sales Centre DARTMOUTH NS B2Y C1 Sent Via Email to David@faresinc.com RE:
Ref. No. 171-6694 Phase 2 November 23, 217 Mr. David Quilichini, Vice President Fares & Co. Developments Inc. 31 Place Keelson Sales Centre DARTMOUTH NS B2Y C1 Sent Via Email to David@faresinc.com RE:
APPENDIX A LEVEL OF SERVICE CONCEPTS, ANALYSIS METHODOLOGIES,STANDARDS OF SIGNIFICANCE
 APPENDIX A LEVEL OF SERVICE CONCEPTS, ANALYSIS METHODOLOGIES,STANDARDS OF SIGNIFICANCE Roadway Segment Level of Service Definitions LOS V/C Congestion/Delay Traffic Description (Used for surface streets,
Proposed Pit Development
 July 5, 2017 via email: sam@greenwoodconst.ca CCTA File 114239 Sam Greenwood Greenwood Aggregates 205467 County Road 109 Amaranth, ON L9W 0V1 Re: Proposed Violet Hill Gravel Pit, Town of Mono Traffic Review
Re: Cyrville Road Car Dealership
 1223 Michael Street, Suite 100, Ottawa, ON K1J 7T2 Tel: 613.738.4160 Fax: 613.739.7105 www.delcan.com February 25, 2013 OUR REF: TO3098TOE Mark Motors of Ottawa 611 Montreal Road Ottawa, ON K1K 0T8 Attention:
Re: Residential Development - Ogilvie/Cummings Transportation Overview
 1223 Michael Street, Suite 100, Ottawa, ON K1J 7T2 Tel: 613.738.4160 Fax: 613.739.7105 www.delcan.com March 28, 2012 OUR REF: TO3088TOY Barry J. Hobin & Architects 63 Pamilla Street Ottawa, ON K1S 3K7
DIVISION STREET PLAT TRAFFIC IMPACT ANALYSIS
 DIVISION STREET PLAT TRAFFIC IMPACT ANALYSIS TABLE OF CONTENTS 1. Introduction...3 2. Project Description...3 3. Existing Conditions...3 4. Forecast Traffic Demand and Analysis...12 5. Conclusions and
LATSON INTERCHANGE DEVELOPMENT TRAFFIC STUDIES. Genoa Township, Livingston County, MI
 LATSON INTERCHANGE DEVELOPMENT TRAFFIC STUDIES Genoa Township, Livingston County, MI DRAFT TRAFFIC STUDY FOR I-96 AT LATSON RD INTERCHANGE Livingston County CS 47065 JN 101622C Submitted to: Michigan Department
JOHNSON RANCH RAPID CITY, SOUTH DAKOTA TRAFFIC IMPACT ANALYSIS
 JOHNSON RANCH RAPID CITY, SOUTH DAKOTA TRAFFIC IMPACT ANALYSIS Prepared for: KTM Design Solutions 528 Kansas City Street, Suite 1 Rapid City, SD 57701 Prepared by: Felsburg Holt & Ullevig 6300 South Syracuse
Oakbrook Village Plaza City of Laguna Hills
 Oakbrook Village Plaza City of Laguna Hills Traffic Impact Analysis Prepared by: HDR Engineering 3230 El Camino Real, Suite 200 Irvine, CA 92602 October 2012 Revision 3 D-1 Oakbrook Village Plaza Laguna
Traffic Impact Analysis Farmington Center Village
 Traffic Impact Analysis Farmington Center Village Route 4 (Farmington Avenue) Farmington, Connecticut Prepared for: The Town of Farmington, CT Prepared By: BL Companies Meriden, Connecticut December 2016
MEMORANDUM. Date: November 4, Cheryl Burrell, Pebble Beach Company. Rob Rees, P.E. Inclusionary Housing Transportation Analysis WC
 MEMORANDUM Date: November 4, 2013 To: From: Subject: Cheryl Burrell, Pebble Beach Company Rob Rees, P.E. Inclusionary Housing Transportation Analysis As requested, Fehr & Peers is providing clarification
Barrhaven Honda Dealership. Dealership Drive, Ottawa, ON. Transportation Brief
 Barrhaven Honda Dealership Dealership Drive, Ottawa, ON Transportation Brief Prepared By: NOVATECH Suite 200, 240 Michael Cowpland Drive Ottawa, Ontario K2M 1P6 September, 2015 File: 115136 Ref: R-2015-152
Half Moon Bay North Apartment Block Transportation Impact Assessment. Full Report. March 15, Prepared for: Mattamy Homes.
 Half Moon Bay North Apartment Block Transportation Impact Assessment Full Report March 15, 2018 Prepared for: Mattamy Homes Prepared by: Stantec Consulting Ltd. Table of Contents 1.0 SCREENING... 1 1.1
Alpine Highway to North County Boulevard Connector Study
 Alpine Highway to North County Boulevard Connector Study prepared by Avenue Consultants March 16, 2017 North County Boulevard Connector Study March 16, 2017 Table of Contents 1 Summary of Findings... 1
April 7, Mr. Blake Shutler Compass Homes Development LLC Summit Homes Construction, LLC PO Box 6539 Dillon, CO 80435
 Compass Homes Development LLC Summit Homes Construction, LLC PO Box 6539 Dillon, CO 80435 Re: Trip Generation Comparison West Hills Townhomes Keystone, Colorado FHU Reference No. 116388-01 Dear Mr. Shutler:
BUCKLEY ANNEX REDEVELOPMENT PLAN TRANSPORTATION ANALYSIS ADDENDUM
 BUCKLEY ANNEX REDEVELOPMENT PLAN TRANSPORTATION ANALYSIS ADDENDUM Prepared for: City and County of Denver Prepared by: Contact: Brian Bern, P.E., PTOE 303.572.0200 On Behalf of: Lowry Redevelopment Authority
April Salvation Army Barrhaven Church 102 Bill Leathem Drive Transportation Brief
 April 26 Salvation Army Barrhaven Church 2 Bill Leathem Drive Transportation Brief Salvation Army Barrhaven Church 2 Bill Leathem Drive Transportation Brief prepared for: The Salvation Army 2 Overlea Blvd.
886 March Road McDonald's Transportation Study
 McDonald's Restaurants of Canada Limited March 2013 886 March Road McDonald's Transportation Study Submitted by: HDR Corporation 100 York Boulevard, Suite 300 Richmond Hill, ON L4B 1J8 (905) 882-4100 www.hdrinc.com
Traffic Impact Study. Residences at Bancroft Block 14, Lot 2 Borough of Haddonfield, Camden County, New Jersey
 Traffic Impact Study Residences at Bancroft Block 14, Lot 2 April 30, 2018 REVISED: JANUARY 17, 2019 Prepared For 2 Hopkins Lane, LLC 2701 Renaissance Boulevard King of Prussia, PA 19406 Prepared By Maser
MURRIETA APARTMENTS TRAFFIC IMPACT ANALYSIS CITY OF MURRIETA, CALIFORNIA
 MURRIETA APARTMENTS TRAFFIC IMPACT ANALYSIS CITY OF MURRIETA, CALIFORNIA SEPTEMBER 20, 2012 Prepared for: Golden Eagle Multi-Family Properties, LLC 6201 Oak Canyon Rd., Suite 250 Irvine, CA 92618 Prepared
Ref. No Task 3. April 28, Mr. Cesar Saleh, P. Eng. VP Planning and Design W.M. Fares Group th
 Ref. No. 151-00564 Task 3 April 28, 2015 Mr. Cesar Saleh, P. Eng. VP Planning and Design W.M. Fares Group th 3480 Joseph Howe Drive, 5 Floor HALIFAX NS B3L 4H7 Sent via Email to ceasr.saleh@wmfares.com
Proposed location of Camp Parkway Commerce Center. Vicinity map of Camp Parkway Commerce Center Southampton County, VA
 Proposed location of Camp Parkway Commerce Center Vicinity map of Camp Parkway Commerce Center Southampton County, VA Camp Parkway Commerce Center is a proposed distribution and industrial center to be
Proposed Office Building Traffic Impact Study Chicago Avenue Evanston, Illinois
 Proposed Office Building Traffic Impact Study 1714-1720 Chicago Avenue Evanston, Illinois Prepared For: HOLABIRD & ROOT, LLC Prepared by: Eriksson Engineering Associates, Ltd. 145 Commerce Drive, Ste A,
County State Aid Highway 30 (Diffley Road) and Dodd Road Intersection Study
 and Dodd Road Intersection Study") County State Aid Highway 30 (Diffley Road) and Dodd Road Intersection Study City of Eagan, Dakota County, Minnesota Date: March 2012 Project No. 14957.000 444 Cedar Street, Suite 1500 Saint Paul, MN 55101
County State Aid Highway 30 (Diffley Road) and Dodd Road Intersection Study City of Eagan, Dakota County, Minnesota Date: March 2012 Project No. 14957.000 444 Cedar Street, Suite 1500 Saint Paul, MN 55101
RESPONSE TO TRAFFIC IMPACT STUDY COMMENTS
 RESPONSE TO TRAFFIC IMPACT STUDY COMMENTS Proposed Gas Station 40 Arthur Street (Highway 26), Town of the Blue Mountains (Thornbury), County of Grey, Ontario AUGUST 2013 August 27, 2013 MR. REG RUSSWURM
Traffic Impact Study Morgan Road Commerce Park Pasco County, Florida
 Traffic Impact Study Morgan Road Commerce Park Pasco County, Florida Summary Report June 2008 Prepared by: 12909 N 56 th Street # 201 Tampa, FL 33617 Ph: (813) 988-3180 Fax: (813) 343-6854 Morgan Road
MEMORANDUM November 19, 2012
 COUNCIL OF GOVERNMENTS CENTRAL NAUGATUCK VALLEY 60 NORTH MAIN ST 3RD Floor WATERBURY, CT 06702-1403 (203)757-0535 Web Site: www.cogcnv.org E-Mail: cogcnv@cogcnv.org November 19, 2012 MEMORANDUM 111912
FIRGROVE ELEMENTARY TRAFFIC IMPACT ANALYSIS
 1 FIRGROVE ELEMENTARY TRAFFIC IMPACT ANALYSIS TABLE OF CONTENTS I. Introduction... 3 II. Project Description... 3 III. Existing Conditions... 6 IV. Future Traffic Demand... 10 V. Conclusions and Mitigation...
TRAFFIC AND TRANSPORTATION TECHNICAL MEMORANDUM
 TRAFFIC AND TRANSPORTATION TECHNICAL MEMORANDUM for ENVIRONMENTAL ASSESSMENT US 460 Bypass Interchange and Southgate Drive Relocation State Project No.: 0460-150-204, P101, R201, C501, B601; UPC 99425
King Soopers #116 Thornton, Colorado
 Traffic Impact Study King Soopers #116 Thornton, Colorado Prepared for: Galloway & Company, Inc. T R A F F I C I M P A C T S T U D Y King Soopers #116 Thornton, Colorado Prepared for Galloway & Company
TRAFFIC IMPACT STUDY DERRY GREEN CORPORATE BUSINESS PARK MILTON SECONDARY PLAN MODIFICATION
 TRAFFIC IMPACT STUDY DERRY GREEN CORPORATE BUSINESS PARK MILTON SECONDARY PLAN MODIFICATION TRAFFIC IMPACT STUDY DERRY GREEN CORPORATE BUSINESS PARK MILTON SECONDARY PLAN MODIFICATION DECEMBER 2014 UPDATED
TECHNICAL MEMORANDUM
 TECHNICAL MEMORANDUM TO: Merrimack Valley Metropolitan Planning Organization FROM: James Terlizzi, P.E., Transportation Planning Engineer DATE: March 6, 2017 SUBJECT: Further analysis of the recommendations
Village of Richmond Transportation Brief
 Village of Richmond Transportation Brief GENIVAR Project Number 111-18482-00 June 21 st, 2011 www.genivar.com GENIVAR 15 Fitzgerald Road, Suite 100 Ottawa, Ontario, CANADA K2H 9G1 Telephone: 613-829-2800
MERIVALE PRIORITY SQUARE 2852 MERIVALE ROAD CITY OF OTTAWA TRANSPORTATION BRIEF. Prepared for: ONT Inc. 25 Winding Way Nepean, Ontario K2C 3H1
 MERIVALE PRIORITY SQUARE 2852 MERIVALE ROAD CITY OF OTTAWA TRANSPORTATION BRIEF Prepared for: 2190986ONT Inc. 25 Winding Way Nepean, Ontario K2C 3H1 October 6, 2010 110-502 Report_1.doc D. J. Halpenny
LAWRENCE TRANSIT CENTER LOCATION ANALYSIS 9 TH STREET & ROCKLEDGE ROAD / 21 ST STREET & IOWA STREET LAWRENCE, KANSAS
 LAWRENCE TRANSIT CENTER LOCATION ANALYSIS 9 TH STREET & ROCKLEDGE ROAD / 21 ST STREET & IOWA STREET LAWRENCE, KANSAS TRAFFIC IMPACT STUDY FEBRUARY 214 OA Project No. 213-542 TABLE OF CONTENTS 1. INTRODUCTION...
Final Technical Report US 17 Corridor Study Update (Market Street Road Diet)
") Market Street Road Diet Wilmington, NC 2016 Final Technical Report US 17 Corridor Study Update (Market Street Road Diet) Wilmington, NC Parsons Brinckerhoff January 2016 FINAL TECHNICAL REPORT US 17 Corridor
Market Street Road Diet Wilmington, NC 2016 Final Technical Report US 17 Corridor Study Update (Market Street Road Diet) Wilmington, NC Parsons Brinckerhoff January 2016 FINAL TECHNICAL REPORT US 17 Corridor
Tijuana River Valley Regional Park Campground and Education Center
 Tijuana River Valley Regional Park Campground and Education Center Draft Report September 2018 Prepared for: County of San Diego 5500 Overland Avenue, Suite 410 San Diego, CA 92123 Prepared by: 3900 Fifth
MEMO. McCORMICK RANKIN CORPORATION. File Mark VanderSluis, Keyur Shah DATE: October 26, 2009 COPIES: OUR FILE: TO: FROM: Jack Thompson
 McCORMICK RANKIN CORPORATION 2655 North Sheridan Way Mississauga, Ontario, L5K 2P8 Tel: (95)823-85 Fax: (95) 823-853 E-mail: mrc@mrc.ca Website: www.mrc.ca MEMO TO: FROM: File Mark VanderSluis, Keyur Shah
JRL consulting. March Hartland Developments Limited 1993 Hammonds Plains Road Hammonds Plains, NS B4B 1P3
 March 2015 Prepared for Hartland Developments Limited 1993 Hammonds Plains Road Hammonds Plains, NS B4B 1P3 JRL consulting JRL consulting TABLE OF CONTENTS 1 INTRODUCTION... 2 1.1 BACKGROUND... 2 2 EXISTING
ZINFANDEL LANE / SILVERADO TRAIL INTERSECTION TRAFFIC ANALYSIS
 ZINFANDEL LANE / SILVERADO TRAIL INTERSECTION TRAFFIC ANALYSIS UPDATED TRAFFIC STUDY FOR THE PROPOSED RAYMOND VINEYARDS WINERY USE PERMIT MODIFICATION #P11-00156 AUGUST 5, 2014 PREPARED BY: OMNI-MEANS,
Traffic Impact Study. Eastern Springs. A Proposed Development in Manorville, NY. April Haas Group Inc Transportation Planners and Engineers
 Traffic Impact Study For Eastern Springs A Proposed Development in Manorville, NY April 2018 Haas Group Inc Transportation Planners and Engineers Table of Contents 1) Executive Summary... 2 2) Study Purpose...
Lacey Gateway Residential Phase 1
 Lacey Gateway Residential Phase Transportation Impact Study April 23, 203 Prepared for: Gateway 850 LLC 5 Lake Bellevue Drive Suite 02 Bellevue, WA 98005 Prepared by: TENW Transportation Engineering West
MEMO VIA . Ms. Amy Roth DPS Director, City of Three Rivers. To:
 MEMO To: Ms. Amy Roth DPS Director, City of Three Rivers VIA EMAIL From: Michael J. Labadie, PE Julie M. Kroll, PE, PTOE Brandon Hayes, PE, P.Eng. Fleis & VandenBrink Date: January 5, 2017 Re: Proposed
Traffic Impact Study Hudson Street Parking Garage MC Project No.: A Table of Contents
 Traffic Impact Study Hudson Street Parking Garage MC Project No.: 15001714A Table of Contents Table of Contents I. INTRODUCTION... 1 II. EXISTING CONDITIONS... 4 III. 2015 EXISTING TRAFFIC CONDITIONS...
Traffic Impact Analysis. Alliance Cole Avenue Residential Site Dallas, Texas. Kimley-Horn and Associates, Inc. Dallas, Texas.
 Traffic Impact Analysis Alliance Cole Avenue Residential Site Dallas, Texas February 15, 2018 Kimley-Horn and Associates, Inc. Dallas, Texas Project #064524900 Registered Firm F-928 Traffic Impact Analysis
Salvini Consulting Inc. 459 Deer Ridge Drive Kitchener, ON N2P 0A November 8, 2017 Revised December 20, 2017
 Salvini Consulting Inc. 459 Deer Ridge Drive Kitchener, ON N2P 0A7 519-591-0426 November 8, 2017 Revised December 20, 2017 Laurie Wills, PEng Deputy Director of Public Works Town of Cobourg 740 Division
TIMBERVINE TRANSPORTATION IMPACT STUDY FORT COLLINS, COLORADO JANUARY Prepared for:
 TIMBERVINE TRANSPORTATION IMPACT STUDY FORT COLLINS, COLORADO JANUARY 2014 Prepared for: Hartford Companies 1218 W. Ash Street Suite A Windsor, Co 80550 Prepared by: DELICH ASSOCIATES 2272 Glen Haven Drive
(A) Project Manager, Infrastructure Approvals
 Project Manager, Infrastructure Approvals") February 14th, 2014 BY E-MAIL: wally.dubyk@ottawa.ca City of Ottawa Planning and Growth Management Branch 110 Laurier Ave. W., 4 th Floor, Ottawa, Ontario K1P 1J1 Attention: Wally Dubyk, C.E.T (A) Project
February 14th, 2014 BY E-MAIL: wally.dubyk@ottawa.ca City of Ottawa Planning and Growth Management Branch 110 Laurier Ave. W., 4 th Floor, Ottawa, Ontario K1P 1J1 Attention: Wally Dubyk, C.E.T (A) Project
Paisley & Whitelaw - Paisley Park OPA / ZBA for Mixed Density Residential Use
 Paisley & Whitelaw - Paisley Park OPA / ZBA for Mixed Density Residential Use Transportation Impact Study City of Guelph Prepared for: Armel Corporation August 2018 Table of Contents 1 Introduction...
Wellington Street West
 Transportation Brief prepared for: 185 Davenport Road Suite 300 Toronto, ON M5R 1J1 prepared by: 1223 Michael Street Suite 100 Ottawa, ON K1J 7T2 November 5, 2013 TO3131TOH Transportation Brief November
INDUSTRIAL DEVELOPMENT
 INDUSTRIAL DEVELOPMENT Traffic Impact Study Plainfield, Illinois August 2018 Prepared for: Seefried Industrial Properties, Inc. TABLE OF CONTENTS Executive Summary 2 Introduction 3 Existing Conditions
APPENDIX C1 TRAFFIC ANALYSIS DESIGN YEAR TRAFFIC ANALYSIS
 APPENDIX C1 TRAFFIC ANALYSIS DESIGN YEAR TRAFFIC ANALYSIS DESIGN YEAR TRAFFIC ANALYSIS February 2018 Highway & Bridge Project PIN 6754.12 Route 13 Connector Road Chemung County February 2018 Appendix
1140 Wellington Street West Transportation Brief
 1140 Wellington Street West Transportation Brief October 2013 Study 1140 Wellington Type Street West October 2013 Study Transportation Name Brief February 2011 TB Check List TIS / TB/ CTS Check List prepared
1012 & 1024 McGarry Terrace
 December 217 112 & 124 McGarry Terrace Transportation Impact Study 112 & 124 McGarry Terrace Transportation Impact Study prepared for: Lépine Corporation 32 March Road Kanata, ON K2K 2E3 prepared by: 1223
TRAFFIC IMPACT ANALYSIS FOR. McDONALD S RESTAURANT IN CARMICAEL Sacramento County, CA. Prepared For:
 TRAFFIC IMPACT ANALYSIS FOR McDONALD S RESTAURANT IN CARMICAEL Sacramento County, CA Prepared For: McDonald s USA, LLC Pacific Sierra Region 2999 Oak Road, Suite 900 Walnut Creek, CA 94597 Prepared By:
Traffic Engineering Study
 Traffic Engineering Study Bellaire Boulevard Prepared For: International Management District Technical Services, Inc. Texas Registered Engineering Firm F-3580 November 2009 Executive Summary has been requested
TRANSPORTATION ANALYSIS. Wawa US 441 and Morningside Drive. Prepared for: Brightwork Real Estate, Inc.
 TRANSPORTATION ANALYSIS Wawa US 441 and Morningside Drive Prepared for: Brightwork Real Estate, Inc. TABLE OF CONTENTS Introduction... 1 Project Description... 1 Estimated Daily Project Traffic... 3 Estimated
Traffic Impact Statement (TIS)
") Traffic Impact Statement (TIS) Vincentian PUDA Collier County, FL 10/18/2013 Prepared for: Global Properties of Naples Prepared by: Trebilcock Consulting Solutions, PA 2614 Tamiami Trail N, Suite 615 1205
Traffic Impact Statement (TIS) Vincentian PUDA Collier County, FL 10/18/2013 Prepared for: Global Properties of Naples Prepared by: Trebilcock Consulting Solutions, PA 2614 Tamiami Trail N, Suite 615 1205
Craig Scheffler, P.E., PTOE HNTB North Carolina, P.C. HNTB Project File: Subject
 TECHNICAL MEMORANDUM To Kumar Neppalli Traffic Engineering Manager Town of Chapel Hill From Craig Scheffler, P.E., PTOE HNTB North Carolina, P.C. Cc HNTB Project File: 38435 Subject Obey Creek TIS 2022
CastleGlenn Consultants Inc.
 CastleGlenn Consultants Inc. Engineers, Project Managers & Planners March 11 th, 2013 Domenic Idone, P. Eng Planning Manager R.W. Tomlinson Ltd. 5597 Power Road Ottawa, Ontario K1G 3N4 Dear Mr. Idone:
Memorandum. Megan Costa, SOCPA Sam Gordon, Town of DeWitt Jeanie Gleisner, CNYRPDB Meghan Vitale DATE: April 20, 2017
 TO: FROM: Megan Costa, SOCPA Sam Gordon, Town of DeWitt Jeanie Gleisner, CNYRPDB Meghan Vitale DATE: April 20, 2017 RE: Syracuse Metropolitan Transportation Council 100 Clinton Square 126 N. Salina Street,
HCM Unsignalized Intersection Capacity Analysis 6: Brian Street & LC 111 5/26/2009
 6: Brian Street & LC 111 5/26/2009 Movement EBL EBR NBL NBT SBT SBR Volume (veh/h) 116 20 8 405 137 56 Sign Control Stop Free Free Grade 0% 0% 0% Peak Hour Factor 0.81 0.81 0.67 0.67 0.89 0.89 Hourly flow
APPENDIX G. Traffic Data
 APPENDIX G Traffic Data HCM Signalized Intersection Capacity Analysis 2: Duanesburg Road & I-88 Ramps 10/7/2004 Movement EBL EBT EBR WBL WBT WBR NBL NBT NBR SBL SBT SBR Lane Configurations Ideal Flow (vphpl)
Appendix B: Traffic Reports
 Appendix B: Traffic Reports 407 TRANSITWAY - KENNEDY ROAD TO BROCK ROAD MINISTRY OF TRANSPORTATION - CENTRAL REGION Report Markham Road Station Traffic Study Prepared for Ministry of Transportation, Ontario
Addendum to Traffic Impact Analysis for Port Marigny Site Mandeville, LA
 Addendum to Traffic Impact Analysis for Port Marigny Site Mandeville, LA (St. Tammany Parish Mandeville, LA) Prepared For The Pittman Companies Michael N Pittman, MD 328 East Boston St Covington, LA 70433
TRAFFIC IMPACT ANALYSIS
 TRAFFIC IMPACT ANALYSIS Emerald Isle Commercial Development Prepared by SEPI Engineering & Construction Prepared for Ark Consulting Group, PLLC March 2016 I. Executive Summary A. Site Location The Emerald
MEMORANDUM BOSTON REGION METROPOLITAN PLANNING ORGANIZATION. DATE March 1, 2012
 BOSTON REGION METROPOLITAN PLANNING ORGANIZATION State Transportation Building Ten Park Plaza, Suite 2150 Boston, MA 02116-3968 Tel. (617) 973-7100 Fax (617) 973-8855 TTY (617) 973-7089 www.bostonmpo.org
Winnetka Avenue Bike Lanes Traffic Impact Analysis
 Winnetka Avenue Bike Lanes Traffic Impact Analysis January 4, 2019 Prepared by City of Los Angeles Department of Transportation Active Transportation Division Winnetka Ave Bike Lanes Traffic Impact Analysis
Appendix C-5: Proposed Refinements Rail Operations and Maintenance Facility (ROMF) Traffic Impact Analysis. Durham-Orange Light Rail Transit Project
 Traffic Impact Analysis. Durham-Orange Light Rail Transit Project") Appendix C-5: Proposed Refinements Rail Operations and Maintenance Facility (ROMF) Traffic Impact Analysis Durham-Orange Light Rail Transit Project July 25, 218 ROMF Transportation Impact Analysis Version
Appendix C-5: Proposed Refinements Rail Operations and Maintenance Facility (ROMF) Traffic Impact Analysis Durham-Orange Light Rail Transit Project July 25, 218 ROMF Transportation Impact Analysis Version
SR 104/Paradise Bay-Shine Road Intersection Safety Improvements Intersection Control Evaluation
 SR 104/Paradise Bay-Shine Road Intersection Safety Improvements Intersection Control Evaluation Background and Project Needs SR 104 is functionally classified as a rural-principal arterial. It is a limited
Lakeside Terrace Development
 Lakeside Terrace Development City of Barrie, County of Simcoe Traffic Brief for: Type of Document: Final Report Project Number: JDE 1617 Date Submitted: April 29 th, 216 4/29/16 John Northcote, P.Eng.
December 5, Red Bank Planning Board Municipal Building 90 Monmouth Street Red Bank, NJ 07701
 Dynamic Traffic, LLC www.dynamic-traffic.com 1904 Main Street Lake Como, NJ 07719 T. 732.681.0760 December 5, 2016 Red Bank Planning Board Municipal Building 90 Monmouth Street Red Bank, NJ 07701 Re: Traffic
267 O Connor Street Residential Development
 M a y 2014 267 O Connor Street Residential Development Transportation Brief Google 2014 Bing 2014 Prepared for: MASTERCRAFT STARWOOD Prepared by: Study 267 O'Connor Type Street May 2014 Study Residential
C. iv) Analysis/Results
 Analysis/Results") The Pettengill Road project is located outside the borders of the model in an external zone. As a result, inserting all Pettengill Road trip generation assumptions into the NRPC model and running a new
The Pettengill Road project is located outside the borders of the model in an external zone. As a result, inserting all Pettengill Road trip generation assumptions into the NRPC model and running a new
TRAFFIC SIGNAL DESIGN REPORT KING OF PRUSSIA ROAD & RAIDER ROAD RADNOR TOWNSHIP PENNSYLVANIA
 TRAFFIC SIGNAL DESIGN REPORT KING OF PRUSSIA ROAD & RAIDER ROAD RADNOR TOWNSHIP PENNSYLVANIA PREPARED FOR: UNIVERSITY OF PENNSYLVANIA HEALTH SYSTEM 34 CIVIC CENTER BOULEVARD PHILADELPHIA, PA 1987 (61)