267 O Connor Street Residential Development
|
|
|
- Olivia Jacobs
- 5 years ago
- Views:
Transcription


1 M a y O Connor Street Residential Development Transportation Brief Google 2014 Bing 2014 Prepared for: MASTERCRAFT STARWOOD Prepared by:
2 Study 267 O'Connor Type Street May 2014 Study Residential Name Development February 2011 TB Check List TIS / TB/ CTS Check List prepared for: Mastercraft Starwood 188 Eglinton Ave. East Suite 800 Toronto, ON M4P 2X7 OUR REF:TO3157TOG00 OUR Report Context Municipal address; Location relative to major elements of the existing transportation system (e.g., the site is located in the southwest quadrant of the intersection of Main Street/ First Street, 600metres from the Maple Street Rapid Transit Station); Existing land uses or permitted use provisions in the Official Plan, Zoning By-law, etc.; Proposed land uses and relevant planning regulations to be used in the analysis; Proposed development size (building size, number of residential units, etc.) and location on site; Estimated date of occupancy; Planned phasing of development; Proposed number of parking spaces (not relevant for Draft Plans of Subdivision); Proposed access points and type of access (full turns, right-in/ right-out, turning restrictions, etc. Study area;
3 Study 267 O'Connor Type Street May 2014 Study Residential Name Development February 2011 Existing Conditions Existing roads and ramps in the study area, including jurisdiction, classification, number of lanes, and posted speed limit; Existing intersections, indicating type of control, lane configurations, turning restrictions, and any other relevant data (e.g., extraordinary lane widths, grades, etc.); Existing access points to adjacent developments (both sides of all roads bordering the site); Existing transit system, including stations and stops; Existing on- and off-road bicycle facilities and pedestrian sidewalks and pathway networks; Existing system operations (V/C, LOS); Major trip generators/ attractors within the Study Area should be indicated. Demand Forecasting General background growth; Not required for TB Other study area developments; Not required for TB Changes to the study area road network; Not required for TB Future background system operations (V/C, LOS, queue lengths): Not required for TB Trip generation rates; Trip distribution and assignment.
4 Study 267 O'Connor Type Street May 2014 Study Residential Name Development February 2011 Impact Analysis Total future system operations (V/C, LOS, queue lengths); Signal and auxiliary lane (device) warrants; Operational/ safety assessment (e.g., sight line assessment where grades are an issue); Storage analysis for closely spaced intersections; Pedestrian and bicycle network connections and continuity; On-site circulation and design; Potential for neighbourhood impacts; and TDM. Not required for modified TB Synchro Files CTS Impact Analysis Network Capacity Analysis; Non-auto network connections and continuity; Potential for community impacts, and TDM. Synchro Files Screenline Analysis
5 267 O Connor Street Residential Development Transportation Brief prepared for: Mastercraft Starwood 188 Eglinton Ave. East Suite 800 Toronto, ON M4P 2X7 prepared by: 1223 Michael Street Suite 100 Ottawa, ON K1J 7T2 May 6, 2014 TO3157TOG00
6 267 O Connor Street Transportation Brief May 2014 Table of Contents 1. Introduction Existing Conditions Area Road Network Pedestrian/Cycling Network Transit Network Existing Study Area Intersections Existing Intersection Operations Demand Forecasting Site Trip Generation Future Traffic Operations Site Plan Review Findings and Recommendations List of Figures Figure 1: Local Context... 1 Figure 2: Proposed Site Plan... 2 Figure 3: Area Transit Network... 4 Figure 4: Existing Peak Hour Traffic Volumes... 6 Figure 5: New and Pass-by Site-Generated Traffic Volumes Figure 6: Existing Site-Generated Traffic Volumes Figure 7: Total Projected Net Traffic Volumes List of Tables Table 1: Existing Performance at Study Area Intersections... 7 Table 2: ITE Trip Generation Rates... 8 Table 3: Modified Person Trip Generation... 8 Table 4: High-Rise Condominium Modal Site Trip Generation... 9 Table 5: Retail Modal Site Trip Generation... 9 Table 6: Total Site Vehicle Trip Generation... 9 Table 7: Projected Performance of Study Area Intersections Appendices Appendix A Current Peak Hour Volumes Appendix B SYNCHRO Capacity Analysis: Existing Conditions Appendix C SYNCHRO Capacity Analysis: Projected Conditions

7 267 O Connor Street Transportation Brief May INTRODUCTION From the information provided, a residential development consisting of approximately 510 high-rise condominium units and approximately 4,300 ft 2 of ground floor retail is being proposed, which will be constructed in 2 phases. The proposed site is bound by O Connor Street to the west, MacLaren Street to the north and Gilmour Street to the south, with access to/from MacLaren Street. The site, which is municipally known as 267 O Connor, is currently occupied by a 6 storey office building and a pay & display parking lot. The local context of the site is provided as Figure 1 and the proposed Site Plan is provided as Figure 2. Figure 1: Local Context Based on the ensuing trip generation and our review of the City s Transportation Impact Assessment Guidelines (TIA), the proposed development is projected to generate a net increase of less than the City s threshold for requiring a Transportation Impact Assessment. As such, no further traffic analysis is required. However, this modified Transportation Brief has been prepared to assist in the application/review process and captures only the relevant transportation issues, which are as follows: Existing traffic conditions at adjacent intersections; Future site trip generation; and Site Plan issues, including pedestrian access, proposed vehicle access, parking, loading and circulation layout. For the purpose of this assessment, projected conditions assumes full build-out of Phases 1 and 2. 1

8 Figure 2: Proposed Site Plan
9 267 O Connor Street Transportation Brief May EXISTING CONDITIONS 2.1 Area Road Network O Connor Street is an arterial roadway, which operates one-way in the southbound direction. Within the study area, O Connor Street has a four-lane cross section and an unposted speed limit understood to be 50 km/h. On-street parking is permitted along the east side of the road outside morning and afternoon peak hours and along the west side of the road outside the afternoon peak hour. Metcalfe Street is an arterial roadway, which operates one-way in the northbound direction. Within the study area, Metcalfe Street has a three-lane cross section and an unposted speed limit understood to be 50 km/h. On-street parking is permitted along the east side of the road outside morning and afternoon peak hours. MacLaren Street is a local roadway, which operates one-way in the westbound direction. Its cross section consists of a single travel lane with on-street parking provided along the north side of the road. The unposted speed limit along MacLaren Street is understood to be 50 km/h. Gilmour Street is a local roadway, which operates one-way in the eastbound direction. Its cross section consists of a single travel lane with on-street parking provided along the north side of the road. The unposted speed limit along Gilmour Street is understood to be 50 km/h. 2.2 Pedestrian/Cycling Network According to the City s Cycling Plan, O Connor Street and Metcalfe Street are classified as spine cycling routes. Identified suggested routes, according to the City s Cycling Plan, are along Somerset Street West, located one block north of the study area and along Elgin Street, located one block east of the study area. Sidewalks are currently provided along both sides of all study area roadways connecting pedestrians to transit service and other adjacent development/recreational facilities. 2.3 Transit Network Transit service within the vicinity of the site is currently provided by OC Transpo Routes #1, 2, 5, 6, 7 and 14. Regular Routes #1, 2, 5, 7 and 14 provide frequent all-day service and Peak Route #6 provides service during the peak hours only. Bus stops for Routes #1, 2 and 7 are located along Bank Street, approximately 250 m from the subject site and bus stops for Routes #5, 6, and 14 are located along Elgin Street, approximately 350 m from the subject site. Rapid transit service is also provided along Slater Street and Albert Street approximately 650 m to 700 m north of the subject site. 3

10 267 O Connor Street Transportation Brief May 2014 Figure 3: Area Transit Network 2.4 Existing Study Area Intersections O Connor/MacLaren 1 The O Connor/MacLaren intersection is an unsignalized four-legged intersection with STOP control on the minor westbound approach only. The westbound approach consists of a single left-turn lane and a narrow through lane for bicycles only. The southbound approach consists of three through lanes and a shared through/rightturn lane. O Connor Street and MacLaren Street both operate as one-way roadways in the south and westbound directions, respectively. The westbound through movement is restricted to bicycles only. 1 On-street parking is permitted along the west side of O Connor Street during the morning peak hour only. As such, O Connor Street was assessed as a three lane roadway during the morning peak hour and as a four lane roadway during the afternoon peak hour. 4
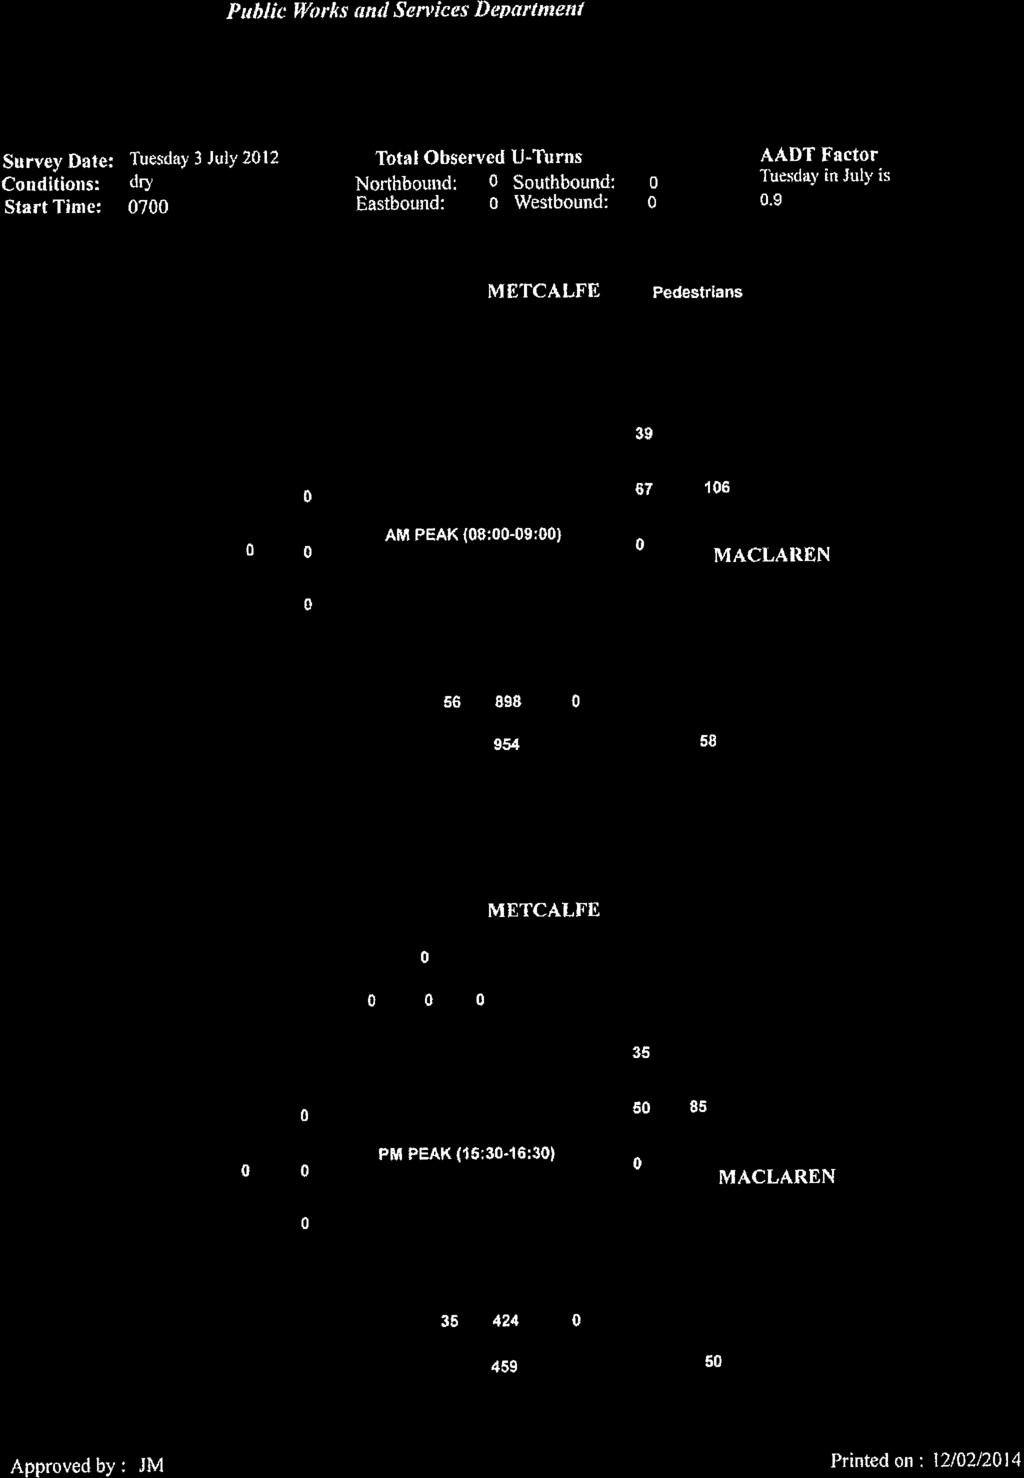
11 267 O Connor Street Transportation Brief May 2014 Metcalfe/MacLaren The Metcalfe/MacLaren intersection is a signalized four-legged intersection. The northbound approach consists of two through lanes and a shared through/leftturn lane. The westbound approach consists of a shared through/right-turn lane. Metcalfe Street and MacLaren Street both operate as one-way roadways in the north and westbound directions, respectively. O Connor/Gilmour 2 The O Connor/Gilmour intersection is a signalized four-legged intersection. The southbound approach consists of three through lanes and a shared through/leftturn lane. The eastbound approach consists of a shared through/right-turn lane. O Connor Street and Gilmour Street both operate as one-way roadways in the south and eastbound directions, respectively. Metcalfe/Gilmour The Metcalfe/Gilmour intersection is a signalized four-legged intersection. The northbound approach consists of two through lanes and a shared through/rightturn lane. The eastbound approach consists of a shared through/left-turn lane. Metcalfe Street and Gilmour Street both operate as one-way roadways in the north and eastbound directions, respectively. 2.5 Existing Intersection Operations Illustrated as Figure 4, are the most recent weekday morning and afternoon peak hour traffic volumes obtained from the City of Ottawa for the O Connor/Gilmour, Metcalfe/MacLaren and Metcalfe/Gilmour intersections. Peak hour traffic volumes, also included in Figure 4, were collected by Delcan (March 2014) at the unsignalized 2 On-street parking is permitted along the west side of O Connor Street during the morning peak hour only. As such, O Connor Street was assessed as a three lane roadway during the morning peak hour and as a four lane roadway during the afternoon peak hour. 5
12 STOP 267 O Connor Street Transportation Brief May 2014 O Connor/MacLaren intersection and the existing site driveway connection to O Connor Street. These peak hour traffic volumes are included as Appendix A. Figure 4: Existing Peak Hour Traffic Volumes 45(43) 585(1251) 5(3) 93(112) 98(115) MacLaren 39(35) 67(50) 585(1251) 28(6) 641(1313) 37(50) 10(32) SITE Gilmour Metcalfe 56(35) 898(424) 68(61) 54(74) O'Connor xx (yy) AM Peak Hour Volumes PM Peak Hour Volumes 21(47) 45(81) 1108(702) 37(57) The following Table 1 provides a summary of existing traffic operations at study area intersections based on the SYNCHRO (V8) traffic analysis software. The subject intersections were assessed in terms of the volume-to-capacity (v/c) ratio and the corresponding Level of Service (LoS) for the critical movement(s). The subject intersections as a whole were assessed based on a weighted v/c ratio and the Synchro model output of existing conditions is provided within Appendix B. 6
13 267 O Connor Street Transportation Brief May 2014 Table 1: Existing Performance at Study Area Intersections Weekday AM Peak (PM Peak) Intersection Critical Movement Intersection as a Whole max. v/c LoS or avg. Movement Delay (s) LoS v/c delay (s) Metcalfe/MacLaren A(A) 0.35(0.19) NBT(WBT) 3.2(3.3) A(A) 0.34(0.17) O'Connor/Gilmour A(A) 0.34(0.38) EBT(EBT) 7.4(7.2) A(A) 0.25(0.36) Metcalfe/Gilmour A(A) 0.44(0.29) NBT(NBT) 9.6(10.1) A(A) 0.42(0.28) O Connor/MacLaren B(B) 11.0(13.3) WBL(WBL) 1.5(1.1) - - Note: Analysis of signalized intersections assumes a PHF of 0.95 and a saturation flow rate of 1800 veh/h/lane. As shown in Table 1, SYNCHRO analysis indicates that study area intersections as a whole and their respective critical movements are currently operating at an excellent LoS B or better during both peak hours. Field observations confirm these findings. During peak hours, field observations revealed sufficient gaps were created by the signalized O Connor/Summerset intersection (north of O Connor/MacLaren intersection), such that vehicles on MacLaren Street are able to turn left onto O Connor Street with minimal delay. Further south on O Connor Street, towards HWY 417, lengthy southbound queues were observed extending from the O Connor/Isabella intersection, however, these queues did not spill back to study area intersections. It should also be noted that a total of 8 westbound through vehicles were observed at the O Connor/MacLaren intersection during peak hours. As previously mentioned, this movement is restricted to bicycles only. 3. DEMAND FORECASTING 3.1 Site Trip Generation Appropriate vehicle trip generation rates for the proposed development, consisting of approximately 510 high-rise condominium units and approximately 4,300 ft 2 of ground floor retail, were obtained from the 9 th Edition of the Institute of Transportation Engineers (ITE) Trip Generation Manual, which are summarized in Table 2. 7
14 267 O Connor Street Transportation Brief May 2014 Table 2: ITE Trip Generation Rates Land Use High-Rise Condominiums Data Source ITE 232 Specialty Retail ITE 826 AM Peak T = 0.34(du); T = 0.29(du) T = 1.36(X); T = 1.20(X) Notes: T = Average Vehicle Trip Ends du = dwelling units X = 1000 ft 2 Gross Floor Area Specialty Retail AM Peak is assumed to be 50% of the PM Peak Trip Rates PM Peak T = 0.38(du); T = 0.34(du) T = 2.71(X); T = 2.40(X) As ITE trip generation surveys only record vehicle trips and typically reflect highly suburban locations (with little to no access by travel modes other than private automobiles), adjustment factors appropriate to the more urban study area context were applied to attain estimates of person trips for the proposed development. This approach is considered appropriate within the industry for urban infill developments. To convert ITE vehicle trip rates to person trips, an auto occupancy factor and a non-auto trip factor were applied to the ITE vehicle trip rates. Our review of available literature suggests that a combined factor of approximately 1.3 is considered reasonable to account for typical North American auto occupancy values of approximately 1.15 and combined transit/non-motorized modal shares of less than 10%. As such, the person trip generation for the proposed development is summarized in Table 3. Table 3: Modified Person Trip Generation AM Peak (persons/h) PM Peak (persons/h) Land Use Area In Out Total In Out Total High-Rise 510 du Condominiums Specialty Retail 4,300 ft Total Person Trips Note: 1.3 factor to account for typical North American auto occupancy values of approximately 1.15 and combined transit and non-motorized modal shares of less than 10% The person trips shown in Table 3 for the proposed development were then reduced by modal share values based on the site s location and proximity to adjacent communities, employment, shopping uses and transit availability. Modal share values for the residential component of the proposed development are summarized in Table 4. 8
15 267 O Connor Street Transportation Brief May 2014 Table 4: High-Rise Condominium Modal Site Trip Generation Mode AM Peak (persons/h) PM Peak (persons/h) Travel Mode Share In Out Total In Out Total Auto Driver 40% Auto Passenger 10% Transit 25% Non-motorized 25% Total Person Trips 100% Total New Auto Trips Given the local context of the retail component of the proposed development, and the likelihood that it will mainly serve on-site residents/existing pedestrians along O Connor Street, it is reasonable to assume that it will generate a high non-motorized modal share. In addition, it is reasonable to assume a high auto mode pass-by value for the retail component of the proposed development, given the retail will not be a destination for many drivers due to its local context and size. As such, the modal share values for the retail component of the proposed development are summarized in Table 5. Table 5: Retail Modal Site Trip Generation Mode AM Peak (persons/h) PM Peak (persons/h) Travel Mode Share In Out Total In Out Total Auto Driver 20% Auto Passenger 10% Transit 10% Non-motorized 60% Total Person Trips 100% Less 50% Pass-by Total New Auto Trips The following Table 6 provides a summary of the total projected site vehicle trip generation. Table 6: Total Site Vehicle Trip Generation Land Use AM Peak (veh/h) PM Peak (veh/h) In Out Total In Out Total High-Rise Condominiums Specialty Retail Less Retail Pass-by Total New Auto Trips As shown in Table 6, the resulting number of potential new two-way vehicle trips for the proposed development is approximately 96 and 104 veh/h during the weekday morning and afternoon peak hours, respectively. 9
16 STOP 267 O Connor Street Transportation Brief May 2014 These new trips were then distributed based on the site s connectivity to the existing road network and our knowledge of the surrounding area. The resultant distribution is assumed to be: 60% to/from the south via O Connor Street and Metcalfe Street; 30% to/from the north via O Connor Street and Metcalfe Street; and 10% to/from the west via Gilmour Street and MacLaren Street. 100% Given the proposed development is located approximate 800 m (approximately 10 minute walking distance) from the center of Ottawa s Downtown Central Business District area, it is reasonable to assume the majority of site-generated trips to/from the north will be nonmotorized person trips. Therefore, with respect to vehicle site-generated trips, the majority will be to/from the south, towards the HWY 417. Based on the assumed distributions, new and pass-by site-generated trips were assigned to study area intersections and are illustrated as Figure 5. It should be noted that no onsite commercial parking is proposed for the subject development. Therefore, only residential site-generated trips were assigned to the proposed site driveway connection to MacLaren Avenue and retail site-generated trips were assigned to on-street parking. This is reflected in Figure 5. Figure 5: New and Pass-by Site-Generated Traffic Volumes 6(19) 76(39) 1(1) 18(61) MacLaren 2(6) O'Connor 46(24) 35(35) SITE 75(38) Metcalfe 17(56) 23(13) Gilmour 28(31) 7(4) 12(38) xx (yy) AM Peak Hour Volumes PM Peak Hour Volumes 10
17 STOP 267 O Connor Street Transportation Brief May 2014 Given the proposed site is currently occupied by an approximate 50,000 ft 2 office building and a pay/display parking lot, which will be replaced by the proposed development, peak hour traffic counts were conducted at the existing site driveway connection to O Connor Street to obtain existing peak hour site-generated trips. Assuming the same traffic distribution as the new site-generated trips, the observed office/parking lot sitegenerated trips were removed from the study area network to obtain a net increase in total projected peak hour traffic volumes. Existing office/parking lot site-generated traffic is illustrated as Figure 6 and it equates to 38 veh/h two-way total during both the morning and afternoon peak hours. Removing the office/parking lot site-generated traffic, the projected net increase in study area traffic is approximately 58 and 66 veh/h during the weekday morning and afternoon peak hours, respectively. This amount of new traffic equates to approximately 1 new vehicle every minute. Figure 6: Existing Site-Generated Traffic Volumes 8(2) 20(4) 20(4) MacLaren 3(1) 28(6) 17(3) 3(10) 10(32) SITE Metcalfe 6(19) 4(13) Gilmour O'Connor xx (yy) AM Peak Hour Volumes PM Peak Hour Volumes 3(10) 1(3) 17(3) 11
18 STOP 267 O Connor Street Transportation Brief May FUTURE TRAFFIC OPERATIONS For the purpose of this study, the total projected traffic volumes were derived by superimposing site-generated traffic volumes (Figure 5) onto existing traffic volumes (Figure 3) and existing office/parking lot site-generated traffic volumes (Figure 6) were removed (i.e. Figure 5 + Figure 3 Figure 6 = Total net projected traffic volumes). The resulting total net projected traffic volumes are illustrated as Figure 7. Figure 7: Total Projected Net Traffic Volumes 45(43) 583(1268) 5(3) 149(147) 79(112) 18(61) MacLaren 39(35) 66(55) O'Connor 681(1318) 68(72) SITE 75(38) Metcalfe 56(88) 918(427) Gilmour 68(61) 54(74) xx (yy) AM Peak Hour Volumes PM Peak Hour Volumes 46(68) 51(82) The following Table 7 provides a summary of projected performances of study area intersections at full site build-out. The SYNCHRO model output of projected conditions is provided within Appendix C. Table 7: Projected Performance of Study Area Intersections Weekday AM Peak (PM Peak) Intersection Critical Movement Intersection as a Whole max. v/c LoS or avg. Movement Delay (s) LoS v/c delay (s) Metcalfe/MacLaren A(A) 0.35(0.20) NBT(WBT) 3.3(3.0) A(A) 0.34(0.19) O'Connor/Gilmour A(A) 0.34(0.38) EBT(EBT) 7.3(7.2) A(A) 0.26(0.37) Metcalfe/Gilmour A(A) 0.43(0.31) NBT(NBT) 9.8(10.0) A(A) 0.41(0.31) O Connor/MacLaren B(B) 11.5(13.9) WBL(WBL) 2.3(1.4) - - MacLaren/Site A(B) 9.6(10.4) NBL(NBL) 5.0(4.1) - - Note: Analysis of signalized intersections assumes a PHF of 0.95 and a saturation flow rate of 1800 veh/h/lane. 1103(737) 37(57) 12
19 267 O Connor Street Transportation Brief May 2014 As shown in Table 7, with no signal timing plan modifications, the signalized study area intersections, as a whole, are projected to operate at an excellent LoS A during both peak hours, similar to existing conditions summarized in Table 1. The critical movements are also projected to operate similar to existing conditions. It should be noted that the site proposed driveway connection will be to MacLaren Street, and the existing site driveway along O Connor Street will be removed. This is considered beneficial, as the driveway connection will be to a local roadway with lower traffic volumes, as opposed to an arterial roadway carrying higher traffic volumes. This will result in a safer environment for drivers to/from the proposed development. With respect to the unsignalized O Connor/MacLaren intersection, it is projected to continue operating acceptably. As mentioned previously, sufficient gaps will be created by adjacent signalized intersections for vehicles to turn left onto O Connor Street from MacLaren Street with minimal delay. 5. SITE PLAN REVIEW This section provides an overview of site access, parking requirements, pedestrian circulation and transit accessibility. The proposed Site Plan was previously illustrated as Figure 2. Parking A total of 309 vehicle parking spaces are proposed to serve the subject development, which includes 254 residential, 50 visitor and 5 commercial spaces. This proposed amount of parking does not satisfy the minimum parking requirement of 320 spaces, with respect to the City s Zoning By-Law requirements for Area B, identified in Schedule 1 of the City s Zoning By-Law. As such, the proponent will likely be required to seek a By-Law variance for the proposed amount of parking for the subject development. Site Circulation With regard to on-site circulation, the proposed parking garage is laid out effectively, such that two-way traffic can be effectively accommodated with aisle widths noted as 6.7 m. The proposed parking space dimensions are noted as 5.2 m in length and 2.6 m in width. The identified small car parking spaces (a total of 21 spaces) are noted as 2.6 m in width and 4.4 m in length. The proponent will likely be required to seek a By-Law variance with respect to the small car parking space dimensioning, as the By-Law states that a minimum length of 4.6 m is required. The ramp providing access to the lower level parking is noted as having an acceptable 15% grade, as long as appropriate transition grades are provided particularly at the top of the ramp approaching the sidewalk, and signage prohibiting pedestrians from the ramp is installed. If exposed to the elements, a subsurface melting device sufficient to keep the access ramp free of ice at all times would be of benefit in terms of safety. 13
20 267 O Connor Street Transportation Brief May 2014 Access Requirements Based on projected volumes and proximity to adjacent intersections, additional traffic control/auxiliary turn lanes are not warranted or required at the proposed driveway connection to MacLaren Street. Pedestrians/Transit To connect pedestrians to transit service and other nearby employment, shopping and recreation opportunities, sidewalks are currently provided along both sides of all study area roads. OC Transpo bus stops for Routes #1, 2, 5, 6, 7 and 14 are located along Bank Street and Elgin Street, approximately 250 to 350 m from the subject site. The rapid transit corridor is located along Slater Street and Albert Street approximately 650 to 700 m north of the subject site. Bicycles A total of 259 bicycle parking spaces will be provided on parking level 1, close to main building entrances/in well-lit areas, which satisfies the City s By-Law requirements. 6. FINDINGS AND RECOMMENDATIONS Based on the foregoing analysis of the proposed development, the following transportation-related conclusions are offered: Study area intersections are currently operating at an acceptable Level of Service during the weekday morning and afternoon peak hours; The existing on-site development, which will be demolished, generates approximately 38 veh/h two-way total during both the morning and afternoon peak hours; The proposed development is projected to generate approximately 96 and 104 veh/h during the weekday morning and afternoon peak hours (a net increase of 58 and 66 veh/h), respectively. The resultant net volumes equate to approximately 1 new vehicle every minute. This amount of new traffic is considered relatively insignificant with no measureable impact on the operations of adjacent intersections; Future traffic conditions at study area intersections are projected to operate similar to existing conditions; The site s on-site circulation and parking layout is well arranged and meets By-Law requirements. However, the proposed total parking supply and the dimensioning of small car parking spaces do not meet By-Law requirements and will likely require a By-Law variance; 14


21 267 O Connor Street Transportation Brief May 2014 The parking garage access/egress ramp grades are noted as 15%. Appropriate transition grades should be provided, particularly on the approach to the sidewalk to ensure proper sight lines. Based on the foregoing, the proposed development fits well into the context of the surrounding area, and its location and design serves to promote use of walking, cycling, and transit modes, thus supporting City of Ottawa policies, goals and objectives with respect to redevelopment, intensification and modal share. Therefore, the proposed 267 O Connor Street residential development is recommended from a transportation perspective. Prepared By: Reviewed By: André Jane Sponder, B.A.Sc. Analyst, Transportation Ottawa Operations Gordon R. Scobie, P.Eng. Project Engineer, Transportation Ottawa Operations
22 Appendix A Current Peak Hour Traffic Counts
23
24

25
26 DIRECTIONAL TRAFFIC FLOW Intersection: O Connor at MacLaren DATE: Day: 20 Month: March Year: 2014 Day of Week: Thursday Observer: Alex Buck Weather: Clear Chkd by: Date: Street Name: MacLaren TIME PERIOD: From: 8 : 00 To: 9 : 00 Instructions: 1) Use tally marks to indicate vehicles. 2) Use one sheet for each 15-minute period. 45 Pass. Vehicles Trks Bus Street Name: O Connor N Bus Trks Pass. Vehicles 5 93 Pass. Vehicles Trks Bus Street Name: MacLaren Street Name: O Connor Bus Trks Pass. Vehicles
27 DIRECTIONAL TRAFFIC FLOW Intersection: O Connor at MacLaren DATE: Day: 20 Month: March Year: 2014 Day of Week: Thursday Observer: Alex Buck Weather: Clear Chkd by: Date: Street Name: MacLaren TIME PERIOD: From: 4 : 15 To: 5 : 15 Instructions: 1) Use tally marks to indicate vehicles. 2) Use one sheet for each 15-minute period. 43 Pass. Vehicles Trks Bus Street Name: O Connor N Bus Trks Pass. Vehicles Pass. Vehicles Trks Bus Street Name: MacLaren Street Name: O Connor Bus Trks Pass. Vehicles
28 DIRECTIONAL TRAFFIC FLOW Intersection: O Connor at Site DATE: Day: 25 Month: March Year: 2014 Day of Week: Tuesday Observer: Alex Buck Weather: Clear Chkd by: Date: Street Name: DNE TIME PERIOD: From: 8 : 00 To: 9 : 00 Instructions: 1) Use tally marks to indicate vehicles. 2) Use one sheet for each 15-minute period. 28 Pass. Vehicles Trks Bus Street Name: O Connor N Bus Trks Pass. Vehicles 10 Pass. Vehicles Trks Bus Street Name: Site Street Name: O Connor Bus Trks Pass. Vehicles
 Use tally marks to indicate vehicles. 2) Use one sheet for each 15-minute period. 6 Pass. Vehicles Trks Bus Street Name: O Connor N Bus Trks Pass.")
29 DIRECTIONAL TRAFFIC FLOW Intersection: O Connor at Site DATE: Day: 25 Month: March Year: 2014 Day of Week: Tuesday Observer: Alex Buck Weather: Clear Chkd by: Date: Street Name: DNE TIME PERIOD: From: 4 : 00 To: 5 : 00 Instructions: 1) Use tally marks to indicate vehicles. 2) Use one sheet for each 15-minute period. 6 Pass. Vehicles Trks Bus Street Name: O Connor N Bus Trks Pass. Vehicles 32 Pass. Vehicles Trks Bus Street Name: Site Street Name: O Connor Bus Trks Pass. Vehicles
30 Appendix B SYNCHRO Capacity Analysis: Existing Conditions
31 Existing AM 2: Metcalfe & MacLaren Lane Group WBT NBT Lane Configurations Volume (vph) Lane Group Flow (vph) Turn Type NA NA Protected Phases 8 2 Permitted Phases Minimum Split (s) Total Split (s) Total Split (%) 33.3% 66.7% Yellow Time (s) All-Red Time (s) Lost Time Adjust (s) Total Lost Time (s) Lead/Lag Lead-Lag Optimize? Act Effct Green (s) Actuated g/c Ratio v/c Ratio Control Delay Queue Delay Total Delay LOS B A Approach Delay Approach LOS B A Queue Length 50th (m) Queue Length 95th (m) Internal Link Dist (m) Turn Bay Length (m) Base Capacity (vph) Starvation Cap Reductn Spillback Cap Reductn 0 0 Storage Cap Reductn 0 0 Reduced v/c Ratio Intersection Summary Cycle Length: 75 Actuated Cycle Length: 75 Offset: 59 (79%), Referenced to phase 2:NBTL, Start of Green Natural Cycle: 45 Control Type: Pretimed Maximum v/c Ratio: 0.35 Intersection Signal Delay: 3.2 Intersection Capacity Utilization 45.1% Analysis Period (min) 15 Intersection LOS: A ICU Level of Service A Splits and Phases: 2: Metcalfe & MacLaren Delcan Synchro 8 - Report
32 Existing AM 3: O'Connor & Gilmour Lane Group EBT SBT Lane Configurations Volume (vph) Lane Group Flow (vph) Turn Type NA NA Protected Phases 4 6 Permitted Phases Minimum Split (s) Total Split (s) Total Split (%) 28.0% 72.0% Yellow Time (s) All-Red Time (s) Lost Time Adjust (s) Total Lost Time (s) Lead/Lag Lead-Lag Optimize? Act Effct Green (s) Actuated g/c Ratio v/c Ratio Control Delay Queue Delay Total Delay LOS B A Approach Delay Approach LOS B A Queue Length 50th (m) Queue Length 95th (m) Internal Link Dist (m) Turn Bay Length (m) Base Capacity (vph) Starvation Cap Reductn 0 0 Spillback Cap Reductn 0 0 Storage Cap Reductn 0 0 Reduced v/c Ratio Intersection Summary Cycle Length: 75 Actuated Cycle Length: 75 Offset: 46 (61%), Referenced to phase 6:SBTL, Start of Green Natural Cycle: 50 Control Type: Pretimed Maximum v/c Ratio: 0.34 Intersection Signal Delay: 7.4 Intersection Capacity Utilization 38.7% Analysis Period (min) 15 Intersection LOS: A ICU Level of Service A Splits and Phases: 3: O'Connor & Gilmour Delcan Synchro 8 - Report
33 Existing AM 4: Metcalfe & Gilmour Lane Group EBT NBT Lane Configurations Volume (vph) Lane Group Flow (vph) Turn Type NA NA Protected Phases 4 2 Permitted Phases Minimum Split (s) Total Split (s) Total Split (%) 36.0% 64.0% Yellow Time (s) All-Red Time (s) Lost Time Adjust (s) Total Lost Time (s) Lead/Lag Lead-Lag Optimize? Act Effct Green (s) Actuated g/c Ratio v/c Ratio Control Delay Queue Delay Total Delay LOS A A Approach Delay Approach LOS A A Queue Length 50th (m) Queue Length 95th (m) Internal Link Dist (m) Turn Bay Length (m) Base Capacity (vph) Starvation Cap Reductn 0 0 Spillback Cap Reductn 0 0 Storage Cap Reductn 0 0 Reduced v/c Ratio Intersection Summary Cycle Length: 75 Actuated Cycle Length: 75 Offset: 58 (77%), Referenced to phase 2:NBT, Start of Green Natural Cycle: 50 Control Type: Pretimed Maximum v/c Ratio: 0.44 Intersection Signal Delay: 9.6 Intersection Capacity Utilization 49.7% Analysis Period (min) 15 Intersection LOS: A ICU Level of Service A Splits and Phases: 4: Metcalfe & Gilmour Delcan Synchro 8 - Report
34 Existing AM 1: O'Connor & MacLaren Movement EBL EBT EBR WBL WBT WBR NBL NBT NBR SBL SBT SBR Lane Configurations Volume (veh/h) Sign Control Stop Stop Free Free Grade 0% 0% 0% 0% Peak Hour Factor Hourly flow rate (vph) Pedestrians Lane Width (m) Walking Speed (m/s) Percent Blockage Right turn flare (veh) Median type None None Median storage veh) Upstream signal (m) 88 px, platoon unblocked vc, conflicting volume vc1, stage 1 conf vol vc2, stage 2 conf vol vcu, unblocked vol tc, single (s) tc, 2 stage (s) tf (s) p0 queue free % cm capacity (veh/h) Direction, Lane # WB 1 SB 1 SB 2 SB 3 Volume Total Volume Left Volume Right csh Volume to Capacity Queue Length 95th (m) Control Delay (s) Lane LOS B Approach Delay (s) Approach LOS B Intersection Summary Average Delay 1.5 Intersection Capacity Utilization 25.4% ICU Level of Service A Analysis Period (min) 15 Delcan Synchro 8 - Report
35 Existing PM 2: Metcalfe & MacLaren Lane Group WBT NBT Lane Configurations Volume (vph) Lane Group Flow (vph) Turn Type NA NA Protected Phases 8 2 Permitted Phases Minimum Split (s) Total Split (s) Total Split (%) 33.3% 66.7% Yellow Time (s) All-Red Time (s) Lost Time Adjust (s) Total Lost Time (s) Lead/Lag Lead-Lag Optimize? Act Effct Green (s) Actuated g/c Ratio v/c Ratio Control Delay Queue Delay Total Delay LOS B A Approach Delay Approach LOS B A Queue Length 50th (m) Queue Length 95th (m) Internal Link Dist (m) Turn Bay Length (m) Base Capacity (vph) Starvation Cap Reductn 0 0 Spillback Cap Reductn 0 0 Storage Cap Reductn 0 0 Reduced v/c Ratio Intersection Summary Cycle Length: 75 Actuated Cycle Length: 75 Offset: 56 (75%), Referenced to phase 2:NBTL, Start of Green Natural Cycle: 45 Control Type: Pretimed Maximum v/c Ratio: 0.19 Intersection Signal Delay: 3.3 Intersection Capacity Utilization 35.9% Analysis Period (min) 15 Intersection LOS: A ICU Level of Service A Splits and Phases: 2: Metcalfe & MacLaren Delcan Synchro 8 - Report
36 Existing PM 3: O'Connor & Gilmour Lane Group EBT SBT Lane Configurations Volume (vph) Lane Group Flow (vph) Turn Type NA NA Protected Phases 4 6 Permitted Phases Minimum Split (s) Total Split (s) Total Split (%) 28.0% 72.0% Yellow Time (s) All-Red Time (s) Lost Time Adjust (s) Total Lost Time (s) Lead/Lag Lead-Lag Optimize? Act Effct Green (s) Actuated g/c Ratio v/c Ratio Control Delay Queue Delay Total Delay LOS B A Approach Delay Approach LOS B A Queue Length 50th (m) Queue Length 95th (m) Internal Link Dist (m) Turn Bay Length (m) Base Capacity (vph) Starvation Cap Reductn 0 0 Spillback Cap Reductn 0 0 Storage Cap Reductn 0 0 Reduced v/c Ratio Intersection Summary Cycle Length: 75 Actuated Cycle Length: 75 Offset: 62 (83%), Referenced to phase 6:SBTL, Start of Green Natural Cycle: 50 Control Type: Pretimed Maximum v/c Ratio: 0.38 Intersection Signal Delay: 7.2 Intersection Capacity Utilization 43.7% Analysis Period (min) 15 Intersection LOS: A ICU Level of Service A Splits and Phases: 3: O'Connor & Gilmour Delcan Synchro 8 - Report
37 Existing PM 4: Metcalfe & Gilmour Lane Group EBT NBT Lane Configurations Volume (vph) Lane Group Flow (vph) Turn Type NA NA Protected Phases 4 2 Permitted Phases Minimum Split (s) Total Split (s) Total Split (%) 36.0% 64.0% Yellow Time (s) All-Red Time (s) Lost Time Adjust (s) Total Lost Time (s) Lead/Lag Lead-Lag Optimize? Act Effct Green (s) Actuated g/c Ratio v/c Ratio Control Delay Queue Delay Total Delay LOS C A Approach Delay Approach LOS C A Queue Length 50th (m) Queue Length 95th (m) Internal Link Dist (m) Turn Bay Length (m) Base Capacity (vph) Starvation Cap Reductn 0 0 Spillback Cap Reductn 0 0 Storage Cap Reductn 0 0 Reduced v/c Ratio Intersection Summary Cycle Length: 75 Actuated Cycle Length: 75 Offset: 52 (69%), Referenced to phase 2:NBT, Start of Green Natural Cycle: 50 Control Type: Pretimed Maximum v/c Ratio: 0.29 Intersection Signal Delay: 10.1 Intersection Capacity Utilization 42.3% Analysis Period (min) 15 Intersection LOS: B ICU Level of Service A Splits and Phases: 4: Metcalfe & Gilmour Delcan Synchro 8 - Report
38 Existing PM 1: O'Connor & MacLaren Movement EBL EBT EBR WBL WBT WBR NBL NBT NBR SBL SBT SBR Lane Configurations Volume (veh/h) Sign Control Stop Stop Free Free Grade 0% 0% 0% 0% Peak Hour Factor Hourly flow rate (vph) Pedestrians Lane Width (m) Walking Speed (m/s) Percent Blockage Right turn flare (veh) Median type None None Median storage veh) Upstream signal (m) 88 px, platoon unblocked vc, conflicting volume vc1, stage 1 conf vol vc2, stage 2 conf vol vcu, unblocked vol tc, single (s) tc, 2 stage (s) tf (s) p0 queue free % cm capacity (veh/h) Direction, Lane # WB 1 SB 1 SB 2 SB 3 SB 4 Volume Total Volume Left Volume Right csh Volume to Capacity Queue Length 95th (m) Control Delay (s) Lane LOS B Approach Delay (s) Approach LOS B Intersection Summary Average Delay 1.1 Intersection Capacity Utilization 33.3% ICU Level of Service A Analysis Period (min) 15 Delcan Synchro 8 - Report
39 Appendix C SYNCHRO Capacity Analysis: Projected Conditions
40 Projected AM 2: Metcalfe & MacLaren Lane Group WBT NBT Lane Configurations Volume (vph) Lane Group Flow (vph) Turn Type NA NA Protected Phases 8 2 Permitted Phases Minimum Split (s) Total Split (s) Total Split (%) 33.3% 66.7% Yellow Time (s) All-Red Time (s) Lost Time Adjust (s) Total Lost Time (s) Lead/Lag Lead-Lag Optimize? Act Effct Green (s) Actuated g/c Ratio v/c Ratio Control Delay Queue Delay Total Delay LOS B A Approach Delay Approach LOS B A Queue Length 50th (m) Queue Length 95th (m) Internal Link Dist (m) Turn Bay Length (m) Base Capacity (vph) Starvation Cap Reductn Spillback Cap Reductn 0 0 Storage Cap Reductn 0 0 Reduced v/c Ratio Intersection Summary Cycle Length: 75 Actuated Cycle Length: 75 Offset: 59 (79%), Referenced to phase 2:NBTL, Start of Green Natural Cycle: 45 Control Type: Pretimed Maximum v/c Ratio: 0.35 Intersection Signal Delay: 3.3 Intersection Capacity Utilization 45.5% Analysis Period (min) 15 Intersection LOS: A ICU Level of Service A Splits and Phases: 2: Metcalfe & MacLaren Delcan Synchro 8 - Report
41 Projected AM 3: O'Connor & Gilmour Lane Group EBT SBT Lane Configurations Volume (vph) Lane Group Flow (vph) Turn Type NA NA Protected Phases 4 6 Permitted Phases Minimum Split (s) Total Split (s) Total Split (%) 28.0% 72.0% Yellow Time (s) All-Red Time (s) Lost Time Adjust (s) Total Lost Time (s) Lead/Lag Lead-Lag Optimize? Act Effct Green (s) Actuated g/c Ratio v/c Ratio Control Delay Queue Delay Total Delay LOS B A Approach Delay Approach LOS B A Queue Length 50th (m) Queue Length 95th (m) Internal Link Dist (m) Turn Bay Length (m) Base Capacity (vph) Starvation Cap Reductn 0 0 Spillback Cap Reductn 0 0 Storage Cap Reductn 0 0 Reduced v/c Ratio Intersection Summary Cycle Length: 75 Actuated Cycle Length: 75 Offset: 46 (61%), Referenced to phase 6:SBTL, Start of Green Natural Cycle: 50 Control Type: Pretimed Maximum v/c Ratio: 0.34 Intersection Signal Delay: 7.3 Intersection Capacity Utilization 38.7% Analysis Period (min) 15 Intersection LOS: A ICU Level of Service A Splits and Phases: 3: O'Connor & Gilmour Delcan Synchro 8 - Report
42 Projected AM 4: Metcalfe & Gilmour Lane Group EBT NBT Lane Configurations Volume (vph) Lane Group Flow (vph) Turn Type NA NA Protected Phases 4 2 Permitted Phases Minimum Split (s) Total Split (s) Total Split (%) 36.0% 64.0% Yellow Time (s) All-Red Time (s) Lost Time Adjust (s) Total Lost Time (s) Lead/Lag Lead-Lag Optimize? Act Effct Green (s) Actuated g/c Ratio v/c Ratio Control Delay Queue Delay Total Delay LOS B A Approach Delay Approach LOS B A Queue Length 50th (m) Queue Length 95th (m) Internal Link Dist (m) Turn Bay Length (m) Base Capacity (vph) Starvation Cap Reductn 0 0 Spillback Cap Reductn 0 0 Storage Cap Reductn 0 0 Reduced v/c Ratio Intersection Summary Cycle Length: 75 Actuated Cycle Length: 75 Offset: 58 (77%), Referenced to phase 2:NBT, Start of Green Natural Cycle: 50 Control Type: Pretimed Maximum v/c Ratio: 0.43 Intersection Signal Delay: 9.8 Intersection Capacity Utilization 49.6% Analysis Period (min) 15 Intersection LOS: A ICU Level of Service A Splits and Phases: 4: Metcalfe & Gilmour Delcan Synchro 8 - Report
43 Projected AM 1: O'Connor & MacLaren Movement EBL EBT EBR WBL WBT WBR NBL NBT NBR SBL SBT SBR Lane Configurations Volume (veh/h) Sign Control Stop Stop Free Free Grade 0% 0% 0% 0% Peak Hour Factor Hourly flow rate (vph) Pedestrians Lane Width (m) Walking Speed (m/s) Percent Blockage Right turn flare (veh) Median type None None Median storage veh) Upstream signal (m) 88 px, platoon unblocked vc, conflicting volume vc1, stage 1 conf vol vc2, stage 2 conf vol vcu, unblocked vol tc, single (s) tc, 2 stage (s) tf (s) p0 queue free % cm capacity (veh/h) Direction, Lane # WB 1 SB 1 SB 2 SB 3 Volume Total Volume Left Volume Right csh Volume to Capacity Queue Length 95th (m) Control Delay (s) Lane LOS B Approach Delay (s) Approach LOS B Intersection Summary Average Delay 2.3 Intersection Capacity Utilization 28.6% ICU Level of Service A Analysis Period (min) 15 Delcan Synchro 8 - Report
44 Projected AM 5: Site & MacLaren Movement EBT EBR WBL WBT NBL NBR Lane Configurations Volume (veh/h) Sign Control Free Free Stop Grade 0% 0% 0% Peak Hour Factor Hourly flow rate (vph) Pedestrians Lane Width (m) Walking Speed (m/s) Percent Blockage Right turn flare (veh) Median type None None Median storage veh) Upstream signal (m) 130 px, platoon unblocked vc, conflicting volume vc1, stage 1 conf vol vc2, stage 2 conf vol vcu, unblocked vol tc, single (s) tc, 2 stage (s) tf (s) p0 queue free % cm capacity (veh/h) Direction, Lane # WB 1 NB 1 Volume Total Volume Left Volume Right 0 0 csh Volume to Capacity Queue Length 95th (m) Control Delay (s) Lane LOS A A Approach Delay (s) Approach LOS A Intersection Summary Average Delay 5.0 Intersection Capacity Utilization 16.5% ICU Level of Service A Analysis Period (min) 15 Delcan Synchro 8 - Report
45 Projected PM 2: Metcalfe & MacLaren Lane Group WBT NBT Lane Configurations Volume (vph) Lane Group Flow (vph) Turn Type NA NA Protected Phases 8 2 Permitted Phases Minimum Split (s) Total Split (s) Total Split (%) 33.3% 66.7% Yellow Time (s) All-Red Time (s) Lost Time Adjust (s) Total Lost Time (s) Lead/Lag Lead-Lag Optimize? Act Effct Green (s) Actuated g/c Ratio v/c Ratio Control Delay Queue Delay Total Delay LOS B A Approach Delay Approach LOS B A Queue Length 50th (m) Queue Length 95th (m) Internal Link Dist (m) Turn Bay Length (m) Base Capacity (vph) Starvation Cap Reductn 0 0 Spillback Cap Reductn 0 0 Storage Cap Reductn 0 0 Reduced v/c Ratio Intersection Summary Cycle Length: 75 Actuated Cycle Length: 75 Offset: 56 (75%), Referenced to phase 2:NBTL, Start of Green Natural Cycle: 45 Control Type: Pretimed Maximum v/c Ratio: 0.20 Intersection Signal Delay: 3.0 Intersection Capacity Utilization 36.2% Analysis Period (min) 15 Intersection LOS: A ICU Level of Service A Splits and Phases: 2: Metcalfe & MacLaren Delcan Synchro 8 - Report
46 Projected PM 3: O'Connor & Gilmour Lane Group EBT SBT Lane Configurations Volume (vph) Lane Group Flow (vph) Turn Type NA NA Protected Phases 4 6 Permitted Phases Minimum Split (s) Total Split (s) Total Split (%) 28.0% 72.0% Yellow Time (s) All-Red Time (s) Lost Time Adjust (s) Total Lost Time (s) Lead/Lag Lead-Lag Optimize? Act Effct Green (s) Actuated g/c Ratio v/c Ratio Control Delay Queue Delay Total Delay LOS B A Approach Delay Approach LOS B A Queue Length 50th (m) Queue Length 95th (m) Internal Link Dist (m) Turn Bay Length (m) Base Capacity (vph) Starvation Cap Reductn 0 0 Spillback Cap Reductn 0 0 Storage Cap Reductn 0 0 Reduced v/c Ratio Intersection Summary Cycle Length: 75 Actuated Cycle Length: 75 Offset: 62 (83%), Referenced to phase 6:SBTL, Start of Green Natural Cycle: 50 Control Type: Pretimed Maximum v/c Ratio: 0.38 Intersection Signal Delay: 7.2 Intersection Capacity Utilization 44.1% Analysis Period (min) 15 Intersection LOS: A ICU Level of Service A Splits and Phases: 3: O'Connor & Gilmour Delcan Synchro 8 - Report
47 Projected PM 4: Metcalfe & Gilmour Lane Group EBT NBT Lane Configurations Volume (vph) Lane Group Flow (vph) Turn Type NA NA Protected Phases 4 2 Permitted Phases Minimum Split (s) Total Split (s) Total Split (%) 36.0% 64.0% Yellow Time (s) All-Red Time (s) Lost Time Adjust (s) Total Lost Time (s) Lead/Lag Lead-Lag Optimize? Act Effct Green (s) Actuated g/c Ratio v/c Ratio Control Delay Queue Delay Total Delay LOS B A Approach Delay Approach LOS B A Queue Length 50th (m) Queue Length 95th (m) Internal Link Dist (m) Turn Bay Length (m) Base Capacity (vph) Starvation Cap Reductn 0 0 Spillback Cap Reductn 0 0 Storage Cap Reductn 0 0 Reduced v/c Ratio Intersection Summary Cycle Length: 75 Actuated Cycle Length: 75 Offset: 52 (69%), Referenced to phase 2:NBT, Start of Green Natural Cycle: 50 Control Type: Pretimed Maximum v/c Ratio: 0.31 Intersection Signal Delay: 10.0 Intersection Capacity Utilization 42.9% Analysis Period (min) 15 Intersection LOS: B ICU Level of Service A Splits and Phases: 4: Metcalfe & Gilmour Delcan Synchro 8 - Report
Re: Residential Development - Ogilvie/Cummings Transportation Overview
 1223 Michael Street, Suite 100, Ottawa, ON K1J 7T2 Tel: 613.738.4160 Fax: 613.739.7105 www.delcan.com March 28, 2012 OUR REF: TO3088TOY Barry J. Hobin & Architects 63 Pamilla Street Ottawa, ON K1S 3K7
Wellington Street West
 Transportation Brief prepared for: 185 Davenport Road Suite 300 Toronto, ON M5R 1J1 prepared by: 1223 Michael Street Suite 100 Ottawa, ON K1J 7T2 November 5, 2013 TO3131TOH Transportation Brief November
April Salvation Army Barrhaven Church 102 Bill Leathem Drive Transportation Brief
 April 26 Salvation Army Barrhaven Church 2 Bill Leathem Drive Transportation Brief Salvation Army Barrhaven Church 2 Bill Leathem Drive Transportation Brief prepared for: The Salvation Army 2 Overlea Blvd.
Re: Cyrville Road Car Dealership
 1223 Michael Street, Suite 100, Ottawa, ON K1J 7T2 Tel: 613.738.4160 Fax: 613.739.7105 www.delcan.com February 25, 2013 OUR REF: TO3098TOE Mark Motors of Ottawa 611 Montreal Road Ottawa, ON K1K 0T8 Attention:
1140 Wellington Street West Transportation Brief
 1140 Wellington Street West Transportation Brief October 2013 Study 1140 Wellington Type Street West October 2013 Study Transportation Name Brief February 2011 TB Check List TIS / TB/ CTS Check List prepared
Barrhaven Honda Dealership. Dealership Drive, Ottawa, ON. Transportation Brief
 Barrhaven Honda Dealership Dealership Drive, Ottawa, ON Transportation Brief Prepared By: NOVATECH Suite 200, 240 Michael Cowpland Drive Ottawa, Ontario K2M 1P6 September, 2015 File: 115136 Ref: R-2015-152
886 March Road McDonald's Transportation Study
 McDonald's Restaurants of Canada Limited March 2013 886 March Road McDonald's Transportation Study Submitted by: HDR Corporation 100 York Boulevard, Suite 300 Richmond Hill, ON L4B 1J8 (905) 882-4100 www.hdrinc.com
1012 & 1024 McGarry Terrace
 December 217 112 & 124 McGarry Terrace Transportation Impact Study 112 & 124 McGarry Terrace Transportation Impact Study prepared for: Lépine Corporation 32 March Road Kanata, ON K2K 2E3 prepared by: 1223
L1TILE BEARS DAY CARE TRANSPORTATION IMPACT STUDY FORT COLLINS, COLORADO MAY Prepared for:
 L1TILE BEARS DAY CARE TRANSPORTATION IMPACT STUDY FORT COLLINS, COLORADO MAY 2012 Prepared for: Hillside Construction, Inc. 216 Hemlock Street, Suite B Fort Collins, CO 80534 Prepared by: DELICH ASSOCIATES
700 Hunt Club Road. Transportation Impact Study - Addendum #1. Submitted by:
 700 Hunt Club Road Transportation Impact Study - Addendum #1 Submitted by: 14 June 2013 1223 Michael Street, Suite 100, Ottawa, ON K1J 7T2 Tel: 613.738.4160 Fax: 613.739.7105 www.delcan.com 14 June 2013
CitiGate Retail Development
 CitiGate Retail Development Transportation Impact Study prepared for: Trinity Development Group Inc. Sun Life Financial Centre, East Tower 3250 Bloor Street West, Suite 1000 Toronto, ON M8X 2X9 prepared
Village of Richmond Transportation Brief
 Village of Richmond Transportation Brief GENIVAR Project Number 111-18482-00 June 21 st, 2011 www.genivar.com GENIVAR 15 Fitzgerald Road, Suite 100 Ottawa, Ontario, CANADA K2H 9G1 Telephone: 613-829-2800
RESPONSE TO TRAFFIC IMPACT STUDY COMMENTS
 RESPONSE TO TRAFFIC IMPACT STUDY COMMENTS Proposed Gas Station 40 Arthur Street (Highway 26), Town of the Blue Mountains (Thornbury), County of Grey, Ontario AUGUST 2013 August 27, 2013 MR. REG RUSSWURM
MEMORANDUM. Date: November 4, Cheryl Burrell, Pebble Beach Company. Rob Rees, P.E. Inclusionary Housing Transportation Analysis WC
 MEMORANDUM Date: November 4, 2013 To: From: Subject: Cheryl Burrell, Pebble Beach Company Rob Rees, P.E. Inclusionary Housing Transportation Analysis As requested, Fehr & Peers is providing clarification
Provide an overview of the development proposal including projected site traffic volumes;
 December 19, 2013 File: 163600935 Attention: Troy Elliott Carl Elliott Limited 15-1831 Robertson Road PO Box 11117 Nepean, Ontario K1H 7T8 Dear Mr. Elliott, Reference: 2235 and 2265 Robertson Road Transportation
700 Hunt Club Road. Transportation Impact Study. Submitted by:
 700 Hunt Club Road Transportation Impact Study Submitted by: December 2012 700 Hunt Club Road Transportation Impact Study prepared for: Lone Star Group of Companies 472 Morden Road Unit 101 Oakville, ON
Lakeside Terrace Development
 Lakeside Terrace Development City of Barrie, County of Simcoe Traffic Brief for: Type of Document: Final Report Project Number: JDE 1617 Date Submitted: April 29 th, 216 4/29/16 John Northcote, P.Eng.
Traffic Impact Study Proposed Commercial Development Ballwin, Missouri. Technical Memorandum for Traffic Impact Study
 Traffic Impact Study Proposed Commercial Development Ballwin, Missouri Technical Memorandum for Traffic Impact Study Crawford, Bunte, Brammeier May 1, 2009 MEMORANDUM Date: April 24, 2009 To: From: Subject:
Traffic Impact Analysis Farmington Center Village
 Traffic Impact Analysis Farmington Center Village Route 4 (Farmington Avenue) Farmington, Connecticut Prepared for: The Town of Farmington, CT Prepared By: BL Companies Meriden, Connecticut December 2016
Table 1 - Land Use Comparisons - Proposed King s Wharf Development. Retail (SF) Office (SF) 354 6,000 10, Land Uses 1
 Office (SF) 354 6,000 10, Land Uses 1") Ref. No. 171-6694 Phase 2 November 23, 217 Mr. David Quilichini, Vice President Fares & Co. Developments Inc. 31 Place Keelson Sales Centre DARTMOUTH NS B2Y C1 Sent Via Email to David@faresinc.com RE:
Ref. No. 171-6694 Phase 2 November 23, 217 Mr. David Quilichini, Vice President Fares & Co. Developments Inc. 31 Place Keelson Sales Centre DARTMOUTH NS B2Y C1 Sent Via Email to David@faresinc.com RE:
Re: Sainte-Geneviève Elementary School (2198 Arch Street) Transportation Overview
 Transportation Overview") 2 March 2015 OUR REF: TO3205TOB00 Conseil des écoles catholiques du Centre-Est (CECCE) 4000 rue Labelle Ottawa, Ontario K1J 1A1 Attention: Maguy Eustache Dear Maguy: Re: Sainte-Geneviève Elementary School
2 March 2015 OUR REF: TO3205TOB00 Conseil des écoles catholiques du Centre-Est (CECCE) 4000 rue Labelle Ottawa, Ontario K1J 1A1 Attention: Maguy Eustache Dear Maguy: Re: Sainte-Geneviève Elementary School
Proposed Office Building Traffic Impact Study Chicago Avenue Evanston, Illinois
 Proposed Office Building Traffic Impact Study 1714-1720 Chicago Avenue Evanston, Illinois Prepared For: HOLABIRD & ROOT, LLC Prepared by: Eriksson Engineering Associates, Ltd. 145 Commerce Drive, Ste A,
Minto Mahogany Stage 2
 Minto Mahogany Stage 2 Transportation Impact Study prepared for: Minto Developments Inc 200-180 Kent Street Ottawa, ON K1P 0B6 prepared by: 1223 Michael Street Suite 100 Ottawa, ON K1J 7T2 June 27, 2017
CastleGlenn Consultants Inc.
 CastleGlenn Consultants Inc. Engineers, Project Managers & Planners March 11 th, 2013 Domenic Idone, P. Eng Planning Manager R.W. Tomlinson Ltd. 5597 Power Road Ottawa, Ontario K1G 3N4 Dear Mr. Idone:
1354 Carling Avenue. Community Transportation Study/ Transportation Impact Study
 354 Carling Avenue Community Transportation Study/ Transportation Impact Study prepared for: Holloway Lodging Corporation 69 Quinpool Road, th Floor Halifax, NS B3K 5J7 prepared by: 223 Michael Street
Sugarland Crossing Gwinnett County, Georgia
 Sugarland Crossing Gwinnett County, Georgia S IGNAL W ARRANT A NALYSIS For the Intersection of: Sugarloaf Parkway / Richards Middle School Driveway / Sugarland Crossing Main Site Driveway Prepared for:
MEMO. McCORMICK RANKIN CORPORATION. File FROM: Keyur Shah DATE: February 1, 2010 COPIES: OUR FILE: SUBJECT: TO:
 McCORMICK RANKIN CORPORATION 2655 North Sheridan Way Mississauga, Ontario, L5K 2P8 Tel: (905)823-8500 Fax: (905) 823-8503 E-mail: mrc@mrc.ca Website: www.mrc.ca MEMO TO: File FROM: Keyur Shah DATE: February
Wellings Communities Holding Inc and Extendicare (Canada) Inc Hazeldean Road. Transportation Impact Study. Ottawa, Ontario. Project ID
 Inc Hazeldean Road. Transportation Impact Study. Ottawa, Ontario. Project ID") Wellings Communities Holding Inc and Extendicare (Canada) Inc. 5731 Hazeldean Road Transportation Impact Study Ottawa, Ontario Project ID 160401195 Prepared by: Stantec Consulting Ltd. March 2016 WELLINGS
Wellings Communities Holding Inc and Extendicare (Canada) Inc. 5731 Hazeldean Road Transportation Impact Study Ottawa, Ontario Project ID 160401195 Prepared by: Stantec Consulting Ltd. March 2016 WELLINGS
TIS / TB/ CTS Check List
 Study Merivale Type Road Central Park Mixed-Use Development May 2011 Study TIS/CTS Name February 2011 CTS/TIS Check List TIS / TB/ CTS Check List prepared for: Ashcroft Homes 18 Antares Drive Ottawa, ON
 Traffic Analysis For Approved Uses within the St. Lucie West DRI Aldi Port St. Lucie, FL Prepared for: Bohler Engineering, LLC 1000 Corporate Drive Suite 250 Fort Lauderdale, FL 33334 Prepared by: 10795
Paisley & Whitelaw - Paisley Park OPA / ZBA for Mixed Density Residential Use
 Paisley & Whitelaw - Paisley Park OPA / ZBA for Mixed Density Residential Use Transportation Impact Study City of Guelph Prepared for: Armel Corporation August 2018 Table of Contents 1 Introduction...
(A) Project Manager, Infrastructure Approvals
 Project Manager, Infrastructure Approvals") February 14th, 2014 BY E-MAIL: wally.dubyk@ottawa.ca City of Ottawa Planning and Growth Management Branch 110 Laurier Ave. W., 4 th Floor, Ottawa, Ontario K1P 1J1 Attention: Wally Dubyk, C.E.T (A) Project
February 14th, 2014 BY E-MAIL: wally.dubyk@ottawa.ca City of Ottawa Planning and Growth Management Branch 110 Laurier Ave. W., 4 th Floor, Ottawa, Ontario K1P 1J1 Attention: Wally Dubyk, C.E.T (A) Project
Weaver Road Senior Housing Traffic Impact Analysis
 Gibson Traffic Consultants, Inc. 2813 Rockefeller Avenue Suite B Everett, WA 9821 425.339.8266 Weaver Road Senior Housing Traffic Impact Analysis Jurisdiction: City of Snohomish January 218 GTC #17-37
JRL consulting. March Hartland Developments Limited 1993 Hammonds Plains Road Hammonds Plains, NS B4B 1P3
 March 2015 Prepared for Hartland Developments Limited 1993 Hammonds Plains Road Hammonds Plains, NS B4B 1P3 JRL consulting JRL consulting TABLE OF CONTENTS 1 INTRODUCTION... 2 1.1 BACKGROUND... 2 2 EXISTING
MURRIETA APARTMENTS TRAFFIC IMPACT ANALYSIS CITY OF MURRIETA, CALIFORNIA
 MURRIETA APARTMENTS TRAFFIC IMPACT ANALYSIS CITY OF MURRIETA, CALIFORNIA SEPTEMBER 20, 2012 Prepared for: Golden Eagle Multi-Family Properties, LLC 6201 Oak Canyon Rd., Suite 250 Irvine, CA 92618 Prepared
Rockingham Ridge Plaza Commercial Development Halifax Regional Municipality
 Rockingham Ridge Plaza Commercial Development Halifax Regional Municipality Traffic Impact Study Final Draft Report Prepared by: GRIFFIN transportation group inc. 30 Bonny View Drive Fall River, NS B2T
Bennett Pit. Traffic Impact Study. J&T Consulting, Inc. Weld County, Colorado. March 3, 2017
 Bennett Pit Traffic Impact Study J&T Consulting, Inc. Weld County, Colorado March 3, 217 Prepared By: Sustainable Traffic Solutions, Inc. http://www.sustainabletrafficsolutions.com/ Joseph L. Henderson,
RE: 3605 Paul Anka Drive Addendum #2 to the December 2012 Traffic Impact Study
 19 May 2015 BY EMAIL: asaggarwal@gmail.com Manor Park Management 231 Brittany Drive, Suite D Ottawa, ON K1K 0R8 Attention: Mr. Anand Aggarwal RE: 3605 Paul Anka Drive Addendum #2 to the December 2012 Traffic
Traffic Impact Study Hudson Street Parking Garage MC Project No.: A Table of Contents
 Traffic Impact Study Hudson Street Parking Garage MC Project No.: 15001714A Table of Contents Table of Contents I. INTRODUCTION... 1 II. EXISTING CONDITIONS... 4 III. 2015 EXISTING TRAFFIC CONDITIONS...
RE: Taggart Retail Site Plan: Kanata West Proposal for Traffic Impact Study: Addendum #2
 1223 Michael Street, Suite 100, Ottawa, Ontario K1J 7T2 Tel: 613.738.4160 Fax: 613.739.7105 www.delcan.com July 9, 2014 OUR REF: TO3073TOK00 BY EMAIL: jparkes@taggart.ca/aturner@taggart.ca Taggart Commercial
MERIVALE PRIORITY SQUARE 2852 MERIVALE ROAD CITY OF OTTAWA TRANSPORTATION BRIEF. Prepared for: ONT Inc. 25 Winding Way Nepean, Ontario K2C 3H1
 MERIVALE PRIORITY SQUARE 2852 MERIVALE ROAD CITY OF OTTAWA TRANSPORTATION BRIEF Prepared for: 2190986ONT Inc. 25 Winding Way Nepean, Ontario K2C 3H1 October 6, 2010 110-502 Report_1.doc D. J. Halpenny
Salvini Consulting Inc. 459 Deer Ridge Drive Kitchener, ON N2P 0A November 8, 2017 Revised December 20, 2017
 Salvini Consulting Inc. 459 Deer Ridge Drive Kitchener, ON N2P 0A7 519-591-0426 November 8, 2017 Revised December 20, 2017 Laurie Wills, PEng Deputy Director of Public Works Town of Cobourg 740 Division
STANDARD LIMITATIONS
 STANDARD LIMITATIONS This report was prepared by MMM Group (MMM) for the account of Spire Construction Inc. (the Client). The disclosure of any information contained in this report is the sole responsibility
Ref. No Task 3. April 28, Mr. Cesar Saleh, P. Eng. VP Planning and Design W.M. Fares Group th
 Ref. No. 151-00564 Task 3 April 28, 2015 Mr. Cesar Saleh, P. Eng. VP Planning and Design W.M. Fares Group th 3480 Joseph Howe Drive, 5 Floor HALIFAX NS B3L 4H7 Sent via Email to ceasr.saleh@wmfares.com
Traffic Impact Study. Eastern Springs. A Proposed Development in Manorville, NY. April Haas Group Inc Transportation Planners and Engineers
 Traffic Impact Study For Eastern Springs A Proposed Development in Manorville, NY April 2018 Haas Group Inc Transportation Planners and Engineers Table of Contents 1) Executive Summary... 2 2) Study Purpose...
BARRHAVEN FELLOWSHIP CRC 3058 JOCKVALE ROAD OTTAWA, ONTARIO TRANSPORTATION BRIEF. Prepared for:
 BARRHAVEN FELLOWSHIP CRC 3058 JOCKVALE ROAD OTTAWA, ONTARIO TRANSPORTATION BRIEF Prepared for: Barrhaven Fellowship CRC 3058 Jockvale Road Ottawa, ON K2J 2W7 December 7, 2016 116-649 Report_1.doc D. J.
770 SOMERSET STREET RESIDENTIAL DEVELOPMENT
 Downtown North York by PFHLai / CC-BY-3. September 217 77 SOMERSET STREET RESIDENTIAL DEVELOPMENT Transportation Impact Assessment 77 Somerset Street Residential Development Transportation Impact Assessment
APPENDICES. APPENDIX D Synchro Level of Service Output Sheets
 APPENDICES APPENDIX D Synchro Level of Service Output Sheets Lanes, Volumes, Timings NO BUILD 2016 PM 8: 10th St & Thain Rd 10/05/2016 Lane Group NBL NBT NBR SBL SBT SBR SEL SET SER NWL NWT NWR
LOST LAKE CORRIDOR REVIEW
 LOST LAKE CORRIDOR REVIEW Prepared for: Prepared by: Broadview Developments Inc. c/o Westbrook Consulting Watt Consulting Group Our File: 2064.B01 Date: October 31, 2016 TABLE OF CONTENTS 1.0 INTRODUCTION...
RE: 67/71 Marquette Avenue Redevelopment Transportation Overview
 1223 Michael Street, Suite 100, Ottawa, Ontario K1J 7T2 Tel: 613.738.4160 Fax: 613.739.7105 www.delcan.com April 23, 2014 OUR REF: TO3157TOA00 BY EMAIL: mark.larose@urbanrisedevelopment.com Urban Rise
Traffic Impact Study Morgan Road Commerce Park Pasco County, Florida
 Traffic Impact Study Morgan Road Commerce Park Pasco County, Florida Summary Report June 2008 Prepared by: 12909 N 56 th Street # 201 Tampa, FL 33617 Ph: (813) 988-3180 Fax: (813) 343-6854 Morgan Road
10 th Street Residences Development Traffic Impact Analysis
 Gibson Traffic Consultants, Inc. 2813 Rockefeller Avenue Suite B Everett, WA 98201 425.339.8266 10 th Street Residences Development Traffic Impact Analysis Jurisdiction: City of Snohomish September 2018
Re: Addendum No. 4 Transportation Overview 146 Mountshannon Drive Ottawa, Ontario
 April 18 th, 2017 Mr. Kevin Yemm Vice President, Land Development Richraft Group of Companies 2280 St. Laurent Boulevard, Suite 201 Ottawa, Ontario (Tel: 613.739.7111 / e-mail: keviny@richcraft.com) Re:
RICHMOND OAKS HEALTH CENTRE 6265 PERTH STREET OTTAWA, ONTARIO TRANSPORTATION BRIEF. Prepared for: Guycoki (Eastern) Limited.
 Limited.") RICHMOND OAKS HEALTH CENTRE 6265 PERTH STREET OTTAWA, ONTARIO TRANSPORTATION BRIEF Prepared for: Guycoki (Eastern) Limited June 16, 2016 116-638 Brief_1.doc D. J. Halpenny & Associates Ltd. Consulting
RICHMOND OAKS HEALTH CENTRE 6265 PERTH STREET OTTAWA, ONTARIO TRANSPORTATION BRIEF Prepared for: Guycoki (Eastern) Limited June 16, 2016 116-638 Brief_1.doc D. J. Halpenny & Associates Ltd. Consulting
June 21, Mr. Jeff Mark The Landhuis Company 212 North Wahsatch Avenue, Suite 301. Colorado Springs, CO 80903
 LSC TRANSPORTATION CONSULTANTS, INC. 545 East Pikes Peak Avenue, Suite 210 Colorado Springs, CO 80903 (719) 633-2868 FAX (719) 633-5430 E-mail: lsc@lsctrans.com Website: http://www.lsctrans.com June 21,
Date: December 20, Project #:
 To: Craig Rottenberg Long s Jewelers 60A South Avenue Burlington, MA 01803 From: Patrick Dunford, P.E. Senior Project Manager Date: December 20, 2018 Project #: 14416.00 Re: Burlington Mall Proposed Long
KUM & GO 6400 WESTOWN PARKWAY WEST DES MOINES, IOWA 50266
 KUM & GO #300 PECOS STREET & 88 TH AVENUE THORNTON, COLORADO TRAFFIC IMPACT STUDY REVISION 1 PREPARED FOR KUM & GO 6400 WESTOWN PARKWAY WEST DES MOINES, IOWA 50266 JANUARY 23, 2014 OA PROJECT NO. 013-1721
ZINFANDEL LANE / SILVERADO TRAIL INTERSECTION TRAFFIC ANALYSIS
 ZINFANDEL LANE / SILVERADO TRAIL INTERSECTION TRAFFIC ANALYSIS UPDATED TRAFFIC STUDY FOR THE PROPOSED RAYMOND VINEYARDS WINERY USE PERMIT MODIFICATION #P11-00156 AUGUST 5, 2014 PREPARED BY: OMNI-MEANS,
TRANSPORTATION ANALYSIS. Wawa US 441 and Morningside Drive. Prepared for: Brightwork Real Estate, Inc.
 TRANSPORTATION ANALYSIS Wawa US 441 and Morningside Drive Prepared for: Brightwork Real Estate, Inc. TABLE OF CONTENTS Introduction... 1 Project Description... 1 Estimated Daily Project Traffic... 3 Estimated
Traffic Impact Analysis Update
 Willow Bend Traffic Impact Analysis Update TABLE OF CONTENTS Page I. INTRODUCTION -------------------------------------------------------------------------------------------- 1 II. EXISTING CONDITIONS
The Re:Queen and Sparks Traffic Brief - Addendum #2
 June 11, 2015 Ashcroft Homes 18 Antares Drive Ottawa, ON K2E 1A9 EMAIL: mpham@ashcrofthomes.com Attention: May Pham Development Planner Dear May, Re: The Re:Queen and Sparks Traffic Brief - Addendum #2
Sweetwater Landing Traffic Impact Analysis
 Gibson Traffic Consultants, Inc. 8 Rockefeller Avenue Suite B Everett, WA 98 45.9.8 Sweetwater Landing Traffic Impact Analysis Jurisdiction: City of Snohomish February 8 GTC #7-87 Sweetwater Landing Traffic
HCM Unsignalized Intersection Capacity Analysis 6: Brian Street & LC 111 5/26/2009
 6: Brian Street & LC 111 5/26/2009 Movement EBL EBR NBL NBT SBT SBR Volume (veh/h) 116 20 8 405 137 56 Sign Control Stop Free Free Grade 0% 0% 0% Peak Hour Factor 0.81 0.81 0.67 0.67 0.89 0.89 Hourly flow
MEMO. McCORMICK RANKIN CORPORATION. File Mark VanderSluis, Keyur Shah DATE: October 26, 2009 COPIES: OUR FILE: TO: FROM: Jack Thompson
 McCORMICK RANKIN CORPORATION 2655 North Sheridan Way Mississauga, Ontario, L5K 2P8 Tel: (95)823-85 Fax: (95) 823-853 E-mail: mrc@mrc.ca Website: www.mrc.ca MEMO TO: FROM: File Mark VanderSluis, Keyur Shah
DEVELOPMENT PROPERTY 1627 MAXIME STREET CITY OF OTTAWA TRANSPORTATION OVERVIEW. Prepared for: Subhas Bhargava. July 9, Overview_1.
 DEVELOPMENT PROPERTY 1627 MAXIME STREET CITY OF OTTAWA TRANSPORTATION OVERVIEW Prepared for: Subhas Bhargava July 9, 2015 115-620 Overview_1.doc D. J. Halpenny & Associates Ltd. Consulting Transportation
Half Moon Bay North Apartment Block Transportation Impact Assessment. Full Report. March 15, Prepared for: Mattamy Homes.
 Half Moon Bay North Apartment Block Transportation Impact Assessment Full Report March 15, 2018 Prepared for: Mattamy Homes Prepared by: Stantec Consulting Ltd. Table of Contents 1.0 SCREENING... 1 1.1
Vanier Parkway and Presland Road Residential Development Transportation Impact Study
 Vanier Parkway and Presland Road Residential Development Transportation Impact Study Final Report (Revised) March 2011 Submitted to: Groupe Lépine Ottawa Project No. 09-1613 Submitted by: Groupe Lépine
MMM Group Limited. Communities. Transportation. Buildings. Infrastructure
 MMM Group Limited Traffic Study CASA MIA Community Care Facility Vancouver, BC Communities Transportation Buildings Infrastructure February 2013 5011001-033 STANDARD LIMITATIONS This report was prepared
One Harbor Point Residential
 Residential Gig Harbor, WA Transportation Impact Analysis January 23, 2017 Prepared for: Neil Walter Company PO Box 2181 Tacoma, WA 98401 Prepared by: TENW Transportation Engineering NorthWest 11400 SE
Aldridge Transportation Consultants, LLC Advanced Transportation Planning and Traffic Engineering
 Aldridge Transportation Consultants, LLC Advanced Transportation Planning and Traffic Engineering John M.W. Aldridge, PE, PTOE, AICP 1082 Chimney Rock Road Colorado Registered Professional Engineer Highlands
TECHNICAL MEMORANDUM Upper Broadway Road Diet Summary of Findings
 TECHNICAL MEMORANDUM Summary of Findings Date: June 17, 2014 Project #: 17121.15 To: Si Lau, P.E.; City of Oakland, CA From: Erin Ferguson, P.E.; Aaron Elias, P.E.; Daphne Dethier; and Mark Bowman, P.E.;
Oakbrook Village Plaza City of Laguna Hills
 Oakbrook Village Plaza City of Laguna Hills Traffic Impact Analysis Prepared by: HDR Engineering 3230 El Camino Real, Suite 200 Irvine, CA 92602 October 2012 Revision 3 D-1 Oakbrook Village Plaza Laguna
Prepared For: Toronto Transit Commission 1138 Bathurst Street Toronto, Ontario M5R 3H2. Prepared By:
 TRAFFIC IMPACT STUDY FOR THE TTC MCNICOLL BUS GARAGE CITY OF TORONTO Prepared For: Toronto Transit Commission 1138 Bathurst Street Toronto, Ontario M5R 3H2 Prepared By: Canada Inc. 4th Floor, 3 Leek Crescent
830 Main Street Halifax Regional Municipality
 830 Main Street Halifax Regional Municipality Traffic Impact Statement Final Report Prepared by: GRIFFIN transportation group inc. 30 Bonny View Drive Fall River, NS B2T 1R2 www.griffininc.ca Prepared
Addendum to Traffic Impact Analysis for Port Marigny Site Mandeville, LA
 Addendum to Traffic Impact Analysis for Port Marigny Site Mandeville, LA (St. Tammany Parish Mandeville, LA) Prepared For The Pittman Companies Michael N Pittman, MD 328 East Boston St Covington, LA 70433
Parking/Traffic Assessment Study
 Brock Road Industrial Mall 985 Brock Road South City of Pickering Parking/Traffic Assessment Study Prepared by: Tranplan Associates, Toronto Toronto 416-670-2005 Sudbury 705-522-0272 Peterborough 705-874-3638
ARVADA TRIANGLE REDEVELOPMENT TRAFFIC IMPACT ANALYSIS
 ARVADA TRIANGLE REDEVELOPMENT TRAFFIC IMPACT ANALYSIS Prepared for: Arvada Urban Renewal Authority 5601 Olde Wadsworth Boulevard, Suite 210 Arvada, Colorado 80002 (720) 898-7062 Prepared by: Felsburg Holt
GASOLINE SERVICE STATION 1618, 1622 ROGER STEVENS DRIVE OTTAWA, ONTARIO TRANSPORTATION IMPACT ASSESSMENT. Prepared for:
 GASOLINE SERVICE STATION 1618, 1622 ROGER STEVENS DRIVE OTTAWA, ONTARIO TRANSPORTATION IMPACT ASSESSMENT Prepared for: Invecta Development (Ottawa) Corporation 758 Shanks Height Milton, ON L9T 7P7 May
Re: 233 Armstrong Street Residential Condominium Traffic Brief
 1223 Michael Street, Suite 100, Ottawa, ON K1J 7T2 Tel: 613.738.4160 Fax: 613.739.7105 www.delcan.com August 8, 2008 TO3031TOP00 BY E-MAIL: gerry.lalonde@rogers.com Spencedale Properties 7 Cobb Court Ottawa,
Alpine Highway to North County Boulevard Connector Study
 Alpine Highway to North County Boulevard Connector Study prepared by Avenue Consultants March 16, 2017 North County Boulevard Connector Study March 16, 2017 Table of Contents 1 Summary of Findings... 1
INTERSECTION ANALYSIS PARK AVENUE AND BRADDOCK ROAD (FROSTBURG, MD) FOR LENHART TRAFFIC CONSULTING, INC.
 FOR LENHART TRAFFIC CONSULTING, INC.") INTERSECTION ANALYSIS FOR PARK AVENUE AND BRADDOCK ROAD (FROSTBURG, MD) Prepared for: City of Frostburg, Maryland & Allegany County Commissioners Prepared by: LENHART TRAFFIC CONSULTING, INC. TRAFFIC ENGINEERING
INTERSECTION ANALYSIS FOR PARK AVENUE AND BRADDOCK ROAD (FROSTBURG, MD) Prepared for: City of Frostburg, Maryland & Allegany County Commissioners Prepared by: LENHART TRAFFIC CONSULTING, INC. TRAFFIC ENGINEERING
370 Queen Elizabeth Drive Transportation Overview
 December 8, 2014 OUR REF: TO3193TOA BY EMAIL: Ashley@rocahomes.ca 2253644 Ontario Inc. c/o BassCon 24 George Street West Ottawa, ON K1S 3J2 Attention: Ashley Lepine Dear Ashley: Re: 370 Queen Elizabeth
BUCKLEY ANNEX REDEVELOPMENT PLAN TRANSPORTATION ANALYSIS ADDENDUM
 BUCKLEY ANNEX REDEVELOPMENT PLAN TRANSPORTATION ANALYSIS ADDENDUM Prepared for: City and County of Denver Prepared by: Contact: Brian Bern, P.E., PTOE 303.572.0200 On Behalf of: Lowry Redevelopment Authority
Downtown One Way Street Conversion Technical Feasibility Report
 Downtown One Way Street Conversion Technical Feasibility Report As part of the City s Transportation Master Plan, this report reviews the technical feasibility of the proposed conversion of the current
Ingraham High School Parking and Traffic Analysis
 Parking and Traffic Analysis Seattle, WA Prepared for: URS Corporation 1501 4th Avenue, Suite 1400 Seattle, WA 98101-1616 Mirai Transportation Planning & Engineering 11410 NE 122nd Way, Suite 320 Kirkland,
County State Aid Highway 30 (Diffley Road) and Dodd Road Intersection Study
 and Dodd Road Intersection Study") County State Aid Highway 30 (Diffley Road) and Dodd Road Intersection Study City of Eagan, Dakota County, Minnesota Date: March 2012 Project No. 14957.000 444 Cedar Street, Suite 1500 Saint Paul, MN 55101
County State Aid Highway 30 (Diffley Road) and Dodd Road Intersection Study City of Eagan, Dakota County, Minnesota Date: March 2012 Project No. 14957.000 444 Cedar Street, Suite 1500 Saint Paul, MN 55101
Manotick Plaza, Manotick Main Street - Traffic Impact Brief
 March 28 th, 2013 Mr. Nicholas Caragianis Nicholas Caragianis Architect Inc. 137 Pamilla Street Ottawa, ON K1S 3K9 [Tel: 613 237-6801 ext. 222 / Fax: 613 237-8289 / E-mail: nicholas@ncarchitect.ca] Dear
Aldridge Transportation Consultants, LLC Advanced Transportation Planning and Traffic Engineering
 Aldridge Transportation Consultants, LLC Advanced Transportation Planning and Traffic Engineering John M.W. Aldridge, PE, PTOE, AICP 1082 Chimney Rock Road Colorado Registered Professional Engineer Highlands
RE: A Traffic Impact Statement for a proposed development on Quinpool Road
 James J. Copeland, P.Eng. GRIFFIN transportation group inc. 30 Bonny View Drive Fall River, NS B2T 1R2 May 31, 2018 Ellen O Hara, P.Eng. Project Engineer DesignPoint Engineering & Surveying Ltd. 200 Waterfront
Appendix B: Traffic Reports
 Appendix B: Traffic Reports 407 TRANSITWAY - KENNEDY ROAD TO BROCK ROAD MINISTRY OF TRANSPORTATION - CENTRAL REGION Report Markham Road Station Traffic Study Prepared for Ministry of Transportation, Ontario
LAWRENCE TRANSIT CENTER LOCATION ANALYSIS 9 TH STREET & ROCKLEDGE ROAD / 21 ST STREET & IOWA STREET LAWRENCE, KANSAS
 LAWRENCE TRANSIT CENTER LOCATION ANALYSIS 9 TH STREET & ROCKLEDGE ROAD / 21 ST STREET & IOWA STREET LAWRENCE, KANSAS TRAFFIC IMPACT STUDY FEBRUARY 214 OA Project No. 213-542 TABLE OF CONTENTS 1. INTRODUCTION...
Zachary Bugg, PhD, Diego Arguea, PE, and Phill Worth University of Oregon North Campus Conditional Use Permit Application Transportation Assessment
 MEMORANDUM Date: June 22, 2018 Project #: 21562 To: Colin McArthur, AICP From: Project: Subject: Zachary Bugg, PhD, Diego Arguea, PE, and Phill Worth University of Oregon North Campus Conditional Use Permit
TRAFFIC IMPACT STUDY DERRY GREEN CORPORATE BUSINESS PARK MILTON SECONDARY PLAN MODIFICATION
 TRAFFIC IMPACT STUDY DERRY GREEN CORPORATE BUSINESS PARK MILTON SECONDARY PLAN MODIFICATION TRAFFIC IMPACT STUDY DERRY GREEN CORPORATE BUSINESS PARK MILTON SECONDARY PLAN MODIFICATION DECEMBER 2014 UPDATED
Trim Road, Commercial Development, City of Ottawa
 HARDEN REALTIES July 2016 Trim Road, Commercial Development, City of Ottawa Transportation Impact Study Trim Road, Commercial Development, City of Ottawa Transportation Impact Study prepared for: Harden
Transit City Etobicoke - Finch West LRT
 Delcan Corporation Transit City Etobicoke - Finch West LRT APPENDIX D Microsimulation Traffic Modeling Report March 2010 March 2010 Appendix D CONTENTS 1.0 STUDY CONTEXT... 2 Figure 1 Study Limits... 2
Dartmouth, NS B3B 1X7 Tel: WSP. Canada Inc.
 Traffic Impact Study: Proposed Residential Development Herring Cove Road Halifax, NS Presented to: FH Construction Ltd. 1 Spectacle Lake Drive Dartmouth, NS B3B 1X7 Tel: 902 835 9955 Fax: 902 835 1645
TRAFFIC DATA. Existing Derousse Ave./River Rd. AM LOS Analysis Existing Derousse Ave./River Rd. PM LOS Analysis
 Appendix E NJ TRANSIT Pennsauken Junction Transit Center and Park & Ride RiverLINE and Atlantic City Line Pennsauken Township, Camden County, New Jersey TRAFFIC DATA Background Traffic Information for
D & B COMMERCIAL TRAFFIC IMPACT ANALYSIS
 D & B COMMERCIAL TRAFFIC IMPACT ANALYSIS TABLE OF CONTENTS I. Introduction...3 II. Project Description...3 III. Existing Conditions...3 IV. Future Traffic Conditions...8 V. Conclusions and Mitigation...14
Appendix I: The Project Traffic Impact Study report by TJKM Transportation Consultants
 Appendix I: The Project Traffic Impact Study report by TJKM Transportation Consultants TJKM Transportation Consultants Draft Report Traffic Impact Study for the Residential Development at 4659 Proctor
105 Toronto Street South, Markdale Transportation Impact Study. Paradigm Transportation Solutions Limited
 105 Toronto Street South, Markdale Transportation Impact Study Paradigm Transportation Solutions Limited December 2016 Project Summary Project Number 162060 December 2016 Client Zelinka Priamo Ltd 318