DRAFT WATERMAN GARDENS MASTER PLAN TRAFFIC IMPACT STUDY
|
|
|
- Darrell Curtis
- 5 years ago
- Views:
Transcription


1 DRAFT WATERMAN GARDENS MASTER PLAN TRAFFIC IMPACT STUDY PREPARED FOR: Housing Authority of the County of San Bernardino Pyatok Architects The Planning Center/DCE PREPARED BY: 3850 Vine Street, Suite 140 Riverside, CA p (951) July 2012
2 TABLE OF CONTENTS EXECUTIVE SUMMARY... i 1. ANALYSIS PARAMETERS... 1 PROPOSED PROJECT... 1 PROJECT STUDY AREA... 4 ANALYSIS SCENARIOS... 4 ANALYSIS METHODOLOGIES... 6 TRAVEL DEMAND FORECASTING... 7 CUMULATIVE PROJECTS... 7 SIGNIFICANCE CRITERIA EXISTING CONDITIONS EXISTING ROADWAY FACILITIES EXISTING BUS TRANSIT FACILITIES BICYCLE NETWORK PEDESTRIAN NETWORK TRAFFIC VOLUMES AND LANE CONFIGURATIONS EXISTING INTERSECTION OPERATIONS PROJECT OPENING YEAR (2013) NO PROJECT TRAFFIC CONDITIONs TRAFFIC VOLUMES ROADWAY IMPROVEMENTS INTERSECTION OPERATIONS PROJECT OPENING YEAR (2013) PLUS PROJECT TRAFFIC CONDITIONS TRAFFIC VOLUMES ROADWAY IMPROVEMENTS INTERSECTION OPERATIONS IMPACT ASSESSMENT FUTURE BUILDOUT YEAR (2033) TRAFFIC CONDITIONS TRAFFIC VOLUMES ROADWAY IMPROVEMENTS INTERSECTION OPERATIONS IMPACT ASSESSMENT FINDINGS AND MITIGATION MEASURES SUMMARY OF PROJECT IMPACTS RECOMMENDED MITIGATION MEASURES FAIR SHARE CONTRIBUTIONS PROJECT IMPROVEMENTS PROJECT SITE PLAN REVIEW PROJECT OVERVIEW PROJECT IMPACT... 37
3 APPENDICES APPENDIX A: EXISTING TRAFFIC COUNTS APPENDIX B: EXISTING LOS RESULTS APPENDIX C: OPENING YEAR (2013) LOS RESULTS APPENDIX D: OPENING YEAR (2013) PLUS PROJECT LOS RESULTS APPENDIX E: CUMULATIVE BASE (2033) LOS RESULTS APPENDIX F: CUMULATIVE (2033) PLUS PROJECT LOS RESULTS APPENDIX G: MITIGATION AND NEW SIGNAL LOS RESULTS APPENDIX H: CUMULATIVE PROJECTS LIST APPENDIX I: CITY OF SAN BERNARDINO REFERENCE DOCUMENTS APPENDIX J: PROJECT SCOPING FORM
4 LIST OF FIGURES FIGURE I POTENTIAL MITIGATION MEASURES... II FIGURE 1 PROJECT SITE PLAN... 3 FIGURE 2 - PROJECT LOCATION AND STUDY INTERSECTIONS... 5 FIGURE 3 MAP OF PENDING AND APPROVED PROJECTS... 9 FIGURE 4 EXISTING LANE CONFIGURATIONS AND PEAK HOUR TRAFFIC VOLUMES FIGURE 5 OPENING YEAR (2013) NO PROJECT LANE CONFIGURATIONS AND PEAK HOUR TRAFFIC VOLUMES FIGURE 6 GENERAL PROJECT TRIP DISTRIBUTION FIGURE 7 PROJECT TRIP DISTRIBUTION BY INTERSECTION FIGURE 8 PROJECT ONLY FUTURE LANE CONFIGURATIONS AND PEAK HOUR TRAFFIC VOLUMES 25 FIGURE 9 PROJECT TRIP ASSIGNMENT AT ACCESS DRIVEWAYS FIGURE 10 OPENING YEAR (2013) PLUS PROJECT LANE CONFIGURATIONS AND PEAK HOUR TRAFFIC VOLUMES FIGURE 11 FUTURE BUILDOUT YEAR (2033) NO PROJECT LANE CONFIGURATIONS AND PEAK HOUR TRAFFIC VOLUMES FIGURE 12 FUTURE BUILDOUT YEAR (2033) PLUS PROJECT LANE CONFIGURATIONS AND PEAK HOUR TRAFFIC VOLUMES LIST OF TABLES TABLE 1 - INTERSECTION LOS CRITERIA... 6 TABLE 2 - SIGNIFICANCE CRITERIA... 8 TABLE 3 - INTERSECTION LEVELS OF SERVICE: EXISTING CONDITIONS TABLE 4 - INTERSECTION LEVELS OF SERVICE: OPENING YEAR (2013) NO PROJECT TABLE 5 - PROJECT TRIP GENERATION TABLE 6 - INTERSECTION LEVELS OF SERVICE: OPENING YEAR (2013) PLUS PROJECT TABLE 7 - IMPACTS FOR SIGNALIZED INTERSECTIONS: OPENING YEAR (2013) PLUS PROJECT TABLE 8 - INTERSECTION LEVELS OF SERVICE: FUTURE BUILDOUT YEAR (2033) NO PROJECT TABLE 9 - INTERSECTION LEVELS OF SERVICE: FUTURE BUILDOUT YEAR (2033) PLUS PROJECT TABLE 10 - IMPACTS FOR SIGNALIZED INTERSECTIONS: FUTURE BUILDOUT YEAR (2033) PLUS PROJECT... 34
5 Draft Traffic Impact Study for Waterman Gardens Master Plan, San Bernardino, CA July 2012 EXECUTIVE SUMMARY Fehr & Peers has completed an assessment for the proposed Waterman Gardens Master Plan project proposing to demolish an existing 252 multi-familrecreational facility, community support center, community care facility, administration and community room, community and construct 411 new multi-family dwelling units with a recycling facility, and shop and youth/jobs training facility. The project is bounded by Base Line Street to the north, La Junita Street to the east, Olive Street to the south and Waterman Avenue to the west in the City of San Bernardino. Six access driveways are proposed for the site. Additional pedestrian and bicycle access will be provided throughout the site. The project proposes to also install traffic signals at the intersections of the Stater Bros. lot north of the site at Base Line Street and extend it into the project site (proposed Alder Street). A traffic signal is also proposed at the intersection of Waterman Avenue at Olive Street. The driveways along La Junita Street and Olive Street will be side-street stop-controlled. Signal modifications have been proposed for the Waterman Avenue at Base Line Street and Crestview Avenue at Base Line intersection. All of the project driveways are full-access with one entrance and one exit lane. The project will realign Crestview Avenue south of Base Line Street to directly oppose Crestview Avenue north of Base Line Street. Orange Street at Waterman Avenue will also be realigned approximately 200 feet north to directly oppose Orange Street west of Waterman Avenue and remain side-street stoop-controlled on Orange Street. Internally, Orange Street, portions of Crestview Avenue, and portions of Alder Street will remain, but several street name changes are proposed for the project site. Elm Circle and Sycamore Circle will be demolished. As part of Fehr & Peers assessment and consistent with City Traffic Study Guidelines, the following scenarios were evaluated: Existing Conditions (2011) Consists of existing counts collected in the study area. Opening Year (2013) Conditions Applies an ambient growth rate of 3% per year to existing traffic volumes. This assessment provides an estimate of traffic conditions in the project s proposed opening year of Opening Year (2013) Plus Project Conditions Applies traffic generated from the proposed project to Opening Year (2013) volumes. Future Buildout No Project (2033) Conditions Applies an ambient growth of o 3% per year to existing traffic volumes in addition to traffic generated from pending and approved projects in the vicinity of the proposed project. Future Buildout (2033) plus Project Conditions Applies traffic generated from the proposed project to Cumulative Base (2033) traffic volumes. Significant impacts were identified and measures to mitigate impacts were recommendations are summarized on Figure I. recommended. These i
6
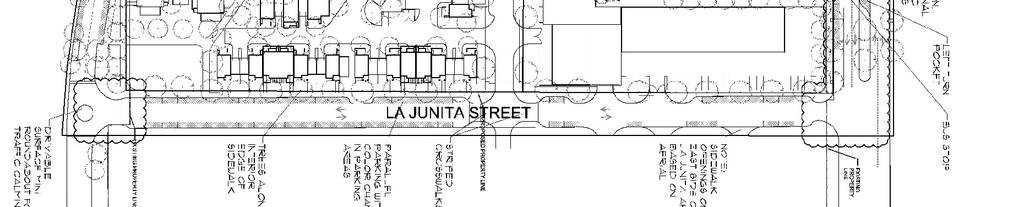
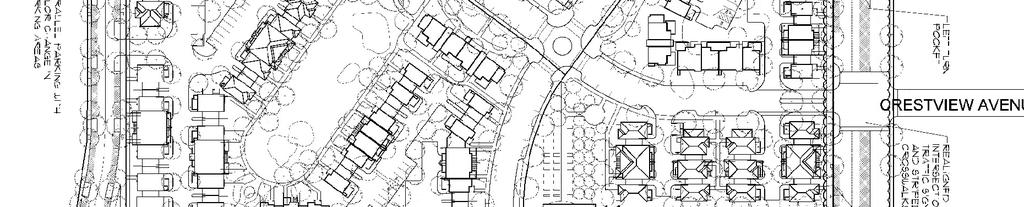
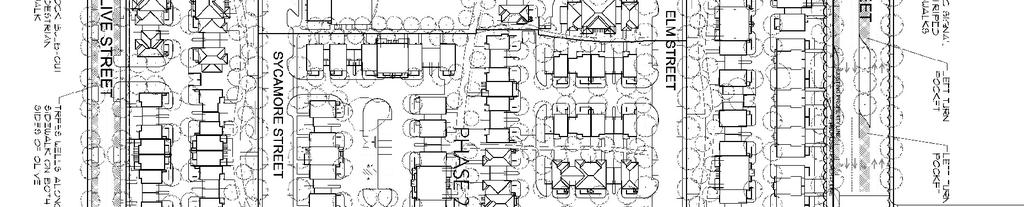
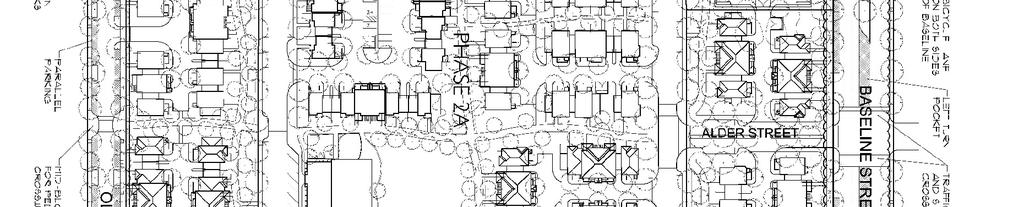
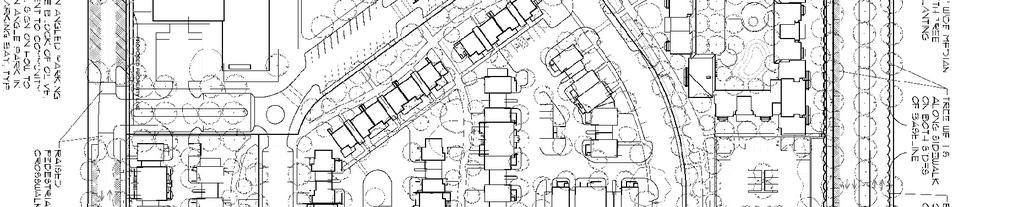
7 Draft Traffic Impact Study for Waterma an Gardens Master Plan, San Bernardino, CA July ANALYSIS PARAMETERS This chapter outlines the geographic scope of the traffic impact analysis, including study intersections and roadways, and analysis methodologies and significance criteria employed in this study. PROPOSED PROJECT Project Description The Waterman Gardens Master Plan project proposes to redevelop an existing 252 residential community at the southeast corner of Waterman Avenue and Base Line Street in the City of San Bernardino and construct a comprehensive mixed-use development with residential and community recreational uses. The Waterman Gardens site is a public housing development owned by the Housing Authority of the County of San Bernardino aimed at providing affordable housing. Proposed for the site are 411 multi-family dwelling units and a 114,000 square feet community center that will include a recycling facility and youth/job training facility. Completion of the project is expected in Interstate 210 (I-210) runs east-wes approximately two miles north of the project site, the I-10 freeway runs east west approximately four miles south of the project site, and the I-215 freeway runs north-south approximately one and a half miles west of the project site. Directly north of the project are a shopping center and residential land uses. Directly south of the project site are a shopping center, Neal Roberts Elementary School, Sierra High School, and a church. Directly east of the project is an industrial land use and directly west of the project are a fast-food restaurant and residential land uses. Parking The project proposes to provide on and off-street parking for members living in the community and patrons using the community center. Access There are six access points for the proposed Waterman Gardens project, as described below. The project site plan is shown on Figure 1. Base Line Street access There are two proposed access driveways on the northern border of the project site at Base Line Street. One driveway (to be Alder Street) will be located mid-block of the project, directly across from the Stater Bros. shopping center driveway north of the site. This driveway will be signalized. The second driveway will be realigned directly across from Crestview Avenue and signalized. Both driveways will be full-access with one entrance and one exit lane. It is recommended in the design of the Alder Street driveway, however, that one left turn lane and one shared through-right turn lane be provided on the north-southh driveways. La Junita Street access There is one access driveway on the eastern border of the project site at La Junita Street and Orange Street. This driveway is currently facing the driveway of the industrial land use east of the site with one entrance and one exit lane. The driveway will be stop-controlled are two access driveways on the southern border of the project site on Olive on the proposed Elm Street. Olive Street access Theree Street. The most eastern driveway will face Neal Roberts Elementary school, and the most western driveway will face the shopping center. Both driveways will be side-street stop controlled, full-access with one entrance and one exit lane. 1
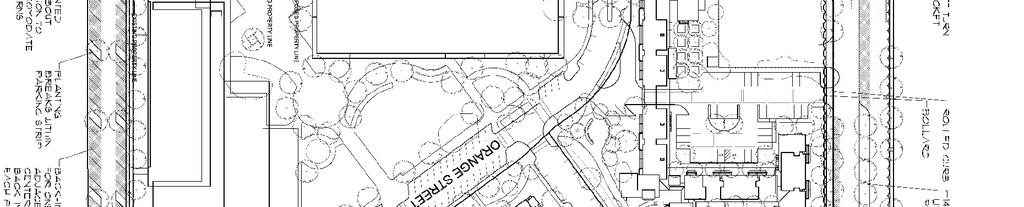
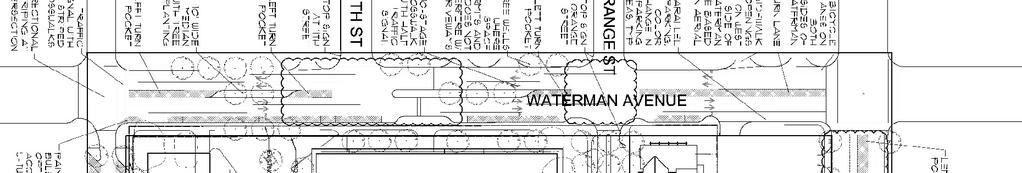
8 Draft Traffic Impact Study for Waterma an Gardens Master Plan, San Bernardino, CA July 2012 Waterman Avenue access Currently, the driveway on Orange Street and Waterman Avenue faces an opposing driveway at the Wienerschnitzel fast-food restaurant. This driveway will be realigned with Orange Street, approximately 200 feet north of its current location. The driveway will be stop-controlled on Orange Street, full-access with one entrance and one exit lane. In addition, a pedestrian signal separated by a raised median is proposed on Waterman Avenue, between Orange Street and 11 th Street. This signall will only be accessible to pedestrians and bicyclists and only flash when triggered by a non-motorist traveller. Pedestrian sidewalks are provided along all borders around and throughout the project site. Striped bicycle lanes are also proposed in both directions of travel along project boundaries on Waterman Avenue and Base Line Street. 2
9
10 Draft Traffic Impact Study for Waterma an Gardens Master Plan, San Bernardino, CA July 2012 PROJECT STUDY AREA Ten study intersections were selected for evaluation in this study in collaboration with City staff, as documented in the Project Scoping Form attached to this document. The project site and study intersections are identified below and shown on Figure E Street at Base Line Street 2. Waterman Avenue at Highland Avenue 3. Waterman Avenue at Base Line Street 4. Waterman Avenue at Orange Street 5. Waterman Avenue at Olive Street 6. Waterman Avenue at 5 th Street 7. Crestview Avenue at Base Line Street 8. La Junita Street at Base Line Street 9. La Junita Street at Orange Street 10. Del Rosa Drive at Base Line Street ANALYSIS SCENARIOS To identify significant project impacts, Fehr & Peers evaluated the following scenarios as part of the proposed project consistent with the City of San Bernardino Traffic Impact Analysis Guidelines and the requirements set forth in the San Bernardino County Congestion Management Program (CMP): Existing Conditions Consists of existing (May 2011) counts collected at the study intersection locations. Existing counts were conducted on May 4, 2011 from 7:00 to 9:00 AM for the morning peak hour and from 4:00 to 6:00 PM for the evening peak hour. Project Opening Year (2013) Base Conditions Consists of the Existing Conditions traffic volumes plus an annual growth factor of three percent per year over the two-year period between the existing counts and the project opening year. Project Opening Year (2013) plus Project Conditions Consists of Project Opening Year (2013) Base Conditions plus traffic generated from the proposed project. Future Build-Out Year (2033) Base Conditions Consists of Existing Conditions traffic volumes plus a three percent per year growth factor plus traffic generated from approved and pending projects in the proposed project s vicinity. Future Build-Out Year (2033) plus Project Conditions Consists of Future Build-Out Year (2033) Base Conditions plus traffic generated from the proposed project. The scenarios described above were evaluated during the weekday morning and evening peak hours. Appendix A provides the intersection counts sheets for all analyzed intersections. 4
11
12 Draft Traffic Impact Study for Waterma an Gardens Master Plan, San Bernardino, CA July 2012 ANALYSIS METHODOLOGIES Fehr & Peers analysis of intersections employs a methodology based on empirical research conducted by the Transportation Research Board and other authorities. Signalized and unsignalized intersection operations were evaluated using methodologies provided in Highway Capacity Manual (HCM 2000) (Transportation Research Board), are considered the state-of-the-practice methodologies for evaluating intersection operations, and are consistent with the City of San Bernardino and CMP analysis requirements. The HCM 2000 methodology for signalized and all-way stop-controlled intersections estimates the average control delay for the vehicle at the intersection. For side-street stop-controlled intersections, the methodology estimates the control delays for each turning movement and identifies the delay for the longest delayed approach (if there is a shared lane, delay is averaged for all turning movements from that lane). After the quantitative delay estimates are complete, the methodology assigns a qualitative letter grade that represents the operations of the intersection. These grades range from level of service (LOS) A (minimal delay) to LOS F (excessive congestion). LOS E represents at-capacity operations. Descriptions of the LOS letter grades for signalized and unsignalized intersections are provided in Table 1. TABLE 1 - INTERSECTION LOS CRITERIA Level of Service Description Signalized Delay (Seconds) Unsignalized Delay ( Seconds) Volume-to- Capacity (V/C) Ratio A B C D E F Operations with very low delay occurring with favorable progression and/or short cycle length. Operations with low delay occurring with good progression and/or shortt cycle lengths. Operations with averagee delays resulting from fair progression and/or longer cycle lengths. Individual cycle failures begin to appear. Operations with longer delays due to a combination of unfavorable progression, long cycle lengths, or high V/C ratios. Many vehicles stop and individual cycle failures are noticeable. Operations with high delay values indicating poor progression, long cycle lengths, and high V/C ratios. Individual cycle failures are frequent occurrences. Operation with delays unacceptable to most drivers occurring due to over saturation, poor progression, or very long cycle lengths. < 15.0 < > 15.0 to 25.0 >10.00 to > 25.0 to 35.0 >15.0 to > 35.0 to 55.0 >25.0 to > 55.0 to 80.0 >35.0 to > 80.0 >50.0 Greater than Source: Highway Capacity Manual (Transportationn Research Board, 2000). For all of the signalized and unsignalized intersections, Synchro software version was used to calculate delays and associated levels of service. Per the County CMP requirements, the following assumptions were included in the level of service assessment: 2% heavy vehicles at the study intersections Existing and Opening Year peak hour factor (PHF) was based on the counts collected 6
13 Draft Traffic Impact Study for Waterma an Gardens Master Plan, San Bernardino, CA July 2012 Future Build-Out Year PHF is 0.95 Existing and Opening Year saturation flow rates assumed to be: o 1800 for exclusive through and exclusive right o 1700 for exclusive left o 1600 for dual lefts Future Build-Out Year saturation flow rates assumed to be: o 1900 for exclusive through and exclusive right o 1800 for exclusive left o 1700 for dual lefts Existing signal timings based on timing data received from City staff For Future Build-Out Year, timing splits were optimized for uncoordinated intersections and a maximum cycle length of 130 secondss was utilized TRAVEL DEMAND FORECASTING The City of San Bernardino Traffic Study guidelines contain the following language: Use of the City s East Valley Travel Forecast Model or other approved model may be required to determine the future traffic volumes and growth. In the absence of traffic model information, the future build-out year base traffic volumes shall be estimated using an annual growth factor of 3 percent per year, unless a different rate can be justified and is approved and/or required by the City Engineer. The use of a locally valid Travel Demand Forecasting (TDF) model generally provides the most accurate results as the purpose of a TDF model is to accurately estimate the change in volume of a roadway given changes in land use and changes in the transportation network. For this project, Fehr & Peers reviewed the model developed for the City of San Bernardino s general plan, the East Valley travel forecasting model, and the Southern California Association of Governments (SCAG) model; all of which include the San Bernardino area. Additionally, SANBAG is currently developing a focused travel demand model for San Bernardino County, which should be completed later this year, and would supersede use of the East Valley or SCAG models in San Bernardino County. Once completed, that model should incorporate the most up to date information for the City of San Bernardino and would be a more appropriate tool to utilize for the assessment. Therefore, in conformance with the City s guidelines, we applied a 3% per year growth rate to existing volumes to develop future conditions. To develop a conservative assessment of future conditions, manual assignment of trips from approved and pending projects in the project study area were also applied to future year forecasts. CUMULATIVE PROJECTS Cumulative projects are defined as all projects that were pending, approved, or under construction in the City of San Bernardino as of May This list was supplied by the City of San Bernardino planning staff. The 2033 scenario therefore analyzes the cumulative conditions impacts from nearby projects expected to influence the study area. Fehr & Peers estimated the number of trips generated from each project using Trip Generation, 8 th Edition (Institute of Transportation Engineers (ITE), Figure 3 shows a map of pending and approved projects in the study area. Appendix H provides a list of all cumulative projects, as well as the number of trips generated from each project. 7
14 Draft Traffic Impact Study for Waterma an Gardens Master Plan, San Bernardino, CA July 2012 SIGNIFICANCE CRITERIA The following significance criteria were employed to determine if the project causes significant traffic impacts. The criteria are based on the City of San Bernardino s General Plan, the City s Traffic Impact Analysis Guidelines, and the County s CMP. Traffic Impacts The City of San Bernardino considers traffic impacts at intersections to be significant if the following volume-to- in Table capacity (V/C) ratios occur between the without project and with project conditions shown 2. TABLE 2 - SIGNIFICANCE CRITERIA Level of Service V/C Difference C > D > E,F > Source: City of San Bernardino Traffic Impact Study Guidelines (2004) and Highway Capacity Manual (Transportation Research Board, 2000). For unsignalized intersections, a traffic impact is considered to be significant if the addition of project-generated traffic degrades operations below LOS D and the project adds traffic such that it satisfies the Peak Hour Signal Warrant. Mitigation Requirements The City of San Bernardino requires that any intersections with significant impacts be mitigated to improved LOS D or better for intersections and LOS C or better for roadway segments. 8
15
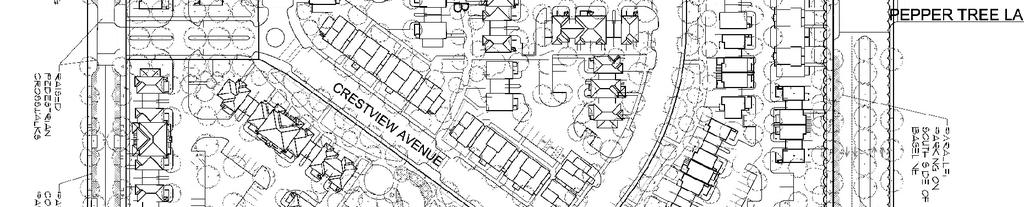
16 Draft Traffic Impact Study for Waterma an Gardens Master Plan, San Bernardino, CA July EXISTING CONDITIONS This chapter discusses the existing transportation conditions in the project study area. the roadway, transit network, and pedestrian networks. This discussion addresses EXISTING ROADWAY FACILITIES Regional access to the project site is provided by State Route 210 (SR-210), Interstate 10 (I-10), and Interstate 215 (I-215). Local access is provided by Highland Avenue, Base Line Street, Olive Street, 5 th Street, E Street, Waterman Avenue, La Junita Street, and Del Rosa Drive. These roadways are described in detail below. Regional Roads SR-210 Freeway The SR-21and curves south where it ends at the I-10 in Redlands. The SR-210 is generally a two- to three-lane begins in Pasadena to the west and extends east toward San Bernardino freeway. Access to the project site is provided via the Highland Avenue interchange. I-10 Freeway The I-10 is an east-west freeway that extends from the west coast in Santa Monica to Jacksonville, Florida to the east. The I-10 is generally a four-lane freeway. Access to the project site is provided via the Waterman Avenue interchange. I-215 Freeway The I-215 is a north-south freeway that extends from the I-15 to the north to where it turns into the SR-91 to the south. The I-215 is generally a three-lane freeway and connects the SR-210 and I-10 freeways. Local Access Roads Highland Avenue Highland Avenue is an east-west divided road with two lanes l in each direction. It extends from Easton Street to the west and curves south, east of SR-210 where it turns into Weaver Street and ends at Greenspot Road. Highland Avenue is a direct connector to the SR-210 freeway. The posted speed limit on Highland Avenue is 40 miles per hour (mph). Highland Avenue is classified as a Major Arterial in the City of San Bernardino General Plan. Waterman Avenue Waterman Avenue is a north-south divided road with two lanes in each direction. It extends into the mountains where it becomes SR-18 to the north and ends south of Barton Road to the south. Waterman Avenue is a direct connector to the SR-210 north of the project site and I-10 south of the project site. The posted speed limit on Waterman Avenue ranges from 35 to 40 miles per hour next to the project site. Waterman Avenue is classified as a Major Arterial in the City of San Bernardino General Plan. Del Rosa Drive Del Rosa Drive is a north-south divided road with two lanes in each direction. It extends from the mountains to the north and ends at Harry Shepard Boulevard to the south. Del Rosa Drive is a direct connector to the SR-210 northwest of the project site. The posted speed limit on Del Rosa Drive is 45 miles per hour. Del Rosa Drive is classified as a Major Arterial in the City of San Bernardino General Plan. Base Line Street Base Line Street is an east-west divided road with two lanes l in each direction. It extends from the City of San Dimas to the west and ends at Alta Vista to the east. Base Line Street is a direct connector to the SR-210 east of the project site. Currently, the project site has one driveway leading to Base Line Streett on Crestview Avenue. The project proposes to construct another driveway to 10
17 Draft Traffic Impact Study for Waterma an Gardens Master Plan, San Bernardino, CA July 2012 Base Line Street, opposing the shopping center to the north. The posted speed limit on Base Line Street is 40 mph. Base Line Streett is classified as a Major Arterial in the City of San Bernardino General Plan. Orange Street Orange Street is an undivided east-west residential road with one lane in each direction. Orange Street runs throughh the project site from Waterman Avenue to the west and La Junita Street to the east. Currently, the Orange Street at Waterman Avenue driveway directly opposes a fast-food restaurant driveway. The project proposes to realign Orange Street within the project site to meet Orange Street west of Waterman Avenue, approximately 200 feet north of the current intersection location. The posted speed limit on Orange Street is 25 mph. Orange Street is classified as Residential in the City of San Bernardino General Plan. Crestview Avenue Crestview Avenue is an undivided north-south residential road with one lane in each direction. It extends from 21 st Street to the north and ends before Olive Street within the project site. Currently, at Base Line Street, the Crestview Avenue driveways are offset approximately 25 feet from each other. The project proposes to realign Crestview Avenue, south of Base Line Street to directly oppose the north Crestview Avenue driveway. The posted speed limit on Crestview Avenue is 25 mph. Crestview Avenue is classified as Residential in the City of San Bernardino General Plan. La Junita Street La Junita Street is an undivided north-south residential road that stretches from Base Line Street to the north and Olive Street to the south.. Date Street is an east-west divided road with two lanes in each direction. The posted speed limit on La Junita Street is 25 mph. La Junita Street is classified as a Local Street in the City of San Bernardino General Plan. Olive Street Olive Street is an east-west undivided residential road with one lane in each direction. It extends from Mountain View Avenue to the west and ends past Belvan Avenue to the east. Currently, there are no driveways from the project site onto Olive Street. The project proposes to construct two driveways leading to Olive Street, one across from the shopping center and the other across from Neal Roberts Elementary School. The posted speed limit on Olive Street is 25 mph. Olive Street is classified as a Local Street in the City of San Bernardino General Plan. E Street E Street is generally a north-south undivided street with two lanes in each direction. It turns into Kendall Drive north of SR-210 and continues northwest and merges with Hunts Lane just before the I-10 to the south. The posted speed limit on E Street is 35 mph. E Street is classified as a Secondary Arterial in the City of San Bernardino General Plan. 5 th Street 5 th Street is an east-west undivided road with one lane in each direction east of Waterman Avenue and divided with two lanes in each direction west of Waterman Avenue. To the west, 5 th Street turns into Foothill Blvd/SR-66 then Huntington Drive then Mission Road beforee ending in downtown Los Angeles at Jesse Street. To the east, 5 th Street turns into Greenspot Road, turns south and turns into Florida Street then Garnet Avenue before ending at Zanja Villa Drive just south of Mill Creek Road/SR-38. The posted speed limit on 5 th Street is 40 mph. 5 th Street is classified as a Major Arterial in the City of San Bernardino General Plan. EXISTING BUS TRANSIT FACILITIES There are three transit lines that currently operate in the study area. The lines, operated by Omnitrans, are described in detail below. There are currently three bus lines along the project site perimeter that provide access from the project site to Routes 1, 4 and 5. Route 1 and 5 are accessible via transit stops at the Waterman Avenue and Base Line Street intersection and the Waterman Avenue and Olive Street intersection. Route 3 is accessible via a transit stop at the Crestview Avenue and Base line Street intersection. Route 4 is accessible via transit stops at the Waterman Avenue and Base Line intersection and Pepper Tree Lane and Base Line Street intersection. 11
18 Draft Traffic Impact Study for Waterma an Gardens Master Plan, San Bernardino, CA July 2012 Bus Route 1 Bus Route 1 (ARMC-San Bernardino-Del Rosa Route) provides service from Lynwood Drive diagonally southwestt past the I-215 freeway to Valley Boulevard along various roads, connecting the City of San Bernardino and City of Colton. Within the project study area, Bus Route 1 travels from along Waterman Avenue from 5 th Street to the south to 21 st Street to the north. Service is provided at 15- and 30-minute headways on weekdays and at 30-minute headways on weekends. Service runs from 4:50 AM to 10:49 PM in the southbound direction and from 5:45 AM to 10: :09 PM in the northbound direction on weekdays. On Saturdays, service runs from 7:07 AM to 7:30 PM in i the southbound direction and from 6:07 AM to 7:30 PM in the northbound direction. On Sundays, service runs from 7:07 AM to 7:25 PM in the southbound direction and from 6:07 AM to 7:25 PM in the northbound direction. Bus Route 3/4 Bus Routes 3/4 (Baseline Highland-San Bernardino) run almost identical routes, but in the counter-clockwise direction on Route 3 and in the clockwise direction on Route 4. The bus route provides round-trip servicee along various roads in the City of San Bernardino that include Highland Avenue to the north, 2 nd Street and Baseline Street to the south, Medical Center Drive to the west and Boulder Avenue to the east. In the project study area, the bus route travels along Base Line Street from Arrowhead Avenue to Boulder Avenue. Service is provided at 20-minute headways every day. Bus Route 3, service runs from 4:36 AM to 11:13 PM in the counter-clockwise direction and Bus Route 4 runs from 4:32 AM to 10:56 PM in the clockwise direction on weekdays. On Saturdays, Bus Route 3 runs from 6:01 AM to 7:06 PM in the counter-clockwise direction and Bus Route 4 runs from 6:22 AM to 7:42 PM in the clockwise direction. On Sundays, Bus Route 3 runs from 6:01 AM to 7:06 PM in the counter- clockwise direction and Bus Route 4 runs from 6:22 AM to 7:24 PM in the clockwise direction. Bus Route 5 Bus Route 5 (San Bernardino-Del Rosa-Cal State) provides service from Cal State University of San Bernardino diagonally southeast to Del Rosa Drive then southwest toward the Carousel Mall on E Street along various roads. Within the project study area, Bus Route 5 travels along Waterman Avenue from Gilbert Streett to the north and 4 th Street to the south. Servicee is provided at 30-minute headways on weekdays and 60-minute headways on weekends. Service runs from 4:51 AM to 10:08 PM in the southbound direction and from 5:45 AM to 10:24 PM in the northbound direction on weekdays. On Saturdays, service runs from 6:54 AM to 6:38 PM in the southbound direction and from 7:50 AM to 6:38 PM in the northbound direction. On Sundays, service runs from 6:39 AM to 6:28 PM in the southbound direction and from 7:35 AM to 7:28 PM in the northbound direction. The City of San Bernardino General Plan contains several references to public transit in the policy statements including: Policy 6.6.1: Support the efforts of regional, state, and federal agencies to provide additional local and express bus service in the City. Policy 6.6.2: In cooperation with Omnitrans, require new development to provide transit facilities, such as bus shelters and turnouts, as necessary and warranted by the scale of the development. Policy 6.6.3: Encourage measures that will reduce the number of vehicle-miles traveled during peak periods, including the following examples of these types of measures: Incentives for car-pooling and vanpools Preferential parking for car-pools and vanpools An adequate, safe, and interconnected system of pedestrian and bicycle paths The project is consistent with these and Base Line Street, listed above. policy statements through existing bus stops located along Waterman Avenue 12
19 Draft Traffic Impact Study for Waterma an Gardens Master Plan, San Bernardino, CA July 2012 BICYCLE NETWORK The City of San Bernardino Generall Plan has the following three classifications for its bicycle facilities: Class I Bikeway Dedicated travel-way for bicyclists. Most common application of Class I Bikeways are along rivers, canals, and utility right-of-ways, college campuses or within and between parks. Class II Bikeways Delineated right-of-way assigned to bicyclists along roadways. Signs and pavement markings help define bike lanes. Class III Bikeways Shared facilities that serve either to provide continuity to other bicycle facilities, or designate preferred routes through high demand corridors. Bicycle use is secondary and normally shared with motor vehicles on the street or with pedestrians on sidewalks. Existing bicycle routes in the project study area are located along Highland Avenue and Baseline Street. Proposed bicycle routes in the project study are planned on Waterman Avenue. PEDESTRIAN NETWORK The pedestrian network in the study area consists of sidewalks and pedestrian crosswalks, with appropriate pedestrian crossing controls at signalized intersections. Fifty foot pedestrian-onlyy greenways with natural bioswales and walking paths are planned throughout the project. The City of San Bernardino General Plan contains several references to pedestrian bicycle activity in the policy statements including: Policy 8.3: Develop a well-designed system of interconnected multi-purpose trails, bikeways, and pedestrian paths. Policy 8.3.8: Install sidewalks and wheelchair ramps in existing neighborhoods. The project is consistent with thesee policy statements through planned sidewalks and crosswalks throughout and around the project. The project also proposes to increase sidewalk widths and raise curb bulb-outs and crosswalks, promoting pedestrian safety and the accessibility of pedestrian routes. Narrow travel lanes throughout the site will also decrease travel speeds to provide pedestrian and bicycle safety. TRAFFIC VOLUMES AND LANE CONFIGURATIONS Fehr & Peers collected existing traffic counts at the study intersections in May 2011 during the morning (7:00 to 9:00 AM) and evening (4:00 to 6:000 PM) peak hours. Figure 4 shows the existing lane configurations and traffic volumes. Existing traffic counts are provided in Appendix A. At the time that existing traffic volumes were collected, ramp closures on I-215 at 3 rd Street, 27 th Street, and Highland Avenue (in the northbound direction) were closed. Waterman Avenue at Highland Avenue was also reduced to one-lane traffic in each direction. These temporary ramp and lane closures could have possibly affected the existing count volumes. EXISTING INTERSECTION OPERATIONS Fehr & Peers utilized the existing traffic volumes, lane configurations, and signal timing information to evaluate operations at the study intersections for the existing AM and PM peak hour conditions. The results are summarized in Table 3. The technical calculations are presented in Appendix B. 13
20
21 Draft Traffic Impact Study for Waterma an Gardens Master Plan, San Bernardino, CA July 2012 TABLE 3 - INTERSECTION LEVELS OF SERVICE: EXISTING CONDITIONS Intersection 1. E Street/Base Line Street 2. Waterman Avenue/Highland Avenue 2 Signalized 26.7 C 3. Waterman Avenue/Base Line Street 2 Signalized 28.0 C 4. Waterman Avenue/Orangee Street SSSC D 5. Waterman Avenue/Olive Street SSSC D 6. Waterman Avenue/5 th Street Signalized 17.4 B 7. Crestview Avenue/Base Line Street Signalized 3.4 A 8. La Junita Street/Base Line Street SSSC C 9. La Junita Street/Orange Street SSSC A 10. Del Rosa Drive/Base Line Street Notes: Signalized 25.3 C 1- Delay for intersections based on application of 2000 Highway Capacity Manual Methodology. Synchro 6.0 software. 2- CMP intersection 3- V/C = Volume to Capacity ratio. Note V/C is not calculated for unsignalized intersections. 4- SSSC= Side Street Stop Sign Controlled Source: Fehr & Peers, 2011 Control AM Peak Hour Delay 1 LOS Signalized 14.2 B PM Peak Hour Delay LOS 15.3 B 28.2 C 29.2 C F 48.3 E 20.3 C 3.3 A 18.0 C 8.8 A 23.1 C Delay was calculated using As shown in Table 3, all of the signalized intersections operate at LOS C or better during the peak hours. This determination is consistent with our fieldwork which noted that these signalized intersections appeared to operate at an acceptable level during the peak hours. For unsignalized intersections, the following two intersections operate at LOS D or worse during the peak hours: Waterman Avenue/Orange Street LOS D during the AM peak hour and LOS F during the PM peak hour Waterman Avenue/Olive Street LOS D during the AM peak hour and LOS E during the PM peak hour Please note that this determination of deficient conditions occurs because of delays occurring on the side streets connecting to Waterman Avenue, in that vehicles turning onto Waterman Avenue may have to wait for gaps in incoming traffic. 15
22 Draft Traffic Impact Study for Waterma an Gardens Master Plan, San Bernardino, CA July PROJECT OPENING YEAR (2013) NO PROJECT TRAFFIC CONDITIONS This section documents the conditions in the Opening Year (2013) scenario. This scenario analyzes the intersection conditions with the addition of ambient growth per year from the existing volumes to 2013 (the opening year for the proposed project). TRAFFIC VOLUMES A 3% ambient growth per year, over the two year period between the existing and opening year scenario (equal to 6.09%) was applied to the existing conditions volumes per City of San Bernardino Traffic Impact Study Guidelines. Opening year (2013) peak hour traffic volumes for the study intersections are shown on Figure 5. ROADWAY IMPROVEMENTS There are no roadway improvements planned and funded at the study intersections that will be completed by INTERSECTION OPERATIONSS Intersection level of service analysiss results for opening year (2013) are summarized in Table 4. Analysis sheets are provided in Appendix C. As shown in this table, with the application of ambient growth, most of the study intersections will continue to operatee at LOS C or better, with the exception of the following two intersections: Waterman Avenue/Orange Street LOS E during the AM peak hour and LOS F during the PM peak hour Waterman Avenue/Olive Street LOS E during the AM peak hour and LOS F during the PM peak hour Please note that this determination of deficient conditions occurs because of delays occurring on the side streets connecting to Waterman Avenue, in that vehicles turning onto Waterman Avenue may have to wait for gaps in incoming traffic. 16
23
24 Draft Traffic Impact Study for Waterma an Gardens Master Plan, San Bernardino, CA July 2012 TABLE 4 - INTERSECTION LEVELS OF SERVICE: OPENING YEAR (2013) NO PROJECT Intersectionn 1. E Street/Base Line Street Signalized 14.5 B Waterman Avenue/Highland Avenue 2 Signalized 27.1 C Waterman Avenue/Base Line Street 2 Signalized 28.3 C Waterman Avenue/Orange Street SSSC E n/a 5. Waterman Avenue/Olive Street SSSC E n/a 6. Waterman Avenue/5 th Street 2 Signalized 18.1 B Crestview Avenue/Basee Line Street Signalized 3.4 A La Junita Street/Base Line Street SSSC C n/a 9. La Junita Street/Orangee Street SSSC A n/a 8.8 A n/a 10. Del Rosa Drive/Base Line Street Notes: Signalized 25.8 C C Delay for intersections based on application of 2000 Highway Capacity Manual Methodology. Delay was calculated using Synchro 6.0 software. 2- CMP intersection 3- V/C = Volume to Capacity ratio. Note V/C is not calculated for unsignalized intersections. 4- SSSC= Side Street Stop Sign Controlled Source: Fehr & Peers, 2011 Control AM Peak Hour Delay 1 3 LOS V/C PM Peak Hour Delay 1 LOS V/C B C C F n/s 65.4 F n/a 21.5 C A C n/a 18
25 Draft Traffic Impact Study for Waterma an Gardens Master Plan, San Bernardino, CA July PROJECT OPENING YEAR (2013) PLUS PROJECT TRAFFIC CONDITIONS This section documents the conditions in the Opening Year (2013) plus Project scenario. This scenario analyzes the opening year (2013) conditions plus the project. This condition is used to evaluate the net change in traffic conditions and to identify potential traffic impacts associated with the proposed project. TRAFFIC VOLUMES Traffic was estimated for the proposed project using a three step process: Trip Generation, Trip Distribution, and Trip Assignment. In the first step, the numbers of trips generated by the project are estimated. Then, the directions from which these trips approach and depart the site are projected. Finally, the project trips are assigned to the roadway system and the study intersections. Each of these steps is described in detail below. Please note that all of these assumptions were circulated to City staff and as part of the scoping form prior to initiating any assessment for the site. Project Trip Generation Fehr & Peers estimated the project trip generation by applying standard trip generationn rates, based on ITE s Trip Generation, 8 th Edition, Project trips were estimated using the trip generation rates for land use code 220 for multi-family dwelling units and land use code 495 for the community center, whichh includes the recreational facility, community support center, community care facility, administration and community room. Existing 24-hour street segment counts were conducted on May 4, 2011 to determine the number of trips currently using the site. These trips are applied as a negative credit toward the trips generated by the project to give a more realistic number of how many additional trips the project will attract. Table 5 summarizes the trip generation estimates for the proposed project. The proposed project was assumed to consist of the following land uses: Multi-family dwelling units The existing 252 family units spanning 114 buildings will be demolished. The new development will include 411 dwelling units. Because 252 dwelling units of livable space currently exists at the site, the project trips generated for 411 dwelling units can be reduced. Community Center The community center is a new construction that willl include 45,835 sq. ft. of recreational facility, 58,2000 sq. ft. of community support center, 4,000 sq. ft. of community care facility, and 6,000 sq. ft. of administration and community room. The community center will be open to Waterman Gardens Master Plan project residents as well as to the public. The assumption is that community center patrons will walk versus drive to the community center so the trip generation rates and estimates of the community center can be reduced to reflect this internalized travel. Combining all of the information above, the project (for transportation assessment) consists of the following: 411 new multi-family dwelling units 114,035 sq. ft. of community center 19
26 Draft Traffic Impact Study for Waterma an Gardens Master Plan, San Bernardino, CA July 2012 Land Use Size TABLE 5 - PROJECT TRIP GENERATION Unit Daily New Multi Family Dwelling Units 411 Du 2, Existing 252 Multi-Family Dwelling Units 2-2, Subtotal Community Center 114 ksf 2, Internalized Trips from Residents Subtotal -1,305 1, ITE Trip Generation Subtotal: 5, Existing Trip Credits -2, Internalized Trip Credits -1, Project Trip Generationn Total 1, Trip Generation 1 AM Peak Hour PM Peak Hour Inbound Outbound Total Inbound Outbound Total Notes: 1- Trip generations and pass-by rates calculated from ITE Trip Generation (8th edition, 2008) and Trip Generation Handbook (2nd edition, 2004) Categories 220 and Credits calculated from existing counts conducted on April 28, 2011 at inlet/outlet locations to project site. Proportion of existing land use units over proposed land use units (252/411=61.3%) is credited for counts exceeding ITE trip generation values. 3- Community Center is assumed to be primarily used by residents of the project. Source: Fehr & Peers, 2011 Trip Distribution The project trip distributions reflect the likely approach and departure routes to the project site, as determined through multiple sources such as the location of complementary land uses and existing traffic volumes on study area roadways. General distributions for the project trips are shown on Figure 6. Project trip distributions by intersection are shown on Figure 7. 20
27
28
29 Draft Traffic Impact Study for Waterma an Gardens Master Plan, San Bernardino, CA July 2012 Trip Assignment Based on the trip distribution, project trips were assigned to the study area roadways and intersections. The assignment of these trips is shown on Figure 8. The assignment of trips at project site-access driveways is shown on Figure 9. The project-related trips described above were added to the Opening Year No Project volumes shown on Figure 5 to develop Opening Year with Project volumes. These volumes are shown on Figure 10. ROADWAY IMPROVEMENTS At the study intersections, the proposed project includes the following intersection improvements shown on the project site plan: Waterman Avenue/Base Line Street Signal modification. Proposed Alder Street/Basee Line Street Install traffic signal. Crestview Avenue/Base Line Street Intersection realignment to connect Crestview Avenue and signal modification. Waterman Avenue/Orange stop controlled. Street Intersection realignment to connect Orange Street and side-street Waterman Avenue/Olive Street Install traffic signal. La Junita Street/Orange Street All-way stop controlled. The above referenced improvements were included in the With Project conditions assessment. Since signal timing sheets are not available for these future intersections, Fehr & Peers staff have made the following assumptions at each intersection listed above in evaluating Opening Year (2013) plus Project and Future Buildout Year (2033) plus Project conditions. Lane configurations at each intersection were not changed from existing conditions. Crestview Avenue/Base Line Street Optimize cycle length for the AM and PM peak hour. Waterman Avenue/Olive Street Optimize cycle length for the AM and PM peak hour. Protected northassumptions are shown in south left turns. Permitted east-west approaches. Signal and phasing timing Appendix. INTERSECTION OPERATIONSS Intersection level of service results for Opening Year (2013) plus Project are summarized in Table 6 and calculations are provided in Appendix D. 23
30 Draft Traffic Impact Study for Waterma an Gardens Master Plan, San Bernardino, CA July 2012 TABLE 6 - INTERSECTION LEVELS OF SERVICE: OPENING YEAR (2013) PLUS PROJECT Intersection Control AM Peak Hour Delay 1 3 LOS V/C PM Peak Hour Delay 1 LOS V/C 3 1. E Street/Base Line Street Signalized 14.4 B B Waterman Avenue/Highland Avenue 2 Signalized 27.2 C C Waterman Avenue/Base Line Street 2 Signalized 29.9 C C Waterman Avenue/Orangee Street SSSC F n/a F n/a 5. Waterman Avenue/Olive Street Signalized 6.8 A A Waterman Avenue/5 th Street Signalized 18.4 B C Crestview Avenue/Base Line Street Signalized 4.9 A A La Junita Street/Base Line Street SSSC C n/a 18.8 C n/a 9. La Junita Street/Orange Street SSSC A n/a 9.1 A n/a 10. Del Rosa Drive/Base Line Street Notes: Signalized 26.1 C C Delay for intersections based on application of 2000 Highway Capacity Manual Methodology. Synchro 6.0 software. Delay was calculated using 2- CMP intersection 3- V/C = Volume to Capacity ratio. Note V/C is not calculated for unsignalized intersections. 4- SSSC= Side street stop controlled Source: Fehr & Peers, May
31
32
33
34 Draft Traffic Impact Study for Waterma an Gardens Master Plan, San Bernardino, CA July 2012 IMPACT ASSESSMENT Table 7 compares the change in volume-to-capacity ratios at intersections that operate at LOS C, D, E, or F to determine project impacts. These V/C changes are compared to the allowable change shown in Table 2. TABLE 7 - IMPACTS FOR SIGNALIZED INTERSECTIONS: OPENING YEAR (2013) PLUS PROJECT Intersection 1. E Street/Base Line Street 2. Waterman Avenue/Highland Avenue 3. Waterman Avenue/Base Line Street 4. Waterman Avenue/Orange Street 5. Waterman Avenue/Olive Street 6. Waterman Avenue/5 th Street 7. Crestview Avenue/Base Line Street 8. La Junita Street/Base Line Streett 9. La Junita Street/Orange Street 10. Del Rosa Drive/Base Line Street LOS AM (PM) B(B) Allowable V/C AM (PM) No Project Notes: 1- V/C = Volume to Capacity ratio. Calculated using the Synchro 6 software package. Shaded cells indicate where intersections operate at LOS A or B. Bold-Italicized type indicates project impact. Source: Fehr & Peers, AM Peak Hour With Project V/C C(C)) 0.04(0.04) C(C) 0.04(0.04) F(F) A(A) B(C) A(A) C(C) A(A) n/a(0.04) C(C) 0.04(0.04) No Project PM Peak Hour With Project V/C As shown in Table 7, the proposed project will not impact signalized intersections in the study area. For unsignalized intersections operating below LOS C with the project in place, traffic volumes for the following intersection was tested and met signal warrants, creating a significant project impact at: : Waterman Avenue/Orange Street Please note that this determination of deficient conditions for unsignalized intersectionss occurs because of delays occurring on the side streets connecting to Waterman Avenue, in that vehicles turning onto Waterman Avenue may have to wait for gaps in incoming traffic. Measures to mitigate the identified impacts are discussed in detail in Chapter 6. 28
35 Draft Traffic Impact Study for Waterma an Gardens Master Plan, San Bernardino, CA July FUTURE BUILDOUT YEAR (2033) TRAFFIC CONDITIONS This section documents the conditions in the 2033 scenario. TRAFFIC VOLUMES The Southern California Association of Governments (SCAG) Travel Demand Model was not used to evaluate the project and forecast volumes due to several reasons. The SCAG Model lacks sufficient roadway network detail and does not include all of the roadway facilities analyzed within this study. Also, the most current version of the SCAG Model has a 2003 Base Year and does not provide information for a year which is close to the Existing Conditions analyzed in this study. Unlike the SCAG Model, the EVTM provides an appropriate level of detail for this study. However, this model is based on Existing Conditions at the time of the model development (2006), which significantly predates the year of analysis for this proejct Additionally, although the model was validated to Year 2006 conditions, it was based off of an earlier version of the SCAG model, on an outdated software platform, and is based on an outdated RTP. Fehr & Peers understands that SANBAG is currently finishing a countywide model for the local region (SBTAM); but it is not available at this time and could not be used in this assessment. Our concern with using either model to forecast future traffic relates more to the level of detail (SCAG) and the Base Year of the model (SCAG and EVTM). The preferred and approved method of forecasting volumes used is to apply an annual growth rate to existing volumes. A 3% annual growth rate was applied to existing traffic counts to develop 2033 traffic volumes. A list of pending and approved projects was also used to determine the amount of traffic generated from related projects which were added to the traffic volumes in addition to the 3% growth factor. These projects are shown on Figure 3. The Future Year Buildout (2033) No Project peak hour traffic volumes for the study intersections are shown on Figure 11. Traffic generated by the proposed project, shown on Figures 8 and 9, were added to these volumes to develop Future Year Buildout (2033) With Project peak hour volumes shown on Figure 12. ROADWAY IMPROVEMENTS Fehr & Peers reviewed the SCAG 2008 RTP to identify any programmed roadway improvements in the study area. No improvements were identified and therefore no improvements were assumed in this analysis. INTERSECTION OPERATIONSS The LOS results are summarized in Table 8 for the Future Buildout Year (2033) No Project Condition. Table 9 summarizes the results for the Future Buildout Year (2033) With Project Conditions. The analysis sheets are provided in Appendix E and F. 29
36 Draft Traffic Impact Study for Waterma an Gardens Master Plan, San Bernardino, CA July 2012 TABLE 8 - INTERSECTIONN LEVELS OF SERVICE: FUTURE BUILDOUT YEAR (2033) NO PROJECT Intersection 1. E Street/Base Line Street Signalized 18.0 B C Waterman Avenue/Highland Avenue 2 Signalized 54.1 D F Waterman Avenue/Base Line Street 2 Signalized 53.0 D D Waterman Avenue/Orangee Street SSSC F n/a ERR F n/a 5. Waterman Avenue/Olive Street SSSC F n/a ERR F n/a 6. Waterman Avenue/5 th Street Signalized 31.7 C F Crestview Avenue/Base Line Street Signalized 3.5 A A La Junita Street/Base Line Street SSSC D n/a F n/a 9. La Junita Street/Orange Street SSSC A n/a 9.0 A n/a 10. Del Rosa Drive/Base Line Street Notes: Signalized 39.1 D C Delay for intersections based on application of 2000 Highway Capacity Manual Methodology. Synchro 6 software. Delay was calculated using 2- CMP intersection 3- V/C = Volume to Capacity ratio. Note V/C is not calculated for unsignalized intersections. 4- SSSC= Side Street Stop Sign Controlled Source: Fehr & Peers, May 2012 Control Intersection level of service analysiss results for opening year (2013) are summarized in Table 8. Analysis sheets are provided in Appendix E. As shown in this table, with the application of ambient growth and related projects, most of the study intersections willl continue to operate at LOS C or better, with the exception of the following intersections: Waterman Avenue/Highland Avenue LOS D during the AM peak hour and LOS F during the PM peak hour Waterman Avenue/Base Line Street LOS D during the AM peak hour and LOS D during the PM peak hour Waterman Avenue/Orange Street LOS F during the AM peak hour and LOS F during the PM peak hour Waterman Avenue/Olive Street LOS F during the AM peak hour and LOS F during the PM peak hour La Junita Street/Base Line Street LOS D during the AM peak hour and LOS F during the PM peak hour Del Rosa Drive/Base Line Street LOS D during the AM peak hour AM Peak Hour Delay 1 3 LOS V/C PM Peak Hour Delay 1 LOS V/C 3 Please note that this determination of deficient conditions at unsignalized intersectionss occurs because of delays occurring on the side streets connecting to Waterman Avenue, in that vehicles turning onto Waterman Avenue may have to wait for gaps in incoming traffic. 30
37
38
39 Draft Traffic Impact Study for Waterma an Gardens Master Plan, San Bernardino, CA July 2012 TABLE 9 - INTERSECTION LEVELS OF SERVICE: FUTURE BUILDOUT YEAR (2033) PLUS PROJECT Intersection 1. E Street/Base Line Street Control AM Peak Hour Delay 1 3 LOS V/C PM Peak Hour Delay 1 LOS V/C 3 Signalized 18.1 B C Waterman Avenue/Highland Avenue 2 Signalized 56.7 E F Waterman Avenue/Base Line Street 2 Signalized 55.2 E E Waterman Avenue/Orangee Street SSSC F n/a ERR F n/a 5. Waterman Avenue/Olive Street Signalized 9.5 A B Waterman Avenue/5 th Street Signalized 43.6 D F Crestview Avenue/Base Line Street Signalized 5.1 A A La Junita Street/Base Line Street SSSC D n/a F n/a 9. La Junita Street/Orange Street SSSC A n/a 9.3 A n/a 10. Del Rosa Drive/Base Line Street Notes: Notes: Signalized 39.7 D C Delay for intersections based on application of 2000 Highway Capacity Manual Methodology. Synchro 6.0 software. Delay was calculated using 2- CMP intersection 3- V/C = Volume to Capacity ratio. Note V/C is not calculated for unsignalized intersections. 4- SSSC= Side street stop controlled Source: Fehr & Peers, 2011 IMPACT ASSESSMENT Please note that this determination of deficient conditions for unsignalized intersectionss occurs because of delays occurring on the side streets connecting to Waterman Avenue, in that vehicles turning onto Waterman Avenue may have to wait for gaps in incoming traffic. Measures to mitigate the identified impacts are discussed in detail in Chapter 6. Table 10 compares the change in volume-to-capacity ratios at intersections that operate at LOS C, D, E, or F to determine project impacts. These V/C changes are compared to the allowable change shown in Table 2. As shown in Table 10, the proposed project will impact the following signalized intersections: Waterman Avenue/Base Line Street AM and PM Peak Hour For unsignalized intersections operating below LOS C with the project in place, traffic volumes for the following intersection was tested and met signal warrants, creating a significant project impact at: Waterman Avenue/Orange Street Please note that this determination of deficient conditions for unsignalized intersectionss occurs because of delays occurring on the side streets connecting to Waterman Avenue, in that vehicles turning onto Waterman Avenue may have to wait for gaps in incoming traffic. Several intersections have deficient operations in either the AM or PM Peak Hour but do not exceed City of San Bernardino thresholds as describedd below: 33
40 Draft Traffic Impact Study for Waterma an Gardens Master Plan, San Bernardino, CA July 2012 Waterman Avenue/Highland Avenue AM and PM Peak Hour: The intersectionn operates at LOS E in the AM peak hour and LOS F in the PM peak hour with a V/C ratio difference of 0.00 in the AM and 0.01 in the PM from the without project scenario. The V/C ratio, not delay, is the controlling factor of significant impacts in the City of San Bernardino. The V/C ratio difference for this intersection falls within the allowable difference in V/C ratios. Therefore, mitigation measures are not required for this location. Waterman Avenue/5 th Street AM and PM Peak Hour: The intersection operates at LOS D in the AM peak hour and LOS F in the PM peak hour with a V/C ratio difference of 0.00 in the AM and in the PM from the without project scenario. The V/C ratio, not delay, is the controlling factor of significant impacts in the City of San Bernardino. The V/C ratio difference for this intersection falls within the allowable difference in V/C ratios. Therefore, this location does not need to be mitigated and no mitigation is required for this scenario.. La Junita Street/Base Line Street AM and PM Peak Hour: The intersection operates as LOS D in the AM peak hour and LOS F in the PM peak hour. Although the with project scenario surpasses the LOS C minimum requirement for unsignalized intersections, it does not satisfy the peak hour signal warrant requirements to install a traffic signal. Therefore, mitigation measures are not required for this location since the City requires thatt an unsignalized intersection exceed both the LOS threshold and meet with peak hour signal warrant. Del Rosa Drive/La Junita Street AM Peak Hour: The intersection operates at LOS D in the AM peak hour with a V/C ratio difference of 0.01 in the AM from the without project scenario. The V/C ratio, not delay, is the controlling factor of significant impacts in the City of San Bernardino. The V/C ratio difference for this intersection falls within the allowable difference in V/C ratios. Therefore, this location does not need to be mitigated and no mitigation is required for this scenario. Measures to mitigate the identified impacts are discussed in detail in Chapter 6. TABLE 10 - IMPACTS FOR SIGNALIZED INTERSECTIONS: FUTURE BUILDOUT YEAR (2033) PLUS PROJECT Intersection 1. E Street/Base Line Street 2. Waterman Avenue/Highland Avenue 2 3. Waterman Avenue/Base Line Street 2 4. Waterman Avenue/Orange Street 5. Waterman Avenue/Olive Street 6. Waterman Avenue/5 th Street 2 7. Crestview Avenue/Base Line Street 8. La Junita Street/Base Line Streett 9. La Junita Street/Orange Street 10. Del Rosa Drive/Base Line Street LOS AM (PM) B(C) Allowable V/C AM (PM) n/a(0.04) No Project Notes: 1- V/C = Volume to Capacity ratio. Calculated using the Synchro 6 software package. Shaded cells indicate where intersections operate at LOS A or B. Bold-Italicized type indicates project impact. Source: Fehr & Peers, May AM Peak Hour With Project V/C D(F) 0.02 (0.01) D(D) 0.02 (0.02) F(F) A(B) C(F) 0.04(0.01) A(A) D(F) A(A) D(C) 0.02(0.04) No Project PM Peak Hour With Project V/C
41 Draft Traffic Impact Study for Waterma an Gardens Master Plan, San Bernardino, CA July FINDINGS AND MITIGATION MEASURES This chapter provides a summary of the key findings and project impacts for each scenario analyzed, and recommended mitigation measuress to mitigate these impacts. Significant project impacts were identified based upon significance criteria outlined in Chapter 1. SUMMARY OF PROJECT IMPACTS The addition of the project will significantly impact the following locations under the following analyzed scenario: Opening Year (2013) Plus Project Conditions Waterman Avenue/ /Orange Street AM and PM Peak Hour Future Buildout Year (2033) Plus Project Conditions Waterman Avenue/ /Base Line Street AM and PM Peak Hour Waterman Avenue/ /Orange Street AM and PM Peak Hour A description of each project impact and potential mitigation measures are provided below. The proposed project would be responsible for a fair-share contribution toward the Waterman Avenue and Base Line Street intersection mitigation. The project would be fully responsible for mitigations at the intersection of Waterman Avenue, therefore fair share contributions are not calculated for improvements at this location. RECOMMENDED MITIGATION MEASURES A description of each project impact and potential mitigation measures are proposed below. Improvement measures are implemented to minimize the impact of a project on the study area. With implemented improvements, with project scenarios must fall within the significance criteria outlined in Chapter 1. The proposed project would be responsible for a fair-share contribution toward the identified improvements. Level of service reports for mitigated intersections are provided in Appendix G. Waterman Avenue/Base Line Street (AM and PM Peak Hour) Impact The intersection operates at LOS E during the AM and PM peak hour with the addition of project-generated traffic. It will increase the V/C ratio by 0.05 in the AM peak hour and 0.03 in the PM peak hour, creating a project impact at the intersection. Mitigation The intersection of Waterman Avenue/Base Line Street is coordinated along Waterman Avenue. For the intersection to operate at an acceptable level of service, signal modification and optimization would be needed. With the improvement, the intersection would operate at LOS D with a V/C ratio increase of 0.02 in the AM peak hour and at LOS D with a V/C ratio increase of 0.00 in the PM peak hour from withoutt project conditions. Signal timing sheets for this mitigated intersection are provided in Appendix G. 35
42 Draft Traffic Impact Study for Waterma an Gardens Master Plan, San Bernardino, CA July 2012 Waterman Avenue/Orange Street (AM and PM Peak Hour) Impact Deficient conditions for this intersection occurs because of delays occurring on the side streets (Orange Street) connecting to Waterman Avenue, in that vehicles turning onto Waterman Avenue may have to wait for gaps in incoming traffic. Mitigation It is recommended that the project implement a right-turn-in/right-turn-out,/left-turn-in rule at this intersection. This measure will drastically alleviate delay experienced by drivers wanting to turn left out of the Orange Street driveway. Although this intersectionn is warranted for a signal, it is not recommended given the intersection s close proximity (~350 feet) to the Waterman Avenue and Base Line Street intersection. FAIR SHARE CONTRIBUTIONSS The project is responsible for a portion of each mitigation measure proposed under Future Buildout Year (2033) Conditions. Project fair share contributions are calculated by comparing the project s peak hour traffic generated against future growth. Waterman Avenue at Base Line Street It is recommended that the intersection implement signal optimization to bring LOS delay to within allowable limits. From past experiences implementing signal optimizations, the typical cost of this mitigation would be approximately $5,000 to $10,000. To be conservative, this mitigation is estimated to cost $10,000. The project generates 99 PM peak hour trips at this location, resulting in a 3.6% fair share cost of the proposed mitigation (99/(5,493-2,739)). This would equate to $360. PROJECT IMPROVEMENTS The project proposes to install a traffic signal at Base Line Street and the proposed Alder Street driveway (opposing commercial driveway on Base Line Street just west of Pepper Tree Lane). It is recommended in the design of the driveway that one left turn lane and one shared through-right turn lane be provided on the north- by the project. Signal south driveways. Updated signal timing plans are provided for study intersections affected timing sheets for the intersections of Waterman Avenue at Base Line Street, Olive Street at Base Line Street, proposed Alder Street at Baseline Street, and Crestview Avenue at Base Line Streetaree provided in Appendix G. 36
43 Draft Traffic Impact Study for Waterma an Gardens Master Plan, San Bernardino, CA July PROJECT SITE PLAN REVIEW This chapter reviews the project site plan and considers on-site circulation and access in the context of two items: First, it considers whether the proposed roadway system, both on-site and adjacent to the site, are consistent with City of San Bernardino Standards and Guidelines Second, it considers whether these improvements are consistent with standardized roadway design standards such as those promulgated by AASHTO or other standard traffic engineering guidelines and procedures This review ultimately is oriented towards whether a project s design elements conflicts with the CEQA Guidelines which state that a significant traffic impact could occur if the project substantially increases hazards due to a design feature (e.g., sharp curves or dangerous intersections) or incompatible uses (e.g., farm equipment)? PROJECT OVERVIEW The project is proposing both on-site and off-site improvements. The on-site improvements include the reconstruction of new roadways within the project site, as shown on Figure 1. It is anticipated that these on-site roadways will be constructed as private streets instead of public streets. Concurrent with these on-site improvements, a series of off-site improvements will be constructed concurrently along several roadways adjacent to the project site including Base Line Street, Waterman Avenue, Olive Street, and La Junita Street. These proposed improvements include: Narrow travel lanes, to slow down traffic and decrease the permeable surface area. On-street parallel and diagonal parking, to decrease the needed travel surface area to parking spacess and decrease traffic speeds. Raised crosswalks and curb bulb outs, to increase pedestrian safety. Increased sidewalk width, to promote walking and the accessibility of pedestrian routes. Addition of street trees Under-grounding of existing electrical lines With these proposed improvements, the number of existing travel lanes on Base Line Street and Waterman Avenue would be maintained to preserve roadway and intersection capacity. PROJECT IMPACT This review considers the following items: Are all areas of the project accessible to/from each other? Do designs of roadway features meet or exceed accepted standards? Does the project provide sufficient on-site traffic control devices? Is there adequate access for emergency vehicles? Is the traffic signal spacing adequate? Each of these items are discussed in further detail below. 37
44 Draft Traffic Impact Study for Waterma an Gardens Master Plan, San Bernardino, CA July 2012 Are All Areas of the Project Accessible To Each Other? This evaluation criterion considers whether the project has sufficient internal accessibility to limit the need to travel on external roadways to reach various locations within the site. Our review of the site plan indicates that the project has a high level of internal accessibility. The various project driveways connect into the site terminating at an internal ring roadway which provides access to individual properties within the site. It is therefore considered that the internal project accessibility is more than adequate. Do Designs of Roadway Features Meet or Exceed Accepted Standards? Our review of the proposed roadways indicates that there are on-site and off-site roadways proposed for the project. The on-site roadways are proposed to be private streets and therefore City of San Bernardino Street design standards do not apply. In the absence of City Standards, we would consider generalized standards related to lane width, curb radii, and other related items. Our review indicates that these internal roadways are consistent with general standards for roadways and are sufficient for internal circulation. The project is also proposing to conduct a series of public street improvements described above. The ones which are potentially problematic are those proposed for Base Line Street and Waterman Avenue. While no reduction in the number of lanes is proposed, some reduction in lane width is being proposed along with parking on one side of each roadway. Our review of the City s roadway widths as provided in the City s General Plan indicates that the curb-to-curb width may be insufficient as compared to these standards. We would note that this potential inconsistency is limited by the following language in the City s General Plan: Unique street cross-sections, median designs, and street widths may be considered for each development in order to create distinction and identity as long as function, capacity, and safety are maintained to the City s satisfaction. (Page 6-6 of the Circulation Element) Given the language above, it is therefore concluded that the roadway features are compliant with City policy statements and therefore acceptable. Does the Project Provide Sufficient On-Site Traffic Control Devices? The project is not proposed to construct any internal traffic signals or install other on-site traffic control devices. The need for traffic control devices is considered to be minimal given the extensive use of on-site traffic control devices, the prevalence of on-street parking, and other related measures. It is therefore concluded that the site plan to be adequate with respect to this item. Is there Adequate Access for Emergency Vehicles? Emergency vehicle access considers two items. First, this analysis considers whether emergency vehicles can access the site from a regional perspective. A review of the project location indicates that it is located at the corner of two major roadways and is several miles from several regional freeways (I-10, I-215). The regional access is therefore considered to be more than adequate. The second topic considered is whether emergency vehicles can travel into the site. As noted above, the project has a high level of internal accessibility, therefore, it is considered that emergency vehicles can easily travel while inside the project boundary using the internal ring road previously discussed. 38
45 Draft Traffic Impact Study for Waterma an Gardens Master Plan, San Bernardino, CA July 2012 Does the Project Provide Sufficient Pedestrian and Bicyclist On-Site and Off-Site Connectivity? The project has a very high level of pedestrian connectivity within the site with an extensive network of pedestrian-only trails and sidewalks connecting all areas of the project. This internal pedestrian network is complemented through additional pedestrian facilities on the boundary of the project including sidewalks on Olive Street, Waterman Avenue, and Base Line Street. The project also proposes to install a pedestrian signal separated by a raised median on Waterman Avenue, between Orange Street and 11 th Street. In the southbound direction, the crosswalk will be located approximately 90 feet north of 11 th Street, and approximately 35 wide. In the northbound direction, the crosswalk will be located approximately 75 feet north of 11 th Street, and approximately 30 wide. The signal is only accessible to pedestrians and bicyclists and a pedestrian signal will only flash when triggered by a non-motorist traveler. Striped bicycle lanes in both directions of travel at project boundaries are also proposed on Waterman Avenue and Base Line Street. The bicycle lanes will be located on-street and will share right-of-way with motor vehicles. It is concluded that the project has more than sufficient on-site and off-site pedestrian and bicyclist connectivity. Is the Traffic Signal Spacing Adequate? A review of City of San Bernardino documents indicates that the City does not have formal traffic signal spacing requirements. In the absence of specific direction, it is noted that one standard traffic engineering principle is that traffic signals should generally be spaced at least 800 feet. A review of the proposed traffic signals at the various locations along the project frontage indicates that a majority of the traffic signals meet this general spacing standard. Based on the considerations above, it can be concluded that the traffic signal spacing is therefore adequate. 39
46 APPENDIX A: EXISTING TRAFFIC COUNTS
47 City of San Bernardino N/S: "E" Street E/W: Base Line Street Weather: Sunny Counts Unlimited Inc. PO Box 1178 Corona, CA (951) File Name : SBCEBLAM Site Code : Start Date : 5/4/2011 Page No : 1 Groups Printed- Total Volume "E" Street Southbound Base Line Street Westbound "E" Street Northbound Base Line Street Eastbound Start Time Left Thru Right App. Total Left Thru Right App. Total Left Thru Right App. Total Left Thru Right App. Total Int. Total 07:00 AM :15 AM :30 AM :45 AM Total :00 AM :15 AM :30 AM :45 AM Total Grand Total Apprch % Total % "E" Street Southbound Base Line Street Westbound "E" Street Northbound Base Line Street Eastbound Start Time Left Thru Right App. Total Left Thru Right App. Total Left Thru Right App. Total Left Thru Right App. Total Int. Total Peak Hour Analysis From 07:00 AM to 08:45 AM - Peak 1 of 1 Peak Hour for Entire Intersection Begins at 07:15 AM 07:15 AM :30 AM :45 AM :00 AM Total Volume % App. Total PHF
48 City of San Bernardino N/S: "E" Street E/W: Base Line Street Weather: Sunny Counts Unlimited Inc. PO Box 1178 Corona, CA (951) File Name : SBCEBLAM Site Code : Start Date : 5/4/2011 Page No : 2 "E" Street Out In Total Right 312 Thru 57 Left Peak Hour Data Base Line Street Out In Total Left 472 Thru 34 Right Peak Hour Begins at 07:15 AM Total Volume North Right Thru Left Out In Total Base Line Street Left 15 Thru 139 Right Out In Total "E" Street Peak Hour Analysis From 07:00 AM to 08:45 AM - Peak 1 of 1 Peak Hour for Each Approach Begins at: 07:15 AM 07:15 AM 08:00 AM 08:00 AM +0 mins mins mins mins Total Volume % App. Total PHF
49 City of San Bernardino N/S: "E" Street E/W: Base Line Street Weather: Sunny Counts Unlimited Inc. PO Box 1178 Corona, CA (951) File Name : SBCEBLPM Site Code : Start Date : 5/4/2011 Page No : 1 Groups Printed- Total Volume "E" Street Southbound Base Line Street Westbound "E" Street Northbound Base Line Street Eastbound Start Time Left Thru Right App. Total Left Thru Right App. Total Left Thru Right App. Total Left Thru Right App. Total Int. Total 04:00 PM :15 PM :30 PM :45 PM Total :00 PM :15 PM :30 PM :45 PM Total Grand Total Apprch % Total % "E" Street Southbound Base Line Street Westbound "E" Street Northbound Base Line Street Eastbound Start Time Left Thru Right App. Total Left Thru Right App. Total Left Thru Right App. Total Left Thru Right App. Total Int. Total Peak Hour Analysis From 04:00 PM to 05:45 PM - Peak 1 of 1 Peak Hour for Entire Intersection Begins at 04:30 PM 04:30 PM :45 PM :00 PM :15 PM Total Volume % App. Total PHF
50 City of San Bernardino N/S: "E" Street E/W: Base Line Street Weather: Sunny Counts Unlimited Inc. PO Box 1178 Corona, CA (951) File Name : SBCEBLPM Site Code : Start Date : 5/4/2011 Page No : 2 "E" Street Out In Total Right 205 Thru 59 Left Peak Hour Data Base Line Street Out In Total Left 566 Thru 27 Right Peak Hour Begins at 04:30 PM Total Volume North Right Thru Left Out In Total Base Line Street Left 69 Thru 347 Right Out In Total "E" Street Peak Hour Analysis From 04:00 PM to 05:45 PM - Peak 1 of 1 Peak Hour for Each Approach Begins at: 04:30 PM 04:00 PM 04:30 PM 04:00 PM +0 mins mins mins mins Total Volume % App. Total PHF
51 City of San Bernardino N/S: Waterman Avenue E/W: Highland Avenue Weather: Sunny Counts Unlimited Inc. PO Box 1178 Corona, CA (951) File Name : SBCWAHIAM Site Code : Start Date : 5/4/2011 Page No : 1 Groups Printed- Total Volume Waterman Avenue Southbound Highland Avenue Westbound Waterman Avenue Northbound Highland Avenue Eastbound Start Time Left Thru Right App. Total Left Thru Right App. Total Left Thru Right App. Total Left Thru Right App. Total Int. Total 07:00 AM :15 AM :30 AM :45 AM Total :00 AM :15 AM :30 AM :45 AM Total Grand Total Apprch % Total % Waterman Avenue Southbound Highland Avenue Westbound Waterman Avenue Northbound Highland Avenue Eastbound Start Time Left Thru Right App. Total Left Thru Right App. Total Left Thru Right App. Total Left Thru Right App. Total Int. Total Peak Hour Analysis From 07:00 AM to 08:45 AM - Peak 1 of 1 Peak Hour for Entire Intersection Begins at 07:15 AM 07:15 AM :30 AM :45 AM :00 AM Total Volume % App. Total PHF
52 City of San Bernardino N/S: Waterman Avenue E/W: Highland Avenue Weather: Sunny Counts Unlimited Inc. PO Box 1178 Corona, CA (951) File Name : SBCWAHIAM Site Code : Start Date : 5/4/2011 Page No : 2 Waterman Avenue Out In Total Right 630 Thru 98 Left Peak Hour Data Highland Avenue Out In Total Left 294 Thru 154 Right Peak Hour Begins at 07:15 AM Total Volume North Right Thru Left Out In Total Highland Avenue Left 81 Thru 323 Right Out In Total Waterman Avenue Peak Hour Analysis From 07:00 AM to 08:45 AM - Peak 1 of 1 Peak Hour for Each Approach Begins at: 07:00 AM 07:15 AM 07:15 AM 07:15 AM +0 mins mins mins mins Total Volume % App. Total PHF
53 City of San Bernardino N/S: Waterman Avenue E/W: Highland Avenue Weather: Sunny Counts Unlimited Inc. PO Box 1178 Corona, CA (951) File Name : SBCWAHIPM Site Code : Start Date : 5/4/2011 Page No : 1 Groups Printed- Total Volume Waterman Avenue Southbound Highland Avenue Westbound Waterman Avenue Northbound Highland Avenue Eastbound Start Time Left Thru Right App. Total Left Thru Right App. Total Left Thru Right App. Total Left Thru Right App. Total Int. Total 04:00 PM :15 PM :30 PM :45 PM Total :00 PM :15 PM :30 PM :45 PM Total Grand Total Apprch % Total % Waterman Avenue Southbound Highland Avenue Westbound Waterman Avenue Northbound Highland Avenue Eastbound Start Time Left Thru Right App. Total Left Thru Right App. Total Left Thru Right App. Total Left Thru Right App. Total Int. Total Peak Hour Analysis From 04:00 PM to 05:45 PM - Peak 1 of 1 Peak Hour for Entire Intersection Begins at 04:45 PM 04:45 PM :00 PM :15 PM :30 PM Total Volume % App. Total PHF
54 City of San Bernardino N/S: Waterman Avenue E/W: Highland Avenue Weather: Sunny Counts Unlimited Inc. PO Box 1178 Corona, CA (951) File Name : SBCWAHIPM Site Code : Start Date : 5/4/2011 Page No : 2 Waterman Avenue Out In Total Right 346 Thru 117 Left Peak Hour Data Highland Avenue Out In Total Left 486 Thru 124 Right Peak Hour Begins at 04:45 PM Total Volume North Right Thru Left Out In Total Highland Avenue Left 165 Thru 606 Right Out In Total Waterman Avenue Peak Hour Analysis From 04:00 PM to 05:45 PM - Peak 1 of 1 Peak Hour for Each Approach Begins at: 04:00 PM 04:45 PM 04:45 PM 04:45 PM +0 mins mins mins mins Total Volume % App. Total PHF
55 City of San Bernardino N/S: Waterman Avenue E/W: Base Line Street Weather: Sunny Counts Unlimited Inc. PO Box 1178 Corona, CA (951) File Name : SBCWABLAM Site Code : Start Date : 5/4/2011 Page No : 1 Groups Printed- Total Volume Waterman Avenue Southbound Base Line Street Westbound Waterman Avenue Northbound Base Line Street Eastbound Start Time Left Thru Right App. Total Left Thru Right App. Total Left Thru Right App. Total Left Thru Right App. Total Int. Total 07:00 AM :15 AM :30 AM :45 AM Total :00 AM :15 AM :30 AM :45 AM Total Grand Total Apprch % Total % Waterman Avenue Southbound Base Line Street Westbound Waterman Avenue Northbound Base Line Street Eastbound Start Time Left Thru Right App. Total Left Thru Right App. Total Left Thru Right App. Total Left Thru Right App. Total Int. Total Peak Hour Analysis From 07:00 AM to 08:45 AM - Peak 1 of 1 Peak Hour for Entire Intersection Begins at 07:15 AM 07:15 AM :30 AM :45 AM :00 AM Total Volume % App. Total PHF
56 City of San Bernardino N/S: Waterman Avenue E/W: Base Line Street Weather: Sunny Counts Unlimited Inc. PO Box 1178 Corona, CA (951) File Name : SBCWABLAM Site Code : Start Date : 5/4/2011 Page No : 2 Waterman Avenue Out In Total Right 626 Thru 44 Left Peak Hour Data Base Line Street Out In Total Left 333 Thru 81 Right Peak Hour Begins at 07:15 AM Total Volume North Right Thru Left Out In Total Base Line Street Left 53 Thru 329 Right Out In Total Waterman Avenue Peak Hour Analysis From 07:00 AM to 08:45 AM - Peak 1 of 1 Peak Hour for Each Approach Begins at: 07:15 AM 07:15 AM 07:45 AM 07:15 AM +0 mins mins mins mins Total Volume % App. Total PHF
57 City of San Bernardino N/S: Waterman Avenue E/W: Base Line Street Weather: Sunny Counts Unlimited Inc. PO Box 1178 Corona, CA (951) File Name : SBCWABLPM Site Code : Start Date : 5/4/2011 Page No : 1 Groups Printed- Total Volume Waterman Avenue Southbound Base Line Street Westbound Waterman Avenue Northbound Base Line Street Eastbound Start Time Left Thru Right App. Total Left Thru Right App. Total Left Thru Right App. Total Left Thru Right App. Total Int. Total 04:00 PM :15 PM :30 PM :45 PM Total :00 PM :15 PM :30 PM :45 PM Total Grand Total Apprch % Total % Waterman Avenue Southbound Base Line Street Westbound Waterman Avenue Northbound Base Line Street Eastbound Start Time Left Thru Right App. Total Left Thru Right App. Total Left Thru Right App. Total Left Thru Right App. Total Int. Total Peak Hour Analysis From 04:00 PM to 05:45 PM - Peak 1 of 1 Peak Hour for Entire Intersection Begins at 05:00 PM 05:00 PM :15 PM :30 PM :45 PM Total Volume % App. Total PHF
58 City of San Bernardino N/S: Waterman Avenue E/W: Base Line Street Weather: Sunny Counts Unlimited Inc. PO Box 1178 Corona, CA (951) File Name : SBCWABLPM Site Code : Start Date : 5/4/2011 Page No : 2 Waterman Avenue Out In Total Right 535 Thru 55 Left Peak Hour Data Base Line Street Out In Total Left 416 Thru 104 Right Peak Hour Begins at 05:00 PM Total Volume North Right Thru Left Out In Total Base Line Street Left 120 Thru 577 Right Out In Total Waterman Avenue Peak Hour Analysis From 04:00 PM to 05:45 PM - Peak 1 of 1 Peak Hour for Each Approach Begins at: 04:00 PM 05:00 PM 04:45 PM 05:00 PM +0 mins mins mins mins Total Volume % App. Total PHF
59 City of San Bernardino N/S: Waterman Avenue E/W: Orange Street Weather: Sunny Counts Unlimited Inc. PO Box 1178 Corona, CA (951) File Name : SBCWAORAM Site Code : Start Date : 5/4/2011 Page No : 1 Groups Printed- Total Volume Waterman Avenue Southbound Orange Street Westbound Waterman Avenue Northbound Orange Street Eastbound Start Time Left Thru Right App. Total Left Thru Right App. Total Left Thru Right App. Total Left Thru Right App. Total Int. Total 07:00 AM :15 AM :30 AM :45 AM Total :00 AM :15 AM :30 AM :45 AM Total Grand Total Apprch % Total % Waterman Avenue Southbound Orange Street Westbound Waterman Avenue Northbound Orange Street Eastbound Start Time Left Thru Right App. Total Left Thru Right App. Total Left Thru Right App. Total Left Thru Right App. Total Int. Total Peak Hour Analysis From 07:00 AM to 08:45 AM - Peak 1 of 1 Peak Hour for Entire Intersection Begins at 07:30 AM 07:30 AM :45 AM :00 AM :15 AM Total Volume % App. Total PHF
60 City of San Bernardino N/S: Waterman Avenue E/W: Orange Street Weather: Sunny Counts Unlimited Inc. PO Box 1178 Corona, CA (951) File Name : SBCWAORAM Site Code : Start Date : 5/4/2011 Page No : 2 Waterman Avenue Out In Total Right 796 Thru 28 Left Peak Hour Data Orange Street Out In Total Thru Left 3 Right Peak Hour Begins at 07:30 AM Total Volume North Right Thru Left Out In Total Orange Street Left 5 Thru 540 Right Out In Total Waterman Avenue Peak Hour Analysis From 07:00 AM to 08:45 AM - Peak 1 of 1 Peak Hour for Each Approach Begins at: 07:00 AM 07:30 AM 08:00 AM 07:00 AM +0 mins mins mins mins Total Volume % App. Total PHF
61 City of San Bernardino N/S: Waterman Avenue E/W: Orange Street Weather: Sunny Counts Unlimited Inc. PO Box 1178 Corona, CA (951) File Name : SBCWAORPM Site Code : Start Date : 5/4/2011 Page No : 1 Groups Printed- Total Volume Waterman Avenue Southbound Orange Street Westbound Waterman Avenue Northbound Orange Street Eastbound Start Time Left Thru Right App. Total Left Thru Right App. Total Left Thru Right App. Total Left Thru Right App. Total Int. Total 04:00 PM :15 PM :30 PM :45 PM Total :00 PM :15 PM :30 PM :45 PM Total Grand Total Apprch % Total % Waterman Avenue Southbound Orange Street Westbound Waterman Avenue Northbound Orange Street Eastbound Start Time Left Thru Right App. Total Left Thru Right App. Total Left Thru Right App. Total Left Thru Right App. Total Int. Total Peak Hour Analysis From 04:00 PM to 05:45 PM - Peak 1 of 1 Peak Hour for Entire Intersection Begins at 04:15 PM 04:15 PM :30 PM :45 PM :00 PM Total Volume % App. Total PHF
62 City of San Bernardino N/S: Waterman Avenue E/W: Orange Street Weather: Sunny Counts Unlimited Inc. PO Box 1178 Corona, CA (951) File Name : SBCWAORPM Site Code : Start Date : 5/4/2011 Page No : 2 Waterman Avenue Out In Total Right 908 Thru 30 Left Peak Hour Data Orange Street Out In Total Left Thru 11 Right Peak Hour Begins at 04:15 PM Total Volume North Right Thru Left Out In Total Orange Street Left 20 Thru 983 Right Out In Total Waterman Avenue Peak Hour Analysis From 04:00 PM to 05:45 PM - Peak 1 of 1 Peak Hour for Each Approach Begins at: 04:00 PM 04:15 PM 04:45 PM 04:00 PM +0 mins mins mins mins Total Volume % App. Total PHF
63 City of San Bernardino N/S: Waterman Avenue E/W: 5th Street Weather: Sunny Counts Unlimited Inc. PO Box 1178 Corona, CA (951) File Name : SBCWA5AM Site Code : Start Date : 5/4/2011 Page No : 1 Groups Printed- Total Volume Waterman Avenue Southbound 5th Street Westbound Waterman Avenue Northbound 5th Street Eastbound Start Time Left Thru Right App. Total Left Thru Right App. Total Left Thru Right App. Total Left Thru Right App. Total Int. Total 07:00 AM :15 AM :30 AM :45 AM Total :00 AM :15 AM :30 AM :45 AM Total Grand Total Apprch % Total % Waterman Avenue Southbound 5th Street Westbound Waterman Avenue Northbound 5th Street Eastbound Start Time Left Thru Right App. Total Left Thru Right App. Total Left Thru Right App. Total Left Thru Right App. Total Int. Total Peak Hour Analysis From 07:00 AM to 08:45 AM - Peak 1 of 1 Peak Hour for Entire Intersection Begins at 07:30 AM 07:30 AM :45 AM :00 AM :15 AM Total Volume % App. Total PHF
64 City of San Bernardino N/S: Waterman Avenue E/W: 5th Street Weather: Sunny Counts Unlimited Inc. PO Box 1178 Corona, CA (951) File Name : SBCWA5AM Site Code : Start Date : 5/4/2011 Page No : 2 Waterman Avenue Out In Total Right 742 Thru 19 Left Peak Hour Data 5th Street Out In Total Left 128 Thru 112 Right Peak Hour Begins at 07:30 AM Total Volume North Right Thru Left Out In Total th Street Left 71 Thru 523 Right Out In Total Waterman Avenue Peak Hour Analysis From 07:00 AM to 08:45 AM - Peak 1 of 1 Peak Hour for Each Approach Begins at: 07:15 AM 07:15 AM 08:00 AM 07:45 AM +0 mins mins mins mins Total Volume % App. Total PHF
65 City of San Bernardino N/S: Waterman Avenue E/W: 5th Street Weather: Sunny Counts Unlimited Inc. PO Box 1178 Corona, CA (951) File Name : SBCWA5PM Site Code : Start Date : 5/4/2011 Page No : 1 Groups Printed- Total Volume Waterman Avenue Southbound 5th Street Westbound Waterman Avenue Northbound 5th Street Eastbound Start Time Left Thru Right App. Total Left Thru Right App. Total Left Thru Right App. Total Left Thru Right App. Total Int. Total 04:00 PM :15 PM :30 PM :45 PM Total :00 PM :15 PM :30 PM :45 PM Total Grand Total Apprch % Total % Waterman Avenue Southbound 5th Street Westbound Waterman Avenue Northbound 5th Street Eastbound Start Time Left Thru Right App. Total Left Thru Right App. Total Left Thru Right App. Total Left Thru Right App. Total Int. Total Peak Hour Analysis From 04:00 PM to 05:45 PM - Peak 1 of 1 Peak Hour for Entire Intersection Begins at 04:30 PM 04:30 PM :45 PM :00 PM :15 PM Total Volume % App. Total PHF
66 City of San Bernardino N/S: Waterman Avenue E/W: 5th Street Weather: Sunny Counts Unlimited Inc. PO Box 1178 Corona, CA (951) File Name : SBCWA5PM Site Code : Start Date : 5/4/2011 Page No : 2 Waterman Avenue Out In Total Right 777 Thru 39 Left Peak Hour Data 5th Street Out In Total Left 419 Thru 129 Right Peak Hour Begins at 04:30 PM Total Volume North Right Thru Left Out In Total th Street Left 85 Thru 970 Right Out In Total Waterman Avenue Peak Hour Analysis From 04:00 PM to 05:45 PM - Peak 1 of 1 Peak Hour for Each Approach Begins at: 04:30 PM 04:30 PM 04:30 PM 04:30 PM +0 mins mins mins mins Total Volume % App. Total PHF
67 City of San Bernardino N/S: Crestview Avenue E/W: Base Line Street Weather: Sunny Counts Unlimited Inc. PO Box 1178 Corona, CA (951) File Name : SBCCRBLAM Site Code : Start Date : 5/4/2011 Page No : 1 Groups Printed- Total Volume Crestview Avenue Southbound Base Line Street Westbound Crestview Avenue Northbound Base Line Street Eastbound Start Time Left Thru Right App. Total Left Thru Right App. Total Left Thru Right App. Total Left Thru Right App. Total Int. Total 07:00 AM :15 AM :30 AM :45 AM Total :00 AM :15 AM :30 AM :45 AM Total Grand Total Apprch % Total % Crestview Avenue Southbound Base Line Street Westbound Crestview Avenue Northbound Base Line Street Eastbound Start Time Left Thru Right App. Total Left Thru Right App. Total Left Thru Right App. Total Left Thru Right App. Total Int. Total Peak Hour Analysis From 07:00 AM to 08:45 AM - Peak 1 of 1 Peak Hour for Entire Intersection Begins at 07:15 AM 07:15 AM :30 AM :45 AM :00 AM Total Volume % App. Total PHF
68 City of San Bernardino N/S: Crestview Avenue E/W: Base Line Street Weather: Sunny Counts Unlimited Inc. PO Box 1178 Corona, CA (951) File Name : SBCCRBLAM Site Code : Start Date : 5/4/2011 Page No : 2 Crestview Avenue Out In Total Right 4 Thru 23 Left Peak Hour Data Base Line Street Out In Total Left 411 Thru 10 Right Peak Hour Begins at 07:15 AM Total Volume North Right Thru Left Out In Total Base Line Street Left 9 Thru 3 Right Out In Total Crestview Avenue Peak Hour Analysis From 07:00 AM to 08:45 AM - Peak 1 of 1 Peak Hour for Each Approach Begins at: 08:00 AM 07:15 AM 07:00 AM 07:15 AM +0 mins mins mins mins Total Volume % App. Total PHF
69 City of San Bernardino N/S: Crestview Avenue E/W: Base Line Street Weather: Sunny Counts Unlimited Inc. PO Box 1178 Corona, CA (951) File Name : SBCCRBLPM Site Code : Start Date : 5/4/2011 Page No : 1 Groups Printed- Total Volume Crestview Avenue Southbound Base Line Street Westbound Crestview Avenue Northbound Base Line Street Eastbound Start Time Left Thru Right App. Total Left Thru Right App. Total Left Thru Right App. Total Left Thru Right App. Total Int. Total 04:00 PM :15 PM :30 PM :45 PM Total :00 PM :15 PM :30 PM :45 PM Total Grand Total Apprch % Total % Crestview Avenue Southbound Base Line Street Westbound Crestview Avenue Northbound Base Line Street Eastbound Start Time Left Thru Right App. Total Left Thru Right App. Total Left Thru Right App. Total Left Thru Right App. Total Int. Total Peak Hour Analysis From 04:00 PM to 05:45 PM - Peak 1 of 1 Peak Hour for Entire Intersection Begins at 04:15 PM 04:15 PM :30 PM :45 PM :00 PM Total Volume % App. Total PHF
70 City of San Bernardino N/S: Crestview Avenue E/W: Base Line Street Weather: Sunny Counts Unlimited Inc. PO Box 1178 Corona, CA (951) File Name : SBCCRBLPM Site Code : Start Date : 5/4/2011 Page No : 2 Crestview Avenue Out In Total Right 5 Thru 48 Left Peak Hour Data Base Line Street Out In Total Left 636 Thru 12 Right Peak Hour Begins at 04:15 PM Total Volume North Right Thru Left Out In Total Base Line Street Left 3 Thru 4 Right Out In Total Crestview Avenue Peak Hour Analysis From 04:00 PM to 05:45 PM - Peak 1 of 1 Peak Hour for Each Approach Begins at: 04:15 PM 05:00 PM 05:00 PM 04:15 PM +0 mins mins mins mins Total Volume % App. Total PHF
71 City of San Bernardino N/S: La Junta Street E/W: Base Line Street Weather: Sunny Counts Unlimited Inc. PO Box 1178 Corona, CA (951) File Name : SBCLJBLAM Site Code : Start Date : 5/4/2011 Page No : 1 Groups Printed- Total Volume Base Line Street Westbound La Junta Street Northbound Base Line Street Eastbound Start Time Left Thru App. Total Left Right App. Total Thru Right App. Total Int. Total 07:00 AM :15 AM :30 AM :45 AM Total :00 AM :15 AM :30 AM :45 AM Total Grand Total Apprch % Total % Base Line Street Westbound La Junta Street Northbound Base Line Street Eastbound Start Time Left Thru App. Total Left Right App. Total Thru Right App. Total Int. Total Peak Hour Analysis From 07:00 AM to 08:45 AM - Peak 1 of 1 Peak Hour for Entire Intersection Begins at 07:15 AM 07:15 AM :30 AM :45 AM :00 AM Total Volume % App. Total PHF
72 City of San Bernardino N/S: La Junta Street E/W: Base Line Street Weather: Sunny Counts Unlimited Inc. PO Box 1178 Corona, CA (951) File Name : SBCLJBLAM Site Code : Start Date : 5/4/2011 Page No : 2 Peak Hour Data Base Line Street Out In Total Thru 17 Right Peak Hour Begins at 07:15 AM Total Volume North Thru 587 Left 19 Out In Total Base Line Street Left 10 Right Out In Total La Junta Street Peak Hour Analysis From 07:00 AM to 08:45 AM - Peak 1 of 1 Peak Hour for Each Approach Begins at: 07:15 AM 08:00 AM 07:15 AM +0 mins mins mins mins Total Volume % App. Total PHF
73 City of San Bernardino N/S: La Junta Street E/W: Base Line Street Weather: Sunny Counts Unlimited Inc. PO Box 1178 Corona, CA (951) File Name : SBCLJBLPM Site Code : Start Date : 5/4/2011 Page No : 1 Groups Printed- Total Volume Base Line Street Westbound La Junta Street Northbound Base Line Street Eastbound Start Time Left Thru App. Total Left Right App. Total Thru Right App. Total Int. Total 04:00 PM :15 PM :30 PM :45 PM Total :00 PM :15 PM :30 PM :45 PM Total Grand Total Apprch % Total % Base Line Street Westbound La Junta Street Northbound Base Line Street Eastbound Start Time Left Thru App. Total Left Right App. Total Thru Right App. Total Int. Total Peak Hour Analysis From 04:00 PM to 05:45 PM - Peak 1 of 1 Peak Hour for Entire Intersection Begins at 04:30 PM 04:30 PM :45 PM :00 PM :15 PM Total Volume % App. Total PHF
74 City of San Bernardino N/S: La Junta Street E/W: Base Line Street Weather: Sunny Counts Unlimited Inc. PO Box 1178 Corona, CA (951) File Name : SBCLJBLPM Site Code : Start Date : 5/4/2011 Page No : 2 Peak Hour Data Base Line Street Out In Total Thru 12 Right Peak Hour Begins at 04:30 PM Total Volume North Thru 605 Left 9 Out In Total Base Line Street Left 16 Right Out In Total La Junta Street Peak Hour Analysis From 04:00 PM to 05:45 PM - Peak 1 of 1 Peak Hour for Each Approach Begins at: 05:00 PM 04:30 PM 04:15 PM +0 mins mins mins mins Total Volume % App. Total PHF
75 City of San Bernardino N/S: La Junta Street E/W: Orange Street Weather: Sunny Counts Unlimited Inc. PO Box 1178 Corona, CA (951) File Name : SBCLJORAM Site Code : Start Date : 5/4/2011 Page No : 1 Groups Printed- Total Volume La Junta Street Southbound La Junta Street Northbound Orange Street Eastbound Start Time Thru Right App. Total Left Thru App. Total Left Right App. Total Int. Total 07:00 AM :15 AM :30 AM :45 AM Total :00 AM :15 AM :30 AM :45 AM Total Grand Total Apprch % Total % La Junta Street Southbound La Junta Street Northbound Orange Street Eastbound Start Time Thru Right App. Total Left Thru App. Total Left Right App. Total Int. Total Peak Hour Analysis From 07:00 AM to 08:45 AM - Peak 1 of 1 Peak Hour for Entire Intersection Begins at 08:00 AM 08:00 AM :15 AM :30 AM :45 AM Total Volume % App. Total PHF
76 City of San Bernardino N/S: La Junta Street E/W: Orange Street Weather: Sunny Counts Unlimited Inc. PO Box 1178 Corona, CA (951) File Name : SBCLJORAM Site Code : Start Date : 5/4/2011 Page No : 2 La Junta Street Out In Total Right 22 Thru Peak Hour Data Orange Street Out In Total Left 28 Right Peak Hour Begins at 08:00 AM Total Volume North Left 10 Thru Out In Total La Junta Street Peak Hour Analysis From 07:00 AM to 08:45 AM - Peak 1 of 1 Peak Hour for Each Approach Begins at: 07:15 AM 08:00 AM 08:00 AM +0 mins mins mins mins Total Volume % App. Total PHF
77 City of San Bernardino N/S: La Junta Street E/W: Orange Street Weather: Sunny Counts Unlimited Inc. PO Box 1178 Corona, CA (951) File Name : SBCLJORPM Site Code : Start Date : 5/4/2011 Page No : 1 Groups Printed- Total Volume La Junta Street Southbound La Junta Street Northbound Orange Street Eastbound Start Time Thru Right App. Total Left Thru App. Total Left Right App. Total Int. Total 04:00 PM :15 PM :30 PM :45 PM Total :00 PM :15 PM :30 PM :45 PM Total Grand Total Apprch % Total % La Junta Street Southbound La Junta Street Northbound Orange Street Eastbound Start Time Thru Right App. Total Left Thru App. Total Left Right App. Total Int. Total Peak Hour Analysis From 04:00 PM to 05:45 PM - Peak 1 of 1 Peak Hour for Entire Intersection Begins at 05:00 PM 05:00 PM :15 PM :30 PM :45 PM Total Volume % App. Total PHF
78 City of San Bernardino N/S: La Junta Street E/W: Orange Street Weather: Sunny Counts Unlimited Inc. PO Box 1178 Corona, CA (951) File Name : SBCLJORPM Site Code : Start Date : 5/4/2011 Page No : 2 La Junta Street Out In Total Right 25 Thru Peak Hour Data Orange Street Out In Total Left 9 Right Peak Hour Begins at 05:00 PM Total Volume North Left 18 Thru Out In Total La Junta Street Peak Hour Analysis From 04:00 PM to 05:45 PM - Peak 1 of 1 Peak Hour for Each Approach Begins at: 05:00 PM 05:00 PM 04:30 PM +0 mins mins mins mins Total Volume % App. Total PHF
79 City of San Bernardino N/S: Del Rosa Drive E/W: Base Line Street Weather: Sunny Counts Unlimited Inc. PO Box 1178 Corona, CA (951) File Name : SBCDRBLAM Site Code : Start Date : 5/4/2011 Page No : 1 Groups Printed- Total Volume Del Rosa Drive Southbound Base Line Street Westbound Del Rosa Drive Northbound Base Line Street Eastbound Start Time Left Thru Right App. Total Left Thru Right App. Total Left Thru Right App. Total Left Thru Right App. Total Int. Total 07:00 AM :15 AM :30 AM :45 AM Total :00 AM :15 AM :30 AM :45 AM Total Grand Total Apprch % Total % Del Rosa Drive Southbound Base Line Street Westbound Del Rosa Drive Northbound Base Line Street Eastbound Start Time Left Thru Right App. Total Left Thru Right App. Total Left Thru Right App. Total Left Thru Right App. Total Int. Total Peak Hour Analysis From 07:00 AM to 08:45 AM - Peak 1 of 1 Peak Hour for Entire Intersection Begins at 07:00 AM 07:00 AM :15 AM :30 AM :45 AM Total Volume % App. Total PHF
80 City of San Bernardino N/S: Del Rosa Drive E/W: Base Line Street Weather: Sunny Counts Unlimited Inc. PO Box 1178 Corona, CA (951) File Name : SBCDRBLAM Site Code : Start Date : 5/4/2011 Page No : 2 Del Rosa Drive Out In Total Right 346 Thru 31 Left Peak Hour Data Base Line Street Out In Total Left 246 Thru 93 Right Peak Hour Begins at 07:00 AM Total Volume North Right Thru Left Out In Total Base Line Street Left 52 Thru 173 Right Out In Total Del Rosa Drive Peak Hour Analysis From 07:00 AM to 08:45 AM - Peak 1 of 1 Peak Hour for Each Approach Begins at: 07:00 AM 07:00 AM 07:00 AM 07:15 AM +0 mins mins mins mins Total Volume % App. Total PHF
81 City of San Bernardino N/S: Del Rosa Drive E/W: Base Line Street Weather: Sunny Counts Unlimited Inc. PO Box 1178 Corona, CA (951) File Name : SBCDRBLPM Site Code : Start Date : 5/4/2011 Page No : 1 Groups Printed- Total Volume Del Rosa Drive Southbound Base Line Street Westbound Del Rosa Drive Northbound Base Line Street Eastbound Start Time Left Thru Right App. Total Left Thru Right App. Total Left Thru Right App. Total Left Thru Right App. Total Int. Total 04:00 PM :15 PM :30 PM :45 PM Total :00 PM :15 PM :30 PM :45 PM Total Grand Total Apprch % Total % Del Rosa Drive Southbound Base Line Street Westbound Del Rosa Drive Northbound Base Line Street Eastbound Start Time Left Thru Right App. Total Left Thru Right App. Total Left Thru Right App. Total Left Thru Right App. Total Int. Total Peak Hour Analysis From 04:00 PM to 05:45 PM - Peak 1 of 1 Peak Hour for Entire Intersection Begins at 04:30 PM 04:30 PM :45 PM :00 PM :15 PM Total Volume % App. Total PHF
82 City of San Bernardino N/S: Del Rosa Drive E/W: Base Line Street Weather: Sunny Counts Unlimited Inc. PO Box 1178 Corona, CA (951) File Name : SBCDRBLPM Site Code : Start Date : 5/4/2011 Page No : 2 Del Rosa Drive Out In Total Right 216 Thru 55 Left Peak Hour Data Base Line Street Out In Total Left 518 Thru 33 Right Peak Hour Begins at 04:30 PM Total Volume North Right Thru Left Out In Total Base Line Street Left 22 Thru 259 Right Out In Total Del Rosa Drive Peak Hour Analysis From 04:00 PM to 05:45 PM - Peak 1 of 1 Peak Hour for Each Approach Begins at: 04:00 PM 05:00 PM 04:45 PM 04:30 PM +0 mins mins mins mins Total Volume % App. Total PHF
83 City of Corona Orange Street E/ Waterman Avenue 24 Hour Directional Volume Count Counts Unlimited, Inc PO Box 1178 Corona, CA (951) Page 1 SBCOREWA Site Code: Date Start: 28-Apr-11 Date End: 28-Apr-11 Start 28-Apr-11 Eastbound Hour Totals Westbound Hour Totals Combined Totals Time Thu Morning Afternoon Morning Afternoon Morning Afternoon Morning Afternoon Morning Afternoon 12: : : : : : : : : : : : : : : : : : : : : : : : : : : : : : : : : : : : : : : : : : : : : : : : Total Combined Total AM Peak 10:45 07:30 Vol P.H.F PM Peak 12:00 12:00 Vol P.H.F Percentag e ADT/AAD T 30.7% 69.3% 34.4% 65.6% ADT 1,403 AADT 1,403
84 City of Corona Crestview Avenue S/ Base Line Street 24 Hour Directional Volume Count Counts Unlimited, Inc PO Box 1178 Corona, CA (951) Page 1 SBCCRSBL Site Code: Date Start: 28-Apr-11 Date End: 28-Apr-11 Start 28-Apr-11 Northbound Hour Totals Southbound Hour Totals Combined Totals Time Thu Morning Afternoon Morning Afternoon Morning Afternoon Morning Afternoon Morning Afternoon 12: : : : : : : : : : : : : : : : : : : : : : : : : : : : : : : : : : : : : : : : : : : : : : : : Total Combined Total AM Peak 07:00 10:45 Vol P.H.F PM Peak 02:15 02:45 Vol P.H.F Percentag e ADT/AAD T 30.9% 69.1% 29.4% 70.6% ADT 689 AADT 689
85 City of San Bernardino Orange Street W/ La Juanita Street 24 Hour Directional Volume Count Counts Unlimited, Inc PO Box 1178 Corona, CA (951) Page 1 SBCORWLJ Site Code: Date Start: 28-Apr-11 Date End: 28-Apr-11 Start 28-Apr-11 Eastbound Hour Totals Westbound Hour Totals Combined Totals Time Thu Morning Afternoon Morning Afternoon Morning Afternoon Morning Afternoon Morning Afternoon 12: : : : : : : : : : : : : : : : : : : : : : : : : : : : : : : : : : : : : : : : : : : : : : : : Total Combined Total AM Peak 07:45 07:00 Vol P.H.F PM Peak 12:00 00:15 Vol P.H.F Percentag e ADT/AAD T 42.7% 57.3% 35.5% 64.5% ADT 506 AADT 506
86 APPENDIX B: EXISTING LOS RESULTS
87 HCM Signalized Intersection Capacity Analysis 1: Base Line Street & E Street 6/6/2011 Movement EBL EBT EBR WBL WBT WBR NBL NBT NBR SBL SBT SBR Ideal Flow (vphpl) Total Lost time (s) Lane Util. Factor Frt Flt Protected Satd. Flow (prot) Flt Permitted Satd. Flow (perm) Volume (vph) Peak-hour factor, PHF Adj. Flow (vph) RTOR Reduction (vph) Lane Group Flow (vph) Turn Type pm+pt pm+pt Perm Perm Protected Phases Permitted Phases Actuated Green, G (s) Effective Green, g (s) Actuated g/c Ratio Clearance Time (s) Vehicle Extension (s) Lane Grp Cap (vph) v/s Ratio Prot c c c0.13 v/s Ratio Perm v/c Ratio Uniform Delay, d Progression Factor Incremental Delay, d Delay (s) Level of Service A A A A C C C C Approach Delay (s) Approach LOS A A C C HCM Average Control Delay 14.2 HCM Level of Service B HCM Volume to Capacity ratio 0.38 Actuated Cycle Length (s) 80.0 Sum of lost time (s) 8.0 Intersection Capacity Utilization 55.7% ICU Level of Service B c Critical Lane Group Waterman Gardens - Existing - AM Fehr & Peers Associates, Inc. Page 1
88 HCM Signalized Intersection Capacity Analysis 2: Highland Avenue & Waterman Avenue 6/6/2011 Movement EBL EBT EBR WBL WBT WBR NBL NBT NBR SBL SBT SBR Ideal Flow (vphpl) Total Lost time (s) Lane Util. Factor Frt Flt Protected Satd. Flow (prot) Flt Permitted Satd. Flow (perm) Volume (vph) Peak-hour factor, PHF Adj. Flow (vph) RTOR Reduction (vph) Lane Group Flow (vph) Turn Type Prot Perm Prot Prot Perm Prot Protected Phases Permitted Phases 2 8 Actuated Green, G (s) Effective Green, g (s) Actuated g/c Ratio Clearance Time (s) Vehicle Extension (s) Lane Grp Cap (vph) v/s Ratio Prot c0.07 c c0.07 c0.21 v/s Ratio Perm v/c Ratio Uniform Delay, d Progression Factor Incremental Delay, d Delay (s) Level of Service D B B D B D C C D C Approach Delay (s) Approach LOS B C C C HCM Average Control Delay 26.7 HCM Level of Service C HCM Volume to Capacity ratio 0.45 Actuated Cycle Length (s) 90.0 Sum of lost time (s) 4.0 Intersection Capacity Utilization 52.1% ICU Level of Service A c Critical Lane Group Waterman Gardens - Existing - AM Fehr & Peers Associates, Inc. Page 2
89 HCM Signalized Intersection Capacity Analysis 3: Base Line Street & Waterman Avenue 6/13/2012 Movement EBL EBT EBR WBL WBT WBR NBL NBT NBR SBL SBT SBR Ideal Flow (vphpl) Total Lost time (s) Lane Util. Factor Frt Flt Protected Satd. Flow (prot) Flt Permitted Satd. Flow (perm) Volume (vph) Peak-hour factor, PHF Adj. Flow (vph) RTOR Reduction (vph) Lane Group Flow (vph) Turn Type Prot Prot Prot pm+ov Prot pm+ov Protected Phases Permitted Phases 8 4 Actuated Green, G (s) Effective Green, g (s) Actuated g/c Ratio Clearance Time (s) Vehicle Extension (s) Lane Grp Cap (vph) v/s Ratio Prot 0.06 c0.12 c0.10 c0.17 c c v/s Ratio Perm v/c Ratio Uniform Delay, d Progression Factor Incremental Delay, d Delay (s) Level of Service D C E D D B A D B A Approach Delay (s) Approach LOS D D B B HCM Average Control Delay 28.0 HCM Level of Service C HCM Volume to Capacity ratio 0.53 Actuated Cycle Length (s) Sum of lost time (s) 6.0 Intersection Capacity Utilization 56.6% ICU Level of Service B c Critical Lane Group Waterman Gardens - Existing - AM Fehr & Peers Associates, Inc. Page 1
90 HCM Unsignalized Intersection Capacity Analysis 4: Driveway & Waterman Avenue 6/6/2011 Movement EBL EBT EBR WBL WBT WBR NBL NBT NBR SBL SBT SBR Sign Control Stop Stop Free Free Grade 0% 0% 0% 0% Volume (veh/h) Peak Hour Factor Hourly flow rate (vph) Pedestrians Lane Width (ft) Walking Speed (ft/s) Percent Blockage Right turn flare (veh) Median type None None Median storage veh) Upstream signal (ft) 526 px, platoon unblocked vc, conflicting volume vc1, stage 1 conf vol 0 0 vc2, stage 2 conf vol 0 0 vcu, unblocked vol tc, single (s) tc, 2 stage (s) tf (s) p0 queue free % cm capacity (veh/h) Direction, Lane # EB 1 WB 1 NB 1 NB 2 NB 3 SB 1 SB 2 SB 3 Volume Total Volume Left Volume Right csh Volume to Capacity Queue Length 95th (ft) Control Delay (s) Lane LOS C D A A Approach Delay (s) Approach LOS C D Average Delay 2.1 Intersection Capacity Utilization 37.6% ICU Level of Service A Waterman Gardens - Existing - AM Fehr & Peers Associates, Inc. Page 4
91 HCM Unsignalized Intersection Capacity Analysis 5: Olive Street & Waterman Avenue 6/6/2011 Movement EBL EBT EBR WBL WBT WBR NBL NBT NBR SBL SBT SBR Sign Control Stop Stop Free Free Grade 0% 0% 0% 0% Volume (veh/h) Peak Hour Factor Hourly flow rate (vph) Pedestrians Lane Width (ft) Walking Speed (ft/s) Percent Blockage Right turn flare (veh) Median type None None Median storage veh) Upstream signal (ft) 1013 px, platoon unblocked vc, conflicting volume vc1, stage 1 conf vol 0 0 vc2, stage 2 conf vol 0 0 vcu, unblocked vol tc, single (s) tc, 2 stage (s) tf (s) p0 queue free % cm capacity (veh/h) Direction, Lane # EB 1 WB 1 NB 1 NB 2 NB 3 SB 1 SB 2 SB 3 Volume Total Volume Left Volume Right csh Volume to Capacity Queue Length 95th (ft) Control Delay (s) Lane LOS D D A A Approach Delay (s) Approach LOS D D Average Delay 1.2 Intersection Capacity Utilization 36.0% ICU Level of Service A Waterman Gardens - Existing - AM Fehr & Peers Associates, Inc. Page 5
92 HCM Signalized Intersection Capacity Analysis 6: 5th Street & Waterman Avenue 6/6/2011 Movement EBL EBT EBR WBL WBT WBR NBL NBT NBR SBL SBT SBR Ideal Flow (vphpl) Total Lost time (s) Lane Util. Factor Frt Flt Protected Satd. Flow (prot) Flt Permitted Satd. Flow (perm) Volume (vph) Peak-hour factor, PHF Adj. Flow (vph) RTOR Reduction (vph) Lane Group Flow (vph) Turn Type pm+pt pm+pt Perm Prot Perm Prot Perm Protected Phases Permitted Phases Actuated Green, G (s) Effective Green, g (s) Actuated g/c Ratio Clearance Time (s) Vehicle Extension (s) Lane Grp Cap (vph) v/s Ratio Prot c c c c0.27 v/s Ratio Perm v/c Ratio Uniform Delay, d Progression Factor Incremental Delay, d Delay (s) Level of Service B B B C B C B A C C B Approach Delay (s) Approach LOS B B B B HCM Average Control Delay 17.4 HCM Level of Service B HCM Volume to Capacity ratio 0.52 Actuated Cycle Length (s) 64.0 Sum of lost time (s) 6.0 Intersection Capacity Utilization 53.1% ICU Level of Service A c Critical Lane Group Waterman Gardens - Existing - AM Fehr & Peers Associates, Inc. Page 6
93 HCM Signalized Intersection Capacity Analysis 7: Base Line Street & Crestview Avenue 6/6/2011 Movement EBL EBT EBR WBL WBT WBR NBL NBT NBR SBL SBT SBR Ideal Flow (vphpl) Total Lost time (s) Lane Util. Factor Frt Flt Protected Satd. Flow (prot) Flt Permitted Satd. Flow (perm) Volume (vph) Peak-hour factor, PHF Adj. Flow (vph) RTOR Reduction (vph) Lane Group Flow (vph) Turn Type Perm Perm Perm Perm Protected Phases Permitted Phases Actuated Green, G (s) Effective Green, g (s) Actuated g/c Ratio Clearance Time (s) Vehicle Extension (s) Lane Grp Cap (vph) v/s Ratio Prot 0.14 c0.22 v/s Ratio Perm c0.03 v/c Ratio Uniform Delay, d Progression Factor Incremental Delay, d Delay (s) Level of Service A A A A B B Approach Delay (s) Approach LOS A A B B HCM Average Control Delay 3.4 HCM Level of Service A HCM Volume to Capacity ratio 0.27 Actuated Cycle Length (s) 50.0 Sum of lost time (s) 4.0 Intersection Capacity Utilization 40.4% ICU Level of Service A c Critical Lane Group Waterman Gardens - Existing - AM Fehr & Peers Associates, Inc. Page 7
94 HCM Unsignalized Intersection Capacity Analysis 8: Base Line Street & La Junita Street 6/6/2011 Movement EBT EBR WBL WBT NBL NBR Sign Control Free Free Stop Grade 0% 0% 0% Volume (veh/h) Peak Hour Factor Hourly flow rate (vph) Pedestrians Lane Width (ft) Walking Speed (ft/s) Percent Blockage Right turn flare (veh) Median type None Median storage veh) Upstream signal (ft) 270 px, platoon unblocked vc, conflicting volume vc1, stage 1 conf vol vc2, stage 2 conf vol vcu, unblocked vol tc, single (s) tc, 2 stage (s) tf (s) p0 queue free % cm capacity (veh/h) Direction, Lane # EB 1 EB 2 WB 1 WB 2 WB 3 NB 1 Volume Total Volume Left Volume Right csh Volume to Capacity Queue Length 95th (ft) Control Delay (s) Lane LOS A C Approach Delay (s) Approach LOS C Average Delay 0.6 Intersection Capacity Utilization 26.2% ICU Level of Service A Waterman Gardens - Existing - AM Fehr & Peers Associates, Inc. Page 8
95 HCM Unsignalized Intersection Capacity Analysis 9: Driveway & La Junita Street 6/6/2011 Movement EBL EBT EBR WBL WBT WBR NBL NBT NBR SBL SBT SBR Sign Control Stop Stop Free Free Grade 0% 0% 0% 0% Volume (veh/h) Peak Hour Factor Hourly flow rate (vph) Pedestrians Lane Width (ft) Walking Speed (ft/s) Percent Blockage Right turn flare (veh) Median type None None Median storage veh) Upstream signal (ft) px, platoon unblocked vc, conflicting volume vc1, stage 1 conf vol vc2, stage 2 conf vol vcu, unblocked vol tc, single (s) tc, 2 stage (s) tf (s) p0 queue free % cm capacity (veh/h) Direction, Lane # EB 1 WB 1 NB 1 SB 1 Volume Total Volume Left Volume Right csh Volume to Capacity Queue Length 95th (ft) Control Delay (s) Lane LOS A A A Approach Delay (s) Approach LOS A A Average Delay 4.0 Intersection Capacity Utilization 18.5% ICU Level of Service A Waterman Gardens - Existing - AM Fehr & Peers Associates, Inc. Page 9
96 HCM Signalized Intersection Capacity Analysis 10: Base Line Street & Del Rosa Drive 6/6/2011 Movement EBL EBT EBR WBL WBT WBR NBL NBT NBR SBL SBT SBR Ideal Flow (vphpl) Total Lost time (s) Lane Util. Factor Frt Flt Protected Satd. Flow (prot) Flt Permitted Satd. Flow (perm) Volume (vph) Peak-hour factor, PHF Adj. Flow (vph) RTOR Reduction (vph) Lane Group Flow (vph) Turn Type Prot Prot Prot Prot Perm Protected Phases Permitted Phases 4 Actuated Green, G (s) Effective Green, g (s) Actuated g/c Ratio Clearance Time (s) Vehicle Extension (s) Lane Grp Cap (vph) v/s Ratio Prot c c0.05 c0.17 c c0.23 v/s Ratio Perm 0.06 v/c Ratio Uniform Delay, d Progression Factor Incremental Delay, d Delay (s) Level of Service D B D C D C D C C Approach Delay (s) Approach LOS C C C C HCM Average Control Delay 25.3 HCM Level of Service C HCM Volume to Capacity ratio 0.53 Actuated Cycle Length (s) 90.0 Sum of lost time (s) 8.0 Intersection Capacity Utilization 55.1% ICU Level of Service B c Critical Lane Group Waterman Gardens - Existing - AM Fehr & Peers Associates, Inc. Page 10
97 HCM Signalized Intersection Capacity Analysis 1: Base Line Street & E Street 6/6/2011 Movement EBL EBT EBR WBL WBT WBR NBL NBT NBR SBL SBT SBR Ideal Flow (vphpl) Total Lost time (s) Lane Util. Factor Frt Flt Protected Satd. Flow (prot) Flt Permitted Satd. Flow (perm) Volume (vph) Peak-hour factor, PHF Adj. Flow (vph) RTOR Reduction (vph) Lane Group Flow (vph) Turn Type pm+pt pm+pt Perm Perm Protected Phases Permitted Phases Actuated Green, G (s) Effective Green, g (s) Actuated g/c Ratio Clearance Time (s) Vehicle Extension (s) Lane Grp Cap (vph) v/s Ratio Prot c c v/s Ratio Perm c0.14 v/c Ratio Uniform Delay, d Progression Factor Incremental Delay, d Delay (s) Level of Service A A A A C C C C Approach Delay (s) Approach LOS A A C C HCM Average Control Delay 15.3 HCM Level of Service B HCM Volume to Capacity ratio 0.40 Actuated Cycle Length (s) 80.0 Sum of lost time (s) 8.0 Intersection Capacity Utilization 60.1% ICU Level of Service B c Critical Lane Group Waterman Gardens - Existing - PM Fehr & Peers Associates, Inc. Page 1
98 HCM Signalized Intersection Capacity Analysis 2: Highland Avenue & Waterman Avenue 6/6/2011 Movement EBL EBT EBR WBL WBT WBR NBL NBT NBR SBL SBT SBR Ideal Flow (vphpl) Total Lost time (s) Lane Util. Factor Frt Flt Protected Satd. Flow (prot) Flt Permitted Satd. Flow (perm) Volume (vph) Peak-hour factor, PHF Adj. Flow (vph) RTOR Reduction (vph) Lane Group Flow (vph) Turn Type Prot Perm Prot Prot Perm Prot Protected Phases Permitted Phases 2 8 Actuated Green, G (s) Effective Green, g (s) Actuated g/c Ratio Clearance Time (s) Vehicle Extension (s) Lane Grp Cap (vph) v/s Ratio Prot c0.07 c0.19 c0.11 c v/s Ratio Perm v/c Ratio Uniform Delay, d Progression Factor Incremental Delay, d Delay (s) Level of Service D C B D C D C C D C Approach Delay (s) Approach LOS C C C C HCM Average Control Delay 28.2 HCM Level of Service C HCM Volume to Capacity ratio 0.54 Actuated Cycle Length (s) 90.0 Sum of lost time (s) 4.0 Intersection Capacity Utilization 61.6% ICU Level of Service B c Critical Lane Group Waterman Gardens - Existing - PM Fehr & Peers Associates, Inc. Page 2
99 HCM Signalized Intersection Capacity Analysis 3: Base Line Street & Waterman Avenue 6/13/2012 Movement EBL EBT EBR WBL WBT WBR NBL NBT NBR SBL SBT SBR Ideal Flow (vphpl) Total Lost time (s) Lane Util. Factor Frt Flt Protected Satd. Flow (prot) Flt Permitted Satd. Flow (perm) Volume (vph) Peak-hour factor, PHF Adj. Flow (vph) RTOR Reduction (vph) Lane Group Flow (vph) Turn Type Prot Prot Prot pm+ov Prot pm+ov Protected Phases Permitted Phases 8 4 Actuated Green, G (s) Effective Green, g (s) Actuated g/c Ratio Clearance Time (s) Vehicle Extension (s) Lane Grp Cap (vph) v/s Ratio Prot 0.06 c0.17 c0.09 c0.17 c0.09 c c v/s Ratio Perm v/c Ratio Uniform Delay, d Progression Factor Incremental Delay, d Delay (s) Level of Service D D E C D B A D C B Approach Delay (s) Approach LOS D D C C HCM Average Control Delay 29.2 HCM Level of Service C HCM Volume to Capacity ratio 0.57 Actuated Cycle Length (s) Sum of lost time (s) 4.0 Intersection Capacity Utilization 59.4% ICU Level of Service B c Critical Lane Group Waterman Gardens - Existing - PM Fehr & Peers Associates, Inc. Page 1
100 HCM Unsignalized Intersection Capacity Analysis 4: Orange Street Driveway & Waterman Avenue 6/6/2011 Movement EBL EBT EBR WBL WBT WBR NBL NBT NBR SBL SBT SBR Sign Control Stop Stop Free Free Grade 0% 0% 0% 0% Volume (veh/h) Peak Hour Factor Hourly flow rate (vph) Pedestrians Lane Width (ft) Walking Speed (ft/s) Percent Blockage Right turn flare (veh) Median type None None Median storage veh) Upstream signal (ft) 526 px, platoon unblocked vc, conflicting volume vc1, stage 1 conf vol 0 0 vc2, stage 2 conf vol 0 0 vcu, unblocked vol tc, single (s) tc, 2 stage (s) tf (s) p0 queue free % cm capacity (veh/h) Direction, Lane # EB 1 WB 1 NB 1 NB 2 NB 3 SB 1 SB 2 SB 3 Volume Total Volume Left Volume Right csh Volume to Capacity Queue Length 95th (ft) Control Delay (s) Lane LOS E F A A Approach Delay (s) Approach LOS E F Average Delay 4.9 Intersection Capacity Utilization 39.8% ICU Level of Service A Waterman Gardens - Existing - PM Fehr & Peers Associates, Inc. Page 4
101 HCM Unsignalized Intersection Capacity Analysis 5: Olive Street & Waterman Avenue 6/6/2011 Movement EBL EBT EBR WBL WBT WBR NBL NBT NBR SBL SBT SBR Sign Control Stop Stop Free Free Grade 0% 0% 0% 0% Volume (veh/h) Peak Hour Factor Hourly flow rate (vph) Pedestrians Lane Width (ft) Walking Speed (ft/s) Percent Blockage Right turn flare (veh) Median type None None Median storage veh) Upstream signal (ft) 1013 px, platoon unblocked vc, conflicting volume vc1, stage 1 conf vol 0 0 vc2, stage 2 conf vol 0 0 vcu, unblocked vol tc, single (s) tc, 2 stage (s) tf (s) p0 queue free % cm capacity (veh/h) Direction, Lane # EB 1 WB 1 NB 1 NB 2 NB 3 SB 1 SB 2 SB 3 Volume Total Volume Left Volume Right csh Volume to Capacity Queue Length 95th (ft) Control Delay (s) Lane LOS E E A A Approach Delay (s) Approach LOS E E Average Delay 1.7 Intersection Capacity Utilization 39.4% ICU Level of Service A Waterman Gardens - Existing - PM Fehr & Peers Associates, Inc. Page 5
102 HCM Signalized Intersection Capacity Analysis 6: 5th Street & Waterman Avenue 6/6/2011 Movement EBL EBT EBR WBL WBT WBR NBL NBT NBR SBL SBT SBR Ideal Flow (vphpl) Total Lost time (s) Lane Util. Factor Frt Flt Protected Satd. Flow (prot) Flt Permitted Satd. Flow (perm) Volume (vph) Peak-hour factor, PHF Adj. Flow (vph) RTOR Reduction (vph) Lane Group Flow (vph) Turn Type pm+pt pm+pt Perm Prot Perm Prot Perm Protected Phases Permitted Phases Actuated Green, G (s) Effective Green, g (s) Actuated g/c Ratio Clearance Time (s) Vehicle Extension (s) Lane Grp Cap (vph) v/s Ratio Prot c0.03 c0.19 c c c0.24 v/s Ratio Perm v/c Ratio Uniform Delay, d Progression Factor Incremental Delay, d Delay (s) Level of Service B C B B B C B B C B B Approach Delay (s) Approach LOS C B B B HCM Average Control Delay 20.3 HCM Level of Service C HCM Volume to Capacity ratio 0.64 Actuated Cycle Length (s) 70.4 Sum of lost time (s) 8.0 Intersection Capacity Utilization 65.2% ICU Level of Service C c Critical Lane Group Waterman Gardens - Existing - PM Fehr & Peers Associates, Inc. Page 6
103 HCM Signalized Intersection Capacity Analysis 7: Base Line Street & Crestview Avenue 6/6/2011 Movement EBL EBT EBR WBL WBT WBR NBL NBT NBR SBL SBT SBR Ideal Flow (vphpl) Total Lost time (s) Lane Util. Factor Frt Flt Protected Satd. Flow (prot) Flt Permitted Satd. Flow (perm) Volume (vph) Peak-hour factor, PHF Adj. Flow (vph) RTOR Reduction (vph) Lane Group Flow (vph) Turn Type Perm Perm Perm Perm Protected Phases Permitted Phases Actuated Green, G (s) Effective Green, g (s) Actuated g/c Ratio Clearance Time (s) Vehicle Extension (s) Lane Grp Cap (vph) v/s Ratio Prot c v/s Ratio Perm c0.04 v/c Ratio Uniform Delay, d Progression Factor Incremental Delay, d Delay (s) Level of Service A A A A B B Approach Delay (s) Approach LOS A A B B HCM Average Control Delay 3.3 HCM Level of Service A HCM Volume to Capacity ratio 0.27 Actuated Cycle Length (s) 50.0 Sum of lost time (s) 4.0 Intersection Capacity Utilization 63.1% ICU Level of Service B c Critical Lane Group Waterman Gardens - Existing - PM Fehr & Peers Associates, Inc. Page 7
104 HCM Unsignalized Intersection Capacity Analysis 8: Base Line Street & La Junita Street 6/6/2011 Movement EBT EBR WBL WBT NBL NBR Sign Control Free Free Stop Grade 0% 0% 0% Volume (veh/h) Peak Hour Factor Hourly flow rate (vph) Pedestrians Lane Width (ft) Walking Speed (ft/s) Percent Blockage Right turn flare (veh) Median type None Median storage veh) Upstream signal (ft) 270 px, platoon unblocked vc, conflicting volume vc1, stage 1 conf vol vc2, stage 2 conf vol vcu, unblocked vol tc, single (s) tc, 2 stage (s) tf (s) p0 queue free % cm capacity (veh/h) Direction, Lane # EB 1 EB 2 WB 1 WB 2 WB 3 NB 1 Volume Total Volume Left Volume Right csh Volume to Capacity Queue Length 95th (ft) Control Delay (s) Lane LOS A C Approach Delay (s) Approach LOS C Average Delay 0.6 Intersection Capacity Utilization 28.9% ICU Level of Service A Waterman Gardens - Existing - PM Fehr & Peers Associates, Inc. Page 8
105 HCM Unsignalized Intersection Capacity Analysis 9: Orange Street Driveway & La Junita Street 6/6/2011 Movement EBL EBT EBR WBL WBT WBR NBL NBT NBR SBL SBT SBR Sign Control Stop Stop Free Free Grade 0% 0% 0% 0% Volume (veh/h) Peak Hour Factor Hourly flow rate (vph) Pedestrians Lane Width (ft) Walking Speed (ft/s) Percent Blockage Right turn flare (veh) Median type None None Median storage veh) Upstream signal (ft) px, platoon unblocked vc, conflicting volume vc1, stage 1 conf vol vc2, stage 2 conf vol vcu, unblocked vol tc, single (s) tc, 2 stage (s) tf (s) p0 queue free % cm capacity (veh/h) Direction, Lane # EB 1 WB 1 NB 1 SB 1 Volume Total Volume Left Volume Right csh Volume to Capacity Queue Length 95th (ft) Control Delay (s) Lane LOS A A A Approach Delay (s) Approach LOS A A Average Delay 3.4 Intersection Capacity Utilization 18.8% ICU Level of Service A Waterman Gardens - Existing - PM Fehr & Peers Associates, Inc. Page 9
106 HCM Signalized Intersection Capacity Analysis 10: Base Line Street & Del Rosa Drive 6/6/2011 Movement EBL EBT EBR WBL WBT WBR NBL NBT NBR SBL SBT SBR Ideal Flow (vphpl) Total Lost time (s) Lane Util. Factor Frt Flt Protected Satd. Flow (prot) Flt Permitted Satd. Flow (perm) Volume (vph) Peak-hour factor, PHF Adj. Flow (vph) RTOR Reduction (vph) Lane Group Flow (vph) Turn Type Prot Prot Prot Prot Perm Protected Phases Permitted Phases 4 Actuated Green, G (s) Effective Green, g (s) Actuated g/c Ratio Clearance Time (s) Vehicle Extension (s) Lane Grp Cap (vph) v/s Ratio Prot c c c0.04 c0.15 v/s Ratio Perm 0.02 v/c Ratio Uniform Delay, d Progression Factor Incremental Delay, d Delay (s) Level of Service D B D B D C D C C Approach Delay (s) Approach LOS B B C C HCM Average Control Delay 23.1 HCM Level of Service C HCM Volume to Capacity ratio 0.44 Actuated Cycle Length (s) 90.0 Sum of lost time (s) 6.0 Intersection Capacity Utilization 50.9% ICU Level of Service A c Critical Lane Group Waterman Gardens - Existing - PM Fehr & Peers Associates, Inc. Page 10
107 APPENDIX C: OPENING YEAR (2013) LOS RESULTS
108 HCM Signalized Intersection Capacity Analysis 1: Base Line Street & E Street 6/6/2011 Movement EBL EBT EBR WBL WBT WBR NBL NBT NBR SBL SBT SBR Ideal Flow (vphpl) Total Lost time (s) Lane Util. Factor Frt Flt Protected Satd. Flow (prot) Flt Permitted Satd. Flow (perm) Volume (vph) Peak-hour factor, PHF Adj. Flow (vph) RTOR Reduction (vph) Lane Group Flow (vph) Turn Type pm+pt pm+pt Perm Perm Protected Phases Permitted Phases Actuated Green, G (s) Effective Green, g (s) Actuated g/c Ratio Clearance Time (s) Vehicle Extension (s) Lane Grp Cap (vph) v/s Ratio Prot c c c0.13 v/s Ratio Perm v/c Ratio Uniform Delay, d Progression Factor Incremental Delay, d Delay (s) Level of Service A A A A C C C C Approach Delay (s) Approach LOS A A C C HCM Average Control Delay 14.5 HCM Level of Service B HCM Volume to Capacity ratio 0.41 Actuated Cycle Length (s) 80.0 Sum of lost time (s) 8.0 Intersection Capacity Utilization 57.5% ICU Level of Service B c Critical Lane Group Waterman Gardens - Opening Year (2013) - AM Fehr & Peers Associates, Inc. Page 1
109 HCM Signalized Intersection Capacity Analysis 2: Highland Avenue & Waterman Avenue 6/6/2011 Movement EBL EBT EBR WBL WBT WBR NBL NBT NBR SBL SBT SBR Ideal Flow (vphpl) Total Lost time (s) Lane Util. Factor Frt Flt Protected Satd. Flow (prot) Flt Permitted Satd. Flow (perm) Volume (vph) Peak-hour factor, PHF Adj. Flow (vph) RTOR Reduction (vph) Lane Group Flow (vph) Turn Type Prot Perm Prot Prot Perm Prot Protected Phases Permitted Phases 2 8 Actuated Green, G (s) Effective Green, g (s) Actuated g/c Ratio Clearance Time (s) Vehicle Extension (s) Lane Grp Cap (vph) v/s Ratio Prot c0.07 c c0.07 c0.22 v/s Ratio Perm v/c Ratio Uniform Delay, d Progression Factor Incremental Delay, d Delay (s) Level of Service D B B D B D C C D C Approach Delay (s) Approach LOS C C C C HCM Average Control Delay 27.1 HCM Level of Service C HCM Volume to Capacity ratio 0.48 Actuated Cycle Length (s) 90.0 Sum of lost time (s) 4.0 Intersection Capacity Utilization 54.5% ICU Level of Service A c Critical Lane Group Waterman Gardens - Opening Year (2013) - AM Fehr & Peers Associates, Inc. Page 2
110 HCM Signalized Intersection Capacity Analysis 3: Base Line Street & Waterman Avenue 6/13/2012 Movement EBL EBT EBR WBL WBT WBR NBL NBT NBR SBL SBT SBR Ideal Flow (vphpl) Total Lost time (s) Lane Util. Factor Frt Flt Protected Satd. Flow (prot) Flt Permitted Satd. Flow (perm) Volume (vph) Peak-hour factor, PHF Adj. Flow (vph) RTOR Reduction (vph) Lane Group Flow (vph) Turn Type Prot Prot Prot pm+ov Prot pm+ov Protected Phases Permitted Phases 8 4 Actuated Green, G (s) Effective Green, g (s) Actuated g/c Ratio Clearance Time (s) Vehicle Extension (s) Lane Grp Cap (vph) v/s Ratio Prot 0.06 c0.13 c0.11 c0.18 c c v/s Ratio Perm v/c Ratio Uniform Delay, d Progression Factor Incremental Delay, d Delay (s) Level of Service D C E C D B A D C A Approach Delay (s) Approach LOS D D B C HCM Average Control Delay 28.3 HCM Level of Service C HCM Volume to Capacity ratio 0.56 Actuated Cycle Length (s) Sum of lost time (s) 6.0 Intersection Capacity Utilization 58.9% ICU Level of Service B c Critical Lane Group Waterman Gardens - Opening Year (2013) - AM Fehr & Peers Associates, Inc. Page 1
111 HCM Unsignalized Intersection Capacity Analysis 4: Driveway & Waterman Avenue 6/6/2011 Movement EBL EBT EBR WBL WBT WBR NBL NBT NBR SBL SBT SBR Sign Control Stop Stop Free Free Grade 0% 0% 0% 0% Volume (veh/h) Peak Hour Factor Hourly flow rate (vph) Pedestrians Lane Width (ft) Walking Speed (ft/s) Percent Blockage Right turn flare (veh) Median type None None Median storage veh) Upstream signal (ft) 526 px, platoon unblocked vc, conflicting volume vc1, stage 1 conf vol 0 0 vc2, stage 2 conf vol 0 0 vcu, unblocked vol tc, single (s) tc, 2 stage (s) tf (s) p0 queue free % cm capacity (veh/h) Direction, Lane # EB 1 WB 1 NB 1 NB 2 NB 3 SB 1 SB 2 SB 3 Volume Total Volume Left Volume Right csh Volume to Capacity Queue Length 95th (ft) Control Delay (s) Lane LOS C E A A Approach Delay (s) Approach LOS C E Average Delay 2.5 Intersection Capacity Utilization 39.7% ICU Level of Service A Waterman Gardens - Opening Year (2013) - AM Fehr & Peers Associates, Inc. Page 4
112 HCM Unsignalized Intersection Capacity Analysis 5: Olive Street & Waterman Avenue 6/6/2011 Movement EBL EBT EBR WBL WBT WBR NBL NBT NBR SBL SBT SBR Sign Control Stop Stop Free Free Grade 0% 0% 0% 0% Volume (veh/h) Peak Hour Factor Hourly flow rate (vph) Pedestrians Lane Width (ft) Walking Speed (ft/s) Percent Blockage Right turn flare (veh) Median type None None Median storage veh) Upstream signal (ft) 1013 px, platoon unblocked vc, conflicting volume vc1, stage 1 conf vol 0 0 vc2, stage 2 conf vol 0 0 vcu, unblocked vol tc, single (s) tc, 2 stage (s) tf (s) p0 queue free % cm capacity (veh/h) Direction, Lane # EB 1 WB 1 NB 1 NB 2 NB 3 SB 1 SB 2 SB 3 Volume Total Volume Left Volume Right csh Volume to Capacity Queue Length 95th (ft) Control Delay (s) Lane LOS E D A A Approach Delay (s) Approach LOS E D Average Delay 1.4 Intersection Capacity Utilization 37.7% ICU Level of Service A Waterman Gardens - Opening Year (2013) - AM Fehr & Peers Associates, Inc. Page 5
113 HCM Signalized Intersection Capacity Analysis 6: 5th Street & Waterman Avenue 6/6/2011 Movement EBL EBT EBR WBL WBT WBR NBL NBT NBR SBL SBT SBR Ideal Flow (vphpl) Total Lost time (s) Lane Util. Factor Frt Flt Protected Satd. Flow (prot) Flt Permitted Satd. Flow (perm) Volume (vph) Peak-hour factor, PHF Adj. Flow (vph) RTOR Reduction (vph) Lane Group Flow (vph) Turn Type pm+pt pm+pt Perm Prot Perm Prot Perm Protected Phases Permitted Phases Actuated Green, G (s) Effective Green, g (s) Actuated g/c Ratio Clearance Time (s) Vehicle Extension (s) Lane Grp Cap (vph) v/s Ratio Prot c c c c0.29 v/s Ratio Perm v/c Ratio Uniform Delay, d Progression Factor Incremental Delay, d Delay (s) Level of Service B B B C B C B A C C B Approach Delay (s) Approach LOS B B B C HCM Average Control Delay 18.1 HCM Level of Service B HCM Volume to Capacity ratio 0.57 Actuated Cycle Length (s) 65.8 Sum of lost time (s) 8.0 Intersection Capacity Utilization 55.5% ICU Level of Service B c Critical Lane Group Waterman Gardens - Opening Year (2013) - AM Fehr & Peers Associates, Inc. Page 6
114 HCM Signalized Intersection Capacity Analysis 7: Base Line Street & Crestview Avenue 6/6/2011 Movement EBL EBT EBR WBL WBT WBR NBL NBT NBR SBL SBT SBR Ideal Flow (vphpl) Total Lost time (s) Lane Util. Factor Frt Flt Protected Satd. Flow (prot) Flt Permitted Satd. Flow (perm) Volume (vph) Peak-hour factor, PHF Adj. Flow (vph) RTOR Reduction (vph) Lane Group Flow (vph) Turn Type Perm Perm Perm Perm Protected Phases Permitted Phases Actuated Green, G (s) Effective Green, g (s) Actuated g/c Ratio Clearance Time (s) Vehicle Extension (s) Lane Grp Cap (vph) v/s Ratio Prot 0.15 c0.24 v/s Ratio Perm c0.03 v/c Ratio Uniform Delay, d Progression Factor Incremental Delay, d Delay (s) Level of Service A A A A B B Approach Delay (s) Approach LOS A A B B HCM Average Control Delay 3.4 HCM Level of Service A HCM Volume to Capacity ratio 0.29 Actuated Cycle Length (s) 50.0 Sum of lost time (s) 4.0 Intersection Capacity Utilization 42.4% ICU Level of Service A c Critical Lane Group Waterman Gardens - Opening Year (2013) - AM Fehr & Peers Associates, Inc. Page 7
115 HCM Unsignalized Intersection Capacity Analysis 8: Base Line Street & La Junita Street 6/6/2011 Movement EBT EBR WBL WBT NBL NBR Sign Control Free Free Stop Grade 0% 0% 0% Volume (veh/h) Peak Hour Factor Hourly flow rate (vph) Pedestrians Lane Width (ft) Walking Speed (ft/s) Percent Blockage Right turn flare (veh) Median type None Median storage veh) Upstream signal (ft) 270 px, platoon unblocked vc, conflicting volume vc1, stage 1 conf vol vc2, stage 2 conf vol vcu, unblocked vol tc, single (s) tc, 2 stage (s) tf (s) p0 queue free % cm capacity (veh/h) Direction, Lane # EB 1 EB 2 WB 1 WB 2 WB 3 NB 1 Volume Total Volume Left Volume Right csh Volume to Capacity Queue Length 95th (ft) Control Delay (s) Lane LOS A C Approach Delay (s) Approach LOS C Average Delay 0.6 Intersection Capacity Utilization 27.2% ICU Level of Service A Waterman Gardens - Opening Year (2013) - AM Fehr & Peers Associates, Inc. Page 8
116 HCM Unsignalized Intersection Capacity Analysis 9: Driveway & La Junita Street 6/6/2011 Movement EBL EBT EBR WBL WBT WBR NBL NBT NBR SBL SBT SBR Sign Control Stop Stop Free Free Grade 0% 0% 0% 0% Volume (veh/h) Peak Hour Factor Hourly flow rate (vph) Pedestrians Lane Width (ft) Walking Speed (ft/s) Percent Blockage Right turn flare (veh) Median type None None Median storage veh) Upstream signal (ft) px, platoon unblocked vc, conflicting volume vc1, stage 1 conf vol vc2, stage 2 conf vol vcu, unblocked vol tc, single (s) tc, 2 stage (s) tf (s) p0 queue free % cm capacity (veh/h) Direction, Lane # EB 1 WB 1 NB 1 SB 1 Volume Total Volume Left Volume Right csh Volume to Capacity Queue Length 95th (ft) Control Delay (s) Lane LOS A A A Approach Delay (s) Approach LOS A A Average Delay 4.0 Intersection Capacity Utilization 18.6% ICU Level of Service A Waterman Gardens - Opening Year (2013) - AM Fehr & Peers Associates, Inc. Page 9
117 HCM Signalized Intersection Capacity Analysis 10: Base Line Street & Del Rosa Drive 6/6/2011 Movement EBL EBT EBR WBL WBT WBR NBL NBT NBR SBL SBT SBR Ideal Flow (vphpl) Total Lost time (s) Lane Util. Factor Frt Flt Protected Satd. Flow (prot) Flt Permitted Satd. Flow (perm) Volume (vph) Peak-hour factor, PHF Adj. Flow (vph) RTOR Reduction (vph) Lane Group Flow (vph) Turn Type Prot Prot Prot Prot Perm Protected Phases Permitted Phases 4 Actuated Green, G (s) Effective Green, g (s) Actuated g/c Ratio Clearance Time (s) Vehicle Extension (s) Lane Grp Cap (vph) v/s Ratio Prot 0.04 c0.14 c0.05 c0.18 c c0.25 v/s Ratio Perm 0.07 v/c Ratio Uniform Delay, d Progression Factor Incremental Delay, d Delay (s) Level of Service D C D C D C D C C Approach Delay (s) Approach LOS C C C C HCM Average Control Delay 25.8 HCM Level of Service C HCM Volume to Capacity ratio 0.54 Actuated Cycle Length (s) 90.0 Sum of lost time (s) 6.0 Intersection Capacity Utilization 57.1% ICU Level of Service B c Critical Lane Group Waterman Gardens - Opening Year (2013) - AM Fehr & Peers Associates, Inc. Page 10
118 HCM Signalized Intersection Capacity Analysis 1: Base Line Street & E Street 6/6/2011 Movement EBL EBT EBR WBL WBT WBR NBL NBT NBR SBL SBT SBR Ideal Flow (vphpl) Total Lost time (s) Lane Util. Factor Frt Flt Protected Satd. Flow (prot) Flt Permitted Satd. Flow (perm) Volume (vph) Peak-hour factor, PHF Adj. Flow (vph) RTOR Reduction (vph) Lane Group Flow (vph) Turn Type pm+pt pm+pt Perm Perm Protected Phases Permitted Phases Actuated Green, G (s) Effective Green, g (s) Actuated g/c Ratio Clearance Time (s) Vehicle Extension (s) Lane Grp Cap (vph) v/s Ratio Prot c c v/s Ratio Perm c0.15 v/c Ratio Uniform Delay, d Progression Factor Incremental Delay, d Delay (s) Level of Service A A A A C C D C Approach Delay (s) Approach LOS A A C C HCM Average Control Delay 15.5 HCM Level of Service B HCM Volume to Capacity ratio 0.43 Actuated Cycle Length (s) 80.0 Sum of lost time (s) 8.0 Intersection Capacity Utilization 62.2% ICU Level of Service B c Critical Lane Group Waterman Gardens - Opening Year (2013) - PM Fehr & Peers Associates, Inc. Page 1
119 HCM Signalized Intersection Capacity Analysis 2: Highland Avenue & Waterman Avenue 6/6/2011 Movement EBL EBT EBR WBL WBT WBR NBL NBT NBR SBL SBT SBR Ideal Flow (vphpl) Total Lost time (s) Lane Util. Factor Frt Flt Protected Satd. Flow (prot) Flt Permitted Satd. Flow (perm) Volume (vph) Peak-hour factor, PHF Adj. Flow (vph) RTOR Reduction (vph) Lane Group Flow (vph) Turn Type Prot Perm Prot Prot Perm Prot Protected Phases Permitted Phases 2 8 Actuated Green, G (s) Effective Green, g (s) Actuated g/c Ratio Clearance Time (s) Vehicle Extension (s) Lane Grp Cap (vph) v/s Ratio Prot c0.07 c0.20 c0.11 c v/s Ratio Perm v/c Ratio Uniform Delay, d Progression Factor Incremental Delay, d Delay (s) Level of Service D C B D C D C C D C Approach Delay (s) Approach LOS C C C C HCM Average Control Delay 28.9 HCM Level of Service C HCM Volume to Capacity ratio 0.59 Actuated Cycle Length (s) 90.0 Sum of lost time (s) 4.0 Intersection Capacity Utilization 64.6% ICU Level of Service C c Critical Lane Group Waterman Gardens - Opening Year (2013) - PM Fehr & Peers Associates, Inc. Page 2
120 HCM Signalized Intersection Capacity Analysis 3: Base Line Street & Waterman Avenue 6/13/2012 Movement EBL EBT EBR WBL WBT WBR NBL NBT NBR SBL SBT SBR Ideal Flow (vphpl) Total Lost time (s) Lane Util. Factor Frt Flt Protected Satd. Flow (prot) Flt Permitted Satd. Flow (perm) Volume (vph) Peak-hour factor, PHF Adj. Flow (vph) RTOR Reduction (vph) Lane Group Flow (vph) Turn Type Prot Prot Prot pm+ov Prot pm+ov Protected Phases Permitted Phases 8 4 Actuated Green, G (s) Effective Green, g (s) Actuated g/c Ratio Clearance Time (s) Vehicle Extension (s) Lane Grp Cap (vph) v/s Ratio Prot 0.06 c0.18 c0.10 c0.19 c0.09 c c v/s Ratio Perm v/c Ratio Uniform Delay, d Progression Factor Incremental Delay, d Delay (s) Level of Service D C E C D C B D C B Approach Delay (s) Approach LOS D D C C HCM Average Control Delay 30.0 HCM Level of Service C HCM Volume to Capacity ratio 0.60 Actuated Cycle Length (s) Sum of lost time (s) 4.0 Intersection Capacity Utilization 62.1% ICU Level of Service B c Critical Lane Group Waterman Gardens - Opening Year (2013) - PM Fehr & Peers Associates, Inc. Page 1
121 HCM Unsignalized Intersection Capacity Analysis 4: Orange Street Driveway & Waterman Avenue 6/6/2011 Movement EBL EBT EBR WBL WBT WBR NBL NBT NBR SBL SBT SBR Sign Control Stop Stop Free Free Grade 0% 0% 0% 0% Volume (veh/h) Peak Hour Factor Hourly flow rate (vph) Pedestrians Lane Width (ft) Walking Speed (ft/s) Percent Blockage Right turn flare (veh) Median type None None Median storage veh) Upstream signal (ft) 526 px, platoon unblocked vc, conflicting volume vc1, stage 1 conf vol 0 0 vc2, stage 2 conf vol 0 0 vcu, unblocked vol tc, single (s) tc, 2 stage (s) tf (s) p0 queue free % cm capacity (veh/h) Direction, Lane # EB 1 WB 1 NB 1 NB 2 NB 3 SB 1 SB 2 SB 3 Volume Total Volume Left Volume Right csh Volume to Capacity Queue Length 95th (ft) Control Delay (s) Lane LOS F F A B Approach Delay (s) Approach LOS F F Average Delay 8.2 Intersection Capacity Utilization 42.1% ICU Level of Service A Waterman Gardens - Opening Year (2013) - PM Fehr & Peers Associates, Inc. Page 4
122 HCM Unsignalized Intersection Capacity Analysis 5: Olive Street & Waterman Avenue 6/6/2011 Movement EBL EBT EBR WBL WBT WBR NBL NBT NBR SBL SBT SBR Sign Control Stop Stop Free Free Grade 0% 0% 0% 0% Volume (veh/h) Peak Hour Factor Hourly flow rate (vph) Pedestrians Lane Width (ft) Walking Speed (ft/s) Percent Blockage Right turn flare (veh) Median type None None Median storage veh) Upstream signal (ft) 1013 px, platoon unblocked vc, conflicting volume vc1, stage 1 conf vol 0 0 vc2, stage 2 conf vol 0 0 vcu, unblocked vol tc, single (s) tc, 2 stage (s) tf (s) p0 queue free % cm capacity (veh/h) Direction, Lane # EB 1 WB 1 NB 1 NB 2 NB 3 SB 1 SB 2 SB 3 Volume Total Volume Left Volume Right csh Volume to Capacity Queue Length 95th (ft) Control Delay (s) Lane LOS F F A B Approach Delay (s) Approach LOS F F Average Delay 2.1 Intersection Capacity Utilization 41.2% ICU Level of Service A Waterman Gardens - Opening Year (2013) - PM Fehr & Peers Associates, Inc. Page 5
123 HCM Signalized Intersection Capacity Analysis 6: 5th Street & Waterman Avenue 6/6/2011 Movement EBL EBT EBR WBL WBT WBR NBL NBT NBR SBL SBT SBR Ideal Flow (vphpl) Total Lost time (s) Lane Util. Factor Frt Flt Protected Satd. Flow (prot) Flt Permitted Satd. Flow (perm) Volume (vph) Peak-hour factor, PHF Adj. Flow (vph) RTOR Reduction (vph) Lane Group Flow (vph) Turn Type pm+pt pm+pt Perm Prot Perm Prot Perm Protected Phases Permitted Phases Actuated Green, G (s) Effective Green, g (s) Actuated g/c Ratio Clearance Time (s) Vehicle Extension (s) Lane Grp Cap (vph) v/s Ratio Prot c0.03 c0.20 c c c0.25 v/s Ratio Perm v/c Ratio Uniform Delay, d Progression Factor Incremental Delay, d Delay (s) Level of Service B C B B B C C B C C B Approach Delay (s) Approach LOS C B C C HCM Average Control Delay 21.5 HCM Level of Service C HCM Volume to Capacity ratio 0.69 Actuated Cycle Length (s) 71.3 Sum of lost time (s) 8.0 Intersection Capacity Utilization 68.2% ICU Level of Service C c Critical Lane Group Waterman Gardens - Opening Year (2013) - PM Fehr & Peers Associates, Inc. Page 6
124 HCM Signalized Intersection Capacity Analysis 7: Base Line Street & Crestview Avenue 6/6/2011 Movement EBL EBT EBR WBL WBT WBR NBL NBT NBR SBL SBT SBR Ideal Flow (vphpl) Total Lost time (s) Lane Util. Factor Frt Flt Protected Satd. Flow (prot) Flt Permitted Satd. Flow (perm) Volume (vph) Peak-hour factor, PHF Adj. Flow (vph) RTOR Reduction (vph) Lane Group Flow (vph) Turn Type Perm Perm Perm Perm Protected Phases Permitted Phases Actuated Green, G (s) Effective Green, g (s) Actuated g/c Ratio Clearance Time (s) Vehicle Extension (s) Lane Grp Cap (vph) v/s Ratio Prot c v/s Ratio Perm c0.05 v/c Ratio Uniform Delay, d Progression Factor Incremental Delay, d Delay (s) Level of Service A A A A B B Approach Delay (s) Approach LOS A A B B HCM Average Control Delay 3.4 HCM Level of Service A HCM Volume to Capacity ratio 0.28 Actuated Cycle Length (s) 50.0 Sum of lost time (s) 4.0 Intersection Capacity Utilization 64.9% ICU Level of Service C c Critical Lane Group Waterman Gardens - Opening Year (2013) - PM Fehr & Peers Associates, Inc. Page 7
125 HCM Unsignalized Intersection Capacity Analysis 8: Base Line Street & La Junita Street 6/6/2011 Movement EBT EBR WBL WBT NBL NBR Sign Control Free Free Stop Grade 0% 0% 0% Volume (veh/h) Peak Hour Factor Hourly flow rate (vph) Pedestrians Lane Width (ft) Walking Speed (ft/s) Percent Blockage Right turn flare (veh) Median type None Median storage veh) Upstream signal (ft) 270 px, platoon unblocked vc, conflicting volume vc1, stage 1 conf vol vc2, stage 2 conf vol vcu, unblocked vol tc, single (s) tc, 2 stage (s) tf (s) p0 queue free % cm capacity (veh/h) Direction, Lane # EB 1 EB 2 WB 1 WB 2 WB 3 NB 1 Volume Total Volume Left Volume Right csh Volume to Capacity Queue Length 95th (ft) Control Delay (s) Lane LOS A C Approach Delay (s) Approach LOS C Average Delay 0.7 Intersection Capacity Utilization 30.0% ICU Level of Service A Waterman Gardens - Opening Year (2013) - PM Fehr & Peers Associates, Inc. Page 8
126 HCM Unsignalized Intersection Capacity Analysis 9: Orange Street Driveway & La Junita Street 6/6/2011 Movement EBL EBT EBR WBL WBT WBR NBL NBT NBR SBL SBT SBR Sign Control Stop Stop Free Free Grade 0% 0% 0% 0% Volume (veh/h) Peak Hour Factor Hourly flow rate (vph) Pedestrians Lane Width (ft) Walking Speed (ft/s) Percent Blockage Right turn flare (veh) Median type None None Median storage veh) Upstream signal (ft) px, platoon unblocked vc, conflicting volume vc1, stage 1 conf vol vc2, stage 2 conf vol vcu, unblocked vol tc, single (s) tc, 2 stage (s) tf (s) p0 queue free % cm capacity (veh/h) Direction, Lane # EB 1 WB 1 NB 1 SB 1 Volume Total Volume Left Volume Right csh Volume to Capacity Queue Length 95th (ft) Control Delay (s) Lane LOS A A A Approach Delay (s) Approach LOS A A Average Delay 3.5 Intersection Capacity Utilization 18.9% ICU Level of Service A Waterman Gardens - Opening Year (2013) - PM Fehr & Peers Associates, Inc. Page 9
127 HCM Signalized Intersection Capacity Analysis 10: Base Line Street & Del Rosa Drive 6/6/2011 Movement EBL EBT EBR WBL WBT WBR NBL NBT NBR SBL SBT SBR Ideal Flow (vphpl) Total Lost time (s) Lane Util. Factor Frt Flt Protected Satd. Flow (prot) Flt Permitted Satd. Flow (perm) Volume (vph) Peak-hour factor, PHF Adj. Flow (vph) RTOR Reduction (vph) Lane Group Flow (vph) Turn Type Prot Prot Prot Prot Perm Protected Phases Permitted Phases 4 Actuated Green, G (s) Effective Green, g (s) Actuated g/c Ratio Clearance Time (s) Vehicle Extension (s) Lane Grp Cap (vph) v/s Ratio Prot c c c0.05 c0.16 v/s Ratio Perm 0.02 v/c Ratio Uniform Delay, d Progression Factor Incremental Delay, d Delay (s) Level of Service D B D B D C D C C Approach Delay (s) Approach LOS B C C C HCM Average Control Delay 23.5 HCM Level of Service C HCM Volume to Capacity ratio 0.47 Actuated Cycle Length (s) 90.0 Sum of lost time (s) 6.0 Intersection Capacity Utilization 52.9% ICU Level of Service A c Critical Lane Group Waterman Gardens - Opening Year (2013) - PM Fehr & Peers Associates, Inc. Page 10
128 APPENDIX D: OPENING YEAR (2013) PLUS PROJECT LOS RESULTS
129 HCM Signalized Intersection Capacity Analysis 1: Base Line Street & E Street 5/31/2012 Movement EBL EBT EBR WBL WBT WBR NBL NBT NBR SBL SBT SBR Ideal Flow (vphpl) Total Lost time (s) Lane Util. Factor Frt Flt Protected Satd. Flow (prot) Flt Permitted Satd. Flow (perm) Volume (vph) Peak-hour factor, PHF Adj. Flow (vph) RTOR Reduction (vph) Lane Group Flow (vph) Turn Type pm+pt pm+pt Perm Perm Protected Phases Permitted Phases Actuated Green, G (s) Effective Green, g (s) Actuated g/c Ratio Clearance Time (s) Vehicle Extension (s) Lane Grp Cap (vph) v/s Ratio Prot c c c0.13 v/s Ratio Perm v/c Ratio Uniform Delay, d Progression Factor Incremental Delay, d Delay (s) Level of Service A A A A C C C C Approach Delay (s) Approach LOS A A C C HCM Average Control Delay 14.4 HCM Level of Service B HCM Volume to Capacity ratio 0.41 Actuated Cycle Length (s) 80.0 Sum of lost time (s) 6.0 Intersection Capacity Utilization 58.5% ICU Level of Service B c Critical Lane Group Waterman Gardens - Opening Year (2013) plus Project - AM Fehr & Peers Associates, Inc. Page 1
130 HCM Signalized Intersection Capacity Analysis 2: Highland Avenue & Waterman Avenue 5/31/2012 Movement EBL EBT EBR WBL WBT WBR NBL NBT NBR SBL SBT SBR Ideal Flow (vphpl) Total Lost time (s) Lane Util. Factor Frt Flt Protected Satd. Flow (prot) Flt Permitted Satd. Flow (perm) Volume (vph) Peak-hour factor, PHF Adj. Flow (vph) RTOR Reduction (vph) Lane Group Flow (vph) Turn Type Prot Perm Prot Prot Perm Prot Protected Phases Permitted Phases 2 8 Actuated Green, G (s) Effective Green, g (s) Actuated g/c Ratio Clearance Time (s) Vehicle Extension (s) Lane Grp Cap (vph) v/s Ratio Prot c0.07 c c0.07 c0.22 v/s Ratio Perm v/c Ratio Uniform Delay, d Progression Factor Incremental Delay, d Delay (s) Level of Service D B B D B D C C D C Approach Delay (s) Approach LOS C C C C HCM Average Control Delay 27.2 HCM Level of Service C HCM Volume to Capacity ratio 0.49 Actuated Cycle Length (s) 90.0 Sum of lost time (s) 4.0 Intersection Capacity Utilization 55.3% ICU Level of Service B c Critical Lane Group Waterman Gardens - Opening Year (2013) plus Project - AM Fehr & Peers Associates, Inc. Page 2
131 HCM Signalized Intersection Capacity Analysis 3: Base Line Street & Waterman Avenue 7/16/2012 Movement EBL EBT EBR WBL WBT WBR NBL NBT NBR SBL SBT SBR Ideal Flow (vphpl) Total Lost time (s) Lane Util. Factor Frt Flt Protected Satd. Flow (prot) Flt Permitted Satd. Flow (perm) Volume (vph) Peak-hour factor, PHF Adj. Flow (vph) RTOR Reduction (vph) Lane Group Flow (vph) Turn Type Prot Prot Prot pm+ov Prot pm+ov Protected Phases Permitted Phases 8 4 Actuated Green, G (s) Effective Green, g (s) Actuated g/c Ratio Clearance Time (s) Vehicle Extension (s) Lane Grp Cap (vph) v/s Ratio Prot 0.06 c0.14 c0.11 c0.18 c c v/s Ratio Perm v/c Ratio Uniform Delay, d Progression Factor Incremental Delay, d Delay (s) Level of Service D C E D D B A D C B Approach Delay (s) Approach LOS C D C C HCM Average Control Delay 29.9 HCM Level of Service C HCM Volume to Capacity ratio 0.60 Actuated Cycle Length (s) Sum of lost time (s) 6.0 Intersection Capacity Utilization 61.5% ICU Level of Service B c Critical Lane Group Waterman Gardens - Opening Year (2013) plus Project - AM Fehr & Peers Associates, Inc. Page 1
132 HCM Unsignalized Intersection Capacity Analysis 4: Driveway & Waterman Avenue 5/31/2012 Movement EBL EBT EBR WBL WBT WBR NBL NBT NBR SBL SBT SBR Sign Control Stop Stop Free Free Grade 0% 0% 0% 0% Volume (veh/h) Peak Hour Factor Hourly flow rate (vph) Pedestrians Lane Width (ft) Walking Speed (ft/s) Percent Blockage Right turn flare (veh) Median type None None Median storage veh) Upstream signal (ft) px, platoon unblocked vc, conflicting volume vc1, stage 1 conf vol vc2, stage 2 conf vol vcu, unblocked vol tc, single (s) tc, 2 stage (s) tf (s) p0 queue free % cm capacity (veh/h) Direction, Lane # EB 1 WB 1 NB 1 NB 2 NB 3 SB 1 SB 2 SB 3 Volume Total Volume Left Volume Right csh Volume to Capacity Queue Length 95th (ft) Control Delay (s) Lane LOS D F B A Approach Delay (s) Approach LOS D F Average Delay 10.2 Intersection Capacity Utilization 52.4% ICU Level of Service A Waterman Gardens - Opening Year (2013) plus Project - AM Fehr & Peers Associates, Inc. Page 4
133 HCM Signalized Intersection Capacity Analysis 5: Olive Street & Waterman Avenue 7/16/2012 Movement EBL EBT EBR WBL WBT WBR NBL NBT NBR SBL SBT SBR Ideal Flow (vphpl) Total Lost time (s) Lane Util. Factor Frt Flt Protected Satd. Flow (prot) Flt Permitted Satd. Flow (perm) Volume (vph) Peak-hour factor, PHF Adj. Flow (vph) RTOR Reduction (vph) Lane Group Flow (vph) Turn Type Perm Perm Prot Prot Protected Phases Permitted Phases 4 8 Actuated Green, G (s) Effective Green, g (s) Actuated g/c Ratio Clearance Time (s) Vehicle Extension (s) Lane Grp Cap (vph) v/s Ratio Prot c0.03 c0.35 v/s Ratio Perm 0.01 c0.03 v/c Ratio Uniform Delay, d Progression Factor Incremental Delay, d Delay (s) Level of Service C C C A C A Approach Delay (s) Approach LOS C C A A HCM Average Control Delay 6.8 HCM Level of Service A HCM Volume to Capacity ratio 0.42 Actuated Cycle Length (s) 70.0 Sum of lost time (s) 4.0 Intersection Capacity Utilization 49.5% ICU Level of Service A c Critical Lane Group Waterman Gardens - Opening Year (2013) plus Project - AM Fehr & Peers Associates, Inc. Page 1
134 HCM Signalized Intersection Capacity Analysis 6: 5th Street & Waterman Avenue 5/31/2012 Movement EBL EBT EBR WBL WBT WBR NBL NBT NBR SBL SBT SBR Ideal Flow (vphpl) Total Lost time (s) Lane Util. Factor Frt Flt Protected Satd. Flow (prot) Flt Permitted Satd. Flow (perm) Volume (vph) Peak-hour factor, PHF Adj. Flow (vph) RTOR Reduction (vph) Lane Group Flow (vph) Turn Type pm+pt pm+pt Perm Prot Perm Prot Perm Protected Phases Permitted Phases Actuated Green, G (s) Effective Green, g (s) Actuated g/c Ratio Clearance Time (s) Vehicle Extension (s) Lane Grp Cap (vph) v/s Ratio Prot c c c c0.29 v/s Ratio Perm v/c Ratio Uniform Delay, d Progression Factor Incremental Delay, d Delay (s) Level of Service B B B C B C B A C C B Approach Delay (s) Approach LOS B C B C HCM Average Control Delay 18.4 HCM Level of Service B HCM Volume to Capacity ratio 0.58 Actuated Cycle Length (s) 66.7 Sum of lost time (s) 8.0 Intersection Capacity Utilization 56.5% ICU Level of Service B c Critical Lane Group Waterman Gardens - Opening Year (2013) plus Project - AM Fehr & Peers Associates, Inc. Page 6
135 HCM Signalized Intersection Capacity Analysis 7: Base Line Street & Crestview Avenue 7/16/2012 Movement EBL EBT EBR WBL WBT WBR NBL NBT NBR SBL SBT SBR Ideal Flow (vphpl) Total Lost time (s) Lane Util. Factor Frt Flt Protected Satd. Flow (prot) Flt Permitted Satd. Flow (perm) Volume (vph) Peak-hour factor, PHF Adj. Flow (vph) RTOR Reduction (vph) Lane Group Flow (vph) Turn Type Perm Perm Perm Perm Protected Phases Permitted Phases Actuated Green, G (s) Effective Green, g (s) Actuated g/c Ratio Clearance Time (s) Vehicle Extension (s) Lane Grp Cap (vph) v/s Ratio Prot 0.15 c0.24 v/s Ratio Perm c0.03 v/c Ratio Uniform Delay, d Progression Factor Incremental Delay, d Delay (s) Level of Service A A A A C C Approach Delay (s) Approach LOS A A C C HCM Average Control Delay 4.8 HCM Level of Service A HCM Volume to Capacity ratio 0.28 Actuated Cycle Length (s) 75.0 Sum of lost time (s) 4.0 Intersection Capacity Utilization 42.3% ICU Level of Service A c Critical Lane Group Waterman Gardens - Opening Year (2013) plus Project - AM Fehr & Peers Associates, Inc. Page 1
136 HCM Unsignalized Intersection Capacity Analysis 8: Base Line Street & La Junita Street 5/31/2012 Movement EBT EBR WBL WBT NBL NBR Sign Control Free Free Stop Grade 0% 0% 0% Volume (veh/h) Peak Hour Factor Hourly flow rate (vph) Pedestrians Lane Width (ft) Walking Speed (ft/s) Percent Blockage Right turn flare (veh) Median type None Median storage veh) Upstream signal (ft) 270 px, platoon unblocked vc, conflicting volume vc1, stage 1 conf vol vc2, stage 2 conf vol vcu, unblocked vol tc, single (s) tc, 2 stage (s) tf (s) p0 queue free % cm capacity (veh/h) Direction, Lane # EB 1 EB 2 WB 1 WB 2 WB 3 NB 1 Volume Total Volume Left Volume Right csh Volume to Capacity Queue Length 95th (ft) Control Delay (s) Lane LOS A C Approach Delay (s) Approach LOS C Average Delay 0.8 Intersection Capacity Utilization 30.3% ICU Level of Service A Waterman Gardens - Opening Year (2013) plus Project - AM Fehr & Peers Associates, Inc. Page 8
137 HCM Unsignalized Intersection Capacity Analysis 9: Driveway & La Junita Street 5/31/2012 Movement EBL EBT EBR WBL WBT WBR NBL NBT NBR SBL SBT SBR Sign Control Stop Stop Free Free Grade 0% 0% 0% 0% Volume (veh/h) Peak Hour Factor Hourly flow rate (vph) Pedestrians Lane Width (ft) Walking Speed (ft/s) Percent Blockage Right turn flare (veh) Median type None None Median storage veh) Upstream signal (ft) px, platoon unblocked vc, conflicting volume vc1, stage 1 conf vol vc2, stage 2 conf vol vcu, unblocked vol tc, single (s) tc, 2 stage (s) tf (s) p0 queue free % cm capacity (veh/h) Direction, Lane # EB 1 WB 1 NB 1 SB 1 Volume Total Volume Left Volume Right csh Volume to Capacity Queue Length 95th (ft) Control Delay (s) Lane LOS A A A Approach Delay (s) Approach LOS A A Average Delay 4.4 Intersection Capacity Utilization 18.6% ICU Level of Service A Waterman Gardens - Opening Year (2013) plus Project - AM Fehr & Peers Associates, Inc. Page 9
138 HCM Signalized Intersection Capacity Analysis 10: Base Line Street & Del Rosa Drive 5/31/2012 Movement EBL EBT EBR WBL WBT WBR NBL NBT NBR SBL SBT SBR Ideal Flow (vphpl) Total Lost time (s) Lane Util. Factor Frt Flt Protected Satd. Flow (prot) Flt Permitted Satd. Flow (perm) Volume (vph) Peak-hour factor, PHF Adj. Flow (vph) RTOR Reduction (vph) Lane Group Flow (vph) Turn Type Prot Prot Prot Prot Perm Protected Phases Permitted Phases 4 Actuated Green, G (s) Effective Green, g (s) Actuated g/c Ratio Clearance Time (s) Vehicle Extension (s) Lane Grp Cap (vph) v/s Ratio Prot c c0.05 c0.18 c c0.25 v/s Ratio Perm 0.07 v/c Ratio Uniform Delay, d Progression Factor Incremental Delay, d Delay (s) Level of Service D C D C D C D C C Approach Delay (s) Approach LOS C C C C HCM Average Control Delay 26.1 HCM Level of Service C HCM Volume to Capacity ratio 0.57 Actuated Cycle Length (s) 90.0 Sum of lost time (s) 8.0 Intersection Capacity Utilization 57.7% ICU Level of Service B c Critical Lane Group Waterman Gardens - Opening Year (2013) plus Project - AM Fehr & Peers Associates, Inc. Page 10
139 HCM Signalized Intersection Capacity Analysis 1: Base Line Street & E Street 5/31/2012 Movement EBL EBT EBR WBL WBT WBR NBL NBT NBR SBL SBT SBR Ideal Flow (vphpl) Total Lost time (s) Lane Util. Factor Frt Flt Protected Satd. Flow (prot) Flt Permitted Satd. Flow (perm) Volume (vph) Peak-hour factor, PHF Adj. Flow (vph) RTOR Reduction (vph) Lane Group Flow (vph) Turn Type pm+pt pm+pt Perm Perm Protected Phases Permitted Phases Actuated Green, G (s) Effective Green, g (s) Actuated g/c Ratio Clearance Time (s) Vehicle Extension (s) Lane Grp Cap (vph) v/s Ratio Prot c c v/s Ratio Perm c0.16 v/c Ratio Uniform Delay, d Progression Factor Incremental Delay, d Delay (s) Level of Service A A A A C C D C Approach Delay (s) Approach LOS A A C C HCM Average Control Delay 15.6 HCM Level of Service B HCM Volume to Capacity ratio 0.45 Actuated Cycle Length (s) 80.0 Sum of lost time (s) 8.0 Intersection Capacity Utilization 63.1% ICU Level of Service B c Critical Lane Group Waterman Gardens - Opening Year (2013) plus Project - PM Fehr & Peers Associates, Inc. Page 1
140 HCM Signalized Intersection Capacity Analysis 2: Highland Avenue & Waterman Avenue 5/31/2012 Movement EBL EBT EBR WBL WBT WBR NBL NBT NBR SBL SBT SBR Ideal Flow (vphpl) Total Lost time (s) Lane Util. Factor Frt Flt Protected Satd. Flow (prot) Flt Permitted Satd. Flow (perm) Volume (vph) Peak-hour factor, PHF Adj. Flow (vph) RTOR Reduction (vph) Lane Group Flow (vph) Turn Type Prot Perm Prot Prot Perm Prot Protected Phases Permitted Phases 2 8 Actuated Green, G (s) Effective Green, g (s) Actuated g/c Ratio Clearance Time (s) Vehicle Extension (s) Lane Grp Cap (vph) v/s Ratio Prot c0.07 c0.20 c0.12 c v/s Ratio Perm v/c Ratio Uniform Delay, d Progression Factor Incremental Delay, d Delay (s) Level of Service D C C D C D C C D C Approach Delay (s) Approach LOS C C C C HCM Average Control Delay 29.3 HCM Level of Service C HCM Volume to Capacity ratio 0.61 Actuated Cycle Length (s) 90.0 Sum of lost time (s) 4.0 Intersection Capacity Utilization 64.8% ICU Level of Service C c Critical Lane Group Waterman Gardens - Opening Year (2013) plus Project - PM Fehr & Peers Associates, Inc. Page 2
141 HCM Signalized Intersection Capacity Analysis 3: Base Line Street & Waterman Avenue 7/16/2012 Movement EBL EBT EBR WBL WBT WBR NBL NBT NBR SBL SBT SBR Ideal Flow (vphpl) Total Lost time (s) Lane Util. Factor Frt Flt Protected Satd. Flow (prot) Flt Permitted Satd. Flow (perm) Volume (vph) Peak-hour factor, PHF Adj. Flow (vph) RTOR Reduction (vph) Lane Group Flow (vph) Turn Type Prot Prot Prot pm+ov Prot pm+ov Protected Phases Permitted Phases 8 4 Actuated Green, G (s) Effective Green, g (s) Actuated g/c Ratio Clearance Time (s) Vehicle Extension (s) Lane Grp Cap (vph) v/s Ratio Prot 0.06 c0.19 c0.10 c0.19 c0.11 c c v/s Ratio Perm v/c Ratio Uniform Delay, d Progression Factor Incremental Delay, d Delay (s) Level of Service D C E D D C B D C B Approach Delay (s) Approach LOS D D C C HCM Average Control Delay 31.1 HCM Level of Service C HCM Volume to Capacity ratio 0.63 Actuated Cycle Length (s) Sum of lost time (s) 4.0 Intersection Capacity Utilization 65.2% ICU Level of Service C c Critical Lane Group Waterman Gardens - Opening Year (2013) plus Project - PM Fehr & Peers Associates, Inc. Page 1
142 HCM Unsignalized Intersection Capacity Analysis 4: Orange Street Driveway & Waterman Avenue 5/31/2012 Movement EBL EBT EBR WBL WBT WBR NBL NBT NBR SBL SBT SBR Sign Control Stop Stop Free Free Grade 0% 0% 0% 0% Volume (veh/h) Peak Hour Factor Hourly flow rate (vph) Pedestrians Lane Width (ft) Walking Speed (ft/s) Percent Blockage Right turn flare (veh) Median type None None Median storage veh) Upstream signal (ft) px, platoon unblocked vc, conflicting volume vc1, stage 1 conf vol vc2, stage 2 conf vol vcu, unblocked vol tc, single (s) tc, 2 stage (s) tf (s) p0 queue free % cm capacity (veh/h) Direction, Lane # EB 1 WB 1 NB 1 NB 2 NB 3 SB 1 SB 2 SB 3 Volume Total Volume Left Volume Right csh Volume to Capacity Queue Length 95th (ft) Control Delay (s) Lane LOS D F B B Approach Delay (s) Approach LOS D F Average Delay 7.2 Intersection Capacity Utilization 56.5% ICU Level of Service B Waterman Gardens - Opening Year (2013) plus Project - PM Fehr & Peers Associates, Inc. Page 4
143 HCM Signalized Intersection Capacity Analysis 5: Olive Street & Waterman Avenue 7/16/2012 Movement EBL EBT EBR WBL WBT WBR NBL NBT NBR SBL SBT SBR Ideal Flow (vphpl) Total Lost time (s) Lane Util. Factor Frt Flt Protected Satd. Flow (prot) Flt Permitted Satd. Flow (perm) Volume (vph) Peak-hour factor, PHF Adj. Flow (vph) RTOR Reduction (vph) Lane Group Flow (vph) Turn Type Perm Perm Prot Prot Protected Phases Permitted Phases 4 8 Actuated Green, G (s) Effective Green, g (s) Actuated g/c Ratio Clearance Time (s) Vehicle Extension (s) Lane Grp Cap (vph) v/s Ratio Prot 0.01 c0.36 c v/s Ratio Perm 0.01 c0.02 v/c Ratio Uniform Delay, d Progression Factor Incremental Delay, d Delay (s) Level of Service C C C A C A Approach Delay (s) Approach LOS C C A A HCM Average Control Delay 6.8 HCM Level of Service A HCM Volume to Capacity ratio 0.43 Actuated Cycle Length (s) 70.0 Sum of lost time (s) 6.0 Intersection Capacity Utilization 44.0% ICU Level of Service A c Critical Lane Group Waterman Gardens - Opening Year (2013) plus Project - PM Fehr & Peers Associates, Inc. Page 1
144 HCM Signalized Intersection Capacity Analysis 6: 5th Street & Waterman Avenue 5/31/2012 Movement EBL EBT EBR WBL WBT WBR NBL NBT NBR SBL SBT SBR Ideal Flow (vphpl) Total Lost time (s) Lane Util. Factor Frt Flt Protected Satd. Flow (prot) Flt Permitted Satd. Flow (perm) Volume (vph) Peak-hour factor, PHF Adj. Flow (vph) RTOR Reduction (vph) Lane Group Flow (vph) Turn Type pm+pt pm+pt Perm Prot Perm Prot Perm Protected Phases Permitted Phases Actuated Green, G (s) Effective Green, g (s) Actuated g/c Ratio Clearance Time (s) Vehicle Extension (s) Lane Grp Cap (vph) v/s Ratio Prot c0.03 c0.20 c c c0.25 v/s Ratio Perm v/c Ratio Uniform Delay, d Progression Factor Incremental Delay, d Delay (s) Level of Service B C B B B C C B C C B Approach Delay (s) Approach LOS C B C C HCM Average Control Delay 21.6 HCM Level of Service C HCM Volume to Capacity ratio 0.69 Actuated Cycle Length (s) 71.2 Sum of lost time (s) 8.0 Intersection Capacity Utilization 68.5% ICU Level of Service C c Critical Lane Group Waterman Gardens - Opening Year (2013) plus Project - PM Fehr & Peers Associates, Inc. Page 6
145 HCM Signalized Intersection Capacity Analysis 7: Base Line Street & Crestview Avenue 7/16/2012 Movement EBL EBT EBR WBL WBT WBR NBL NBT NBR SBL SBT SBR Ideal Flow (vphpl) Total Lost time (s) Lane Util. Factor Frt Flt Protected Satd. Flow (prot) Flt Permitted Satd. Flow (perm) Volume (vph) Peak-hour factor, PHF Adj. Flow (vph) RTOR Reduction (vph) Lane Group Flow (vph) Turn Type Perm Perm Perm Perm Protected Phases Permitted Phases Actuated Green, G (s) Effective Green, g (s) Actuated g/c Ratio Clearance Time (s) Vehicle Extension (s) Lane Grp Cap (vph) v/s Ratio Prot c v/s Ratio Perm c0.05 v/c Ratio Uniform Delay, d Progression Factor Incremental Delay, d Delay (s) Level of Service A A A A C C Approach Delay (s) Approach LOS A A C C HCM Average Control Delay 4.5 HCM Level of Service A HCM Volume to Capacity ratio 0.28 Actuated Cycle Length (s) 75.0 Sum of lost time (s) 4.0 Intersection Capacity Utilization 63.2% ICU Level of Service B c Critical Lane Group Waterman Gardens - Opening Year (2013) plus Project - PM Fehr & Peers Associates, Inc. Page 1
146 HCM Unsignalized Intersection Capacity Analysis 8: Base Line Street & La Junita Street 5/31/2012 Movement EBT EBR WBL WBT NBL NBR Sign Control Free Free Stop Grade 0% 0% 0% Volume (veh/h) Peak Hour Factor Hourly flow rate (vph) Pedestrians Lane Width (ft) Walking Speed (ft/s) Percent Blockage Right turn flare (veh) Median type None Median storage veh) Upstream signal (ft) 270 px, platoon unblocked vc, conflicting volume vc1, stage 1 conf vol vc2, stage 2 conf vol vcu, unblocked vol tc, single (s) tc, 2 stage (s) tf (s) p0 queue free % cm capacity (veh/h) Direction, Lane # EB 1 EB 2 WB 1 WB 2 WB 3 NB 1 Volume Total Volume Left Volume Right csh Volume to Capacity Queue Length 95th (ft) Control Delay (s) Lane LOS A C Approach Delay (s) Approach LOS C Average Delay 0.8 Intersection Capacity Utilization 30.3% ICU Level of Service A Waterman Gardens - Opening Year (2013) plus Project - PM Fehr & Peers Associates, Inc. Page 8
147 HCM Unsignalized Intersection Capacity Analysis 9: Orange Street Driveway & La Junita Street 5/31/2012 Movement EBL EBT EBR WBL WBT WBR NBL NBT NBR SBL SBT SBR Sign Control Stop Stop Free Free Grade 0% 0% 0% 0% Volume (veh/h) Peak Hour Factor Hourly flow rate (vph) Pedestrians Lane Width (ft) Walking Speed (ft/s) Percent Blockage Right turn flare (veh) Median type None None Median storage veh) Upstream signal (ft) px, platoon unblocked vc, conflicting volume vc1, stage 1 conf vol vc2, stage 2 conf vol vcu, unblocked vol tc, single (s) tc, 2 stage (s) tf (s) p0 queue free % cm capacity (veh/h) Direction, Lane # EB 1 WB 1 NB 1 SB 1 Volume Total Volume Left Volume Right csh Volume to Capacity Queue Length 95th (ft) Control Delay (s) Lane LOS A A A Approach Delay (s) Approach LOS A A Average Delay 3.9 Intersection Capacity Utilization 18.9% ICU Level of Service A Waterman Gardens - Opening Year (2013) plus Project - PM Fehr & Peers Associates, Inc. Page 9
148 HCM Signalized Intersection Capacity Analysis 10: Base Line Street & Del Rosa Drive 5/31/2012 Movement EBL EBT EBR WBL WBT WBR NBL NBT NBR SBL SBT SBR Ideal Flow (vphpl) Total Lost time (s) Lane Util. Factor Frt Flt Protected Satd. Flow (prot) Flt Permitted Satd. Flow (perm) Volume (vph) Peak-hour factor, PHF Adj. Flow (vph) RTOR Reduction (vph) Lane Group Flow (vph) Turn Type Prot Prot Prot Prot Perm Protected Phases Permitted Phases 4 Actuated Green, G (s) Effective Green, g (s) Actuated g/c Ratio Clearance Time (s) Vehicle Extension (s) Lane Grp Cap (vph) v/s Ratio Prot c c c0.05 c0.16 v/s Ratio Perm 0.02 v/c Ratio Uniform Delay, d Progression Factor Incremental Delay, d Delay (s) Level of Service D B D B D C D C C Approach Delay (s) Approach LOS B C C C HCM Average Control Delay 23.7 HCM Level of Service C HCM Volume to Capacity ratio 0.48 Actuated Cycle Length (s) 90.0 Sum of lost time (s) 6.0 Intersection Capacity Utilization 53.4% ICU Level of Service A c Critical Lane Group Waterman Gardens - Opening Year (2013) plus Project - PM Fehr & Peers Associates, Inc. Page 10
149 APPENDIX E: CUMULATIVE BASE (2033) LOS RESULTS
150 HCM Signalized Intersection Capacity Analysis 1: Base Line Street & E Street 5/31/2012 Movement EBL EBT EBR WBL WBT WBR NBL NBT NBR SBL SBT SBR Ideal Flow (vphpl) Total Lost time (s) Lane Util. Factor Frt Flt Protected Satd. Flow (prot) Flt Permitted Satd. Flow (perm) Volume (vph) Peak-hour factor, PHF Adj. Flow (vph) RTOR Reduction (vph) Lane Group Flow (vph) Turn Type pm+pt pm+pt Perm Perm Protected Phases Permitted Phases Actuated Green, G (s) Effective Green, g (s) Actuated g/c Ratio Clearance Time (s) Vehicle Extension (s) Lane Grp Cap (vph) v/s Ratio Prot c c c0.22 v/s Ratio Perm v/c Ratio Uniform Delay, d Progression Factor Incremental Delay, d Delay (s) Level of Service A B A B C C C C Approach Delay (s) Approach LOS B B C C HCM Average Control Delay 18.0 HCM Level of Service B HCM Volume to Capacity ratio 0.65 Actuated Cycle Length (s) 80.0 Sum of lost time (s) 8.0 Intersection Capacity Utilization 80.1% ICU Level of Service D c Critical Lane Group Waterman Gardens - Cumulative Base (2033) - AM Fehr & Peers Associates, Inc. Page 1
151 HCM Signalized Intersection Capacity Analysis 2: Highland Avenue & Waterman Avenue 5/31/2012 Movement EBL EBT EBR WBL WBT WBR NBL NBT NBR SBL SBT SBR Ideal Flow (vphpl) Total Lost time (s) Lane Util. Factor Frt Flt Protected Satd. Flow (prot) Flt Permitted Satd. Flow (perm) Volume (vph) Peak-hour factor, PHF Adj. Flow (vph) RTOR Reduction (vph) Lane Group Flow (vph) Turn Type Prot Perm Prot Prot Perm Prot Protected Phases Permitted Phases 2 8 Actuated Green, G (s) Effective Green, g (s) Actuated g/c Ratio Clearance Time (s) Vehicle Extension (s) Lane Grp Cap (vph) v/s Ratio Prot c0.11 c c0.12 c0.40 v/s Ratio Perm v/c Ratio Uniform Delay, d Progression Factor Incremental Delay, d Delay (s) Level of Service D C C D C D C C D F Approach Delay (s) Approach LOS C C C F HCM Average Control Delay 54.1 HCM Level of Service D HCM Volume to Capacity ratio 0.84 Actuated Cycle Length (s) 90.0 Sum of lost time (s) 4.0 Intersection Capacity Utilization 86.3% ICU Level of Service E c Critical Lane Group Waterman Gardens - Cumulative Base (2033) - AM Fehr & Peers Associates, Inc. Page 2
152 HCM Signalized Intersection Capacity Analysis 3: Base Line Street & Waterman Avenue 6/13/2012 Movement EBL EBT EBR WBL WBT WBR NBL NBT NBR SBL SBT SBR Ideal Flow (vphpl) Total Lost time (s) Lane Util. Factor Frt Flt Protected Satd. Flow (prot) Flt Permitted Satd. Flow (perm) Volume (vph) Peak-hour factor, PHF Adj. Flow (vph) RTOR Reduction (vph) Lane Group Flow (vph) Turn Type Prot Prot Prot pm+ov Prot pm+ov Protected Phases Permitted Phases 8 4 Actuated Green, G (s) Effective Green, g (s) Actuated g/c Ratio Clearance Time (s) Vehicle Extension (s) Lane Grp Cap (vph) v/s Ratio Prot 0.10 c0.24 c0.18 c c c v/s Ratio Perm v/c Ratio Uniform Delay, d Progression Factor Incremental Delay, d Delay (s) Level of Service E D F C D C B D E B Approach Delay (s) Approach LOS D E C E HCM Average Control Delay 53.0 HCM Level of Service D HCM Volume to Capacity ratio 0.91 Actuated Cycle Length (s) Sum of lost time (s) 4.0 Intersection Capacity Utilization 94.2% ICU Level of Service F c Critical Lane Group Waterman Gardens - Cumulative Base (2033) - AM Fehr & Peers Associates, Inc. Page 1
153 HCM Unsignalized Intersection Capacity Analysis 4: Driveway & Waterman Avenue 5/31/2012 Movement EBL EBT EBR WBL WBT WBR NBL NBT NBR SBL SBT SBR Sign Control Stop Stop Free Free Grade 0% 0% 0% 0% Volume (veh/h) Peak Hour Factor Hourly flow rate (vph) Pedestrians Lane Width (ft) Walking Speed (ft/s) Percent Blockage Right turn flare (veh) Median type None None Median storage veh) Upstream signal (ft) 526 px, platoon unblocked vc, conflicting volume vc1, stage 1 conf vol 0 0 vc2, stage 2 conf vol 0 0 vcu, unblocked vol tc, single (s) tc, 2 stage (s) tf (s) p0 queue free % cm capacity (veh/h) Direction, Lane # EB 1 WB 1 NB 1 NB 2 NB 3 SB 1 SB 2 SB 3 Volume Total Volume Left Volume Right csh Volume to Capacity Queue Length 95th (ft) 29 Err Control Delay (s) Err Lane LOS F F B B Approach Delay (s) Err Approach LOS F F Average Delay Intersection Capacity Utilization 65.5% ICU Level of Service C Waterman Gardens - Cumulative Base (2033) - AM Fehr & Peers Associates, Inc. Page 4
154 HCM Unsignalized Intersection Capacity Analysis 5: Olive Street & Waterman Avenue 5/31/2012 Movement EBL EBT EBR WBL WBT WBR NBL NBT NBR SBL SBT SBR Sign Control Stop Stop Free Free Grade 0% 0% 0% 0% Volume (veh/h) Peak Hour Factor Hourly flow rate (vph) Pedestrians Lane Width (ft) Walking Speed (ft/s) Percent Blockage Right turn flare (veh) Median type None None Median storage veh) Upstream signal (ft) 1013 px, platoon unblocked vc, conflicting volume vc1, stage 1 conf vol 0 0 vc2, stage 2 conf vol 0 0 vcu, unblocked vol tc, single (s) tc, 2 stage (s) tf (s) p0 queue free % cm capacity (veh/h) Direction, Lane # EB 1 WB 1 NB 1 NB 2 NB 3 SB 1 SB 2 SB 3 Volume Total Volume Left Volume Right csh Volume to Capacity 2.61 Err Queue Length 95th (ft) 96 Err Control Delay (s) Err Lane LOS F F B A Approach Delay (s) Err Approach LOS F F Average Delay Err Intersection Capacity Utilization 65.4% ICU Level of Service C Waterman Gardens - Cumulative Base (2033) - AM Fehr & Peers Associates, Inc. Page 5
155 HCM Signalized Intersection Capacity Analysis 6: 5th Street & Waterman Avenue 5/31/2012 Movement EBL EBT EBR WBL WBT WBR NBL NBT NBR SBL SBT SBR Ideal Flow (vphpl) Total Lost time (s) Lane Util. Factor Frt Flt Protected Satd. Flow (prot) Flt Permitted Satd. Flow (perm) Volume (vph) Peak-hour factor, PHF Adj. Flow (vph) RTOR Reduction (vph) Lane Group Flow (vph) Turn Type pm+pt pm+pt Perm Prot Perm Prot Perm Protected Phases Permitted Phases Actuated Green, G (s) Effective Green, g (s) Actuated g/c Ratio Clearance Time (s) Vehicle Extension (s) Lane Grp Cap (vph) v/s Ratio Prot c c0.17 c c0.45 v/s Ratio Perm v/c Ratio Uniform Delay, d Progression Factor Incremental Delay, d Delay (s) Level of Service C C C C C F B B D D B Approach Delay (s) Approach LOS C C C D HCM Average Control Delay 31.7 HCM Level of Service C HCM Volume to Capacity ratio 0.85 Actuated Cycle Length (s) 78.5 Sum of lost time (s) 10.0 Intersection Capacity Utilization 88.3% ICU Level of Service E c Critical Lane Group Waterman Gardens - Cumulative Base (2033) - AM Fehr & Peers Associates, Inc. Page 6
156 HCM Signalized Intersection Capacity Analysis 7: Base Line Street & Crestview Avenue 5/31/2012 Movement EBL EBT EBR WBL WBT WBR NBL NBT NBR SBL SBT SBR Ideal Flow (vphpl) Total Lost time (s) Lane Util. Factor Frt Flt Protected Satd. Flow (prot) Flt Permitted Satd. Flow (perm) Volume (vph) Peak-hour factor, PHF Adj. Flow (vph) RTOR Reduction (vph) Lane Group Flow (vph) Turn Type Perm Perm Perm Perm Protected Phases Permitted Phases Actuated Green, G (s) Effective Green, g (s) Actuated g/c Ratio Clearance Time (s) Vehicle Extension (s) Lane Grp Cap (vph) v/s Ratio Prot 0.24 c0.34 v/s Ratio Perm c0.04 v/c Ratio Uniform Delay, d Progression Factor Incremental Delay, d Delay (s) Level of Service A A A A B B Approach Delay (s) Approach LOS A A B B HCM Average Control Delay 3.5 HCM Level of Service A HCM Volume to Capacity ratio 0.40 Actuated Cycle Length (s) 50.0 Sum of lost time (s) 4.0 Intersection Capacity Utilization 67.4% ICU Level of Service C c Critical Lane Group Waterman Gardens - Cumulative Base (2033) - AM Fehr & Peers Associates, Inc. Page 7
157 HCM Unsignalized Intersection Capacity Analysis 8: Base Line Street & La Junita Street 5/31/2012 Movement EBT EBR WBL WBT NBL NBR Sign Control Free Free Stop Grade 0% 0% 0% Volume (veh/h) Peak Hour Factor Hourly flow rate (vph) Pedestrians Lane Width (ft) Walking Speed (ft/s) Percent Blockage Right turn flare (veh) Median type None Median storage veh) Upstream signal (ft) 270 px, platoon unblocked vc, conflicting volume vc1, stage 1 conf vol vc2, stage 2 conf vol vcu, unblocked vol tc, single (s) tc, 2 stage (s) tf (s) p0 queue free % cm capacity (veh/h) Direction, Lane # EB 1 EB 2 WB 1 WB 2 WB 3 NB 1 Volume Total Volume Left Volume Right csh Volume to Capacity Queue Length 95th (ft) Control Delay (s) Lane LOS B D Approach Delay (s) Approach LOS D Average Delay 0.9 Intersection Capacity Utilization 41.8% ICU Level of Service A Waterman Gardens - Cumulative Base (2033) - AM Fehr & Peers Associates, Inc. Page 8
158 HCM Unsignalized Intersection Capacity Analysis 9: Driveway & La Junita Street 5/31/2012 Movement EBL EBT EBR WBL WBT WBR NBL NBT NBR SBL SBT SBR Sign Control Stop Stop Free Free Grade 0% 0% 0% 0% Volume (veh/h) Peak Hour Factor Hourly flow rate (vph) Pedestrians Lane Width (ft) Walking Speed (ft/s) Percent Blockage Right turn flare (veh) Median type None None Median storage veh) Upstream signal (ft) px, platoon unblocked vc, conflicting volume vc1, stage 1 conf vol vc2, stage 2 conf vol vcu, unblocked vol tc, single (s) tc, 2 stage (s) tf (s) p0 queue free % cm capacity (veh/h) Direction, Lane # EB 1 WB 1 NB 1 SB 1 Volume Total Volume Left Volume Right csh Volume to Capacity Queue Length 95th (ft) Control Delay (s) Lane LOS A A A Approach Delay (s) Approach LOS A A Average Delay 3.9 Intersection Capacity Utilization 20.5% ICU Level of Service A Waterman Gardens - Cumulative Base (2033) - AM Fehr & Peers Associates, Inc. Page 9
159 HCM Signalized Intersection Capacity Analysis 10: Base Line Street & Del Rosa Drive 5/31/2012 Movement EBL EBT EBR WBL WBT WBR NBL NBT NBR SBL SBT SBR Ideal Flow (vphpl) Total Lost time (s) Lane Util. Factor Frt Flt Protected Satd. Flow (prot) Flt Permitted Satd. Flow (perm) Volume (vph) Peak-hour factor, PHF Adj. Flow (vph) RTOR Reduction (vph) Lane Group Flow (vph) Turn Type Prot Prot Prot Prot Perm Protected Phases Permitted Phases 4 Actuated Green, G (s) Effective Green, g (s) Actuated g/c Ratio Clearance Time (s) Vehicle Extension (s) Lane Grp Cap (vph) v/s Ratio Prot 0.06 c c0.28 c c0.38 v/s Ratio Perm 0.14 v/c Ratio Uniform Delay, d Progression Factor Incremental Delay, d Delay (s) Level of Service D C D D D B D E C Approach Delay (s) Approach LOS C D C D HCM Average Control Delay 39.1 HCM Level of Service D HCM Volume to Capacity ratio 0.84 Actuated Cycle Length (s) 90.0 Sum of lost time (s) 6.0 Intersection Capacity Utilization 86.8% ICU Level of Service E c Critical Lane Group Waterman Gardens - Cumulative Base (2033) - AM Fehr & Peers Associates, Inc. Page 10
160 HCM Signalized Intersection Capacity Analysis 1: Base Line Street & E Street 5/31/2012 Movement EBL EBT EBR WBL WBT WBR NBL NBT NBR SBL SBT SBR Ideal Flow (vphpl) Total Lost time (s) Lane Util. Factor Frt Flt Protected Satd. Flow (prot) Flt Permitted Satd. Flow (perm) Volume (vph) Peak-hour factor, PHF Adj. Flow (vph) RTOR Reduction (vph) Lane Group Flow (vph) Turn Type pm+pt pm+pt Perm Perm Protected Phases Permitted Phases Actuated Green, G (s) Effective Green, g (s) Actuated g/c Ratio Clearance Time (s) Vehicle Extension (s) Lane Grp Cap (vph) v/s Ratio Prot c c v/s Ratio Perm c0.46 v/c Ratio Uniform Delay, d Progression Factor Incremental Delay, d Delay (s) Level of Service B B B C C C F C Approach Delay (s) Approach LOS B C C E HCM Average Control Delay 27.9 HCM Level of Service C HCM Volume to Capacity ratio 1.01 Actuated Cycle Length (s) 80.0 Sum of lost time (s) 8.0 Intersection Capacity Utilization 89.9% ICU Level of Service E c Critical Lane Group Waterman Gardens - Buildout (2033) - PM Fehr & Peers Associates, Inc. Page 1
161 HCM Signalized Intersection Capacity Analysis 2: Highland Avenue & Waterman Avenue 5/31/2012 Movement EBL EBT EBR WBL WBT WBR NBL NBT NBR SBL SBT SBR Ideal Flow (vphpl) Total Lost time (s) Lane Util. Factor Frt Flt Protected Satd. Flow (prot) Flt Permitted Satd. Flow (perm) Volume (vph) Peak-hour factor, PHF Adj. Flow (vph) RTOR Reduction (vph) Lane Group Flow (vph) Turn Type Prot Perm Prot Prot Perm Prot Protected Phases Permitted Phases 2 8 Actuated Green, G (s) Effective Green, g (s) Actuated g/c Ratio Clearance Time (s) Vehicle Extension (s) Lane Grp Cap (vph) v/s Ratio Prot 0.11 c0.28 c0.12 c0.35 c0.20 c v/s Ratio Perm v/c Ratio Uniform Delay, d Progression Factor Incremental Delay, d Delay (s) Level of Service D C C E F F F C F C Approach Delay (s) Approach LOS C F F D HCM Average Control Delay 91.7 HCM Level of Service F HCM Volume to Capacity ratio 1.14 Actuated Cycle Length (s) 90.0 Sum of lost time (s) 8.0 Intersection Capacity Utilization 103.9% ICU Level of Service G c Critical Lane Group Waterman Gardens - Buildout (2033) - PM Fehr & Peers Associates, Inc. Page 2
162 HCM Signalized Intersection Capacity Analysis 3: Base Line Street & Waterman Avenue 6/13/2012 Movement EBL EBT EBR WBL WBT WBR NBL NBT NBR SBL SBT SBR Ideal Flow (vphpl) Total Lost time (s) Lane Util. Factor Frt Flt Protected Satd. Flow (prot) Flt Permitted Satd. Flow (perm) Volume (vph) Peak-hour factor, PHF Adj. Flow (vph) RTOR Reduction (vph) Lane Group Flow (vph) Turn Type Prot Prot Prot pm+ov Prot pm+ov Protected Phases Permitted Phases 8 4 Actuated Green, G (s) Effective Green, g (s) Actuated g/c Ratio Clearance Time (s) Vehicle Extension (s) Lane Grp Cap (vph) v/s Ratio Prot 0.10 c0.30 c0.15 c0.28 c0.14 c c v/s Ratio Perm v/c Ratio Uniform Delay, d Progression Factor Incremental Delay, d Delay (s) Level of Service D D F D F D B D D B Approach Delay (s) Approach LOS D E D D HCM Average Control Delay 50.5 HCM Level of Service D HCM Volume to Capacity ratio 0.97 Actuated Cycle Length (s) Sum of lost time (s) 4.0 Intersection Capacity Utilization 97.9% ICU Level of Service F c Critical Lane Group Waterman Gardens - Buildout (2033) - PM Fehr & Peers Associates, Inc. Page 1
163 HCM Unsignalized Intersection Capacity Analysis 4: Orange Street Driveway & Waterman Avenue 5/31/2012 Movement EBL EBT EBR WBL WBT WBR NBL NBT NBR SBL SBT SBR Sign Control Stop Stop Free Free Grade 0% 0% 0% 0% Volume (veh/h) Peak Hour Factor Hourly flow rate (vph) Pedestrians Lane Width (ft) Walking Speed (ft/s) Percent Blockage Right turn flare (veh) Median type None None Median storage veh) Upstream signal (ft) 526 px, platoon unblocked vc, conflicting volume vc1, stage 1 conf vol 0 0 vc2, stage 2 conf vol 0 0 vcu, unblocked vol tc, single (s) tc, 2 stage (s) tf (s) p0 queue free % cm capacity (veh/h) Direction, Lane # EB 1 WB 1 NB 1 NB 2 NB 3 SB 1 SB 2 SB 3 Volume Total Volume Left Volume Right csh Volume to Capacity Err Queue Length 95th (ft) Err Err Control Delay (s) Err Err Lane LOS F F B B Approach Delay (s) Err Err Approach LOS F F Average Delay Err Intersection Capacity Utilization 72.9% ICU Level of Service C Waterman Gardens - Buildout (2033) - PM Fehr & Peers Associates, Inc. Page 4
164 HCM Unsignalized Intersection Capacity Analysis 5: Olive Street & Waterman Avenue 5/31/2012 Movement EBL EBT EBR WBL WBT WBR NBL NBT NBR SBL SBT SBR Sign Control Stop Stop Free Free Grade 0% 0% 0% 0% Volume (veh/h) Peak Hour Factor Hourly flow rate (vph) Pedestrians Lane Width (ft) Walking Speed (ft/s) Percent Blockage Right turn flare (veh) Median type None None Median storage veh) Upstream signal (ft) 1013 px, platoon unblocked vc, conflicting volume vc1, stage 1 conf vol 0 0 vc2, stage 2 conf vol 0 0 vcu, unblocked vol tc, single (s) tc, 2 stage (s) tf (s) p0 queue free % cm capacity (veh/h) Direction, Lane # EB 1 WB 1 NB 1 NB 2 NB 3 SB 1 SB 2 SB 3 Volume Total Volume Left Volume Right csh Volume to Capacity Err Err Queue Length 95th (ft) Err Err Control Delay (s) Err Err Lane LOS F F B B Approach Delay (s) Err Err Approach LOS F F Average Delay Err Intersection Capacity Utilization 70.0% ICU Level of Service C Waterman Gardens - Buildout (2033) - PM Fehr & Peers Associates, Inc. Page 5
165 HCM Signalized Intersection Capacity Analysis 6: 5th Street & Waterman Avenue 5/31/2012 Movement EBL EBT EBR WBL WBT WBR NBL NBT NBR SBL SBT SBR Ideal Flow (vphpl) Total Lost time (s) Lane Util. Factor Frt Flt Protected Satd. Flow (prot) Flt Permitted Satd. Flow (perm) Volume (vph) Peak-hour factor, PHF Adj. Flow (vph) RTOR Reduction (vph) Lane Group Flow (vph) Turn Type pm+pt pm+pt Perm Prot Perm Prot Perm Protected Phases Permitted Phases Actuated Green, G (s) Effective Green, g (s) Actuated g/c Ratio Clearance Time (s) Vehicle Extension (s) Lane Grp Cap (vph) v/s Ratio Prot c0.05 c0.31 c c c0.45 v/s Ratio Perm v/c Ratio Uniform Delay, d Progression Factor Incremental Delay, d Delay (s) Level of Service B D B B B D F B C F B Approach Delay (s) Approach LOS D B F F HCM Average Control Delay HCM Level of Service F HCM Volume to Capacity ratio 1.16 Actuated Cycle Length (s) 76.3 Sum of lost time (s) 6.0 Intersection Capacity Utilization 108.7% ICU Level of Service G c Critical Lane Group Waterman Gardens - Buildout (2033) - PM Fehr & Peers Associates, Inc. Page 6
166 HCM Signalized Intersection Capacity Analysis 7: Base Line Street & Crestview Avenue 5/31/2012 Movement EBL EBT EBR WBL WBT WBR NBL NBT NBR SBL SBT SBR Ideal Flow (vphpl) Total Lost time (s) Lane Util. Factor Frt Flt Protected Satd. Flow (prot) Flt Permitted Satd. Flow (perm) Volume (vph) Peak-hour factor, PHF Adj. Flow (vph) RTOR Reduction (vph) Lane Group Flow (vph) Turn Type Perm Perm Perm Perm Protected Phases Permitted Phases Actuated Green, G (s) Effective Green, g (s) Actuated g/c Ratio Clearance Time (s) Vehicle Extension (s) Lane Grp Cap (vph) v/s Ratio Prot c v/s Ratio Perm c0.08 v/c Ratio Uniform Delay, d Progression Factor Incremental Delay, d Delay (s) Level of Service A A A A B B Approach Delay (s) Approach LOS A A B B HCM Average Control Delay 4.8 HCM Level of Service A HCM Volume to Capacity ratio 0.49 Actuated Cycle Length (s) 50.0 Sum of lost time (s) 4.0 Intersection Capacity Utilization 81.9% ICU Level of Service D c Critical Lane Group Waterman Gardens - Buildout (2033) - PM Fehr & Peers Associates, Inc. Page 7
167 HCM Unsignalized Intersection Capacity Analysis 8: Base Line Street & La Junita Street 5/31/2012 Movement EBT EBR WBL WBT NBL NBR Sign Control Free Free Stop Grade 0% 0% 0% Volume (veh/h) Peak Hour Factor Hourly flow rate (vph) Pedestrians Lane Width (ft) Walking Speed (ft/s) Percent Blockage Right turn flare (veh) Median type None Median storage veh) Upstream signal (ft) 270 px, platoon unblocked vc, conflicting volume vc1, stage 1 conf vol vc2, stage 2 conf vol vcu, unblocked vol tc, single (s) tc, 2 stage (s) tf (s) p0 queue free % cm capacity (veh/h) Direction, Lane # EB 1 EB 2 WB 1 WB 2 WB 3 NB 1 Volume Total Volume Left Volume Right csh Volume to Capacity Queue Length 95th (ft) Control Delay (s) Lane LOS B F Approach Delay (s) Approach LOS F Average Delay 4.8 Intersection Capacity Utilization 47.4% ICU Level of Service A Waterman Gardens - Buildout (2033) - PM Fehr & Peers Associates, Inc. Page 8
168 HCM Unsignalized Intersection Capacity Analysis 9: Orange Street Driveway & La Junita Street 5/31/2012 Movement EBL EBT EBR WBL WBT WBR NBL NBT NBR SBL SBT SBR Sign Control Stop Stop Free Free Grade 0% 0% 0% 0% Volume (veh/h) Peak Hour Factor Hourly flow rate (vph) Pedestrians Lane Width (ft) Walking Speed (ft/s) Percent Blockage Right turn flare (veh) Median type None None Median storage veh) Upstream signal (ft) px, platoon unblocked vc, conflicting volume vc1, stage 1 conf vol vc2, stage 2 conf vol vcu, unblocked vol tc, single (s) tc, 2 stage (s) tf (s) p0 queue free % cm capacity (veh/h) Direction, Lane # EB 1 WB 1 NB 1 SB 1 Volume Total Volume Left Volume Right csh Volume to Capacity Queue Length 95th (ft) Control Delay (s) Lane LOS A A A Approach Delay (s) Approach LOS A A Average Delay 3.1 Intersection Capacity Utilization 20.8% ICU Level of Service A Waterman Gardens - Buildout (2033) - PM Fehr & Peers Associates, Inc. Page 9
169 HCM Signalized Intersection Capacity Analysis 10: Base Line Street & Del Rosa Drive 5/31/2012 Movement EBL EBT EBR WBL WBT WBR NBL NBT NBR SBL SBT SBR Ideal Flow (vphpl) Total Lost time (s) Lane Util. Factor Frt Flt Protected Satd. Flow (prot) Flt Permitted Satd. Flow (perm) Volume (vph) Peak-hour factor, PHF Adj. Flow (vph) RTOR Reduction (vph) Lane Group Flow (vph) Turn Type Prot Prot Prot Prot Perm Protected Phases Permitted Phases 4 Actuated Green, G (s) Effective Green, g (s) Actuated g/c Ratio Clearance Time (s) Vehicle Extension (s) Lane Grp Cap (vph) v/s Ratio Prot c c c0.07 c0.24 v/s Ratio Perm 0.06 v/c Ratio Uniform Delay, d Progression Factor Incremental Delay, d Delay (s) Level of Service E C D C D C D C C Approach Delay (s) Approach LOS C C C C HCM Average Control Delay 30.8 HCM Level of Service C HCM Volume to Capacity ratio 0.73 Actuated Cycle Length (s) 90.0 Sum of lost time (s) 6.0 Intersection Capacity Utilization 77.9% ICU Level of Service D c Critical Lane Group Waterman Gardens - Buildout (2033) - PM Fehr & Peers Associates, Inc. Page 10
170 APPENDIX F: CUMULATIVE (2033) PLUS PROJECT LOS RESULTS
171 HCM Signalized Intersection Capacity Analysis 1: Base Line Street & E Street 5/31/2012 Movement EBL EBT EBR WBL WBT WBR NBL NBT NBR SBL SBT SBR Ideal Flow (vphpl) Total Lost time (s) Lane Util. Factor Frt Flt Protected Satd. Flow (prot) Flt Permitted Satd. Flow (perm) Volume (vph) Peak-hour factor, PHF Adj. Flow (vph) RTOR Reduction (vph) Lane Group Flow (vph) Turn Type pm+pt pm+pt Perm Perm Protected Phases Permitted Phases Actuated Green, G (s) Effective Green, g (s) Actuated g/c Ratio Clearance Time (s) Vehicle Extension (s) Lane Grp Cap (vph) v/s Ratio Prot c c c0.22 v/s Ratio Perm v/c Ratio Uniform Delay, d Progression Factor Incremental Delay, d Delay (s) Level of Service B B A B C C C C Approach Delay (s) Approach LOS B B C C HCM Average Control Delay 18.1 HCM Level of Service B HCM Volume to Capacity ratio 0.67 Actuated Cycle Length (s) 80.0 Sum of lost time (s) 8.0 Intersection Capacity Utilization 81.1% ICU Level of Service D c Critical Lane Group Waterman Gardens - Future Buildout Year (2033) plus Project - AM Fehr & Peers Associates, Inc. Page 1
172 HCM Signalized Intersection Capacity Analysis 2: Highland Avenue & Waterman Avenue 5/31/2012 Movement EBL EBT EBR WBL WBT WBR NBL NBT NBR SBL SBT SBR Ideal Flow (vphpl) Total Lost time (s) Lane Util. Factor Frt Flt Protected Satd. Flow (prot) Flt Permitted Satd. Flow (perm) Volume (vph) Peak-hour factor, PHF Adj. Flow (vph) RTOR Reduction (vph) Lane Group Flow (vph) Turn Type Prot Perm Prot Prot Perm Prot Protected Phases Permitted Phases 2 8 Actuated Green, G (s) Effective Green, g (s) Actuated g/c Ratio Clearance Time (s) Vehicle Extension (s) Lane Grp Cap (vph) v/s Ratio Prot c0.12 c c0.12 c0.40 v/s Ratio Perm v/c Ratio Uniform Delay, d Progression Factor Incremental Delay, d Delay (s) Level of Service D C C D C D C C D F Approach Delay (s) Approach LOS C C C F HCM Average Control Delay 56.7 HCM Level of Service E HCM Volume to Capacity ratio 0.84 Actuated Cycle Length (s) 90.0 Sum of lost time (s) 4.0 Intersection Capacity Utilization 87.1% ICU Level of Service E c Critical Lane Group Waterman Gardens - Future Buildout Year (2033) plus Project - AM Fehr & Peers Associates, Inc. Page 2
173 HCM Signalized Intersection Capacity Analysis 3: Base Line Street & Waterman Avenue 6/13/2012 Movement EBL EBT EBR WBL WBT WBR NBL NBT NBR SBL SBT SBR Ideal Flow (vphpl) Total Lost time (s) Lane Util. Factor Frt Flt Protected Satd. Flow (prot) Flt Permitted Satd. Flow (perm) Volume (vph) Peak-hour factor, PHF Adj. Flow (vph) RTOR Reduction (vph) Lane Group Flow (vph) Turn Type Prot Prot Prot pm+ov Prot pm+ov Protected Phases Permitted Phases 8 4 Actuated Green, G (s) Effective Green, g (s) Actuated g/c Ratio Clearance Time (s) Vehicle Extension (s) Lane Grp Cap (vph) v/s Ratio Prot 0.10 c0.25 c0.18 c0.27 c c v/s Ratio Perm v/c Ratio Uniform Delay, d Progression Factor Incremental Delay, d Delay (s) Level of Service E D F D E C B D E B Approach Delay (s) Approach LOS D E C E HCM Average Control Delay 55.2 HCM Level of Service E HCM Volume to Capacity ratio 0.96 Actuated Cycle Length (s) Sum of lost time (s) 6.0 Intersection Capacity Utilization 97.3% ICU Level of Service F c Critical Lane Group Waterman Gardens - Future Buildout Year (2033) plus Project - AM Fehr & Peers Associates, Inc. Page 1
174 HCM Unsignalized Intersection Capacity Analysis 4: Driveway & Waterman Avenue 5/31/2012 Movement EBL EBT EBR WBL WBT WBR NBL NBT NBR SBL SBT SBR Sign Control Stop Stop Free Free Grade 0% 0% 0% 0% Volume (veh/h) Peak Hour Factor Hourly flow rate (vph) Pedestrians Lane Width (ft) Walking Speed (ft/s) Percent Blockage Right turn flare (veh) Median type None None Median storage veh) Upstream signal (ft) px, platoon unblocked vc, conflicting volume vc1, stage 1 conf vol vc2, stage 2 conf vol vcu, unblocked vol tc, single (s) tc, 2 stage (s) tf (s) p0 queue free % cm capacity (veh/h) Direction, Lane # EB 1 WB 1 NB 1 NB 2 NB 3 SB 1 SB 2 SB 3 Volume Total Volume Left Volume Right csh Volume to Capacity Queue Length 95th (ft) 19 Err Control Delay (s) Err Lane LOS F F C B Approach Delay (s) Err Approach LOS F F Average Delay Intersection Capacity Utilization 76.4% ICU Level of Service D Waterman Gardens - Future Buildout Year (2033) plus Project - AM Fehr & Peers Associates, Inc. Page 4
175 HCM Signalized Intersection Capacity Analysis 5: Olive Street & Waterman Avenue 7/16/2012 Movement EBL EBT EBR WBL WBT WBR NBL NBT NBR SBL SBT SBR Ideal Flow (vphpl) Total Lost time (s) Lane Util. Factor Frt Flt Protected Satd. Flow (prot) Flt Permitted Satd. Flow (perm) Volume (vph) Peak-hour factor, PHF Adj. Flow (vph) RTOR Reduction (vph) Lane Group Flow (vph) Turn Type Perm Perm Prot Prot Protected Phases Permitted Phases 4 8 Actuated Green, G (s) Effective Green, g (s) Actuated g/c Ratio Clearance Time (s) Vehicle Extension (s) Lane Grp Cap (vph) v/s Ratio Prot 0.01 c c0.54 v/s Ratio Perm 0.01 c0.04 v/c Ratio Uniform Delay, d Progression Factor Incremental Delay, d Delay (s) Level of Service C C C A C A Approach Delay (s) Approach LOS C C A A HCM Average Control Delay 9.5 HCM Level of Service A HCM Volume to Capacity ratio 0.65 Actuated Cycle Length (s) 70.0 Sum of lost time (s) 6.0 Intersection Capacity Utilization 67.6% ICU Level of Service C c Critical Lane Group Waterman Gardens - Future Buildout Year (2033) plus Project - AM Fehr & Peers Associates, Inc. Page 1
176 HCM Signalized Intersection Capacity Analysis 6: 5th Street & Waterman Avenue 5/31/2012 Movement EBL EBT EBR WBL WBT WBR NBL NBT NBR SBL SBT SBR Ideal Flow (vphpl) Total Lost time (s) Lane Util. Factor Frt Flt Protected Satd. Flow (prot) Flt Permitted Satd. Flow (perm) Volume (vph) Peak-hour factor, PHF Adj. Flow (vph) RTOR Reduction (vph) Lane Group Flow (vph) Turn Type pm+pt pm+pt Perm Prot Perm Prot Perm Protected Phases Permitted Phases Actuated Green, G (s) Effective Green, g (s) Actuated g/c Ratio Clearance Time (s) Vehicle Extension (s) Lane Grp Cap (vph) v/s Ratio Prot c c c c0.46 v/s Ratio Perm v/c Ratio Uniform Delay, d Progression Factor Incremental Delay, d Delay (s) Level of Service C C C C C D B B D F B Approach Delay (s) Approach LOS C C B E HCM Average Control Delay 43.6 HCM Level of Service D HCM Volume to Capacity ratio 0.85 Actuated Cycle Length (s) 78.4 Sum of lost time (s) 8.0 Intersection Capacity Utilization 89.3% ICU Level of Service E c Critical Lane Group Waterman Gardens - Future Buildout Year (2033) plus Project - AM Fehr & Peers Associates, Inc. Page 6
177 HCM Signalized Intersection Capacity Analysis 7: Base Line Street & Crestview Avenue 5/31/2012 Movement EBL EBT EBR WBL WBT WBR NBL NBT NBR SBL SBT SBR Ideal Flow (vphpl) Total Lost time (s) Lane Util. Factor Frt Flt Protected Satd. Flow (prot) Flt Permitted Satd. Flow (perm) Volume (vph) Peak-hour factor, PHF Adj. Flow (vph) RTOR Reduction (vph) Lane Group Flow (vph) Turn Type Perm Perm Perm Perm Protected Phases Permitted Phases Actuated Green, G (s) Effective Green, g (s) Actuated g/c Ratio Clearance Time (s) Vehicle Extension (s) Lane Grp Cap (vph) v/s Ratio Prot 0.25 c0.34 v/s Ratio Perm c0.05 v/c Ratio Uniform Delay, d Progression Factor Incremental Delay, d Delay (s) Level of Service A A A A C C Approach Delay (s) Approach LOS A A C C HCM Average Control Delay 5.1 HCM Level of Service A HCM Volume to Capacity ratio 0.41 Actuated Cycle Length (s) 75.0 Sum of lost time (s) 4.0 Intersection Capacity Utilization 67.2% ICU Level of Service C c Critical Lane Group Waterman Gardens - Future Buildout Year (2033) plus Project - AM Fehr & Peers Associates, Inc. Page 7
178 HCM Unsignalized Intersection Capacity Analysis 8: Base Line Street & La Junita Street 5/31/2012 Movement EBT EBR WBL WBT NBL NBR Sign Control Free Free Stop Grade 0% 0% 0% Volume (veh/h) Peak Hour Factor Hourly flow rate (vph) Pedestrians Lane Width (ft) Walking Speed (ft/s) Percent Blockage Right turn flare (veh) Median type None Median storage veh) Upstream signal (ft) 270 px, platoon unblocked vc, conflicting volume vc1, stage 1 conf vol vc2, stage 2 conf vol vcu, unblocked vol tc, single (s) tc, 2 stage (s) tf (s) p0 queue free % cm capacity (veh/h) Direction, Lane # EB 1 EB 2 WB 1 WB 2 WB 3 NB 1 Volume Total Volume Left Volume Right csh Volume to Capacity Queue Length 95th (ft) Control Delay (s) Lane LOS B D Approach Delay (s) Approach LOS D Average Delay 1.0 Intersection Capacity Utilization 42.0% ICU Level of Service A Waterman Gardens - Future Buildout Year (2033) plus Project - AM Fehr & Peers Associates, Inc. Page 8
179 HCM Unsignalized Intersection Capacity Analysis 9: Driveway & La Junita Street 5/31/2012 Movement EBL EBT EBR WBL WBT WBR NBL NBT NBR SBL SBT SBR Sign Control Stop Stop Free Free Grade 0% 0% 0% 0% Volume (veh/h) Peak Hour Factor Hourly flow rate (vph) Pedestrians Lane Width (ft) Walking Speed (ft/s) Percent Blockage Right turn flare (veh) Median type None None Median storage veh) Upstream signal (ft) px, platoon unblocked vc, conflicting volume vc1, stage 1 conf vol vc2, stage 2 conf vol vcu, unblocked vol tc, single (s) tc, 2 stage (s) tf (s) p0 queue free % cm capacity (veh/h) Direction, Lane # EB 1 WB 1 NB 1 SB 1 Volume Total Volume Left Volume Right csh Volume to Capacity Queue Length 95th (ft) Control Delay (s) Lane LOS A A A Approach Delay (s) Approach LOS A A Average Delay 4.2 Intersection Capacity Utilization 21.1% ICU Level of Service A Waterman Gardens - Future Buildout Year (2033) plus Project - AM Fehr & Peers Associates, Inc. Page 9
180 HCM Signalized Intersection Capacity Analysis 10: Base Line Street & Del Rosa Drive 5/31/2012 Movement EBL EBT EBR WBL WBT WBR NBL NBT NBR SBL SBT SBR Ideal Flow (vphpl) Total Lost time (s) Lane Util. Factor Frt Flt Protected Satd. Flow (prot) Flt Permitted Satd. Flow (perm) Volume (vph) Peak-hour factor, PHF Adj. Flow (vph) RTOR Reduction (vph) Lane Group Flow (vph) Turn Type Prot Prot Prot Prot Perm Protected Phases Permitted Phases 4 Actuated Green, G (s) Effective Green, g (s) Actuated g/c Ratio Clearance Time (s) Vehicle Extension (s) Lane Grp Cap (vph) v/s Ratio Prot 0.06 c c0.29 c c0.38 v/s Ratio Perm 0.14 v/c Ratio Uniform Delay, d Progression Factor Incremental Delay, d Delay (s) Level of Service D C D D D B D E C Approach Delay (s) Approach LOS C D C D HCM Average Control Delay 39.7 HCM Level of Service D HCM Volume to Capacity ratio 0.85 Actuated Cycle Length (s) 90.0 Sum of lost time (s) 6.0 Intersection Capacity Utilization 87.6% ICU Level of Service E c Critical Lane Group Waterman Gardens - Future Buildout Year (2033) plus Project - AM Fehr & Peers Associates, Inc. Page 10
181 HCM Signalized Intersection Capacity Analysis 1: Base Line Street & E Street 5/31/2012 Movement EBL EBT EBR WBL WBT WBR NBL NBT NBR SBL SBT SBR Ideal Flow (vphpl) Total Lost time (s) Lane Util. Factor Frt Flt Protected Satd. Flow (prot) Flt Permitted Satd. Flow (perm) Volume (vph) Peak-hour factor, PHF Adj. Flow (vph) RTOR Reduction (vph) Lane Group Flow (vph) Turn Type pm+pt pm+pt Perm Perm Protected Phases Permitted Phases Actuated Green, G (s) Effective Green, g (s) Actuated g/c Ratio Clearance Time (s) Vehicle Extension (s) Lane Grp Cap (vph) v/s Ratio Prot c c v/s Ratio Perm c0.47 v/c Ratio Uniform Delay, d Progression Factor Incremental Delay, d Delay (s) Level of Service B B B C C C F C Approach Delay (s) Approach LOS B C C E HCM Average Control Delay 28.8 HCM Level of Service C HCM Volume to Capacity ratio 1.03 Actuated Cycle Length (s) 80.0 Sum of lost time (s) 8.0 Intersection Capacity Utilization 90.8% ICU Level of Service E c Critical Lane Group Waterman Gardens - Future Buildout (2033) plus Project - PM Fehr & Peers Associates, Inc. Page 1
182 HCM Signalized Intersection Capacity Analysis 2: Highland Avenue & Waterman Avenue 5/31/2012 Movement EBL EBT EBR WBL WBT WBR NBL NBT NBR SBL SBT SBR Ideal Flow (vphpl) Total Lost time (s) Lane Util. Factor Frt Flt Protected Satd. Flow (prot) Flt Permitted Satd. Flow (perm) Volume (vph) Peak-hour factor, PHF Adj. Flow (vph) RTOR Reduction (vph) Lane Group Flow (vph) Turn Type Prot Perm Prot Prot Perm Prot Protected Phases Permitted Phases 2 8 Actuated Green, G (s) Effective Green, g (s) Actuated g/c Ratio Clearance Time (s) Vehicle Extension (s) Lane Grp Cap (vph) v/s Ratio Prot 0.11 c0.28 c0.12 c0.35 c0.20 c v/s Ratio Perm v/c Ratio Uniform Delay, d Progression Factor Incremental Delay, d Delay (s) Level of Service D C C E F F F C F C Approach Delay (s) Approach LOS C F F D HCM Average Control Delay 93.4 HCM Level of Service F HCM Volume to Capacity ratio 1.15 Actuated Cycle Length (s) 90.0 Sum of lost time (s) 8.0 Intersection Capacity Utilization 104.1% ICU Level of Service G c Critical Lane Group Waterman Gardens - Future Buildout (2033) plus Project - PM Fehr & Peers Associates, Inc. Page 2
183 HCM Signalized Intersection Capacity Analysis 3: Base Line Street & Waterman Avenue 6/13/2012 Movement EBL EBT EBR WBL WBT WBR NBL NBT NBR SBL SBT SBR Ideal Flow (vphpl) Total Lost time (s) Lane Util. Factor Frt Flt Protected Satd. Flow (prot) Flt Permitted Satd. Flow (perm) Volume (vph) Peak-hour factor, PHF Adj. Flow (vph) RTOR Reduction (vph) Lane Group Flow (vph) Turn Type Prot Prot Prot pm+ov Prot pm+ov Protected Phases Permitted Phases 8 4 Actuated Green, G (s) Effective Green, g (s) Actuated g/c Ratio Clearance Time (s) Vehicle Extension (s) Lane Grp Cap (vph) v/s Ratio Prot 0.10 c0.31 c0.15 c0.28 c0.16 c v/s Ratio Perm v/c Ratio Uniform Delay, d Progression Factor Incremental Delay, d Delay (s) Level of Service D D F D F D B E D B Approach Delay (s) Approach LOS D E E D HCM Average Control Delay 55.6 HCM Level of Service E HCM Volume to Capacity ratio 1.00 Actuated Cycle Length (s) Sum of lost time (s) 4.0 Intersection Capacity Utilization 100.8% ICU Level of Service G c Critical Lane Group Waterman Gardens - Future Buildout (2033) plus Project - PM Fehr & Peers Associates, Inc. Page 1
184 HCM Unsignalized Intersection Capacity Analysis 4: Orange Street Driveway & Waterman Avenue 5/31/2012 Movement EBL EBT EBR WBL WBT WBR NBL NBT NBR SBL SBT SBR Sign Control Stop Stop Free Free Grade 0% 0% 0% 0% Volume (veh/h) Peak Hour Factor Hourly flow rate (vph) Pedestrians Lane Width (ft) Walking Speed (ft/s) Percent Blockage Right turn flare (veh) Median type None None Median storage veh) Upstream signal (ft) px, platoon unblocked vc, conflicting volume vc1, stage 1 conf vol vc2, stage 2 conf vol vcu, unblocked vol tc, single (s) tc, 2 stage (s) tf (s) p0 queue free % cm capacity (veh/h) Direction, Lane # EB 1 WB 1 NB 1 NB 2 NB 3 SB 1 SB 2 SB 3 Volume Total Volume Left Volume Right csh Volume to Capacity Err Err Queue Length 95th (ft) Err Err Control Delay (s) Err Err Lane LOS F F C F Approach Delay (s) Err Err Approach LOS F F Average Delay Err Intersection Capacity Utilization 86.2% ICU Level of Service E Waterman Gardens - Future Buildout (2033) plus Project - PM Fehr & Peers Associates, Inc. Page 4
185 HCM Signalized Intersection Capacity Analysis 5: Olive Street & Waterman Avenue 7/16/2012 Movement EBL EBT EBR WBL WBT WBR NBL NBT NBR SBL SBT SBR Ideal Flow (vphpl) Total Lost time (s) Lane Util. Factor Frt Flt Protected Satd. Flow (prot) Flt Permitted Satd. Flow (perm) Volume (vph) Peak-hour factor, PHF Adj. Flow (vph) RTOR Reduction (vph) Lane Group Flow (vph) Turn Type Perm Perm Prot Prot Protected Phases Permitted Phases 4 8 Actuated Green, G (s) Effective Green, g (s) Actuated g/c Ratio Clearance Time (s) Vehicle Extension (s) Lane Grp Cap (vph) v/s Ratio Prot 0.03 c0.65 c v/s Ratio Perm 0.01 c0.02 v/c Ratio Uniform Delay, d Progression Factor Incremental Delay, d Delay (s) Level of Service C C C C C A Approach Delay (s) Approach LOS C C C B HCM Average Control Delay 16.1 HCM Level of Service B HCM Volume to Capacity ratio 0.76 Actuated Cycle Length (s) 70.0 Sum of lost time (s) 6.0 Intersection Capacity Utilization 71.8% ICU Level of Service C c Critical Lane Group Waterman Gardens - Future Buildout (2033) plus Project - PM Fehr & Peers Associates, Inc. Page 1
186 HCM Signalized Intersection Capacity Analysis 6: 5th Street & Waterman Avenue 5/31/2012 Movement EBL EBT EBR WBL WBT WBR NBL NBT NBR SBL SBT SBR Ideal Flow (vphpl) Total Lost time (s) Lane Util. Factor Frt Flt Protected Satd. Flow (prot) Flt Permitted Satd. Flow (perm) Volume (vph) Peak-hour factor, PHF Adj. Flow (vph) RTOR Reduction (vph) Lane Group Flow (vph) Turn Type pm+pt pm+pt Perm Prot Perm Prot Perm Protected Phases Permitted Phases Actuated Green, G (s) Effective Green, g (s) Actuated g/c Ratio Clearance Time (s) Vehicle Extension (s) Lane Grp Cap (vph) v/s Ratio Prot c0.04 c0.31 c c c0.45 v/s Ratio Perm v/c Ratio Uniform Delay, d Progression Factor Incremental Delay, d Delay (s) Level of Service B D C C B D F B E F B Approach Delay (s) Approach LOS D C F F HCM Average Control Delay HCM Level of Service F HCM Volume to Capacity ratio 1.09 Actuated Cycle Length (s) 81.4 Sum of lost time (s) 6.0 Intersection Capacity Utilization 109.0% ICU Level of Service G c Critical Lane Group Waterman Gardens - Future Buildout (2033) plus Project - PM Fehr & Peers Associates, Inc. Page 6
187 HCM Signalized Intersection Capacity Analysis 7: Base Line Street & Crestview Avenue 5/31/2012 Movement EBL EBT EBR WBL WBT WBR NBL NBT NBR SBL SBT SBR Ideal Flow (vphpl) Total Lost time (s) Lane Util. Factor Frt Flt Protected Satd. Flow (prot) Flt Permitted Satd. Flow (perm) Volume (vph) Peak-hour factor, PHF Adj. Flow (vph) RTOR Reduction (vph) Lane Group Flow (vph) Turn Type Perm Perm Perm Perm Protected Phases Permitted Phases Actuated Green, G (s) Effective Green, g (s) Actuated g/c Ratio Clearance Time (s) Vehicle Extension (s) Lane Grp Cap (vph) v/s Ratio Prot c v/s Ratio Perm c0.10 v/c Ratio Uniform Delay, d Progression Factor Incremental Delay, d Delay (s) Level of Service A A A A C C Approach Delay (s) Approach LOS A A C C HCM Average Control Delay 6.3 HCM Level of Service A HCM Volume to Capacity ratio 0.50 Actuated Cycle Length (s) 75.0 Sum of lost time (s) 4.0 Intersection Capacity Utilization 81.9% ICU Level of Service D c Critical Lane Group Waterman Gardens - Future Buildout (2033) plus Project - PM Fehr & Peers Associates, Inc. Page 7
188 HCM Unsignalized Intersection Capacity Analysis 8: Base Line Street & La Junita Street 5/31/2012 Movement EBT EBR WBL WBT NBL NBR Sign Control Free Free Stop Grade 0% 0% 0% Volume (veh/h) Peak Hour Factor Hourly flow rate (vph) Pedestrians Lane Width (ft) Walking Speed (ft/s) Percent Blockage Right turn flare (veh) Median type None Median storage veh) Upstream signal (ft) 270 px, platoon unblocked vc, conflicting volume vc1, stage 1 conf vol vc2, stage 2 conf vol vcu, unblocked vol tc, single (s) tc, 2 stage (s) tf (s) p0 queue free % cm capacity (veh/h) Direction, Lane # EB 1 EB 2 WB 1 WB 2 WB 3 NB 1 Volume Total Volume Left Volume Right csh Volume to Capacity Queue Length 95th (ft) Control Delay (s) Lane LOS B F Approach Delay (s) Approach LOS F Average Delay 5.9 Intersection Capacity Utilization 48.2% ICU Level of Service A Waterman Gardens - Future Buildout (2033) plus Project - PM Fehr & Peers Associates, Inc. Page 8
189 HCM Unsignalized Intersection Capacity Analysis 9: Orange Street Driveway & La Junita Street 5/31/2012 Movement EBL EBT EBR WBL WBT WBR NBL NBT NBR SBL SBT SBR Sign Control Stop Stop Free Free Grade 0% 0% 0% 0% Volume (veh/h) Peak Hour Factor Hourly flow rate (vph) Pedestrians Lane Width (ft) Walking Speed (ft/s) Percent Blockage Right turn flare (veh) Median type None None Median storage veh) Upstream signal (ft) px, platoon unblocked vc, conflicting volume vc1, stage 1 conf vol vc2, stage 2 conf vol vcu, unblocked vol tc, single (s) tc, 2 stage (s) tf (s) p0 queue free % cm capacity (veh/h) Direction, Lane # EB 1 WB 1 NB 1 SB 1 Volume Total Volume Left Volume Right csh Volume to Capacity Queue Length 95th (ft) Control Delay (s) Lane LOS A A A Approach Delay (s) Approach LOS A A Average Delay 3.3 Intersection Capacity Utilization 20.8% ICU Level of Service A Waterman Gardens - Future Buildout (2033) plus Project - PM Fehr & Peers Associates, Inc. Page 9
190 HCM Signalized Intersection Capacity Analysis 10: Base Line Street & Del Rosa Drive 5/31/2012 Movement EBL EBT EBR WBL WBT WBR NBL NBT NBR SBL SBT SBR Ideal Flow (vphpl) Total Lost time (s) Lane Util. Factor Frt Flt Protected Satd. Flow (prot) Flt Permitted Satd. Flow (perm) Volume (vph) Peak-hour factor, PHF Adj. Flow (vph) RTOR Reduction (vph) Lane Group Flow (vph) Turn Type Prot Prot Prot Prot Perm Protected Phases Permitted Phases 4 Actuated Green, G (s) Effective Green, g (s) Actuated g/c Ratio Clearance Time (s) Vehicle Extension (s) Lane Grp Cap (vph) v/s Ratio Prot c c c0.07 c0.24 v/s Ratio Perm 0.07 v/c Ratio Uniform Delay, d Progression Factor Incremental Delay, d Delay (s) Level of Service E C D C D C D C C Approach Delay (s) Approach LOS C C C C HCM Average Control Delay 31.3 HCM Level of Service C HCM Volume to Capacity ratio 0.74 Actuated Cycle Length (s) 90.0 Sum of lost time (s) 6.0 Intersection Capacity Utilization 78.4% ICU Level of Service D c Critical Lane Group Waterman Gardens - Future Buildout (2033) plus Project - PM Fehr & Peers Associates, Inc. Page 10
191 APPENDIX G: MITIGATION AND NEW SIGNAL LOS RESULTS
192 HCM Signalized Intersection Capacity Analysis 3: Base Line Street & Waterman Avenue 7/16/2012 Movement EBL EBT EBR WBL WBT WBR NBL NBT NBR SBL SBT SBR Ideal Flow (vphpl) Total Lost time (s) Lane Util. Factor Frt Flt Protected Satd. Flow (prot) Flt Permitted Satd. Flow (perm) Volume (vph) Peak-hour factor, PHF Adj. Flow (vph) RTOR Reduction (vph) Lane Group Flow (vph) Turn Type Prot Prot Prot pm+ov Prot pm+ov Protected Phases Permitted Phases 8 4 Actuated Green, G (s) Effective Green, g (s) Actuated g/c Ratio Clearance Time (s) Vehicle Extension (s) Lane Grp Cap (vph) v/s Ratio Prot c0.18 c0.27 c c v/s Ratio Perm v/c Ratio Uniform Delay, d Progression Factor Incremental Delay, d Delay (s) Level of Service D D F D F C B D E B Approach Delay (s) Approach LOS D D D E HCM Average Control Delay 51.9 HCM Level of Service D HCM Volume to Capacity ratio 0.93 Actuated Cycle Length (s) Sum of lost time (s) 4.0 Intersection Capacity Utilization 97.3% ICU Level of Service F c Critical Lane Group Waterman Gardens - Future Buildout Year (2033) plus Project - AM Mitigation Page 1 Fehr & Peers Associates, Inc.
193 HCM Signalized Intersection Capacity Analysis 3: Base Line Street & Waterman Avenue 7/16/2012 Movement EBL EBT EBR WBL WBT WBR NBL NBT NBR SBL SBT SBR Ideal Flow (vphpl) Total Lost time (s) Lane Util. Factor Frt Flt Protected Satd. Flow (prot) Flt Permitted Satd. Flow (perm) Volume (vph) Peak-hour factor, PHF Adj. Flow (vph) RTOR Reduction (vph) Lane Group Flow (vph) Turn Type Prot Prot Prot pm+ov Prot pm+ov Protected Phases Permitted Phases 8 4 Actuated Green, G (s) Effective Green, g (s) Actuated g/c Ratio Clearance Time (s) Vehicle Extension (s) Lane Grp Cap (vph) v/s Ratio Prot 0.10 c0.31 c c0.16 c v/s Ratio Perm v/c Ratio Uniform Delay, d Progression Factor Incremental Delay, d Delay (s) Level of Service F E F D F D B F E B Approach Delay (s) Approach LOS E D D D HCM Average Control Delay 53.7 HCM Level of Service D HCM Volume to Capacity ratio 0.97 Actuated Cycle Length (s) Sum of lost time (s) 6.0 Intersection Capacity Utilization 100.8% ICU Level of Service G c Critical Lane Group Waterman Gardens - Future Buildout (2033) plus Project - PM Mitigation Page 1 Fehr & Peers Associates, Inc.
194 HCM Signalized Intersection Capacity Analysis 3: Base Line Street & Waterman Avenue 7/16/2012 Movement EBL EBT EBR WBL WBT WBR NBL NBT NBR SBL SBT SBR Ideal Flow (vphpl) Total Lost time (s) Lane Util. Factor Frt Flt Protected Satd. Flow (prot) Flt Permitted Satd. Flow (perm) Volume (vph) Peak-hour factor, PHF Adj. Flow (vph) RTOR Reduction (vph) Lane Group Flow (vph) Turn Type Prot Prot Prot pm+ov Prot pm+ov Protected Phases Permitted Phases 8 4 Actuated Green, G (s) Effective Green, g (s) Actuated g/c Ratio Clearance Time (s) Vehicle Extension (s) Lane Grp Cap (vph) v/s Ratio Prot 0.06 c0.14 c0.11 c0.18 c c v/s Ratio Perm v/c Ratio Uniform Delay, d Progression Factor Incremental Delay, d Delay (s) Level of Service D C E D D B A D C B Approach Delay (s) Approach LOS C D C C HCM Average Control Delay 29.9 HCM Level of Service C HCM Volume to Capacity ratio 0.60 Actuated Cycle Length (s) Sum of lost time (s) 6.0 Intersection Capacity Utilization 61.5% ICU Level of Service B c Critical Lane Group Waterman Gardens - Opening Year (2013) plus Project - AM Fehr & Peers Associates, Inc. Page 1
195 HCM Signalized Intersection Capacity Analysis 3: Base Line Street & Waterman Avenue 7/16/2012 Movement EBL EBT EBR WBL WBT WBR NBL NBT NBR SBL SBT SBR Ideal Flow (vphpl) Total Lost time (s) Lane Util. Factor Frt Flt Protected Satd. Flow (prot) Flt Permitted Satd. Flow (perm) Volume (vph) Peak-hour factor, PHF Adj. Flow (vph) RTOR Reduction (vph) Lane Group Flow (vph) Turn Type Prot Prot Prot pm+ov Prot pm+ov Protected Phases Permitted Phases 8 4 Actuated Green, G (s) Effective Green, g (s) Actuated g/c Ratio Clearance Time (s) Vehicle Extension (s) Lane Grp Cap (vph) v/s Ratio Prot 0.06 c0.19 c0.10 c0.19 c0.11 c c v/s Ratio Perm v/c Ratio Uniform Delay, d Progression Factor Incremental Delay, d Delay (s) Level of Service D C E D D C B D C B Approach Delay (s) Approach LOS D D C C HCM Average Control Delay 31.1 HCM Level of Service C HCM Volume to Capacity ratio 0.63 Actuated Cycle Length (s) Sum of lost time (s) 4.0 Intersection Capacity Utilization 65.2% ICU Level of Service C c Critical Lane Group Waterman Gardens - Opening Year (2013) plus Project - PM Fehr & Peers Associates, Inc. Page 1
196 HCM Signalized Intersection Capacity Analysis 5: Olive Street & Waterman Avenue 7/16/2012 Movement EBL EBT EBR WBL WBT WBR NBL NBT NBR SBL SBT SBR Ideal Flow (vphpl) Total Lost time (s) Lane Util. Factor Frt Flt Protected Satd. Flow (prot) Flt Permitted Satd. Flow (perm) Volume (vph) Peak-hour factor, PHF Adj. Flow (vph) RTOR Reduction (vph) Lane Group Flow (vph) Turn Type Perm Perm Prot Prot Protected Phases Permitted Phases 4 8 Actuated Green, G (s) Effective Green, g (s) Actuated g/c Ratio Clearance Time (s) Vehicle Extension (s) Lane Grp Cap (vph) v/s Ratio Prot c0.03 c0.35 v/s Ratio Perm 0.01 c0.03 v/c Ratio Uniform Delay, d Progression Factor Incremental Delay, d Delay (s) Level of Service C C C A C A Approach Delay (s) Approach LOS C C A A HCM Average Control Delay 6.8 HCM Level of Service A HCM Volume to Capacity ratio 0.42 Actuated Cycle Length (s) 70.0 Sum of lost time (s) 4.0 Intersection Capacity Utilization 49.5% ICU Level of Service A c Critical Lane Group Waterman Gardens - Opening Year (2013) plus Project - AM Fehr & Peers Associates, Inc. Page 1
197 HCM Signalized Intersection Capacity Analysis 5: Olive Street & Waterman Avenue 7/16/2012 Movement EBL EBT EBR WBL WBT WBR NBL NBT NBR SBL SBT SBR Ideal Flow (vphpl) Total Lost time (s) Lane Util. Factor Frt Flt Protected Satd. Flow (prot) Flt Permitted Satd. Flow (perm) Volume (vph) Peak-hour factor, PHF Adj. Flow (vph) RTOR Reduction (vph) Lane Group Flow (vph) Turn Type Perm Perm Prot Prot Protected Phases Permitted Phases 4 8 Actuated Green, G (s) Effective Green, g (s) Actuated g/c Ratio Clearance Time (s) Vehicle Extension (s) Lane Grp Cap (vph) v/s Ratio Prot 0.01 c0.36 c v/s Ratio Perm 0.01 c0.02 v/c Ratio Uniform Delay, d Progression Factor Incremental Delay, d Delay (s) Level of Service C C C A C A Approach Delay (s) Approach LOS C C A A HCM Average Control Delay 6.8 HCM Level of Service A HCM Volume to Capacity ratio 0.43 Actuated Cycle Length (s) 70.0 Sum of lost time (s) 6.0 Intersection Capacity Utilization 44.0% ICU Level of Service A c Critical Lane Group Waterman Gardens - Opening Year (2013) plus Project - PM Fehr & Peers Associates, Inc. Page 1
198 HCM Signalized Intersection Capacity Analysis 7: Base Line Street & Crestview Avenue 7/16/2012 Movement EBL EBT EBR WBL WBT WBR NBL NBT NBR SBL SBT SBR Ideal Flow (vphpl) Total Lost time (s) Lane Util. Factor Frt Flt Protected Satd. Flow (prot) Flt Permitted Satd. Flow (perm) Volume (vph) Peak-hour factor, PHF Adj. Flow (vph) RTOR Reduction (vph) Lane Group Flow (vph) Turn Type Perm Perm Perm Perm Protected Phases Permitted Phases Actuated Green, G (s) Effective Green, g (s) Actuated g/c Ratio Clearance Time (s) Vehicle Extension (s) Lane Grp Cap (vph) v/s Ratio Prot 0.15 c0.24 v/s Ratio Perm c0.03 v/c Ratio Uniform Delay, d Progression Factor Incremental Delay, d Delay (s) Level of Service A A A A C C Approach Delay (s) Approach LOS A A C C HCM Average Control Delay 4.8 HCM Level of Service A HCM Volume to Capacity ratio 0.28 Actuated Cycle Length (s) 75.0 Sum of lost time (s) 4.0 Intersection Capacity Utilization 42.3% ICU Level of Service A c Critical Lane Group Waterman Gardens - Opening Year (2013) plus Project - AM Fehr & Peers Associates, Inc. Page 1
199 HCM Signalized Intersection Capacity Analysis 7: Base Line Street & Crestview Avenue 7/16/2012 Movement EBL EBT EBR WBL WBT WBR NBL NBT NBR SBL SBT SBR Ideal Flow (vphpl) Total Lost time (s) Lane Util. Factor Frt Flt Protected Satd. Flow (prot) Flt Permitted Satd. Flow (perm) Volume (vph) Peak-hour factor, PHF Adj. Flow (vph) RTOR Reduction (vph) Lane Group Flow (vph) Turn Type Perm Perm Perm Perm Protected Phases Permitted Phases Actuated Green, G (s) Effective Green, g (s) Actuated g/c Ratio Clearance Time (s) Vehicle Extension (s) Lane Grp Cap (vph) v/s Ratio Prot c v/s Ratio Perm c0.05 v/c Ratio Uniform Delay, d Progression Factor Incremental Delay, d Delay (s) Level of Service A A A A C C Approach Delay (s) Approach LOS A A C C HCM Average Control Delay 4.5 HCM Level of Service A HCM Volume to Capacity ratio 0.28 Actuated Cycle Length (s) 75.0 Sum of lost time (s) 4.0 Intersection Capacity Utilization 63.2% ICU Level of Service B c Critical Lane Group Waterman Gardens - Opening Year (2013) plus Project - PM Fehr & Peers Associates, Inc. Page 1
200 HCM Signalized Intersection Capacity Analysis 33: Base Line Street & Stater Bros. Lot 7/16/2012 Movement EBL EBT EBR WBL WBT WBR NBL NBT NBR SBL SBT SBR Ideal Flow (vphpl) Total Lost time (s) Lane Util. Factor Frt Flt Protected Satd. Flow (prot) Flt Permitted Satd. Flow (perm) Volume (vph) Peak-hour factor, PHF Adj. Flow (vph) RTOR Reduction (vph) Lane Group Flow (vph) Turn Type Perm Perm Perm Perm Protected Phases Permitted Phases Actuated Green, G (s) Effective Green, g (s) Actuated g/c Ratio Clearance Time (s) Vehicle Extension (s) Lane Grp Cap (vph) v/s Ratio Prot 0.14 c v/s Ratio Perm c0.02 v/c Ratio Uniform Delay, d Progression Factor Incremental Delay, d Delay (s) Level of Service A A A A C C C C Approach Delay (s) Approach LOS A A C C HCM Average Control Delay 3.1 HCM Level of Service A HCM Volume to Capacity ratio 0.22 Actuated Cycle Length (s) 75.0 Sum of lost time (s) 4.0 Intersection Capacity Utilization 39.4% ICU Level of Service A c Critical Lane Group Waterman Gardens - Opening Year (2013) plus Project - AM Fehr & Peers Associates, Inc. Page 1
201 HCM Signalized Intersection Capacity Analysis 32: Base Line Street & Stater Bros Lot 7/16/2012 Movement EBL EBT EBR WBL WBT WBR NBL NBT NBR SBL SBT SBR Ideal Flow (vphpl) Total Lost time (s) Lane Util. Factor Frt Flt Protected Satd. Flow (prot) Flt Permitted Satd. Flow (perm) Volume (vph) Peak-hour factor, PHF Adj. Flow (vph) RTOR Reduction (vph) Lane Group Flow (vph) Turn Type Perm Perm Perm Perm Protected Phases Permitted Phases Actuated Green, G (s) Effective Green, g (s) Actuated g/c Ratio Clearance Time (s) Vehicle Extension (s) Lane Grp Cap (vph) v/s Ratio Prot c v/s Ratio Perm c0.05 v/c Ratio Uniform Delay, d Progression Factor Incremental Delay, d Delay (s) Level of Service A A A A C C C C Approach Delay (s) Approach LOS A A C C HCM Average Control Delay 4.2 HCM Level of Service A HCM Volume to Capacity ratio 0.28 Actuated Cycle Length (s) 75.0 Sum of lost time (s) 4.0 Intersection Capacity Utilization 45.4% ICU Level of Service A c Critical Lane Group Waterman Gardens - Opening Year (2013) plus Project - PM Fehr & Peers Associates, Inc. Page 1
202 APPENDIX H: CUMULATIVE PROJECTS LIST
203 APPENDIX H PENDING AND APPROVED PROJECTS TRIP GENERATION [a] Trip Generation AM PM Daily Existing Population Location Size Unit [c] In Out Total In Out Total Total Southeast corner of Waterman Avenue KSF Commercial Building and Mill Street Commercial Shopping Center with Southwest corner of Arden Avenue and KSF ,692 Home Improvement Store [b] Highland Avenue Industrial Complex Center Southeast corner of Arrowhead Avenue a KSF ,359 3-Story, Senior Housing Complex Northwest corner of Medical Center U Drive and 16th Street Contractor Storage Yard Southeast corner of Valley View Drive KSF and Mill Street 3-Story Hotel Highland Avenue between Valaria Drive RM ,294 and Robinson Road Industrial Building 1910 East Central Avenue KSF ,386 Residential Rialto Avenue, 800 feet east of DU Tippecanoe Avenue Offices and Industrial Building Northeast corner of Sterling Avenue and KSF rd Street KSF Office Building 1955 East Marshall Avenue KSF ,745 Trip Generation Total 1, , ,143 1,714 22,370 Notes: [a] Trip generations calculated from ITE Trip Generation (8th edition, 2008). Categories 110, 150, 210, 310, 710, and 820. [b] Trip generation sourced from Home Depot Traffic Impact Study Report, Fehr and Peers, May See Appendix H for pending and approved projects trip generation. [c] DU = dwelling unit, U = unit, RM = room, KSF = thousand square feet.
204 APPENDIX I: CITY OF SAN BERNARDINO REFERENCE DOCUMENTS

205 CITY OF SAN BERNARDINO DEVELOPMENT SERVICES DEPARTMENT TRAFFIC IMPACT STUDY GUIDELINES The Development/Environmental Review Committee may identify concerns that require a traffic study and report as part of the project review process. The City Engineer, under the authority of the Director of Development Services, will make the final decision on the need for a traffic study. The purpose of the traffic study is to identify impacts to traffic operation and safety. The purpose of these guidelines is to provide the standard requirements for the preparation of a traffic study. Traffic Study Requirement Review The City s Development Services Department shall do an initial assessment of the project based upon the description and proposed use(s). In general, the requirement for a traffic study as part of the project review process will be based upon, but not limited to, the following criteria: 1) Any project with initial traffic generation estimates showing that the project is likely to add 500 or more daily two-way trips, and/or likely to add 50 or more AM or PM peak period two-way trips to the existing circulation system, without consideration of pass-by trip reductions. Phased projects must be evaluated as a whole assuming full build-out conditions for purposes of determining the need for a traffic study. 2) Any project that is located in the vicinity (within a 1½-mile radius from the project site) of any key intersections that currently operate at a level of service (LOS) D or worse and project traffic is likely to significantly worsen this condition. 3) Any project that generates more than 40 percent of its total traffic in the form of truck traffic using passenger car equivalents (PCE). 4) Any project that intensifies the usage, density, or traffic generation of the site above the level currently allowed by zoning codes, requiring a Conditional Use Permit, General Plan Amendment, or other discretionary permit. Study Review Fee The applicant shall pay the City a study review fee of $ at the time of report submittal. The City of San Bernardino Traffic Impact Study Guidelines Page 1 of 8 September 24, 2004
Escondido Marriott Hotel and Mixed-Use Condominium Project TRAFFIC IMPACT ANALYSIS REPORT
 Escondido Marriott Hotel and Mixed-Use Condominium Project TRAFFIC IMPACT ANALYSIS REPORT Prepared for Phelps Program Management 420 Sixth Avenue, Greeley, CO 80632 Prepared by 5050 Avenida Encinas, Suite
Traffic Impact Analysis 5742 BEACH BOULEVARD MIXED USE PROJECT
 Traffic Impact Analysis 5742 BEACH BOULEVARD MIXED USE PROJECT CITY OF BUENA PARK Prepared by Project No. 14139 000 April 17 th, 2015 DKS Associates Jeffrey Heald, P.E. Rohit Itadkar, T.E. 2677 North Main
The key roadways in the project vicinity are described below. Exhibit displays the existing number of lanes on the study roadways.
 4.2 TRAFFIC AND CIRCULATION This section presents the key assumptions, methods, and results of analysis for the transportation and circulation impacts of the proposed project. This section is based on
Appendix C. Traffic Study
 Appendix C Traffic Study TABLE OF CONTENTS SECTION Executive Summary PAGE 1.0 Introduction... 1 1.1 Scope of Work... 1 1.2 Study Area... 2 2.0 Project Description... 3 2.1 Site Access... 4 2.2 Pedestrian
APPENDIX B Traffic Analysis
 APPENDIX B Traffic Analysis Rim of the World Unified School District Reconfiguration Prepared for: Rim of the World School District 27315 North Bay Road, Blue Jay, CA 92317 Prepared by: 400 Oceangate,
TIMBERVINE TRANSPORTATION IMPACT STUDY FORT COLLINS, COLORADO JANUARY Prepared for:
 TIMBERVINE TRANSPORTATION IMPACT STUDY FORT COLLINS, COLORADO JANUARY 2014 Prepared for: Hartford Companies 1218 W. Ash Street Suite A Windsor, Co 80550 Prepared by: DELICH ASSOCIATES 2272 Glen Haven Drive
Table Existing Traffic Conditions for Arterial Segments along Construction Access Route. Daily
 5.8 TRAFFIC, ACCESS, AND CIRCULATION This section describes existing traffic conditions in the project area; summarizes applicable regulations; and analyzes the potential traffic, access, and circulation
EXECUTIVE SUMMARY. The following is an outline of the traffic analysis performed by Hales Engineering for the traffic conditions of this project.
 EXECUTIVE SUMMARY This study addresses the traffic impacts associated with the proposed Shopko redevelopment located in Sugarhouse, Utah. The Shopko redevelopment project is located between 1300 East and
TRAFFIC IMPACT ANALYSIS
 TRAFFIC IMPACT ANALYSIS Emerald Isle Commercial Development Prepared by SEPI Engineering & Construction Prepared for Ark Consulting Group, PLLC March 2016 I. Executive Summary A. Site Location The Emerald
Appendix Q Traffic Study
 Appendices Appendix Q Traffic Study Crummer Site Subdivision Draft EIR City of Malibu Appendices This page intentionally left blank. The Planning Center April 2013 TRAFFIC IMPACT ANALYSIS Photo z here
TRANSPORTATION STUDY FOR THE 8899 BEVERLY BOULEVARD PROJECT
 DRAFT TRANSPORTATION STUDY FOR THE 8899 BEVERLY BOULEVARD PROJECT WEST HOLLYWOOD, CALIFORNIA NOVEMBER 2013 PREPARED FOR BEVERLY BOULEVARD ASSOCIATION PREPARED BY DRAFT TRANSPORTATION STUDY FOR THE 8899
TRAFFIC IMPACT STUDY FOR SONIC DRIVE-IN RESTAURANT. Vallejo, CA. Prepared For:
 TRAFFIC IMPACT STUDY FOR SONIC DRIVE-IN RESTAURANT Vallejo, CA Prepared For: ELITE DRIVE-INS, INC. 2190 Meridian Park Blvd, Suite G Concord, CA 94520 Prepared By: KD Anderson & Associates 3853 Taylor Road,
King County Metro. Columbia Street Transit Priority Improvements Alternative Analysis. Downtown Southend Transit Study. May 2014.
 King County Metro Columbia Street Transit Priority Improvements Alternative Analysis Downtown Southend Transit Study May 2014 Parametrix Table of Contents Introduction... 1 Methodology... 1 Study Area...
MONTEREY BAY AQUARIUM RESEARCH INSTITUTE (MBARI) MASTER PLAN UPDATE MOSS LANDING, CALIFORNIA
 MASTER PLAN UPDATE MOSS LANDING, CALIFORNIA") MONTEREY BAY AQUARIUM RESEARCH INSTITUTE (MBARI) MASTER PLAN UPDATE MOSS LANDING, CALIFORNIA TRAFFIC IMPACT ANALYSIS Administrative Draft Report Prepared For Monterey Bay Aquarium Research Institute Moss
MONTEREY BAY AQUARIUM RESEARCH INSTITUTE (MBARI) MASTER PLAN UPDATE MOSS LANDING, CALIFORNIA TRAFFIC IMPACT ANALYSIS Administrative Draft Report Prepared For Monterey Bay Aquarium Research Institute Moss
LOTUS RANCH TRAFFIC IMPACT ANALYSIS. LLG Ref Senior Transportation Engineer & Charlene Sadiarin Transportation Engineer II
 TRAFFIC IMPACT ANALYSIS LOTUS RANCH El Centro, California July 31, 2015February 12, 2016 LLG Ref. 3-14-2392 Prepared by: KC Yellapu, P.E Senior Transportation Engineer & Charlene Sadiarin Transportation
The major roadways in the study area are State Route 166 and State Route 33, which are shown on Figure 1-1 and described below:
 3.5 TRAFFIC AND CIRCULATION 3.5.1 Existing Conditions 3.5.1.1 Street Network DRAFT ENVIRONMENTAL IMPACT REPORT The major roadways in the study area are State Route 166 and State Route 33, which are shown
LAWRENCE TRANSIT CENTER LOCATION ANALYSIS 9 TH STREET & ROCKLEDGE ROAD / 21 ST STREET & IOWA STREET LAWRENCE, KANSAS
 LAWRENCE TRANSIT CENTER LOCATION ANALYSIS 9 TH STREET & ROCKLEDGE ROAD / 21 ST STREET & IOWA STREET LAWRENCE, KANSAS TRAFFIC IMPACT STUDY FEBRUARY 214 OA Project No. 213-542 TABLE OF CONTENTS 1. INTRODUCTION...
TALMONT TOWNHOMES MADISON KENNETH SPA TRAFFIC IMPACT STUDY. Sacramento, CA. Prepared For: MBK Homes. Prepared By:
 TALMONT TOWNHOMES MADISON KENNETH SPA TRAFFIC IMPACT STUDY Sacramento, CA Prepared For: MBK Homes Prepared By: KD Anderson & Associates 3853 Taylor Road, Suite G Loomis, California 95650 (916) 660-1555
2. Valley Circle Boulevard/Andora Avenue/Baden Avenue and Lassen Street
 IV.J TRANSPORTATION 1. INTRODUCTION This section presents an overview of the existing traffic and circulation system in and surrounding the project site. This section also discusses the potential impacts
Traffic Impact Analysis for 2171 Rosecrans Avenue
 Traffic Impact Analysis for 2171 Rosecrans Avenue Prepared for: Continental Development Corporation Revised May 2016 LA16-2831 Prepared by: Fehr & Peers 600 Wilshire Blvd, Suite 1050 Los Angeles, CA 90017
King Soopers #116 Thornton, Colorado
 Traffic Impact Study King Soopers #116 Thornton, Colorado Prepared for: Galloway & Company, Inc. T R A F F I C I M P A C T S T U D Y King Soopers #116 Thornton, Colorado Prepared for Galloway & Company
4.14 TRANSPORTATION AND CIRCULATION
 4.14 TRANSPORTATION AND CIRCULATION 4.14.1 Summary Table 4.14-1 summarizes the identified environmental impacts, proposed mitigation measures, and residual impacts of the proposed project with regard to
Oakbrook Village Plaza City of Laguna Hills
 Oakbrook Village Plaza City of Laguna Hills Traffic Impact Analysis Prepared by: HDR Engineering 3230 El Camino Real, Suite 200 Irvine, CA 92602 October 2012 Revision 3 D-1 Oakbrook Village Plaza Laguna
DRAFT TRANSPORTATION IMPACT STUDY CASTILIAN REDEVELOPMENT PROJECT
 DRAFT TRANSPORTATION IMPACT STUDY CASTILIAN REDEVELOPMENT PROJECT Prepared for: Submitted by: 299 Lava Ridge Ct. Suite 2 Roseville, CA. 95661 June 212 TABLE OF CONTENTS 1. Introduction... 1 Project Location
TRAFFIC IMPACT ANALYSIS FOR. McDONALD S RESTAURANT IN CARMICAEL Sacramento County, CA. Prepared For:
 TRAFFIC IMPACT ANALYSIS FOR McDONALD S RESTAURANT IN CARMICAEL Sacramento County, CA Prepared For: McDonald s USA, LLC Pacific Sierra Region 2999 Oak Road, Suite 900 Walnut Creek, CA 94597 Prepared By:
Traffic Impact Study Speedway Gas Station Redevelopment
 Traffic Impact Study Speedway Gas Station Redevelopment Warrenville, Illinois Prepared For: Prepared By: April 11, 2018 Table of Contents 1. Introduction... 1 2. Existing Conditions... 4 Site Location...
INDUSTRIAL DEVELOPMENT
 INDUSTRIAL DEVELOPMENT Traffic Impact Study Plainfield, Illinois August 2018 Prepared for: Seefried Industrial Properties, Inc. TABLE OF CONTENTS Executive Summary 2 Introduction 3 Existing Conditions
2.0 Development Driveways. Movin Out June 2017
 Movin Out June 2017 1.0 Introduction The proposed Movin Out development is a mixed use development in the northeast quadrant of the intersection of West Broadway and Fayette Avenue in the City of Madison.
Traffic Impact Analysis. Alliance Cole Avenue Residential Site Dallas, Texas. Kimley-Horn and Associates, Inc. Dallas, Texas.
 Traffic Impact Analysis Alliance Cole Avenue Residential Site Dallas, Texas February 15, 2018 Kimley-Horn and Associates, Inc. Dallas, Texas Project #064524900 Registered Firm F-928 Traffic Impact Analysis
BROWARD BOULEVARD CORRIDOR TRANSIT STUDY
 BROWARD BOULEVARD CORRIDOR TRANSIT STUDY FM # 42802411201 EXECUTIVE SUMMARY July 2012 GOBROWARD Broward Boulevard Corridor Transit Study FM # 42802411201 Executive Summary Prepared For: Ms. Khalilah Ffrench,
Date: February 7, 2017 John Doyle, Z-Best Products Robert Del Rio. T.E. Z-Best Traffic Operations and Site Access Analysis
 Memorandum Date: February 7, 07 To: From: Subject: John Doyle, Z-Best Products Robert Del Rio. T.E. Z-Best Traffic Operations and Site Access Analysis Introduction Hexagon Transportation Consultants, Inc.
Draft Report: West Berkeley Bowl Project
 Draft Report: West Berkeley Bowl Project July 2004 Prepared for: The City of Berkeley 1031-1925 F EHR & PEERS TRANSPORTATION CONSULTANTS 3685 Mt. Diablo Blvd. #301 Lafayette, CA 94549 925-284-3200 Fax:
Section 5.8 Transportation and Traffic
 Section 5.8 Transportation and Traffic 5.8 TRANSPORTATION AND TRAFFIC Generous This Section is based on the Topgolf Specific Plan Traffic Impact Analysis (RK Engineering Group, Inc., October 31, 2016);
Transportation & Traffic Engineering
 Transportation & Traffic Engineering 1) Project Description This report presents a summary of findings for a Traffic Impact Analysis (TIA) performed by A+ Engineering, Inc. for the Hill Country Family
Perris Apartments Traffic Impact Analysis City of Perris, California
 Perris Apartments Traffic Impact Analysis City of Perris, California Prepared for: JD Pierce Company, Inc. 2222 Martin St., Suite 100 Irvine, CA 92612 Prepared by: TJW ENGINEERING, INC. 540 N. Golden Circle
Alpine Highway to North County Boulevard Connector Study
 Alpine Highway to North County Boulevard Connector Study prepared by Avenue Consultants March 16, 2017 North County Boulevard Connector Study March 16, 2017 Table of Contents 1 Summary of Findings... 1
Lacey Gateway Residential Phase 1
 Lacey Gateway Residential Phase Transportation Impact Study April 23, 203 Prepared for: Gateway 850 LLC 5 Lake Bellevue Drive Suite 02 Bellevue, WA 98005 Prepared by: TENW Transportation Engineering West
Volume 1 Traffic Impact Analysis Turtle Creek Boulevard Dallas, Texas. Kimley-Horn and Associates, Inc. Dallas, Texas.
 Volume 1 Traffic Impact Analysis 2727 Dallas, Texas June 18, 2018 Kimley-Horn and Associates, Inc. Dallas, Texas Project #064523000 Registered Firm F-928 Traffic Impact Analysis 2727 Dallas, Texas Prepared
TABLE OF CONTENTS SECTION PAGE. Executive Summary... xii
 TABLE OF CONTENTS SECTION PAGE Executive Summary... xii 1.0 Introduction... 1 1.1 Study Area... 2 1.2 Traffic Impact Analysis Scenarios... 4 1.3 Study Area - City of Orange... 4 2.0 Project Description
TRAFFIC IMPACT ANALYSIS SHORTBREAD LOFTS 2009 MODIFICATION Chapel Hill, North Carolina
 TRAFFIC IMPACT ANALYSIS SHORTBREAD LOFTS 2009 MODIFICATION Chapel Hill, North Carolina Prepared for: The Town of Chapel Hill, NC Prepared by: Architects-Engineers-Planners, Inc. November 2009 Traffic Impact
APPENDIX E. Traffic Analysis Report
 APPENDIX E Traffic Analysis Report THIS PAGE INTENTIONALLY BLANK EAGLE RIVER TRAFFIC MITIGATION PHASE I OLD GLENN HIGHWAY/EAGLE RIVER ROAD INTERSECTION IMPROVEMENTS TRAFFIC ANALYSIS Eagle River, Alaska
Appendix G: Transportation/Traffic
 City of Irvine - William Lyon Homes: Vista Verde Draft EIR Appendix G: Transportation/Traffic Michael Brandman Associates H:\Client (PN-JN)\0006\00060034\EIR\3 - DEIR\00060034 Sec99-00 Appendix Dividers
APPENDIX H. Transportation Impact Study
 APPENDIX H Transportation Impact Study BUENA VISTA LAGOON ENHANCEMENT PROJECT TRANSPORTATION IMPACT STUDY Prepared for: San Diego Association of Governments Prepared by: VRPA Technologies, Inc. 9520 Padgett
Diablo Vista Pumping Plant Replacement
 Diablo Vista Pumping Plant Replacement Traffic Study PHA Transportation Consultants 12-05-359 October 2012 Diablo Vista Pumping Plant Replacement Traffic Study For EBMUD October 2012 PHA Transportation
Traffic Impact Statement (TIS)
") Traffic Impact Statement (TIS) Vincentian PUDA Collier County, FL 10/18/2013 Prepared for: Global Properties of Naples Prepared by: Trebilcock Consulting Solutions, PA 2614 Tamiami Trail N, Suite 615 1205
Traffic Impact Statement (TIS) Vincentian PUDA Collier County, FL 10/18/2013 Prepared for: Global Properties of Naples Prepared by: Trebilcock Consulting Solutions, PA 2614 Tamiami Trail N, Suite 615 1205
APPENDIX C-2. Traffic Study Supplemental Analysis Memo
 APPENDIX C-2 Traffic Study Supplemental Analysis Memo The Mobility Group Transportation Strategies & Solutions Memorandum To: From: Subject: Tomas Carranza, LADOT Matthew Simons Traffic Review - Revised
D R A F T TRAFFIC IMPACT ANALYSIS FOR. DARK HORSE GOLF RESORT EXPANSION Nevada County, CA. Prepared For:
 D R A F T TRAFFIC IMPACT ANALYSIS FOR DARK HORSE GOLF RESORT EXPANSION Nevada County, CA Prepared For: ASIAN PACIFIC GROUP 18000 Van Karman Avenue, Suite 500 Irvine, CA 92612 Prepared By: KD Anderson &
Quantitative analyses of weekday a.m. and p.m. commuter hour conditions have been conducted for the following five scenarios:
 6.1 TRANSPORTATION AND CIRCULATION 6.1.1 INTRODUCTION This section of the EIR presents the results of TJKM s traffic impact analysis of the proposed Greenbriar Development. The analysis includes consideration
MINERVA PARK SITE TRAFFIC IMPACT STUDY M/I HOMES. September 2, 2015
 5500 New Albany Road Columbus, Ohio 43054 Phone: 614.775.4500 Fax: 614.775.4800 Toll Free: 1-888-775-EMHT emht.com 2015-1008 MINERVA PARK SITE TRAFFIC IMPACT STUDY M/I HOMES September 2, 2015 Engineers
Executive Summary. Draft Environmental Impact Statement/Environmental Impact Report ES-1
 Executive Summary Introduction The Eastside Transit Corridor Phase 2 Project is a vital public transit infrastructure investment that would provide a transit connection to the existing Metro Gold Line
ZINFANDEL LANE / SILVERADO TRAIL INTERSECTION TRAFFIC ANALYSIS
 ZINFANDEL LANE / SILVERADO TRAIL INTERSECTION TRAFFIC ANALYSIS UPDATED TRAFFIC STUDY FOR THE PROPOSED RAYMOND VINEYARDS WINERY USE PERMIT MODIFICATION #P11-00156 AUGUST 5, 2014 PREPARED BY: OMNI-MEANS,
L1TILE BEARS DAY CARE TRANSPORTATION IMPACT STUDY FORT COLLINS, COLORADO MAY Prepared for:
 L1TILE BEARS DAY CARE TRANSPORTATION IMPACT STUDY FORT COLLINS, COLORADO MAY 2012 Prepared for: Hillside Construction, Inc. 216 Hemlock Street, Suite B Fort Collins, CO 80534 Prepared by: DELICH ASSOCIATES
BARRHAVEN FELLOWSHIP CRC 3058 JOCKVALE ROAD OTTAWA, ONTARIO TRANSPORTATION BRIEF. Prepared for:
 BARRHAVEN FELLOWSHIP CRC 3058 JOCKVALE ROAD OTTAWA, ONTARIO TRANSPORTATION BRIEF Prepared for: Barrhaven Fellowship CRC 3058 Jockvale Road Ottawa, ON K2J 2W7 December 7, 2016 116-649 Report_1.doc D. J.
IV. ENVIRONMENTAL IMPACT ANALYSIS J. TRANSPORTATION AND TRAFFIC
 IV. ENVIRONMENTAL IMPACT ANALYSIS J. TRANSPORTATION AND TRAFFIC This Section summarizes the information provided in the Traffic Study for the Santa Monica College Bundy Campus Master Plan (Traffic Study),
APPENDIX D- TRAFFIC STUDY
 APPENDIX D- TRAFFIC STUDY TRANSPORTATION IMPACT ANALYSIS IMPERIAL COUNTY OFFICE OF EDUCATION County of Imperial, California March 06, 2018 LLG Ref. 3-17-2831 Prepared by: Jose R. Nunez Transportation Planner
Traffic Impact Study for the Maria Drive Apartment Complex
 Traffic Impact Study for the Maria Drive Apartment Complex Prepared for the City of Petaluma Submitted by Whitlock & Weinberger Transportation, Inc. 490 Mendocino Avenue Suite 201 Santa Rosa, CA 95401
HUMC/Mountainside Hospital Redevelopment Plan
 Traffic and Parking Analysis HUMC/Mountainside Hospital Redevelopment Plan in Glen Ridge Borough and Montclair Township PREPARED FOR H2M 119 Cherry Hill Road, Suite 110 Parsippany, NJ 07054 862.207.5900
CITY OF RIALTO TRANSPORTATION/TRAFFIC IMPACT FEE Nexus Study
 Submitted by: CITY OF RIALTO TRANSPORTATION/TRAFFIC IMPACT FEE Nexus Study Submitted to: City of Rialto November 2016 17J14 1737 Traffic Impact Fee Nexus Study Draft Report TABLE OF CONTENTS Table of Contents...
TRAFFIC SIGNAL DESIGN REPORT KING OF PRUSSIA ROAD & RAIDER ROAD RADNOR TOWNSHIP PENNSYLVANIA
 TRAFFIC SIGNAL DESIGN REPORT KING OF PRUSSIA ROAD & RAIDER ROAD RADNOR TOWNSHIP PENNSYLVANIA PREPARED FOR: UNIVERSITY OF PENNSYLVANIA HEALTH SYSTEM 34 CIVIC CENTER BOULEVARD PHILADELPHIA, PA 1987 (61)
IMPROVEMENT CONCEPTS
 IMPROVEMENT CONCEPTS for the South Novato Transit Hub Study Prepared by: January 11, 2010 DKS Associates With Wilbur Smith Associates IMPROVEMENT CONCEPTS Chapter 1: Introduction 1. INTRODUCTION The strategic
TRAFFIC IMPACT ANALYSIS SAFARI HIGHLANDS RANCH
 TRAFFIC IMPACT ANALYSIS SAFARI HIGHLANDS RANCH, California November 11, 2016 LLG Ref. 3-14-2334 EXECUTIVE SUMMARY The Project proposes the development of 550 luxury residential dwelling units, public trails,
Task 5.1: Existing Conditions Review and Analysis
 City of Oceanside Coast Highway Corridor Task 5.1: Existing Conditions Review and Analysis Technical Memorandum August 2014 DOCUMENT CONTROL Client: Project Name: Report Title: City of Oceanside City of
Table of Contents INTRODUCTION... 3 PROJECT STUDY AREA Figure 1 Vicinity Map Study Area... 4 EXISTING CONDITIONS... 5 TRAFFIC OPERATIONS...
 Crosshaven Drive Corridor Study City of Vestavia Hills, Alabama Table of Contents INTRODUCTION... 3 PROJECT STUDY AREA... 3 Figure 1 Vicinity Map Study Area... 4 EXISTING CONDITIONS... 5 TRAFFIC OPERATIONS...
Proposed location of Camp Parkway Commerce Center. Vicinity map of Camp Parkway Commerce Center Southampton County, VA
 Proposed location of Camp Parkway Commerce Center Vicinity map of Camp Parkway Commerce Center Southampton County, VA Camp Parkway Commerce Center is a proposed distribution and industrial center to be
Traffic Engineering Study
 Traffic Engineering Study Bellaire Boulevard Prepared For: International Management District Technical Services, Inc. Texas Registered Engineering Firm F-3580 November 2009 Executive Summary has been requested
City of Marina. Regional Roundabout Study Utilizing Caltrans Intersection Control Evaluation Section 4: Transportation Agency for Monterey County
 Regional Roundabout Study Utilizing Caltrans Intersection Control Evaluation Section 4: City of Marina Study Intersections: RESERVATION ROAD AT BEACH ROAD RESERVATION ROAD AT DEFOREST ROAD CARDOZA AVENUE
TRANSPORTATION 1. INTRODUCTION
 IV.F TRANSPORTATION 1. INTRODUCTION This section evaluates potential impacts associated with Project-related traffic, circulation, and access. The analysis summarizes the findings of the traffic study
1. INTRODUCTION 2. PROJECT DESCRIPTION CUBES SELF-STORAGE MILL CREEK TRIP GENERATION COMPARISON
 CUBES SELF-STORAGE MILL CREEK TRIP GENERATION COMPARISON 1. INTRODUCTION This report summarizes traffic impacts of the proposed CUBES Self-Storage Mill Creek project in comparison to the traffic currently
Construction Realty Co.
 MEMORANDUM TO: FROM : Jeff Pickus Construction Realty Co. Luay R. Aboona, PE Principal 9575 West Higgins Road, Suite 400 Rosemont, Illinois 60018 p: 847-518-9990 f: 847-518-9987 DATE: May 22, 2014 SUBJECT:
5.9 TRANSPORTATION AND TRAFFIC
 5.9 TRANSPORTATION AND TRAFFIC This section evaluates transportation- and traffic-related impacts that have the potential to result from the construction and operation of the Project. Information and analysis
LOTUS RANCH TRAFFIC IMPACT ANALYSIS. LLG Ref Senior Transportation Engineer & Charlene Sadiarin Transportation Engineer II
 TRAFFIC IMPACT ANALYSIS LOTUS RANCH El Centro, California April 26, 2016 LLG Ref. 3-14-2392 Prepared by: KC Yellapu, P.E Senior Transportation Engineer & Charlene Sadiarin Transportation Engineer II Under
Existing Traffic Conditions
 May 14, 2014 Ms. Lorraine Weiss City of San Mateo 330 West 20 th Avenue San Mateo, CA 94403 Subject: Traffic Operational Study for the Proposed Tilton Avenue Residential Development in San Mateo, California
Table of Contents. Traffic Impact Analysis Capital One Building at Schilling Place
 Traffic Impact Analysis Capital One Building at Schilling Place Table of Contents Executive Summary... 1 1. Introduction... 4 2. Project Description... 4 3. Background Information... 4 4. Study Scope...
Clean Harbors Canada, Inc.
 Clean Harbors Canada, Inc. Proposed Lambton Landfill Expansion Environmental Assessment Terms of Reference Transportation Assessment St. Clair Township, Ontario September 2009 itrans Consulting Inc. 260
November 1, Mr. Jafar Tabrizi President, Tabrizi Rugs 180 Bedford Highway. Traffic Impact Statement BH-1 and BH-2, Southgate Drive, Bedford, NS
 161-12598 Mr. Jafar Tabrizi President, Tabrizi Rugs 180 Bedford Highway Bedford, NS B4A 1C1 [Via Email: tabrizi@tabrizi.com] RE: Traffic Impact Statement Dear Mr. Tabrizi: Plans are being prepared for
STH 60 Northern Reliever Route Feasibility Study Report
 #233087 v3 STH 60 Northern Reliever Route Feasibility Study Report Washington County Public Works Committee Meeting September 28, 2016 1 STH 60 Northern Reliever Route Feasibility Study Hartford Area Development
Traffic Impact Analysis West Street Garden Plots Improvements and DuPage River Park Garden Plots Development Naperville, Illinois
 Traffic Impact Analysis West Street Garden Plots Improvements and DuPage River Park Garden Plots Development Naperville, Illinois Submitted by April 9, 2009 Introduction Kenig, Lindgren, O Hara, Aboona,
TRAFFIC DATA. Existing Derousse Ave./River Rd. AM LOS Analysis Existing Derousse Ave./River Rd. PM LOS Analysis
 Appendix E NJ TRANSIT Pennsauken Junction Transit Center and Park & Ride RiverLINE and Atlantic City Line Pennsauken Township, Camden County, New Jersey TRAFFIC DATA Background Traffic Information for
Section 5.0 ENVIRONMENTAL ANALYSIS
 Section 5.0 ENVIRONMENTAL ANALYSIS 5.2 TRANSPORTATION/CIRCULATION/PARKING This section evaluates potential traffic-related and parking impacts associated with the proposed project. The following discussion
APPENDIX C1 TRAFFIC ANALYSIS DESIGN YEAR TRAFFIC ANALYSIS
 APPENDIX C1 TRAFFIC ANALYSIS DESIGN YEAR TRAFFIC ANALYSIS DESIGN YEAR TRAFFIC ANALYSIS February 2018 Highway & Bridge Project PIN 6754.12 Route 13 Connector Road Chemung County February 2018 Appendix
APPENDIX VMT Evaluation
 APPENDIX 2.7-2 VMT Evaluation MEMORANDUM To: From: Mr. Jonathan Frankel New Urban West, Incorporated Chris Mendiara LLG, Engineers Date: May 19, 2017 LLG Ref: 3-16-2614 Subject: Villages VMT Evaluation
PROJECT: Wilkinson Road Corridor Improvement Traffic Management Planning Project SUBJECT: Traffic Analysis
 TECHNICAL MEMORANDUM DATE: September 10, 2014 PROJECT 5861.03 NO: PROJECT: Wilkinson Road Corridor Improvement Traffic Management Planning Project SUBJECT: Traffic Analysis TO: Steve Holroyd - District
IV. ENVIRONMENTAL IMPACT ANALYSIS B. TRAFFIC AND CIRCULATION
 IV. ENVIRONMENTAL IMPACT ANALYSIS B. TRAFFIC AND CIRCULATION 1. INTRODUCTION This section is based on the technical report, Traffic Study for 10131 Constellation Boulevard Residential Project, prepared
TRAFFIC IMPACT STUDY DERRY GREEN CORPORATE BUSINESS PARK MILTON SECONDARY PLAN MODIFICATION
 TRAFFIC IMPACT STUDY DERRY GREEN CORPORATE BUSINESS PARK MILTON SECONDARY PLAN MODIFICATION TRAFFIC IMPACT STUDY DERRY GREEN CORPORATE BUSINESS PARK MILTON SECONDARY PLAN MODIFICATION DECEMBER 24 UPDATED
Access Management Standards
 Access Management Standards This section replaces Access Control Standards on Page number 300-4 of the Engineering Standards passed February 11, 2002 and is an abridged version of the Access Management
TRAFFIC IMPACT ANALYSIS FOR. Prepared For: Din/Cal 3, Inc Richmond Avenue, Suite 200 Houston, Texas Prepared By:
 TRAFFIC IMPACT ANALYSIS FOR STERLING 5 th STREET APARTMENTS PROJECT Davis, CA Prepared For: Din/Cal 3, Inc. 3411 Richmond Avenue, Suite 200 Houston, Texas 77046 Prepared By: KD Anderson & Associates, Inc.
Los Angeles Mission College Facilities Master Plan Draft Program Environmental Impact Report 3.13 TRANSPORTATION / TRAFFIC
 3.13 TRANSPORTATION / TRAFFIC As a result of the analysis undertaken in the Initial Study for the Los Angeles Mission College Facilities Master Plan, the (LACCD) determined that the proposed project may
INTERCHANGE OPERTIONS STUDY Interstate 77 / Wallings Road Interchange
 INTERCHANGE OPERTIONS STUDY Interstate 77 / Wallings Road Interchange City of Broadview Heights, Cuyahoga County, Ohio Prepared For: City of Broadview Heights Department of Engineering 9543 Broadview Road
TRAFFIC IMPACT ANALYSIS 661 BEAR VALLEY. Escondido, California September 1, LLG Ref
 TRAFFIC IMPACT ANALYSIS 661 BEAR VALLEY Escondido, California September 1, 2015 LLG Ref. 3-13-2299 EXECUTIVE SUMMARY The Project (Project) proposes the development of 55 residential dwelling units on 40.88
IV. ENVIRONMENTAL IMPACT ANALYSIS K.2. PARKING
 IV. ENVIRONMENTAL IMPACT ANALYSIS K.2. PARKING ENVIRONMENTAL SETTING The following analysis summarizes the findings and conclusions of the Traffic Analysis (Traffic Study), prepared by The Mobility Group,
700 University Avenue Mixed-Use Development. Traffic Impact Analysis
 700 University Avenue Mixed-Use Development Traffic Impact Analysis January 20, 2006 Prepared by 700 UNIVERSITY AVENUE MIXED- USE DEVELOPMENT TRAFFIC IMPACT STUDY Table of Contents 1.0 Executive Summary...
Parks and Transportation System Development Charge Methodology
 City of Sandy Parks and Transportation System Development Charge Methodology March, 2016 Background In order to implement a City Council goal the City of Sandy engaged FCS Group in January of 2015 to update
Mountain Area Transportation Study Model Methodology and Assumptions Final
 Model Methodology and Assumptions Final February 19, 2017 Submitted to: 17J17-1768.17 Prepared by Iteris, Inc. Innovating Through Informatics TABLE OF CONTENTS 1.0 OVERVIEW... 1 1.1 Project Objective and
MEMO VIA . Ms. Amy Roth DPS Director, City of Three Rivers. To:
 MEMO To: Ms. Amy Roth DPS Director, City of Three Rivers VIA EMAIL From: Michael J. Labadie, PE Julie M. Kroll, PE, PTOE Brandon Hayes, PE, P.Eng. Fleis & VandenBrink Date: January 5, 2017 Re: Proposed
Shirk Road at State Route 198 Interchange Analysis Tulare County, California
 Shirk Road at State Route 198 Interchange Analysis Tulare County, California DRAFT REPORT Prepared By Tulare County Association of Governments (TCAG) April 2013 Table of Contents Introduction:... 3 Project
RE: A Traffic Impact Statement for a proposed development on Quinpool Road
 James J. Copeland, P.Eng. GRIFFIN transportation group inc. 30 Bonny View Drive Fall River, NS B2T 1R2 May 31, 2018 Ellen O Hara, P.Eng. Project Engineer DesignPoint Engineering & Surveying Ltd. 200 Waterfront
IV. ENVIRONMENTAL IMPACT ANALYSIS N. TRANSPORTATION AND TRAFFIC
 IV. ENVIRONMENTAL IMPACT ANALYSIS N. TRANSPORTATION AND TRAFFIC The following section summarizes the information provided in the traffic report entitled Traffic Impact Analysis for a Proposed Residential
IV. ENVIRONMENTAL IMPACT ANALYSIS L. TRANSPORTATION/TRAFFIC
 IV. ENVIRONMENTAL IMPACT ANALYSIS L. TRANSPORTATION/TRAFFIC INTRODUCTION The following section summarizes the information provided in the traffic report entitled Traffic Impact Analysis for a Proposed
BERKELEY DOWNTOWN AREA PLAN PROGRAM ENVIRONMENTAL IMPACT REPORT TRAFFIC IMPACT ANALYSIS
 BERKELEY DOWNTOWN AREA PLAN PROGRAM ENVIRONMENTAL IMPACT REPORT TRAFFIC IMPACT ANALYSIS Prepared for: City of Berkeley Prepared by: REVISED JANUARY 9, 2009 Berkeley Downtown Area Plan Program EIR Traffic
Appendix G Traffic and Parking Report
 Appendix G Traffic and Parking Report TABLE OF CONTENTS SECTION PAGE Executive Summary... v 1.0 Introduction... 1 1.1 Study Area... 3 2.0 Project Description... 4 2.1 Site Location... 4 2.2 Existing Project