Monthly Electrical Energy Overview March 2018
|
|
|
- Kristina Caldwell
- 5 years ago
- Views:
Transcription


1 March 218

2 Monthly Electrical Energy Overview March 218 March was marked by a sharp fall in average temperatures (-3.1 C compared to last year), which led to an increase in electricity demand. Electricity production continued to increase in all sectors, with the exception of conventional thermal production. Gross power demand increased by 11.6% compared to March 217. Corrected for climate factors, demand decreased. Monthly generation reached 52 TWh i.e. an increase of 4.8% compared to March 217. The increase in hydraulic generation slowed. Wind power generation exceeded 3 TWh. Solar generation remained higher with an increase of 5.6% compared to March 217. The development of renewable energies intensified with 624 new renewable energy parks in France since March 217. French prices remained stable compared to the previous month, at 48.26/MWh on average in March. The overall monthly balance remained in favour of exports this month. The instantaneous balance switched in favour of imports on ten occasions and reached 4,572 MW on 22 March. 16 facilities went into service in March: 4 substations, 8 overhead lines, 1 overhead/underground line, 1 underground line, 1 transformer, 1 compensator. Monthly Overview - March 218 2
. Demand by large industry continued its upward trend (+3.4%). GENERATION For the third consecutive time this year, the hydraulic sector increased.")
3 Monthly Electrical Energy Overview March 218 DEMAND Gross demand reached TWh, up 11.6% compared to March 217, due to an average monthly temperature that was lower by 3.1 C. Corrected for climate factors, overall demand was down (-.4%). Demand by large industry continued its upward trend (+3.4%). GENERATION For the third consecutive time this year, the hydraulic sector increased. It increased by 11.7% to reach 6.99 TWh. Renewable generation (excluding hydraulic) was also up by 12% compared with March 217. Nuclear production was up by 4.1%. Therefore fossil-fuel thermal generation was down despite an increase in heating needs. WIND AND SOLAR Wind generation was up by 17.5% compared with March and reached 3.12 TWh. The coverage rate of demand by wind generation reached 17.3%. As for solar generation, it reached.74 TWh, i.e. an increase of 5.6% compared to March 217. TERRITORIES AND REGIONS To meet the targets of the energy transition law, 624 new renewable energy parks (313 photovoltaic parks, 153 wind farms, 8 dams, 78 bioenergy centres) have been installed in various French regions since March 217. Three regions: Hauts-De-France, Nouvelle-Aquitaine, Grand-Est have created more than 5% of the new facilities overall, i.e. 1.3 GW. ELECTRICITY MARKETS The cold snap at the end of February continued during the first days of March, with a daily average French price of 84/MWh on Thursday 1 and Friday 2. Conversely, abundant wind turbine generation led to very low prices in some countries on non-working days: the German price became negative for 21 hours on the weekend of 17 and 18, and the Spanish price was less than 8/MWh as a daily average on Sunday 11 and on Friday 3, a public holiday in Spain (the wind sector covered nearly half of demand on these two days). INTERNATIONAL TRADE The export balance totalled 3.1 TWh. The import balance of trade with the CWE area was up and reached.84 TWh. The export balance of trade to Italy, Switzerland, and Great Britain was lower compared to March 217. The balance of trade was in favour of imports with Spain and totalled.73 TWh. NEW INSTALLATIONS 16 new facilities went into service in March. They were part of three projects for strengthening the security of electricity supply, two projects of the 2Loires programme, a customer connection and two infrastructure renewal projects. Monthly Overview - March 218 3
4 Monthly electrical energy overview March 218 Monthly energy consumption Monthly gross consumption % 4% 3% 3% Trend by sector in sliding year adjusted from the climate effect 3,4% 4 3 2% 2% 1% 2 1 1% % -1% -,4% -,3% Apr-17 May-17 Jun-17 Jul-17 Aug-17 Sep-17 Oct-17 Period Period Nov-17 Dec-17 Jan-18 Feb-18 Mar-18-1% Apr-17 May-17 Jun-17 Jul-17 Aug-17 Sep-17 Oct-17 Nov-17 Dec-17 Adjusted national consumption Direct RTE customers * Adjusted consumption on PDN Jan-18 Feb-18 Mar-18 *without energy sector Peak consumption* March GW 91, GW Gross monthly consumption at the peak and actual temperature C ma 1 je 3 sa 5 lu 7 me 9 ve 11 di 13 ma 15 je 17 sa 19 lu 21 me 23 ve 25 di 27 ma 29 Deviation from norm ( C) Gross consumption : daily peak (GW) Actual temperature -1 GW Evolution of monthly power extrema 12,1 GW 29,5 GW 91, GW 45,2 GW Max power Min Power Absolute max Absolute min * Perimeter France excl. Corsica, losses included Monthly Overview - March 218 4

5 Monthly electricical energy overview March 218 Installed capacity (MW) March 218 Energy generated () March 218 Hydroelectric Nuclear Conventional Thermal Hydro-electric Conventional Thermal Other RES Other RES 719 Solar 744 Nuclear Solar 7 86 Wind Wind 3122 Focus on generation sectors Nuclear generation Hydro-electric generation Apr May Jun Jul Aug Sep Oct Nov Dec Jan Feb Mar Apr May Jun Jul Aug Sep Oct Nov Dec Jan Feb Mar Period Period Period Period Fossil-fuel thermal generation RES generation excl. hydro-electric Apr May Jun Jul Aug Sep Oct Nov Dec Jan Feb Mar Apr May Jun Jul Aug Sep Oct Nov Dec Jan Feb Mar Period Period Period Period Monthly Overview - March 218 5

6 Monthly electrical energy overview March 218 Monthly generation Wind generation Photovoltaic generation Apr May Jun Jul Aug Sep Oct Nov Dec Jan Feb Mar Apr May Jun Jul Aug Sep Oct Nov Dec Jan Feb Mar Period Period Period Period % 7% 6% 5% 4% Load factor of wind generation March 218 MW ,% 25,% 2,% 15,% Rate of coverage of consumption by wind generation (%) 1.7% 3% 2% 1% ,% 5,%.6% % 3/1 3/3 3/5 3/7 3/9 3/11 3/13 3/15 3/17 3/19 3/21 3/23 3/25 3/27 3/29 3/31 Mean load factor by half-hour interval (%) and associated power Mean monthly load factor (%) and associated power,% Jan 12 Apr 12 Jul 12 Oct 12 Jan 13 Apr 13 Jul 13 Oct 13 Jan 14 Apr 14 Jul 14 Oct 14 Jan 15 Apr 15 Jul 15 Oct 15 Jan 16 Apr 16 Jul 16 Oct 16 Jan 17 Apr 17 Jul 17 Oct 17 Jan 18 Average value Maximal value Minimal value.1% Fleet development in France Planned fleet on the PTN MW Development of generating fleets in France** Jan 1 Jun 1 Nov 1 Apr 11 Sep 11 Feb 12 Jul 12 Dec 12 May 13 Oct 13 Mar 14 Aug 14 Jan 15 Jun 15 Nov 15 Apr 16 Sep 16 Feb 17 Jul 17 Dec 17 Technology Wind of which Offshore Photovoltaic Installed capacity* at 31/3/18 95 MW Nb 29 MW MW 4 Queued projects * Cumulative power Nb 1937 MW 8 48 MW 3 27 MW MW 62 MW 7 Projects in preparation* Cumulative power 376 MW Wind farm Solar photovoltaic * Refer to glossary for category definitions Wind capacity awaiting connection at Enedis as of 31/12/17: MW ** data available up to February 218 Solar capacity awaiting connection at Enedis as of 31/12/17: MW Monthly Overview - March 218 6


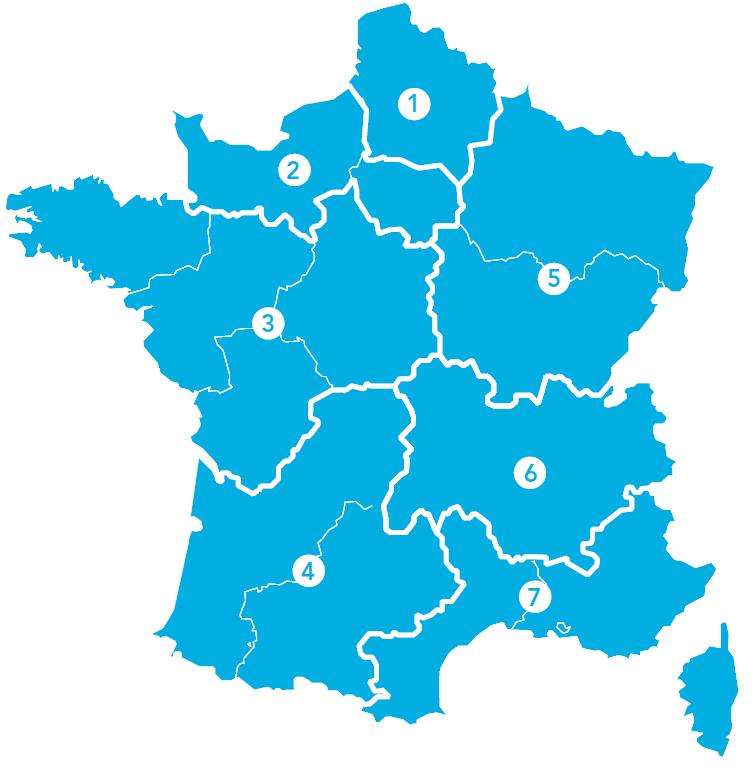
7 Aperçu Monthly mensuel electrical sur l'énergie energy électrique overview Septembre March Distribution of regional generation Distribution of regional consumption Renewable energy production of metropolitan France in March 218 The regions are on track to meet the targets of the energy transition law 624 new renewable energy parks have been installed in various French regions since March 217. That was an increase of 6% to reache GW of total renewable installed capacity. Three regions Hauts-De-France, Nouvelle-Aquitaine and Grans-Est have created more than 5% of the new facilities overall, i.e. 1.3 GW. 313 new solar parks (64 MW), of which 72 new parks in Auvergne-Rhône-Alpes i.e. 62 MW, 87new parks in Nouvelle-Aquitaine i.e. 278 MW and 51 new parks in Occitanie, generating 63 MW. 153 new wind turbine farms (1.6 GW) have been connected, including 47 wind farms in Hauts-de- France i.e. 544 MW, and 29 farms in Grand-Est, generating 279 MW. The hydraulic and bioenergy sectors are also expanding with 8 new hydraulic parks and 78 new bioenergy power plants in France. Data from GRT is updated to March 31,218 Data from GRD is updated to February 28,218 Monthly Overview - March

8 Monthly electrical energy overview March 218 Spot prices in Europe Monthly average value Actuality of Market mechanisms 48,26 Prix( /MWh) Sens du spread prix >prix FR prix <prix FR 64,56 44,36 42,38 44,84 41,89 37,96 44,96 42,93 51,82 48,7 37,36 5,74 New auction on the French capacity mechanism A new capacity auction was organised on 8 March for the 219 delivery year. 12,35 capacity certificates of.1 MW were traded at the price of 1,85 per certificate. At the first auction for 219 (last 14 December) 12,2 certificates were traded at the price of 1, each. Five other auctions will be organised in 218 for the 219 delivery year. 48,26 39,75 4,18 42,4 58,8 56,97 55,72 52,6 55,72 53,92 /MWh Daily average value evolution of the spot prices during the month Moyenne sur le mois 1-Mar 4-Mar 7-Mar 1-Mar 13-Mar 16-Mar 19-Mar 22-Mar 25-Mar 28-Mar 31-Mar Belgium Netherland France Germany/Austrich Great Britain Spain Italia (north) Monthly Overview - March 218 8

9 Monthly electrical energy overview March 218 Commercial exchanges March 218 MW 15 Daily extrema of the export balance EXPORT : IMPORT : BALANCE : Monthly exchange balances on each border 3 With CWE zone With Great Britain 25 With Switzerland avr mai juin juil août sept oct nov déc janv févr mars avr mai juin juil août sept oct nov déc janv févr mars With Italy With Spain avr mai juin juil août sept oct nov déc 3/1 3/2 3/3 3/4 3/5 3/6 3/7 3/8 3/9 3/1 3/11 3/12 3/13 3/14 3/15 3/16 3/17 3/18 3/19 3/2 3/21 3/22 3/23 3/24 3/25 3/26 3/27 3/28 3/29 3/3 3/31 janv févr mars avr mai juin juil août sept oct nov déc janv févr mars avr mai juin juil août sept oct nov déc janv févr mars Minimal balance Maximal blance The energy values described correspond to contracted exchanges on Euronext. Monthly Overview - March 218 9
 As part of the project to secure the power supply of the")
 The connection of a consumer-customer site 225kV")
 To strengthen the power supply to the urban area of")


 As part of the 2Loires project 63kV overhead line Bouleternere- Ille-sur-Tet")


10 Monthly electrical energy overview March 218 2MVA compensator Mur - De-Bretagne Cotes d'amour (22) As part of the project to secure the power supply of the Brittany region 225 kv substation Duvigneau 225kV overhead line Duvigneau - Piquage à Duvigneau Lille (59) The connection of a consumer-customer site 225kV substation 1 MVA transformer Saone 225 kv overhead line Mambelin - Saone Pontarlier - Saone Doubs (25) To strengthen the power supply to the urban area of Besançon 9 kv underground line Laitier - Rom Deux Sèvre (79) To satisfy the diffuse growth of the load and alleviate the transmission constraints observed on the 9 kv network to the south of Poitiers 63kV substation Saone Doubs (25) To strengthen the power supply to the urban area of Besançon 225kV overhead line Pratclaux - Trevas 225kV overhead/underground line Riviere - Sanssac Haute-Loire (43) As part of the 2Loires project 63kV overhead line Bouleternere- Ille-sur-Tet Bouleternere -Villefranche - De- Conflent Pyrénées orientales (66) Following the renewal of its conductors 225 kv substation Le Castellet 225 kv overhead line Castellet - Enco-De-Botte Castellet - Escaillon Var (83) As part of the creation of a 225/63 kv step to strengthen the area s power supply Overhead line Underground line Substation 63 to 15 kv Monthly Overview - March 218 1


.")
11 Nb Puissance cumulée Nb Puissance cumulée 2131 MW MW 42% 8% 238 MW 1 3 MW Monthly electrical energy overview March 218 Data sources This document relies on metered data collected by RTE and also on data sent by the french DSOs, especially erdf and EDF SEI. Monthly gross consumption Perimeter : France with Corsica, losses included Gross national demands and actual temperatures Daily peak for perimeter France excl. Corsica For more information on how actual temperatures and reference temperatures are calculated, visit RTE's website: Extreme capacity value trend Max/Min Power: Maximum/minimum power consumption in France over the month, excluding Corsica Absolute extreme value: Extreme value for consumption observed since 1st January 28 Trend by sector in sliding year adjusted from the climate effect Total consumption: Consumption of France, with Corsica, losses included. Adjusted from climate effect. Adjusted consumption on PDN: Represents the consumption of resditential and SMEs/SMIs sector. Data adjusted from weather effect. Direct RTE customers : Industrial sites connected directly to the PTN (excluding consumption at source). Energy sector is excluded Trend in sliding year : growth between the last 12 cumulative monthly values and the previous 12 Generation The "Hydro-electric" category includes all types of hydro plants (impoundment, run-of-river, etc.). Consumption for pumping by pumped storage facilities is not deducted from generation. The "Nuclear" category includes all nuclear units. Consumption by auxiliary units is deducted from generation. The "Fossil-fuel thermal" category includes Coal, Oil and Gas-fired technologies. The "Other RES" category includes PV solar, Biomass, Biogas and paper/card waste. The installed capacity values are valid for the end of the month, with the exception of the "Other RES" category, which is validfor the start of the month. Wind Generation Load factor : Ratio of wind power generated to nominal installed wind capacity Coverage of demand Coverage rate : Ratio of wind power generated to gros national consumption at a given time Puissance Filière installée Eolien 361 MW 22 dont Offshore Photovoltaïque 24 MW 9 Projets en file Projets en d'attente préparation Generation Wind: onshore and offshore wind projects. The share of offshore capacity is indicated in the row below Installed capacity: Cumulative capacity of installations for which a connection agreement has been signed. Queued projects: Projects which have entered the connection queue under RTE's connection procedure, i.e. projects which have signed a "queuing proposal" with RTE, following a detailed connection study or a "technical and financial proposal". Projects in preparation: Connection projects for which RTE has been asked to provide a detailed study or technical and financial proposal, currently being examined by RTE, or for which the Prices in Europe Monthly average of spot prices in the different price zones of the coupled area. France is always represented in white, the other areas are coloured based on the difference in price compared with France (blue: lower price, red: higher price, the deeper the colour, the greater the difference). Glossary Spot price: Wholesale price of electricity, determined by the power exchanges the day before fordelivery thefollowing day,foreach houroftheday. Spread : Price differential between two price areas (here between each price area and France). Price area: Geographic area inside which the electricity price is identical and where exchanges are done with no allocation of capacity. A price area may combine several countries (for example: Germany, Austria, Luxembourg) and a country may be subdivided into more than one price area (for example: Italy, Norway). Daily spot price changes ChangeofthespotpriceinFrance andinthe coupledneighbouring regions, over a month in daily average, (NB: for Italy the price of the northern area is shown, for Nordic countries the average of the areas displayed on the map is shown). Daily extrema : International exchanges Extrema of the half hour mean power value of the global international commercial exchanges, observed daily. Type of installation Name of installation (or substation) Département Nature of work Monthly Overview - March


12
Monthly Electrical Energy Overview
 Monthly Electrical Energy Overview February 218 February 218 Monthly Electrical Energy Overview February 218 February 218 was characterised by extremely low temperatures, 3.5 C below normal, and consequently
Monthly Electrical Energy Overview January 2018
 January 218 Monthly Electrical Energy Overview January 218 January 218 was marked both by a very strong fall in gross demand and by significant hydraulic and wind generation because of the weather conditions.
Monthly Electrical Energy Overview January 2017
 uary 217 Monthly Electrical Energy Overview uary 217 The cold spell of uary 217 caused a strong increase in gross electricity demand (+.3%) compared to uary 2. The French exchange balance was in favour
Monthly Electrical Energy Overview May 2015
 215 Monthly Electrical Energy Overview 215 Launch of Central West Europe zone (CWE) Flow-Based market coupling on 2 -the threshold of 5, MW of exchange capacity was exceeded on 22. Fossil fuel thermal
Monthly Electrical Energy Overview
 Monthly Electrical Energy Overview il 218 Monthly Electrical Energy Overview il 218 il 218 was characterised by very mild temperatures during almost the whole of the month, 2.3 C above those of il 217,
Monthly Electrical Energy Overview
 Monthly Electrical Energy Overview 218 Monthly Electrical Energy Overview 218 Moderate domestic demand and a good level of hydraulic generation enabled France to reach its highest export balance since
Monthly Electrical Energy Overview January 2015
 uary 215 Monthly Electrical Energy Overview uary 215 The return to close to normal weather conditions, as opposed to the exceptionally warm uary 214, led to a rise in gross internal electricity demand.
Monthly Electrical Energy Overview November 2017
 November 217 Monthly Electrical Energy Overview November 217 Monthly gross domestic demand fell by 1.1% compared to November 216, due to below-normal temperatures. The monthly trade balance was in favour
Monthly Electrical Energy Overview June 2016
 e 216 Monthly Electrical Energy Overview e 216 Moderate national demand and a good level of hydraulic generation allowed France to achieve a significant export balance. Corrected for weather effects, total
Monthly Electrical Energy Overview
 Monthly Electrical Energy Overview December 217 December 217 Monthly Electrical Energy Overview December 217 The weather in December 217 experienced rainfall and three winter storms. Wind generation reached
Monthly Electrical Energy Overview March 2015
 ch 215 Monthly Electrical Energy Overview ch 215 Temperatures in ch remained close to the reference temperatures leading to an increase in demand of 5%. Corrected for the climate uncertainty and continuing
Monthly Electrical Energy Overview March 2014
 ch 214 Monthly Electrical Energy Overview ch 214 ch marked the end of one of the mildest winters for electricity consumption since the winter of 24 25. The demand trend for SMIs / SMEs has moved from growth
Monthly Electrical Energy Overview
 Monthly Electrical Energy Overview Monthly Electrical Energy Overview The weather conditions in led to an increase in renewable generation compared to October 217. Gross demand increased by 1.1% compared
Monthly Electrical Energy Overview January 2014
 uary 214 Monthly Electrical Energy Overview uary 214 In uary 214, particularly warm temperatures during that period led to a strong drop in national consumption and a high monthly level of exchanges. In
Monthly Electrical Energy Overview April 2015
 il 215 Monthly Electrical Energy Overview il 215 Temperatures in il 215 were milder than the reference temperatures (+.6 C), and are close to those noted in il 214. It was noted that demand, generation
Monthly Electrical Energy Overview April 2016
 il 216 Monthly Electrical Energy Overview il 216 Anincreasein gross consumption is observed on april, for the second consecutive month, because of lower temperatures. The difference in temperature is reflected
Monthly Electrical Energy Overview October 2017
 October 217 Monthly Electrical Energy Overview October 217 Monthly gross domestic demand fell by 5.2% compared to October 216, due to above-normal temperatures. The monthly trade balance was in favour
Monthly Electrical Energy Overview December 2016
 December 216 Monthly Electrical Energy Overview December 216 Demand in December 216 was higher by more than 13% compared to December 215, due to the significantly lower temperatures. The balance of exchanges
Monthly Electrical Energy Overview July and August 2018
 July and August 218 Monthly Electrical Energy Overview July and August 218 Heatwave conditions in July and August led to an increase in demand compared to the same period of 217. The sunshine has led to
Monthly Electrical Energy Overview July & August 2017
 July & August 217 Monthly Electrical Energy Overview July & August 217 Demand was stable compared to July and August 216. The average temperatures were close to those of 216:+.3 C in July and -.6 C in
Monthly Electrical Energy Overview January 2016
 uary 216 Monthly Electrical Energy Overview uary 216 Thanks to good weather conditions, two new records were achieved in uary: that of the highest monthly level of wind generation and the highest monthly
Monthly Electrical Energy Overview
 Monthly Electrical Energy Overview Monthly Electrical Energy Overview Electricity demand totalled 47.6 TWh (+3.7 TWh compared to the previous month) due in particular to average temperatures that were
Monthly Electrical Energy Overview October 2014
 ober 214 Monthly Electrical Energy Overview ober 214 Interconnections were particularly called upon during ober, for imports and exports alike. High temperatures led to relatively moderate demand for a
Monthly Electrical Energy Overview October 2015
 ober 215 Monthly Electrical Energy Overview ober 215 ober saw an increase in demand as a result of temperatures that were well below seasonal averages. To meet this demand thermal production was required,
Security of Supply. on the European Electricity Market
 Security of Supply on the European Electricity Market What is Security of Supply? A reliable supply of energy Reliable transportation of supply Reliable distribution and delivery of supply to the final
MANAGING CRITICAL GRID SITUATIONS A MARKET ANALYSIS
 MANAGING CRITICAL GRID SITUATIONS A MARKET ANALYSIS MARKET ANALYSIS ANNEX TO THE ENTSO-E MAY 217 REPORT ON MANAGING CRITICAL GRID SITUATIONS: SUCCESS AND CHALLENGES NOVEMBER 217 European Network of Transmission
Commercial-in-Confidence Ashton Old Baths Financial Model - Detailed Cashflow
 Year 0 1 2 3 4 5 6 7 8 9 10 11 12 13 Oct-16 Nov-16 Dec-16 Jan-17 Feb-17 Mar-17 Apr-17 May-17 Jun-17 Jul-17 Aug-17 Sep-17 Oct-17 2,038 2,922 4,089 4,349 6,256 7,124 8,885 8,885 8,885 8,885 8,885 8,885 9,107
Storage in the energy market
 Storage in the energy market Richard Green Energy Transitions 216, Trondheim 1 including The long-run impact of energy storage on prices and capacity Richard Green and Iain Staffell Imperial College Business
Elia System and market overview 2010
 Elia System and market overview 2010 Table of contents I. System and grid management and market data 01 I.1 Energy balance on the Elia grid in 2010 01 I.2 Consumption recovers in Elia control area in 2010
Analysis and dashboards on GRTgaz transmission activity. August 2014
 Analysis and dashboards on GRTgaz transmission activity August 214 1 A total of 127 shippers at end August 214 774 delivery points to industrial customers at end August 214, for contracted capacities of
Table of Contents... i List of Tables... vi List of Figures... x List of Abbreviations... xiv
 Table of Contents Table of Contents Table of Contents... i List of Tables... vi List of Figures... x List of Abbreviations... xiv Introduction... 1 Operating Support Incentives... 1 Feed-in Tariffs...
20 January Road Safety in Provisional results. Manuelle SALATHÉ Head of the French Road Safety Observatory (ONISR)
") 20 January 2014 Road Safety in 2013 Provisional results Manuelle SALATHÉ Head of the French Road Safety Observatory (ONISR) 1 Table of contents 1. Provisional results in 2013 2. Long trends 3. 10-year
20 January 2014 Road Safety in 2013 Provisional results Manuelle SALATHÉ Head of the French Road Safety Observatory (ONISR) 1 Table of contents 1. Provisional results in 2013 2. Long trends 3. 10-year
Asahi World Environmental Forum 14 September Global trends in clean energy investment. Michael Liebreich Chief Executive
 Asahi World Environmental Forum 14 September 2010 Global trends in clean energy investment Michael Liebreich Chief Executive Bloomberg New Energy Finance, 2004-2010 Global total new investment in clean
Monthly Operating Report. February 2018
 Monthly Operating Report February 2018 February overview» For the month of February 2018 Contact recorded: Electricity and gas sales of 534 GWh (February 20: 551 GWh) Netback of $82.16/MWh (February 20:
EUROPEAN ENERGY MASTER CLASS
 EUROPEAN ENERGY MASTER CLASS Energy & Risk Management Services Matthew Osborne Principal Risk Manager Frans La Grand European Manager OUR PAN-EUROPEAN CAPABILITY Whilst most European markets are now liberalised,
Analysis and dashboards on GRTgaz transmission activity. October 2015
 Analysis and dashboards on GRTgaz transmission activity October 215 1 A total of 13 shippers at end October 215 766 delivery points to industrial customers at end of October 215. for contracted capacities
Economics of Integrating Renewables DAN HARMS MANAGER OF RATE, TECHNOLOGY & ENERGY POLICY SEPTEMBER 2017
 Economics of Integrating Renewables DAN HARMS MANAGER OF RATE, TECHNOLOGY & ENERGY POLICY SEPTEMBER 2017 Presentation Outline Understanding LPEA s expenses and what drives them Economics of net metering
The role of Transmission System Operator in Belgium and in Europe. Vlerick Alumni Event 26 January 2016
 The role of Transmission System Operator in Belgium and in Europe Vlerick Alumni Event 26 January 2016 Agenda Introduction Infrastructure management Controlling the system Developing the EU Market 1/25/2016
D G A G R I D A S H B O A R D : T O M A T O E S Last update: EU AVG PRICES
 tonnes Weightedaverages by volume of production per MS Ongoing adjustments on weights by variety group 000 tonnes D G A G R I D A S H B O A R D : T O M A T O E S Last update: 20.04.2018 EU AVG PRICES MS
Analysis and dashboards on GRTgaz transmission activity. July 2015
 Analysis and dashboards on GRTgaz transmission activity July 215 1 A total of 128 shippers at end July 215 766 delivery points to industrial customers at end of july 215. for contracted capacities of 917
The impact of electric vehicle development on peak demand and the load curve under different scenarios of EV integration and recharging options
 The impact of electric vehicle development on peak demand and the load curve under different scenarios of EV integration and recharging options Electricity demand in France: a paradigm shift Electricity
Analysis and dashboards on GRTgaz transmission activity. May 2013
 Analysis and dashboards on GRTgaz transmission activity May 213 1 A total of 97 shippers at end May 213 789 delivery points to industrial customers at end May213, for contracted capacities of 993 GWh/day,
Large scale solar power plant in Nordic conditions. Antti Kosonen, Jero Ahola, Christian Breyer, Albert Albó
 Large scale solar power plant in Nordic conditions Antti Kosonen, Jero Ahola, Christian Breyer, Albert Albó 25.8.214 Finland Finland: Location: between latitudes of 6 7 Area: 338 435 km 2 Population: 5.4
EU Market Situation for Poultry. Committee for the Common Organisation of the Agricultural Markets 22 October 2015
 EU Market Situation for Poultry Committee for the Common Organisation of the Agricultural Markets 22 October 215 Euro Dollar exchange rate 1.6 22/9/215: 1 EUR = 1.12 USD 1.4 1.2 1. Exchange rate: Spot,
Monthly Operating Report. January 2019
 Monthly Operating Report January 2019 January overview For the month of January 2019» The Customer business recorded: Mass market electricity and gas sales of 281 GWh (January 20: 282 GWh) Mass market
Operational Opportunities to Minimize Renewables Curtailments
 Operational Opportunities to Minimize Renewables Curtailments Clyde Loutan Principal, Renewable Energy Integration July 24, 2017 2017 CAISO - Public Page 1 Agenda Background Real-time control performance
COMPARISON OF FIXED & VARIABLE RATES (25 YEARS) CHARTERED BANK ADMINISTERED INTEREST RATES - PRIME BUSINESS*
 CHARTERED BANK ADMINISTERED INTEREST RATES - PRIME BUSINESS*") COMPARISON OF FIXED & VARIABLE RATES (25 YEARS) 2 Fixed Rates Variable Rates For Internal Use Only. FIXED RATES OF THE PAST 25 YEARS AVERAGE RESIDENTIAL MORTGAGE LENDING RATE - 5 YEAR* (Per cent) Year
COMPARISON OF FIXED & VARIABLE RATES (25 YEARS) 2 Fixed Rates Variable Rates For Internal Use Only. FIXED RATES OF THE PAST 25 YEARS AVERAGE RESIDENTIAL MORTGAGE LENDING RATE - 5 YEAR* (Per cent) Year
COMPARISON OF FIXED & VARIABLE RATES (25 YEARS) CHARTERED BANK ADMINISTERED INTEREST RATES - PRIME BUSINESS*
 CHARTERED BANK ADMINISTERED INTEREST RATES - PRIME BUSINESS*") COMPARISON OF FIXED & VARIABLE RATES (25 YEARS) 2 Fixed Rates Variable Rates FIXED RATES OF THE PAST 25 YEARS AVERAGE RESIDENTIAL MORTGAGE LENDING RATE - 5 YEAR* (Per cent) Year Jan Feb Mar Apr May Jun
COMPARISON OF FIXED & VARIABLE RATES (25 YEARS) 2 Fixed Rates Variable Rates FIXED RATES OF THE PAST 25 YEARS AVERAGE RESIDENTIAL MORTGAGE LENDING RATE - 5 YEAR* (Per cent) Year Jan Feb Mar Apr May Jun
Graph #1. Micro-Generation Generating Units in Alberta 20
 2, Graph #1. Micro-Generation Generating Units in Alberta 2 Cumulative # of Generating Units 1,9 1,8 1,7 1,6 1,5 1,4 1,3 1,2 1,1 1, 9 8 7 6 5 4 3 2 Number of MGG Units as of 216 Mar 31 Number of Solar
Monthly Operating Report. September 2016
 Monthly Operating Report September 20 September overview» For the month of September 20 Contact recorded: Electricity, gas and steam sales of 819 GWh (September 2015: 821 GWh) Netback of $79.50/MWh (September
Analysis and dashboards on GRTgaz transmission activity. June 2015
 Analysis and dashboards on GRTgaz transmission activity June 215 1 A total of 128 shippers at end June 215 767 delivery points to industrial customers at end of june 215. for contracted capacities of 918
Operational Overview. Operational Forum, 24 th March 2010
 Operational Overview Operational Forum, 24 th March 21 Weather Weather February 21 The cold weather continued throughout February with all but one day being colder than the 17-year seasonal normal CWV.
Monthly Operating Report. December 2017
 Monthly Operating Report December 20 December overview» For the month of December 20 Contact recorded: Electricity and gas sales of 571 GWh (December 2016: 582 GWh) Netback of $79.23/MWh (December 2016:
ANCR CRU Statistics February 2007 to December 2007
 ANCR CRU Statistics February 2007 to December 2007 o Jan/07 Feb/07* Mar/07 Apr/07 May/07 Jun/07 Jul/07 Aug/07 Sep/07 Oct/07 Nov/07 Dec/07 Total notes data from Perimeter phone system unavailable prior
December. Next release: 13 February Oct/Sep Nov/Oct Dec/Nov Janu19 January Febru13 February 2018 Oct/Sep Nov/Oct Dec/Nov 2017
 Oct/Sep Nov/Oct Dec/Nov 2017 19 Janu19 January 2018 13 Febru13 February 2018 Oct/Sep Nov/Oct Dec/Nov 2017 Next release: 13 February 2018 DecembDecember December TABLE OF CONTENTS Page Charts 1 Latest IEA
Midwest Association of Rail Shippers
 January 13, 2016 Midwest Association of Rail Shippers Lance Fritz Chairman and CEO Union Pacific 1 2015 Economic Results Consumer-driven growth 1 Consumer Spending 2 Light Vehicle Sales 3.6% 3.0% 3.0%
MARKET NEWS for pig meat
 MARKET NEWS for pig meat Market analysis 4 July 2016 Week 27 MARKET SITUATION Europe: Trade in pork legs took place at slightly rising prices this week. Loins and collars as well as other cuts were traded
What is the Future of Competitive Markets? Some Fundamental Preliminaries and View from Events in the PJM Market
 What is the Future of Competitive Markets? Some Fundamental Preliminaries and View from Events in the PJM Market Paul M. Sotkiewicz, Ph.D President December 7, 2016 What are the ideal properties of competitive
D G A G R I D A S H B O A R D : A P P L E S
 75 79 60 56 49 74 65 59 54 42 76 63 58 53 78 55 42 43 79 44 81 63 47 83 64 59 53 48 Sources: Eurostat, MSs notifications, DG Agri, Comext, Comtrade, GTA, ITC, AMI, Expert groups, Freshfel, Wapa. 89 68
Monthly Report on the Electricity System
 September 218 Monthly Report on the Electricity System September 218 Monthly Report on the Electricity System page 5 The Focus of this month provides a summary of the analysis of the 217 statistical data
The Energy Market 2004
 The Energy Market 24 Electrical energy generated by Swedish nuclear power per inhabitant in 21 compared to other countries kwh/inhabitant 9 8 7 6 5 4 3 2 1 Sweden Belgium Finland France Slovakia Spain
Global Monthly February 2018
 Global Monthly February 18 3 1-year Treasury yields 1-year breakeven inflation rate 1 1 15 16 17 18 February 18 5 3 Global GDP growth Composite PMI (RHS) Index 56 5 5 1 5 1 13 1 15 16 17 18 3..5. 1.5 1.
December 2018 RenewableGenerations Monthly Report
 2018 RenewableGenerations Monthly Report Ecosystem of Clean Energy Programs Contractor Training Webinar Table of Contents Solar Electric... 3 Solar Thermal Heating (Northern Nevada Gas Customers)... 5
MONTHLY PERFORMANCE DASHBOARD
 AUSTIN ENERGY MARCH 21 MONTHLY PERFORMANCE DASHBOARD A report highlighting key Austin Energy metrics for uary FY 21 FINANCIAL HEALTH Standard and Poor s Bond Rating Current AA AA Budget Based Revenues
Committee for the Common Organisation of the Agricultural Market Market Situation for Sheep & Goat Meats 22 March 2018
 Committee for the Common Organisation of the Agricultural Market Market Situation for Sheep & Goat Meats 22 March 218 Production In ' tonnes carcase weight P R O D U C T I O N 297.4 114.8 8.9 67.1 51.3
Montana Renewable Energy Association
 Montana Renewable Energy Association Mission & Focus areas: Education and Outreach Policy and Advocacy Industry Engagement www.montanarenewables.org SolSmart Solar Ready communities making process of going
The Electric Power System
 The Electric Power System - Sweden- Swedish Power System 1 2 Basic facts 2014 Area: 450 295 km 2 Population: 9.6 Million Number of electricity consumers: 5.3 Million Number of TSOs: 1 Number of DSOs: 170
282m 75% +575m. Net sales Operating income before non-recurring items. Operating margin before non-recurring items. Net Loss.
 First-Half 2009 Financial Highlights Net sales Operating income before non-recurring items Operating margin before non-recurring items Net Loss Net debt-to-equity ratio Free cash flow** 7,134m 282m 4.0%
System Status Briefing
 System Status Briefing Phakamani Hadebe Interim Group Chief Executive 3 May 2018 Contents 1 Performance summary 2 Operational highlights 3 Generation performance 4 Distribution overview 5 Transmission
Conditions for making competition work in the Central European electricity market
 Conditions for making competition work in the Central European electricity market Dr. Reinhard HAAS Institute of Power Systems and Energy Economics, Vienna University of Technology 7th European IAEE conference,
November. Next release: 19 January Sep/AugOct/Sep Nov/Oct Dec 14 December Janu 19 January 2018 Sep/AugOct/Sep Nov/Oct 2017
 Sep/AugOct/Sep Nov/Oct 2017 14 Dec 14 December 2017 19 Janu 19 January 2018 Sep/AugOct/Sep Nov/Oct 2017 Next release: 19 January 2018 NovembNovember November Monthly Oil Price Statistics TABLE OF CONTENTS
Growth cycles in Industrial production (IIP) (percentage deviation from trend*, seasonally adjusted) Jan-00 Aug-06 Sep-94. Dec-01.
 (percentage deviation from trend*, seasonally adjusted) Jan-00 Aug-06 Sep-94. Dec-01.") Chile The reference series The reference series used for constructing OECD Composite ing Indicator (CLI) for Chile is the index of production in total manufacturing, which is a proxy for the monthly index
Chile The reference series The reference series used for constructing OECD Composite ing Indicator (CLI) for Chile is the index of production in total manufacturing, which is a proxy for the monthly index
MONTHLY PERFORMANCE DASHBOARD
 AUSTIN ENERGY JULY MONTHLY PERFORMANCE DASHBOARD A report highlighting key Austin Energy metrics for e FY FINANCIAL HEALTH Standard and Poor s Bond Rating Austin Energy Rating AA AA Budget Based Revenues
Committee for the Common Organisation of the Agricultural Market Market Situation for Sheep & Goat Meats 21 Septembre 2017
 Committee for the Common Organisation of the Agricultural Market Market Situation for Sheep & Goat Meats 21 Septembre 217 Production P R O D U C T I O N In ' tonnes carcase weight 14.1 58.4 43.8 3.6 29.2
NJ Solar Market Update As of 6/30/15
 NJ Solar Market Update As of 6/30/ Prepared by Charlie Garrison July 17, 20 SOLAR INSTALLED CAPACITY DATA The preliminary installed solar capacity as of 6/30/ is approximately 1,500.7 MW. Approximately
MONTHLY PERFORMANCE DASHBOARD
 AUSTIN ENERGY MONTHLY PERFORMANCE DASHBOARD A report highlighting key Austin Energy metrics for uary FY 219 FINANCIAL HEALTH Standard and Poor s Bond Rating Austin Energy Rating AA AA Budget Based Revenues
North-South Interconnections in Central-East and South- East Europe
 European Network of Transmission System Operators for Electricity North-South Interconnections in Central-East and South- East Europe Building power bridges between Eastern and Western Europe; relieving
Electricity Networks Inter-regional market co-ordination (Session 8)
") Electricity Networks Inter-regional market co-ordination (Session 8) Dennis Volk Electricity Analyst Electricity System Training Week, Bangkok, November 2013 Theoretical benefits of inter-regional approaches
Electricity Networks Inter-regional market co-ordination (Session 8) Dennis Volk Electricity Analyst Electricity System Training Week, Bangkok, November 2013 Theoretical benefits of inter-regional approaches
Global Monthly March 2019
 Global Monthly March 19 Percent of world bonds outstanding 3 5 15 5 Jan-1 Jun-1 Nov-1 Apr-15 Sep-15 Feb-1 Jul-1 Dec-1 May-17 Oct-17 Mar-1 Aug-1 Dec-1 Mar-19 March 19 Percent, year-on-year 7 5 3 1 1Q1 1Q
Gas Insecurity: A Figment of the Imagination? Peter Davies. Chief Economist, BP EPRG. Cambridge. 19 May, 2006
 Gas Insecurity: A Figment of the Imagination? Peter Davies. Chief Economist, BP EPRG. Cambridge. 19 May, 2006 BP 2006 2 Gas Security What is it? Does the UK have it? What is going to change? What can we
ANCR CRU Statistics Februa.. to December 2007
 ANCR CRU Statistics Februa.. to December 2007 Jan/07 Feb/07* Mar/07 Apr/07 May/07 Jun/07 Jul/07 Aug/07 Sep/07 Oct/07 Nov/07 Dec/07 Total notes Answered dato from Perimeter phone system unavailable prior
ENERGY STORAGE. Integrating Renewables thanks to Consumers Flexibility. Energy Pool Développement SAS
 ENERGY STORAGE Integrating Renewables thanks to Consumers Flexibility 1 Introduction to Energy Pool The leading European Demand Response Operator YOUNG, FAST DEVELOPING COMPANY 2009 2010 2013 Company set
MONTHLY PERFORMANCE DASHBOARD
 AUSTIN ENERGY MONTHLY PERFORMANCE DASHBOARD A report highlighting key Austin Energy metrics for ember FY 219 FINANCIAL HEALTH Standard and Poor s Bond Rating Austin Energy Rating AA AA Budget Based Revenues
Northern European power system scenarios for EMPS 2010 to 2030
 Stefan Jaehnert Northern European power system scenarios for EMPS 21 to 23 Brukermøte Produksjonsplanlegging 22. Mai 213 1 Outline 1. Basic modelling assumption Northern Europe 2. 23 scenario development
FLEXIBILITY & NUCLEAR ENERGY MANAGEMENT IN FRANCE
 FLEXIBILITY & NUCLEAR ENERGY MANAGEMENT IN FRANCE with increasing shares of intermittent renewable electricity in the generation mix IAEA Thursday 5 th September 2013 François FARRUGGIA EDF Head of Short-Term
US Crude Oil Reshaping International Crude Oil Flows. Olivier Jakob,
 US Crude Oil Reshaping International Crude Oil Flows Olivier Jakob, ojakob@petromatrix.com www.petromatrix.com Claimer Petromatrix publishes since 2006 a daily market note on the oil markets Our reports
Update on the Philippine Wholesale Electricity Spot Market
 Update on the Philippine Wholesale Electricity Spot Market A Presentation to the APEx Asia Pacific Conference New Delhi, India 1 Presentation WESM Overview 2010 Market Results Market Outlook 2 WESM Overview
The Electric Power System
 The Electric Power System - Thailand - Thailand Power System 1 Basic facts Area: 513,000 km 2 (198,000 sq mi), Population: 65,931,550 (2016) Number of electricity consumers (2016): 22.5 million households
ENEL PUBLISHES 2018 SECOND QUARTER AND FIRST HALF GROUP OPERATING DATA REPORT
 Media Relations Investor Relations T +39 06 8305 5699 T +39 06 8305 7975 F +39 06 8305 3771 F +39 06 8305 7940 ufficiostampa@enel.com investor.relations@enel.com enel.com enel.com ENEL PUBLISHES 2018 SECOND
Renewable Energy Policy in Japan
 Renewable Energy Policy in Japan Kenji Kimura February 6, 2018 Researcher, New and Renewable Energy Group The Institute of Energy Economics, Japan IEEJ Feb. 2018 Table of Contents 1 Ⅰ. Status of Japan
NEU Electric and Natural Gas Price Update
 Exelon s $24 Billion Energy Bill Senate Bill 2814 Short-Term Energy Price Outlook On November 15, 2016, Exelon, through its legislative supporters, introduced Senate Bill 2814, a massive 446 page document
NJ Solar Market Update
 NJ Solar Market Update April 16, 20 Renewable Energy Committee Meeting Trenton, NJ Prepared by Charlie Garrison Solar Installed Capacity Data The preliminary installed solar capacity as of 3/31/ is approximately
Respect for customers, partners and staff. Service: another name for the respect that a company owes its customers, partners and staff.
 Respect for customers, partners and staff Service: another name for the respect that a company owes its customers, partners and staff. Vehicle glass KEY FIGURES (in EUR million) 2004 2003 % change Total
Up and Down Months of the Stock Market
 Up and Down Months of the Stock Market 1926-2017 Positive years (66) in the stock market were not good all year long and losing years (24) were not losers throughout the year. Winning years produce losing
Alfen acquires Elkamo in Finland A platform for expansion in the Nordics
 Alfen acquires Elkamo in Finland A platform for expansion in the Nordics 2 July 2018 Disclaimer This communication may include forward-looking statements. All statements other than statements of historical
PDR Energy Baseline Alternative. Proposal for Discussion October 27, 2015
 PDR Energy Baseline Alternative Proposal for Discussion October 27, 2015 Update Since Last Meeting Since the October 12 th Working Group Meeting Stem, Solar City, AMS and CESA have had over a half-dozen
Energy use in potato stores
 Energy use in potato stores Adrian Cunnington PCL Sutton Bridge Potato Council Energy Forum Huntingdon 11 February 2010 Storage costs Fixed (capital) costs Variable (running) costs Finance costs Potato
WIM #29 was operational for the entire month of October Volume was computed using all monthly data.
 OCTOBER 2015 WIM Site Location WIM #29 is located on US 53 near Cotton in St Louis county. System Operation WIM #29 was operational for the entire month of October 2015. Volume was computed using all monthly
WinnCompanies Community Solar Photovoltaic to Benefit Affordable Housing Darien Crimmin Vice President of Energy & Sustainability
 WinnCompanies Community Solar Photovoltaic to Benefit Affordable Housing Darien Crimmin Vice President of Energy & Sustainability dcrimmin@winnco.com Massachusetts Solar Policy SREC I Program 2010 through
This presentation was given as part of a workshop on February 7, Presenters were:
 This presentation was given as part of a workshop on February 7, 2018. Presenters were: Andrew Valainis, Montana Renewable Energy Association Bryan Von Lossberg, Renewable Energy Consultant Paul Herendeen,