Energy use in potato stores
|
|
|
- Amanda Dalton
- 5 years ago
- Views:
Transcription
1 Energy use in potato stores Adrian Cunnington PCL Sutton Bridge Potato Council Energy Forum Huntingdon 11 February 2010
2 Storage costs Fixed (capital) costs Variable (running) costs Finance costs Potato Review Nov/Dec 2009 But most visible and major running cost in potato stores is energy, i.e. electricity
3 Energy cost profile Electricity costs are volatile Source: FEC
4 Energy cost profile But general trend is upward Relative cost Source: NAO
5 Storage costs Electricity contributes around 60% of variable costs (excluding storage losses) and 10-40% of total costs, depending on circumstances Important to know how efficient your storage is and how you can improve it
6 PCL project: assessing use Undertaken by Farm Energy and Sutton Bridge on commercial stores Eight closely-monitored stores over two seasons Further 25 stores monitored in last year on a monthly basis Spread of store qualities and uses Analysed by store type and end market

7 Sub-metering FEC Just increasing awareness can yield immediate gains of up to 10%
8 Measurements: kwh Analyse consumption per tonne this relates directly to sales Or per tonne per day this helps to compare store performance Analysis is problematic where stores are used dynamically with partial loading/unloading or regular movement of crop in and out but it does highlight inefficiencies
9 Results: processing Number of days stored 0.20 kwh / tonne kwh / tonne / day O I N K S Store 4 Store 1 R Store 2 P Q Store 3 Store identifier 0.00 kwh per tonne kwh/ tonne / Day
10 Processing stores kwh/100t/day 2007/ October November December January February March April 2008/ PR1 PR2 PR3 PR4 PR1 PR2 PR3 PR4
11 Results: processing kwh / tonne trend Aug-08 Sep-08 Oct-08 Nov-08 Dec-08 Jan-09 Feb-09 Mar-09 Apr-09 May-09 Jun-09 Store 1 Store 2 Store 3 Store 4
12 Results: processing Wide range of energy usage Linked closely to crop quality Excluding problem crops, usage can still vary by factor of 3 or 4 Plenty of scope for looking at reductions or optimisation

13 Results: cold stores Number of days stored kwh / tonne kwh / tonne/ day Y W AD AH X Store 8 T AC AE U Store 7 Z Store 5 V AA Store 6 AJ AG 0.00 kwh per tonne kwh / tonne / day Store identifier
14 Cold stores kwh/100t/day 2007/ October November December January February March April 2008/ PP1 PP2 PP3 PP PP1 PP2 PP3 PP4
15 Results: cold stores trend Energy consumption trend kwh / tonne Aug-08 Sep-08 Oct-08 Nov-08 Dec-08 Jan-09 Feb-09 Mar-09 Apr-09 May-09 Jun-09 Store 5 Store 6 Store 7 Store 8
16 Results: cold stores Pull-down load predominates Daily energy use can be modest in fully loaded, well insulated stores But use of stores when part-filled meant spot consumption was actually as high as 39.9 kwh/month or 4/tonne!

17 Results: cold stores
18 Champion stores Need to know factors which have greatest influence on energy costs Management is the biggest one! Season is also significant. This year our project is focusing on identifying other key attributes of lower cost stores Aim to model best stores and highlight further benefits which you can share
19 Trends kwh / tonne trend optimal? Aug-08 Sep-08 Oct-08 Nov-08 Dec-08 Jan-09 Feb-09 Mar-09 Apr-09 May-09 Jun-09 Store 1 Store 2 Store 3 Store 4
20 Optimising stores Most efficient stores are likely to feature: Inverter drives Offer significant savings if fans are suitable eg at 80% of max speed use just 50% of power Adiabatic cooling Humidification also removes heat: allows ambient air at or above crop temperature to be used for cooling Variable differentials High quality insulation & sealing
21 Optimal stores Most efficient stores are likely to feature: - Positive ventilation Worth considering to achieve positive ventilation? Not with solid-sided boxes! - Separate delivery & return air This helps to prevent short-circuits and hunting in box stores without positive systems - Planned consideration of energy use

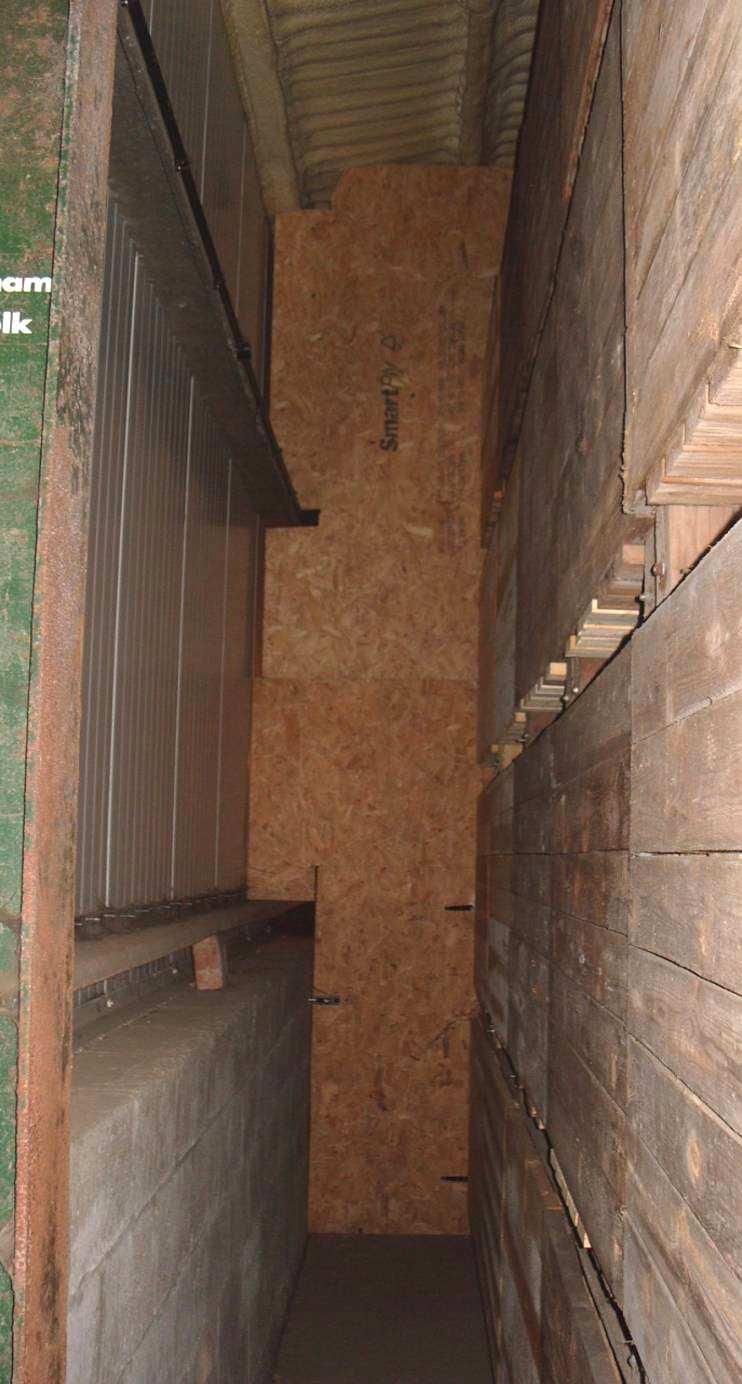
22 Separators
23 Ambient air availability 2008/ Oct 13 Oct 20 Oct 27 Oct 03 Nov 10 Nov 17 Nov 24 Nov 01 Dec 08 Dec 15 Dec 22 Dec 29 Dec 05 Jan 12 Jan 19 Jan 26 Jan 02 Feb 09 Feb 16 Feb 23 Feb 02 Mar 09 Mar 16 Mar 23 Mar 30 Mar 06 Apr 13 Apr 20 Apr Average Daily hours 27 Apr Hours available* Week commencing 9.5 DegC 8 DegC 3.5 DegC 2.5 DegC *assumes 2 C differential required
24 Future options Wider use of energy-saving technologies eg inverters, defrost on demand etc Smarter control Sustainable construction Renewable energy sources Wind: turbines Solar: photo volteics Ground source AD

25 Acknowledgements Potato Council Jon Swain, Tim Pratt & Andrew Kneeshaw at Collaborating growers and store managers Simon Alexander
26 Summary Move energy up your agenda Measure your usage so you know where you stand Consider your markets needs if making changes Keep up to date at
27
Commercial-in-Confidence Ashton Old Baths Financial Model - Detailed Cashflow
 Year 0 1 2 3 4 5 6 7 8 9 10 11 12 13 Oct-16 Nov-16 Dec-16 Jan-17 Feb-17 Mar-17 Apr-17 May-17 Jun-17 Jul-17 Aug-17 Sep-17 Oct-17 2,038 2,922 4,089 4,349 6,256 7,124 8,885 8,885 8,885 8,885 8,885 8,885 9,107
GAZIFÈRE INC. Prime Rate Forecasting Process 2017 Rate Case
 Overview A consensus forecast is used to estimate the prime rate charged by commercial banks. As the prime rate is subject to competitive pressures faced by individual lenders and is set on an individual
COMPARISON OF FIXED & VARIABLE RATES (25 YEARS) CHARTERED BANK ADMINISTERED INTEREST RATES - PRIME BUSINESS*
 CHARTERED BANK ADMINISTERED INTEREST RATES - PRIME BUSINESS*") COMPARISON OF FIXED & VARIABLE RATES (25 YEARS) 2 Fixed Rates Variable Rates For Internal Use Only. FIXED RATES OF THE PAST 25 YEARS AVERAGE RESIDENTIAL MORTGAGE LENDING RATE - 5 YEAR* (Per cent) Year
COMPARISON OF FIXED & VARIABLE RATES (25 YEARS) 2 Fixed Rates Variable Rates For Internal Use Only. FIXED RATES OF THE PAST 25 YEARS AVERAGE RESIDENTIAL MORTGAGE LENDING RATE - 5 YEAR* (Per cent) Year
COMPARISON OF FIXED & VARIABLE RATES (25 YEARS) CHARTERED BANK ADMINISTERED INTEREST RATES - PRIME BUSINESS*
 CHARTERED BANK ADMINISTERED INTEREST RATES - PRIME BUSINESS*") COMPARISON OF FIXED & VARIABLE RATES (25 YEARS) 2 Fixed Rates Variable Rates FIXED RATES OF THE PAST 25 YEARS AVERAGE RESIDENTIAL MORTGAGE LENDING RATE - 5 YEAR* (Per cent) Year Jan Feb Mar Apr May Jun
COMPARISON OF FIXED & VARIABLE RATES (25 YEARS) 2 Fixed Rates Variable Rates FIXED RATES OF THE PAST 25 YEARS AVERAGE RESIDENTIAL MORTGAGE LENDING RATE - 5 YEAR* (Per cent) Year Jan Feb Mar Apr May Jun
FOR IMMEDIATE RELEASE
 Article No. 5842 Available on www.roymorgan.com Roy Morgan Unemployment Profile Thursday, 2 October 2014 Unemployment climbs to 9.9% in September as full-time work lowest since October 2011; 2.2 million
FOR IMMEDIATE RELEASE
 Article No. 7761 Available on www.roymorgan.com Roy Morgan Unemployment Profile Monday, 8 October 2018 Unemployment down to 9.4% in September off two-year high Australian employment has grown solidly over
FOR IMMEDIATE RELEASE
 Article No. 7845 Available on www.roymorgan.com Roy Morgan Unemployment Profile Friday, 18 January 2019 Unemployment in December is 9.7% and under-employment is 8.8% FOR IMMEDIATE RELEASE Australian unemployment
TABLE C-43. Manufacturers' new and unfilled orders, {Amounts in millions of dollars] Nondurable. Capital goods. Total. goods.
![TABLE C-43. Manufacturers' new and unfilled orders, {Amounts in millions of dollars] Nondurable. Capital goods. Total. goods.](/thumbs/93/112603708.jpg "TABLE C-43. Manufacturers' new and unfilled orders, {Amounts in millions of dollars] Nondurable. Capital goods. Total. goods.") TABLE C-43. Manufacturers' new and unfilled orders, -74 {Amounts in millions of dollars] New orders t, I960. 27, 559 26, 903 30,672 30,115 31,086 33,005 35,322 37,952 41, 803 45, 944 46,763 50, 243 53,
TABLE C-43. Manufacturers' new and unfilled orders, -74 {Amounts in millions of dollars] New orders t, I960. 27, 559 26, 903 30,672 30,115 31,086 33,005 35,322 37,952 41, 803 45, 944 46,763 50, 243 53,
November 2018 Customer Switching Report for the Electricity and Gas Retail Markets
 An Coimisiún um Rialáil Fóntas Commission for Regulation of Utilities November 2018 Customer Switching Report for the Electricity and Gas Retail Markets Information Paper Reference: CRU18266 Date Published:
Operational Overview. Operational Forum, 24 th March 2010
 Operational Overview Operational Forum, 24 th March 21 Weather Weather February 21 The cold weather continued throughout February with all but one day being colder than the 17-year seasonal normal CWV.
University of Michigan Eco-Driving Index (EDI) Latest data: October 2017
 Latest data: October 2017") University of Michigan Eco-Driving Index () http://www.ecodrivingindex.org Latest data: October 2017 Developed and issued monthly by Michael Sivak and Brandon Schoettle Sustainable Worldwide Transportation
University of Michigan Eco-Driving Index () http://www.ecodrivingindex.org Latest data: October 2017 Developed and issued monthly by Michael Sivak and Brandon Schoettle Sustainable Worldwide Transportation
FOR IMMEDIATE RELEASE
 Article No. 7353 Available on www.roymorgan.com Roy Morgan Unemployment Profile Wednesday, 11 October 2017 2.498 million Australians (18.9%) now unemployed or under-employed In September 1.202 million
Date Event or Holiday :Sun, 2:Mon North Orchard Delong Preschool North Orchard Delong Preschool
 2018 6 1 1:Sun, 2:Mon 2018-2019 Date Event or Holiday Aug 16 Board Meeting 6pm Aug 23 Open House June 2018 July 2018 August 2018 Sep 06 Board Meeting 6pm Su M Tu W Th F Sa Su M Tu W Th F Sa Su M Tu W Th
The impact of electric vehicle development on peak demand and the load curve under different scenarios of EV integration and recharging options
 The impact of electric vehicle development on peak demand and the load curve under different scenarios of EV integration and recharging options Electricity demand in France: a paradigm shift Electricity
Monthly Operating Report. February 2018
 Monthly Operating Report February 2018 February overview» For the month of February 2018 Contact recorded: Electricity and gas sales of 534 GWh (February 20: 551 GWh) Netback of $82.16/MWh (February 20:
Residential Load Profiles
 Residential Load Profiles TABLE OF CONTENTS PAGE 1 BACKGROUND... 1 2 DATA COLLECTION AND ASSUMPTIONS... 1 3 ANALYSIS AND RESULTS... 2 3.1 Load Profiles... 2 3.2 Calculation of Monthly Electricity Bills...
FOR IMMEDIATE RELEASE
 Article No. 6928 Available on www.roymorgan.com Roy Morgan Unemployment Profile Wednesday, 17 August 2016 Australian real unemployment jumps to 10.5% (up 0.9%) in July during post-election uncertainty
PRESENTATION ON STRATEGIC APPROACH TOWARDS WIND SOLAR HYBRID SYSTEMS (SWES) FOR REMOTE TELECOM SITES IN INDIA & CASE STUDY OF RAJASTHAN
 FOR REMOTE TELECOM SITES IN INDIA & CASE STUDY OF RAJASTHAN") PRESENTATION ON STRATEGIC APPROACH TOWARDS WIND SOLAR HYBRID SYSTEMS (SWES) FOR REMOTE TELECOM SITES IN INDIA & CASE STUDY OF RAJASTHAN WORKSHOP ON SMALL WIND ENERGY AND HYBRID SYSTEMS & ITS RELEVANCE
PRESENTATION ON STRATEGIC APPROACH TOWARDS WIND SOLAR HYBRID SYSTEMS (SWES) FOR REMOTE TELECOM SITES IN INDIA & CASE STUDY OF RAJASTHAN WORKSHOP ON SMALL WIND ENERGY AND HYBRID SYSTEMS & ITS RELEVANCE
WIM #37 was operational for the entire month of September Volume was computed using all monthly data.
 SEPTEMBER 2016 WIM Site Location WIM #37 is located on I-94 near Otsego in Wright county. The WIM is located only on the westbound (WB) side of I-94, meaning that all data mentioned in this report pertains
Wheat Marketing Situation
 Wheat Marketing Situation Prepared by: Darrell L. Hanavan Executive Director Colorado Wheat Administrative Committee If you would like to receive an email when this report is updated, email gmostek@coloradowheat.org
ANCR CRU Statistics February 2007 to December 2007
 ANCR CRU Statistics February 2007 to December 2007 o Jan/07 Feb/07* Mar/07 Apr/07 May/07 Jun/07 Jul/07 Aug/07 Sep/07 Oct/07 Nov/07 Dec/07 Total notes data from Perimeter phone system unavailable prior
Electricity Industry Code Minimum Service Standards & Guaranteed Service Levels Quarterly Report July September 2008
 Electricity Industry Code Minimum Service Standards & Guaranteed Service Levels Quarterly Report July September 2008 2 Table of Contents Administrative Data...3 Network Performance...3 Reliability Measures
November 2017 Customer Switching Report for the Electricity and Gas Retail Markets
 An Coimisiún um Rialáil Fóntas Commission for Regulation of Utilities November 2017 Customer Switching Report for the Electricity and Gas Retail Markets Information Paper Reference: CRU18011 Date Published:
Total Production by Month (Acre Feet)
") Production by Month (acre-feet) 2008 2009 2010 2011 2012 2013 2014 2015 2016 January 25 339.10 228.90 249.50 297.99 243.06 327.14 247.66 212.37 February 234.00 218.80 212.10 241.52 245.82 279.08 234.16
Production by Month (acre-feet) 2008 2009 2010 2011 2012 2013 2014 2015 2016 January 25 339.10 228.90 249.50 297.99 243.06 327.14 247.66 212.37 February 234.00 218.80 212.10 241.52 245.82 279.08 234.16
[Amounts in millions of dollars] Nondurable. Total. goods. equipment 34,415 30,717 24,506 8,868 9,566 8,981
![[Amounts in millions of dollars] Nondurable. Total. goods. equipment 34,415 30,717 24,506 8,868 9,566 8,981](/thumbs/92/109418289.jpg "[Amounts in millions of dollars] Nondurable. Total. goods. equipment 34,415 30,717 24,506 8,868 9,566 8,981") 1970 TABLE C-44. Manufacturers 1 new and unfilled orders, 1947-69 Unfilled orders2 Unfilled orders-shipments Machinery and equipment 1947.. 1948.. 1949.. 23,53.3 3 3 4 3 1961 * 31,085 15,698 17,026 18,522
1970 TABLE C-44. Manufacturers 1 new and unfilled orders, 1947-69 Unfilled orders2 Unfilled orders-shipments Machinery and equipment 1947.. 1948.. 1949.. 23,53.3 3 3 4 3 1961 * 31,085 15,698 17,026 18,522
September 2016 Water Production & Consumption Data
 September 2016 Water Production & Consumption Data September 2016 monthly water production (288.48 AF) was lowest in at least 17 years. Monthly water production has increased slightly each month since
Meter Insights for Downtown Store
 Meter Insights for Downtown Store Commodity: Analysis Period: Prepared for: Report Date: Electricity 1 December 2013-31 December 2014 Arlington Mills 12 February 2015 Electricity use over the analysis
Monthly Hog Market Update United States Hog Production
 This information is provided as a resource by Saskatchewan Agriculture staff All prices are in Canadian dollars unless otherwise noted. Please use this information at your own risk. Monthly Hog Market
MEDIA PACK 2019 MAGAZINE WINDOWS DOORS CONSERVATORIES GLASS FABRICATORS DISTRIBUTORS INSTALLERS. October 2018 Issue
 MEDIA PACK 2019 WINDOWS DOORS CONSERVATORIES GLASS FABRICATORS DISTRIBUTORS INSTALLERS CLEARZINE CLEARVIEW-UK.COM MAGAZINE 733 ALUMINIUM WINDOW & DOOR FABRICATORS MAGAZINE DISTRIBUTION 12,606 2,356 14,889
Action Requested From AMWG
 Action Requested From AMWG NONE, These Two Presentations Are For Information Transfer Only The information is derived from a multi-year synthesis research effort related to existing data on flow, sediment-transport
Modeling and Comparison of Dynamics of AC and DC Coupled Remote Hybrid Power Systems
 Modeling and Comparison of Dynamics of AC and DC Coupled Remote Hybrid Power Systems Presenter: Tanjila Haque Supervisor : Dr. Tariq Iqbal Faculty of Engineering and Applied Science Memorial University
Up and Down Months of the Stock Market
 Up and Down Months of the Stock Market 1926-2017 Positive years (66) in the stock market were not good all year long and losing years (24) were not losers throughout the year. Winning years produce losing
D G A G R I D A S H B O A R D : A P P L E S
 75 79 60 56 49 74 65 59 54 42 76 63 58 53 78 55 42 43 79 44 81 63 47 83 64 59 53 48 Sources: Eurostat, MSs notifications, DG Agri, Comext, Comtrade, GTA, ITC, AMI, Expert groups, Freshfel, Wapa. 89 68
FOR IMMEDIATE RELEASE
 Article No. 7433 Available on www.roymorgan.com Roy Morgan Unemployment Profile Friday, 12 January 2018 2.6m Australians unemployed or under-employed in December The latest data for the Roy Morgan employment
DRAFT. Total Month Average Point (MAP) A Massage 4/30/2014 8/1/2015 A CENTER E
 A Massage 4/30/2014 8/1/2015 A CENTER E") Total Month Average Point (MAP) A Massage 4/30/2014 8/1/2015 A CENTER E 2.25 2.00 2.00 2.25 2.00 2.00 1.00 2.25 2.00 2.25 2.00 A Massage 10/31/2017 9/1/2015 B MEZZANINE 2.25 2.00 2.00 2.25 2.25 2.25 2.25
Total Month Average Point (MAP) A Massage 4/30/2014 8/1/2015 A CENTER E 2.25 2.00 2.00 2.25 2.00 2.00 1.00 2.25 2.00 2.25 2.00 A Massage 10/31/2017 9/1/2015 B MEZZANINE 2.25 2.00 2.00 2.25 2.25 2.25 2.25
Presented by Eric Englert Puget Sound Energy September 11, 2002
 Results from PSE s First Year of Time of Use Program Presented by Eric Englert Puget Sound Energy September 11, 2002 Puget Sound Energy Overview 973,489 Total Electric Customers 908,949 are AMR Capable
M onthly arket. Jan Table of Contents. Monthly Highlights
 Table of Contents Market Inventory...2 www.gaar.com Monthly Highlights January 2014 had a 12.29% increase in the number of homes sales when compared to same time last year. The average sale price of single-family
The Peoples Gas Light and Coke Company
 History of Gas Charges Due to the Operation of Rider 2 (Cents per Therm) Factors for Transportation Customers (Riders FST, SST, P, CFY and AGG) Non- Total Standby Standby Aggregation Commodity Commodity
Design Criteria Data
 OKLAHOMA CITY OK Latitude = 35.4 N WMO No. 72353 Longitude = 97.6 W Elevation = 133 feet Period of Record = 1973 to 1996 Average Pressure = 28.62 inches Hg Design Criteria Data Mean Coincident (Average)
Construction Sector Indices
 STATISTICAL RELEASE UGANDA BUREAU OF STATISTICS January to April 212 Construction Sector Indices HIGHLIGHTS Annual Changes show that the prices for the Whole Construction Sector (covering material prices,
Design Criteria Data
 MEDFORD/JACKSON CO. OR Latitude = 42.37 N WMO No. 72597 Longitude =122.8 W Elevation = 1329 feet Period of Record = 1973 to 1996 Average Pressure = 28.61 inches Hg Design Criteria Data Mean Coincident
Units of Instruction MISD Pacing Guide Days Date Range Test Date
 MISD Pacing Guide Date Range Test Date Introduction: Processes of Investigations (1 day) Aug. 21 Unit 01: Matter (12 days) Aug. 22-Sept. 7 Sep. 10 Unit 02: Atomic Structure and the Periodic Table (15 days)
Solar photovoltaic research: Drakenstein Municipality
 Rooftop Solar PV Solar photovoltaic research: Drakenstein Municipality Karin Kritzinger and Imke Meyer, Date 22/04/2015 Dialogue on Utility and Local Scale Renewable Energy in South Africa 22 April 2015-1
Presentation to the Customer Service, Operations and Safety Committee OPERATIONS PERFORMANCE INDICATORS
 Presentation to the Customer Service, Operations and Safety Committee OPERATIONS PERFORMANCE INDICATORS May 19, 2005 Department of Operations 100 95 90 85 80 75 70 65 A B C D RAIL PERFORMANCE INDEX FY
2017 SC Producers Whole Farm Revenue Protection Expected Price Justification
 2017 SC Producers Whole Farm Revenue Protection Expected Price Justification RMA Projected Expected As of Average Futures Price Close As of RMA Projected Prices 4 Feb 2011 2015 % Differ 4 Feb Crop Contract
Design Criteria Data
 DES MOINES IA Latitude = 41.53 N WMO No. 72546 Longitude = 93.65 W Elevation = 965 feet Period of Record = 1973 to 1996 Average Pressure = 28.96 inches Hg Design Criteria Data Mean Coincident (Average)
RIDERSHIP TRENDS. April 2018
 RIDERSHIP TRENDS April Prepared by the Division of Strategic Capital Planning June Table of Contents Executive Summary...1 Ridership...3 Estimated Passenger Trips by Line...3 Estimated Passenger Trips
NEU Electric and Natural Gas Price Update
 Exelon s $24 Billion Energy Bill Senate Bill 2814 Short-Term Energy Price Outlook On November 15, 2016, Exelon, through its legislative supporters, introduced Senate Bill 2814, a massive 446 page document
Algebra II Pacing Guide
 Unit 13: Exploring a Business Venture (10 days) 8 May 13 - May 24 n/a MISD Pacing Guide Date Range Unit 01: Introduction to Functions in 15 Aug. 21 - Sept. 11 Sept. 12 Unit 02: Absolute Value Functions,,
Design Criteria Data
 LAS VEGAS/MCCARRAN NV Latitude = 36.8 N WMO No. 72386 Longitude =115.1 W Elevation = 2179 feet Period of Record = 1973 to 1996 Average Pressure = 27.67 inches Hg Design Criteria Data Mean Coincident (Average)
Design Criteria Data
 PHOENIX/SKY HARBOR AZ Latitude = 33.43 N WMO No. 72278 Longitude =112. W Elevation = 116 feet Period of Record = 1973 to 1996 Average Pressure = 28.72 inches Hg Design Criteria Data Mean Coincident (Average)
Monthly Operating Report. January 2019
 Monthly Operating Report January 2019 January overview For the month of January 2019» The Customer business recorded: Mass market electricity and gas sales of 281 GWh (January 20: 282 GWh) Mass market
Results of annual simulation
 2 x Vitosol 100-FM SVKF Total gross surface area:4,46 m² Azimuth: 0 Incl.: 30 160 Liters/Day 50 C Gas-fired boiler 26 kw Vitocell 100-B Vol : 250 l Results of annual simulation Installed collector power:
MARKET RATES UPDATE Paula Gold-Williams Cory Kuchinsky
 MARKET RATES UPDATE I N T R O D U C T I O N BY: Paula Gold-Williams President & Chief Executive Officer (CEO) P R E S E N T E D BY: Cory Kuchinsky Interim Vice President, Financial Services September 24,
Energy Markets in Turmoil The Consumer Perspective
 Energy Markets in Turmoil The Consumer Perspective Sonny Popowsky Consumer Advocate of Pennsylvania Illinois State University Institute for Regulatory Policy Studies 63682 Springfield, IL May 17, 2001
NEW HAMPSHIRE GAS CORPORATION WINTER PERIOD ORIGINAL FILING CONTENTS 3. CONVERSION OF GAS COSTS - GALLONS TO THERMS SCHEDULE A
 NEW HAMPSHIRE GAS CORPORATION COST OF GAS RATE FILING - DG 13- WINTER PERIOD 2013-2014 ORIGINAL FILING CONTENTS 1. TARIFF PAGE - COST OF GAS RATE 2. MARKED TARIFF PAGE - COST OF GAS RATE 3. CONVERSION
Electrical Power Analysis of the Cal Poly Organic Farm for the Cal Poly SuPER Project
 Electrical Power Analysis of the Cal Poly Organic Farm for the Cal Poly SuPER Project Presentation For SARC March 21, 2008 Senior Project By Alex Liang Agenda Terminology Introduction to SuPER and This
August 2018 MLS Statistical Report
 January February March April May June July August Septem October Novem Decem August 218 MLS Statistical Report Total Sales Overall, sales are down 3%; however, total volume sold is up 7% and Median Sale
January-March 2017 Customer Switching Report for the Electricity and Gas Retail Markets
 January- Customer Switching Report for the Electricity and Gas Retail Markets DOCUMENT TYPE: REFERENCE: Information Note CER/17102 DATE PUBLISHED: QUERIES TO: 28th April 2017 gkelly@cer.ie The Commission
Irrigation energy efficiency How to analyse your energy costs. Nick Bullock The Energy Guys
 Irrigation energy efficiency How to analyse your energy costs Nick Bullock The Energy Guys March 2017 1 PILOT Energy Audits: Pivots AIM: data on energy use simple field data How energy efficient is system?
THE TRES AMIGAS PROJECT
 UNITING THE NATION S ELECTRIC POWER GRID THE TRES AMIGAS PROJECT Project Development, Business Case, and Benefits -ERCOT Presentation Jan 22, 2010 Agenda Project Overview Project Objective Project Description,
LOCAL CLIMATOLOGICAL DATA
 ILLINOIS STATE WATER SURVEY DIVISION URBANA, ILLINOIS ISWS MP-21 Archive SWS0964 Illinois State Water Survey LOCAL CLIMATOLOGICAL DATA FDR HILLSBORO, IL. 1901-1962 LOCAL CLIMATOLOGICAL DATA 1901-1962 HILLSBORO
Year to Date Summary. Average and Median Sale Prices
 A Publication of RMLS, The Source for Real Estate Statistics in Your Community Residential Review: Southwest Washington September 2018 Reporting Period September Residential Highlights Southwest Washington
2017 Adjusted Count Report February 12, 2018
 A statewide multi-use trail user study and volunteer data collection program 2017 Adjusted Count Report February 12, 2018 The following report includes the final adjusted infrared (IR) counter data at
Bulk Storage Containers
 UCSB AST SPCC SELF-INSPECTION CHECKLIST Year: Responsible Department: Tank Location: Tank ID: Bulk Storage Containers Total tank capacity: Petroleum type and amount: Secondary containment type: (diesel,
Flexible Capacity Needs and Availability Assessment Hours Technical Study for 2020
 Flexible Capacity Needs and Availability Assessment Hours Technical Study for 2020 Clyde Loutan Principal, Renewable Energy Integration Hong Zhou Market Development Analyst, Lead Amber Motley Manager,
Your electricity bill
 Your electricity bill Bill date: February 22, 2017 Summary of what you owe Amount due on your last bill $1,271.36 Payment made on Jan 30, thank you -$1,271.36 Your balance forward $0.00 Your new charges
STATISTICS BOTSWANA ELECTRICITY GENERATION & DISTRIBUTION 2016/2 STATS BRIEF, FIRST QUARTER Copyrights Statistics Botswana 2016
 2016/2 ELECTRICITY GENERATION & DISTRIBUTION STATS BRIEF, FIRST QUARTER 2016 Copyrights Statistics Botswana 2016 Statistics Botswana. Private Bag 0024 Botswana Tel: (267) 367 1300. Fax: (267) 395 2201.
Appendix E Water Supply Modeling
 Supply Modeling Modesto Irrigation District Treatment Plant Expansion Project Modeling I. Introduction The Modesto Irrigation District (MID) is situated adjacent to and north of the Tuolumne River. Over
Operational Opportunities to Minimize Renewables Curtailments
 Operational Opportunities to Minimize Renewables Curtailments Clyde Loutan Principal, Renewable Energy Integration July 24, 2017 2017 CAISO - Public Page 1 Agenda Background Real-time control performance
VEHICLE / PEDESTRIAN COLLISIONS
 Info item No. 1 Crosswalk Safety Advisory Committee March 31, 2016 VEHICLE / PEDESTRIAN COLLISIONS HRM: January December 20 DISCLAIMER: All figures presented in this report reflect the information held
2014 Meteorological and Oceanographic Summary for the Bocas del Toro Research Station. Prepared by: Steven Paton
 0 2014 Meteorological and Oceanographic Summary for the Bocas del Toro Research Station Prepared by: Steven Paton 1 Introduction This is the second of a series of yearly reports summarising the past year
D G A G R I D A S H B O A R D : T O M A T O E S Last update: EU AVG PRICES
 tonnes Weightedaverages by volume of production per MS Ongoing adjustments on weights by variety group 000 tonnes D G A G R I D A S H B O A R D : T O M A T O E S Last update: 20.04.2018 EU AVG PRICES MS
7th Grade Social Studies Pacing Guide Units of Instruction MISD Pacing Guide Days Date Range Test Date
 7th Grade Social Studies MISD Pacing Guide Date Range Test Date Unit 01: Thinking Like a Historian (5 days for the entire unit) 5 Aug 27-31 Unit 02: Natural Texas and Its People 1200s-1800s (5 days for
MONTHLY PERFORMANCE DASHBOARD
 AUSTIN ENERGY MARCH 21 MONTHLY PERFORMANCE DASHBOARD A report highlighting key Austin Energy metrics for uary FY 21 FINANCIAL HEALTH Standard and Poor s Bond Rating Current AA AA Budget Based Revenues
Energy Conservation Efforts
 Hennepin County Property Services Energy Conservation Efforts MEPC Presentation September 2010 HENNEPIN COUNTY PROPERTY SERVICES DEPARTMENT MONTHLY ENERGY COSTS $1,200,000 $1,000,000 Cold 2009 October
System Status Briefing
 System Status Briefing Phakamani Hadebe Interim Group Chief Executive 3 May 2018 Contents 1 Performance summary 2 Operational highlights 3 Generation performance 4 Distribution overview 5 Transmission
Digitized for FRASER Federal Reserve Bank of St. Louis. Per cent. P Total reported (000) ^D-)>oCL
 ^D-)>oCL") statistical FEDERAL release RESERVE ^D-)>oCL For immedia < t4 6 relea I s February 13, 1968 AUTOM3BILE LOANS BY MAJOR SALES FINANCE COMPANIES IN THE FOURTH QlJARTP^HE PROPORTION OF 3 YEAR NEW CAR CONTRACTS
statistical FEDERAL release RESERVE ^D-)>oCL For immedia < t4 6 relea I s February 13, 1968 AUTOM3BILE LOANS BY MAJOR SALES FINANCE COMPANIES IN THE FOURTH QlJARTP^HE PROPORTION OF 3 YEAR NEW CAR CONTRACTS
Yield Reduction Due to Shading:
 x Fronius International NA-E35L5 35 W FRONIUS IG Plus 20 V-3 2 0,0kW x Fronius International NA-E35L5 35 W FRONIUS IG Plus 20 V-3 4 0,0kW 84 x SHARP Corporation x Fronius International NA-E35L5 35 W FRONIUS
FOR IMMEDIATE RELEASE
 Article No. 7137 Available on www.roymorgan.com Roy Morgan Unemployment Profile Wednesday, 8 February 2017 Over 12 million Australians have jobs for the first time including over 8 million full-time jobs,
Graph #1. Micro-Generation Generating Units in Alberta 20
 2, Graph #1. Micro-Generation Generating Units in Alberta 2 Cumulative # of Generating Units 1,9 1,8 1,7 1,6 1,5 1,4 1,3 1,2 1,1 1, 9 8 7 6 5 4 3 2 Number of MGG Units as of 216 Mar 31 Number of Solar
M o n. a t i s t i c s. M o n t h l y NOVEMBER 2009
 M o n t h l y M o n t S h l t y a t i s t i c s NOVEMBER 29 For Immediate Release December 7, 29 CONTACT: Kimberly Clifton, President (52) 954-8 Wes Wiggins Vice President, MLS (52) 82-8792 Cheri Meadows
Smarter Network Storage UK first multi-purpose application of grid scale storage. Dr. Panos Papadopoulos, PhD, CEng
 Smarter Network Storage UK first multi-purpose application of grid scale storage Dr. Panos Papadopoulos, PhD, CEng UK Power Networks GENERATION TRANSMISSION DISTRIBUTION SUPPLY INDUSTRIAL COMMERCIAL RESIDENTIAL
It s time to start buying propane for fall Expect to pay more to dry 2017 corn crop By Bryce Knorr, senior grain market analyst
 It s time to start buying propane for fall Expect to pay more to dry 2017 corn crop By Bryce Knorr, senior grain market analyst It s the end of winter hopefully and that means it s a good time to buy coats,
TABLE C-42. Sales and inventories in manufacturing and trade, [Amounts in millions of dollars] Manufacturing. Inventories Ratio 3.
![TABLE C-42. Sales and inventories in manufacturing and trade, [Amounts in millions of dollars] Manufacturing. Inventories Ratio 3.](/thumbs/80/81413912.jpg "TABLE C-42. Sales and inventories in manufacturing and trade, [Amounts in millions of dollars] Manufacturing. Inventories Ratio 3.") 1970 TABLE C-4. and inventories in manufacturing, 1947-69 Inyentories i 1947 1948 1949 1950 1951 195 1953 1954 1955 1956 1957 1958 1959 35,60 54,33 5,507 59,8 70,4 7,377,1 89,05 86,9 1.4 16,16 1,714,59
1970 TABLE C-4. and inventories in manufacturing, 1947-69 Inyentories i 1947 1948 1949 1950 1951 195 1953 1954 1955 1956 1957 1958 1959 35,60 54,33 5,507 59,8 70,4 7,377,1 89,05 86,9 1.4 16,16 1,714,59
Utah Fatal Crash Summary 2014
 Utah Fatal Crash Summary 1 State of Utah Department of Public Safety Highway Safety Office W Amelia Earhart Dr # Salt Lake City, UT 8116 81-366-6 www.highwaysafety.utah.gov Preliminary Totals as of 1/29/
Monthly Operating Report. September 2016
 Monthly Operating Report September 20 September overview» For the month of September 20 Contact recorded: Electricity, gas and steam sales of 819 GWh (September 2015: 821 GWh) Netback of $79.50/MWh (September
ANCR CRU Statistics Februa.. to December 2007
 ANCR CRU Statistics Februa.. to December 2007 Jan/07 Feb/07* Mar/07 Apr/07 May/07 Jun/07 Jul/07 Aug/07 Sep/07 Oct/07 Nov/07 Dec/07 Total notes Answered dato from Perimeter phone system unavailable prior
WinnCompanies Community Solar Photovoltaic to Benefit Affordable Housing Darien Crimmin Vice President of Energy & Sustainability
 WinnCompanies Community Solar Photovoltaic to Benefit Affordable Housing Darien Crimmin Vice President of Energy & Sustainability dcrimmin@winnco.com Massachusetts Solar Policy SREC I Program 2010 through
This presentation was given as part of a workshop on February 7, Presenters were:
 This presentation was given as part of a workshop on February 7, 2018. Presenters were: Andrew Valainis, Montana Renewable Energy Association Bryan Von Lossberg, Renewable Energy Consultant Paul Herendeen,
2017 Risk and Profit Conference Breakout Session Presenters. 13. Ethanol and Biodiesel Market and Profitability Prospects
 2017 Risk and Profit Conference Breakout Session Presenters 13. Ethanol and Biodiesel Market and Profitability Prospects Dan O Brien Daniel O Brien was raised on a grain and livestock
May ATR Monthly Report
 May ATR Monthly Report Minnesota Department of Transportation Office of Transportation Data and Analysis May 2011 Introduction The purpose of this report is to examine monthly traffic trends on Minnesota
NJ Solar Market Update
 NJ Solar Market Update April 16, 20 Renewable Energy Committee Meeting Trenton, NJ Prepared by Charlie Garrison Solar Installed Capacity Data The preliminary installed solar capacity as of 3/31/ is approximately
Price Category Breakdown - February 2010
 SINGLE FAMILY RESIDENTIAL BREAKDOWN ruary 21 ruary Sales and Average Price Increase Annually TORONTO - Wednesday, March 3, 21 7.3 % 24.6 % 1.8 % 7.3%.2%.1 % Greater Toronto REALTORS reported 7,291 sales
PDR Energy Baseline Alternative. Proposal for Discussion October 27, 2015
 PDR Energy Baseline Alternative Proposal for Discussion October 27, 2015 Update Since Last Meeting Since the October 12 th Working Group Meeting Stem, Solar City, AMS and CESA have had over a half-dozen
January During JANUARY. Sunday Monday Tuesday Wednesday Thursday Friday Saturday 1 Dec Feb 2011
 January 2011 1 Dec 2010 Feb 2011 During JANUARY Happy New Year! -- Appoint Company Nominating Committee 1 2 3 4 -- Camp report to Company - Jan 155 6 7 8 9 10 11 6 7 8 9 10 11 12 12 13 14 15 16 17 18 13
Yield Reduction Due to Shading:
 x9 31 x SunPower 1 x Power-One SPR-E0-37 37 W TRIO-8.5-TL-OUTD 10 ; 1x13 1x13 1 x Power-One 10 ; -30 7.5kW 9 x SunPower 1 x Power-One SPR-E0-37 37 W 10 ; 59 7.5kW 7 x SunPower 1 x Power-One SPR-E0-37 37
COMPILED BY GLASS S. Auction Report - LCV November 2013
 GLASS S Auction Report - LCV November 2013 Contents Market Commentary Page 3 Whole Market Summary Page 8 Average Sales Price Year on Year Page 9 Sales Price Compared to Number of Entries (all ages) Page
A9 Data Monitoring and Analysis Report. January Content. 1. Executive Summary. 2. Overview. 3. Purpose. 4. Baseline Data Sources
 A9 Data Monitoring and Analysis Report January 2016 Content 1. Executive Summary 2. Overview 3. Purpose 4. Baseline Data Sources 5. Casualty Analysis 6. Vehicle Speed Data 7. Incident Frequency & Impact
Past Due. Account Charges. Contract Charges Security Deposit Due - Jun 09, , Customer Service. Jun 19, PAST DUE $1,693.
 11983978 Jun 19, 217 1 124 958 PAST DUE $1,693.97 Meter Reading Information Meter # 55271 May 3 655 Jun 15 6642 17 days 1397 on or about Aug 15 82 Past Due Balance payable includes an amount which is payable