M onthly arket. Jan Table of Contents. Monthly Highlights
|
|
|
- Nigel Lewis
- 5 years ago
- Views:
Transcription

1 Table of Contents Market Inventory Monthly Highlights January 2014 had a 12.29% increase in the number of homes sales when compared to same time last year. The average sale price of single-family detached homes increased 9.48%, Median increased 6.27%. Market Activity...3 Home Sales by Area...4 Closed Sales by Price Supply-Demand/Absorption Rate...7 Home Sales Prices Market Activity by Zip Code...10 Market Overview...11 Market Comparisons Area Sales Color Maps M onthly arket R E P O R T Jan 2014 Contact John Kynor, 2014 GAAR President Phone president@gaar.com
2 Detached Historical Year January 3,750 3,611 3,884 February 3,668 3,676 March 3,705 3,809 April 3,806 3,953 May 3,986 4,112 June 4,097 4,388 July 4,152 4,497 August 4,103 4,578 September 4,081 4,608 October 4,083 4,439 November 3,902 4,255 December 3,587 3,836 Attached Historical Year January February March April May June July August September October November December Market Inventory 6,000 5,000 4,000 3,000 2,000 1, Detached homes on market Jan-13 Feb-13 Mar-13 Apr-13 May-13 Jun-13 Jul-13 Aug-13 Sep-13 Oct-13 Nov-13 Dec-13 Jan-14 Detached represents existing single-family detached homes Attached homes on market Jan-13 Feb-13 Mar-13 Apr-13 May-13 Jun-13 Jul-13 Aug-13 Sep-13 Oct-13 Nov-13 Dec-13 Jan-14 Attached represents existing condo/townhomes attached homes 2
3 Market Activity (New, Pending, Closed) Market Activity Month New Pending Closed Jan-13 1, Feb-13 1, Mar-13 1,388 1, Apr-13 1,519 1, May-13 1,581 1, Jun-13 1, Jul-13 1,578 1, Aug-13 1,429 1, Sep-13 1, Oct-13 1, Nov-13 1, Dec Jan-14 1, Change from last month/year 1,800 1,600 1,400 1,200 1, New Listings 1,578 1,388 1,519 1,581 1,588 1,578 1,429 1,429 1,247 1,213 1,249 1,288 1,213 1,249 1,288 1,095 1,091 1, Jan-12 Jan-13 Feb-12 Feb-13 Mar-12 Mar-13 Apr-12 Apr-13 May-13 Jun-12 Jun-13 Jul-12 Jul-13 Aug-12Sep-12Oct-12 Aug-13Sep-13 Oct-13 Nov-12Dec-12Jan-13 Nov-13Dec-13 Jan Pending Sales 1,400 1,600 1,280 1,250 1,108 1,158 1,158 1,200 1,400 1,280 1, ,011 1, ,108 1,158 1,158 1, , , Jan-12 Jan-13 Feb-12 Feb-13 Mar-12 Mar-13 Apr-12 Apr-13 May-13 Jun-12 Jun-13 Jul-12 Jul-13 Aug-12Sep-12Oct-12 Aug-13Sep-13 Oct-13 Nov-12Dec-12Jan-13 Nov-13Dec-13 Jan Jan-14 Dec-13 Jan-13 New 1, ,247 % Change % 3.29% Pending % Change % % Closed % Change % 12.29% 1,000 1,200 1, Closed Sales Jan-12 Jan-13 Feb-12 Feb-13 Mar-12 Mar-13 Apr-12 Apr-13 May-13 Jun-12 Jun-13 Jul-12 Jul-13 Aug-12Sep-12Oct-12 Aug-13Sep-13 Oct-13 Nov-12Dec-12Jan-13 Nov-13Dec-13Jan Data is for single-family detached homes Closed Sales chart also shows average days on market, indicated by a line. The average days on market for January 2014 detached sales was 76. 3
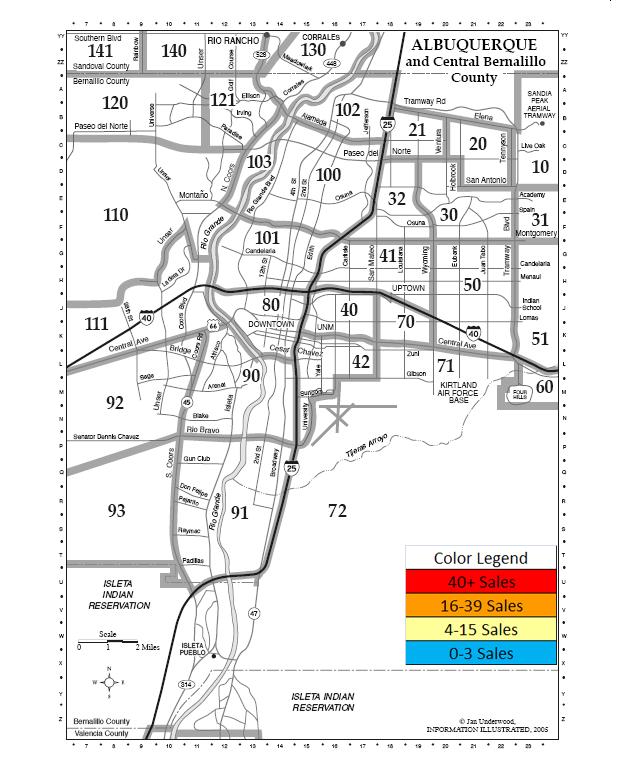
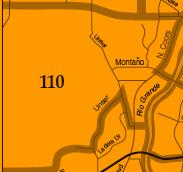
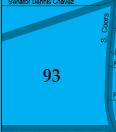
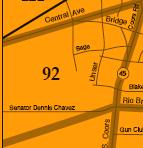
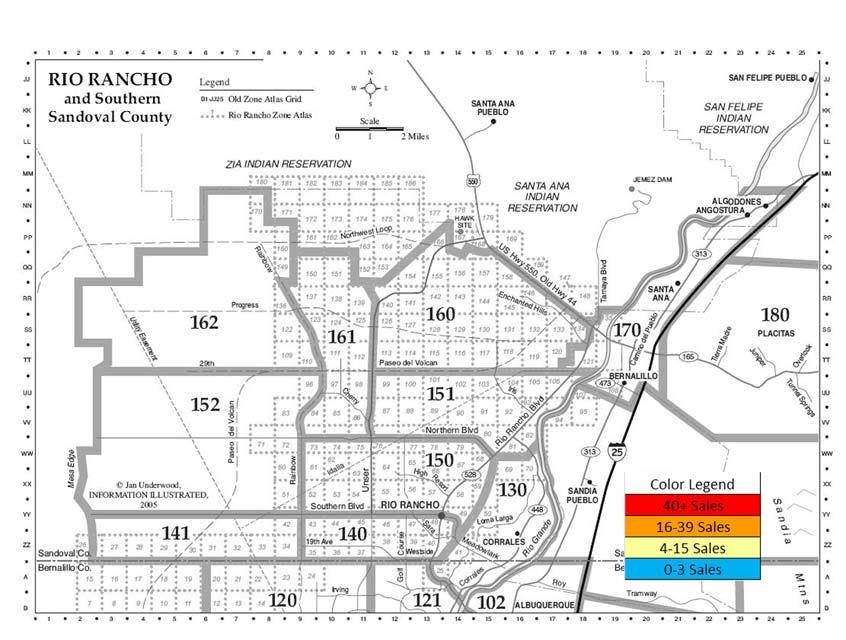
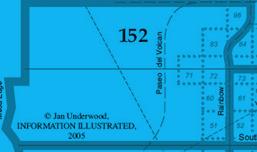
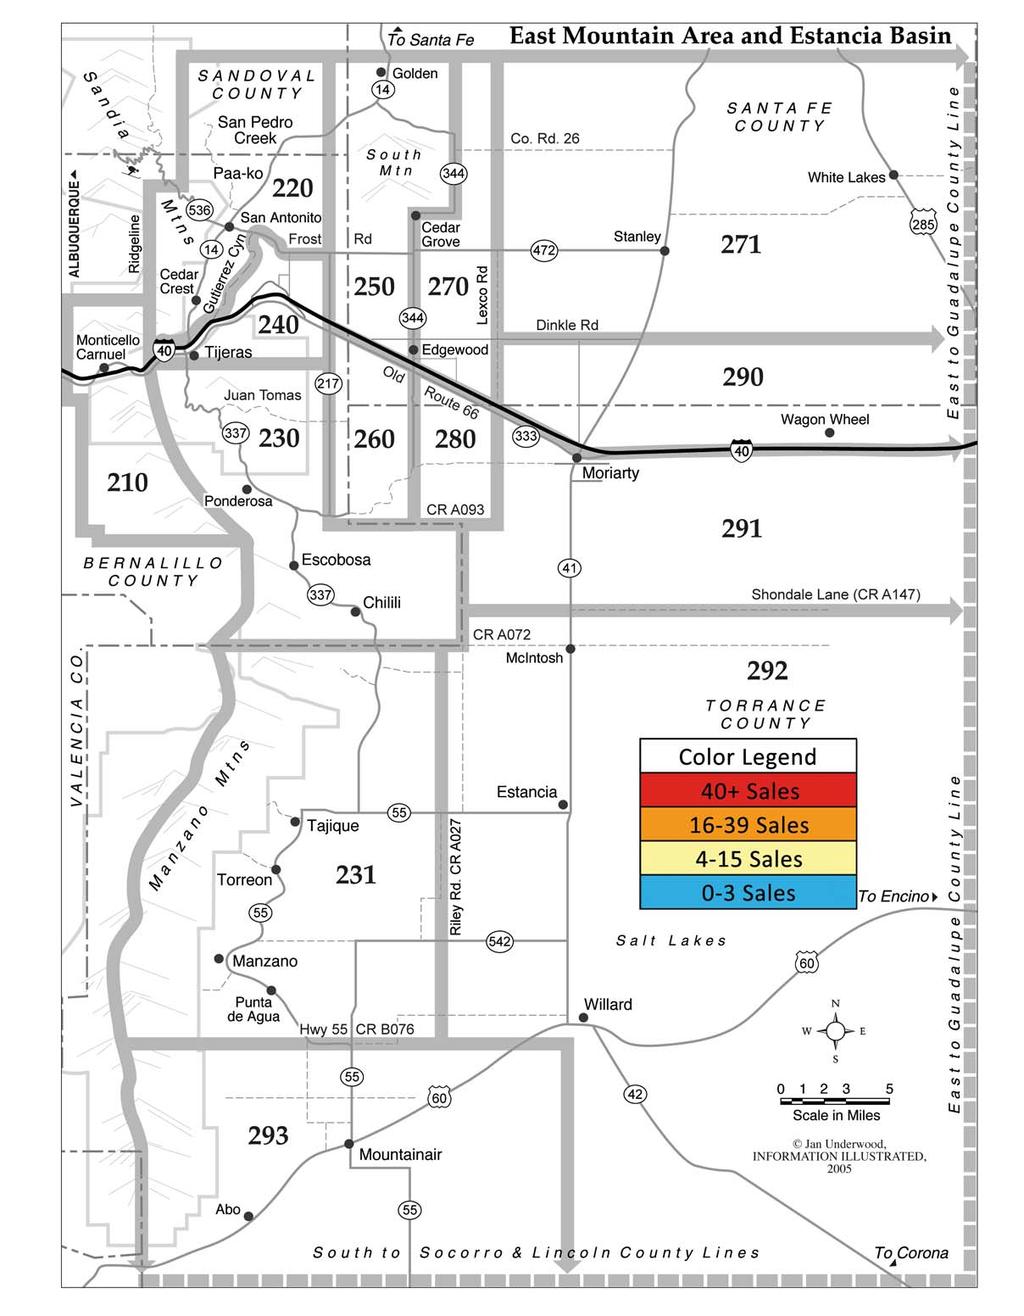
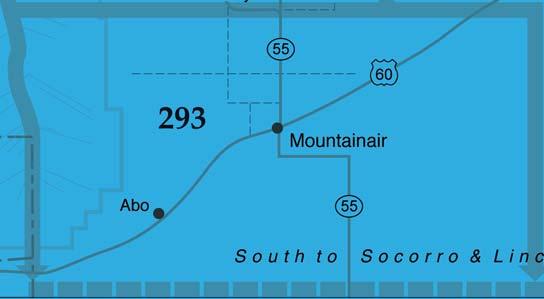
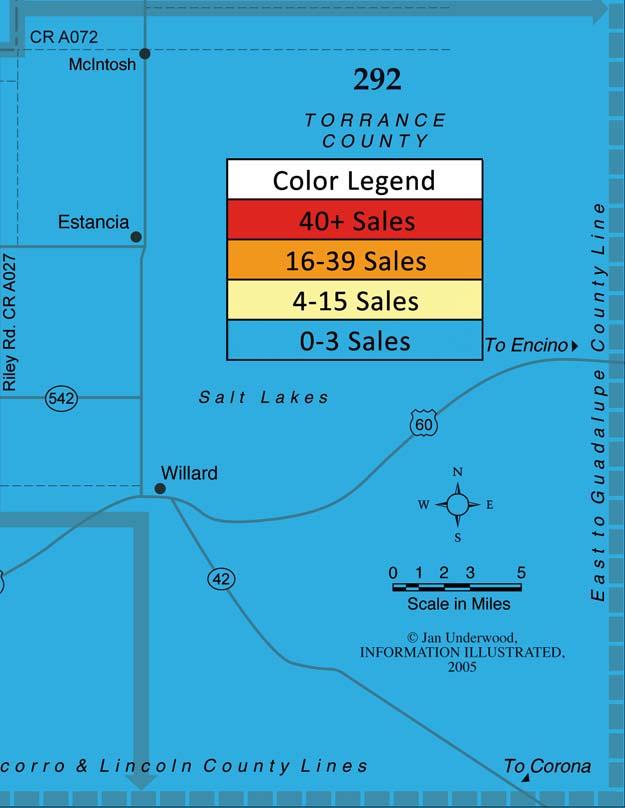
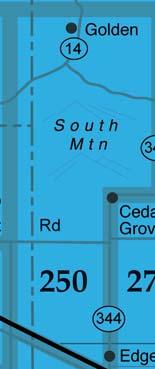
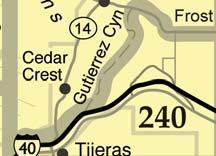
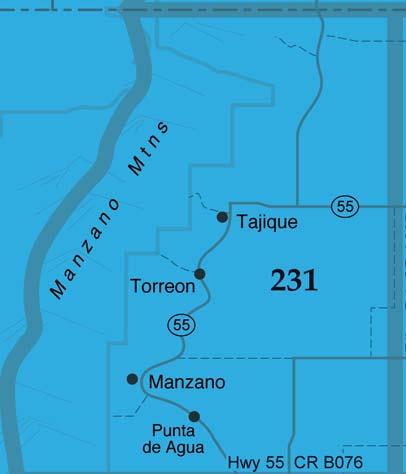
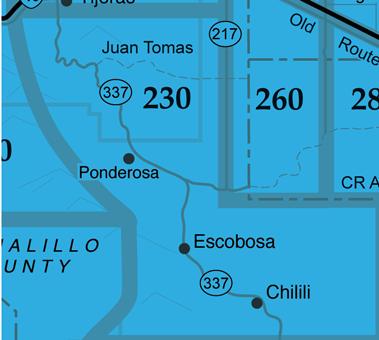
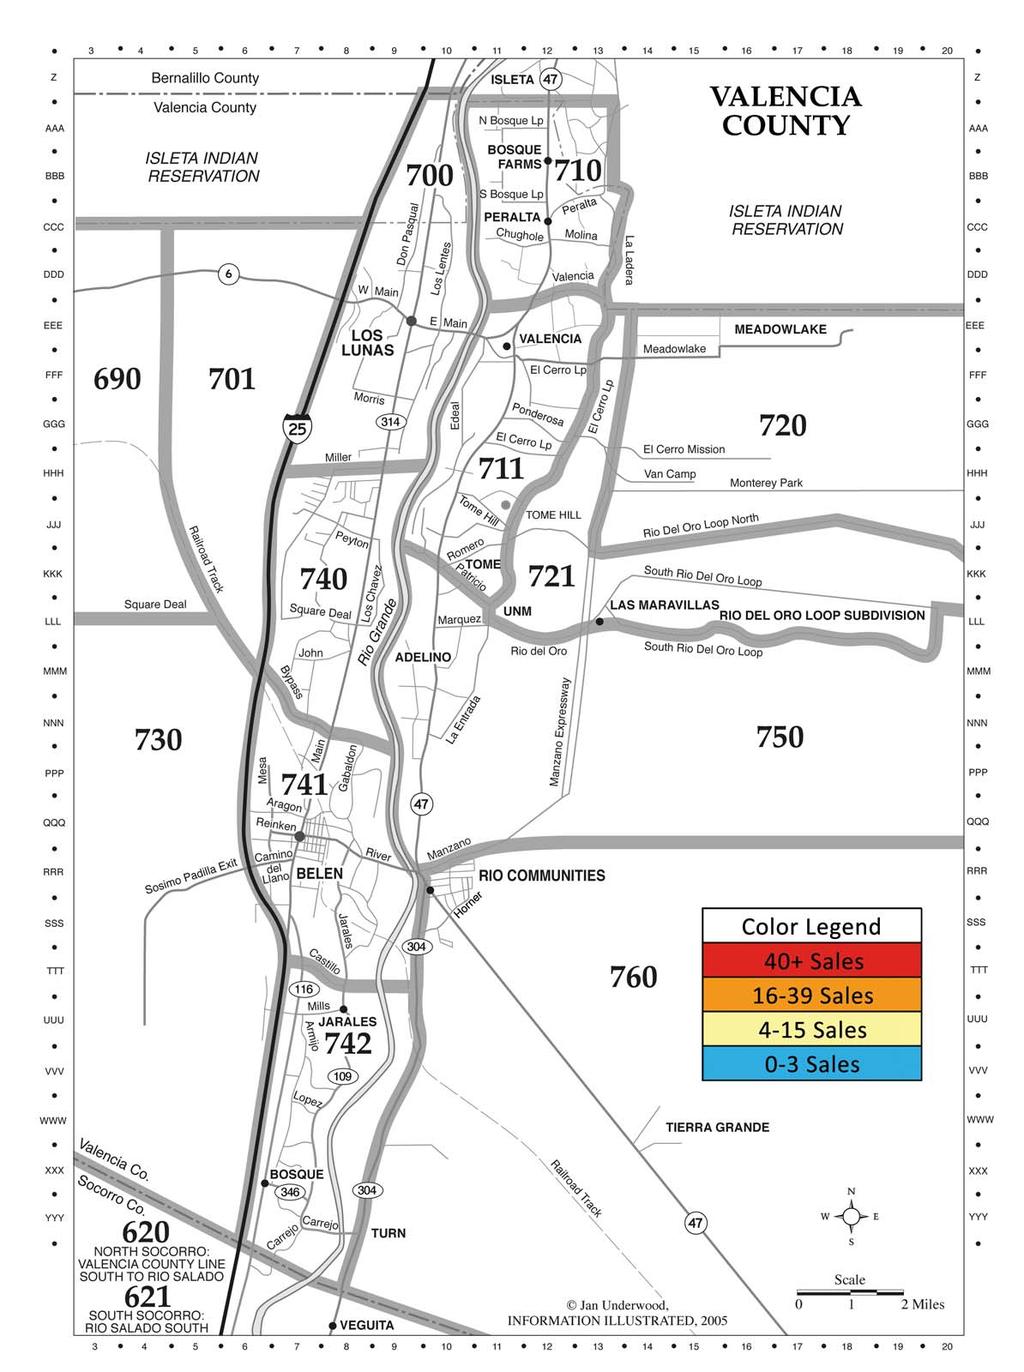
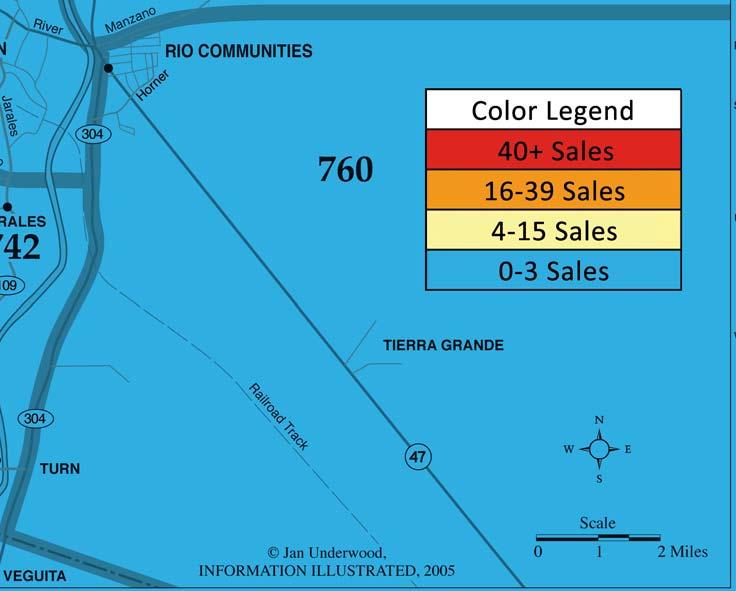
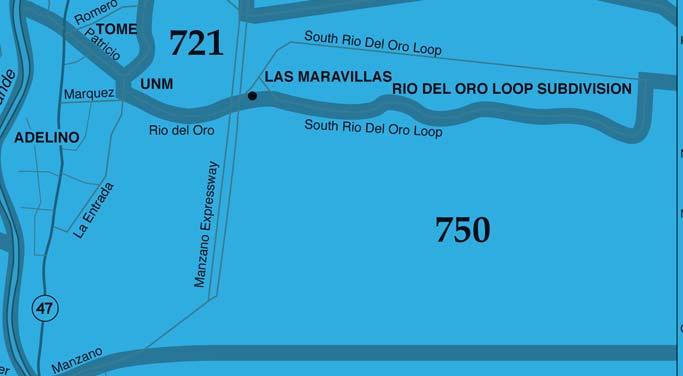
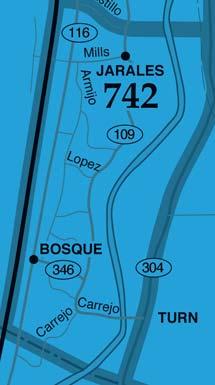
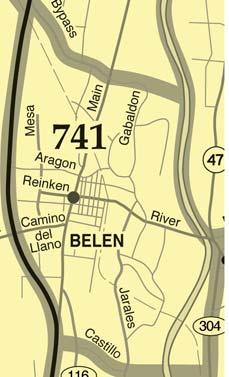
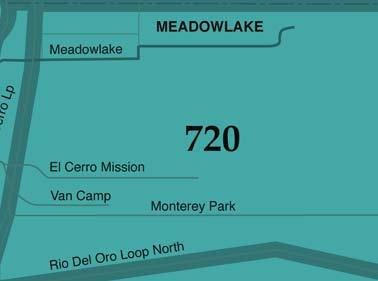
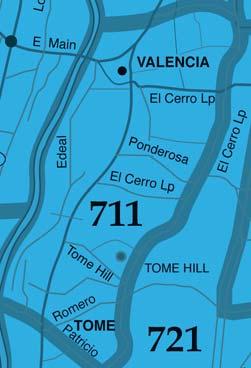
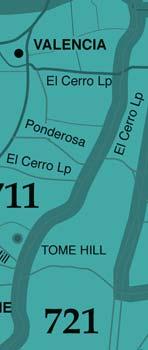
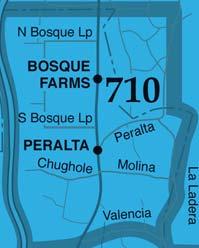
4 Homes Sales by Market Area Single-family detached sales MLS Area Area Name Jan-13 Jan Albuquerque Corrales Rio Rancho Bernalillo Placitas E. Mountains Valencia Co Total All , Jan. January Detached detached Sales sales and Median and Median Sale Sale Price Price $220,000 $210,000 $200,000 $190,000 $180,000 $170,000 $160,000 $150,000 $140,000 Condo/townhome (attached) sales MLS Area Area Name Jan-13 Jan Albuquerque Corrales Rio Rancho Bernalillo Placitas E. Mountains Valencia Co. 0 3 Total All Jan. January Attached attached Sales sales and Median and Median Sale Sale Price Price $180,000 $170,000 $160,000 $150,000 $140,000 $130,000 $120,000 $110,000 $100,000 MLS Areas include East Mountains and Estancia Basin Blue line on charts represents the median sale price for that month. MLS Areas include Belen, Los Lunas, Bosque Farms. 4
5 80 Closed Sales by Price Detached Sales by Price January historical (in thousands) < 30K Jan Jan Jan M+ Top Selling Price Range for Detached Homes $200,000 - $249,999 5
6 Closed Sales by Price 16 Attached Sales by Price January historical (in thousands) < 30K Jan Jan Jan M+ Top Selling Price Ranges for Attached Homes $120,000 - $139,999 6
7 Market Indicators Supply-Demand Year January February March April May June July August September October November December Number of Active Listings Per Buyer (detached) Supply-Demand The Supply-Demand Ratio is calculated by dividing the number of homes for sale (listings available) by the number of total pending sales for that month. The higher the ratio, the more supply there is relative to demand. Absorption Rate Year January February March April May June July August September October November December Data is for single-family detached homes Month Supply of Homes (detached) Absorption Rate The Absorption Rate measures how long it will take to exhaust or sell the current housing inventory. An average market is traditionally a six-month supply. 7
8 Monthly Sale Prices Median Sale Price Monthly Sale Prices Ye ar January $165,000 $158,000 $167,900 February $161,500 $168,500 March $159,000 $175,000 April $174,775 $168,000 May $175,000 $174,900 June $172,700 $172,000 July $175,000 $182,000 August $165,000 $182,500 September $172,000 $177,500 October $166,300 $166,000 November $165,000 $170,000 December $169,500 $185,000 $251,000 $201,000 $151,000 Median SP Average SP Average Sale Price Ye ar January $194,352 $186,051 $203,687 February $195,165 $203,514 March $189,676 $202,605 April $211,186 $197,908 May $211,213 $211,505 June $207,679 $212,456 July $210,685 $222,505 August $201,833 $223,533 September $203,016 $212,307 October $202,827 $208,152 November $204,653 $207,986 December $211,191 $219,909 $101,000 $51,000 $1,000 Jan-13 Feb-13 Mar-13 Apr-13 May-13 Jun-13 Jul-13 Aug-13 Sep-13 Oct-13 Nov-13 Dec-13 Jan-14 Data is for single-family detached homes 8
9 Ye ar Median Sale Price Median Sale Price 2003 $136, $134, $149, $172, $190, $185, $175, $172, $172, $165, $158, $167,900 % Change Fro m Prev ious Y ear 7.37% -2.01% 11.74% 14.91% 10.30% -2.63% -5.41% -1.58% -0.14% -4.07% -4.24% 6.27% Historical Home Prices $251,000 $201,000 $151,000 Historical Sale Prices (January) Median SP Average SP Average Sale Price Ye ar Av erage Sale Price 2003 $157, $163, $185, $218, $234, $227, $214, $205, $201, $194, $186, $203,687 % Change Fro m Prev ious Y ear 3.14% 3.86% 13.72% 17.76% 7.52% -2.94% -5.72% -4.30% -2.13% -3.42% -4.27% 9.48% $101,000 $51,000 $1, Data is for single-family detached homes 9
10 January Market Activity by Zip Code Zip Code Active listings Sold Listings % of All Sales Zip Code Active listings Sold Listings % of All Sales Zip Code Active listings Sold Listings % of All Sales % % % % % % % % % % % % % % % % % % % % % % % % % % % % % % % % % % % % % % % % % Any Zip code that is located in the Southwest MLS Service Area that had at least 1 Active listing or 1 Sale that month will be included in the Zip Code report. 10
11 Percent Change (ATT) 2014 (ATT) 2013 Percent Change (DET+ATT) 2014 Yearto-Date (DET+ATT) 2013 Yearto-Date Percent Change New Listings Jan 1,288 1, % % 1,416 1, % Feb 1, ,555 Mar 1, ,092 Pending Sales Jan % % 844 1, % Feb ,049 Mar 1, ,266 Closed Sales Jan % % % Dollar Volume of Closed Sales (in millions) Market Overview Feb ,127 Mar ,858 Jan $109.8 $ % $6.7 $ % $116.5 $ % Feb $110.3 $7.2 $213.5 Mar $136.2 $8.7 $358.4 Median Sales Price Jan $167,900 $158, % $128,000 $120, % Feb $168,500 $127, Mar $175,000 $135,000 Average Sales Price Jan $203,687 $186, % $142,447 $131, % Feb $203,514 $132, Mar $202,605 $147,025 Total Active Jan 3,884 3, % % Listings Available Feb 3, Mar 3, Average Days on Market Jan % % Feb Mar
12 City of Albuquerque Market Comparison Albuquerque & Rio Rancho Percent Change City of Rio Rancho Percent Change New Listings Jan % New Listings Jan % Feb 693 Feb 90 Mar 851 Mar 288 Pending Sales Jan % Pending Sales Jan % Feb 618 Feb 159 Mar 767 Mar 203 Closed Sales Jan % Closed Sales Jan % Feb 363 Feb 95 Mar 448 Mar 141 Median Sales Price Jan $171,000 $160, % Median Sales Price Jan $162,518 $146, % Feb $169,900 Feb $155,000 Mar $176,450 Mar $167,900 Average Sales Price Jan $208,880 $185, % Average Sales Price Jan $181,393 $166, % Feb $210,777 Feb $178,225 Mar $204,774 Mar $184,812 Total Active Jan 2,230 2, % Total Active Jan % Feb 2,052 Feb 637 Mar 2,123 Mar 676 Average Days on Market Jan % Average Days on Market Jan % Feb 75 Feb 72 Mar 71 Mar 71 12
13 Market Comparison East Mountains/Estancia Basin & Valencia County East Mountains & Estancia Basin Percent Change Valencia County Percent Change New Listings Jan % New Listings Jan % Feb 56 Feb 107 Mar 87 Mar 90 Pending Sales Jan % Pending Sales Jan % Feb 45 Feb 61 Mar 36 Mar 63 Closed Sales Jan % Closed Sales Jan % Feb 32 Feb 40 Mar 22 Mar 41 Median Sales Price Jan $226,500 $197, % Median Sales Price Jan $102,450 $115, % Feb $208,838 Feb $124,000 Mar $205,000 Mar $130,000 Average Sales Price Jan $249,294 $234, % Average Sales Price Jan $120,136 $120, % Feb $225,712 Feb $135,324 Mar $222,480 Mar $146,677 Total Active Jan % Total Active Jan % Feb 330 Feb 421 Mar 357 Mar 426 Average Days on Market Jan % Average Days on Market Jan % Feb 93 Feb 72 Mar 113 Mar 78 13


14


15


16


17
Greater Albuquerque Area Monthly Housing Trends vs. 2011
 Greater Albuquerque Area Monthly Housing Trends - 2010 vs. 2011 Class R1 (Existing Single-Family Detached) and Class R2 (Existing Condo/Townhome Attached) homes Data on this page was obtained from the
Greater Albuquerque Area Monthly Housing Trends vs. 2014
 Month Greater Albuquerque Association of REALTORS Greater Albuquerque Area Monthly Housing Trends - 2013 vs. 2014 Class R1 (Existing Single-Family Detached) and Class R2 (Existing Condo/Townhome Attached)
Greater Albuquerque Area Monthly Housing Trends vs. 2016
 Month Greater Albuquerque Area Monthly Housing Trends - 2015 vs. 2016 Class R1 (Existing Single-Family Detached) and Class R2 (Existing Condo/Townhome Attached) homes Data on this page was obtained from
Greater Albuquerque Area Monthly Housing Trends vs. 2017
 Month Greater Albuquerque Association of REALTORS Greater Albuquerque Area Monthly Housing Trends - 2016 vs. 2017 Class R1 (Existing Single-Family Detached) and Class R2 (Existing Condo/Townhome Attached)
Year to Date Summary. Average and Median Sale Prices
 A Publication of RMLS, The Source for Real Estate Statistics in Your Community Residential Review: Southwest Washington September 2018 Reporting Period September Residential Highlights Southwest Washington
Inventory Levels - All Prices. Inventory Levels - By Price Range
 Inventory Levels - All Prices Idaho Falls Bonneville Total 3-Mar-17 152 108 260 2-Mar-18 109 78 187-28% Inventory Levels - By Price Range 3-Mar-17 2-Mar-18 0-100,000 41 6 100,001-125,000 19 8 125,001-150,000
Inventory Levels - All Prices. Inventory Levels - By Price Range
 Inventory Levels - All Prices Idaho Falls Bonneville Total 7-Apr-17 154 111 265 6-Apr-18 113 91 204-23% Inventory Levels - By Price Range 7-Apr-17 6-Apr-18 0-100,000 36 10 100,001-125,000 13 9 125,001-150,000
market Quarterly Highlights Single-family detached home sales increased 1.7% from 4th Quarter 2017 to 2,716. Closed Sales
 Q uarterly market R E P O R T Quarterly Highlights 4 th QTR 2018 The average sale price of single-family detached homes in 4th Quarter 2018 was $241,900, a 2.3% increase from 4th Quarter 2017. Single-family
Inventory Levels - All Prices. Inventory Levels - By Price Range
 Inventory Levels - All Prices Idaho Falls Bonneville Total 3-Nov-17 198 128 326 2-Nov-18 155 134 289-11% Inventory Levels - By Price Range 3-Nov-17 2-Nov-18 0-100,000 17 11 100,001-125,000 15 9 125,001-150,000
Price Category Breakdown - February 2010
 SINGLE FAMILY RESIDENTIAL BREAKDOWN ruary 21 ruary Sales and Average Price Increase Annually TORONTO - Wednesday, March 3, 21 7.3 % 24.6 % 1.8 % 7.3%.2%.1 % Greater Toronto REALTORS reported 7,291 sales
Commercial-in-Confidence Ashton Old Baths Financial Model - Detailed Cashflow
 Year 0 1 2 3 4 5 6 7 8 9 10 11 12 13 Oct-16 Nov-16 Dec-16 Jan-17 Feb-17 Mar-17 Apr-17 May-17 Jun-17 Jul-17 Aug-17 Sep-17 Oct-17 2,038 2,922 4,089 4,349 6,256 7,124 8,885 8,885 8,885 8,885 8,885 8,885 9,107
increase of over four per cent compared to the average of $409,058 reported in January 2010.
 SINGLE FAMILY RESIDENTIAL BREAKDOWN uary 211 26.8 % 1.7 % 7.%.4%.1 % Good Start to 211 TORONTO - February 4, 211 Greater Toronto REALTORS reported 4,337 transactions through the TorontoMLS system in uary
COMPARISON OF FIXED & VARIABLE RATES (25 YEARS) CHARTERED BANK ADMINISTERED INTEREST RATES - PRIME BUSINESS*
 CHARTERED BANK ADMINISTERED INTEREST RATES - PRIME BUSINESS*") COMPARISON OF FIXED & VARIABLE RATES (25 YEARS) 2 Fixed Rates Variable Rates For Internal Use Only. FIXED RATES OF THE PAST 25 YEARS AVERAGE RESIDENTIAL MORTGAGE LENDING RATE - 5 YEAR* (Per cent) Year
COMPARISON OF FIXED & VARIABLE RATES (25 YEARS) 2 Fixed Rates Variable Rates For Internal Use Only. FIXED RATES OF THE PAST 25 YEARS AVERAGE RESIDENTIAL MORTGAGE LENDING RATE - 5 YEAR* (Per cent) Year
COMPARISON OF FIXED & VARIABLE RATES (25 YEARS) CHARTERED BANK ADMINISTERED INTEREST RATES - PRIME BUSINESS*
 CHARTERED BANK ADMINISTERED INTEREST RATES - PRIME BUSINESS*") COMPARISON OF FIXED & VARIABLE RATES (25 YEARS) 2 Fixed Rates Variable Rates FIXED RATES OF THE PAST 25 YEARS AVERAGE RESIDENTIAL MORTGAGE LENDING RATE - 5 YEAR* (Per cent) Year Jan Feb Mar Apr May Jun
COMPARISON OF FIXED & VARIABLE RATES (25 YEARS) 2 Fixed Rates Variable Rates FIXED RATES OF THE PAST 25 YEARS AVERAGE RESIDENTIAL MORTGAGE LENDING RATE - 5 YEAR* (Per cent) Year Jan Feb Mar Apr May Jun
M o n. a t i s t i c s. M o n t h l y NOVEMBER 2009
 M o n t h l y M o n t S h l t y a t i s t i c s NOVEMBER 29 For Immediate Release December 7, 29 CONTACT: Kimberly Clifton, President (52) 954-8 Wes Wiggins Vice President, MLS (52) 82-8792 Cheri Meadows
Local Market Update 2012 Year In Review
 Northwest Area Home Sales for the Year 2012 Sales of single-family homes reported in Toledo and the surrounding area by the Toledo Board of REALTORS totaled 6,793. This was an increase of 6% compared to
3 rd QTR Jon Schnoor 2016 GAAR President QUARTERLY MARKET REPORT CONTACT QUARTERLY HIGHLIGHTS. New Listings Closed Sales Average Sale Price
 QUARTERLY MARKET REPORT 3 rd QTR 2016 New Listings Closed Sales Average Sale Price 2016 2015 2016 2015 2016 2015 Detached 4,396 4,354 Detached 3,069 2,886 Detached $228,271 $220,928 Attached 427 417 Attached
Total Production by Month (Acre Feet)
") Production by Month (acre-feet) 2008 2009 2010 2011 2012 2013 2014 2015 2016 January 25 339.10 228.90 249.50 297.99 243.06 327.14 247.66 212.37 February 234.00 218.80 212.10 241.52 245.82 279.08 234.16
Production by Month (acre-feet) 2008 2009 2010 2011 2012 2013 2014 2015 2016 January 25 339.10 228.90 249.50 297.99 243.06 327.14 247.66 212.37 February 234.00 218.80 212.10 241.52 245.82 279.08 234.16
Multiple Listing Service
 For Immediate Release: January 7, 21 CONTACT: Dan Santa Maria MLS President (52) 795-1492 Wes Wiggins Vice President, MLS (52) 382-8792 Cheri Meadows Senior Vice President, TAR (52) 327-4218 For Tucson
August 2018 MLS Statistical Report
 January February March April May June July August Septem October Novem Decem August 218 MLS Statistical Report Total Sales Overall, sales are down 3%; however, total volume sold is up 7% and Median Sale
Greater Las Vegas Snapshot by Sale Type Last Month's Sold
 Available Units Pending Units Las Vegas Market Update - January 2019 Greater Las Vegas Snapshot by Sale Type Last Month's Sold Units Median List Price Average List Price Median Sold Price Average Sold
Local Market Update February 2013
 Local Market Update February 213 February sales of single-family homes reported in Lucas and Upper Wood County by the Toledo Board of REALTORS totaled 315. This was unchanged compared to February of 212.
2nd QTR % +1.24% +0.36% Danny Wm. Vigil 2018 GAAR President QUARTERLY MARKET REPORT CONTACT QUARTERLY HIGHLIGHTS
 QUARTERLY MARKET REPORT 2018 New Listings Closed Sales Average Sale Price 2018 2017 2018 2017 2018 2017 Detached 5,345 5,326 Detached 3,484 3,380 Detached $242,906 $239,934 Attached 477 501 Attached 368
Greater Las Vegas Snapshot by Sale Type Last Month's Sold
 Available Units Pending Units Las Vegas Market Update - August 2018 Greater Las Vegas Snapshot by Sale Type Last Month's Sold Units Median List Price Average List Price Median Sold Price Average Sold Price
Preston s Edmond Market Report
 Preston s Edmond arket Report April 2 Prepared By Brian Preston RE/AX Associates obile: 45-826-5725 Office: 45-359-87 bpreston88@sbcglobal.net www.edmond4sale.com Realtor of the Year 1995 & 22 Lifetime
Summary Statistics. Closed Sales. Paid in Cash. Median Sale Price. Average Sale Price. Dollar Volume. Median Percent of Original List Price Received
 ly Market Detail - May 218 Summary Statistics May 218 May 217 Paid in Cash 1,667 1,647 1.2% 888 943-5.8% $168, $159, 5.7% Average Sale Price Dollar Volume $231,288 $21,944 9.6% $385.6 Million $347.4 Million
Monthly Market Detail - June 2018 Single Family Homes Miami-Dade County
 ly Market Detail - June 218 Summary Statistics June 218 June 217 Paid in Cash 1,335 1,346 -.8% 286 33-5.6% $355, $335, 6.% Average Sale Price Dollar Volume $598,494 $57,82 18.% $799. Million $682.5 Million
Monthly Market Detail - June 2018 Townhouses and Condos Miami-Dade County
 ly Market Detail - June 218 Summary Statistics June 218 June 217 Paid in Cash 1,257 1,323-5.% 657 682-3.7% $24, $235, 2.1% Average Sale Price Dollar Volume $439,546 $384,319 14.4% $552.5 Million $58.5
ANCR CRU Statistics February 2007 to December 2007
 ANCR CRU Statistics February 2007 to December 2007 o Jan/07 Feb/07* Mar/07 Apr/07 May/07 Jun/07 Jul/07 Aug/07 Sep/07 Oct/07 Nov/07 Dec/07 Total notes data from Perimeter phone system unavailable prior
Greater Las Vegas Snapshot by Sale Type Last Month's Sold
 Available Units Pending Units Greater Las Vegas Snapshot by Sale Type Last Month's Sold Units Median List Price Average List Price Median Sold Price Average Sold Price Months of Inventory 30 Day Absorption
Greater Las Vegas Snapshot by Sale Type Last Month's Sold
 Available Units Pending Units Las Vegas Market Update - November 2017 Greater Las Vegas Snapshot by Sale Type Last Month's Sold Units Median List Price Average List Price Median Sold Price Average Sold
Greater Las Vegas Snapshot by Sale Type Last Month's Sold
 Available Units Pending Units Greater Las Vegas Snapshot by Sale Type Last Month's Sold Units Median List Price Average List Price Median Sold Price Average Sold Price Months of Inventory 30 Day Absorption
Greater Las Vegas Snapshot by Sale Type Last Month's Sold
 Available Units Pending Units Greater Las Vegas Snapshot by Sale Type Last Month's Sold Units Median List Price Average List Price Median Sold Price Average Sold Price Months of Inventory 30 Day Absorption
Greater Las Vegas Snapshot by Sale Type Last Month's Sold
 Available Units Pending Units Greater Las Vegas Snapshot by Sale Type Last Month's Sold Units Median List Price Average List Price Median Sold Price Average Sold Price Months of Inventory 30 Day Absorption
Date Event or Holiday :Sun, 2:Mon North Orchard Delong Preschool North Orchard Delong Preschool
 2018 6 1 1:Sun, 2:Mon 2018-2019 Date Event or Holiday Aug 16 Board Meeting 6pm Aug 23 Open House June 2018 July 2018 August 2018 Sep 06 Board Meeting 6pm Su M Tu W Th F Sa Su M Tu W Th F Sa Su M Tu W Th
NEWS Release. U.S. Manufacturing Technology Orders. Year-to-date U.S. manufacturing technology orders up 4.1% over 2011
 U.S. Manufacturing Technology Orders A statistical program of AMT NEWS Release FOR RELEASE: October 8, 2012 Contact: Pat McGibbon, AMT, 703-827-5255 Year-to-date U.S. manufacturing technology orders up
Greater Las Vegas Snapshot by Sale Type Last Month's Sold
 Available Pending Greater Las Vegas Snapshot by Sale Type Last Month's Sold Median List Price Average List Price Median Sold Price Average Sold Price Months of Inventory 30 Day Average Absorption DOM Rate
Greater Las Vegas Snapshot by Sale Type Last Month's Sold
 Available Pending Greater Las Vegas Snapshot by Sale Type Last Month's Sold Median List Price Average List Price Median Sold Price Average Sold Price Months of Inventory 30 Day Average Absorption DOM Rate
Monthly Statistics November 2011
 For Immediate Release: December 9, 211 CONTACT: Greg Hollman MLS President (52) 577-7433 Tucson Association of REALTORS Multiple Listing Service Monthly Statistics November 211 Below are some highlights
2013 / 2014 Revenue Comparison: OCTOBER
 CAR RENTAL GROSS REVENUES 2013 / Revenue Comparison: OCTOBER COMPANY 2013 incr./decr. % change Advantage 1,049,117.25 1,679,547.68 630,430.43 60.1% Alamo/National 5,448,360.80 8,262,318.28 2,813,957.48
Greater Las Vegas Snapshot by Sale Type Last Month's Sold
 Available Units Pending Units Greater Las Vegas Snapshot by Sale Type Last Month's Sold Units Median List Price Average List Price Median Sold Price Average Sold Price Months of Inventory 30 Day Absorption
Up and Down Months of the Stock Market
 Up and Down Months of the Stock Market 1926-2017 Positive years (66) in the stock market were not good all year long and losing years (24) were not losers throughout the year. Winning years produce losing
Greater Las Vegas Snapshot by Sale Type Last
 September 217 Greater Las Vegas Market Update Greater Las Vegas Snapshot by Sale Type Last Available Pending Month's Median List Price List Price Median Price Price Months 3 Day of Absorption DOM Inventory
Greater Las Vegas Snapshot by Sale Type
 500,000 Available Greater Las Vegas Snapshot by Sale Type Pending Last Month's Sold SFR Market Prices Median List Price Average List Price Median Sold Price Average Sold Price Months of Inventory Closed
Monthly Statistical Digest
 Tucson Association of REALTORS Monthly Statistical Digest June 27 FOR IMMEDIATE RELEASE: July 13, 27 CONTACT: Judy Lowe, President - (52) 529-5189 Rick Hodges, CEO - (52) 327-4218 LETTER FROM E PRESIDENT
Greater Las Vegas Snapshot by Sale Type Last
 October 217 Greater Las Vegas Market Update Greater Las Vegas Snapshot by Sale Type Last Available Pending Month's Median List Price List Price Median Price Price Months 3 Day of Absorption DOM Inventory
September 2016 Water Production & Consumption Data
 September 2016 Water Production & Consumption Data September 2016 monthly water production (288.48 AF) was lowest in at least 17 years. Monthly water production has increased slightly each month since
Wheat Marketing Situation
 Wheat Marketing Situation Prepared by: Darrell L. Hanavan Executive Director Colorado Wheat Administrative Committee If you would like to receive an email when this report is updated, email gmostek@coloradowheat.org
Data Current Through: January, Seattle (All Areas) RESIDENTIAL & CONDOMINIUM. Active, Pending, & Months Supply of Inventory. 4 mo.
 RESIDENTIAL & CONDOMINIUM. Active, Pending, & Months Supply of Inventory. 4 mo.") January, 2017 MTD MARKET UPDATE Data Current Through: January, 2017 Active, Pending, & Months Supply of Inventory 4,000 3,500 3,000 3,426 5.9 6.6 3,220 2,973 2,711 Active Listings MTD Pending Sales MTD
January, 2017 MTD MARKET UPDATE Data Current Through: January, 2017 Active, Pending, & Months Supply of Inventory 4,000 3,500 3,000 3,426 5.9 6.6 3,220 2,973 2,711 Active Listings MTD Pending Sales MTD
The Peoples Gas Light and Coke Company
 History of Gas Charges Due to the Operation of Rider 2 (Cents per Therm) Factors for Transportation Customers (Riders FST, SST, P, CFY and AGG) Non- Total Standby Standby Aggregation Commodity Commodity
Florida Courts E-Filing Authority Board. Service Desk Report October 2018
 Florida Courts E-Filing Authority Board Service Desk Report October 218 Customer Service Incidents October 218 Status August 218 September 218 October 218 Incidents Received 3,157 2,685 3,779 Incidents
TABLE C-43. Manufacturers' new and unfilled orders, {Amounts in millions of dollars] Nondurable. Capital goods. Total. goods.
![TABLE C-43. Manufacturers' new and unfilled orders, {Amounts in millions of dollars] Nondurable. Capital goods. Total. goods.](/thumbs/93/112603708.jpg "TABLE C-43. Manufacturers' new and unfilled orders, {Amounts in millions of dollars] Nondurable. Capital goods. Total. goods.") TABLE C-43. Manufacturers' new and unfilled orders, -74 {Amounts in millions of dollars] New orders t, I960. 27, 559 26, 903 30,672 30,115 31,086 33,005 35,322 37,952 41, 803 45, 944 46,763 50, 243 53,
TABLE C-43. Manufacturers' new and unfilled orders, -74 {Amounts in millions of dollars] New orders t, I960. 27, 559 26, 903 30,672 30,115 31,086 33,005 35,322 37,952 41, 803 45, 944 46,763 50, 243 53,
3rd Quarter Market Report 2018
 3rd Quarter Market Report Lake Tahoe Basin Single Family (Excluding lakefront) Lake Tahoe Basin Condo/Townhome (Excluding lakefront & lakefront condo project) Total Units Sold 234 224 4% Total Units Sold
Eastside (All Areas)
") November, 2018 MTD MARKET UPDATE Data Current Through: November, 2018 Active, Pending, & Months Supply of Inventory 4,500 4,000 4,156 6.5 3,926 Active Listings at End of Month Pending Sales MTD 7 mo. 6
November, 2018 MTD MARKET UPDATE Data Current Through: November, 2018 Active, Pending, & Months Supply of Inventory 4,500 4,000 4,156 6.5 3,926 Active Listings at End of Month Pending Sales MTD 7 mo. 6
Data Current Through: February, Seattle (All Areas) RESIDENTIAL & CONDOMINIUM. Active, Pending, & Months Supply of Inventory 1,
 RESIDENTIAL & CONDOMINIUM. Active, Pending, & Months Supply of Inventory 1,") February, 2017 MTD MARKET UPDATE Data Current Through: February, 2017 Active, Pending, & Months Supply of Inventory 4,000 3,500 3,650 3,555 6.9 3,297 Active Listings at End of Month Pending Sales MTD 8
February, 2017 MTD MARKET UPDATE Data Current Through: February, 2017 Active, Pending, & Months Supply of Inventory 4,000 3,500 3,650 3,555 6.9 3,297 Active Listings at End of Month Pending Sales MTD 8
Data Current Through: November, Seattle (All Areas) RESIDENTIAL & CONDOMINIUM. Active, Pending, & Months Supply of Inventory
 RESIDENTIAL & CONDOMINIUM. Active, Pending, & Months Supply of Inventory") November, 2017 MTD MARKET UPDATE Data Current Through: November, 2017 4,000 3,500 3,000 2,500 2,000 1,500 1,000 500 0 3,777 7.9 477 3,169 5.0 3,321 5.6 633 596 2,256 Active, Pending, & Months Supply of
November, 2017 MTD MARKET UPDATE Data Current Through: November, 2017 4,000 3,500 3,000 2,500 2,000 1,500 1,000 500 0 3,777 7.9 477 3,169 5.0 3,321 5.6 633 596 2,256 Active, Pending, & Months Supply of
Data Current Through: April, Seattle (All Areas) RESIDENTIAL & CONDOMINIUM. Active, Pending, & Months Supply of Inventory 1,
 RESIDENTIAL & CONDOMINIUM. Active, Pending, & Months Supply of Inventory 1,") April, 2017 MTD MARKET UPDATE Data Current Through: April, 2017 Active, Pending, & Months Supply of Inventory 5,000 4,500 4,000 3,500 3,000 2,500 4,321 5.3 3,670 4.1 3,960 3.2 2,954 3.3 Active Listings
April, 2017 MTD MARKET UPDATE Data Current Through: April, 2017 Active, Pending, & Months Supply of Inventory 5,000 4,500 4,000 3,500 3,000 2,500 4,321 5.3 3,670 4.1 3,960 3.2 2,954 3.3 Active Listings
Englewood Area Board of Realtors Monthly Sales Trend Indicator 2017 Sales by Price Range - Single Family Homes & Villa s
 Englewood Area Board of Realtors Englewood Area Board of Realtors Sales by Price Range - Single Family Homes & Villa s Price Range Jan-17 Feb-17 Mar-17 Apr-17 May-17 Jun-17 Jul-17 Aug-17 Sep-17 Oct-17
TECHNICAL SERVICE BULLETIN
 TECHNICAL SERVICE BULLETIN To: Minuteman Dealers and Customers From: Minuteman Technical Support Date: 1/12/2011 Subject: TSB for the KIT # K-FRSPEEDSWT. For the FR17115, FR17220, FR20115 and FR20220 models.
FOR IMMEDIATE RELEASE
 Article No. 7761 Available on www.roymorgan.com Roy Morgan Unemployment Profile Monday, 8 October 2018 Unemployment down to 9.4% in September off two-year high Australian employment has grown solidly over
Data Current Through: March, Seattle (All Areas) RESIDENTIAL & CONDOMINIUM. Active, Pending, & Months Supply of Inventory 1,709 1,069 1,111 1.
 RESIDENTIAL & CONDOMINIUM. Active, Pending, & Months Supply of Inventory 1,709 1,069 1,111 1.") March, 2017 MTD MARKET UPDATE Data Current Through: March, 2017 Active, Pending, & Months Supply of Inventory 4,500 4,000 3,500 3,000 3,935 4.8 3,641 5.2 3,659 2,775 Active Listings at End of Month Pending
March, 2017 MTD MARKET UPDATE Data Current Through: March, 2017 Active, Pending, & Months Supply of Inventory 4,500 4,000 3,500 3,000 3,935 4.8 3,641 5.2 3,659 2,775 Active Listings at End of Month Pending
Monthly Statistics April 2011
 For Immediate Release: May 11, 211 CONTACT: Greg Hollman MLS President (52) 577-7433 Wes Wiggins Vice President, MLS (52) 382-8792 Philip Tedesco, RCE, CAE CEO, TAR & MLS (52) 327-4218 Tucson Association
Bulk Storage Containers
 UCSB AST SPCC SELF-INSPECTION CHECKLIST Year: Responsible Department: Tank Location: Tank ID: Bulk Storage Containers Total tank capacity: Petroleum type and amount: Secondary containment type: (diesel,
GAZIFÈRE INC. Prime Rate Forecasting Process 2017 Rate Case
 Overview A consensus forecast is used to estimate the prime rate charged by commercial banks. As the prime rate is subject to competitive pressures faced by individual lenders and is set on an individual
Valley Real Estate Review
 Valley Real Estate Review 35, 3, 25, 2, 15, 1, 5, December 218 Listings Months of Inventory 217 218 % of Change 2,479 2,74 1.53% 2.46 2.77 12.6% Offices Combined Force Total Listing Issued Total Annual
September Arizona Regional MLS. All Home Types Single Family Detached Manufactured All Other
 All Home Types Single Family Detached Manufactured All Other Arizona Regional MLS Presented by Arizona Regional MLS 8,7 7,946 6,803-7.4% -6.1% 9,278 9,142-9.8% -2.2% 8,813 8,123-15.0% -5.8% 8,004 7,223
Multiple Listing Service of Southern Arizona Monthly Statistics January 2017
 For Immediate Release: February 9, 2017 CONTACT: Henry Zipf MLSSAZ President (520) 444-5672 Sean Murphy Executive Vice President (520) 382-8792 Multiple Listing Service of Southern Arizona Monthly Statistics
ANCR CRU Statistics Februa.. to December 2007
 ANCR CRU Statistics Februa.. to December 2007 Jan/07 Feb/07* Mar/07 Apr/07 May/07 Jun/07 Jul/07 Aug/07 Sep/07 Oct/07 Nov/07 Dec/07 Total notes Answered dato from Perimeter phone system unavailable prior
Multiple Listing Service of Southern Arizona Monthly Statistics January 2018
 For Immediate Release: February 12, 218 CONTACT: Judith Grammond MLSSAZ President (52) 721-1478 Sean Murphy Executive Vice President (52) 82-8792 Randy Rogers CEO, MLSSAZ (52) 27-4218 Multiple Listing
FOR IMMEDIATE RELEASE
 Article No. 7845 Available on www.roymorgan.com Roy Morgan Unemployment Profile Friday, 18 January 2019 Unemployment in December is 9.7% and under-employment is 8.8% FOR IMMEDIATE RELEASE Australian unemployment
Macroeconomic Outlook. Presented by Dr. Bruce A. Scherr Chairman of the Board Chief Executive Officer Emeritus
 Macroeconomic Outlook Presented by Dr. Bruce A. Scherr Chairman of the Board Chief Executive Officer Emeritus Waterways Symposium Cincinnati, OH November 15-17, 2016 Topics Energy Macro Implications Inflation
Florida Courts E-Filing Authority Board. Service Desk Report December 2018
 Florida Courts E-Filing Authority Board Service Desk Report December 218 Customer Service Incidents December 218 Status October 218 November 218 December 218 Incidents Received 3,779 2,632 2,376 Incidents
FOR IMMEDIATE RELEASE
 Article No. 7353 Available on www.roymorgan.com Roy Morgan Unemployment Profile Wednesday, 11 October 2017 2.498 million Australians (18.9%) now unemployed or under-employed In September 1.202 million
WIM #37 was operational for the entire month of September Volume was computed using all monthly data.
 SEPTEMBER 2016 WIM Site Location WIM #37 is located on I-94 near Otsego in Wright county. The WIM is located only on the westbound (WB) side of I-94, meaning that all data mentioned in this report pertains
New Construction Absorption and Inventory Report As of March 31, 2014
 New Construction Absorption and Inventory Report As of March 31, 2014 This report identifies the current inventory levels for New Construction in Cumberland Hoke and Harnett County. For Cumberland County
Multiple Listing Service of Southern Arizona Monthly Statistics December 2018
 For Immediate Release: January 8, 219 CONTACT: Cheryl Terpening MLSSAZ President (52) 97-27 Sean Murphy Executive Vice President (52) 2-8792 Randy Rogers CEO, MLSSAZ (52) 327-4218 Multiple Listing Service
VEHICLE / PEDESTRIAN COLLISIONS
 Info item No. 1 Crosswalk Safety Advisory Committee March 31, 2016 VEHICLE / PEDESTRIAN COLLISIONS HRM: January December 20 DISCLAIMER: All figures presented in this report reflect the information held
January Manufacturing Technology Orders Off After a Strong December
 Contact: Bonnie Gurney, AMT, 703-827-5277 bgurney@amtonline.org For Release: March 9, 2015 January Manufacturing Technology Orders Off After a Strong December January U.S. manufacturing technology orders
FOR IMMEDIATE RELEASE
 Article No. 5842 Available on www.roymorgan.com Roy Morgan Unemployment Profile Thursday, 2 October 2014 Unemployment climbs to 9.9% in September as full-time work lowest since October 2011; 2.2 million
Sprinkler System Waiver Application Packet
 Sprinkler System Waiver Application Packet According to the City s municipal code, use of sprinklers is conditional upon use of a water budget and the City continues to discourage customers from irrigating
FOR IMMEDIATE RELEASE
 Article No. 6928 Available on www.roymorgan.com Roy Morgan Unemployment Profile Wednesday, 17 August 2016 Australian real unemployment jumps to 10.5% (up 0.9%) in July during post-election uncertainty
Units of Instruction MISD Pacing Guide Days Date Range Test Date
 MISD Pacing Guide Date Range Test Date Introduction: Processes of Investigations (1 day) Aug. 21 Unit 01: Matter (12 days) Aug. 22-Sept. 7 Sep. 10 Unit 02: Atomic Structure and the Periodic Table (15 days)
Algebra II Pacing Guide
 Unit 13: Exploring a Business Venture (10 days) 8 May 13 - May 24 n/a MISD Pacing Guide Date Range Unit 01: Introduction to Functions in 15 Aug. 21 - Sept. 11 Sept. 12 Unit 02: Absolute Value Functions,,
[Amounts in millions of dollars] Nondurable. Total. goods. equipment 34,415 30,717 24,506 8,868 9,566 8,981
![[Amounts in millions of dollars] Nondurable. Total. goods. equipment 34,415 30,717 24,506 8,868 9,566 8,981](/thumbs/92/109418289.jpg "[Amounts in millions of dollars] Nondurable. Total. goods. equipment 34,415 30,717 24,506 8,868 9,566 8,981") 1970 TABLE C-44. Manufacturers 1 new and unfilled orders, 1947-69 Unfilled orders2 Unfilled orders-shipments Machinery and equipment 1947.. 1948.. 1949.. 23,53.3 3 3 4 3 1961 * 31,085 15,698 17,026 18,522
1970 TABLE C-44. Manufacturers 1 new and unfilled orders, 1947-69 Unfilled orders2 Unfilled orders-shipments Machinery and equipment 1947.. 1948.. 1949.. 23,53.3 3 3 4 3 1961 * 31,085 15,698 17,026 18,522
Presented by Eric Englert Puget Sound Energy September 11, 2002
 Results from PSE s First Year of Time of Use Program Presented by Eric Englert Puget Sound Energy September 11, 2002 Puget Sound Energy Overview 973,489 Total Electric Customers 908,949 are AMR Capable
January During JANUARY. Sunday Monday Tuesday Wednesday Thursday Friday Saturday 1 Dec Feb 2011
 January 2011 1 Dec 2010 Feb 2011 During JANUARY Happy New Year! -- Appoint Company Nominating Committee 1 2 3 4 -- Camp report to Company - Jan 155 6 7 8 9 10 11 6 7 8 9 10 11 12 12 13 14 15 16 17 18 13
Hospitality & Tourism Management January 2015 Calendar Sunday Monday Tuesday Wednesday Thursday Friday Saturday 1 2 3
 Jan-14 Week 1 Week 2 January 2015 Calendar 1 2 3 New Year's Day - 4 5 6 7 8 9 10 New Intake-L4 (EFTH) Assign-Presentation L4 Assign-Presentation L5 Last Exam Reg- CTH Assign Marking Assign Marking Module-
CEO PROGRAM September 2018
 CEO PROGRAM September 2018 1 Sept 17th: ALL! CEO High Orientation (Kiva 6pm 7:30pm) 2 3 4 5 6 7 8 Sept 18th: ALL! CEO Orientation (Kiva 6pm 7:30pm) 9 10 11 12 13 14 15 *Parents please drop off/pick up
Energy Conservation Efforts
 Hennepin County Property Services Energy Conservation Efforts MEPC Presentation September 2010 HENNEPIN COUNTY PROPERTY SERVICES DEPARTMENT MONTHLY ENERGY COSTS $1,200,000 $1,000,000 Cold 2009 October
Docket No. DE Dated: 05/04/2015 Attachment CJG-1 Page 1
 Docket No. DE - Dated: 0/0/0 Attachment CJG- Page 8 9 Summary of Forecasted Energy Service 0 Cost For January 0 Through December 0 TOTAL COST Cents per KWH Reference Fossil energy costs $ 9,9 $. Attachment
DVD Backup Technical Information Web Site Gregg Maroney, Web Master Service Magazines
 DVD Backup Technical Information Web Site Gregg Maroney, Web Master http://www.hudsonterraplane.com/tech/tech_index.htm 1934-1944 Service Magazines 1934 Series Vol. 1, No. 3 - April-July Vol. 1, No. 1
Lakeland Association of Realtors Monthly Sales Trend Indicator 2016 Sales by Price Range - Condominiums, Townhouses and Co-Op's
 akeland Association of Realtors9 Lakeland Association of Realtors Sales by Price Range - Single Family Homes & Villa s rice Range Jan-16 Feb-16 Mar-16 Apr-16 May-16 Jun-16 Jul-16 Aug-16 Sep-16 Oct-16 Nov-16
April 10, Dear Customer:
 Dear Customer: April 10, Attached is the monthly water supply outlook and projected operations for Yellowtail Dam and Powerplant. If you have any questions or concerns, please feel free to call me at 406-247-7334
D G A G R I D A S H B O A R D : A P P L E S
 75 79 60 56 49 74 65 59 54 42 76 63 58 53 78 55 42 43 79 44 81 63 47 83 64 59 53 48 Sources: Eurostat, MSs notifications, DG Agri, Comext, Comtrade, GTA, ITC, AMI, Expert groups, Freshfel, Wapa. 89 68
FOR IMMEDIATE RELEASE
 Article No. 7137 Available on www.roymorgan.com Roy Morgan Unemployment Profile Wednesday, 8 February 2017 Over 12 million Australians have jobs for the first time including over 8 million full-time jobs,
COMPILED BY GLASS S. Auction Report - LCV November 2013
 GLASS S Auction Report - LCV November 2013 Contents Market Commentary Page 3 Whole Market Summary Page 8 Average Sales Price Year on Year Page 9 Sales Price Compared to Number of Entries (all ages) Page
November 2018 Customer Switching Report for the Electricity and Gas Retail Markets
 An Coimisiún um Rialáil Fóntas Commission for Regulation of Utilities November 2018 Customer Switching Report for the Electricity and Gas Retail Markets Information Paper Reference: CRU18266 Date Published:
FOR IMMEDIATE RELEASE
 Article No. 7433 Available on www.roymorgan.com Roy Morgan Unemployment Profile Friday, 12 January 2018 2.6m Australians unemployed or under-employed in December The latest data for the Roy Morgan employment
Appendix E Water Supply Modeling
 Supply Modeling Modesto Irrigation District Treatment Plant Expansion Project Modeling I. Introduction The Modesto Irrigation District (MID) is situated adjacent to and north of the Tuolumne River. Over
Operational Overview. Operational Forum, 24 th March 2010
 Operational Overview Operational Forum, 24 th March 21 Weather Weather February 21 The cold weather continued throughout February with all but one day being colder than the 17-year seasonal normal CWV.