FOR IMMEDIATE RELEASE
|
|
|
- Andrea Richardson
- 5 years ago
- Views:
Transcription
 and under-employment of 8.8% (down 0.8%) are both down on a year ago driving a 0.9% fall in overall labour under-utilisation to 18.")
 The latest data for the Roy Morgan employment series for December shows: The workforce, which comprises employed Australians and those who are unemployed and looking for work, is now")

1 Article No Available on Roy Morgan Unemployment Profile Friday, 18 January 2019 Unemployment in December is 9.7% and under-employment is 8.8% FOR IMMEDIATE RELEASE Australian unemployment of 9.7% (down 0.1%) and under-employment of 8.8% (down 0.8%) are both down on a year ago driving a 0.9% fall in overall labour under-utilisation to 18.5% (2.5 million) The latest data for the Roy Morgan employment series for December shows: The workforce, which comprises employed Australians and those who are unemployed and looking for work, is now 13,376,000, down 34,000 on a year ago.12,074,000 Australians were employed in December, down 24,000 over the past year; The decrease in employment was driven by a drop in part-time employment of 89,000 to 4,115,000. An increase in full-time employment of 65,000 to 7,959,000 wasn t enough to offset this drop; 1,302,000 Australians (9.7% of the workforce) were unemployed in December, virtually unchanged on a year ago and the unemployment rate is down by only 0.1%; In addition 1,178,000 Australians (8.8% of the workforce) were under-employed, working part-time and looking for more work, a decrease of 110,000 in a year (down 0.8%). In total 2,480,000 Australians (18.5% of the workforce) were either unemployed or under-employed in December, a decrease of 120,000 in a year (down 0.9%); Roy Morgan s real unemployment figure of 9.7% for December is significantly higher than the current ABS estimate for November 2018 of 5.1%. Source: Roy Morgan Single Source October 2005 December Average monthly interviews 4,000. For further information: Contact Office Mobile Gary Morgan: Michele Levine:
2 FOR IMMEDIATE RELEASE Michele Levine, CEO Roy Morgan, says the good news is that both unemployment and underemployment are both down on a year ago however this isn t due to a surge in new jobs: Growth in the Australian employment market over the past year has stalled with a contraction in the total number of Australians employed compared to December Full-time employment increased by 65,000 from a year ago however part-time employment was down by 89,000. The overall Australian workforce, which includes both employed and unemployed Australians, is down 34,000 on a year ago driven by the decline in employed Australians as well as a small fall in unemployment. In December there were million unemployed Australians down by 10,000 on a year ago (1.312 million) and equivalent to 9.7% of the workforce. A further million Australians (8.8% of the workforce) are under-employed meaning a total of 2.48 million Australians (18.5% of the workforce) are now unemployed and looking for work or employed part-time and looking for more work (under-employed). The continuing high level of unemployment and under-employment is a vitally important issue for many Australians that may be looking for work or may have a close friend or family member after further employment. The L-NP Government s failure to meaningfully impact total unemployment and under-employment since being elected in 2013 is a huge problem for the Morrison Government which is seeking re-election at this year s Federal election due in the next few months. labour under-utilisation in Australia has been consistently over 2 million for over seven years now since The continuing high number of Australians looking for a job, or looking for more hours at work, has tracked the increasing share of the vote for minor parties at Federal Elections. Minor parties have increased their share of the vote at each Federal election over the last decade up to a multi-decade high of 22.9% at the 2016 Federal election and this trend looks set to continue based on the results of the recent Victorian election. This Roy Morgan survey on Australia s unemployment and under-employed * is based on weekly faceto-face interviews of 613,049 Australians aged 14 and over between January 2007 December 2018 and includes 4,220 face-to-face interviews in December *The under-employed are those people who are in part-time work or consultants who are looking for more work. (Unfortunately the ABS does not release this figure in their monthly unemployment survey results). Margin of Error The margin of error to be allowed for in any estimate depends mainly on the number of interviews on which it is based. The following table gives indications of the likely range within which estimates would be 95% likely to fall, expressed as the number of percentage points above or below the actual estimate. The figures are approximate and for general guidance only, and assume a simple random sample. Allowance for design effects (such as stratification and weighting) should be made as appropriate. Sample Size % Estimate 40%-60% 25% or 75% 10% or 90% 5% or 95% 5,000 ±1.4 ±1.2 ±0.8 ±0.6 50,000 ±0.4 ±0.4 ±0.3 ±0.2
3 Roy Morgan Unemployed and Under-employed * Estimates FOR IMMEDIATE RELEASE Unemployed or Unemployed looking for Underemployed * Unemployed Under-employed * Full-time Part-time % 000 % % Jan-Mar , , , Apr-Jun , , , Jul-Sep , , , Oct-Dec , , , Jan-Mar , , , Apr-Jun , , , Jul-Sep , , , Oct-Dec , , , Months November , , , December , , , January , , , February , , , March , , , April , , , May , , , June , , , July , , , August , , , September , , , October , , , November , , , December , , , *Workforce includes those employed and those looking for work the unemployed. ROY MORGAN MEASURES REAL UNEMPLOYMENT IN AUSTRALIA NOT THE PERCEPTION OF UNEMPLOYMENT JUNE 8, 2012 The Roy Morgan Unemployment estimate is obtained by surveying an Australia-wide cross section by face-to-face interviews. A person is classified as unemployed if they are looking for work, no matter when. The results are not seasonally adjusted and provide an accurate measure of monthly unemployment estimates in Australia. The Australian Bureau of Statistics Unemployment estimates are obtained by mostly telephone interviews. Households selected for the ABS Survey are interviewed each month for eight months, with one-eighth of the sample being replaced each month. The first interview is conducted face-to-face. Subsequent interviews are then conducted by telephone. The ABS classifies a person as unemployed if, when surveyed, they have been actively looking for work in the four weeks up to the end of the reference week and if they were available for work in the reference week. The ABS classifies a person as employed if, when surveyed, a person worked for one hour or more during the reference week for pay, profit, commission or payment in kind, or even if a person worked for one hour or more without pay in a family business or on a farm. The Australian Bureau of Statistics Unemployment estimates are also seasonally adjusted. For these reasons the Australian Bureau of Statistics Unemployment estimates are different from the Roy Morgan Unemployment estimate. Gary Morgan's concerns regarding the ABS Unemployment estimate is clearly outlined in his letter to the Australian Financial Review, which was not published.


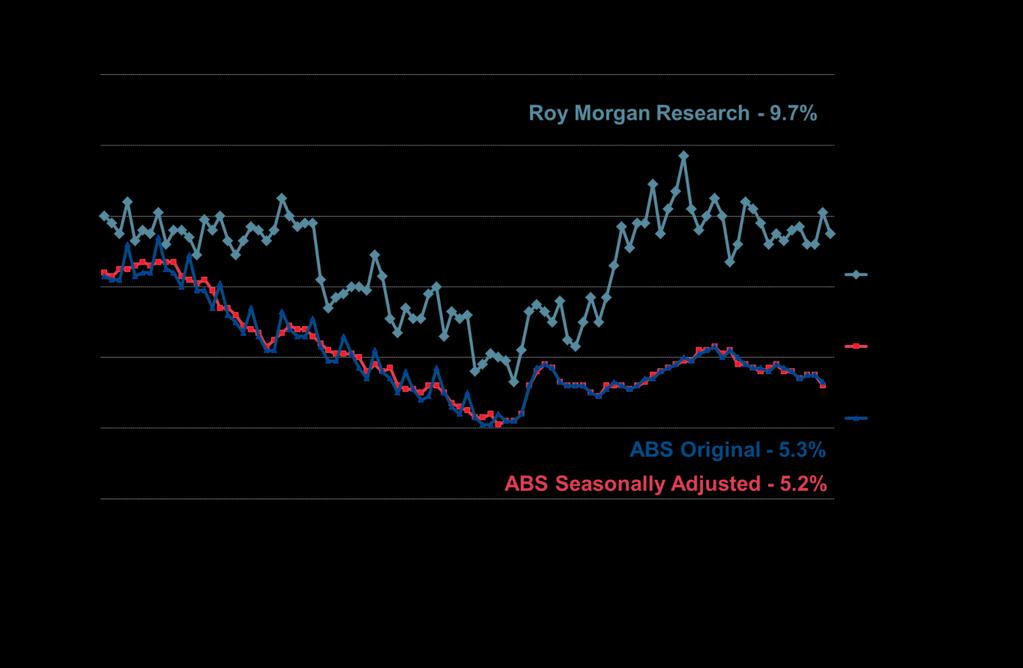
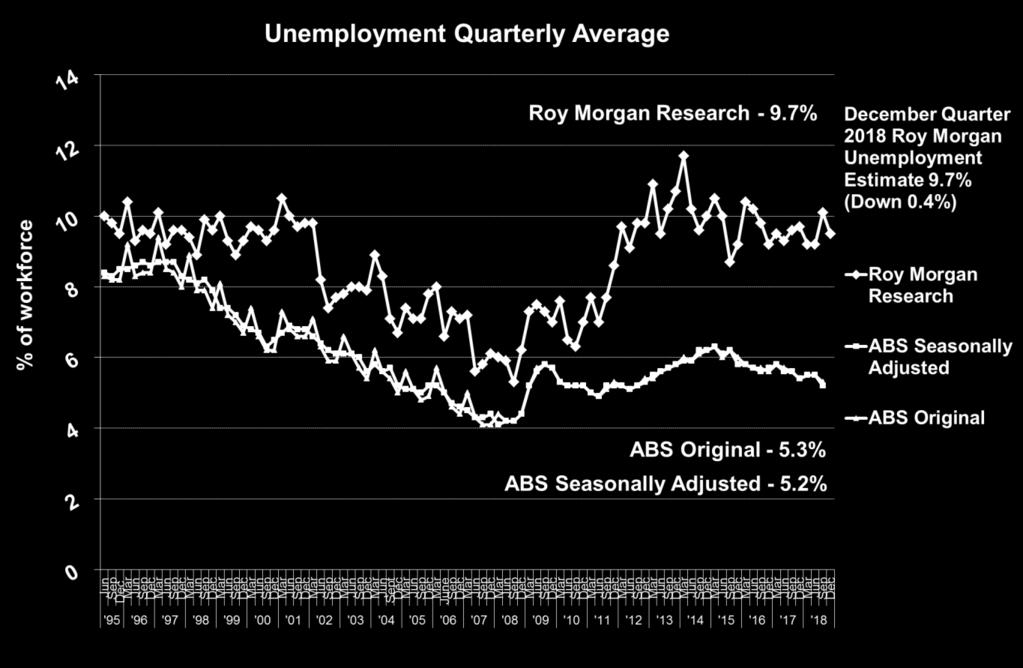
4 Roy Morgan Research vs. ABS Unemployment Estimates FOR IMMEDIATE RELEASE
5 The Roy Morgan Unemployment Estimate The ABS Unemployment Estimates FOR IMMEDIATE RELEASE % of Work Force % of Work Force Unemployed Looking For Work Unemployed Looking For Work* Original Adjusted* 1999 ( 000) ( 000) % % ( 000) ( 000) % % % % Jan. 1, Feb March 818 (920) 8.9 (10.0) 696 (699) 7.8 (8.1) 7.4 (7.4) April May June 866 (847) 9.5 (9.3) 680 (696) 6.9 (7.2) 7.2 (7.4) July Aug Sep. 831 (827) 8.9 (8.9) 703 (682) 7.4 (7.0) 7.4 (7.2) Oct Nov Dec. 862 (853) 9.4 (9.3) 672 (662) 6.9 (6.7) 7.0 (6.9) 2000 Jan Feb March 868 (901) 9.4 (9.7) 700 (666) 7.3 (7.4) 6.9 (6.8) April May June 826 (888) 8.9 (9.6) 609 (637) 6.3 (6.6) 6.6 (6.7) July Aug Sep. 869 (865) 9.4 (9.3) 614 (616) 6.4 (6.2) 6.3 (6.3) Oct Nov Dec. 953 (900) 10.2 (9.6) 643 (632) 6.5 (6.2) 6.6 (6.5) 2001 Jan Feb March 989 (977) 10.6 (10.5) 662 (661) 7.2 (7.3) 6.5 (6.7) April May June 908 (942) 9.7 (10.0) 681 (676) 6.7 (6.8) 6.9 (6.9) July Aug Sep. 1,006 (920) 10.7 (9.7) 672 (645) 6.8 (6.6) 6.7 (6.5) Oct Nov Dec. 1,003 (935) 10.5 (9.8) 665 (674) 6.6 (6.6) 6.7 (6.8) 2002 Jan. 1, Feb March 841 (947) 8.9 (9.8) 622 (656) 6.7 (7.1) 6.3 (6.6) April May June 794 (783) 8.3 (8.2) 644 (629) 6.3 (6.3) 6.5 (6.4) July Aug Sep. 703 (715) 7.3 (7.4) 617 (616) 6.2 (5.9) 6.2 (6.2) Oct Nov Dec. 730 (731) 7.7 (7.7) 628 (615) 6.1 (5.9) 6.2 (6.1) Average calculated for previous three months; *Seasonally adjusted figures.
6 The Roy Morgan Unemployment Estimate The ABS Unemployment Estimates FOR IMMEDIATE RELEASE % of Work Force % of Work Force Unemployed Looking For Work Unemployed Looking For Work* Original Adjusted* 2003 ( 000) ( 000) % % ( 000) ( 000) % % % % Jan Feb March 769 (750) 8.0 (7.8) 626 (619) 6.5 (6.6) 6.2 (6.1) April May June 764 (766) 8.0 (8.0) 620 (619) 5.9 (6.1) 6.1 (6.1) July Aug Sep. 761 (776) 7.8 (8.0) 590 (602) 5.8 (5.7) 5.8 (6.0) Oct Nov Dec. 863 (781) 8.8 (7.9) 575 (575) 5.6 (5.4) 5.6 (5.6) 2004 Jan Feb March 892 (899) 8.8 (8.9) 574 (584) 5.9 (6.2) 5.6 (5.8) April May June 826 (819) 8.5 (8.3) 575 (570) 5.5 (5.6) 5.6 (5.6) July Aug Sep. 698 (711) 7.1 (7.1) 572 (578) 5.5 (5.4) 5.6 (5.7) Oct Nov Dec. 688 (671) 6.8 (6.7) 527 (536) 5.0 (5.0) 5.1 (5.2) 2005 Jan Feb March 753 (748) 7.5 (7.4) 540 (535) 5.4 (5.6) 5.2 (5.1) April May June 669 (734) 6.5 (7.1) 527 (536) 4.9 (5.1) 5.0 (5.1) July Aug Sep. 681 (726) 6.7 (7.1) 539 (531) 5.1 (4.8) 5.1 (5.0) Oct Nov Dec. 864 (802) 8.5 (7.8) 546 (544) 5.1 (4.9) (5.2) Jan Feb March 815 (847) 7.7 (8.0) 532 (558) 5.3 (5.7) 5.0 (5.2) April May June 659 (702) 6.2 (6.6) 529 (531) 4.8 (5.0) 4.9 (5.0) July Aug Sep. 803 (767) 7.6 (7.3) 513 (517) 4.8 (4.6) 4.8 (4.8) Oct Nov Dec. 712 (752) 6.7 (7.1) 502 (499) 4.5 (4.4) 4.6 (4.6) Average calculated for previous three months; *Seasonally adjusted figures.
7 The Roy Morgan Unemployment Estimate The ABS Unemployment Estimates FOR IMMEDIATE RELEASE % of Work Force % of Work Force Unemployed Looking For Work Unemployed Looking For Work* Original Adjusted* 2007 ( 000) ( 000) % % ( 000) ( 000) % % % % Jan Feb March 636 (757) 6.3 (7.2) 485 (493) 4.7 (5.0) 4.5 (4.5) April May June 579 (596) 5.5 (5.6) 472 (470) 4.2 (4.3) 4.3 (4.3) July Aug Sep. 658 (614) 6.2 (5.8) 461 (467) 4.2 (4.1) 4.2 (4.3) Oct Nov Dec. 740 (647) 7.0 (6.1) 468 (482) 4.2 (4.1) (4.4) Jan Feb March 651 (646) 6.1 (6.0) 455 (451) 4.1 (4.4) 4.1 (4.1) April May June 629 (632) 5.8 (5.9) 476 (477) 4.3 (4.2) 4.3 (4.2) July Aug Sep. 538 (584) 4.9 (5.3) 478 (472) 4.3 (4.2) 4.3 (4.2) Oct Nov Dec. 700 (674) 6.4 (6.2) 501 (495) 4.4 (4.4) (4.4) Jan Feb March 775 (809) 7.0 (7.3) 651 (595) 5.4 (5.0) 5.7 (5.2) April May June 862 (829) 7.8 (7.5) 669 (645) 5.8 (5.7) 5.8 (5.6) July Aug Sep. 775 (825) 6.9 (7.3) 659 (662) 5.8 (5.8) 5.7 (5.8) Oct Nov Dec. 773 (787) 6.8 (7.0) 639 (654) 5.6 (5.7) (5.7) Jan Feb March 836 (873) 7.4 (7.6) 619 (616) 5.3 (5.3) 5.3 (5.3) April May June 682 (749) 5.9 (6.5) 598 (609) 5.2 (5.2) 5.1 (5.2) July Aug Sep. 756 (737) 6.5 (6.3) 611 (617) 5.1 (5.2) 5.1 (5.2) Oct Nov Dec. 903 (826) 7.7 (7.0) 599 (625) 5.1 (5.2) 5.0 (5.2) Average calculated for previous three months; *Seasonally adjusted figures.
8 The Roy Morgan Unemployment Estimate The ABS Unemployment Estimates FOR IMMEDIATE RELEASE Looking For Work % of Work Force Unemployed Looking For Work* % of Work Force Unemployed Original Adjusted* 2011 ( 000) ( 000) % % ( 000) ( 000) % % % % Jan Feb March 863 (913) 7.4 (7.7) 593 (601) 4.9 (5.0) 4.9 (5.0) April May June 846 (837) 7.0 (7.0) 591 (589) 4.9 (4.9) 4.9 (4.9) July Aug Sep. 919 (914) 7.7 (7.7) 634 (628) 5.2 (5.1) 5.2 (5.2) Oct. 1, Nov. 1, Dec. 1,034 (1,035) 8.6 (8.6) 630 (632) 5.3 (5.3) (5.2) Jan. 1, Feb. 1, March 1,120 (1,192) 9.3 (9.7) 629 (625) 5.2 (5.2) 5.2 (5.2) April 1, May June 1,169 (1,105) 9.7 (9.1) 631 (617) 5.1 (5.1) 5.2 (5.1) July 1, Aug. 1, Sep. 1,214 (1,197) 10.0 (9.8) 663 (640) 5.3 (5.2) 5.4 (5.2) Oct. 1, Nov. 1, Dec. 1,175 (1,189) 9.6 (9.8) 656 (649) 5.4 (5.4) (5.3) Jan. 1, Feb. 1, March 1,369 (1,352) 10.8 (10.9) 687 (669) 5.5 (5.4) 5.6 (5.5) April 1, May 1, June 1,205 (1,176) 9.7 (9.5) 709 (692) 5.7 (5.6) 5.7 (5.6) July 1, Aug. 1, Sep. 1,297 (1,272) 10.4 (10.2) 697 (705) 5.7 (5.7) 5.6 (5.7) Oct. 1, Nov. 1, Dec. 1,411 (1,337) 11.2 (10.7) 722 (715) 5.8 (5.8) 5.8 (5.8) 2014 Jan. 1, Feb. 1, March 1,465 (1,488) 11.6 (11.7) 713 (728) 6.0 (6.0) 5.8 (5.9) April 1, May 1, June 1,326 (1,273) 10.6 (10.2) 742 (724) 5.9 (5.9) 6.0 (5.9) July 1, Aug. 1, Sep. 1,208 (1,179) 9.9 (9.6) 747 (764) 6.0 (6.1) 6.2 (6.2) Oct. 1, Nov. 1, Dec. 1,402 (1,251) 10.9 (10.0) 759 (770) 6.2 (6.2) 6.1 (6.2) Average calculated for previous three months; *Seasonally adjusted figures.
9 The Roy Morgan Unemployment Estimate The ABS Unemployment Estimates FOR IMMEDIATE RELEASE Looking For Work % of Work Force Unemployed Looking For Work* % of Work Force Unemployed Original Adjusted* 2015 ( 000) ( 000) % % ( 000) ( 000) % % % % Jan. 1, Feb. 1, March 1,368 (1,327) 10.8 (10.5) 765 (779) 6.2 (6.3) 6.1 (6.3) April 1, May 1, June 1,192 (1,263) 9.3 (10.0) 756 (757) 6.0 (6.0) 6.0 (6.1) July 1, Aug. 1, Sep. 1,058 (1,109) 8.3 (8.7) 772 (783) 6.2 (6.2) 6.2 (6.2) Oct. 1, Nov. 1, Dec. 1,256 (1,184) 9.7 (9.2) 728 (736) 5.8 (6.0) 5.8 (5.8) 2016 Jan. 1, Feb. 1, March 1,422 (1,362) 11.0 (10.4) 723 (739) 5.8 (5.8) 5.7 (5.8) April 1, May 1, June 1,247 (1,317) 9.6 (10.2) 734 (728) 5.7 (5.7) 5.8 (5.7) July 1, Aug. 1, Sep. 1,101 (1,266) 8.5 (9.8) 705 (715) 5.6 (5.7) 5.6 (5.6) Oct. 1, Nov. 1, Dec. 1,186 (1,191) 9.2 (9.2) 741 (724) 5.7 (5.6) 5.8 (5.7) 2017 Jan. 1, Feb. 1, March 1,236 (1,261) 9.3 (9.5) 753 (747) 5.9 (5.8) 5.9 (5.8) April 1, May 1, June 1,200 (1,234) 8.9 (9.3) 728 (724) 5.6 (5.7) 5.6 (5.6) July 1, Aug. 1, Sep. 1,202 (1,254) 9.1 (9.6) 712 (724) 5.5 (5.6) 5.5 (5.6) Oct. 1, Nov. 1, Dec. 1,312 (1,275) 9.8 (9.7) 731 (714) 5.4 (5.4) 5.5 (5.4) 2018 Jan. 1, Feb. 1, March 1,210 (1,246) 8.9 (9.2) 730 (729) 5.6 (5.5) 5.5 (5.5) April 1, May 1, June 1,171 (1,228) 8.7 (9.2) 714 (723) 5.4 (5.5) 5.4 (5.5) July 1, Aug. 1, Sep. 1,256 (1,354) 9.4 (10.1) 666 (694) 5.2 (5.3) 5.0 (5.2) Oct. 1, Nov. 1, Dec. 1,302 (1,286) 9.7 (9.5) Average calculated for previous three months; *Seasonally adjusted figures.
10 FOR IMMEDIATE RELEASE ABS Employment Estimates Detailed % of workforce unemployed Looking workforce* employed* for work* Original Adjusted* 1999 ( 000) ( 000) ( 000) ( 000) ( 000) ( 000) % % % % Jan Feb March 9399 (9396) 8703 (8697) 696 (699) 7.8 (8.1) 7.4 (7.4) April May June 9455 (9429) 8775 (8733) 680 (696) 6.9 (7.2) 7.2 (7.4) July Aug Sep (9446) 8831 (8814) 703 (682) 7.4 (7.0) 7.4 (7.2) Oct Nov Dec (9550) 8912 (8888) 672 (662) 6.9 (6.7) 7.0 (6.9) 2000 Jan Feb March 9650 (9605) 8950 (8938) 700 (666) 7.3 (7.4) 6.9 (6.8) April May June 9665 (9663) 9056 (9026) 609 (637) 6.3 (6.6) 6.6 (6.7) July Aug Sep (9740) 9111 (9124) 614 (616) 6.4 (6.2) 6.3 (6.3) Oct Nov Dec (9712) 9087 (9080) 643 (632) 6.5 (6.2) 6.6 (6.5) 2001 Jan Feb March 9752 (9752) 9090 (9091) 662 (661) 7.2 (7.3) 6.5 (6.7) April May June 9830 (9816) 9149 (9147) 681 (676) 6.7 (6.8) 6.9 (6.9) July Aug Sep (9835) 9255 (9190) 672 (645) 6.8 (6.6) 6.7 (6.5) Oct Nov Dec (9864) 9199 (9189) 665 (674) 6.6 (6.6) 6.7 (6.8) 2002 Jan Feb March 9927 (9939) 9304 (9283) 622 (656) 6.7 (7.1) 6.3 (6.6) April May June 9962 (9924) 9318 (9294) 643 (628) 6.3 (6.3) 6.5 (6.4) July Aug Sep (9954) 9347 (9338) 617 (616) 6.2 (5.9) 6.2 (6.2) Oct Nov Dec (10035) 9476 (9421) 628 (615) 6.1 (5.9) 6.2 (6.1) Average calculated for previous three months; *Seasonally adjusted figures.
11 FOR IMMEDIATE RELEASE ABS Employment Estimates Detailed % of workforce unemployed Looking workforce* employed* for work* Original Adjusted* 2003 ( 000) ( 000) ( 000) ( 000) ( 000) ( 000) % % % % Jan Feb March (10172) 9521 (9554) 626 (619) 6.5 (6.6) 6.2 (6.1) April May June (10135) 9508 (9516) 620 (619) 5.9 (6.1) 6.1 (6.1) July Aug Sep (10125) 9555 (9524) 590 (602) 5.8 (5.7) 5.8 (6.0) Oct Nov Dec (10213) 9666 (9639) 575 (575) 5.6 (5.4) 5.6 (5.6) 2004 Jan Feb March (10178) 9637 (9594) 574 (584) 5.9 (6.2) 5.6 (5.8) April May June (10236) 9646 (9666) 575 (570) 5.5 (5.6) 5.6 (5.6) July Aug Sep (10256) 9717 (9678) 572 (578) 5.5 (5.4) 5.6 (5.7) Oct Nov Dec (10330) 9822 (9794) 527 (536) 5.0 (5.0) 5.1 (5.2) 2005 Jan Feb March (10437) 9948 (9903) 540 (535) 5.4 (5.6) 5.2 (5.1) April May June (10527) (9991) 527 (536) 4.9 (5.1) 5.0 (5.1) July Aug Sep (10573) (10042) 539 (531) 5.1 (4.8) 5.1 (5.0) Oct Nov Dec (10567) (10022) 546 (544) 5.1 (4.9) 5.2 (5.2) 2006 Jan Feb March (10607) (10059) 532 (548) 5.3 (5.7) 5.0 (5.2) April May June (10672) (10141) 529 (531) 4.8 (5.0) 4.9 (5.0) July Aug Sep (10781) (10264) 513 (517) 4.8 (4.6) 4.8 (4.8) Oct Nov Dec (10793) (10294) 502 (499) 4.5 (4.4) 4.6 (4.6) Average calculated for previous three months; *Seasonally adjusted figures.
12 FOR IMMEDIATE RELEASE ABS Employment Estimates Detailed % of workforce unemployed Looking workforce* employed* for work* Original Adjusted* 2007 ( 000) ( 000) ( 000) ( 000) ( 000) ( 000) % % % % Jan Feb March (10850) (10358) 485 (493) 4.7 (5.0) 4.5 (4.5) April May June (10913) (10443) 472 (470) 4.2 (4.3) 4.3 (4.3) July Aug Sep (10975) (10508) 461 (467) 4.2 (4.1) 4.2 (4.3) Oct Nov Dec (11056) (10574) 468 (482) 4.2 (4.1) 4.2 (4.4) 2008 Jan Feb March (11112) (10660) 455 (451) 4.1 (4.4) 4.1 (4.1) April May June (11181) (10704) 476 (477) 4.3 (4.2) 4.3 (4.2) July Aug Sep (11211) (10739) 478 (472) 4.3 (4.2) 4.3 (4.2) Oct Nov Dec (11240) (10745) 501 (495) 4.4 (4.4) 4.5 (4.4) 2009 Jan Feb March (11369) (10774) 651 (595) 5.4 (5.0) 5.7 (5.2) April May June (11428) (10785) 663 (643) 5.8 (5.7) 5.8 (5.6) July Aug Sep (11450) (10788) 659 (662) 5.8 (5.8) 5.7 (5.8) Oct Nov Dec (11523) (10869) 639 (654) 5.6 (5.7) 5.5 (5.7) 2010 Jan Feb March (11591) (10975) 619 (616) 5.3 (5.3) 5.3 (5.3) April May June (11670) (11061) 598 (609) 5.2 (5.2) 5.1 (5.2) July Aug Sep (11895) (11278) 611 (617) 5.1 (5.2) 5.1 (5.2) Oct Nov Dec (12021) (11397) 599 (625) 5.1 (5.2) 5.0 (5.2) Average calculated for previous three months; *Seasonally adjusted figures.
13 FOR IMMEDIATE RELEASE ABS Employment Estimates Detailed % of workforce unemployed Looking workforce* employed* for work* Original Adjusted* 2011 ( 000) ( 000) ( 000) ( 000) ( 000) ( 000) % % % % Jan Feb March (12038) (11437) 593 (601) 4.9 (5.0) 4.9 (5.0) April May June (12033) (11444) 581 (586) 4.9 (4.9) 4.9 (4.9) July Aug Sep (12072) (11445) 634 (628) 5.2 (5.1) 5.2 (5.2) Oct Nov Dec (12079) (11447) 630 (632) 5.3 (5.3) 5.2 (5.2) 2012 Jan Feb March (12091) (11466) 629 (625) 5.2 (5.2) 5.2 (5.2) April May June (12131) (11513) 631 (617) 5.1 (5.1) 5.2 (5.1) July Aug Sep (12148) (11508) 663 (640) 5.3 (5.2) 5.4 (5.2) Oct Nov Dec (12185) (11536) 656 (649) 5.4 (5.4) 5.4 (5.3) 2013 Jan Feb March (12259) (11590) 687 (669) 5.5 (5.4) 5.6 (5.5) April May June (12358) (11665) 709 (692) 5.7 (5.6) 5.7 (5.6) July Aug Sep (12351) (11645) 697 (705) 5.7 (5.7) 5.6 (5.7) Oct Nov Dec (12357) (11643) 722 (715) 5.8 (5.8) 5.8 (5.8) 2014 Jan Feb March (12228) (11556) 713 (728) 6.0 (6.0) 5.8 (5.9) April May June (12296) (11572) 742 (724) 5.9 (5.9) 6.0 (5.9) July Aug Sep (12388) (11624) 747 (764) 6.0 (6.1) 6.2 (6.2) Oct Nov Dec (12406) (11636) 759 (770) 6.2 (6.2) 6.1 (6.2) Average calculated for previous three months; *Seasonally adjusted figures.
14 FOR IMMEDIATE RELEASE ABS Employment Estimates Detailed % of workforce unemployed Looking workforce* employed* for work* Original Adjusted* 2015 ( 000) ( 000) ( 000) ( 000) ( 000) ( 000) % % % % Jan Feb March (12459) (11680) 765 (779) 6.2 (6.3) 6.1 (6.3) April May June (12508) (11751) 756 (757) 6.0 (6.0) 6.0 (6.1) July Aug Sep (12551) (11768) 772 (785) 6.2 (6.2) 6.2 (6.2) Oct Nov Dec (12616) (11880) 728 (736) 5.8 (6.0) 5.8 (5.8) 2016 Jan Feb March (12635) (11,896) 723 (739) 5.8 (5.8) 5.7 (5.8) April May June (12657) (11929) 734 (728) 5.7 (5.7) 5.8 (5.7) July Aug Sep (12674) (11960) 705 (715) 5.6 (5.7) 5.6 (5.6) Oct Nov Dec (12690) (11966) 741 (724) 5.7 (5.6) 5.8 (5.7) 2017 Jan Feb March (12761) (12015) 753 (747) 5.9 (5.8) 5.9 (5.8) April May June (12864) (12140) 728 (724) 5.6 (5.7) 5.6 (5.6) July Aug Sep (12977) (12253) 712 (724) 5.5 (5.6) 5.5 (5.6) Oct Nov Dec (13094) (12380) 731 (714) 5.4 (5.4) 5.5 (5.4) 2018 Jan Feb March (13202) (12473) 730 (729) 5.6 (5.5) 5.5 (5.5) April May June (13254) (12531) 714 (723) 5.4 (5.5) 5.4 (5.5) July Aug Sep (13308) (12614) 666 (694) 5.2 (5.3) 5.0 (5.2) Oct Nov Dec. Average calculated for previous three months; *Seasonally adjusted figures
15 Roy Morgan Employment Estimate Detailed Workforce Employed % of workforce Unemployed Looking for work Quarterly Full-time Part-time Quarterly Full-time Part-time Unemployed Quarterly For work Quarterly Full-time Part-time 1999 ( 000) ( 000) ( 000) ( 000) ( 000) ( 000) ( 000) ( 000) % % ( 000) ( 000) ( 000) % ( 000) % Jan , Feb March 9175 (9204) (8284) (10.0) 818 (920) April May June 9110 (9078) (8231) (9.3) 866 (847) July Aug Sep (9277) (8450) (8.9) 831 (827) Oct Nov Dec (9178) (8325) (9.3) 862 (853) Jan Feb March 9226 (9270) (8369) (9.7) 867 (901) April May June 9277 (9237) (8349) (9.6) 826 (888) July Aug Sep (9335) (8470) (9.3) 869 (865) Oct Nov Dec (9335) (8435) (9.6) 953 (900) Jan Feb March 9320 (9336) (8359) (10.5) 989 (977) April May June 9344 (9377) (8435) (10.0) 908 (942) July Aug Sep (9475) (8555) (9.7) 1,006 (920) Oct Nov Dec (9578) (8643) (9.8) 1,003 (935) Average calculated for previous three months.
16 Roy Morgan Employment Estimate Detailed Workforce Employed % of workforce Unemployed Looking for work Quarterly Full-time Part-time Quarterly Full-time Part-time Unemployed Quarterly For work Quarterly Full-time Part-time 2002 ( 000) ( 000) ( 000) ( 000) ( 000) ( 000) ( 000) ( 000) % % ( 000) ( 000) ( 000) % ( 000) % Jan , Feb March 9470 (9696) (8749) (9.8) 841 (947) April May June 9563 (9604) (8821) (8.2) 794 (783) July Aug Sep (9654) (8939) (7.4) 703 (715) Oct Nov Dec (9555) (8824) (7.7) 730 (731) Jan Feb March 9565 (9609) (8859) (7.8) 769 (750) April May June 9551 (9612) (8846) (8.0) 764 (766) July Aug Sep (9719) (8943) (8.0) 761 (776) Oct Nov Dec (9880) (9099) (7.9) 863 (781) Jan Feb March (10080) (9181) (8.9) 892 (899) April May June 9701 (9898) (9079) (8.3) 826 (819) July Aug Sep (9969) (9258) (7.1) 698 (711) Oct Nov Dec (10028) (9357) (6.7) 688 (671) Average calculated for previous three months.
17 Roy Morgan Employment Estimate Detailed Workforce Employed % of workforce Unemployed Looking for work Quarterly Full-time Part-time Quarterly Full-time Part-time Unemployed Quarterly For work Quarterly Full-time Part-time 2005 ( 000) ( 000) ( 000) ( 000) ( 000) ( 000) ( 000) ( 000) % % ( 000) ( 000) ( 000) % ( 000) % Jan Feb March (10149) (9402) (7.4) 753 (747) April May June (10294) (9560) (7.1) 669 (734) July Aug Sep (10220) (9494) (7.1) 681 (726) Oct Nov Dec (10258) (9457) (7.8) 864 (802) Jan Feb March (10553) (9706) (8.0) 815 (847) April May June (10568) (9866) (6.6) 659 (702) July Aug Sep (10471) (9704) (7.3) 803 (767) Oct Nov Dec (10544) (9792) (7.1) 712 (752) Jan Feb March (10485) (9728) (7.2) 636 (757) April May June (10704) (10108) (5.6) 579 (596) July Aug Sep (10671) (10057) (5.8) 658 (614) Oct Nov Dec (10672) (10025) (6.1) 740 (647) Average calculated for previous three months.
18 Roy Morgan Employment Estimate Detailed Workforce Employed % of workforce Unemployed Looking for work Quarterly Full-time Part-time Quarterly Full-time Part-time Unemployed Quarterly For work Quarterly Full-time Part-time 2008 ( 000) ( 000) ( 000) ( 000) ( 000) ( 000) ( 000) ( 000) % % ( 000) ( 000) ( 000) % ( 000) % Jan Feb March (10696) (10050) (6.0) 651 (646) April May June (10758) (10127) (5.9) 629 (632) July Aug Sep (10955) (10371) (5.3) 538 (584) Oct Nov Dec (10933) (10259) (6.2) 700 (674) Jan Feb March (11078) (10269) (7.3) 775 (809) April May June (11124) (10295) (7.5) 862 (829) July Aug Sep (11291) (10466) (7.3) 775 (825) Oct Nov Dec (11324) (10537) (7.0) 773 (787) Jan Feb March (11471) (10598) (7.6) 836 (873) April May June (11533) (10785) (6.5) 682 (749) July Aug Sep (11656) (10919) (6.3) 756 (737) Oct Nov Dec (11829) (11003) (7.0) 903 (826) Average calculated for previous three months.
19 Roy Morgan Employment Estimate Detailed Workforce Employed % of workforce Unemployed Looking for work Quarterly Full-time Part-time Quarterly Full-time Part-time Unemployed Quarterly For work Quarterly Full-time Part-time 2011 ( 000) ( 000) ( 000) ( 000) ( 000) ( 000) ( 000) ( 000) % % ( 000) ( 000) ( 000) % ( 000) % Jan Feb March (11802) (10889) (7.7) 863 (913) April May June (11913) (11076) (7.0) 846 (837) July Aug Sep (11810) (10896) (7.7) 919 (914) Oct , Nov , Dec (12036) (11002) (8.6) 1,034 (1,035) Jan , Feb , March (12249) (11057) (9.7) 1,120 (1,192) April , May June (12177) (11072) (9.1) 1,169 (1,105) July , Aug , Sep (12183) (10986) (9.8) 1,214 (1,197) Oct , Nov , Dec (12095) (10913) (9.8) 1,175 (1,189) Jan , Feb , March (12431) (11079) (10.9) 1,369 (1,352) April , May , June (12406) (11230) (9.5) 1,205 (1,176) July , Aug , Sep (12469) (11197) (10.2) 1,297 (1,272) Oct , Nov , Dec (12518) (11181) (10.7) 1,411 (1,337) Average calculated for previous three months.
20 Roy Morgan Employment Estimate Detailed Workforce Employed % of workforce Unemployed Looking for work Quarterly Full-time Part-time Quarterly Full-time Part-time Unemployed Quarterly For work Quarterly Full-time Part-time 2014 ( 000) ( 000) ( 000) ( 000) ( 000) ( 000) ( 000) ( 000) % % ( 000) ( 000) ( 000) % ( 000) % Jan , Feb , March (12671) (11183) (11.7) 1,465 (1,488) April , May , June (12454) (11181) (10.2) 1,326 (1,273) July , Aug , Sep (12265) (11086) (9.6) 1,208 (1,179) Oct , Nov , Dec (12522) (11271) (10.0) 1,402 (1,251) Jan , Feb , March (12608) (11280) (10.5) 1,368 (1,327) April , May , June (12624) (11361) (10.0) 1,192 (1,263) July , Aug , Sep (12729) (11620) (8.7) 1,058 (1,109) Oct , Nov , Dec (12875) (11691) (9.2) 1,256 (1,184) Jan , Feb , March (13072) (11709) (10.4) 1,422 (1,362) April , May , June (12861) (11544) (10.2) 1,247 (1,317) July , Aug , Sep (12931) (11665) (9.8) 1,101 (1,266) Oct , Nov , Dec (12929) (11739) (9.2) 1,186 (1,191) Average calculated for previous three months.
21 Roy Morgan Employment Estimate Detailed Workforce Employed % of workforce Unemployed Looking for work Quarterly Full-time Part-time Quarterly Full-time Part-time Unemployed Quarterly For work Quarterly Full-time Part-time 2017 ( 000) ( 000) ( 000) ( 000) ( 000) ( 000) ( 000) ( 000) % % ( 000) ( 000) ( 000) % ( 000) % Jan , Feb , March (13324) (12063) (9.5) 1,236 (1,261) April , May , June (13246) (12012) (9.3) 1,200 (1,234) July , Aug , Sep (13091) (11837) (9.6) 1,202 (1,254) Oct , Nov , Dec (13192) (11917) (9.7) 1,312 (1,275) Jan , Feb , March (13526) (12279) (9.2) 1,210 (1,246) April , May , June (13345) (12117) (9.2) 1,171 (1,228) July , Aug , Sep (13395) (12042) (10.1) 1,256 (1,354) Oct , Nov , Dec (13473) (12187) (9.5) 1,302 (1,286) Jan. Feb. March April May June July Aug. Sep. Oct. Nov. Dec. Average calculated for previous three months.
FOR IMMEDIATE RELEASE
 Article No. 7761 Available on www.roymorgan.com Roy Morgan Unemployment Profile Monday, 8 October 2018 Unemployment down to 9.4% in September off two-year high Australian employment has grown solidly over
FOR IMMEDIATE RELEASE
 Article No. 7353 Available on www.roymorgan.com Roy Morgan Unemployment Profile Wednesday, 11 October 2017 2.498 million Australians (18.9%) now unemployed or under-employed In September 1.202 million
FOR IMMEDIATE RELEASE
 Article No. 6928 Available on www.roymorgan.com Roy Morgan Unemployment Profile Wednesday, 17 August 2016 Australian real unemployment jumps to 10.5% (up 0.9%) in July during post-election uncertainty
FOR IMMEDIATE RELEASE
 Article No. 7433 Available on www.roymorgan.com Roy Morgan Unemployment Profile Friday, 12 January 2018 2.6m Australians unemployed or under-employed in December The latest data for the Roy Morgan employment
FOR IMMEDIATE RELEASE
 Article No. 5842 Available on www.roymorgan.com Roy Morgan Unemployment Profile Thursday, 2 October 2014 Unemployment climbs to 9.9% in September as full-time work lowest since October 2011; 2.2 million
FOR IMMEDIATE RELEASE
 Article No. 7137 Available on www.roymorgan.com Roy Morgan Unemployment Profile Wednesday, 8 February 2017 Over 12 million Australians have jobs for the first time including over 8 million full-time jobs,
Commercial-in-Confidence Ashton Old Baths Financial Model - Detailed Cashflow
 Year 0 1 2 3 4 5 6 7 8 9 10 11 12 13 Oct-16 Nov-16 Dec-16 Jan-17 Feb-17 Mar-17 Apr-17 May-17 Jun-17 Jul-17 Aug-17 Sep-17 Oct-17 2,038 2,922 4,089 4,349 6,256 7,124 8,885 8,885 8,885 8,885 8,885 8,885 9,107
Total Production by Month (Acre Feet)
") Production by Month (acre-feet) 2008 2009 2010 2011 2012 2013 2014 2015 2016 January 25 339.10 228.90 249.50 297.99 243.06 327.14 247.66 212.37 February 234.00 218.80 212.10 241.52 245.82 279.08 234.16
Production by Month (acre-feet) 2008 2009 2010 2011 2012 2013 2014 2015 2016 January 25 339.10 228.90 249.50 297.99 243.06 327.14 247.66 212.37 February 234.00 218.80 212.10 241.52 245.82 279.08 234.16
COMPARISON OF FIXED & VARIABLE RATES (25 YEARS) CHARTERED BANK ADMINISTERED INTEREST RATES - PRIME BUSINESS*
 CHARTERED BANK ADMINISTERED INTEREST RATES - PRIME BUSINESS*") COMPARISON OF FIXED & VARIABLE RATES (25 YEARS) 2 Fixed Rates Variable Rates For Internal Use Only. FIXED RATES OF THE PAST 25 YEARS AVERAGE RESIDENTIAL MORTGAGE LENDING RATE - 5 YEAR* (Per cent) Year
COMPARISON OF FIXED & VARIABLE RATES (25 YEARS) 2 Fixed Rates Variable Rates For Internal Use Only. FIXED RATES OF THE PAST 25 YEARS AVERAGE RESIDENTIAL MORTGAGE LENDING RATE - 5 YEAR* (Per cent) Year
COMPARISON OF FIXED & VARIABLE RATES (25 YEARS) CHARTERED BANK ADMINISTERED INTEREST RATES - PRIME BUSINESS*
 CHARTERED BANK ADMINISTERED INTEREST RATES - PRIME BUSINESS*") COMPARISON OF FIXED & VARIABLE RATES (25 YEARS) 2 Fixed Rates Variable Rates FIXED RATES OF THE PAST 25 YEARS AVERAGE RESIDENTIAL MORTGAGE LENDING RATE - 5 YEAR* (Per cent) Year Jan Feb Mar Apr May Jun
COMPARISON OF FIXED & VARIABLE RATES (25 YEARS) 2 Fixed Rates Variable Rates FIXED RATES OF THE PAST 25 YEARS AVERAGE RESIDENTIAL MORTGAGE LENDING RATE - 5 YEAR* (Per cent) Year Jan Feb Mar Apr May Jun
April 2014 Data Release
 April 214 Data Release Fannie Mae s consumer attitudinal survey polls the adult U.S. general population to assess their attitudes about homeownership, renting a home, the economy, and household finances.
September 2016 Water Production & Consumption Data
 September 2016 Water Production & Consumption Data September 2016 monthly water production (288.48 AF) was lowest in at least 17 years. Monthly water production has increased slightly each month since
GAZIFÈRE INC. Prime Rate Forecasting Process 2017 Rate Case
 Overview A consensus forecast is used to estimate the prime rate charged by commercial banks. As the prime rate is subject to competitive pressures faced by individual lenders and is set on an individual
Black Employm ent an d Unemploymen t July Page 1
 August 3, 2012 DATA BRIEF: Black Employment and Unemployment in July 2012 The unemployment rate for Blacks was 14.1% last month. This is according to the latest report on the nation s employment situation
August ATR Monthly Report
 August ATR Monthly Report Minnesota Department of Transportation Office of Transportation Data and Analysis August 2011 Introduction The purpose of this report is to examine monthly traffic trends on
Black Employm ent an d Unemploymen t Au gust Page 1
 September 7, 2012 DATA BRIEF: Black Employment and Unemployment in August 2012 The unemployment rate for Blacks was 14.1% last month. This is according to the latest report on the nation s employment situation
September 2014 Data Release
 September 214 Data Release Fannie Mae s consumer attitudinal survey polls the adult U.S. general population to assess their attitudes about homeownership, renting a home, the economy, and household finances.
Unemployment Rates - November 2011
 December 2, 2011 DATA BRIEF: Black Employment and Unemployment in November 2011 The unemployment rate for Blacks was 15.5% last month. This is according to the latest report on the nation s employment
Up and Down Months of the Stock Market
 Up and Down Months of the Stock Market 1926-2017 Positive years (66) in the stock market were not good all year long and losing years (24) were not losers throughout the year. Winning years produce losing
Black Employm ent an d Unemploymen t Decembe r 2013 Page 1
 January 10, 2014 DATA BRIEF: Black Employment and Unemployment in December 2013 The unemployment rate for Blacks was 11.9% last month. This is according to the latest report on the nation s employment
WIM #37 was operational for the entire month of September Volume was computed using all monthly data.
 SEPTEMBER 2016 WIM Site Location WIM #37 is located on I-94 near Otsego in Wright county. The WIM is located only on the westbound (WB) side of I-94, meaning that all data mentioned in this report pertains
May ATR Monthly Report
 May ATR Monthly Report Minnesota Department of Transportation Office of Transportation Data and Analysis May 2011 Introduction The purpose of this report is to examine monthly traffic trends on Minnesota
Black Employm ent an d Unemploymen t Ap ril Page 1
 May 6, 2012 DATA BRIEF: Black Employment and Unemployment in April 2012 The unemployment rate for Blacks was 13.0% last month. This is according to the latest report on the nation s employment situation
ANCR CRU Statistics February 2007 to December 2007
 ANCR CRU Statistics February 2007 to December 2007 o Jan/07 Feb/07* Mar/07 Apr/07 May/07 Jun/07 Jul/07 Aug/07 Sep/07 Oct/07 Nov/07 Dec/07 Total notes data from Perimeter phone system unavailable prior
Inventory Levels - All Prices. Inventory Levels - By Price Range
 Inventory Levels - All Prices Idaho Falls Bonneville Total 3-Mar-17 152 108 260 2-Mar-18 109 78 187-28% Inventory Levels - By Price Range 3-Mar-17 2-Mar-18 0-100,000 41 6 100,001-125,000 19 8 125,001-150,000
Unemployment Rates January 2011
 February 4, 2011 DATA BRIEF: Black Employment and Unemployment in January 2011 by Sylvia Allegretto, Ary Amerikaner, and Steven Pitts The unemployment rate for Blacks was 15.7% last month. This is according
Inventory Levels - All Prices. Inventory Levels - By Price Range
 Inventory Levels - All Prices Idaho Falls Bonneville Total 7-Apr-17 154 111 265 6-Apr-18 113 91 204-23% Inventory Levels - By Price Range 7-Apr-17 6-Apr-18 0-100,000 36 10 100,001-125,000 13 9 125,001-150,000
Construction Sector Indices
 STATISTICAL RELEASE UGANDA BUREAU OF STATISTICS January to April 212 Construction Sector Indices HIGHLIGHTS Annual Changes show that the prices for the Whole Construction Sector (covering material prices,
ENERGY SLIDESHOW. Federal Reserve Bank of Dallas
 ENERGY SLIDESHOW Updated: January 16, 2019 ENERGY PRICES www.dallasfed.org/research/energy Brent & WTI & Crude Brent Oil Crude Oil Dollars per barrel 140 120 100 Brent (Jan 11 = $58.64) WTI (Jan 11 = $50.78)
March 2013 Euro area unemployment rate at 12.1% EU27 at 10.9%
 STAT/13/70 30 April 2013 March 2013 Euro area unemployment rate at 12.1% at 10.9% The euro area 1 (EA17) seasonally-adjusted 2 unemployment rate 3 was 12.1% in March 2013, up from 12.0% in February 4.
Date Event or Holiday :Sun, 2:Mon North Orchard Delong Preschool North Orchard Delong Preschool
 2018 6 1 1:Sun, 2:Mon 2018-2019 Date Event or Holiday Aug 16 Board Meeting 6pm Aug 23 Open House June 2018 July 2018 August 2018 Sep 06 Board Meeting 6pm Su M Tu W Th F Sa Su M Tu W Th F Sa Su M Tu W Th
TABLE C-43. Manufacturers' new and unfilled orders, {Amounts in millions of dollars] Nondurable. Capital goods. Total. goods.
![TABLE C-43. Manufacturers' new and unfilled orders, {Amounts in millions of dollars] Nondurable. Capital goods. Total. goods.](/thumbs/93/112603708.jpg "TABLE C-43. Manufacturers' new and unfilled orders, {Amounts in millions of dollars] Nondurable. Capital goods. Total. goods.") TABLE C-43. Manufacturers' new and unfilled orders, -74 {Amounts in millions of dollars] New orders t, I960. 27, 559 26, 903 30,672 30,115 31,086 33,005 35,322 37,952 41, 803 45, 944 46,763 50, 243 53,
TABLE C-43. Manufacturers' new and unfilled orders, -74 {Amounts in millions of dollars] New orders t, I960. 27, 559 26, 903 30,672 30,115 31,086 33,005 35,322 37,952 41, 803 45, 944 46,763 50, 243 53,
CEO PROGRAM September 2018
 CEO PROGRAM September 2018 1 Sept 17th: ALL! CEO High Orientation (Kiva 6pm 7:30pm) 2 3 4 5 6 7 8 Sept 18th: ALL! CEO Orientation (Kiva 6pm 7:30pm) 9 10 11 12 13 14 15 *Parents please drop off/pick up
OECD unemployment rate stable at 5.4% in March 2018
 OECD unemployment rate stable at.4% in March 2018 The OECD unemployment rate remained stable at.4% in March 2018. Across the OECD area, 34 million people were unemployed, 1.4 million more than in April
Inventory Levels - All Prices. Inventory Levels - By Price Range
 Inventory Levels - All Prices Idaho Falls Bonneville Total 3-Nov-17 198 128 326 2-Nov-18 155 134 289-11% Inventory Levels - By Price Range 3-Nov-17 2-Nov-18 0-100,000 17 11 100,001-125,000 15 9 125,001-150,000
CREDIT UNION ESTIMATES
 MONTHLY CREDIT UNION ESTIMATES Prepared March 4, 2019 by Credit Union National Association Economics and Statistics Department cuna.org/mcue Loans Credit union loans outstanding grew 0.3% in January, compared
CREDIT UNION ESTIMATES
 MONTHLY CREDIT UNION ESTIMATES Prepared March 2, 2018 by Credit Union National Association Economics and Statistics Department cuna.org/mcue Loans Credit union loans outstanding grew 0.7% in, compared
Macroeconomic Outlook. Presented by Dr. Bruce A. Scherr Chairman of the Board Chief Executive Officer Emeritus
 Macroeconomic Outlook Presented by Dr. Bruce A. Scherr Chairman of the Board Chief Executive Officer Emeritus Waterways Symposium Cincinnati, OH November 15-17, 2016 Topics Energy Macro Implications Inflation
CREDIT UNION ESTIMATES
 MONTHLY CREDIT UNION ESTIMATES Prepared February 1, 2018 by Credit Union National Association Economics and Statistics Department cuna.org/mcue Loans Credit union loans outstanding grew 1.0% in, compared
CREDIT UNION ESTIMATES
 MONTHLY CREDIT UNION ESTIMATES Prepared January 2, 2019 by Credit Union National Association Economics and Statistics Department cuna.org/mcue Loans Credit union loans outstanding grew 0.6% in, compared
The Peoples Gas Light and Coke Company
 History of Gas Charges Due to the Operation of Rider 2 (Cents per Therm) Factors for Transportation Customers (Riders FST, SST, P, CFY and AGG) Non- Total Standby Standby Aggregation Commodity Commodity
M onthly arket. Jan Table of Contents. Monthly Highlights
 Table of Contents Market Inventory...2 www.gaar.com Monthly Highlights January 2014 had a 12.29% increase in the number of homes sales when compared to same time last year. The average sale price of single-family
OECD unemployment rate stable at 5.5% in January 2018
 OECD unemployment rate stable at.% in January 2018 The OECD unemployment rate was stable at.% in January 2018. Across the OECD area, 34. million people were unemployed, 1.9 million more than in April 2008.
CREDIT UNION ESTIMATES
 MONTHLY CREDIT UNION ESTIMATES Prepared May 1, 2018 by Credit Union National Association Economics and Statistics Department cuna.org/mcue Loans Credit union loans outstanding grew 1.1% in, compared to
Presented by Eric Englert Puget Sound Energy September 11, 2002
 Results from PSE s First Year of Time of Use Program Presented by Eric Englert Puget Sound Energy September 11, 2002 Puget Sound Energy Overview 973,489 Total Electric Customers 908,949 are AMR Capable
January During JANUARY. Sunday Monday Tuesday Wednesday Thursday Friday Saturday 1 Dec Feb 2011
 January 2011 1 Dec 2010 Feb 2011 During JANUARY Happy New Year! -- Appoint Company Nominating Committee 1 2 3 4 -- Camp report to Company - Jan 155 6 7 8 9 10 11 6 7 8 9 10 11 12 12 13 14 15 16 17 18 13
CREDIT UNION ESTIMATES
 MONTHLY CREDIT UNION ESTIMATES Prepared September 28, 2018 by Credit Union National Association Economics and Statistics Department cuna.org/mcue Loans Credit union loans outstanding grew 1.0% in, compared
CREDIT UNION ESTIMATES
 MONTHLY CREDIT UNION ESTIMATES Prepared September 4, 2018 by Credit Union National Association Economics and Statistics Department cuna.org/mcue Loans Credit union loans outstanding grew 1.1% in, compared
CREDIT UNION ESTIMATES
 MONTHLY CREDIT UNION ESTIMATES Prepared November 1, 2017 by Credit Union National Association Economics and Statistics Department cuna.org/mcue Loans Credit union loans outstanding grew 0.7% in, compared
ENERGY SLIDESHOW. Federal Reserve Bank of Dallas
 ENERGY SLIDESHOW Updated: March 13, 2018 ENERGY PRICES www.dallasfed.org/research/energy Brent & WTI & Crude Brent Oil Crude Oil Dollars per barrel 140 Brent (Mar 9 = $65.12) WTI (Mar 9 = $61.65) 120 100
Unemployment Rates August 2010
 September 3, 2010 DATA BRIEF: Black Employment and Unemployment in August 2010 by Sylvia Allegretto, Ary Amerikaner, and Steven Pitts The unemployment rate for Blacks was 16.3% last month. This is according
October 23, September year. in 1Q confidence in our. exacerbated by the. 0.3 percent. outpu. (over) Index of Sales. Mar 12.
 Index of Sales. Mar 12.") October 23, 20122 REPORT ON BUSINESSS TRENDS September 20122 Industry Performance Reverts to Pace off GDP in Broad Economy Index of Sales September 2011 - September 2012 140 130 125 127 125 120 114 117
October 23, 20122 REPORT ON BUSINESSS TRENDS September 20122 Industry Performance Reverts to Pace off GDP in Broad Economy Index of Sales September 2011 - September 2012 140 130 125 127 125 120 114 117
Euro area unemployment rate at 10.5%
 3/2016-7 January 2016 November 2015 Euro area unemployment rate at 10.5% EU28 at 9.1% The euro area (EA19) seasonally-adjusted unemployment rate was 10.5% in November 2015, down from 10.6% in October 2015,
November 2018 Customer Switching Report for the Electricity and Gas Retail Markets
 An Coimisiún um Rialáil Fóntas Commission for Regulation of Utilities November 2018 Customer Switching Report for the Electricity and Gas Retail Markets Information Paper Reference: CRU18266 Date Published:
CREDIT UNION ESTIMATES
 MONTHLY CREDIT UNION ESTIMATES Prepared June 1, 2018 by Credit Union National Association Economics and Statistics Department cuna.org/mcue Loans Credit union loans outstanding grew 1.1% in, matching the
MONTHLY NEW RESIDENTIAL CONSTRUCTION, NOVEMBER 2017
 FOR RELEASE AT 8:30 AM EST, TUESDAY, DECEMBER 19, MONTHLY NEW RESIDENTIAL CONSTRUCTION, NOVEMBER Release Number: CB17-206 December 19, - The U.S. Census Bureau and the U.S. Department of Housing and Urban
CREDIT UNION ESTIMATES
 MONTHLY CREDIT UNION ESTIMATES Prepared July 2, 2018 by Credit Union National Association Economics and Statistics Department cuna.org/mcue Loans Credit union loans outstanding grew 1.3% in, compared to
Hospitality & Tourism Management January 2015 Calendar Sunday Monday Tuesday Wednesday Thursday Friday Saturday 1 2 3
 Jan-14 Week 1 Week 2 January 2015 Calendar 1 2 3 New Year's Day - 4 5 6 7 8 9 10 New Intake-L4 (EFTH) Assign-Presentation L4 Assign-Presentation L5 Last Exam Reg- CTH Assign Marking Assign Marking Module-
Preliminary Steel Imports Decline 9% in September Import Market Share at 20%
 News Release FOR IMMEDIATE RELEASE October 25, 2011 CONTACT: NANCY GRAVATT 202.452.7115/ ngravatt@steel.org Preliminary Steel Imports Decline 9% in September Import Market Share at 20% Washington, D.C.
Monthly Hog Market Update United States Hog Production
 This information is provided as a resource by Saskatchewan Agriculture staff All prices are in Canadian dollars unless otherwise noted. Please use this information at your own risk. Monthly Hog Market
Wholesale Market Insights Through June J o n a t h a n S m o k e & Zo R a h i m - C o x A u t o m o t i v e
 Wholesale Market Insights Through June 2018 J o n a t h a n S m o k e & Zo R a h i m - C o x A u t o m o t i v e T R A N S F O R M I N G T H E W A Y T H E W O R L D B U Y S, S E L L S & O W N S C A R S
Presentation to the Customer Service, Operations and Safety Committee OPERATIONS PERFORMANCE INDICATORS
 Presentation to the Customer Service, Operations and Safety Committee OPERATIONS PERFORMANCE INDICATORS May 19, 2005 Department of Operations 100 95 90 85 80 75 70 65 A B C D RAIL PERFORMANCE INDEX FY
Digitized for FRASER Federal Reserve Bank of St. Louis. Per cent. P Total reported (000) ^D-)>oCL
 ^D-)>oCL") statistical FEDERAL release RESERVE ^D-)>oCL For immedia < t4 6 relea I s February 13, 1968 AUTOM3BILE LOANS BY MAJOR SALES FINANCE COMPANIES IN THE FOURTH QlJARTP^HE PROPORTION OF 3 YEAR NEW CAR CONTRACTS
statistical FEDERAL release RESERVE ^D-)>oCL For immedia < t4 6 relea I s February 13, 1968 AUTOM3BILE LOANS BY MAJOR SALES FINANCE COMPANIES IN THE FOURTH QlJARTP^HE PROPORTION OF 3 YEAR NEW CAR CONTRACTS
Quarterly Hogs and Pigs
 Washington, D.C. Quarterly Hogs and Pigs Released March 26, 2010, by the National Agricultural Statistics Service (NASS),, U.S. Department of Agriculture. For information on call Nick Streff at 202-720-3,
IOWA MOLD TOOLING CO., INC. BOX 189, GARNER, IA TEL: IMT PART NUMBER
 CRANE LOG CALENDAR YEAR CRANE MODEL Daily Inspections Weekly Inspections Monthly Inspections Lubrication Record Maintenance Record Damage & Repair Record Modification Record Reference Specifications CRANE
CREDIT UNION ESTIMATES
 MONTHLY CREDIT UNION ESTIMATES Prepared August 1, 2018 by Credit Union National Association Economics and Statistics Department cuna.org/mcue Loans Credit union loans outstanding grew 1.3% in, matching
More Now Disapprove of Trudeau Than Approve
 FOR IMMEDIATE RELEASE More Now Disapprove of Trudeau Than Approve Liberals and Conservatives tied, but Liberals still edge out a minority Toronto, April 26 th In a random sampling of public opinion taken
MONTHLY NEW RESIDENTIAL CONSTRUCTION, FEBRUARY 2017
 FOR RELEASE AT 8:30 AM EDT, THURSDAY, MARCH 16, MONTHLY NEW RESIDENTIAL CONSTRUCTION, FEBRUARY Release Number: CB17-38 March 16, - The U.S. Census Bureau and the U.S. Department of Housing and Urban Development
OECD unemployment rate down to 6.4% in March 2016
 OECD unemployment rate down to 6.4% in March 2016 The OECD unemployment rate fell by 0.1 percentage point to 6.4% in March 2016, 1.7 percentage point below the January 2013 peak. Across the OECD area,
MONTHLY NEW RESIDENTIAL CONSTRUCTION, JULY 2017
 FOR RELEASE AT 8:30 AM EDT, WEDNESDAY, AUGUST 16, MONTHLY NEW RESIDENTIAL CONSTRUCTION, JULY Release Number: CB17-133 August 16, - The U.S. Census Bureau and the U.S. Department of Housing and Urban Development
RIDERSHIP TRENDS. April 2018
 RIDERSHIP TRENDS April Prepared by the Division of Strategic Capital Planning June Table of Contents Executive Summary...1 Ridership...3 Estimated Passenger Trips by Line...3 Estimated Passenger Trips
Price Category Breakdown - February 2010
 SINGLE FAMILY RESIDENTIAL BREAKDOWN ruary 21 ruary Sales and Average Price Increase Annually TORONTO - Wednesday, March 3, 21 7.3 % 24.6 % 1.8 % 7.3%.2%.1 % Greater Toronto REALTORS reported 7,291 sales
Electricity Industry Code Minimum Service Standards & Guaranteed Service Levels Quarterly Report July September 2008
 Electricity Industry Code Minimum Service Standards & Guaranteed Service Levels Quarterly Report July September 2008 2 Table of Contents Administrative Data...3 Network Performance...3 Reliability Measures
August 2018 MLS Statistical Report
 January February March April May June July August Septem October Novem Decem August 218 MLS Statistical Report Total Sales Overall, sales are down 3%; however, total volume sold is up 7% and Median Sale
February 2014 Euro area unemployment rate at 11.9% EU28 at 10.6%
 STAT/14/52 1 April 2014 February 2014 Euro area unemployment rate at 11.9% EU28 at 10.6% The euro area 1 (EA18) seasonally-adjusted 2 unemployment rate 3 was 11.9% in February 2014, stable since October
OECD unemployment rate falls to 6.0% in March 2017
 OECD unemployment rate falls to 6.0% in March 017 The OECD unemployment rate for the population as a whole fell by 0.1 percentage point, to 6.0%, in March 017. Across the OECD area, 37.5 million people
EMBARGOED UNTIL RELEASE AT 8:30 A.M. EST, WEDNESDAY, JANUARY 30, 2013 GROSS DOMESTIC PRODUCT: FOURTH QUARTER AND ANNUAL 2012 (ADVANCE ESTIMATE)
") NEWS RELEASE EMBARGOED UNTIL RELEASE AT 8:30 A.M. EST, WEDNESDAY, JANUARY 30, 2013 Lisa Mataloni: (202) 606-5304 (GDP) gdpniwd@bea.gov Recorded message: (202) 606-5306 BEA 13-02 GROSS DOMESTIC PRODUCT:
NEWS RELEASE EMBARGOED UNTIL RELEASE AT 8:30 A.M. EST, WEDNESDAY, JANUARY 30, 2013 Lisa Mataloni: (202) 606-5304 (GDP) gdpniwd@bea.gov Recorded message: (202) 606-5306 BEA 13-02 GROSS DOMESTIC PRODUCT:
MONTHLY NEW RESIDENTIAL CONSTRUCTION, APRIL 2017
 FOR RELEASE AT 8:30 AM EDT, TUESDAY, MAY 16, MONTHLY NEW RESIDENTIAL CONSTRUCTION, APRIL Release Number: CB17-75 May 16, - The U.S. Census Bureau and the U.S. Department of Housing and Urban Development
Year to Date Summary. Average and Median Sale Prices
 A Publication of RMLS, The Source for Real Estate Statistics in Your Community Residential Review: Southwest Washington September 2018 Reporting Period September Residential Highlights Southwest Washington
TENTH DISTRICT MANUFACTURING SURVEY REBOUNDED MODERATELY Federal Reserve Bank of Kansas City Releases January Manufacturing Survey
 FOR RELEASE Thursday, January 23, 2014 EMBARGOED FOR 10 A.M. CENTRAL TIME CONTACT: Bill Medley 816-881-2556 Bill.Medley@kc.frb.org TENTH DISTRICT MANUFACTURING SURVEY REBOUNDED MODERATELY Federal Reserve
[Amounts in millions of dollars] Nondurable. Total. goods. equipment 34,415 30,717 24,506 8,868 9,566 8,981
![[Amounts in millions of dollars] Nondurable. Total. goods. equipment 34,415 30,717 24,506 8,868 9,566 8,981](/thumbs/92/109418289.jpg "[Amounts in millions of dollars] Nondurable. Total. goods. equipment 34,415 30,717 24,506 8,868 9,566 8,981") 1970 TABLE C-44. Manufacturers 1 new and unfilled orders, 1947-69 Unfilled orders2 Unfilled orders-shipments Machinery and equipment 1947.. 1948.. 1949.. 23,53.3 3 3 4 3 1961 * 31,085 15,698 17,026 18,522
1970 TABLE C-44. Manufacturers 1 new and unfilled orders, 1947-69 Unfilled orders2 Unfilled orders-shipments Machinery and equipment 1947.. 1948.. 1949.. 23,53.3 3 3 4 3 1961 * 31,085 15,698 17,026 18,522
Multiple Listing Service
 For Immediate Release: January 7, 21 CONTACT: Dan Santa Maria MLS President (52) 795-1492 Wes Wiggins Vice President, MLS (52) 382-8792 Cheri Meadows Senior Vice President, TAR (52) 327-4218 For Tucson
increase of over four per cent compared to the average of $409,058 reported in January 2010.
 SINGLE FAMILY RESIDENTIAL BREAKDOWN uary 211 26.8 % 1.7 % 7.%.4%.1 % Good Start to 211 TORONTO - February 4, 211 Greater Toronto REALTORS reported 4,337 transactions through the TorontoMLS system in uary
OECD unemployment rate stable at 5.8% in August 2017
 OECD unemployment rate stable at 5.8% in August 017 The OECD unemployment rate was stable at 5.8% in August 017, unchanged since May. Across the OECD area, 36.1 million people were unemployed, 3.5 million
June 2014 Euro area unemployment rate at 11.5% EU28 at 10.2%
 STAT/14/121 31 July 2014 June 2014 Euro area unemployment rate at 11.5% EU28 at 10.2% The euro area 1 (EA18) seasonally-adjusted 2 unemployment rate 3 was 11.5% in June 2014, down from 11.6% in May 2014
University of Michigan Eco-Driving Index (EDI) Latest data: October 2017
 Latest data: October 2017") University of Michigan Eco-Driving Index () http://www.ecodrivingindex.org Latest data: October 2017 Developed and issued monthly by Michael Sivak and Brandon Schoettle Sustainable Worldwide Transportation
University of Michigan Eco-Driving Index () http://www.ecodrivingindex.org Latest data: October 2017 Developed and issued monthly by Michael Sivak and Brandon Schoettle Sustainable Worldwide Transportation
May 2014 Euro area unemployment rate at 11.6% EU28 at 10.3%
 STAT/14/103-1 July 2014 May 2014 Euro area unemployment rate at 11.6% EU28 at 10.3% The euro area 1 (EA18) seasonally-adjusted 2 unemployment rate 3 was 11.6% in May 2014, stable compared with April 2014
Local Market Update 2012 Year In Review
 Northwest Area Home Sales for the Year 2012 Sales of single-family homes reported in Toledo and the surrounding area by the Toledo Board of REALTORS totaled 6,793. This was an increase of 6% compared to
MONTHLY NEW RESIDENTIAL SALES, SEPTEMBER 2018
 FOR RELEASE AT 10:00 AM EDT, WEDNESDAY, OCTOBER 24, MONTHLY NEW RESIDENTIAL SALES, SEPTEMBER Release Number: CB18 160 October 24, The U.S. Census Bureau and the U.S. Department of Housing and Urban Development
RIDERSHIP TRENDS. July 2018
 RIDERSHIP TRENDS July Prepared by the Division of Strategic Capital Planning September Table of Contents Executive Summary...1 Ridership...3 Estimated Passenger Trips by Line...3 Estimated Passenger Trips
Wheat Marketing Situation
 Wheat Marketing Situation Prepared by: Darrell L. Hanavan Executive Director Colorado Wheat Administrative Committee If you would like to receive an email when this report is updated, email gmostek@coloradowheat.org
MONTHLY NEW RESIDENTIAL CONSTRUCTION, AUGUST 2017
 FOR RELEASE AT 8:30 AM EDT, TUESDAY, SEPTEMBER 19, MONTHLY NEW RESIDENTIAL CONSTRUCTION, AUGUST Release Number: CB17-158 Notice: For information on the impact of Hurricanes Harvey and Irma on the compilation
Outlook for Franchised New Car Dealers
 1 Outlook for Franchised New Car Dealers Fourteenth Annual Automotive Outlook Symposium June 1, 2007 Paul Taylor, Ph.D., Chief Economist National Automobile Dealers Association, McLean, VA www.nada.org
TECHNICAL SERVICE BULLETIN
 TECHNICAL SERVICE BULLETIN To: Minuteman Dealers and Customers From: Minuteman Technical Support Date: 1/12/2011 Subject: TSB for the KIT # K-FRSPEEDSWT. For the FR17115, FR17220, FR20115 and FR20220 models.
MONTHLY NEW RESIDENTIAL SALES, AUGUST 2017
 FOR RELEASE AT 10:00 AM EDT, TUESDAY, SEPTEMBER 26, MONTHLY NEW RESIDENTIAL SALES, AUGUST Release Number: CB17-161 Notice: For information on the impact of Hurricanes Harvey and Irma on the compilation
OECD unemployment rate stable at 5.3% in July 2018
 OECD unemployment rate stable at.3% in July 208 The OECD unemployment rate was stable at.3% in July 208. Across the OECD, 33. million people were unemployed,.7 million less than the peak in January 203
Solomon Islands Government. Statistical Bulletin: 11/2011. HONIARA CONSUMER PRICE INDEX (June 2011)
") Solomon Islands Government Statistical Bulletin: 11/2011 HONIARA CONSUMER PRICE INDEX (June 2011) Solomon Islands National Statistics Office Ministry of Finance & Treasury PO Box G6 Honiara Enquiries:
Solomon Islands Government Statistical Bulletin: 11/2011 HONIARA CONSUMER PRICE INDEX (June 2011) Solomon Islands National Statistics Office Ministry of Finance & Treasury PO Box G6 Honiara Enquiries:
NJ Solar Market Update As of 2/29/16
 NJ Solar Market Update As of 2/29/16 Prepared by Charlie Garrison March 24, 2016 SOLAR INSTALLED CAPACITY DATA The installed solar capacity as of 2/29/16 is approximately 1,644.3 MW. Approximately 20.3
Economic & Steel Market Development in Japan
 1 Economic & Steel Market Development in Japan 68 th OECD Steel Committee Paris May 6-7, 2010 The Japan Iron & Steel Federation 2 Macro-economic overview Steel Supply and Demand v v v Steel Production
MEDIA PACK 2019 MAGAZINE WINDOWS DOORS CONSERVATORIES GLASS FABRICATORS DISTRIBUTORS INSTALLERS. October 2018 Issue
 MEDIA PACK 2019 WINDOWS DOORS CONSERVATORIES GLASS FABRICATORS DISTRIBUTORS INSTALLERS CLEARZINE CLEARVIEW-UK.COM MAGAZINE 733 ALUMINIUM WINDOW & DOOR FABRICATORS MAGAZINE DISTRIBUTION 12,606 2,356 14,889