Irrigation energy efficiency How to analyse your energy costs. Nick Bullock The Energy Guys
|
|
|
- Carmel Cameron
- 5 years ago
- Views:
Transcription


1 Irrigation energy efficiency How to analyse your energy costs Nick Bullock The Energy Guys March
2 PILOT Energy Audits: Pivots AIM: data on energy use simple field data How energy efficient is system? Potential savings? Best and best use of tariff? 7 centre pivots Electricity 3 centre pivots Diesel What is involved? Measure: flow, pressure, energy use 12 months power bills 2


3 DATA COLLECTION Electricity 3

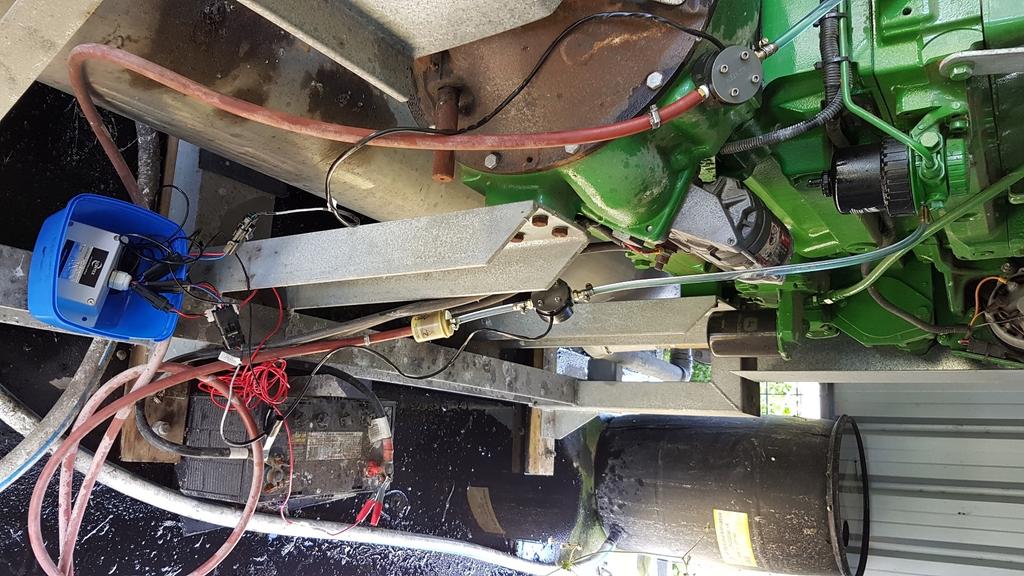

4 DATA COLLECTION Diesel 4
5 DATA COLLECTION 1. Flow at pump 2. Energy consumed (kwh) over known time period 3. Total head: delivery head at pump 4. Pressure at pivot kwh ML Comparison variation in consumption kwh/ ML Energy Used kwh/ ML kwh/ ML Pumping kwh/ ML Locomotion Pivot 1 Pivot 2 Pivot 3 Pivot 4 Pivot 5 Pivot 6 Pivot 7 Pivot 8 Pivot 9 Pivot 10 Pivot 10b Electric motor Diesel motor Average 226 kwh/ ML Range kwh/ ML
6 DATA COLLECTION 1. Flow at pump 2. Energy consumed (kwh) 3. Total head: delivery head at pump 4. Pressure at pivot kwh ML m total head Comparison variation in consumption Energy Used kwh/ ML/m kwh/ml/m Pumping kwh/ml/m Locomotion kwh/ ML/m Pivot 1 Pivot 2 Pivot 3 Pivot 4 Pivot 5 Pivot 6 Pivot 7 Pivot 8 Pivot 9 Pivot 10 Pivot 10b Electric motor Diesel motor Average 5.5 kwh/ ML/ m Range kwh/ ML/m 6
7 Unit cost of energy $/ kwh COST of Energy $/kwh Pivot 1 Pivot 2 Pivot 3 Pivot 4 Pivot 5 Pivot 6 Pivot 7 Pivot 8 Pivot 9 Pivot 10 Pivot 10b Electric motor Diesel motor DIESEL Typically diesel uses between Litres/ kwh Adopted: 0.30 Litres/ kwh 7
8 Comparison of total energy costs COST of Energy $/ML Pumping Locomotion $/ ML Pivot 1 Pivot 2 Pivot 3 Pivot 4 Pivot 5 Pivot 6 Pivot 7 Pivot 8 Pivot 9 Pivot 10 Pivot 10b Electric motor Diesel motor COST of Energy $/ML/m Pumping Locomotion $/ ML/m Pivot 1 Pivot 2 Pivot 3 Pivot 4 Pivot 5 Pivot 6 Pivot 7 Pivot 8 Pivot 9 Pivot 10 Pivot 10b Electric motor Diesel motor 8
9 DATA COLLECTION 1. Flow at pump 2. Energy consumed (kwh) 3. Total head: delivery head at pump 4. Pressure at pivot Pipe & fitting losses TOTAL head Delivery head Pressure at pivot Pivot losses End pressure Pivot height WL Static to GL Pump Static GL at pump to pivot Static across pivot Total head = total static + pivot pressure + pipe and fitting losses 9
10 Pivot 1 Measured Flow L/s Delivery head 170 kpa (17m = 24 psi) kwh 59.8 kwh in 1 hour From bills $ 0.20 / kwh Estimated Depth to WL 19m Static to pivot -3m Pipe losses 1.1m Locomotion use 3.0 kw Motor efficiency 90% Benchmarks (pumping) Total head = = 36m 17m Pivot pressure = delivery head - losses + static = = 18.9m 1.1m 149 kwh/ ML 4.14 kwh/ ML/m $ 39.9/ ML $ 0.84 / ML/m WL 19m Pump 3m 10
11 Pivot 1 Pump effic (%) = VOLUME (L/s) x Total HEAD (m). kwh for pump drawn from grid x motor effic (%) Motor Inefficiency, $1,276 Pump Inefficienc y, $2,927 Move Pivot, $674 Pivot Pressure, $4,492 Static, $3,803 Delivery Pipe Losses, $261 Using data: 1. Flow = L/ s 2. Total head = 36 m 3. kwh from meter = 59.8 kwh 4. kwh for pump = = 56.8 kw 5. Motor efficiency = 90 % (from plate on motor) 6. Pump efficiency = x 36.= 74.4 % 56.8 x 0.90 Total kwhr/ ML/m Pump efficiency and total energy use benchmark Other irrigation systems Pivots other states SA elect pivots SA Diesel pivots Pvt Pump efficiency % 11
12 Pivot 1 ACTIONS Potential energy efficiency improvements 1. Reduce pressure at pivot v low = no improvement 2. Improve pump efficiency v high = no improvement 3. Improve motor efficiency High efficiency motor 94% Potentially save $ 344/ yr 4. Improve uniformity no catch can data available Tariff improvements? 1. Currently on contestable tariff with network charges 2. Demand fees currently based on kwh consumption 3. Average tariff currently $ 0.178/ kwh for consumption 4. IN FUTURE: will be required to go on to a kva demand tariff
13 Energy Efficiency of motors MEPS = Minimum Energy Performance Standard Australian Standards kw MEPS motor High Effic Motor % %
14 Cost of energy to pump $/ ML 80 Static to pivot Delivery pipe Pivot Pump Motor 60 $/ ML Pivot 1 Pivot 2 Pivot 3 Pivot 4 Pivot 5 Pivot 6 Pivot 7 Pivot 8 Pivot 9 Pivot 10 Pivot 10b Electric motor Diesel motor 2.0 Cost of energy to pump $/ ML/m Static Delivery pipe Pivot Pump Motor $/ ML/m Pivot 1 Pivot 2 Pivot 3 Pivot 4 Pivot 5 Pivot 6 Pivot 7 Pivot 8 Pivot 9 Pivot 10 Pivot 10b Electric motor Diesel motor 14
15 Pivot 7 Measured From bills Flow Pivot head kwh 53.2 L/s 310 kpa (31m = 45psi) 55.7 kwh in 1 hour $ 0.24/ kwh Estimated Depth to WL 17m Static to pivot 0m Pipe losses 5.3m Locomotion use 2.0 kw Motor efficiency 90% Benchmarks (pumping) Total head = = 53.3 Delivery head = pivot head + losses + static = = 36.3m 5.3m Pivot head 31m 280 kwh/ ML 5.22 kwh/ ML/m $ 67.7/ ML $ 1.26 / ML/m WL 17m Pump 0m 15
16 Pivot 7 Pump effic (%) = VOLUME (L/s) x Total HEAD (m). kwh for pump drawn from grid x motor effic (%) Motor Inefficiency, 3,378 Pump Inefficienc y, 7, Move Pivot, Static, 3, Delivery Pipe Losses, 1, Pivot Pressure, 6, Using data: 1. Flow = 53.2 L/ s 2. Total head = 53.3 m 3. kwh from meter = 55.7 kwh 4. kwh for pump = = 53.7 kw 5. Motor efficiency = 85 % (from plate on motor) 6. Pump efficiency = 53.2 x 53.3 = 62.1 % 53.7 x 0.85 Total kwhr/ ML/m 9 Pump efficiency and total energy use benchmark Pvt 7 Other irrigation systems 8 Pivots other states 7 SA elect pivots 6 SA Diesel pivots Pump efficiency %
17 Pivot 7 ACTIONS Potential energy efficiency improvements 1. Reduce pressure at pivot measured pressure higher than other pivots Flat ground If possible to reduce to 25m, save $ 1670/ year assumes pump at same efficiency 2. Improve pump efficiency If efficiency can be improved to 70% Savings of $ 1480/ year 3. Improve motor efficiency High efficiency motor 94% replace assumed 85% Potentially save $ 1300/ yr if no other changes made
18 Pivot 7 ACTIONS Potential energy efficiency improvements 4. Improve UNIFORMITY OF APPLICATION Du 51% and Cu 86% BUT: average 5.1 mm measured when expected 6.0 mm If pivot is run on basis of expected average application No improvements to energy costs by improving uniformity But production improvements If pivot is run so that areas of lower application receive the expected depth, there is considerable energy savings possible Pivots costs $ 70.3/ ML applied (includes locomotion) Every 5mm over-applied (2.0 ML over 40Ha) costs $ 141 If occurs 20 times a years, this costs an extra $ 2,800/ year in pumping 18
19 Pivot 7 ACTIONS Tariff improvements? 1. Currently bundled tariff 2. < 100 MWh/ yr used 3. Average tariff currently $ 0.23/ kwh for consumption 4. Better rates can be obtained via: Energymadeeasy.com.au Broker 5. Currently using 64% offpeak, 36% peak BUT watering: 7pm 7am = believed to be offpeak PLUS 4 hours/ week peak used HOWEVER 36% PEAK use equals 4 hours/ day PEAK When checked with Networks: 9 pm 7 am Retailer 11pm 7am 19
20 Pivot 10 and 10b DIESEL Measured Pvt rpm Pvt 10b 1700 rpm Flow 76.6 L/s 76.6 L/s Delivery head 29.6m 36.7m Pivot head 26.4m 33.5m Diesel 15.3 L/ hour 21.1 L/ hour From bills $ 0.80/ L after rebates Estimated Depth to WL 17m Static to pivot 0m Locomotion use 10% Motor efficiency 0.25 L/ kwh Benchmarks (pumping) b kwh/ ML kwh/ ML/m $/ML $/ML/m Total head = = 46.6m WL 29.6m 17m Pump 3.2m 26.4m 0m 20
21 Pivot 10 Pump effic (%) = VOLUME (L/s) x Total HEAD (m). kwh for pump x motor effic (%) Using data: Pvt 10 Pvt 10b 1. Flow 76.6 L/ s 76.6 L/s 2. Total head 46.6 m 53.7m 3. kwh for pump 55.1 kw 76.0 kw 4. Pump efficiency % Total kwhr/ ML/m 9 Pump efficiency and total energy use benchmark Other irrigation systems 8 Pivots other states 7 SA elect pivots 6 SA Diesel pivots 5 Pvt 10b 4 3 Pvt Pump efficiency %
22 Pivot 10 ACTIONS Potential energy efficiency improvements 1. Ensure correct revs set Higher revs cost $ 8,750/ year based on 7.9 ML Ha/ yr 1. Reduce pressure at pivot measured pressure slightly higher than other pivots Some static across pivot requires higher pressure If 20m is achievable, saves $ 1800/ year assumes pump at same efficiency 2. Improve pump efficiency If efficiency can be improved to 70% Savings of $ 900/ year 3. Improve motor efficiency Assumed 0.25 L/ kwh, if higher improved pump efficiency
23 Pivot 10 ACTIONS Potential energy efficiency improvements 4. Improve UNIFORMITY OF APPLICATION Du 85% and Cu 90% BUT: average 6.8 mm measured when expected 6.0 mm If pivot is run on basis of expected average application No improvements to energy costs by improving uniformity But production improvements If pivot is run so that areas of lower application receive the expected depth, there are energy savings possible Pivots costs $ 34.9/ ML applied Every 1mm over-applied (0.62 ML on 60Ha) costs $ 22 If occurs 20 times a years, this costs an extra $ 440/ year in pumping 23
24 Electricity Tariffs SMALL Small Retail Customers Charges based on kwhr consumed service charges tariffs bundled quarterly bills Non-contestable = bundled rates Undergoing change in most states Types of tariff for Small Retail Customers General rate = flat rate per kwhr Time of use = rate for peak and offpeak = higher service fees Controlled load = flat rate for specific equipment (offpeak) Threshold for Small Retail customers in SA 160,000 kwhr/ year 24


25 Time of Use tariffs: typical times for peak and offpeak 25
26 Electricity tariffs LARGE Large Retail Customers Bill itemises components Bills broken into components Monthly Based on kva for larger users kva = kw/ power factor Component Fixed/ Negotiable Rate based on Retail energy use Negotiable kwhr used Network fees Fixed kva + service fee (in past = kwh) Environmental fees Fixed kwhr used Market fees Fixed kwhr used Contestable = retailers can contest for business Metering & service charges Partly Negotiable Daily fee 26
 kva = kw/ power factor kwhr: $ 18,881 = $ 0.137/ kwhr Demand: $ 5,556 Fees $ 131 Average annual tariff with all costs Use + Demand + fees = $ 0.")
27 Sample Contestable bill Negotiable rates Fixed rates mixture of kwh and kva kva can be monthly, annual depends on tariff POWER FACTOR (typically ) kva = kw/ power factor kwhr: $ 18,881 = $ 0.137/ kwhr Demand: $ 5,556 Fees $ 131 Average annual tariff with all costs Use + Demand + fees = $ 0.23/kWh 27
28 Tariff components Sample breakdown of bundled tariff Fees (per day) 2% Consumption (kwh) Fees (per day) Sample breakdown of contestable tariff Fees (per day) 2% Demand (kva) 37% Consumption (kwhr) Demand (kva) Fees (Daily) Consumption 98% Consumption (kwhr) 61% Impact of tariff type If DEMAND is based on kva = saving kwh (energy efficiency) has lower value = replacing kwh with diesel has lower value BUT Diesel may be used to eliminate kva fees 28
29 Managing tariffs SMALL Small Retail customers Need to regularly check rates Check most suitable type of tariffs: General, TOU, controlled loads retailers will not do it for you Tariffs AGL Tariff comparison ERM Origin Winter Summer TOTAL Peak c/kwh Offpeak c/kwh Supply c/day Discount % 20% 16% 16% Peak c/kwh Offpeak c/kwh Use Cost Peak kwh/ yr Offpeak kwh/ yr Peak $/ yr Offpeak $/ yr Supply $/ yr TOTAL $/ yr Average tariff
30 Managing tariffs LARGE Large retail customers negotiate new contract prior to expiry of current contract forward contracting to take advantage of price dips check demand and capacity charges: these can be reset ENERGY BROKERS review best tariffs for given consumption can assist negotiate small and large contracts assess electricity markets = opportunities for forward contracting Some provide analysis of monthly use and costs ( energy managers ) checks actual consumption and demand check tariffs working as intended provide warnings or alerts Selection of broker recommendation from another farmer obtain quotes from 2 or 3 brokers, be clear about: all fees and costs what is included: analysis, reporting, forward contracting Examples
31 Tariffs Farm 1 Farm 2 Farm 3 Farm 4 Farm 5 Annual kwh TYPE BILL Large Large Large Small Small Peak Demand kva kwh kwh - - Peak % kwh 23% 67% 64% 33% 24% Off-Peak % kwh 77% 33% 36% 67% 76% $/ kwh PEAk $/ kwhr OFFPEAK $ for kwh $ for kva $ for fees based on $ for kwh $/ kwhr based on $ TOTAL
32 Tariffs New Network Tariffs Energy bill = Energy Cost/ Retail costs + Network costs + Market /environmental costs + metering, supply fees Network tariffs Agreed 2016/ 16 Demand Actual Demand Supply $/ day no charge kwhr used $/ kwhr Annual Demand Block 1 $/ kva/day Annual Demand Block 2 $/ kva/day Additional Demand $/ kva/ day Summer Peak $/ kva/day Shoulder $/ kva/day Offpeak $/ kva/ day no charge 32
33 Tariffs Agreed kva demand tariff Annual Demand is based on ½ hour between 12noon and 9pm work days for Nov March Additional demand is based on ½ hour outside of above times and dates ie o 9pm noon Nov March AND o 24 hour for rest of year So one peak demand spike between Nov-Mar 12noon 9pm will set demand for whole period (ie no reset each month) The same holds for additional demand There is a flat rate for consumption (kwh) The AGREED kva Demand tariff has a supply fee Actual kva Demand Tariff Peak Demand is based on ½ hour between 4pm and 9pm work days for Nov March Shoulder Demand is based on ½ hour between 12 noon 4pm, all year Offpeak Demand is based on ½ hour outside these times o 9pm noon Nov March AND o 4pm noon for April Oct The Demand is reset each billing period (month) So one high demand in one month will not impact on other months There is a flat rate for consumption (kwh) Actual kva demand has NO supply fees There are 19 hours/day where PEAK Demand is NOT charged There are 15 hours where ONLY OFFPEAK demand is charged. 33
34 Minimise peak kwh/ yr kwh/ yr kwh/ yr Applying NEW Tariffs If use as past If all offpeak Peak + shoulder kwh 29,939 13,406 Offpeak kwh 84, , ,541 RETAIL COSTS TOTAL kwh 113, , ,947 $ $ $ Peak c/ kwh $ 5,292 $ 2,369 Offpeak 9.16 c/ kwh $ 7,691 $ 10,432 $ 9,205 Supply 35 $ / mnth $ 420 $ 420 $ 420 Metering 120 $/ mnth $ 1,440 $ 1,440 $ 1,440 Market charges AEMO c/ kwh $ 63 $ 63 $ 63 Enviornmentals c/ kwh $ 1,960 $ 1,960 $ 1,960 $ 16,865 $ 14,315 $ 15,457 Network costs AGREED DEMAND $ 19,844 ACTUAL DEMAND $ 18,108 $ 5,128 $ 18,108 TOTAL COSTS AGREED DEMAND $ 36,709 ex gst ACTUAL DEMAND $ 34,974 $ 19,442 $ 33,565 AGREED DEMAND $/ kwh 0.32 ACTUAL DEMAND $/ kwh
35 POWER FACTOR POWER FACTOR motor draws kw from grid transformer/grid sees this as kva kva = kw/ power factor (PF) the lower the PF the higher the kva If demand is based on kva charges = lower PF = higher costs Transformer higher PF = lower kva = more kw at transformer PF typically POWER FACTOR correction equipment (PFC) cost-effective to 0.95 EXAMPLE Farm 1 Power factor = average with peak demand at 395 kva 50 kvar PFC equipment improves PF to 0.95 reduce peak demand to 373 kva Typical cost $ 4,000 + gst + installation Saves $ 2,500/ year INTERVAL data = record of kw + power factor every 30 minutes = Smart meter Power Control Engineers in Newcastle, NSW Assess if installation of PFC equipment is cost effective Provide part numbers so that a local electrical can install dennis.slade@pceng.com.au 35
36 POWER FACTOR power factor (PF) = real power/apparent power REAL POWER = the capacity of the circuit for work (kw) APPARENT POWER = current x volts (kva) More worked examples IMPACT of Power Factor low power factor more current larger wires etc, higher cost to grid with PFC $/ kva kva PF kva $ saved Jan Feb Mar Apr May Jun Jul Aug Sep Oct Nov Dec Total saving $ Feb Jan Dec Nov Oct Sep Aug Jul Jun May Apr Mar Peak Current Shoulder kva and PF Offpeak PF PF Proposed Peak kva and PF Shoulder Rates $/ day Savings $/ month Offpeak Peak Shoulder Offpeak Peak Shoulder Offpeak SAVED $ SAVED $
37 Diesel option Is it worth it? Generally, for SMALL RETAIL energy users, if grid power is available at a site installation of a diesel genset is not cost effective diesel gensets normally use between L diesel / kwh generated $ / kwhr, based on $1.00/ L diesel (after rebates) if demand fees not managed, this could be similar to grid costs PLUS ongoing maintenance + recurring capital costs for diesel are significant HOWEVER For LARGE RETAIL energy users on CONTESTABLE BILLS diesel MAY be worthwhile investigating, IF: very seasonal consumption high ANNUAL PEAK DEMAND High annual average total $/ kwh rate low power factor kwhr/ ML/ m benchmarks: Electricity: range average 4.9 Diesel: range average
38 Solar PV THERE IS NO BENEFIT IN INSTALLING SOLAR PV if irrigation runs overnight if the system is run for 4 or 5 days and nights, then switched off for several days there is a long off-season when no irrigation takes place The benefit of solar PV is limited by: the seasonal consumption of electricity by the irrigation pumps in the off-season. the existing daily irrigation pattern: if irrigation cycles start at 9:00pm for hours. SOLAR PV and peak demand Solar PV may not be a reliable to reduce Annual Peak Demand Solar PV plus Monthly Peak Demand tariff can reduce the summer Peak Demand significantly any subsequent demand spikes would only affect that particular month. Solar and batteries potential to reduce consumption and demand fees Solar plus batteries would greatly reduce the risk of a spike in Peak Demand more of a guarantee that any Peak Demand reductions are permanent. 38

39 Solar PV SCENARIO WHERE SOLAR PV MAY BE WORTHWHILE Can irrigation scheduling maximise the solar PV generated? irrigation occurs primarily when the sun shines. Simplified analysis potential of solar PV to offset grid electricity Farm Size of Indicative payback solar PV Farm kwp 12 years Farm 4 30 kwp 7-9 years NOTE this is an approximate analysis and more detailed review must be carried out before proceeding with solar PV. 39

40 Diesel / Solar PV HYBRID Diesel generators Solar PV controllers Diesel motors Solar PV controllers 40
COMPARISON OF FIXED & VARIABLE RATES (25 YEARS) CHARTERED BANK ADMINISTERED INTEREST RATES - PRIME BUSINESS*
 CHARTERED BANK ADMINISTERED INTEREST RATES - PRIME BUSINESS*") COMPARISON OF FIXED & VARIABLE RATES (25 YEARS) 2 Fixed Rates Variable Rates For Internal Use Only. FIXED RATES OF THE PAST 25 YEARS AVERAGE RESIDENTIAL MORTGAGE LENDING RATE - 5 YEAR* (Per cent) Year
COMPARISON OF FIXED & VARIABLE RATES (25 YEARS) 2 Fixed Rates Variable Rates For Internal Use Only. FIXED RATES OF THE PAST 25 YEARS AVERAGE RESIDENTIAL MORTGAGE LENDING RATE - 5 YEAR* (Per cent) Year
COMPARISON OF FIXED & VARIABLE RATES (25 YEARS) CHARTERED BANK ADMINISTERED INTEREST RATES - PRIME BUSINESS*
 CHARTERED BANK ADMINISTERED INTEREST RATES - PRIME BUSINESS*") COMPARISON OF FIXED & VARIABLE RATES (25 YEARS) 2 Fixed Rates Variable Rates FIXED RATES OF THE PAST 25 YEARS AVERAGE RESIDENTIAL MORTGAGE LENDING RATE - 5 YEAR* (Per cent) Year Jan Feb Mar Apr May Jun
COMPARISON OF FIXED & VARIABLE RATES (25 YEARS) 2 Fixed Rates Variable Rates FIXED RATES OF THE PAST 25 YEARS AVERAGE RESIDENTIAL MORTGAGE LENDING RATE - 5 YEAR* (Per cent) Year Jan Feb Mar Apr May Jun
Residential Load Profiles
 Residential Load Profiles TABLE OF CONTENTS PAGE 1 BACKGROUND... 1 2 DATA COLLECTION AND ASSUMPTIONS... 1 3 ANALYSIS AND RESULTS... 2 3.1 Load Profiles... 2 3.2 Calculation of Monthly Electricity Bills...
Commercial-in-Confidence Ashton Old Baths Financial Model - Detailed Cashflow
 Year 0 1 2 3 4 5 6 7 8 9 10 11 12 13 Oct-16 Nov-16 Dec-16 Jan-17 Feb-17 Mar-17 Apr-17 May-17 Jun-17 Jul-17 Aug-17 Sep-17 Oct-17 2,038 2,922 4,089 4,349 6,256 7,124 8,885 8,885 8,885 8,885 8,885 8,885 9,107
40KW Solar System for Apple Sauce Co
 2012 40KW Solar System for Apple Sauce Co Document Created for The Apple Sauce Co by Luke M Hardy lmhardy@smartconsult.com.au Smartcom P/L For further details please contact Luke M Hardy SunUp Solar Pty
Economics of Integrating Renewables DAN HARMS MANAGER OF RATE, TECHNOLOGY & ENERGY POLICY SEPTEMBER 2017
 Economics of Integrating Renewables DAN HARMS MANAGER OF RATE, TECHNOLOGY & ENERGY POLICY SEPTEMBER 2017 Presentation Outline Understanding LPEA s expenses and what drives them Economics of net metering
TVA Distributor Retail Rates and Comprehensive Services Program Power Factor Case Studies. Gerald Johns, P.E. Power Utilization Engineer, TVA
 TVA Distributor Retail Rates and Comprehensive Services Program Power Factor Case Studies Gerald Johns, P.E. Power Utilization Engineer, TVA 1 TVA Comprehensive Services Power Factor Studies/Recommendations
Customers with solar PV units in NSW producing and consuming electricity
 Independent Pricing and Regulatory Tribunal FACT SHEET Customers with solar PV units in NSW producing and consuming electricity Based on Solar feed-in tariffs - Setting a fair and reasonable value for
Past Due. Account Charges. Contract Charges Security Deposit Due - Jun 09, , Customer Service. Jun 19, PAST DUE $1,693.
 11983978 Jun 19, 217 1 124 958 PAST DUE $1,693.97 Meter Reading Information Meter # 55271 May 3 655 Jun 15 6642 17 days 1397 on or about Aug 15 82 Past Due Balance payable includes an amount which is payable
SolarPACE + Storage Expanding Opportunities and Improving Project Economics. Presented By:
 SolarPACE + Storage Expanding Opportunities and Improving Project Economics Presented By: Introductions GELI Geli provides software solutions to help project developers and hardware suppliers bring commercial
MARKET RATES UPDATE Paula Gold-Williams Cory Kuchinsky
 MARKET RATES UPDATE I N T R O D U C T I O N BY: Paula Gold-Williams President & Chief Executive Officer (CEO) P R E S E N T E D BY: Cory Kuchinsky Interim Vice President, Financial Services September 24,
MCE Napa County Cleaner energy and lower rates. Honig Winery, Rutherford
 MCE Napa County Cleaner energy and lower rates Honig Winery, Rutherford Public Power by Community Choice Communities collectively purchase electricity as an alternative to investor-owned utility power
NJ Solar Market Update
 NJ Solar Market Update April 16, 20 Renewable Energy Committee Meeting Trenton, NJ Prepared by Charlie Garrison Solar Installed Capacity Data The preliminary installed solar capacity as of 3/31/ is approximately
Group 3: Pricing from 1 April 2018 and load management
 Group 3: Pricing from 1 April 2018 and load management This document is intended to provide background to Network Tasman s Group 3 pricing, in particular the Regional Coincident Peak Demand (RCPD) price,
Customers with solar PV units in NSW producing and consuming electricity
 Independent Pricing and Regulatory Tribunal FACT SHEET Customers with solar PV units in NSW producing and consuming electricity Based on Solar feed-in tariffs - Setting a fair and reasonable value for
Australian Solar Cooling Interest Group (ausscig) Conference Queensland Solar City
 Conference Queensland Solar City") Townsville: Queensland Solar City ausscig Conference 2011 1 The Townsville: Queensland Solar City project is part of the Australian Government Solar Cities program. Ergon Energy would like to acknowledge
Townsville: Queensland Solar City ausscig Conference 2011 1 The Townsville: Queensland Solar City project is part of the Australian Government Solar Cities program. Ergon Energy would like to acknowledge
energy price fact sheet - electricity
 energy price fact sheet - electricity - New South Wales - Ausgrid Distribution Zone Domestic Single Rate Usage of first 10.9589 kwh/day cents per kwh 29.34 32.274 20.54 22.594 Usage of next 10.9589 kwh/day
Energy Price Fact Sheet
 Energy Price Fact Sheet Company: Offer name: Offer ID: Red Energy Pty Ltd Living Energy Saver RED66350MR Customer type Fuel type(s) Distributor Offer type Release date Residential Electricity United Energy
250kW Solar PV System Poultry Shed Solution - Gatton
 250kW PV System Poultry Shed Solution - Gatton Document Created by Luke M Hardy lmhardy@smartconsult.com.au Smartcom P/L www.smartconsult.com.au 14 June 2013 Key Points for a PV System 250kW System at
PDR Energy Baseline Alternative. Proposal for Discussion October 27, 2015
 PDR Energy Baseline Alternative Proposal for Discussion October 27, 2015 Update Since Last Meeting Since the October 12 th Working Group Meeting Stem, Solar City, AMS and CESA have had over a half-dozen
Balance from your previous bill $0.00 Meter # Basic Charge: 17 $ /day 3.23* Energy charge:¹ 2
 11983979 Jun 19, 217 1 124 962 Jul 11, 217 $24.34 Meter Reading Previous Bill. Balance from your previous bill $. Meter # 552711 May 3 19813 Account Account charge 12.4* Charges 17 days 82 Jun 15 19895
MARKET OFFER POWERSHOP
 POWERSHOP MARKET OFFER The following Energy Price Fact Sheet sets out all applicable rates for Ausgrid Residential tariffs. Please read the summary of each to help determine which apply to you. Distribution
FOR IMMEDIATE RELEASE
 Article No. 7845 Available on www.roymorgan.com Roy Morgan Unemployment Profile Friday, 18 January 2019 Unemployment in December is 9.7% and under-employment is 8.8% FOR IMMEDIATE RELEASE Australian unemployment
NEU Electric and Natural Gas Price Update
 Exelon s $24 Billion Energy Bill Senate Bill 2814 Short-Term Energy Price Outlook On November 15, 2016, Exelon, through its legislative supporters, introduced Senate Bill 2814, a massive 446 page document
Energy Price Fact Sheet
 Energy Price Fact Sheet Company: Offer name: Offer ID: Red Energy Pty Ltd Living Energy Saver RED66517MS Customer type Fuel type(s) Distributor Offer type Release date Small business Electricity United
Continuous Efficiency Improvement Loop
 Make Data Driven, Continuous Efficiency Improvements as Standard Practice: Technical Loop Lessons Learned & Databases Update Building(s) Benchmarking (Fleet Databases) Energy Use & Performance Deviation
Large scale solar power plant in Nordic conditions. Antti Kosonen, Jero Ahola, Christian Breyer, Albert Albó
 Large scale solar power plant in Nordic conditions Antti Kosonen, Jero Ahola, Christian Breyer, Albert Albó 25.8.214 Finland Finland: Location: between latitudes of 6 7 Area: 338 435 km 2 Population: 5.4
The impact of electric vehicle development on peak demand and the load curve under different scenarios of EV integration and recharging options
 The impact of electric vehicle development on peak demand and the load curve under different scenarios of EV integration and recharging options Electricity demand in France: a paradigm shift Electricity
FOR IMMEDIATE RELEASE
 Article No. 7761 Available on www.roymorgan.com Roy Morgan Unemployment Profile Monday, 8 October 2018 Unemployment down to 9.4% in September off two-year high Australian employment has grown solidly over
NJ Solar Market Update As of 6/30/15
 NJ Solar Market Update As of 6/30/ Prepared by Charlie Garrison July 17, 20 SOLAR INSTALLED CAPACITY DATA The preliminary installed solar capacity as of 6/30/ is approximately 1,500.7 MW. Approximately
A 3-Year Case Study of a Residential Photovoltaic System with Microinverters
 A 3-Year Case Study of a Residential Photovoltaic System with Microinverters Clifford K. Ho Sandia National Laboratories, Albuquerque, NM Sandia National Laboratories is a multi-program laboratory managed
NJ Solar Market Update As of 10/31/15
 NJ Solar Market Update As of 10/31/15 Prepared by Charlie Garrison Renewable Energy Committee Meeting November 10, 2015 SOLAR INSTALLED CAPACITY DATA The preliminary installed solar capacity as of 10/31/15
Solar photovoltaic research: Drakenstein Municipality
 Rooftop Solar PV Solar photovoltaic research: Drakenstein Municipality Karin Kritzinger and Imke Meyer, Date 22/04/2015 Dialogue on Utility and Local Scale Renewable Energy in South Africa 22 April 2015-1
Energy Price Fact Sheet
 Energy Price Fact Sheet Company: Offer name: Offer ID: Red Energy Pty Ltd Qantas Red Plus RED68614MR Customer type Fuel type(s) Distributor Offer type Release date Residential Electricity United Energy
Energy Price Fact Sheet
 Energy Price Fact Sheet Company: Offer name: Offer ID: Lumo Movers LU262303MR Customer type Fuel type(s) Distributor Offer type Release date Residential Gas AusNet Services Market offer 19-Dec-2017 Gas
FOR IMMEDIATE RELEASE
 Article No. 7353 Available on www.roymorgan.com Roy Morgan Unemployment Profile Wednesday, 11 October 2017 2.498 million Australians (18.9%) now unemployed or under-employed In September 1.202 million
FOR IMMEDIATE RELEASE
 Article No. 5842 Available on www.roymorgan.com Roy Morgan Unemployment Profile Thursday, 2 October 2014 Unemployment climbs to 9.9% in September as full-time work lowest since October 2011; 2.2 million
Energy Efficiency and Cost minimisation in Water Supply Operations
 Energy Efficiency and Cost minimisation in Water Supply Operations Presented by: Jason Ip Manager Operations Riverina Water County Council LGNSW Water Management Conference 2014 25-27 August 2014 Background
Meter Insights for Downtown Store
 Meter Insights for Downtown Store Commodity: Analysis Period: Prepared for: Report Date: Electricity 1 December 2013-31 December 2014 Arlington Mills 12 February 2015 Electricity use over the analysis
UNITIL ENERGY SYSTEMS. INC. CALCULATION OF THE EXTERNAL DELIVERY CHARGE
 Schedule LSM-DJD-1 Page 1 of 2 UNITIL ENERGY SYSTEMS. INC. CALCULATION OF THE EXTERNAL DELIVERY CHARGE Calculation Calculation of the Calculation of the of the EDC EDC/ Only EDC/Non- 1. (Over)/under Recovery
Energy Price Fact Sheet
 Energy Price Fact Sheet Company: Offer name: Offer ID: Red Energy Pty Ltd Qantas Red Saver RED68556MR Customer type Fuel type(s) Distributor Offer type Release date Residential Electricity AusNet Services
NEU Electric and Natural Gas Price Update
 $ / MWH Jan-11 May-11 Sep-11 Sep-12 Jan-13 Electric: Short-Term Outlook The NYMEX Northern Illinois Hub 12-month forward price at the end of August 2016 for the September 2016 to August 2017 period was
University of Michigan Eco-Driving Index (EDI) Latest data: October 2017
 Latest data: October 2017") University of Michigan Eco-Driving Index () http://www.ecodrivingindex.org Latest data: October 2017 Developed and issued monthly by Michael Sivak and Brandon Schoettle Sustainable Worldwide Transportation
University of Michigan Eco-Driving Index () http://www.ecodrivingindex.org Latest data: October 2017 Developed and issued monthly by Michael Sivak and Brandon Schoettle Sustainable Worldwide Transportation
ELECTRIC VEHICLE MARKET UPDATE
 16TH ANNUAL ENERGY FORECASTING MEETING / EFG AUSTIN, TX APRIL 26-28, 2018 ELECTRIC VEHICLE MARKET UPDATE MIKE RUSSO, ITRON, INC. MONTHLY U.S. EV SALES Source: Monthly Plug-in Sales Scorecard, Inside EVs.
Presented by Eric Englert Puget Sound Energy September 11, 2002
 Results from PSE s First Year of Time of Use Program Presented by Eric Englert Puget Sound Energy September 11, 2002 Puget Sound Energy Overview 973,489 Total Electric Customers 908,949 are AMR Capable
ELECTRICAL UTILITY COST REDUCTION THROUGH PREDICTIVE CONTROL BACKGROUND
 ELECTRICAL UTILITY COST REDUCTION THROUGH PREDICTIVE CONTROL Project Manager: Chris Hayes BACKGROUND Kraft Foods 35 Reduction of Energy Costs Over The Next 5 Yrs. (5 Benchmark) Kraft Foods Financial Model
FOR IMMEDIATE RELEASE
 Article No. 7433 Available on www.roymorgan.com Roy Morgan Unemployment Profile Friday, 12 January 2018 2.6m Australians unemployed or under-employed in December The latest data for the Roy Morgan employment
Thomas Alston Director of Business and Policy Development. Presented By N. Scottsdale Rd, Suite 410 Scottsdale Arizona 85257
 Residential Solar Workshop May 7 th 2008 Thomas Alston Director of Business and Policy Development Presented By 1475 N. Scottsdale Rd, Suite 410 Scottsdale Arizona 85257 Workshop Agenda An Overview of
Energy use in potato stores
 Energy use in potato stores Adrian Cunnington PCL Sutton Bridge Potato Council Energy Forum Huntingdon 11 February 2010 Storage costs Fixed (capital) costs Variable (running) costs Finance costs Potato
Energy Price Fact Sheet
 The retail tariff type that is available to you is dependent on the metering configuration at your premise. This meter configuration is defined by your relevant electricity distribution network, and may
What, Why, and Where? Brian Lips Senior Project Manager for Policy NC Clean Energy Technology Center
 What, Why, and Where? Brian Lips Senior Project Manager for Policy NC Clean Energy Technology Center bclips@ncsu.edu About the 50 States of Solar Quarterly publication detailing state and utility distributed
Example 1MW Solar System for Fosters Yatala
 Example 1MW Solar System for Fosters Yatala Document Created by Luke M Hardy lmhardy@smartconsult.com.au Smartcom P/L 31 December 2012 Highlights Luke M Hardy MBA, Grad Cert Carbon Management Key Points
Thank you for requesting information on our utility auditing services!
 - EXHIBIT A - ELECTRIC - CLIENT INVOICE: EXAMPLE #1 If we moved a client from an electrical rate 6 to a rate 6L, and, as a result, changed their KWH rate from $.06 per Kilowatt Hour to $.05 per Kilowatt
United Energy Tariff Criteria (effective 1 January 2019)
") United Energy Tariff Criteria (effective 1 January 2019) 08.11.18 08.11.18 1 TABLE OF CONTENTS 1. INTRODUCTION... 3 2. DEFAULT NETWORK TARIFFS FOR NEW CONNECTIONS:... 4 2.1. LVS1R - Low voltage small 1
United Energy Tariff Criteria (effective 1 January 2019) 08.11.18 08.11.18 1 TABLE OF CONTENTS 1. INTRODUCTION... 3 2. DEFAULT NETWORK TARIFFS FOR NEW CONNECTIONS:... 4 2.1. LVS1R - Low voltage small 1
Energy Markets in Turmoil The Consumer Perspective
 Energy Markets in Turmoil The Consumer Perspective Sonny Popowsky Consumer Advocate of Pennsylvania Illinois State University Institute for Regulatory Policy Studies 63682 Springfield, IL May 17, 2001
Regulated Price Plan (RPP) - Tiered Prices Prices effective May 1, 2011 (per kwh)
 - Tiered Prices Prices effective May 1, 2011 (per kwh)") Page 1 of 5 Electricity Prices Electricity Prices at a Glance OEB's Role in Electricity Prices Regulated Price Plan (RPP) - Tiered Prices Regulated Price Plan - Time-of-use (TOU) Prices for Smart Meters
Page 1 of 5 Electricity Prices Electricity Prices at a Glance OEB's Role in Electricity Prices Regulated Price Plan (RPP) - Tiered Prices Regulated Price Plan - Time-of-use (TOU) Prices for Smart Meters
Zero Emission Bus Impact on Infrastructure
 Zero Emission Bus Impact on Infrastructure California Transit Association (CTA) Fall Conference Nov 17, 2016 Russ Garwacki Director, Pricing Design & Research 626.302.6673 Russell.Garwacki@sce.com Barbara
ELECTRICITY TARIFFS 2013/2014
 ELECTRICITY TARIFFS 2013/2014 Presented by Cobus Kritzinger Leon Swanepoel Deputy Director Finance Head Electro Technical Services CONTENTS BACKROUND ELECTRICITY SALES BULK PURCHASES SALARY INCREASE TARIFF
Electric Vehicle Program
 Cause No. 43960 INDIANAPOLIS POWER & LIGHT COMPANY Electric Vehicle Program Year 3 2013 Report May 2, 2014 Contents Background... 2 Project Objectives... 3 Current Status... 3 Significant Milestones...
FOR IMMEDIATE RELEASE
 Article No. 6928 Available on www.roymorgan.com Roy Morgan Unemployment Profile Wednesday, 17 August 2016 Australian real unemployment jumps to 10.5% (up 0.9%) in July during post-election uncertainty
Appendix 6.7 January 23, 2015 SURPLUS ENERGY PROGRAM PROPOSED TERMS AND CONDITIONS
 Appendix 6.7 SUR ENERGY PROGRAM PROPOSED TERMS AND CONDITIONS SUR ENERGY PROGRAM INDUSTRIAL LOAD - OPTION 1 TABLE OF CONTENTS Page No. Eligibility...1 Reference Demand...1 Billing...2 Interruptions...3
Marlborough Lines Limited Electricity Line Charges from 1 April 2014
 consumer. For more information visit http://www.marlboroughlines.co.nz/about-us/disclosures.aspx Marlborough Lines Limited Electricity Line Charges Marlborough Lines Limited Electricity Line Charges Marlborough
Montana Renewable Energy Association
 Montana Renewable Energy Association Mission & Focus areas: Education and Outreach Policy and Advocacy Industry Engagement www.montanarenewables.org SolSmart Solar Ready communities making process of going
ON-SITE ASSESSMENT REPORT. <Engineering Firm> Presented to: <Customer> <Presentation Date> Funding by: <Report Date>
 ON-SITE ASSESSMENT REPORT Presented to: Funding by: This report is for sample purposes only. The customer s actual report will contain information
NJ Solar Market Update As of 2/29/16
 NJ Solar Market Update As of 2/29/16 Prepared by Charlie Garrison March 24, 2016 SOLAR INSTALLED CAPACITY DATA The installed solar capacity as of 2/29/16 is approximately 1,644.3 MW. Approximately 20.3
NEW HAMPSHIRE GAS CORPORATION WINTER PERIOD ORIGINAL FILING CONTENTS 3. CONVERSION OF GAS COSTS - GALLONS TO THERMS SCHEDULE A
 NEW HAMPSHIRE GAS CORPORATION COST OF GAS RATE FILING - DG 13- WINTER PERIOD 2013-2014 ORIGINAL FILING CONTENTS 1. TARIFF PAGE - COST OF GAS RATE 2. MARKED TARIFF PAGE - COST OF GAS RATE 3. CONVERSION
RE: Advice Schedule 45 Public DC Fast Charger Delivery Service Optional Transitional Rate REPLACEMENT PAGES
 January 31, 2017 VIA ELECTRONIC FILING Public Utility Commission of Oregon 201 High Street SE, Suite 100 Salem, OR 97301-3398 Attn: Filing Center RE: Advice 16-020 Schedule 45 Public DC Fast Charger Delivery
Energy Produced by PV Array (AC):
:") 4x17 2x16 400 x PHOTON SOLAR 4 x KACO new energy PH-250P-60 (HDS) INT 250 W Powador 30,0 TL3 15 ; 0 25,0kW Location: Climate Data Record: PV Output: Gross/Active PV Surface Area: Antalya Antalya (1961-1990)
4x17 2x16 400 x PHOTON SOLAR 4 x KACO new energy PH-250P-60 (HDS) INT 250 W Powador 30,0 TL3 15 ; 0 25,0kW Location: Climate Data Record: PV Output: Gross/Active PV Surface Area: Antalya Antalya (1961-1990)
2016 UC Solar Research Symposium
 2016 UC Solar Research Symposium Beyond UCR s Sustainable Integrated Grid Initiative: Energy Management Projects in Southern California October 7, 2016 Presented by: Alfredo A. Martinez-Morales, Ph.D.
Presentation to the Customer Service, Operations and Safety Committee OPERATIONS PERFORMANCE INDICATORS
 Presentation to the Customer Service, Operations and Safety Committee OPERATIONS PERFORMANCE INDICATORS May 19, 2005 Department of Operations 100 95 90 85 80 75 70 65 A B C D RAIL PERFORMANCE INDEX FY
Smarter Network Storage UK first multi-purpose application of grid scale storage. Dr. Panos Papadopoulos, PhD, CEng
 Smarter Network Storage UK first multi-purpose application of grid scale storage Dr. Panos Papadopoulos, PhD, CEng UK Power Networks GENERATION TRANSMISSION DISTRIBUTION SUPPLY INDUSTRIAL COMMERCIAL RESIDENTIAL
Energy Price Fact Sheet
 Energy Price Fact Sheet VIC VIC Standard Offer Residential Standard Offer Offer Ref: Electricity - Usage charges Rates (ex GST) Rates (incl GST) Effective 1 March 2016 Powercor - Tariff CS (Climate Saver)
Residential Time-of-Day Service Rate Schedule R-TOD
 I. Applicability This Rate Schedule 1-R-TOD applies to single- and three-phase service for the following types of residential premises: 1. Individual or dual metered residences with digital communicating
WIM #41 CSAH 14, MP 14.9 CROOKSTON, MINNESOTA MAY 2013 MONTHLY REPORT
 WIM #41 CSAH 14, MP 14.9 CROOKSTON, MINNESOTA MAY 2013 MONTHLY REPORT In order to understand the vehicle classes and groupings the Mn/DOT Vehicle Classification Scheme and the Vehicle Classification Groupings
Energy Price Fact Sheet
 Energy Price Fact Sheet Company: Offer name: Offer ID: VIC Home Standing TAN65323SR Customer type Fuel type(s) Distributor Offer type Release date Residential Electricity Jemena Standing offer 01-Jan-2018
Demand and Time of Use Rates. Marty Blake The Prime Group LLC
 Demand and Time of Use Rates Marty Blake The Prime Group LLC Factors Affecting Electric Rates Generation plant cost increases Fuel price increases and volatility Carbon and environmental regulations Cost
Would you like to be free and enjoy electrical comforts just like at home?
 Would you like to be free and enjoy electrical comforts just like at home? EFOY COMFORT 365 days of freedom away from the grid EFOY COMFORT. The fully automatic, silent power supplier works anywhere, in
PRESENTATION ON STRATEGIC APPROACH TOWARDS WIND SOLAR HYBRID SYSTEMS (SWES) FOR REMOTE TELECOM SITES IN INDIA & CASE STUDY OF RAJASTHAN
 FOR REMOTE TELECOM SITES IN INDIA & CASE STUDY OF RAJASTHAN") PRESENTATION ON STRATEGIC APPROACH TOWARDS WIND SOLAR HYBRID SYSTEMS (SWES) FOR REMOTE TELECOM SITES IN INDIA & CASE STUDY OF RAJASTHAN WORKSHOP ON SMALL WIND ENERGY AND HYBRID SYSTEMS & ITS RELEVANCE
PRESENTATION ON STRATEGIC APPROACH TOWARDS WIND SOLAR HYBRID SYSTEMS (SWES) FOR REMOTE TELECOM SITES IN INDIA & CASE STUDY OF RAJASTHAN WORKSHOP ON SMALL WIND ENERGY AND HYBRID SYSTEMS & ITS RELEVANCE
This presentation was given as part of a workshop on February 7, Presenters were:
 This presentation was given as part of a workshop on February 7, 2018. Presenters were: Andrew Valainis, Montana Renewable Energy Association Bryan Von Lossberg, Renewable Energy Consultant Paul Herendeen,
Storage in the energy market
 Storage in the energy market Richard Green Energy Transitions 216, Trondheim 1 including The long-run impact of energy storage on prices and capacity Richard Green and Iain Staffell Imperial College Business
ELECTRICAL UTILITY COST REDUCTION THROUGH PREDICTIVE CONTROL December 2008 BACKGROUND
 ELECTRICAL UTILITY COST REDUCTION THROUGH PREDICTIVE CONTROL December 2008 Project Manager: Chris Hayes Advisor: Paul I-Hai Lin 1 BACKGROUND Kraft Foods 35 uction of Energy Costs Over The Next 5 Yrs. (2005
By: Ibrahim Anwar Ibrahim Ihsan Abd Alfattah Omareya. The supervisor: Dr. Maher Khammash
 Investigations of the effects of supplying Jenin s power distribution network by a PV generator with respect to voltage level, power losses, P.F and harmonics By: Ibrahim Anwar Ibrahim Ihsan Abd Alfattah
Distribution Capacity Impacts of Plug In Electric Vehicles. Chris Punt, P.E. MIPSYCON 2014
 Distribution Capacity Impacts of Plug In Electric Vehicles Chris Punt, P.E. MIPSYCON 2014 1 Outline EV Benefits EV Growth Where are we today? Where are we going? Potential Distribution Capacity Issues
Energy Price Fact Sheet
 Energy Price Fact Sheet Company: Offer name: Offer ID: VIC Home E-Select TAN66117MR Customer type Fuel type(s) Distributor Offer type Release date Residential Electricity AusNet Services Market offer 05-Feb-2018
Jean Marie River Solar and Wind Monitoring Update
 Jean Marie River Solar and Wind Monitoring Update Source: MACA Prepared for By Jean-Paul Pinard, P. Eng., PhD. 703 Wheeler St., Whitehorse, Yukon Y1A 2P6 Tel. (867) 393-2977; Email jpp@northwestel.net,
Electricity and Gas Retail Markets Report Q Information Paper
 Electricity and Gas Retail Markets Report Q1 2017 Information Paper Reference: CER/17247 Date Published: 22/01/2018 Public/ Customer Impact Statement The purpose of this report is to provide industry,
INTEGRATING PLUG-IN- ELECTRIC VEHICLES WITH THE DISTRIBUTION SYSTEM
 Paper 129 INTEGRATING PLUG-IN- ELECTRIC VEHICLES WITH THE DISTRIBUTION SYSTEM Arindam Maitra Jason Taylor Daniel Brooks Mark Alexander Mark Duvall EPRI USA EPRI USA EPRI USA EPRI USA EPRI USA amaitra@epri.com
Energy Price Fact Sheet
 Energy Price Fact Sheet Company: Offer name: Offer ID: VIC Home Standing TAN65333SR Customer type Fuel type(s) Distributor Offer type Release date Residential Electricity United Energy Standing offer 01-Jan-2018
Energy Management Through Peak Shaving and Demand Response: New Opportunities for Energy Savings at Manufacturing and Distribution Facilities
 Energy Management Through Peak Shaving and Demand Response: New Opportunities for Energy Savings at Manufacturing and Distribution Facilities By: Nasser Kutkut, PhD, DBA Advanced Charging Technologies
THE TRES AMIGAS PROJECT
 UNITING THE NATION S ELECTRIC POWER GRID THE TRES AMIGAS PROJECT Project Development, Business Case, and Benefits -ERCOT Presentation Jan 22, 2010 Agenda Project Overview Project Objective Project Description,
SALT RIVER PROJECT AGRICULTURAL IMPROVEMENT AND POWER DISTRICT E-27 CUSTOMER GENERATION PRICE PLAN FOR RESIDENTIAL SERVICE
 SALT RIVER PROJECT AGRICULTURAL IMPROVEMENT AND POWER DISTRICT E-27 CUSTOMER GENERATION PRICE PLAN FOR RESIDENTIAL SERVICE Effective: April 2015 Billing Cycle AVAILABILITY: The E-27 Price Plan is subject
ALZ Electrical Solar Consumer Guide
 ALZ Electrical Solar Consumer Guide ALZ Electrical Unit 6/3 Southern Cross Circuit, Urangan QLD 4655 T: (07) 4124 9552 E: admin@alzelectrical.net W: www.alzelectrical.net Why go solar? Solar power systems
September 2016 Water Production & Consumption Data
 September 2016 Water Production & Consumption Data September 2016 monthly water production (288.48 AF) was lowest in at least 17 years. Monthly water production has increased slightly each month since
GAZIFÈRE INC. Prime Rate Forecasting Process 2017 Rate Case
 Overview A consensus forecast is used to estimate the prime rate charged by commercial banks. As the prime rate is subject to competitive pressures faced by individual lenders and is set on an individual
Electricity and Gas Retail Markets Report Q2 2017
 An Coimisiún um Rialáil Fóntas Commission for Regulation of Utilities Electricity and Gas Retail Markets Report Q2 2017 Information Paper Reference: CRU 17290 Date Published: 06/10/2017 An Coimisiún um
Energy Price Fact Sheet
 The retail tariff type that is available to you is dependent on the metering configuration at your premise. This meter configuration is defined by your relevant electricity distribution network, and may
Energy Price Fact Sheet
 The retail tariff type that is available to you is dependent on the metering configuration at your premise. This meter configuration is defined by your relevant electricity distribution network, and may
Solar Plus: A Holistic Approach to Distributed Solar PV Eric O'Shaughnessy, Kristen Ardani, Dylan Cutler, Robert Margolis
 Solar Plus: A Holistic Approach to Distributed Solar PV Eric O'Shaughnessy, Kristen Ardani, Dylan Cutler, Robert Margolis NREL is a national laboratory of the U.S. Department of Energy, Office of Energy
energy price fact sheet electricity
 energy price fact sheet electricity - New South Wales Ausgrid Distribution Zone Energy Made Easy Reference Code: ALI275074MR ALI275128MR ALI275071MR ALI275137MR Customer type Fuel type Distributor(s) Tariff
This presentation was given as part of a workshop on November 14, Presenters were:
 This presentation was given as part of a workshop on November 14, 2017. Presenters were: Andrew Valainis, Montana Renewable Energy Association Bryan Von Lossberg Paul Herendeen, Missoula Federal Credit