Electrical Power Analysis of the Cal Poly Organic Farm for the Cal Poly SuPER Project
|
|
|
- Blanche Horn
- 6 years ago
- Views:
Transcription


1 Electrical Power Analysis of the Cal Poly Organic Farm for the Cal Poly SuPER Project Presentation For SARC March 21, 2008 Senior Project By Alex Liang
2 Agenda Terminology Introduction to SuPER and This Project Electrical Analysis of Organic Farm Power Measurement of Organic Farm AC Power Summary DC Power Analysis SuPER Field Testing Conclusion Future Studies Discussion


3 About Me Electrical Engineering Senior Emphasis in Power Systems Interned at SFPUC, NUMMI Will be working at PG&E Substation Design Engineer Originally from Fremont, CA


4 Terminology SuPER Sustainable Power for Electrical Resources Load any device that uses electricity
5 Terminology Watts measurement of power how much power it is using Light bulb = 50 watts, hairdryer = 1800 watts Watt-hours how much energy has been used (watts) x (time in hours) Light bulb on for 2 hours (50 watts) x (2 hours) = 100 watt-hours


6 Terminology AC alternating current 110V from wall outlets DC direct current 1.5V from an AA battery
7 Introduction to SuPER To develop a standalone, low cost, sustainable solar power system Aimed to bring power to the 2 billion people who currently do not have access to it Cost less than $500 Lifecycle of 20 years
8 Introduction to SuPER SuPER project 2 years running All work performed by students First prototype built Capable of at least 700 watt-hours per day Testing with small loads outside of laboratory
9
10 Introduction to Project Perform electrical analysis of Organic Farm Investigate all loads used at the farm Develop schematic of electrical system Perform power consumption measurements Converting farm to DC system How to utilize SuPER systems at the farm

11 How this project began Read about SuPER Project Met with Dr. Jim Harris SuPER Field Testing Organic Farm going solar Apply internship experience

12 Cal Poly Organic Farm


13 First Farm Visit Neal MacDougall Quick tour of farm and buildings Size the scope of project

14 Electrical Analysis Consulted Dennis Elliot Monthly utility meter data Monthly power usage in kilowatt-hours Monthly cost in dollars
15 Cal Poly Organic Farm Electricity Usage, July 2006 to June $ $ $ Power Used (kwh) $ $ $ $ $ $86.90 $ $ $95.56 $ $ $ $ $ $ Cost ($) kwh Used Cost 0 Jul Aug Sep Oct Nov Dec Jan Feb Mar Apr May Jun Month $0.00 Average monthly usage = 844 kwh,, Average monthly cost = $ Average daily usage = kwh
16 Electrical Analysis Loads at the farm Investigated the loads present Building by building Read electrical ratings to determine watts Measured watts using Kill-A-Watt meter Estimate of how much power each building uses
17 Electrical Analysis Packing Shed Loads # Load Name 1.1 Vegetable Spinner 1.2 Stereo 1.3 Toaster Oven 1.4 Microwave Oven 1.5 Digital Scales (2) 1.6 Water Heater 1.7 Mini Fridge 1.8 Outdoor Lamps (4) 1.9 Fluorescent lamps (15) Total Watts 100 W 5 W 1360 W 925 W 10 W total 2000 W 115 W 285 W total 330 W total 5,130 W
18 Electrical Analysis Straw Bale House & Storage Shed Loads # Load Name 2.1 Laser Printer 2.2 Computer 2.3 Monitor Total Watts 6W / 340 W 80 W 40 W 126 W / 460 W # Load Name 3.1 Fluorescent lamps (2) Total Watts 65 W 65 W
19 Electrical Analysis Greenhouse & Other Loads # Load Name 4.1 Blower fan 4.2 Exhaust fan (2) 4.3 Circulation fan 4.4 Motorized shutter 4.5 Vacuum Total Watts 67 W 1,480 W total 248 W 17 W 700 W 2,512 W # Load Name 5.1 Pond pump Total Watts 800 W 800 W
20 Electrical Analysis Instantaneous power use (watts) More useful is energy used in a day (watt-hours) Estimates from farm personnel Data from power measurement
21 Electrical Analysis Summary of Power Usage # Building / Area Total Power Per Day 1 Packing Shed 4,712.4 Wh 2 Straw Bale House Wh 3 Storage Shed Wh 4 Greenhouse 13,837 Wh 5 Pond Pump 480 Wh Total 19, Wh
22 Electrical Analysis Packing Shed Load Schedule # Load Name 1.1 Vegetable Spinner 1.2 Stereo 1.3 Toaster Oven 1.4 Microwave Oven 1.5 Digital Scales (2) 1.6 Water Heater 1.7 Mini Fridge 1.8 Outdoor Lamps (4) 1.9 Fluorescent Lamps (15) Watts 100 W 5 W 1360 W 925 W 10 W total 2000 W 115 W 285 W total 330 W total Hours Per Week Avg. Power Per Day Wh Total 11.4 Wh 97.1 Wh 66 Wh 14.3 Wh 1714 Wh 160 Wh 1221 Wh Wh 4,712.4 Wh
23 Electrical Analysis Straw Bale House & Storage Shed Load Schedules # Load Name 2.1 Laser Printer 2.2 Computer 2.3 Monitor Watts 6W / 340 W 80 W 40 W Hours Per Day Avg. Power Per Day 0.5 / / 3.4 Wh 9 2 Total 720 Wh 80 Wh Wh # Load Name 3.1 Fluorescent Lamps Watts 80 W Hours Per Day Avg. Power Per Day Total Wh
24 Electrical Analysis Greenhouse & Other Load Schedules # Load Name 4.1 Blower fan 4.2 Exhaust fan (2) 4.3 Circulation fan 4.4 Motorized shutter 4.5 Vacuum Watts 67 W 1480 W total 248 W Hours Per Day 17 W (seconds) Avg. Power Per Day Wh Wh 4712 Wh negligible 700 W Total 13,837 Wh # Load Name 5.1 Pond Pump Watts 800 W Hours Per Day Avg. Power Per Day Total 480 Wh
25 Electrical Analysis Electrical schematic Shows each circuit Single Line Diagram One circuit = one circuit breaker, wire, loads
26

27 Power Measurement Individual loads: Kill-A-Watt Meter Only for plug-in loads
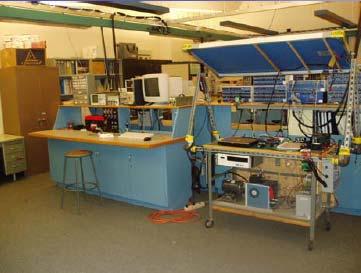
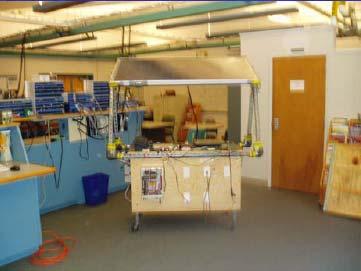
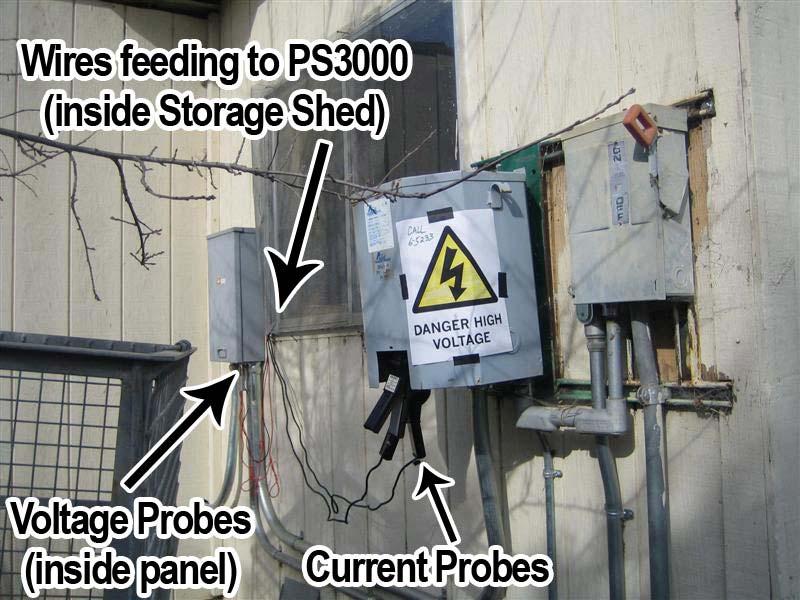
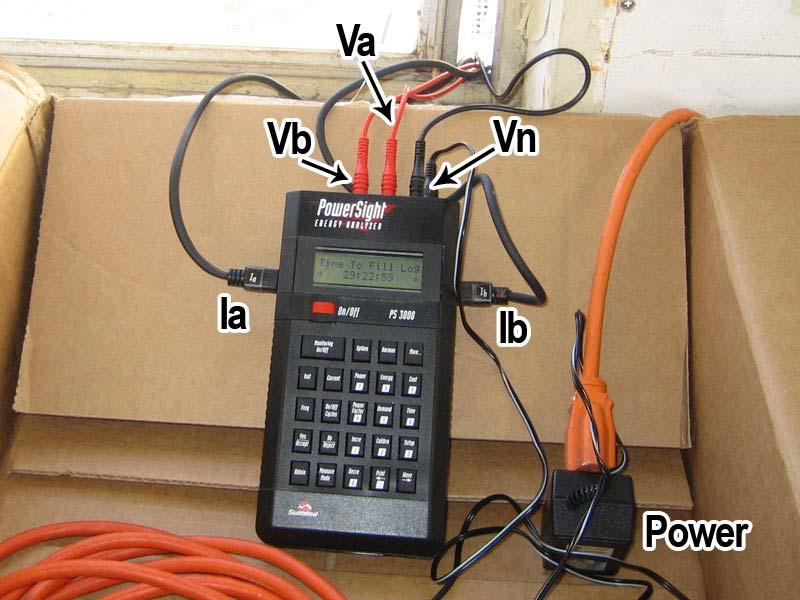
28 Power Measurement Measured farm s s total power consumption PowerSight meter installed at circuit breaker panel Gathered data for a week Provided power used by greenhouse fans, lighting; time on Provided peak power (highest watts seen)
29
30 Organic Farm Power Consumption Thursday 02/28/08 11:00:00 11:30:00 12:00:00 12:30:00 13:00:00 13:30:00 14:00:00 14:30:00 15:00:00 15:30:00 16:00:00 16:30:00 17:00:00 17:30:00 18:00:00 18:30:00 19:00:00 19:30:00 20:00:00 20:30:00 21:00:00 21:30:00 22:00:00 22:30:00 23:00:00 23:30:00 0:00:00 Time Power (Watts) Temperature (ºF) Power 12:30PM: Exhaust fans, blower fan, pond pump, stereo on
31 Organic Farm Power Consumption Friday 02/29/08 0:00:00 1:00:00 2:00:00 3:00:00 4:00:00 5:00:00 6:00:00 7:00:00 8:00:00 9:00:00 10:00:00 11:00:00 12:00:00 13:00:00 14:00:00 15:00:00 16:00:00 17:00:00 18:00:00 19:00:00 20:00:00 21:00:00 22:00:00 23:00:00 0:00:00 Time Power (Watts) Temperature (ºF) Power Temperature Power was unplugged or unit's memory prematurely filled 3:30PM: Circulation fan, blower fan, computer + monitor on
32 Organic Farm Power Consumption Saturday 03/01/08 0:00:00 1:00:00 2:00:00 3:00:00 4:00:00 5:00:00 6:00:00 7:00:00 8:00:00 9:00:00 10:00:00 11:00:00 12:00:00 13:00:00 14:00:00 15:00:00 16:00:00 17:00:00 18:00:00 19:00:00 20:00:00 21:00:00 22:00:00 23:00:00 0:00:00 Time Power (Watts) Temperature (ºF) Power 6:30PM: Circulation fan, blower fan, computer + monitor on
33 Organic Farm Power Consumption Sunday 03/02/08 0:00:00 1:00:00 2:00:00 3:00:00 4:00:00 5:00:00 6:00:00 7:00:00 8:00:00 9:00:00 10:00:00 11:00:00 12:00:00 13:00:00 14:00:00 15:00:00 16:00:00 17:00:00 18:00:00 19:00:00 20:00:00 21:00:00 22:00:00 23:00:00 0:00:00 Time Power (Watts) Temperature (ºF) Power 4:00PM: Exhaust fans, blower fan, computer + monitor on
34 4000 Organic Farm Power Consumption Monday 03/03/08 80 Power Temperature :00:00 1:00:00 2:00:00 3:00:00 4:00:00 5:00:00 6:00:00 7:00:00 8:00:00 9:00:00 10:00:00 11:00:00 12:00:00 13:00:00 14:00:00 15:00:00 16:00:00 17:00:00 18:00:00 19:00:00 20:00:00 21:00:00 22:00:00 23:00:00 0:00:00 Time Power (Watts) Temperature (ºF) Power was unplugged or unit's memory prematurely filled 6:15PM: Circulation fan, blower fan, computer + monitor, Packing Shed lights on
35 4000 Organic Farm Power Consumption Tuesday 03/04/08 80 Power Temperature :00:00 1:00:00 2:00:00 3:00:00 4:00:00 5:00:00 6:00:00 7:00:00 8:00:00 9:00:00 10:00:00 11:00:00 12:00:00 13:00:00 14:00:00 15:00:00 16:00:00 17:00:00 18:00:00 19:00:00 20:00:00 21:00:00 22:00:00 23:00:00 0:00:00 Temperature (ºF) 6:20PM: Circulation fan, blower fan, air pump, pond pump, computer + monitor on Power (Watts)
36 4000 Organic Farm Power Consumption Wednesday 03/05/08 80 Power Temperature :00:00 1:00:00 2:00:00 3:00:00 4:00:00 5:00:00 6:00:00 7:00:00 8:00:00 9:00:00 10:00:00 11:00:00 12:00:00 13:00:00 14:00:00 15:00:00 16:00:00 17:00:00 18:00:00 19:00:00 20:00:00 21:00:00 22:00:00 23:00:00 0:00:00 Temperature (ºF) 6:05PM: Circulation fan, blower fan, air pump, pond pump, computer + monitor on Power (Watts)
37 4000 Organic Farm Power Consumption Thursday 03/06/ :00:00 1:00:00 2:00:00 3:00:00 4:00:00 5:00:00 6:00:00 7:00:00 8:00:00 9:00:00 10:00:00 11:00:00 12:00:00 13:00:00 14:00:00 15:00:00 16:00:00 17:00:00 18:00:00 19:00:00 20:00:00 21:00:00 22:00:00 23:00:00 0:00:00 4:45PM: Circulation fan, blower fan, air pump, pond pump, computer + monitor, Packing Shed lights, stereo on Power (Watts) Temperature (ºF) Power Temperature
38 4000 Organic Farm Power Consumption Friday 03/07/ Power Temperature 0 0:00:00 0:30:00 1:00:00 1:30:00 2:00:00 2:30:00 3:00:00 3:30:00 4:00:00 4:30:00 5:00:00 5:30:00 6:00:00 6:30:00 7:00:00 7:30:00 8:00:00 8:30:00 9:00:00 9:30:00 10:00:00 10:30:00 11:00:00 11:30:00 12:00:00 12:30:00 13:00:00 13:30:00 14:00:00 14:30:00 15:00:00 Temperature (ºF) 3:18PM: Exhaust fans, blower fan, air pump, pond pump, computer r + monitor on Power (Watts)
39 Keeping the Farm AC with Solar Power Pros Keep existing loads and electrical system intact Easy to install Easy to switch back to grid power Cons Solar inherently DC Require DC AC inverters If using SuPER, require 65 units $500 each $32,500 total Not feasible
40 Keeping the Farm AC with Solar Power Hire contractor to perform install Grid supplement VS standalone system Highest energy used last year June 07: 1350 kwh; 45 kwh per day Total energy used last year 8,900 kwh; $
41 Keeping the Farm AC with Solar Power Percentage of Power Supplied By Solar Power Estimated Cost Greenhouse Gases Saved Over 25 Years 25% $15, Tons 50% $27, Tons 75% $40, Tons 100% $54, Tons Source:


42 Walker Creek Ranch Solar Installation
43 Keeping the Farm AC with Solar Power Reducing energy consumption Water heater & mini fridge Computer & monitor Packing Shed lighting on harvest days timer Pond pump timer
44 Converting the Farm to DC Why DC? with Solar Power Solar panels output DC No need for DC AC inverter Many electronic devices are DC Computers, battery charger, AC adapter

45 Converting the Farm to DC Efficient LED lighting 2ft LED tube = 3 W with Solar Power 4ft Fluorescent tube = 40 W Getting brighter and better with increasing technology
46 Converting the Farm to DC with Solar Power Replace loads with their DC equivalents RV market many 12V / 24V DC appliances For existing DC loads (stereo, digital scales) use DC-DC converter Circuit that changes the DC voltage 12V car charger for cell phones For loads without DC equivalents, use DC AC inverter (veg( veg.. spinner)
47 Converting the Farm to DC with Solar Power Replace all lighting with LED lighting Solar water heater Replace computer + monitor with laptop Combined 120 W vs 60 W laptop Replace laser printer with inkjet Printing: 340 W vs 25 W Replace Greenhouse fans motors with DC motors of same size
48 Converting the Farm to DC with Solar Power Pros Reduce power consumption No need for inverters to be running continuously # of SuPER units needed drops to 15 $7,500 Cons Requires modification to electrical system Estimated parts cost $4,258 Requires inverters to use AC loads Require AC DC rectifiers to use grid power (backup)
49 Converting the Farm to DC with Solar Power May or may not be feasible for this farm Good idea for a farm currently without any electricity Rural areas No local utility
50 SuPER Field Testing 15 SuPER units still a large number, especially for field testing Greenhouse needs 13 of them Focus on powering all but the Greenhouse Only requires 2 units Feasible number of units to build These buildings loads provide good simulation of household loads
51 SuPER Field Testing Convert these buildings to DC $2, in replacement parts Install AC DC rectifiers for backup (~$350) Leave Greenhouse AC Still have AC power available at the farm
52 SuPER Field Testing Packing Shed w/ DC loads Estimated watt-hours per day Can use one SuPER unit Install behind building or on roof

53 SuPER Field Testing Packing Shed SuPER Location
54 SuPER Field Testing Straw Bale House & Storage Shed w/ DC loads Estimated watt-hours per day Can use one SuPER unit Trees around building Install away from trees


55 SuPER Field Testing Straw Bale House SuPER Locations
56 Conclusion # Building / Area Total Power Per Day (AC) Total Power Per Day (DC) 1 Packing Shed 4,712.4 Wh Wh 2 Straw Bale House Wh 3 Storage Shed Wh 4 Greenhouse 13,837 Wh Total 19, Wh Wh 0.96 Wh 12,200 Wh 13, Wh

57 Future Studies Electronics Related Projects DC-DC converters, DC-AC inverters, AC-DC rectifiers LED lighting system


58 Solar water heater Future Studies Other Projects More efficient methods of heating/cooling foods Wind power

59 Review literature Future Studies Greenhouse Thorough analysis of energy requirements Optimize performance (energy)

60 Discussion Questions? Comments?
CAL POLY SUPER PROJECT ELECTRICAL POWER ANALYSIS OF CAL POLY ORGANIC FARM
 CAL POLY SUPER PROJECT ELECTRICAL POWER ANALYSIS OF CAL POLY ORGANIC FARM by Alexander Liang Senior Project ELECTRICAL ENGINEERING DEPARTMENT California Polytechnic State University San Luis Obispo 2008
Commercial-in-Confidence Ashton Old Baths Financial Model - Detailed Cashflow
 Year 0 1 2 3 4 5 6 7 8 9 10 11 12 13 Oct-16 Nov-16 Dec-16 Jan-17 Feb-17 Mar-17 Apr-17 May-17 Jun-17 Jul-17 Aug-17 Sep-17 Oct-17 2,038 2,922 4,089 4,349 6,256 7,124 8,885 8,885 8,885 8,885 8,885 8,885 9,107
COMPARISON OF FIXED & VARIABLE RATES (25 YEARS) CHARTERED BANK ADMINISTERED INTEREST RATES - PRIME BUSINESS*
 CHARTERED BANK ADMINISTERED INTEREST RATES - PRIME BUSINESS*") COMPARISON OF FIXED & VARIABLE RATES (25 YEARS) 2 Fixed Rates Variable Rates For Internal Use Only. FIXED RATES OF THE PAST 25 YEARS AVERAGE RESIDENTIAL MORTGAGE LENDING RATE - 5 YEAR* (Per cent) Year
COMPARISON OF FIXED & VARIABLE RATES (25 YEARS) 2 Fixed Rates Variable Rates For Internal Use Only. FIXED RATES OF THE PAST 25 YEARS AVERAGE RESIDENTIAL MORTGAGE LENDING RATE - 5 YEAR* (Per cent) Year
COMPARISON OF FIXED & VARIABLE RATES (25 YEARS) CHARTERED BANK ADMINISTERED INTEREST RATES - PRIME BUSINESS*
 CHARTERED BANK ADMINISTERED INTEREST RATES - PRIME BUSINESS*") COMPARISON OF FIXED & VARIABLE RATES (25 YEARS) 2 Fixed Rates Variable Rates FIXED RATES OF THE PAST 25 YEARS AVERAGE RESIDENTIAL MORTGAGE LENDING RATE - 5 YEAR* (Per cent) Year Jan Feb Mar Apr May Jun
COMPARISON OF FIXED & VARIABLE RATES (25 YEARS) 2 Fixed Rates Variable Rates FIXED RATES OF THE PAST 25 YEARS AVERAGE RESIDENTIAL MORTGAGE LENDING RATE - 5 YEAR* (Per cent) Year Jan Feb Mar Apr May Jun
WIM #37 was operational for the entire month of September Volume was computed using all monthly data.
 SEPTEMBER 2016 WIM Site Location WIM #37 is located on I-94 near Otsego in Wright county. The WIM is located only on the westbound (WB) side of I-94, meaning that all data mentioned in this report pertains
Meter Insights for Downtown Store
 Meter Insights for Downtown Store Commodity: Analysis Period: Prepared for: Report Date: Electricity 1 December 2013-31 December 2014 Arlington Mills 12 February 2015 Electricity use over the analysis
WIM #29 was operational for the entire month of October Volume was computed using all monthly data.
 OCTOBER 2015 WIM Site Location WIM #29 is located on US 53 near Cotton in St Louis county. System Operation WIM #29 was operational for the entire month of October 2015. Volume was computed using all monthly
WIM #41 CSAH 14, MP 14.9 CROOKSTON, MINNESOTA MAY 2013 MONTHLY REPORT
 WIM #41 CSAH 14, MP 14.9 CROOKSTON, MINNESOTA MAY 2013 MONTHLY REPORT In order to understand the vehicle classes and groupings the Mn/DOT Vehicle Classification Scheme and the Vehicle Classification Groupings
The International Cost Estimating and Analysis Association (ICEAA) Southern California Chapter September 9, 2015
 Southern California Chapter September 9, 2015") Sustainable Integrated Grid Initiative (SIGI): Technical and Economic Challenges of Integrating Renewable Energy, Electric Vehicle Charging and Battery Energy Storage in a Modern Grid The International
Sustainable Integrated Grid Initiative (SIGI): Technical and Economic Challenges of Integrating Renewable Energy, Electric Vehicle Charging and Battery Energy Storage in a Modern Grid The International
WIM #31 US 2, MP 8.0 EAST GRAND FORKS, MN JANUARY 2015 MONTHLY REPORT
 WIM #31 US 2, MP 8.0 EAST GRAND FORKS, MN JANUARY 2015 MONTHLY REPORT WIM #31 EAST GRAND FORKS MONTHLY REPORT - JANUARY 2015 WIM Site Location WIM #31 is located on US 2 at mile post 8.0, southeast of
Thomas Alston Director of Business and Policy Development. Presented By N. Scottsdale Rd, Suite 410 Scottsdale Arizona 85257
 Residential Solar Workshop May 7 th 2008 Thomas Alston Director of Business and Policy Development Presented By 1475 N. Scottsdale Rd, Suite 410 Scottsdale Arizona 85257 Workshop Agenda An Overview of
WIM #48 is located on CSAH 5 near Storden in Cottonwood county.
 WIM Site Location WIM #48 is located on CSAH 5 near Storden in Cottonwood county. System Operation WIM #48 was operational for the entire month of August 2017. Volume was computed using all monthly data.
Economics of Integrating Renewables DAN HARMS MANAGER OF RATE, TECHNOLOGY & ENERGY POLICY SEPTEMBER 2017
 Economics of Integrating Renewables DAN HARMS MANAGER OF RATE, TECHNOLOGY & ENERGY POLICY SEPTEMBER 2017 Presentation Outline Understanding LPEA s expenses and what drives them Economics of net metering
Senior Project Off Grid Solar Array. Courtney Elliott Winter 2017
 1 Senior Project Off Grid Solar Array Courtney Elliott Winter 2017 2 Table of Contents: Table of Contents.2 Introduction...3 Project Goals...4 Design...5-6 Schematic...7 Market Requirements...7 Bill of
Energy use in potato stores
 Energy use in potato stores Adrian Cunnington PCL Sutton Bridge Potato Council Energy Forum Huntingdon 11 February 2010 Storage costs Fixed (capital) costs Variable (running) costs Finance costs Potato
Presented by Eric Englert Puget Sound Energy September 11, 2002
 Results from PSE s First Year of Time of Use Program Presented by Eric Englert Puget Sound Energy September 11, 2002 Puget Sound Energy Overview 973,489 Total Electric Customers 908,949 are AMR Capable
Alberta. Collision Facts. 330 people killed. 17,907 people injured. 140,705 collisions.
 Collision Facts 330 people killed 17,907 people injured 140,705 collisions May 2017 www.transportation.alberta.ca/statistics Collision Facts 330 people killed 17,907 people injured 140,705 collisions Monday
WIM #41 CSAH 14, MP 14.9 CROOKSTON, MINNESOTA APRIL 2014 MONTHLY REPORT
 WIM #41 CSAH 14, MP 14.9 CROOKSTON, MINNESOTA APRIL 2014 MONTHLY REPORT In order to understand the vehicle classes and groupings, the MnDOT Vehicle Classification Scheme and the Vehicle Classification
NJ Solar Market Update As of 6/30/15
 NJ Solar Market Update As of 6/30/ Prepared by Charlie Garrison July 17, 20 SOLAR INSTALLED CAPACITY DATA The preliminary installed solar capacity as of 6/30/ is approximately 1,500.7 MW. Approximately
Modeling and Comparison of Dynamics of AC and DC Coupled Remote Hybrid Power Systems
 Modeling and Comparison of Dynamics of AC and DC Coupled Remote Hybrid Power Systems Presenter: Tanjila Haque Supervisor : Dr. Tariq Iqbal Faculty of Engineering and Applied Science Memorial University
Capture The Power of Photovoltaics. IEEE Power Engineering Society Meeting May 2005
 Capture The Power of Photovoltaics IEEE Power Engineering Society Meeting May 2005 Agenda Photovoltaic Basics Applications Economics Grid Interconnection and Net Metering Grid-Tied System Components Net
NJ Solar Market Update As of 2/29/16
 NJ Solar Market Update As of 2/29/16 Prepared by Charlie Garrison March 24, 2016 SOLAR INSTALLED CAPACITY DATA The installed solar capacity as of 2/29/16 is approximately 1,644.3 MW. Approximately 20.3
Fort York Food Bank Monthly Performance Report (FYFB)
") September 2012 Current Month Fort York Food Bank Monthly Performance Report (FYFB) 2010 2011 2012 % change 2010 2011 2012 2009 2010 2011 2012 % change Food Baskets Distributed (3 days of meals/basket)
September 2012 Current Month Fort York Food Bank Monthly Performance Report (FYFB) 2010 2011 2012 % change 2010 2011 2012 2009 2010 2011 2012 % change Food Baskets Distributed (3 days of meals/basket)
The impact of electric vehicle development on peak demand and the load curve under different scenarios of EV integration and recharging options
 The impact of electric vehicle development on peak demand and the load curve under different scenarios of EV integration and recharging options Electricity demand in France: a paradigm shift Electricity
Operational Opportunities to Minimize Renewables Curtailments
 Operational Opportunities to Minimize Renewables Curtailments Clyde Loutan Principal, Renewable Energy Integration July 24, 2017 2017 CAISO - Public Page 1 Agenda Background Real-time control performance
WIM #40 is located on US 52 near South St. Paul in Dakota county.
 WIM Site Location WIM #40 is located on US 52 near South St. Paul in Dakota county. System Operation WIM #40 was operational for the entire month of November 2017. Volume was computed using all monthly
Solar/Wind Hybrid Renewable Power Generators for Minnesota Rural Transportation Applications
 Solar/Wind Hybrid Renewable Power Generators for Minnesota Rural Transportation Applications Taek Kwon and Ryan Weidemann University of Minnesota-Duluth Ray Starr, Kevin Schmidt and Roger Sowder Minnesota
ANCR CRU Statistics February 2007 to December 2007
 ANCR CRU Statistics February 2007 to December 2007 o Jan/07 Feb/07* Mar/07 Apr/07 May/07 Jun/07 Jul/07 Aug/07 Sep/07 Oct/07 Nov/07 Dec/07 Total notes data from Perimeter phone system unavailable prior
Up and Down Months of the Stock Market
 Up and Down Months of the Stock Market 1926-2017 Positive years (66) in the stock market were not good all year long and losing years (24) were not losers throughout the year. Winning years produce losing
PDR Energy Baseline Alternative. Proposal for Discussion October 27, 2015
 PDR Energy Baseline Alternative Proposal for Discussion October 27, 2015 Update Since Last Meeting Since the October 12 th Working Group Meeting Stem, Solar City, AMS and CESA have had over a half-dozen
Graph #1. Micro-Generation Generating Units in Alberta 20
 2, Graph #1. Micro-Generation Generating Units in Alberta 2 Cumulative # of Generating Units 1,9 1,8 1,7 1,6 1,5 1,4 1,3 1,2 1,1 1, 9 8 7 6 5 4 3 2 Number of MGG Units as of 216 Mar 31 Number of Solar
Measured Performance of a High-Efficiency Solar-Assisted Heat Pump Water Heater
 Measured Performance of a High-Efficiency Solar-Assisted Heat Pump Water Heater International Conference on Energy Efficiency in Domestic Appliances and Lighting September 2017 Danny Parker/Carlos Colon
Results of annual simulation
 2 x Vitosol 100-FM SVKF Total gross surface area:4,46 m² Azimuth: 0 Incl.: 30 160 Liters/Day 50 C Gas-fired boiler 26 kw Vitocell 100-B Vol : 250 l Results of annual simulation Installed collector power:
University of Michigan Eco-Driving Index (EDI) Latest data: October 2017
 Latest data: October 2017") University of Michigan Eco-Driving Index () http://www.ecodrivingindex.org Latest data: October 2017 Developed and issued monthly by Michael Sivak and Brandon Schoettle Sustainable Worldwide Transportation
University of Michigan Eco-Driving Index () http://www.ecodrivingindex.org Latest data: October 2017 Developed and issued monthly by Michael Sivak and Brandon Schoettle Sustainable Worldwide Transportation
Off-Grid Renewable Energy Program in Myanmar. Pradeep Tharakan, PhD Senior Energy Specialist (Climate Change) Asian Development Bank
 Asian Development Bank") Off-Grid Renewable Energy Program in Myanmar Pradeep Tharakan, PhD Senior Energy Specialist (Climate Change) Asian Development Bank 1 ADB Off-grid Renewable Energy Program Phase 1: (October 2013 June 2014)
Off-Grid Renewable Energy Program in Myanmar Pradeep Tharakan, PhD Senior Energy Specialist (Climate Change) Asian Development Bank 1 ADB Off-grid Renewable Energy Program Phase 1: (October 2013 June 2014)
How To Build A Solar Wind Turbine: Solar Powered Wind Turbine Plans
 How To Build A Solar Wind Turbine: Solar Powered Wind Turbine Plans If you are searching for the book How To Build a Solar Wind Turbine: Solar Powered Wind Turbine Plans in pdf form, then you've come to
Residential Time-of-Day Service Rate Schedule R-TOD
 I. Applicability This Rate Schedule 1-R-TOD applies to single- and three-phase service for the following types of residential premises: 1. Individual or dual metered residences with digital communicating
December 2018 RenewableGenerations Monthly Report
 2018 RenewableGenerations Monthly Report Ecosystem of Clean Energy Programs Contractor Training Webinar Table of Contents Solar Electric... 3 Solar Thermal Heating (Northern Nevada Gas Customers)... 5
2017 Risk and Profit Conference Breakout Session Presenters. 13. Ethanol and Biodiesel Market and Profitability Prospects
 2017 Risk and Profit Conference Breakout Session Presenters 13. Ethanol and Biodiesel Market and Profitability Prospects Dan O Brien Daniel O Brien was raised on a grain and livestock
A Sustainable Scenario for Energy and Water in Bahrain
 A Sustainable Scenario for Energy and Water in Bahrain John Barton, j.p.barton@lboro.ac.uk Murray Thomson, m.thomson@lboro.ac.uk Centre for Renewable Energy Systems Technology (CREST), Loughborough University
2016 UC Solar Research Symposium
 2016 UC Solar Research Symposium Beyond UCR s Sustainable Integrated Grid Initiative: Energy Management Projects in Southern California October 7, 2016 Presented by: Alfredo A. Martinez-Morales, Ph.D.
Plug- in Electric Vehicles History, Technology and Rates. Ben Echols
 Plug- in Electric Vehicles History, Technology and Rates Ben Echols Southern Company Southern Company (NYSE: SO), an investor-owned energy company in the Southeast, owns 290 generating units at 77 power
CHOOSE TOSAVE. Take control of your electric bill by choosing the pricing plan that is right for you. Time-of-Use. Peak Demand. Demand Time-of-Use
 CHOOSE TOSAVE Take control of your electric bill by choosing the pricing plan that is right for you. Time-of-Use Peak Demand Demand Time-of-Use Basic SHIFT YOUR USAGE AND SAVE Sometimes you can save money
Design Criteria Data
 OKLAHOMA CITY OK Latitude = 35.4 N WMO No. 72353 Longitude = 97.6 W Elevation = 133 feet Period of Record = 1973 to 1996 Average Pressure = 28.62 inches Hg Design Criteria Data Mean Coincident (Average)
Electrical power. Objectives. Assessment. Assessment. Equations. Physics terms 5/27/14
 Electrical power Objectives Use the equation for electrical power to solve circuit problems. Understand basic concepts for home electricity usage and wiring. Calculate the power used by electric circuit
FOR IMMEDIATE RELEASE
 Article No. 7761 Available on www.roymorgan.com Roy Morgan Unemployment Profile Monday, 8 October 2018 Unemployment down to 9.4% in September off two-year high Australian employment has grown solidly over
Would you like to be free and enjoy electrical comforts just like at home?
 Would you like to be free and enjoy electrical comforts just like at home? EFOY COMFORT 365 days of freedom away from the grid EFOY COMFORT. The fully automatic, silent power supplier works anywhere, in
Solar/Wind Hybrid Renewable Power Generator for Powering Rural Dynamic Message Sign
 Solar/Wind Hybrid Renewable Power Generator for Powering Rural Dynamic Message Sign Taek Kwon (Prof.) and Ryan Weidemann (GRA) University of Minnesota-Duluth Ray Starr, Kevin Schmidt and Roger Sowder Minnesota
MARKET RATES UPDATE Paula Gold-Williams Cory Kuchinsky
 MARKET RATES UPDATE I N T R O D U C T I O N BY: Paula Gold-Williams President & Chief Executive Officer (CEO) P R E S E N T E D BY: Cory Kuchinsky Interim Vice President, Financial Services September 24,
Design Criteria Data
 MEDFORD/JACKSON CO. OR Latitude = 42.37 N WMO No. 72597 Longitude =122.8 W Elevation = 1329 feet Period of Record = 1973 to 1996 Average Pressure = 28.61 inches Hg Design Criteria Data Mean Coincident
Cal Poly Sustainable Power for Electrical Resources (SuPER(
 Cal Poly Sustainable Power for Electrical Resources (SuPER( SuPER) Project Solar 2008 San Diego, CA PV System Performance Dr. James G. Harris Tyler Sheffield Dr. Ali Shaban ViaSat: : Carlsbad, CA Department
One Behavioral Switch At a Time
 One Behavioral Switch At a Time 6,000,000 5,000,000 4,000,000 3,000,000 2,000,000 1,000,000 0 Jul Aug Sep Oct Nov Dec Jan Feb Mar Apr May Jun kwh for Fiscal year 10/11 kwh for Fiscal year 11/12 Classroom
The financial impact of residential rooftop PV on local governments in South Africa
 The financial impact of residential rooftop PV on local governments in South Africa A case study into Stellenbosch Municipality Nikkie Korsten Master s candidate Sustainable Development, Stellenbosch University
Design Criteria Data
 DES MOINES IA Latitude = 41.53 N WMO No. 72546 Longitude = 93.65 W Elevation = 965 feet Period of Record = 1973 to 1996 Average Pressure = 28.96 inches Hg Design Criteria Data Mean Coincident (Average)
Field Test Results of Green Roofs, Cool Roofs, and Conventional Roofs CNY Engineering Expo Oncenter, Syracuse, NY November 9, 2015
 Field Test Results of Green Roofs, Cool Roofs, and Conventional Roofs CNY Engineering Expo Oncenter, Syracuse, NY November 9, 2015 Hugh I. Henderson, Jr. P.E CDH Energy Corp. Cazenovia, NY Project Goals
RIDERSHIP TRENDS. April 2018
 RIDERSHIP TRENDS April Prepared by the Division of Strategic Capital Planning June Table of Contents Executive Summary...1 Ridership...3 Estimated Passenger Trips by Line...3 Estimated Passenger Trips
Transmission Access Charges (TAC) Katie Ramsey Staff Attorney Clean Coalition mobile
 Katie Ramsey Staff Attorney Clean Coalition mobile") Transmission Access Charges (TAC) Katie Ramsey Staff Attorney Clean Coalition 202-709-8063 mobile katie@clean-coalition.org Making Clean Local Energy Accessible Now November 2016 Distributed Generation
Transmission Access Charges (TAC) Katie Ramsey Staff Attorney Clean Coalition 202-709-8063 mobile katie@clean-coalition.org Making Clean Local Energy Accessible Now November 2016 Distributed Generation
NJ Solar Market Update
 NJ Solar Market Update April 16, 20 Renewable Energy Committee Meeting Trenton, NJ Prepared by Charlie Garrison Solar Installed Capacity Data The preliminary installed solar capacity as of 3/31/ is approximately
Evaluation and modelling of demand and generation at distribution level for Smart grid implementation
 Evaluation and modelling of demand and generation at distribution level for Smart grid implementation Dr.Haile-Selassie Rajamani Senior Lecturer Energy and Smart Grid Research Group University of Bradford,
Design Criteria Data
 LAS VEGAS/MCCARRAN NV Latitude = 36.8 N WMO No. 72386 Longitude =115.1 W Elevation = 2179 feet Period of Record = 1973 to 1996 Average Pressure = 27.67 inches Hg Design Criteria Data Mean Coincident (Average)
City of Biddeford Solid Waste Management Commission January 10, :00 PM Public Works
 City of Biddeford Solid Waste Management Commission January 10, 2017 7:00 PM Public Works 1. Call to Order 2. Approval of Minutes - December 13, 3. Discussion / Approval 3.1. Food Waste curbside collection
Design Criteria Data
 PHOENIX/SKY HARBOR AZ Latitude = 33.43 N WMO No. 72278 Longitude =112. W Elevation = 116 feet Period of Record = 1973 to 1996 Average Pressure = 28.72 inches Hg Design Criteria Data Mean Coincident (Average)
A direct current (DC) circuit. L 26 Electricity and Magnetism [4] Alternating Current (AC) Direct Current DC. AC power
![A direct current (DC) circuit. L 26 Electricity and Magnetism [4] Alternating Current (AC) Direct Current DC. AC power](/thumbs/75/71489894.jpg "A direct current (DC) circuit. L 26 Electricity and Magnetism [4] Alternating Current (AC) Direct Current DC. AC power") L 26 Electricity and Magnetism [4] A direct current (DC) circuit simple electrical circuits direct current DC Alternating current (AC) vs direct current (DC) electric power distribution household electricity
L 26 Electricity and Magnetism [4] A direct current (DC) circuit simple electrical circuits direct current DC Alternating current (AC) vs direct current (DC) electric power distribution household electricity
FOR IMMEDIATE RELEASE
 Article No. 7845 Available on www.roymorgan.com Roy Morgan Unemployment Profile Friday, 18 January 2019 Unemployment in December is 9.7% and under-employment is 8.8% FOR IMMEDIATE RELEASE Australian unemployment
Total Production by Month (Acre Feet)
") Production by Month (acre-feet) 2008 2009 2010 2011 2012 2013 2014 2015 2016 January 25 339.10 228.90 249.50 297.99 243.06 327.14 247.66 212.37 February 234.00 218.80 212.10 241.52 245.82 279.08 234.16
Production by Month (acre-feet) 2008 2009 2010 2011 2012 2013 2014 2015 2016 January 25 339.10 228.90 249.50 297.99 243.06 327.14 247.66 212.37 February 234.00 218.80 212.10 241.52 245.82 279.08 234.16
FOR IMMEDIATE RELEASE
 Article No. 7353 Available on www.roymorgan.com Roy Morgan Unemployment Profile Wednesday, 11 October 2017 2.498 million Australians (18.9%) now unemployed or under-employed In September 1.202 million
Electric Utility Incentive Programs. Marcus Wilcox, President Cascade Energy, Inc.
 Electric Utility Incentive Programs Marcus Wilcox, President Cascade Energy, Inc. Agenda Why do utilities offer incentive program? Energy vs. Demand vs. Demand Response Influence of Rates No Brainers?
Your electricity bill
 Your electricity bill Bill date: February 22, 2017 Summary of what you owe Amount due on your last bill $1,271.36 Payment made on Jan 30, thank you -$1,271.36 Your balance forward $0.00 Your new charges
Sound Transit Operations July 2016 Service Performance Report. Ridership
 Ridership Total Boardings by Mode Mode Jul-15 Jul-16 % YTD-15 YTD-16 % ST Express 1,618,779 1,545,852-4.5% 10,803,486 10,774,063-0.3% Sounder 333,000 323,233-2.9% 2,176,914 2,423,058 11.3% Tacoma Link
CHOOSE TOSAVE. Take control of your electric bill by choosing the pricing plan that is right for you. Time-of-Use. Peak Demand. Demand Time-of-Use
 CHOOSE TOSAVE Take control of your electric bill by choosing the pricing plan that is right for you. Time-of-Use Peak Demand Demand Time-of-Use Basic SHIFT YOUR USAGE AND SAVE Sometimes you can save money
Monthly STAR Report : Quality Inn Ashland For the Month of: December 2017 Currency: US Dollar / Competitive Set Data Excludes Subject Property
 STR # 33511 / Created January 18, 2018 ly STAR Report : Quality Inn Ashland For the of: December 2017 Currency: US Dollar / Competitive Set Data Excludes Subject Property Table Of Contents 1 ly Performance
Past Due. Account Charges. Contract Charges Security Deposit Due - Jun 09, , Customer Service. Jun 19, PAST DUE $1,693.
 11983978 Jun 19, 217 1 124 958 PAST DUE $1,693.97 Meter Reading Information Meter # 55271 May 3 655 Jun 15 6642 17 days 1397 on or about Aug 15 82 Past Due Balance payable includes an amount which is payable
RIDERSHIP TRENDS. March 2017
 RIDERSHIP TRENDS March 2017 Prepared by the Division of Strategic Capital Planning May 2017 Table of Contents Executive Summary...1 Ridership...3 Estimated Passenger Trips by Line...3 Estimated Passenger
Design Criteria Data
 BURLINGTON VT Latitude = 44.47 N WMO No. 72617 Longitude = 73.15 W Elevation = 341 feet Period of Record = 1973 to 1996 Average Pressure = 29.61 inches Hg Design Criteria Data Mean Coincident (Average)
Balance from your previous bill $0.00 Meter # Basic Charge: 17 $ /day 3.23* Energy charge:¹ 2
 11983979 Jun 19, 217 1 124 962 Jul 11, 217 $24.34 Meter Reading Previous Bill. Balance from your previous bill $. Meter # 552711 May 3 19813 Account Account charge 12.4* Charges 17 days 82 Jun 15 19895
Design Criteria Data
 RAPID CITY SD Latitude = 44.5 N WMO No. 72662 Longitude =3. W Elevation = 3169 feet Period of Record = 1973 to 1996 Average Pressure = 26.67 inches Hg Design Criteria Data Mean Coincident (Average) Values
Design Criteria Data
 COLUMBIA SC Latitude = 33.95 N WMO No. 7231 Longitude = 81.12 W Elevation = 226 feet Period of Record = 1973 to 1996 Average Pressure = 29.8 inches Hg Design Criteria Data Mean Coincident (Average) Values
Design Criteria Data
 PHILADELPHIA PA Latitude = 39.88 N WMO No. 7248 Longitude = 75.25 W Elevation = 3 feet Period of Record = 1973 to 1996 Average Pressure = 29.98 inches Hg Design Criteria Data Mean Coincident (Average)
Design Criteria Data
 HONOLULU/OAHU HI Latitude = 21.35 N WMO No. 91182 Longitude =157.9 W Elevation = 16 feet Period of Record = 1967 to 1996 Average Pressure = 29.96 inches Hg Design Criteria Data Mean Coincident (Average)
Design Criteria Data
 MACON/LEWIS WILSON GA Latitude = 32.7 N WMO No. 72217 Longitude = 83.65 W Elevation = 361 feet Period of Record = 1973 to 1996 Average Pressure = 29.66 inches Hg Design Criteria Data Mean Coincident (Average)
Design Criteria Data
 PIERRE SD Latitude = 44.38 N WMO No. 726686 Longitude =1.2 W Elevation = 1742 feet Period of Record = 1973 to 1996 Average Pressure = 28.1 inches Hg Design Criteria Data Mean Coincident (Average) Values
Design Criteria Data
 INDIANAPOLIS IN Latitude = 39.73 N WMO No. 72438 Longitude = 86.27 W Elevation = 87 feet Period of Record = 1973 to 1996 Average Pressure = 29.15 inches Hg Design Criteria Data Mean Coincident (Average)
Design Criteria Data
 ANCHORAGE AK Latitude = 61.17 N WMO No. 7273 Longitude =15. W Elevation = 131 feet Period of Record = 1973 to 1996 Average Pressure = 29.6 inches Hg Design Criteria Data Mean Coincident (Average) Values
Design Criteria Data
 DENVER/STAPLETON CO Latitude = 39.75 N WMO No. 72469 Longitude =14.8 W Elevation = 5332 feet Period of Record = 1973 to 1995 Average Pressure = 24.66 inches Hg Design Criteria Data Mean Coincident (Average)
System Status Briefing
 System Status Briefing Phakamani Hadebe Interim Group Chief Executive 3 May 2018 Contents 1 Performance summary 2 Operational highlights 3 Generation performance 4 Distribution overview 5 Transmission
RESNET San Diego, California February 24, 2003
 RESNET San Diego, California February 24, 2003 Arthur H. Rosenfeld, Commissioner California Energy Commission 1 916 654-4930 ARosenfe@Energy.State.CA.US www.energy.ca.gov California Title 24 Objective
Design Criteria Data
 JACKSONVILLE FL Latitude = 3.5 N WMO No. 7226 Longitude = 81.7 W Elevation = 3 feet Period of Record = 1973 to 1996 Average Pressure = 3.1 inches Hg Design Criteria Data Mean Coincident (Average) Values
NEU Electric and Natural Gas Price Update
 $ / MWH Jan-11 May-11 Sep-11 Sep-12 Jan-13 Electric: Short-Term Outlook The NYMEX Northern Illinois Hub 12-month forward price at the end of August 2016 for the September 2016 to August 2017 period was
Design Criteria Data
 SPOKANE WA Latitude = 47.63 N WMO No. 72785 Longitude =117.5 W Elevation = 2366 feet Period of Record = 1973 to 1996 Average Pressure = 27.5 inches Hg Design Criteria Data Mean Coincident (Average) Values
Virginia Tech Research Center Arlington, Virginia, USA. PPT slides will be available at
 SMART BUILDINGS & A SMART CITY CONNECTED COMMUNITY Guest Professor Inaugural Lecture at Tsinghua University Professor Saifur Rahman Director, Virginia Tech Advanced Research Inst., USA President-elect,
Design Criteria Data
 LOUISVILLE/STANDIFORD KY Latitude = 38.18 N WMO No. 72423 Longitude = 85.73 W Elevation = 489 feet Period of Record = 1973 to 1996 Average Pressure = 29.49 inches Hg Design Criteria Data Mean Coincident
Design Criteria Data
 DAYTON/JAMES M COX OH Latitude = 39.9 N WMO No. 72429 Longitude = 84.2 W Elevation = 14 feet Period of Record = 1973 to 1996 Average Pressure = 28.95 inches Hg Design Criteria Data Mean Coincident (Average)
Energy Conservation Efforts
 Hennepin County Property Services Energy Conservation Efforts MEPC Presentation September 2010 HENNEPIN COUNTY PROPERTY SERVICES DEPARTMENT MONTHLY ENERGY COSTS $1,200,000 $1,000,000 Cold 2009 October
Design Criteria Data
 SPRINGFLD MO Latitude = 37.23 N WMO No. 7244 Longitude = 93.38 W Elevation = 127 feet Period of Record = 1973 to 1996 Average Pressure = 28.66 inches Hg Design Criteria Data Mean Coincident (Average) Values
Design Criteria Data
 BIRMINGHAM AL Latitude = 33.57 N WMO No. 72228 Longitude = 86.75 W Elevation = 63 feet Period of Record = 1973 to 1996 Average Pressure = 29.36 inches Hg Design Criteria Data Mean Coincident (Average)
September 2016 Water Production & Consumption Data
 September 2016 Water Production & Consumption Data September 2016 monthly water production (288.48 AF) was lowest in at least 17 years. Monthly water production has increased slightly each month since
Overview of FMCSA s Proposed Hours of Service Rules For Truck Drivers. Rob Abbott Vice President of Safety Policy American Trucking Associations
 Overview of FMCSA s Proposed Hours of Service Rules For Truck Drivers Rob Abbott Vice President of Safety Policy American Trucking Associations Background 2003 Final Rule 2003 Legal Challenge 2005 New
Design Criteria Data
 BOSTON/LOGAN MA Latitude = 42.37 N WMO No. 7259 Longitude = 71.3 W Elevation = 3 feet Period of Record = 1967 to 1996 Average Pressure = 29.95 inches Hg Design Criteria Data Mean Coincident (Average) Values
Design Criteria Data
 MINNEAPOLIS-ST PAUL MN Latitude = 44.88 N WMO No. 72658 Longitude = 93.22 W Elevation = 837 feet Period of Record = 1973 to 1996 Average Pressure = 29.7 inches Hg Design Criteria Data Mean Coincident (Average)
Design Criteria Data
 MIDLAND TX Latitude = 31.95 N WMO No. 72265 Longitude =2. W Elevation = 2861 feet Period of Record = 1973 to 1996 Average Pressure = 27.3 inches Hg Design Criteria Data Mean Coincident (Average) Values