2014 Meteorological and Oceanographic Summary for the Bocas del Toro Research Station. Prepared by: Steven Paton
|
|
|
- William Daniel
- 5 years ago
- Views:
Transcription

1 Meteorological and Oceanographic Summary for the Bocas del Toro Research Station Prepared by: Steven Paton
. This report is not meant to be exhaustive in its coverage in that it summarizes only some of the most important or interesting parameters available.")
2 1 Introduction This is the second of a series of yearly reports summarising the past year s Smithsonian Tropical Research Institute s Physical Monitoring Program on and around the Bocas del Toro Research Station (BRS). This report is not meant to be exhaustive in its coverage in that it summarizes only some of the most important or interesting parameters available. Any comments on how future yearly summaries could be improved would be appreciated. Additional copies of this report, reports from previous years, and downloadable data from the Bocas and other research locations, can be obtained from: Setting Established in 2002, the BRS ( , ) is located near the western end of Isla Colon; part of the Bocas del Toro Archipelago. The archipelago is a complex region of islands, mainland bays, rivers and forested mountain slopes on the Caribbean side of the Panamanian isthmus. The station receives an average of mm of rain per year. The meteorological year is divided into four parts: two periods of lower rainfall (approximately from mid-december to the end of May, and the months of August to October), and two wetter periods (June-July and November- December) see the figure on page 7. Relative humidity, solar radiation, air and sea surface temperature, wind speed (but not direction), and salinity all show seasonal patterns. This report summarises data taken from a meteorology tower located on a platform located approximately 60m from the end of the station s dock, as well as several Sea Surface Temperature (SST) probes located approximately 225m north west of the dock (see map on the following page), as well as the station s aquariums. The current platform was built in 2012 to replace the original platform (see photo at right). The platform and tower are used to measure air and water temperature, wind speed and direction, relative humidity and solar radiation.


3 2 Some summaries (temperature, relative humidity, and soil humidity) are based entirely on manual measurements. Other summaries (solar radiation, wind direction) are based entirely on electromechanical measurements. Finally, some summaries (rainfall and wind speed) are based on combinations of manual and electro-mechanical measurements.
4 3 The Mangrove A, B, and C locations refer to three mangrove census sampling sites located in the mangrove fringe 240m NW of the dock. The Seagrass location refers to the location of the former Seagrass sampling site approximately 90 NW of the dock. The Data Data were collected the following locations: Name Measurements Dec Lat. Dec. Long Main Platform Electronic air temperature, wind, solar radiation, rel. humidity, tide, water temperature Mangrove A Weekly water temperature and salinity Mangrove B Weekly water temperature and salinity Mangrove C Weekly water temperature and salinity Reef Weekly water temperature and salinity Seagrass Weekly water temperature and salinity, Electronic water temp Dock (muelle) Daily water temperature, salinity & DO Aquariums (aquarios) Salinity This report summarises the following data: Platform Dock Aquarium Mangrove Seagrass Relative humidity Air temperature Water temperature Wind speed and direction Solar radiation Water temperature Water Transparency Salinity DO Salinity DO Water temperature Salinity Water temperature Salinity
5 4 Rainfall Rainfall was collected by a rain gauge near the centre of the station, and by a tipping bucket on the platform. The rain gauge was read at approximately 8:00am every day except some weekends and holidays. Tipping buckets generate events for every mm of rainfall recorded. In order to fill in the missing rain gauge data, a computer program was written by the author that uses tipping bucket rainfall data to distribute the rain gauge data for those days when readings were not made. The program takes the total rainfall collected in the rain gauge and divides it up proportionally according to the rainfall patterns recorded by the tipping bucket. The estimated rainfall for the missing days is exactly equal to the rainfall collected by the rain gauge. The daily rainfall data for 2014 are shown on page 7. Page 8 shows the monthly totals for The graph on the same page compares this year s monthly totals with the average monthly totals (±SD) for the period 2002 to Page 9 shows yearly rainfall totals for all years since Time series graph and frequency histograms are presented for these data. Pages 10 and 11 show an analysis of rainfall events (storms). For convenience, and again somewhat arbitrarily, I have defined a storm as any continuous period of rain separated by at least an hour from any other rainfall. Since this analysis required the timing of rainfall events, tipping bucket data were used. As a result, the absolute size of rainfall events should be considered as estimates since they will tend to disproportionately underestimate the size of storms - larger storms will be more underestimated than smaller ones. Keeping this in mind, the tables and graphs on this page compare the maximum storm size and the average storm size and duration per month for the period 2002 to 2013 and for the year 2014.
. The average monthly relative humidity data are shown in tabular and graphical form on page 12.")
6 5 Relative Humidity Data were collected on the platform, approximately 3m above Mean Sea Level, at 15- minute intervals by dataloggers attached to Campbell Sci. CS215 temperature/humidity sensors (Viasala HMP 35/45 sensors prior to 2010). The average monthly relative humidity data are shown in tabular and graphical form on page 12. Air Temperature Shaded air temperature data were collected on the platform, approximately 3m above Mean Sea Level, at 15-minute intervals by dataloggers attached to Campbell Sci. CS215 electronic temperature/humidity sensors (Viasala HMP 35/45 sensors prior to 2010). The monthly average temperature plus monthly maximum and minimum temperatures are shown in tabular and graphical form on pages 13 to 15. Solar Radiation Global solar radiation has been measured at the platform tower approximately 4m above Mean Sea Level using a Li-Cor LI200SB pyranometer attached to a datalogger. 15-minute interval total (MJ m - ²), maximum and minimum (J m - ² s -1 ) are collected. Page 16 shows the Daily Global Radiation values. Page 17 shows total monthly Global Radiation. Wind Speed and Direction 15-minute average, maximum and minimum wind speed plus average wind direction was recorded on the platform tower approximately 7m above Mean Sea Level using a Model Young Anemometer connected to a data logger. Page 18 shows average and maximum daily wind speeds from the Young Anemometer located at the top of the platform tower. Page 19 shows daily average wind direction. The angles indicated in the table and graph on this page represent the direction into which the wind was predominately blowing on a given day. Page 20 shows the monthly average wind speed, monthy average daily maximum wind speed, and monthly average directions (Young Anemometer) for the year.
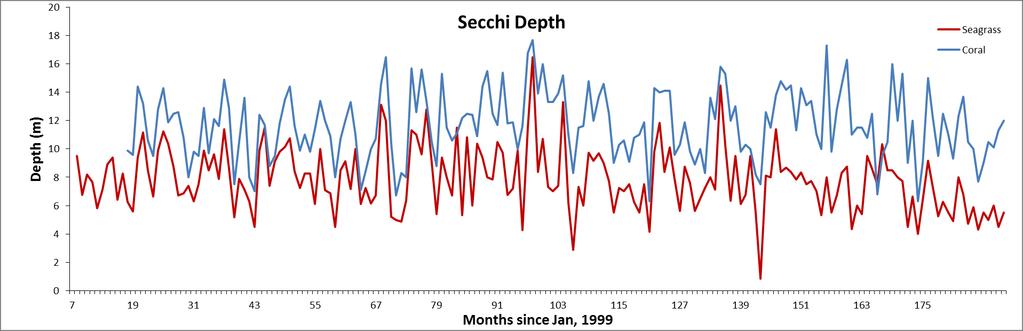
7 6 Given the location of the sensor platform with respect to surrounding topography, it is believed that these data reflect very local wind direction, and to a lesser extent wind speed, conditions Sea Surface Temperature (SST) Water temperature data were collected at the platform at a depth of 1m, at 15-minute intervals by dataloggers attached to Campbell Model 107 electronic temperature sensor. Data were also collected at all other locations using Hobo U22 Water Temperature Pro V2 sensors at varying depths. The monthly average temperature, plus monthly maximum and minimum temperatures for all locations are shown in tabular and graphical form on page 21 and 22, respectively. Salinity Determined from recently collected water samples (taken from a depth of 0.5m) at seven locations, using salinometer Lab-Comb model SCT (precision of 0.01 ppt), or the YSI temperature-salinity-oxygen meter model 85 (precision 0.1 ppt). Monthly averages are shown on page 23 and 24 Water Transparency Measured using a standard Secchi Disk at the Coral and Seagrass sites. Monthly averages are shown on page 25 and 26. Dissolved Oxygen Measured manually at the Dock and the Aquarium using a YSI 2030 Pro sensor. Monthly averages are shown on page 27 and 28. Times Series Graphs showing the monthly averages for the entire period of recorded SST, Salinity, Secchi depth and DO can be found on pages 29 and 30. Daily Patterns Pages 31 and 32
8 7 show the daily patterns for air temperature, relative humidity, solar radiation, rainfall and wind speed. These figures were built using electronic sensor data from the platform.
9 8
10 Precipitation (mm) 9 Daily Rainfall (mm) by the Station Tipping Bucket Jan. Feb. Mar. Apr. May June July Aug. Sep. Oct. Nov. Dec Jan Feb Mar Apr May Jun Jul Aug Sep Oct Nov Dec
11 Precipitation (mm) Accumulative Precipitation (mm) 10 Monthly Rainfall (mm) at 'Bocas ' - Rain Guage Year Jan Feb Mar Apr May June July Aug Sep Oct Nov Dec Total mean sd min max Jan Feb Mar Apr May Jun Jul Aug Sep Oct Nov Dec Jan Feb Mar Apr May Jun Jul Aug Sep Oct Nov Dec
12 Precipitacion (mm) Precipitation (mm) Frequency 11 Yearly Rainfall (mm) at 'Bocas ' - Rain Gauge Year Rain Year Rain Year Rain Yearly Precipitation Distribution of Yearly Precipitation 2013 Mean Median Range S.D. N = = = = = Year Precipitation (mm) Year
13 12 Storm Analysis Max. Rainfall per Storm (mm) Storm Duration (min.) Mean S.D. Mean S.D. January February March April May June July August September October November December Av. Rainfall per Storm (mm) Mean S.D. January February March April May June July August September October November December
14 Mean Duration (min ±SD) Mean Rainfall (mm ±SD) 13 Average Monthly Storm Size J an Feb M ar Apr M ay J un J ul Aug Sep Oc t Nov Dec 0 Jan Feb Mar Apr May Jun Jul A ug Sep Oct Nov Dec Average Monthly Storm Duration Jan Feb Mar A pr May Jun Jul Aug Sep Oct Nov Dec 0 Jan Feb Mar Apr May Jun Jul A ug Sep Oct Nov Dec
15 14 Relative Humidity (%) Year Jan Feb Mar Apr May June July Aug Sep Oct Nov Dec mean sd min max
16 15 Avg. Monthly Maximum & Minimum ( C) Temperatures Monthly Average Temperature Year Jan Feb Mar Apr May June July Aug Sep Oct Nov Dec mean sd min max
17 16 Monthly Average Daily Maximum Temperature Year Jan Feb Mar Apr May June July Aug Sep Oct Nov Dec mean sd min max Monthly Average Daily Minimum Temperature Year Jan Feb Mar Apr May June July Aug Sep Oct Nov Dec mean sd min max
18 17 Monthly Air Temperature ( C)
19 18 Daily Total Radiation (MJ m -2 day -1 ) Jan. Feb. Mar. Apr. May June July Aug. Sep. Oct. Nov. Dec MJ m ² day Jan Feb Mar Apr May Jun Jul Aug Sep Oct Nov Dec
20 19 Total Monthly Solar Radiation (MJ m -2 day -1 ) Year Jan Feb Mar Apr May June July Aug Sep Oct Nov Dec mean sd min max
21 20 Daily Average Wind Speed (km/h) Jan. Feb. Mar. Apr. May June July Aug. Sep. Oct. Nov. Dec. Avg Max Avg Max Avg Max Avg Max Avg Max Avg Max Avg Max Avg Max Avg Max Avg Max Avg Max Avg Max Speed (km/h) Daily Avg Daily Max Jan Feb Mar Apr May Jun Jul Aug Sep Oct Nov Dec
22 21 Average Daily Wind Direction ( ) Jan. Feb. Mar. Apr. May June July Aug. Sep. Oct. Nov. Dec Jan Feb Mar Apr May Jun Jul Aug Sep Oct Nov Dec
23 Direction -22- Average Monthly Wind Speed (km/h) and Direction ( ) Long-term Av Speed Wsmx Dir. Speed Wsmx Dir. January February March April May June July August September October November December
24 -23- Average Sea Surface Temperature ( C) Long-term Average Monthly Temperatures ( ) Mangrove Sea A B C grass Platform Dock January February March April May June July August September October November December Average Monthly Temperatures (2014) Mangrove Sea A B C grass Platform Dock January February March April May June July August September October November December
25 Temperature (C) Temperature (C) Temperature (C) SST, Mangrove 'A' SST, Mangrove 'B' SST, Mangrove 'C' SST, Seagrass SST, Platform SST, Dock Jan Feb Mar Apr May June July Aug Sep Oct Nov Dec Month Jan Feb Mar Apr May June July Aug Sep Oct Nov Dec Month
26 -25- Long-term Average Monthly Temperatures ( ) Average Salinity (ppt) Mangrove Sea A B C grass Coral Aquarium Dock January February March April May June July August September October November December Average Monthly Temperatures (2014) Mangrove Sea A B C grass Coral Aquarium Dock January February March April May June July August September October November December
27 Salinity (ppt) Salinity (ppt) Salinity (ppt) Salinity (ppt) Salinity Mangrove 'A' Salinity Mangrove 'B' Salinity Mangrove 'C' Salinity Seagrass Salinity Coral Salinity Aquarium Salinity Seagrass Jan Feb Mar Apr May June July Aug Sep Oct Nov Dec Month Jan Feb Mar Apr May June July Aug Sep Oct Nov Dec Month
28 -27- Average Water Transparancy (Secchi depth) Coral Year Jan Feb Mar Apr May June July Aug Sep Oct Nov Dec mean sd min max
29 -28- Seagrass Year Jan Feb Mar Apr May June July Aug Sep Oct Nov Dec mean sd min max
30 -29- Aquarium Average Disolved Oxygen (mg/l) Dock Year Jan Feb Mar Apr May June July Aug Sep Oct Nov Dec mean sd min max Year Jan Feb Mar Apr May June July Aug Sep Oct Nov Dec mean sd min max
31 -30-
32 -31- Time Series
33 -32-
34 Percent Humidity (%) Temperature (C) Minute Average Air Temperature Time (hours) 15-Minute Average - Relative Humidity Time (hours) Rainfall (% of - total/15-min interval) Time (hours)
35 Wind Speed (km/h) 2 Solar Radiation (J/m /s) Minute Average Solar Radiation Time (hours) Minute Average Wind Speed Time (hours)
2016 Meteorological and Oceanographic Summary for the Bocas del Toro Research Station. Prepared by: Steven Paton
 0 2016 Meteorological and Oceanographic Summary for the Bocas del Toro Research Station Prepared by: Steven Paton 1 Introduction This is the forth of a series of yearly reports summarising the past year
2017 Meteorological and Oceanographic Summary for the Bocas del Toro Research Station. Prepared by: Steven Paton
 0 2017 Meteorological and Oceanographic Summary for the Bocas del Toro Research Station Prepared by: Steven Paton 1 Introduction This is the 5 th of a series of yearly reports summarising the past year
2017 Meteorological Summary for the Galeta Marine Island Laboratory. Prepared by: Steven Paton
 0 2017 Meteorological Summary for the Galeta Marine Island Laboratory Prepared by: Steven Paton 1 Introduction This is the 5 th in a series of yearly reports summarising the past year s Smithsonian Tropical
2016 Meteorological Summary for the Galeta Marine Island Laboratory. Prepared by: Steven Paton
 0 2016 Meteorological Summary for the Galeta Marine Island Laboratory Prepared by: Steven Paton 1 Introduction This is the fourth in a series of yearly reports summarising the past year s Smithsonian Tropical
2016 Meteorological and Hydrological Summary for Barro Colorado Island. Prepared by: Steven Paton
 0 2016 Meteorological and Hydrological Summary for Barro Colorado Island Prepared by: Steven Paton 1 Introduction This is the seventh of a series of yearly reports summarising the past year s Smithsonian
2017 Meteorological and Hydrological Summary for Barro Colorado Island. Prepared by: Steven Paton
 0 2017 Meteorological and Hydrological Summary for Barro Colorado Island Prepared by: Steven Paton 1 Introduction This is the seventh of a series of yearly reports summarising the past year s Smithsonian
Meteorology of Monteverde, Costa Rica 2005
 Meteorology of Monteverde, Costa Rica 2005 Technical Report submitted to the Monteverde Institute Andrew J. Guswa, Asst Professor, Picker Engineering Program Amy L. Rhodes, Asst Professor, Department of
COMPARISON OF FIXED & VARIABLE RATES (25 YEARS) CHARTERED BANK ADMINISTERED INTEREST RATES - PRIME BUSINESS*
 CHARTERED BANK ADMINISTERED INTEREST RATES - PRIME BUSINESS*") COMPARISON OF FIXED & VARIABLE RATES (25 YEARS) 2 Fixed Rates Variable Rates For Internal Use Only. FIXED RATES OF THE PAST 25 YEARS AVERAGE RESIDENTIAL MORTGAGE LENDING RATE - 5 YEAR* (Per cent) Year
COMPARISON OF FIXED & VARIABLE RATES (25 YEARS) 2 Fixed Rates Variable Rates For Internal Use Only. FIXED RATES OF THE PAST 25 YEARS AVERAGE RESIDENTIAL MORTGAGE LENDING RATE - 5 YEAR* (Per cent) Year
COMPARISON OF FIXED & VARIABLE RATES (25 YEARS) CHARTERED BANK ADMINISTERED INTEREST RATES - PRIME BUSINESS*
 CHARTERED BANK ADMINISTERED INTEREST RATES - PRIME BUSINESS*") COMPARISON OF FIXED & VARIABLE RATES (25 YEARS) 2 Fixed Rates Variable Rates FIXED RATES OF THE PAST 25 YEARS AVERAGE RESIDENTIAL MORTGAGE LENDING RATE - 5 YEAR* (Per cent) Year Jan Feb Mar Apr May Jun
COMPARISON OF FIXED & VARIABLE RATES (25 YEARS) 2 Fixed Rates Variable Rates FIXED RATES OF THE PAST 25 YEARS AVERAGE RESIDENTIAL MORTGAGE LENDING RATE - 5 YEAR* (Per cent) Year Jan Feb Mar Apr May Jun
Design Criteria Data
 OKLAHOMA CITY OK Latitude = 35.4 N WMO No. 72353 Longitude = 97.6 W Elevation = 133 feet Period of Record = 1973 to 1996 Average Pressure = 28.62 inches Hg Design Criteria Data Mean Coincident (Average)
Design Criteria Data
 MEDFORD/JACKSON CO. OR Latitude = 42.37 N WMO No. 72597 Longitude =122.8 W Elevation = 1329 feet Period of Record = 1973 to 1996 Average Pressure = 28.61 inches Hg Design Criteria Data Mean Coincident
Design Criteria Data
 DES MOINES IA Latitude = 41.53 N WMO No. 72546 Longitude = 93.65 W Elevation = 965 feet Period of Record = 1973 to 1996 Average Pressure = 28.96 inches Hg Design Criteria Data Mean Coincident (Average)
Commercial-in-Confidence Ashton Old Baths Financial Model - Detailed Cashflow
 Year 0 1 2 3 4 5 6 7 8 9 10 11 12 13 Oct-16 Nov-16 Dec-16 Jan-17 Feb-17 Mar-17 Apr-17 May-17 Jun-17 Jul-17 Aug-17 Sep-17 Oct-17 2,038 2,922 4,089 4,349 6,256 7,124 8,885 8,885 8,885 8,885 8,885 8,885 9,107
Design Criteria Data
 LAS VEGAS/MCCARRAN NV Latitude = 36.8 N WMO No. 72386 Longitude =115.1 W Elevation = 2179 feet Period of Record = 1973 to 1996 Average Pressure = 27.67 inches Hg Design Criteria Data Mean Coincident (Average)
Design Criteria Data
 PHOENIX/SKY HARBOR AZ Latitude = 33.43 N WMO No. 72278 Longitude =112. W Elevation = 116 feet Period of Record = 1973 to 1996 Average Pressure = 28.72 inches Hg Design Criteria Data Mean Coincident (Average)
Year to Date Summary. Average and Median Sale Prices
 A Publication of RMLS, The Source for Real Estate Statistics in Your Community Residential Review: Southwest Washington September 2018 Reporting Period September Residential Highlights Southwest Washington
Design Criteria Data
 PIERRE SD Latitude = 44.38 N WMO No. 726686 Longitude =1.2 W Elevation = 1742 feet Period of Record = 1973 to 1996 Average Pressure = 28.1 inches Hg Design Criteria Data Mean Coincident (Average) Values
Design Criteria Data
 RAPID CITY SD Latitude = 44.5 N WMO No. 72662 Longitude =3. W Elevation = 3169 feet Period of Record = 1973 to 1996 Average Pressure = 26.67 inches Hg Design Criteria Data Mean Coincident (Average) Values
LOCAL CLIMATOLOGICAL DATA
 ILLINOIS STATE WATER SURVEY DIVISION URBANA, ILLINOIS ISWS MP-21 Archive SWS0964 Illinois State Water Survey LOCAL CLIMATOLOGICAL DATA FDR HILLSBORO, IL. 1901-1962 LOCAL CLIMATOLOGICAL DATA 1901-1962 HILLSBORO
Total Production by Month (Acre Feet)
") Production by Month (acre-feet) 2008 2009 2010 2011 2012 2013 2014 2015 2016 January 25 339.10 228.90 249.50 297.99 243.06 327.14 247.66 212.37 February 234.00 218.80 212.10 241.52 245.82 279.08 234.16
Production by Month (acre-feet) 2008 2009 2010 2011 2012 2013 2014 2015 2016 January 25 339.10 228.90 249.50 297.99 243.06 327.14 247.66 212.37 February 234.00 218.80 212.10 241.52 245.82 279.08 234.16
2017 Adjusted Count Report February 12, 2018
 A statewide multi-use trail user study and volunteer data collection program 2017 Adjusted Count Report February 12, 2018 The following report includes the final adjusted infrared (IR) counter data at
Design Criteria Data
 BURLINGTON VT Latitude = 44.47 N WMO No. 72617 Longitude = 73.15 W Elevation = 341 feet Period of Record = 1973 to 1996 Average Pressure = 29.61 inches Hg Design Criteria Data Mean Coincident (Average)
Design Criteria Data
 HONOLULU/OAHU HI Latitude = 21.35 N WMO No. 91182 Longitude =157.9 W Elevation = 16 feet Period of Record = 1967 to 1996 Average Pressure = 29.96 inches Hg Design Criteria Data Mean Coincident (Average)
Design Criteria Data
 MACON/LEWIS WILSON GA Latitude = 32.7 N WMO No. 72217 Longitude = 83.65 W Elevation = 361 feet Period of Record = 1973 to 1996 Average Pressure = 29.66 inches Hg Design Criteria Data Mean Coincident (Average)
Design Criteria Data
 COLUMBIA SC Latitude = 33.95 N WMO No. 7231 Longitude = 81.12 W Elevation = 226 feet Period of Record = 1973 to 1996 Average Pressure = 29.8 inches Hg Design Criteria Data Mean Coincident (Average) Values
Design Criteria Data
 PHILADELPHIA PA Latitude = 39.88 N WMO No. 7248 Longitude = 75.25 W Elevation = 3 feet Period of Record = 1973 to 1996 Average Pressure = 29.98 inches Hg Design Criteria Data Mean Coincident (Average)
Design Criteria Data
 INDIANAPOLIS IN Latitude = 39.73 N WMO No. 72438 Longitude = 86.27 W Elevation = 87 feet Period of Record = 1973 to 1996 Average Pressure = 29.15 inches Hg Design Criteria Data Mean Coincident (Average)
Design Criteria Data
 ANCHORAGE AK Latitude = 61.17 N WMO No. 7273 Longitude =15. W Elevation = 131 feet Period of Record = 1973 to 1996 Average Pressure = 29.6 inches Hg Design Criteria Data Mean Coincident (Average) Values
Design Criteria Data
 DENVER/STAPLETON CO Latitude = 39.75 N WMO No. 72469 Longitude =14.8 W Elevation = 5332 feet Period of Record = 1973 to 1995 Average Pressure = 24.66 inches Hg Design Criteria Data Mean Coincident (Average)
Design Criteria Data
 JACKSONVILLE FL Latitude = 3.5 N WMO No. 7226 Longitude = 81.7 W Elevation = 3 feet Period of Record = 1973 to 1996 Average Pressure = 3.1 inches Hg Design Criteria Data Mean Coincident (Average) Values
Design Criteria Data
 SPOKANE WA Latitude = 47.63 N WMO No. 72785 Longitude =117.5 W Elevation = 2366 feet Period of Record = 1973 to 1996 Average Pressure = 27.5 inches Hg Design Criteria Data Mean Coincident (Average) Values
Design Criteria Data
 LOUISVILLE/STANDIFORD KY Latitude = 38.18 N WMO No. 72423 Longitude = 85.73 W Elevation = 489 feet Period of Record = 1973 to 1996 Average Pressure = 29.49 inches Hg Design Criteria Data Mean Coincident
Design Criteria Data
 DAYTON/JAMES M COX OH Latitude = 39.9 N WMO No. 72429 Longitude = 84.2 W Elevation = 14 feet Period of Record = 1973 to 1996 Average Pressure = 28.95 inches Hg Design Criteria Data Mean Coincident (Average)
Design Criteria Data
 SPRINGFLD MO Latitude = 37.23 N WMO No. 7244 Longitude = 93.38 W Elevation = 127 feet Period of Record = 1973 to 1996 Average Pressure = 28.66 inches Hg Design Criteria Data Mean Coincident (Average) Values
Design Criteria Data
 BIRMINGHAM AL Latitude = 33.57 N WMO No. 72228 Longitude = 86.75 W Elevation = 63 feet Period of Record = 1973 to 1996 Average Pressure = 29.36 inches Hg Design Criteria Data Mean Coincident (Average)
Local Climatological (Data Summary Molim, Illinois
 SWS Miscellaneous Publication 98-13 STATE OF ILLINOIS DEPARTMENT OF ENERGY AND NATURAL RESOURCES Local Climatological (Data Summary Molim, Illinois 1872-1992 by Audrey A. Bryan and Wayne Wendland Climatological
M onthly arket. Jan Table of Contents. Monthly Highlights
 Table of Contents Market Inventory...2 www.gaar.com Monthly Highlights January 2014 had a 12.29% increase in the number of homes sales when compared to same time last year. The average sale price of single-family
Thirty Years of Climatological Data: 1969 to 1998
 Thirty Years of Climatological Data: 1969 to 1998 NMSU's Agricultural Science Center at Farmington, New Mexico Agricultural Experiment Station Research Report 744 College of Agriculture and Home Economics
Design Criteria Data
 BOSTON/LOGAN MA Latitude = 42.37 N WMO No. 7259 Longitude = 71.3 W Elevation = 3 feet Period of Record = 1967 to 1996 Average Pressure = 29.95 inches Hg Design Criteria Data Mean Coincident (Average) Values
Design Criteria Data
 MINNEAPOLIS-ST PAUL MN Latitude = 44.88 N WMO No. 72658 Longitude = 93.22 W Elevation = 837 feet Period of Record = 1973 to 1996 Average Pressure = 29.7 inches Hg Design Criteria Data Mean Coincident (Average)
Design Criteria Data
 MIDLAND TX Latitude = 31.95 N WMO No. 72265 Longitude =2. W Elevation = 2861 feet Period of Record = 1973 to 1996 Average Pressure = 27.3 inches Hg Design Criteria Data Mean Coincident (Average) Values
Design Criteria Data
 NEW YORK/JOHN F KENNEDY NY Latitude = 4.65 N WMO No. 74486 Longitude = 73.78 W Elevation = 23 feet Period of Record = 1973 to 1996 Average Pressure = 29.98 inches Hg Design Criteria Data Mean Coincident
Design Criteria Data
 WASHINGTON/DULLES VA Latitude = 38.95 N WMO No. 7243 Longitude = 77.45 W Elevation = 322 feet Period of Record = 1973 to 1996 Average Pressure = 29.68 inches Hg Design Criteria Data Mean Coincident (Average)
Design Criteria Data
 LANDER/HUNT WY Latitude = 42.82 N WMO No. 72576 Longitude =18.7 W Elevation = 5558 feet Period of Record = 1973 to 1996 Average Pressure = 24.44 inches Hg Design Criteria Data Mean Coincident (Average)
Design Criteria Data
 ALBUQUERQUE NM Latitude = 35.5 N WMO No. 72365 Longitude =16.6 W Elevation = 5315 feet Period of Record = 1967 to 1996 Average Pressure = 24.72 inches Hg Design Criteria Data Mean Coincident (Average)
Design Criteria Data
 DULUTH MN Latitude = 46.83 N WMO No. 72745 Longitude = 92.18 W Elevation = 1417 feet Period of Record = 1973 to 1996 Average Pressure = 28.43 inches Hg Design Criteria Data Mean Coincident (Average) Values
Design Criteria Data
 MINOT AFB ND Latitude = 48.42 N WMO No. 727675 Longitude =11.3 W Elevation = 1667 feet Period of Record = 1967 to 1996 Average Pressure = 28.16 inches Hg Design Criteria Data Mean Coincident (Average)
CLIMATOLOGICAL SUMMARY
 DEPARTMENT OF REGISTRATION AND EDUCATION CTATP OF ILLINOIS ILLINOIS STATE WATER SURVEY DIVISION URBANA, ILLINOIS ISWS MP-19 Archive ISWS Illinois State Water Survey )CAL CLIMATOLOGICAL DATA MP-19 LOCAL
Design Criteria Data
 CHARLESTON/KANAWHA WV Latitude = 38.37 N WMO No. 72414 Longitude = 81.6 W Elevation = 981 feet Period of Record = 1973 to 1996 Average Pressure = 29. inches Hg Design Criteria Data Mean Coincident (Average)
Price Category Breakdown - February 2010
 SINGLE FAMILY RESIDENTIAL BREAKDOWN ruary 21 ruary Sales and Average Price Increase Annually TORONTO - Wednesday, March 3, 21 7.3 % 24.6 % 1.8 % 7.3%.2%.1 % Greater Toronto REALTORS reported 7,291 sales
Design Criteria Data
 CHICAGO/O HARE IL Latitude = 41.98 N WMO No. 7253 Longitude = 87.9 W Elevation = 673 feet Period of Record = 1967 to 1996 Average Pressure = 29.27 inches Hg Design Criteria Data Mean Coincident (Average)
Design Criteria Data
 MADISON/DANE CO. RGNL WI Latitude = 43.13 N WMO No. 72641 Longitude = 89.33 W Elevation = 866 feet Period of Record = 1973 to 1996 Average Pressure = 29.5 inches Hg Design Criteria Data Mean Coincident
Design Criteria Data
 RENO/CANNON INTL NV Latitude = 39.5 N WMO No. 72488 Longitude =119.7 W Elevation = 44 feet Period of Record = 1973 to 1996 Average Pressure = 25.57 inches Hg Design Criteria Data Mean Coincident (Average)
increase of over four per cent compared to the average of $409,058 reported in January 2010.
 SINGLE FAMILY RESIDENTIAL BREAKDOWN uary 211 26.8 % 1.7 % 7.%.4%.1 % Good Start to 211 TORONTO - February 4, 211 Greater Toronto REALTORS reported 4,337 transactions through the TorontoMLS system in uary
CCoWS. Central Coast Watershed Studies. Summary of Precipitation and Streamflow for Potrero and San Clemente Creeks in Water-Year 2008
 Central Coast Watershed Studies CCoWS Summary of Precipitation and Streamflow for Potrero and San Clemente Creeks in Water-Year 2008 Santa Lucia Preserve Monterey County, California Publication No. WI-2009-01
September 2016 Water Production & Consumption Data
 September 2016 Water Production & Consumption Data September 2016 monthly water production (288.48 AF) was lowest in at least 17 years. Monthly water production has increased slightly each month since
ENVIRONMENTAL & ENGINEERING SERVICES DEPARTMENT
 CITY OF LONDON ENVIRONMENTAL & ENGINEERING SERVICES DEPARTMENT WASTEWATER TREATMENT OPERATIONS VAUXHALL WASTEWATER TREATMENT PLANT 2013 ANNUAL REPORT FEBRUARY 2014 Vauxhall Wastewater Treatment Plant 2013
Local Climatological Data Summary Aurora, Illinois
 SWS Miscellaneous Publication 98-15 STATE OF ILLINOIS DEPARTMENT OF NATURAL RESOURCES Local Climatological Data Summary Aurora, Illinois 1901-1996 Herbert Hoffman 1, Audrey A. Bryan 2 and Wayne Wendland
August 2018 MLS Statistical Report
 January February March April May June July August Septem October Novem Decem August 218 MLS Statistical Report Total Sales Overall, sales are down 3%; however, total volume sold is up 7% and Median Sale
FOR IMMEDIATE RELEASE
 Article No. 5842 Available on www.roymorgan.com Roy Morgan Unemployment Profile Thursday, 2 October 2014 Unemployment climbs to 9.9% in September as full-time work lowest since October 2011; 2.2 million
GAZIFÈRE INC. Prime Rate Forecasting Process 2017 Rate Case
 Overview A consensus forecast is used to estimate the prime rate charged by commercial banks. As the prime rate is subject to competitive pressures faced by individual lenders and is set on an individual
Field Test Results of Green Roofs, Cool Roofs, and Conventional Roofs CNY Engineering Expo Oncenter, Syracuse, NY November 9, 2015
 Field Test Results of Green Roofs, Cool Roofs, and Conventional Roofs CNY Engineering Expo Oncenter, Syracuse, NY November 9, 2015 Hugh I. Henderson, Jr. P.E CDH Energy Corp. Cazenovia, NY Project Goals
Up and Down Months of the Stock Market
 Up and Down Months of the Stock Market 1926-2017 Positive years (66) in the stock market were not good all year long and losing years (24) were not losers throughout the year. Winning years produce losing
CCoWS. Central Coast Watershed Studies. Summary of Precipitation and Streamflow for Potrero and San Clemente Creeks in Water-Year 2007
 Central Coast Watershed Studies CCoWS Summary of Precipitation and Streamflow for Potrero and San Clemente Creeks in Water-Year 2007 Santa Lucia Preserve Monterey County, California Publication No. WI-2008-01
PyeongChang Weather Report. (April 2017) The PyeongChang Organizing Committee for the 2018 Olympic & Paralympic Winter Games
 The PyeongChang Organizing Committee for the 2018 Olympic & Paralympic Winter Games") PyeongChang 218 Weather Report (April 217) The PyeongChang Organizing Committee for the 218 Olympic & Paralympic Winter Games Sport Planning Department Meteorology & Climate Team Contents 1. Characteristics
PyeongChang 218 Weather Report (April 217) The PyeongChang Organizing Committee for the 218 Olympic & Paralympic Winter Games Sport Planning Department Meteorology & Climate Team Contents 1. Characteristics
Date Event or Holiday :Sun, 2:Mon North Orchard Delong Preschool North Orchard Delong Preschool
 2018 6 1 1:Sun, 2:Mon 2018-2019 Date Event or Holiday Aug 16 Board Meeting 6pm Aug 23 Open House June 2018 July 2018 August 2018 Sep 06 Board Meeting 6pm Su M Tu W Th F Sa Su M Tu W Th F Sa Su M Tu W Th
FOR IMMEDIATE RELEASE
 Article No. 7845 Available on www.roymorgan.com Roy Morgan Unemployment Profile Friday, 18 January 2019 Unemployment in December is 9.7% and under-employment is 8.8% FOR IMMEDIATE RELEASE Australian unemployment
2019 Western North Carolina Weather Calendar. Department of Atmospheric Sciences The University of North Carolina at Asheville
 209 Western North Carolina Weather Calendar Department of Atmospheric Sciences The University of North Carolina at Asheville www.atms.unca.edu 209 Western North Carolina Weather Calendar Climatological
Presented by Eric Englert Puget Sound Energy September 11, 2002
 Results from PSE s First Year of Time of Use Program Presented by Eric Englert Puget Sound Energy September 11, 2002 Puget Sound Energy Overview 973,489 Total Electric Customers 908,949 are AMR Capable
Inventory Levels - All Prices. Inventory Levels - By Price Range
 Inventory Levels - All Prices Idaho Falls Bonneville Total 7-Apr-17 154 111 265 6-Apr-18 113 91 204-23% Inventory Levels - By Price Range 7-Apr-17 6-Apr-18 0-100,000 36 10 100,001-125,000 13 9 125,001-150,000
Climatography of the United States No
 Climate Division: CA 5 NWS Call Sign: Month (1) Min (2) Month(1) Extremes Lowest (2) Temperature ( F) Lowest Month(1) Degree s (1) Base Temp 65 Heating Cooling 100 Number of s (3) Jan 45.9 26.0 36.0 67
Inventory Levels - All Prices. Inventory Levels - By Price Range
 Inventory Levels - All Prices Idaho Falls Bonneville Total 3-Mar-17 152 108 260 2-Mar-18 109 78 187-28% Inventory Levels - By Price Range 3-Mar-17 2-Mar-18 0-100,000 41 6 100,001-125,000 19 8 125,001-150,000
WIM #37 was operational for the entire month of September Volume was computed using all monthly data.
 SEPTEMBER 2016 WIM Site Location WIM #37 is located on I-94 near Otsego in Wright county. The WIM is located only on the westbound (WB) side of I-94, meaning that all data mentioned in this report pertains
Climatography of the United States No
 Climate Division: WY 9 NWS Call Sign: LND Temperature ( F) Month (1) Min (2) Month(1) Extremes Lowest (2) Lowest Month(1) Degree s (1) Base Temp 65 Heating Cooling 100 Number of s (3) Jan 31.9 8.7 20.3
The Peoples Gas Light and Coke Company
 History of Gas Charges Due to the Operation of Rider 2 (Cents per Therm) Factors for Transportation Customers (Riders FST, SST, P, CFY and AGG) Non- Total Standby Standby Aggregation Commodity Commodity
Meter Insights for Downtown Store
 Meter Insights for Downtown Store Commodity: Analysis Period: Prepared for: Report Date: Electricity 1 December 2013-31 December 2014 Arlington Mills 12 February 2015 Electricity use over the analysis
FOR IMMEDIATE RELEASE
 Article No. 7761 Available on www.roymorgan.com Roy Morgan Unemployment Profile Monday, 8 October 2018 Unemployment down to 9.4% in September off two-year high Australian employment has grown solidly over
Bulk Storage Containers
 UCSB AST SPCC SELF-INSPECTION CHECKLIST Year: Responsible Department: Tank Location: Tank ID: Bulk Storage Containers Total tank capacity: Petroleum type and amount: Secondary containment type: (diesel,
NJ Solar Market Update As of 6/30/15
 NJ Solar Market Update As of 6/30/ Prepared by Charlie Garrison July 17, 20 SOLAR INSTALLED CAPACITY DATA The preliminary installed solar capacity as of 6/30/ is approximately 1,500.7 MW. Approximately
Inventory Levels - All Prices. Inventory Levels - By Price Range
 Inventory Levels - All Prices Idaho Falls Bonneville Total 3-Nov-17 198 128 326 2-Nov-18 155 134 289-11% Inventory Levels - By Price Range 3-Nov-17 2-Nov-18 0-100,000 17 11 100,001-125,000 15 9 125,001-150,000
SASKATOON STATION
 SRC CLIMATE REFERENCE STATION DAILY DATA REPORT SASKATOON STATION 45718 Saskatchewan 52 9' N 6 36' W 497 m asl Estab. 1963 JULY Preliminary 16 Day Temperature Degree-days Precipitation Relative Humidity
D G A G R I D A S H B O A R D : A P P L E S
 75 79 60 56 49 74 65 59 54 42 76 63 58 53 78 55 42 43 79 44 81 63 47 83 64 59 53 48 Sources: Eurostat, MSs notifications, DG Agri, Comext, Comtrade, GTA, ITC, AMI, Expert groups, Freshfel, Wapa. 89 68
3. Atmospheric Supply of Nitrogen to the Baltic Sea in 2009
 3. Atmospheric Supply of Nitrogen to the Baltic Sea in 2009 Nitrogen emission data, as well as the model results presented here have been approved by the 35 th Session of the Steering Body of EMEP in Geneva
Climatography of the United States No
 Climate Division: MA 3 NWS Call Sign: BOS Month (1) Min (2) Month(1) Extremes Lowest (2) Temperature ( F) Lowest Month(1) Degree s (1) Base Temp 65 Heating Cooling 100 Number of s (3) 36.5 22.1 29.3 72
April 10, Dear Customer:
 Dear Customer: April 10, Attached is the monthly water supply outlook and projected operations for Yellowtail Dam and Powerplant. If you have any questions or concerns, please feel free to call me at 406-247-7334
Appendix E Water Supply Modeling
 Supply Modeling Modesto Irrigation District Treatment Plant Expansion Project Modeling I. Introduction The Modesto Irrigation District (MID) is situated adjacent to and north of the Tuolumne River. Over
FOR IMMEDIATE RELEASE
 Article No. 6928 Available on www.roymorgan.com Roy Morgan Unemployment Profile Wednesday, 17 August 2016 Australian real unemployment jumps to 10.5% (up 0.9%) in July during post-election uncertainty
City Of London Environmental & Engineering Services Department Wastewater Treatment Operations
 City Of London Environmental & Engineering Services Department Wastewater Treatment Operations Greenway Wastewater Treatment Centre 2016 Annual Report February 2017 Page 1 of 96 SUMMARY This annual report
FOR IMMEDIATE RELEASE
 Article No. 7353 Available on www.roymorgan.com Roy Morgan Unemployment Profile Wednesday, 11 October 2017 2.498 million Australians (18.9%) now unemployed or under-employed In September 1.202 million
Action Requested From AMWG
 Action Requested From AMWG NONE, These Two Presentations Are For Information Transfer Only The information is derived from a multi-year synthesis research effort related to existing data on flow, sediment-transport
VEHICLE / PEDESTRIAN COLLISIONS
 Info item No. 1 Crosswalk Safety Advisory Committee March 31, 2016 VEHICLE / PEDESTRIAN COLLISIONS HRM: January December 20 DISCLAIMER: All figures presented in this report reflect the information held
Appendix E Hydrology, Erosion and Sediment Transport Studies
 Appendix E Hydrology, Erosion and Sediment Transport Studies Hatch 2012/10 Appendix E1 EA Hydrology Memorandum February 2011 (Hatch. 2011a) Hatch 2012/10 Project Memo February 23, 2011 TO: Larry King FROM:
NJ Solar Market Update
 NJ Solar Market Update April 16, 20 Renewable Energy Committee Meeting Trenton, NJ Prepared by Charlie Garrison Solar Installed Capacity Data The preliminary installed solar capacity as of 3/31/ is approximately
TABLE C-43. Manufacturers' new and unfilled orders, {Amounts in millions of dollars] Nondurable. Capital goods. Total. goods.
![TABLE C-43. Manufacturers' new and unfilled orders, {Amounts in millions of dollars] Nondurable. Capital goods. Total. goods.](/thumbs/93/112603708.jpg "TABLE C-43. Manufacturers' new and unfilled orders, {Amounts in millions of dollars] Nondurable. Capital goods. Total. goods.") TABLE C-43. Manufacturers' new and unfilled orders, -74 {Amounts in millions of dollars] New orders t, I960. 27, 559 26, 903 30,672 30,115 31,086 33,005 35,322 37,952 41, 803 45, 944 46,763 50, 243 53,
TABLE C-43. Manufacturers' new and unfilled orders, -74 {Amounts in millions of dollars] New orders t, I960. 27, 559 26, 903 30,672 30,115 31,086 33,005 35,322 37,952 41, 803 45, 944 46,763 50, 243 53,
ANCR CRU Statistics February 2007 to December 2007
 ANCR CRU Statistics February 2007 to December 2007 o Jan/07 Feb/07* Mar/07 Apr/07 May/07 Jun/07 Jul/07 Aug/07 Sep/07 Oct/07 Nov/07 Dec/07 Total notes data from Perimeter phone system unavailable prior
M o n. a t i s t i c s. M o n t h l y NOVEMBER 2009
 M o n t h l y M o n t S h l t y a t i s t i c s NOVEMBER 29 For Immediate Release December 7, 29 CONTACT: Kimberly Clifton, President (52) 954-8 Wes Wiggins Vice President, MLS (52) 82-8792 Cheri Meadows
Revising the Historic Monthly Mean Niagara River Flow at Buffalo to Reflect Better Estimates of Maid-of-the-Mist Pool Outflows
 Revising the Historic Monthly Mean Niagara River Flow at Buffalo to Reflect Better Estimates of Maid-of-the-Mist Pool Outflows 1961-2007 Background The Niagara River flow at Buffalo is currently computed
2013 / 2014 Revenue Comparison: OCTOBER
 CAR RENTAL GROSS REVENUES 2013 / Revenue Comparison: OCTOBER COMPANY 2013 incr./decr. % change Advantage 1,049,117.25 1,679,547.68 630,430.43 60.1% Alamo/National 5,448,360.80 8,262,318.28 2,813,957.48
Determination of Monthly Means of Daily Solar Radiation and its Variability: A Summary (continued)
") Introduction Section 5.3 MONTHLY MEANS OF DAILY SOLAR RADIATION AND ITS VARIABILITY R.E. Schulze, M. Maharaj and R.D. Chapman The maps and statistics of solar radiation in this Section supersede the ones
Introduction Section 5.3 MONTHLY MEANS OF DAILY SOLAR RADIATION AND ITS VARIABILITY R.E. Schulze, M. Maharaj and R.D. Chapman The maps and statistics of solar radiation in this Section supersede the ones
IOWA MOLD TOOLING CO., INC. BOX 189, GARNER, IA TEL: IMT PART NUMBER
 CRANE LOG CALENDAR YEAR CRANE MODEL Daily Inspections Weekly Inspections Monthly Inspections Lubrication Record Maintenance Record Damage & Repair Record Modification Record Reference Specifications CRANE