WIM #37 was operational for the entire month of September Volume was computed using all monthly data.
|
|
|
- Meagan Blair
- 5 years ago
- Views:
Transcription

1 SEPTEMBER 2016
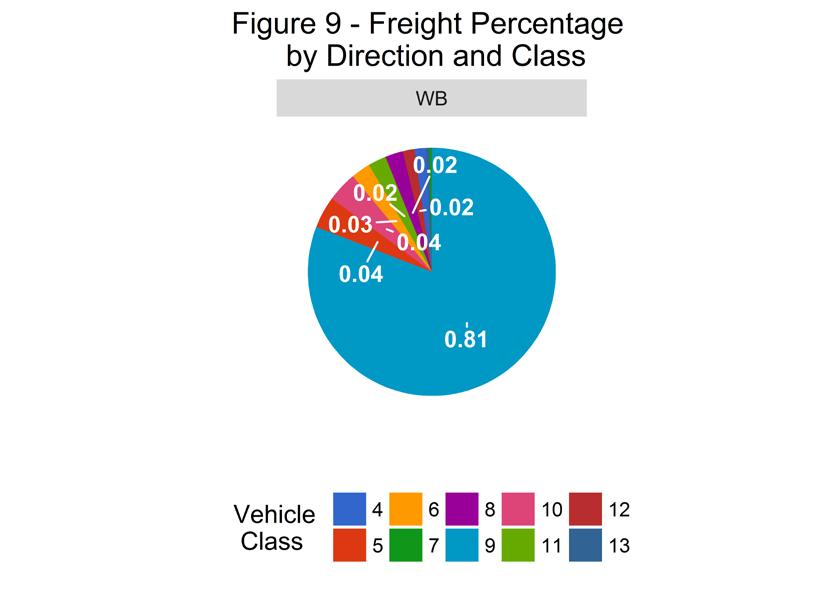
2 WIM Site Location WIM #37 is located on I-94 near Otsego in Wright county. The WIM is located only on the westbound (WB) side of I-94, meaning that all data mentioned in this report pertains to WB traffic only (Lanes 1 and 2). System Operation WIM #37 was operational for the entire month of September Volume was computed using all monthly data. System Calibration WIM #37 was most recently calibrated on Table 1 summarizes the front axle weights of class 9s by lane 1. Table 1 indicates that the class 9 front axle weights were all within ±9% of baseline calibration values for all lanes. Figure 1 shows the distribution of gross vehicle weights (GVW) in the Class 9s at this site for the last 12 months 2. Figure 2 depicts the average front axle weight as a percent difference from the first full month following calibration. Summary of Volume Statistics Total Monthly Volume: Passenger Vehicles: Heavy Commercial Vehicles: Monthly Average Daily Traffic (MADT): Monthly Heavy Commercial Average Daily Traffic (MHCADT): 3963 See Table 2 for vehicle class breakdown Passenger Vehicles (PVs) and Heavy Commercial Vehicles (HCVs) Volume trends. WB vehicles typically reached highest volume levels on Fridays, with lowest volumes reported on Tuesdays (see Figure 3 and 4). Passenger Vehicles (PVs) Volume trends. On an average 24-hour day (see Figure 5), WB PVs generally reached peak volume levels between 03 PM and 05 PM. Heavy Commercial Vehicles (HCVs) Volume trends. On an average 24-hour day, HCVs traveling WB typically reached peak volume levels between 03 PM and 05 PM. See Figure 6. Out of all HCVs, the two highest traffic volumes were generated by Class 9's and Class 5's. Overweight HCVs Volume trends. Of a total of HCVs, 2491 of them were overweight 3. These overweight HCVs contributed to 0.3% of total monthly volume, and 2.1% of total monthly
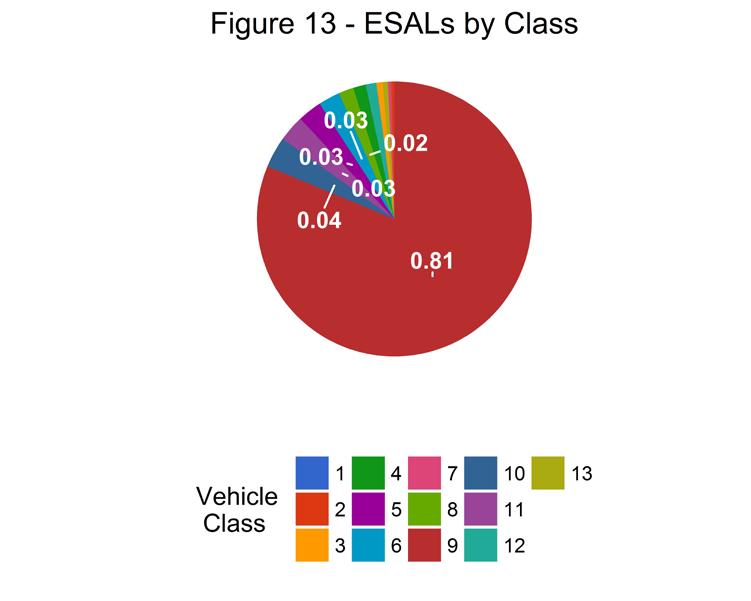
3 HCV volume. WB overweight vehicles typically reached highest numbers on Wednesdays, with lowest volumes reported on Sundays See Figure 3. The top two overweight violators by class were the class 9 and class 10 vehicles. Overall, overweight vehicles tended to reach peak volume concentrations during typical business hours (see Figure 7 & 8). Figure 9 shows the number of vehicles exceeding 88,000 pounds that crossed the WIM over the last 12 months. The highest number of 88,000+ vehicles within the last 12 months occurred in February. WIMs are currently used as a screening tool for weight enforcement, and it is estimated that the WIM scales can measure gross vehicle weights (GVW) within 90-95% of static weight scale measurements. Due to the possibility of measurement error, vehicles exceeding 10% of their legal weight limits (or 1.1 times their legal weight limits) are considered overweight in this report 4. Using normal load limits,160 WB vehicles exceeded 88,000 pounds (95 vehicles were Class 13's; 57 vehicles were Class 10's). Refer to Table 3 for the Top 10 highest recorded GVWs from Classes 9 and 10 from September Loaded vs. Unloaded HCVs. Figure 10 shows the GVW distributions of Class 9's and 10's in September Data suggests that there were greater numbers of empty Class 9's than fully_loaded Class 9's traveling WB Data also suggests that there were more NA Class 10's than NA traveling in the WB direction. Freight Totals. A total of tons of freight was recorded to have crossed the WIM. See Table 4 and Figure 11 for more freight information. Infrastructure Considerations Bridge. Bridge No is approximately 1.2 miles east of WIM #37 and Bridge No is approximately 4.7 miles west of WIM #37. WIM #37 recorded a total of vehicles with a combined GVW of kips (1 kip = 1,000 pounds = 0.5 tons) in September See Table 5 and Figures for GVW information by vehicle class and lane. Pavement Design. A total of equivalent single axle loads (ESALs) passed over the pavement at this site. In particular, 81% of all ESALs were generated by the Class 9's (Class 9's were also responsible for generating 47% of total GVW observed this month). See Table 6 and Figures for more information on ESALs (Table 6 also provides flexible ESAL factors for each vehicle class using a terminal serviceability of 2.5 and a structural number of 5). WIM monthly reports can be found at: MnDOT's vehicle classification scheme and vehicle class groupings for traffic forecasting can be found at:
4 To request this document in an alternative format, please call or , or your request to Please request at least one week in advance. 1 Front axle weights of Class 9s are monitored on a monthly basis to assure performance between calibrations. The current goal of the WIM scale calibration is to have each individual axle weight stay within a range of ±9% of baseline calibration values 2 Previous WIM research indicates that unloaded Class 9s typically weigh kips, while loaded Class 9s generally fall in the kip range. More recent data from several WIM sites suggests that the unloaded Class 9 range may have moved a little higher over time (due to increased presence of sleeper cabs, etc.), although these ranges are also thought to be site-specific. 3 An HCV is considered overweight during normal load limits in this report if they satisfy any of the following 1) exceed a gross vehicle weight (GVW) of 80,000 pounds, 2) exceed any of the legal weight maximums on any axle configurations (legal maximums are: single axle = 20,000 pounds; tandem axles spaced 8' or less = 34,000 pounds; tridem axles spaced 9' or less = 43,000 pounds; quad axles spaced 13' or less = 51,000 pounds). Monthly reports use this standard regardless of the time of year however, the Winter Load Increase (WLI) allows a 10% across the board increase in axle and gross vehicle weights without a permit on US, state routes, and county roads. An HCV is considered overweight during Winter Load Increase(WLI) if they satisfy any of the following 1) exceed a gross vehicle weight (GVW) of 88,000 pounds, 2) exceed any of the legal weight maximums on any axle configurations (legal maximums are: single axle = 22,000 pounds; tandem axles spaced 8' or less = 37,400 pounds; tridem axles spaced 9' or less = 47,300 pounds; quad axles spaced 13' or less = 56,100 pounds). An overweight HCV is only included once in the overweight volume calculations regardless of how many of the aforementioned conditions are violated. For information on MN weight limit dates and statutes: 4 For example, Class 9s and 10s can legally have gross vehicle weights up to 80,000 lbs (with the exception of permitted loads) during normal load limits. To account for measurement error on the WIM scales, those exceeding 10% of the legal GVW maximum (or 1.1 times the legal GVW) should be screened (e.g., 80,000 lbs + 8,000 lbs = 88,000 lbs). Similarly during WLI vehicles weighing 96,800 lbs should be screened.
5
6
7
8
9
10
11 Vehicle Weights (Kips) Oct 2015 Nov 2015 Dec 2015 Jan 2016 Feb 2016 Mar 2016 Apr 2016 May 2016 Jun 2016 Jul 2016 Aug > Total Sep 2016
12
13
14
15 Table 1 Class 9 Front Axle Weight by Lane Month Lane 1 (Kips) Front Axle +/- 9% Lane 2 (Kips) Front Axle +/- 9% October November December January February March April May June July August September
16 Table 2 Vehicle Classification Data Vehicle Class Monthly Average Daily Volume Monthly Total Volume Monthly Total Volume Percentage Monthly Total Overweight Vehicles TOTAL Monthly Total Overweight Percentage
17 Table 3 Top 10 Gross Vehicle Weight, Class 9 and 10 Date Day of Week Time Vehicle Class Direction Lane GVW (lbs) Tuesday 13:28:21 9 WB Tuesday 13:30:50 9 WB Monday 10:45:44 9 WB Tuesday 06:37:29 9 WB Tuesday 13:28:04 9 WB Thursday 09:02:40 9 WB Wednesday 13:48:41 9 WB Saturday 11:01:25 9 WB Friday 07:27:56 9 WB Thursday 11:55:08 9 WB
18 Table 4 Freight Summary Vehicle Class Direction Weight of Empty Vehicle (Kips) Total Number of Vehicles Number of Empty Vehicles Percentage of Empty Vehicles Total Weight of Vehicles with Freight (Kips) Total Weight of Empty Vehicles (Kips) Total Weight of Freight (Tons) 4 WB WB WB WB WB WB WB WB WB WB TOTAL **** **** **** ****
19 Table 5 Gross Vehicle Weight by Class and Lane Vehicle Class WB Driving Lane WB Passing Lane Total Percentage TOTAL GVW/LANE
20 Table 6 ESALs by Class and Lane and Flexible ESAL Factors Vehicle Class WB Driving Lane WB Passing Lane Total Percentage Flexible ESAL Factor e TOTAL ESALS/LANE
21 Table 7 Site Summary: Volume and Vehicle Class Month Total Volume Monthly ADT Monthly HCADT Passenger Vehicles Passenger Vehicles % Heavy Commercial Vehicles Oct Nov Dec Jan Feb Mar Apr May Jun Jul Aug Sep TOTAL AVERAGE Heavy Commercial Vehicles %
22 ESALs Month ESALS WB Driving Lane ESALS WB Passing Lane Total ESALS Oct Nov Dec Jan Feb Mar Apr May Jun Jul Aug Sep TOTAL AVERAGE Pavement Life Decrease Months
23 Gross Vehicle Weight Month GVW WB Driving Lane GVW WB Passing Lane Total GVW Kips Oct Nov Dec Jan Feb Mar Apr May Jun Jul Aug Sep TOTAL AVERAGE
24 Overweight Vehicles Month Total Number of Overweight Vehicles Overweight / Total Volume Overweight / Heavy Commercial Volume Number Over 88,000 lbs Oct Nov Dec Jan Feb Mar Apr May Jun Jul Aug Sep TOTAL AVERAGE Number Over 98,000 lbs
25 Freight Month WB Freight Tons Oct Nov Dec Jan Feb Mar Apr May Jun Jul Aug Sep TOTAL AVERAGE
WIM #29 was operational for the entire month of October Volume was computed using all monthly data.
 OCTOBER 2015 WIM Site Location WIM #29 is located on US 53 near Cotton in St Louis county. System Operation WIM #29 was operational for the entire month of October 2015. Volume was computed using all monthly
WIM #48 is located on CSAH 5 near Storden in Cottonwood county.
 WIM Site Location WIM #48 is located on CSAH 5 near Storden in Cottonwood county. System Operation WIM #48 was operational for the entire month of August 2017. Volume was computed using all monthly data.
WIM #40 is located on US 52 near South St. Paul in Dakota county.
 WIM Site Location WIM #40 is located on US 52 near South St. Paul in Dakota county. System Operation WIM #40 was operational for the entire month of November 2017. Volume was computed using all monthly
WIM #31 US 2, MP 8.0 EAST GRAND FORKS, MN JANUARY 2015 MONTHLY REPORT
 WIM #31 US 2, MP 8.0 EAST GRAND FORKS, MN JANUARY 2015 MONTHLY REPORT WIM #31 EAST GRAND FORKS MONTHLY REPORT - JANUARY 2015 WIM Site Location WIM #31 is located on US 2 at mile post 8.0, southeast of
WIM #41 CSAH 14, MP 14.9 CROOKSTON, MINNESOTA APRIL 2014 MONTHLY REPORT
 WIM #41 CSAH 14, MP 14.9 CROOKSTON, MINNESOTA APRIL 2014 MONTHLY REPORT In order to understand the vehicle classes and groupings, the MnDOT Vehicle Classification Scheme and the Vehicle Classification
WIM #41 CSAH 14, MP 14.9 CROOKSTON, MINNESOTA MAY 2013 MONTHLY REPORT
 WIM #41 CSAH 14, MP 14.9 CROOKSTON, MINNESOTA MAY 2013 MONTHLY REPORT In order to understand the vehicle classes and groupings the Mn/DOT Vehicle Classification Scheme and the Vehicle Classification Groupings
WIM #40 US 52, MP S. ST. PAUL, MN APRIL 2010 MONTHLY REPORT
 WIM #40 US 52, MP 126.8 S. ST. PAUL, MN APRIL 2010 MONTHLY REPORT In order to understand the vehicle classes and groupings the Mn/DOT Vehicle Classification Scheme and the Vehicle Class Groupings for Forecasting
WIM #39 MN 43, MP 45.2 WINONA, MN APRIL 2010 MONTHLY REPORT
 WIM #39 MN 43, MP 45.2 WINONA, MN APRIL 2010 MONTHLY REPORT In order to understand the vehicle classes and groupings the Mn/DOT Vehicle Classification Scheme and the Vehicle Class Groupings for Forecasting
September 2016 Water Production & Consumption Data
 September 2016 Water Production & Consumption Data September 2016 monthly water production (288.48 AF) was lowest in at least 17 years. Monthly water production has increased slightly each month since
Total Production by Month (Acre Feet)
") Production by Month (acre-feet) 2008 2009 2010 2011 2012 2013 2014 2015 2016 January 25 339.10 228.90 249.50 297.99 243.06 327.14 247.66 212.37 February 234.00 218.80 212.10 241.52 245.82 279.08 234.16
Production by Month (acre-feet) 2008 2009 2010 2011 2012 2013 2014 2015 2016 January 25 339.10 228.90 249.50 297.99 243.06 327.14 247.66 212.37 February 234.00 218.80 212.10 241.52 245.82 279.08 234.16
Commercial-in-Confidence Ashton Old Baths Financial Model - Detailed Cashflow
 Year 0 1 2 3 4 5 6 7 8 9 10 11 12 13 Oct-16 Nov-16 Dec-16 Jan-17 Feb-17 Mar-17 Apr-17 May-17 Jun-17 Jul-17 Aug-17 Sep-17 Oct-17 2,038 2,922 4,089 4,349 6,256 7,124 8,885 8,885 8,885 8,885 8,885 8,885 9,107
Meter Insights for Downtown Store
 Meter Insights for Downtown Store Commodity: Analysis Period: Prepared for: Report Date: Electricity 1 December 2013-31 December 2014 Arlington Mills 12 February 2015 Electricity use over the analysis
FOR IMMEDIATE RELEASE
 Article No. 7761 Available on www.roymorgan.com Roy Morgan Unemployment Profile Monday, 8 October 2018 Unemployment down to 9.4% in September off two-year high Australian employment has grown solidly over
US Rt. 12/20/45 at US Rt. 20 <Westbound and Southbound>
 US Rt. 12/20/45 at US Rt. 20 Village of Stone Park, Illinois R L R F o l l o w - U p E v a l u a t i o n R e p o r t Reference No: 016-43280 December 2010 Table of Contents
FOR IMMEDIATE RELEASE
 Article No. 7845 Available on www.roymorgan.com Roy Morgan Unemployment Profile Friday, 18 January 2019 Unemployment in December is 9.7% and under-employment is 8.8% FOR IMMEDIATE RELEASE Australian unemployment
ANCR CRU Statistics February 2007 to December 2007
 ANCR CRU Statistics February 2007 to December 2007 o Jan/07 Feb/07* Mar/07 Apr/07 May/07 Jun/07 Jul/07 Aug/07 Sep/07 Oct/07 Nov/07 Dec/07 Total notes data from Perimeter phone system unavailable prior
COMPARISON OF FIXED & VARIABLE RATES (25 YEARS) CHARTERED BANK ADMINISTERED INTEREST RATES - PRIME BUSINESS*
 CHARTERED BANK ADMINISTERED INTEREST RATES - PRIME BUSINESS*") COMPARISON OF FIXED & VARIABLE RATES (25 YEARS) 2 Fixed Rates Variable Rates For Internal Use Only. FIXED RATES OF THE PAST 25 YEARS AVERAGE RESIDENTIAL MORTGAGE LENDING RATE - 5 YEAR* (Per cent) Year
COMPARISON OF FIXED & VARIABLE RATES (25 YEARS) 2 Fixed Rates Variable Rates For Internal Use Only. FIXED RATES OF THE PAST 25 YEARS AVERAGE RESIDENTIAL MORTGAGE LENDING RATE - 5 YEAR* (Per cent) Year
COMPARISON OF FIXED & VARIABLE RATES (25 YEARS) CHARTERED BANK ADMINISTERED INTEREST RATES - PRIME BUSINESS*
 CHARTERED BANK ADMINISTERED INTEREST RATES - PRIME BUSINESS*") COMPARISON OF FIXED & VARIABLE RATES (25 YEARS) 2 Fixed Rates Variable Rates FIXED RATES OF THE PAST 25 YEARS AVERAGE RESIDENTIAL MORTGAGE LENDING RATE - 5 YEAR* (Per cent) Year Jan Feb Mar Apr May Jun
COMPARISON OF FIXED & VARIABLE RATES (25 YEARS) 2 Fixed Rates Variable Rates FIXED RATES OF THE PAST 25 YEARS AVERAGE RESIDENTIAL MORTGAGE LENDING RATE - 5 YEAR* (Per cent) Year Jan Feb Mar Apr May Jun
The Peoples Gas Light and Coke Company
 History of Gas Charges Due to the Operation of Rider 2 (Cents per Therm) Factors for Transportation Customers (Riders FST, SST, P, CFY and AGG) Non- Total Standby Standby Aggregation Commodity Commodity
Price Category Breakdown - February 2010
 SINGLE FAMILY RESIDENTIAL BREAKDOWN ruary 21 ruary Sales and Average Price Increase Annually TORONTO - Wednesday, March 3, 21 7.3 % 24.6 % 1.8 % 7.3%.2%.1 % Greater Toronto REALTORS reported 7,291 sales
FOR IMMEDIATE RELEASE
 Article No. 7353 Available on www.roymorgan.com Roy Morgan Unemployment Profile Wednesday, 11 October 2017 2.498 million Australians (18.9%) now unemployed or under-employed In September 1.202 million
Sound Transit Operations July 2016 Service Performance Report. Ridership
 Ridership Total Boardings by Mode Mode Jul-15 Jul-16 % YTD-15 YTD-16 % ST Express 1,618,779 1,545,852-4.5% 10,803,486 10,774,063-0.3% Sounder 333,000 323,233-2.9% 2,176,914 2,423,058 11.3% Tacoma Link
FOR IMMEDIATE RELEASE
 Article No. 5842 Available on www.roymorgan.com Roy Morgan Unemployment Profile Thursday, 2 October 2014 Unemployment climbs to 9.9% in September as full-time work lowest since October 2011; 2.2 million
GAZIFÈRE INC. Prime Rate Forecasting Process 2017 Rate Case
 Overview A consensus forecast is used to estimate the prime rate charged by commercial banks. As the prime rate is subject to competitive pressures faced by individual lenders and is set on an individual
2017 Adjusted Count Report February 12, 2018
 A statewide multi-use trail user study and volunteer data collection program 2017 Adjusted Count Report February 12, 2018 The following report includes the final adjusted infrared (IR) counter data at
VEHICLE / PEDESTRIAN COLLISIONS
 Info item No. 1 Crosswalk Safety Advisory Committee March 31, 2016 VEHICLE / PEDESTRIAN COLLISIONS HRM: January December 20 DISCLAIMER: All figures presented in this report reflect the information held
Design Criteria Data
 MEDFORD/JACKSON CO. OR Latitude = 42.37 N WMO No. 72597 Longitude =122.8 W Elevation = 1329 feet Period of Record = 1973 to 1996 Average Pressure = 28.61 inches Hg Design Criteria Data Mean Coincident
Traffic Reports User Documentation
 Traffic Reports User Documentation Date: 2 April 204 Version:. Prepared by Opus International Consultants ( Canada ) Limited of 42 Table of Contents Introduction... 3 2 Background... 3 3 Traffic Reports
Date Event or Holiday :Sun, 2:Mon North Orchard Delong Preschool North Orchard Delong Preschool
 2018 6 1 1:Sun, 2:Mon 2018-2019 Date Event or Holiday Aug 16 Board Meeting 6pm Aug 23 Open House June 2018 July 2018 August 2018 Sep 06 Board Meeting 6pm Su M Tu W Th F Sa Su M Tu W Th F Sa Su M Tu W Th
The impact of electric vehicle development on peak demand and the load curve under different scenarios of EV integration and recharging options
 The impact of electric vehicle development on peak demand and the load curve under different scenarios of EV integration and recharging options Electricity demand in France: a paradigm shift Electricity
FOR IMMEDIATE RELEASE
 Article No. 7433 Available on www.roymorgan.com Roy Morgan Unemployment Profile Friday, 12 January 2018 2.6m Australians unemployed or under-employed in December The latest data for the Roy Morgan employment
Year to Date Summary. Average and Median Sale Prices
 A Publication of RMLS, The Source for Real Estate Statistics in Your Community Residential Review: Southwest Washington September 2018 Reporting Period September Residential Highlights Southwest Washington
M onthly arket. Jan Table of Contents. Monthly Highlights
 Table of Contents Market Inventory...2 www.gaar.com Monthly Highlights January 2014 had a 12.29% increase in the number of homes sales when compared to same time last year. The average sale price of single-family
Design Criteria Data
 INDIANAPOLIS IN Latitude = 39.73 N WMO No. 72438 Longitude = 86.27 W Elevation = 87 feet Period of Record = 1973 to 1996 Average Pressure = 29.15 inches Hg Design Criteria Data Mean Coincident (Average)
Design Criteria Data
 DENVER/STAPLETON CO Latitude = 39.75 N WMO No. 72469 Longitude =14.8 W Elevation = 5332 feet Period of Record = 1973 to 1995 Average Pressure = 24.66 inches Hg Design Criteria Data Mean Coincident (Average)
May ATR Monthly Report
 May ATR Monthly Report Minnesota Department of Transportation Office of Transportation Data and Analysis May 2011 Introduction The purpose of this report is to examine monthly traffic trends on Minnesota
Design Criteria Data
 OKLAHOMA CITY OK Latitude = 35.4 N WMO No. 72353 Longitude = 97.6 W Elevation = 133 feet Period of Record = 1973 to 1996 Average Pressure = 28.62 inches Hg Design Criteria Data Mean Coincident (Average)
Design Criteria Data
 MINNEAPOLIS-ST PAUL MN Latitude = 44.88 N WMO No. 72658 Longitude = 93.22 W Elevation = 837 feet Period of Record = 1973 to 1996 Average Pressure = 29.7 inches Hg Design Criteria Data Mean Coincident (Average)
Design Criteria Data
 SPRINGFLD MO Latitude = 37.23 N WMO No. 7244 Longitude = 93.38 W Elevation = 127 feet Period of Record = 1973 to 1996 Average Pressure = 28.66 inches Hg Design Criteria Data Mean Coincident (Average) Values
Design Criteria Data
 DULUTH MN Latitude = 46.83 N WMO No. 72745 Longitude = 92.18 W Elevation = 1417 feet Period of Record = 1973 to 1996 Average Pressure = 28.43 inches Hg Design Criteria Data Mean Coincident (Average) Values
Design Criteria Data
 MIDLAND TX Latitude = 31.95 N WMO No. 72265 Longitude =2. W Elevation = 2861 feet Period of Record = 1973 to 1996 Average Pressure = 27.3 inches Hg Design Criteria Data Mean Coincident (Average) Values
LARGE TRUCK MONITORING PROGRAM
 LARGE TRUCK MONITORING PROGRAM WIM Station Annual Report for 2008 Prepared for: NEW JERSEY DEPARTMENT OF TRANSPORTATION Bureau of Freight Services Prepared by: LARGE TRUCK MONITORING PROGRAM WIM Station
Design Criteria Data
 WASHINGTON/DULLES VA Latitude = 38.95 N WMO No. 7243 Longitude = 77.45 W Elevation = 322 feet Period of Record = 1973 to 1996 Average Pressure = 29.68 inches Hg Design Criteria Data Mean Coincident (Average)
Design Criteria Data
 LANDER/HUNT WY Latitude = 42.82 N WMO No. 72576 Longitude =18.7 W Elevation = 5558 feet Period of Record = 1973 to 1996 Average Pressure = 24.44 inches Hg Design Criteria Data Mean Coincident (Average)
Design Criteria Data
 ALBUQUERQUE NM Latitude = 35.5 N WMO No. 72365 Longitude =16.6 W Elevation = 5315 feet Period of Record = 1967 to 1996 Average Pressure = 24.72 inches Hg Design Criteria Data Mean Coincident (Average)
Design Criteria Data
 DES MOINES IA Latitude = 41.53 N WMO No. 72546 Longitude = 93.65 W Elevation = 965 feet Period of Record = 1973 to 1996 Average Pressure = 28.96 inches Hg Design Criteria Data Mean Coincident (Average)
FOR IMMEDIATE RELEASE
 Article No. 6928 Available on www.roymorgan.com Roy Morgan Unemployment Profile Wednesday, 17 August 2016 Australian real unemployment jumps to 10.5% (up 0.9%) in July during post-election uncertainty
Inventory Levels - All Prices. Inventory Levels - By Price Range
 Inventory Levels - All Prices Idaho Falls Bonneville Total 7-Apr-17 154 111 265 6-Apr-18 113 91 204-23% Inventory Levels - By Price Range 7-Apr-17 6-Apr-18 0-100,000 36 10 100,001-125,000 13 9 125,001-150,000
Inventory Levels - All Prices. Inventory Levels - By Price Range
 Inventory Levels - All Prices Idaho Falls Bonneville Total 3-Mar-17 152 108 260 2-Mar-18 109 78 187-28% Inventory Levels - By Price Range 3-Mar-17 2-Mar-18 0-100,000 41 6 100,001-125,000 19 8 125,001-150,000
Expansion Projects Description
 Expansion Projects Description The Turnpike expansion program was authorized by the Florida Legislature in 1990 to meet the State s backlog of needed highway facilities. The Legislature set environmental
Design Criteria Data
 BURLINGTON VT Latitude = 44.47 N WMO No. 72617 Longitude = 73.15 W Elevation = 341 feet Period of Record = 1973 to 1996 Average Pressure = 29.61 inches Hg Design Criteria Data Mean Coincident (Average)
Design Criteria Data
 LAS VEGAS/MCCARRAN NV Latitude = 36.8 N WMO No. 72386 Longitude =115.1 W Elevation = 2179 feet Period of Record = 1973 to 1996 Average Pressure = 27.67 inches Hg Design Criteria Data Mean Coincident (Average)
August ATR Monthly Report
 August ATR Monthly Report Minnesota Department of Transportation Office of Transportation Data and Analysis August 2011 Introduction The purpose of this report is to examine monthly traffic trends on
Design Criteria Data
 PHOENIX/SKY HARBOR AZ Latitude = 33.43 N WMO No. 72278 Longitude =112. W Elevation = 116 feet Period of Record = 1973 to 1996 Average Pressure = 28.72 inches Hg Design Criteria Data Mean Coincident (Average)
Design Criteria Data
 RAPID CITY SD Latitude = 44.5 N WMO No. 72662 Longitude =3. W Elevation = 3169 feet Period of Record = 1973 to 1996 Average Pressure = 26.67 inches Hg Design Criteria Data Mean Coincident (Average) Values
Design Criteria Data
 COLUMBIA SC Latitude = 33.95 N WMO No. 7231 Longitude = 81.12 W Elevation = 226 feet Period of Record = 1973 to 1996 Average Pressure = 29.8 inches Hg Design Criteria Data Mean Coincident (Average) Values
Design Criteria Data
 PHILADELPHIA PA Latitude = 39.88 N WMO No. 7248 Longitude = 75.25 W Elevation = 3 feet Period of Record = 1973 to 1996 Average Pressure = 29.98 inches Hg Design Criteria Data Mean Coincident (Average)
Design Criteria Data
 HONOLULU/OAHU HI Latitude = 21.35 N WMO No. 91182 Longitude =157.9 W Elevation = 16 feet Period of Record = 1967 to 1996 Average Pressure = 29.96 inches Hg Design Criteria Data Mean Coincident (Average)
Design Criteria Data
 MACON/LEWIS WILSON GA Latitude = 32.7 N WMO No. 72217 Longitude = 83.65 W Elevation = 361 feet Period of Record = 1973 to 1996 Average Pressure = 29.66 inches Hg Design Criteria Data Mean Coincident (Average)
Design Criteria Data
 PIERRE SD Latitude = 44.38 N WMO No. 726686 Longitude =1.2 W Elevation = 1742 feet Period of Record = 1973 to 1996 Average Pressure = 28.1 inches Hg Design Criteria Data Mean Coincident (Average) Values
Design Criteria Data
 ANCHORAGE AK Latitude = 61.17 N WMO No. 7273 Longitude =15. W Elevation = 131 feet Period of Record = 1973 to 1996 Average Pressure = 29.6 inches Hg Design Criteria Data Mean Coincident (Average) Values
Design Criteria Data
 JACKSONVILLE FL Latitude = 3.5 N WMO No. 7226 Longitude = 81.7 W Elevation = 3 feet Period of Record = 1973 to 1996 Average Pressure = 3.1 inches Hg Design Criteria Data Mean Coincident (Average) Values
increase of over four per cent compared to the average of $409,058 reported in January 2010.
 SINGLE FAMILY RESIDENTIAL BREAKDOWN uary 211 26.8 % 1.7 % 7.%.4%.1 % Good Start to 211 TORONTO - February 4, 211 Greater Toronto REALTORS reported 4,337 transactions through the TorontoMLS system in uary
Design Criteria Data
 SPOKANE WA Latitude = 47.63 N WMO No. 72785 Longitude =117.5 W Elevation = 2366 feet Period of Record = 1973 to 1996 Average Pressure = 27.5 inches Hg Design Criteria Data Mean Coincident (Average) Values
Design Criteria Data
 LOUISVILLE/STANDIFORD KY Latitude = 38.18 N WMO No. 72423 Longitude = 85.73 W Elevation = 489 feet Period of Record = 1973 to 1996 Average Pressure = 29.49 inches Hg Design Criteria Data Mean Coincident
Design Criteria Data
 RENO/CANNON INTL NV Latitude = 39.5 N WMO No. 72488 Longitude =119.7 W Elevation = 44 feet Period of Record = 1973 to 1996 Average Pressure = 25.57 inches Hg Design Criteria Data Mean Coincident (Average)
Design Criteria Data
 DAYTON/JAMES M COX OH Latitude = 39.9 N WMO No. 72429 Longitude = 84.2 W Elevation = 14 feet Period of Record = 1973 to 1996 Average Pressure = 28.95 inches Hg Design Criteria Data Mean Coincident (Average)
Design Criteria Data
 BIRMINGHAM AL Latitude = 33.57 N WMO No. 72228 Longitude = 86.75 W Elevation = 63 feet Period of Record = 1973 to 1996 Average Pressure = 29.36 inches Hg Design Criteria Data Mean Coincident (Average)
City of Biddeford Solid Waste Management Commission January 10, :00 PM Public Works
 City of Biddeford Solid Waste Management Commission January 10, 2017 7:00 PM Public Works 1. Call to Order 2. Approval of Minutes - December 13, 3. Discussion / Approval 3.1. Food Waste curbside collection
Design Criteria Data
 BOSTON/LOGAN MA Latitude = 42.37 N WMO No. 7259 Longitude = 71.3 W Elevation = 3 feet Period of Record = 1967 to 1996 Average Pressure = 29.95 inches Hg Design Criteria Data Mean Coincident (Average) Values
Design Criteria Data
 NEW YORK/JOHN F KENNEDY NY Latitude = 4.65 N WMO No. 74486 Longitude = 73.78 W Elevation = 23 feet Period of Record = 1973 to 1996 Average Pressure = 29.98 inches Hg Design Criteria Data Mean Coincident
Alberta. Collision Facts. 330 people killed. 17,907 people injured. 140,705 collisions.
 Collision Facts 330 people killed 17,907 people injured 140,705 collisions May 2017 www.transportation.alberta.ca/statistics Collision Facts 330 people killed 17,907 people injured 140,705 collisions Monday
Design Criteria Data
 MINOT AFB ND Latitude = 48.42 N WMO No. 727675 Longitude =11.3 W Elevation = 1667 feet Period of Record = 1967 to 1996 Average Pressure = 28.16 inches Hg Design Criteria Data Mean Coincident (Average)
Design Criteria Data
 CHARLESTON/KANAWHA WV Latitude = 38.37 N WMO No. 72414 Longitude = 81.6 W Elevation = 981 feet Period of Record = 1973 to 1996 Average Pressure = 29. inches Hg Design Criteria Data Mean Coincident (Average)
Inventory Levels - All Prices. Inventory Levels - By Price Range
 Inventory Levels - All Prices Idaho Falls Bonneville Total 3-Nov-17 198 128 326 2-Nov-18 155 134 289-11% Inventory Levels - By Price Range 3-Nov-17 2-Nov-18 0-100,000 17 11 100,001-125,000 15 9 125,001-150,000
TECHNICAL SERVICE BULLETIN
 TECHNICAL SERVICE BULLETIN To: Minuteman Dealers and Customers From: Minuteman Technical Support Date: 1/12/2011 Subject: TSB for the KIT # K-FRSPEEDSWT. For the FR17115, FR17220, FR20115 and FR20220 models.
Design Criteria Data
 CHICAGO/O HARE IL Latitude = 41.98 N WMO No. 7253 Longitude = 87.9 W Elevation = 673 feet Period of Record = 1967 to 1996 Average Pressure = 29.27 inches Hg Design Criteria Data Mean Coincident (Average)
Design Criteria Data
 MADISON/DANE CO. RGNL WI Latitude = 43.13 N WMO No. 72641 Longitude = 89.33 W Elevation = 866 feet Period of Record = 1973 to 1996 Average Pressure = 29.5 inches Hg Design Criteria Data Mean Coincident
Wheat Marketing Situation
 Wheat Marketing Situation Prepared by: Darrell L. Hanavan Executive Director Colorado Wheat Administrative Committee If you would like to receive an email when this report is updated, email gmostek@coloradowheat.org
NJ Solar Market Update
 NJ Solar Market Update April 16, 20 Renewable Energy Committee Meeting Trenton, NJ Prepared by Charlie Garrison Solar Installed Capacity Data The preliminary installed solar capacity as of 3/31/ is approximately
August 2018 MLS Statistical Report
 January February March April May June July August Septem October Novem Decem August 218 MLS Statistical Report Total Sales Overall, sales are down 3%; however, total volume sold is up 7% and Median Sale
SPECIAL HAULING PERMITS
 ODOT PERMITS OMA, NOVEMBER 29, 2017 SPECIAL HAULING PERMITS Mike Moreland Supervisor of Permits, ODOT Special Hauling Permit Section (614) 351-5530 Mike.Moreland2@dot.ohio.gov 2 Ohio Manufacturers Association
up the formulas. You can copy/paste the formulas for the days within the same October 2017 Jan 1, 2 & 5 Student Christmas Break April 2018
 School Year Calendar Template 2013-2014 Vertex42 LLC INSTRUCTIONS Year: 2017 Beginning Month: 8 Start day: 1 1:Sunday, 2:Monday «Choose the year and beginning month Note: If you choose Monday as the start
Provisional Review of Fatal Collisions. January to December 31 st 2017
 Provisional Review of Fatal Collisions January to December 31 st 17 2 nd January 18 Review of 17 fatal collision statistics as of 31st December 17 Overview This report summarises the main trends in road
Automated Occupancy Detection October 2015 (Phase I) Demonstration Results Presented by Kathy McCune
 Demonstration Results Presented by Kathy McCune") Automated Occupancy Detection October 2015 (Phase I) Demonstration Results Presented by Kathy McCune 2016 TRB Managed Lanes Conference May 5th, Session 6 Presentation Background Outline Metro ExpressLanes
Automated Occupancy Detection October 2015 (Phase I) Demonstration Results Presented by Kathy McCune 2016 TRB Managed Lanes Conference May 5th, Session 6 Presentation Background Outline Metro ExpressLanes
Utah Fatal Crash Summary 2014
 Utah Fatal Crash Summary 1 State of Utah Department of Public Safety Highway Safety Office W Amelia Earhart Dr # Salt Lake City, UT 8116 81-366-6 www.highwaysafety.utah.gov Preliminary Totals as of 1/29/
Presented by Eric Englert Puget Sound Energy September 11, 2002
 Results from PSE s First Year of Time of Use Program Presented by Eric Englert Puget Sound Energy September 11, 2002 Puget Sound Energy Overview 973,489 Total Electric Customers 908,949 are AMR Capable
Energy Conservation Efforts
 Hennepin County Property Services Energy Conservation Efforts MEPC Presentation September 2010 HENNEPIN COUNTY PROPERTY SERVICES DEPARTMENT MONTHLY ENERGY COSTS $1,200,000 $1,000,000 Cold 2009 October
Michigan. Traffic. Profile
 June 2014 Revised 5/11/15 Michigan 2013 Traffic Crash Profile Reporting Criteria Please pay particular attention to the wording when interpreting the three levels of data gathered for this report. Crash
ANCR CRU Statistics Februa.. to December 2007
 ANCR CRU Statistics Februa.. to December 2007 Jan/07 Feb/07* Mar/07 Apr/07 May/07 Jun/07 Jul/07 Aug/07 Sep/07 Oct/07 Nov/07 Dec/07 Total notes Answered dato from Perimeter phone system unavailable prior
Bank of Japan. Research and Statistics Department FOR RELEASE 8:50 A.M. Thursday, October 25, All items
 Bank of Japan Research and Statistics Department FOR RELEASE 8:50 A.M. Thursday, October 25, 2018 Report on the Services Producer Price ( Preliminary Figures for September 2018 ) The Services Producer
STATISTICS BOTSWANA ELECTRICITY GENERATION & DISTRIBUTION 2016/2 STATS BRIEF, FIRST QUARTER Copyrights Statistics Botswana 2016
 2016/2 ELECTRICITY GENERATION & DISTRIBUTION STATS BRIEF, FIRST QUARTER 2016 Copyrights Statistics Botswana 2016 Statistics Botswana. Private Bag 0024 Botswana Tel: (267) 367 1300. Fax: (267) 395 2201.
Algebra II Pacing Guide
 Unit 13: Exploring a Business Venture (10 days) 8 May 13 - May 24 n/a MISD Pacing Guide Date Range Unit 01: Introduction to Functions in 15 Aug. 21 - Sept. 11 Sept. 12 Unit 02: Absolute Value Functions,,
Michigan. Traffic. Profile
 June 2014 Revised 5/11/15 Michigan 2013 Traffic Crash Profile Reporting Criteria Please pay particular attention to the wording when interpreting the three levels of data gathered for this report. Crash
FOR IMMEDIATE RELEASE
 Article No. 7137 Available on www.roymorgan.com Roy Morgan Unemployment Profile Wednesday, 8 February 2017 Over 12 million Australians have jobs for the first time including over 8 million full-time jobs,
Michigan State Police (MSP) Post 21 - Metro North
 Post 21 - Metro North") June 2018 Revised 8/3/2018 2017 Reporting Criteria Please pay particular attention to the wording when interpreting the three levels of data gathered for this report. Crash The Crash Level analyzes data
June 2018 Revised 8/3/2018 2017 Reporting Criteria Please pay particular attention to the wording when interpreting the three levels of data gathered for this report. Crash The Crash Level analyzes data
Bulk Storage Containers
 UCSB AST SPCC SELF-INSPECTION CHECKLIST Year: Responsible Department: Tank Location: Tank ID: Bulk Storage Containers Total tank capacity: Petroleum type and amount: Secondary containment type: (diesel,
LOCAL CLIMATOLOGICAL DATA
 ILLINOIS STATE WATER SURVEY DIVISION URBANA, ILLINOIS ISWS MP-21 Archive SWS0964 Illinois State Water Survey LOCAL CLIMATOLOGICAL DATA FDR HILLSBORO, IL. 1901-1962 LOCAL CLIMATOLOGICAL DATA 1901-1962 HILLSBORO
Michigan State Police (MSP) Post 21 - Metro North
 Post 21 - Metro North") October 2017 2016 Reporting Criteria Please pay particular attention to the wording when interpreting the three levels of data gathered for this report. Crash The Crash Level analyzes data related to crash
October 2017 2016 Reporting Criteria Please pay particular attention to the wording when interpreting the three levels of data gathered for this report. Crash The Crash Level analyzes data related to crash
NEU Electric and Natural Gas Price Update
 $ / MWH Jan-11 May-11 Sep-11 Sep-12 Jan-13 Electric: Short-Term Outlook The NYMEX Northern Illinois Hub 12-month forward price at the end of August 2016 for the September 2016 to August 2017 period was