Flexible Capacity Needs and Availability Assessment Hours Technical Study for 2020
|
|
|
- James Cooper
- 5 years ago
- Views:
Transcription
1 Flexible Capacity Needs and Availability Assessment Hours Technical Study for 2020 Clyde Loutan Principal, Renewable Energy Integration Hong Zhou Market Development Analyst, Lead Amber Motley Manager, Short Term Forecasting April 4 th, 2019
2 What s the purpose of this call? To discuss the assumptions, methodology, and draft results of the monthly flexible capacity requirement and Availability Assessment Hours Technical Study. Specifically Calculating requirements for all LRAs within the ISO footprint for RA compliance year 2020 and advisory flexible capacity requirements for compliance years 2021 and 2022 Page 2
3 Agenda / Overview Background Process review - Expected build out from all LSEs (CPUC jurisdictional and non-jurisdictional) - Load, wind and solar profiles - Calculate 3-hour net load upward ramps - Add contingency reserves - Calculate monthly Flexible Capacity requirement Overview of methodology used for system/local availability assessment hours 2020 availability assessment hours draft availability assessment hours Page 3
4 Each LSE Scheduling Coordinator shall make a year-ahead and month-ahead showing of flexible capacity for each month of the compliance year Resource Adequacy (RA) Ensure LSEs contract for adequate capacity to meet expected flexible needs Year ahead: LSEs need to secure a minimum of 90% of the next years monthly needs Month ahead: LSEs need to secure adequate net qualified capacity to serve their peak load including a planning reserve margin and flexible capacity to address largest 3-hour net load ramps plus contingency reserves All resources participating in the ISO markets under an RA contract will have an RA must-offer-obligation Required to submit economic bids into the ISO s real-time market consistent with the category of flexible capacity Page 4
5 The ISO used the following data to determine the flexible capacity CEC s 1-in-2 Mid-hourly demand forecast for 2020 through 2022 Behind-the-meter hourly solar PV production Hourly AAEE LSE SCs updated renewable build-out for 2018 through 2022 The data included: Installed capacity by technology and expected operating date (e.g. Solar thermal, solar PV tracking, solar PV non-tracking, estimate of behind-the-meter solar PV etc.) for all variable energy resources under contract Operational date or expected on-line date Location of CREZ latitude and longitude coordinates Resources located outside ISO s BAA indicated if the resources are firmed or non-firmed Page 5
6 MW CEC (mid baseline, mid AAEE) projected 1-in-2 CAISO coincident peak forecast 60,000 CEC's Monthly Peak Forecast Through 2022 vs Actuals 50,000 40,000 30,000 20,000 10,000 0 Jan Feb Mar Apr May Jun Jul Aug Sep Oct Nov Dec CAISO 2017 (Actual) 31,387 30,465 29,790 29,432 36,194 44,285 45,432 47,563 50,099 39,434 31,436 31,049 CAISO 2018 (Actual) 29,545 30,054 28,150 30,027 32,256 37,595 46,310 44,996 38,558 32,184 29,880 30,118 CEC ,597 30,746 29,855 32,233 36,171 41,185 44,890 45,142 45,406 36,778 31,561 32,542 CEC ,690 30,856 29,995 32,399 36,212 41,220 44,650 44,955 45,277 36,984 31,663 32,657 CEC ,856 31,010 30,163 32,618 36,439 41,003 44,264 44,537 44,984 37,200 31,807 32,835 CEC ,064 31,221 30,393 32,898 36,662 41,088 44,081 44,457 45,103 37,568 32,013 33,072 CAISO 2017 (Actual) CAISO 2018 (Actual) CEC 2019 CEC 2020 CEC 2021 CEC 2022 Page 6
7 MW Solar & wind build-out through December ,000 Expected CAISO's Wind & Solar Growth through ,000 16,000 14,000 12,000 10,000 8,000 6,000 4,000 2,000 0 Wind PV Fixed PV Tracking Solar Thermal PV Not yet decided Page 7
8 Firmed and non-firmed out of state contracted solar & wind through December ,800 Expected Wind & Solar Imports through ,400 2,000 1,600 1, Wind PV Tracking PV Fixed Page 8
9 Dynamic Imports (MW) Non-firmed out-of-state contracted renewables through December ,400 Expected Dynamic Imports through ,200 1, Wind PV Tracking PV Fixed Page 9
10 MW MW LSEs estimate of behind-the-meter solar PV capacity & CEC s estimated production through ,000 Expected BTM Cumulative Capacity Through ,000 Expected CEC Production Through ,000 12,000 10,000 10,000 8,000 8,000 6,000 6,000 4,000 4,000 2,000 2, BTM 7,452 8,714 10,045 11,327 12, BTM Prod Page 10
11 The ISO flexibility capacity assessment is based on current LSE s RPS build-out data Used the most current data available for renewable build-out submitted by all LSE SCs For new renewable installation scale 2018 actual production data based on installed monthly capacity in subsequent years Generated net load profiles for 2020 through 2022 using the simulated: Load profiles for 2020 through 2022 Solar profiles for 2020 through 2022 Wind profiles for 2020 through 2022 Page 11
12 The ISO will use the CEC s 1-in-2 IEPR forecast to develop the load forecast The ISO uses 1-in-2 IEPR forecast; the IEPR forecast has both an hourly view and a monthly view. The forecast is correlated such that the peak of the month can be seen in the hourly profile. CEC IEPR Load Forecast Title of File: Corrected CAISO Hourly Results CEDU The ISO will be using column AR (Managed Total Energy for Load) within the spreadsheet. Managed Total Energy for Load = + Baseline Consumption Load Committed PV Generation Additional achievable PV generation AAEE POU AAEE
13 Smoothing minute load profile Inputs Step 1: Subtract 2018 hr actuals from 2020 hr forecast to get hr diff Smooth hr diff to 1-min Step 2: Step 3: resolution (X) Estimate min by adding X to min actuals Page 13
14 Hourly load forecast to 1-minute load forecast Used 2018 actual 1-minute load data to build 1-minute load profiles for subsequent years Scaled the hourly CEC load forecast value of each hour into 1-minute forecast data using a smoothing equation looking at the differences between the forecasted year and the minute actuals Load 1-Minute Forecast 2020 L CECfcst_1-min = 2018 L Act_1-min + X Where X = Interpolated 1min profile from the difference (2020 L CECfcst_hourly L actual_hourly ) 2021 Load 1-Minute Forecast 2021 L CECfcst_1-min = 2018 L Act_1-min + X Where X = Interpolated 1min profile from the difference (2021 L CECfcst_hourly L actual_hourly )
15 Solar growth assumptions through 2022 Used the actual solar 1-minute solar production data for 2018 to develop the 1-minute solar profiles for 2019 through 2022 Scaled 1-minute solar data using the forecast monthly solar capacity for the new plants scheduled to be operational in 2019 Repeated the above steps for 2020, 2021 & S Mth_Sim_1-min = 2018S Act_1-min * 2019S Mth Capacity / 2018S Mth Capacity 2020 S Mth_Sim_1-min = 2018S Act_1-min * 2020S Mth Capacity / 2018S Mth Capacity 2021 S Mth_Sim_1-min = 2018S Act_1-min * 2021S Mth Capacity / 2018S Mth Capacity 2022 S Mth_Sim_1-min = 2018S Act_1-min * 2022S Mth Capacity / 2018S Mth Capacity Page 15
16 Net-load is a NERC accepted metric 1 for evaluating additional flexibility needs to accommodate VERs Net load is defined as load minus wind and solar power production Net load variability increases as more and more wind and solar resources are integrated into the system The monthly 3-hour flexible capacity need equates to the largest upward change in net load when looking across a rolling 3-hour evaluation window The ISO dispatches flexible resources (including renewable resources with energy bids) to meet net load 1 NERC Special Report Flexibility Report Requirements and metrics for Variable Generation: Implications for System Planning Studies, August Page 16
17 The monthly 3-hour upward ramping need is calculated using the largest ramp in each 180 minute period The maximum monthly 3-hour net load ramp within a 3-hour period is the highest MW value reached within any 3-hour moving window The maximum net load change in 3-hours can occur in less than 3 hours The maximum 3-hour upward ramp was calculated as: Net Load 181 min -Net Load 1, Net Load 182 min -Net Load 2,. Net Load n+180min -Net Load n
18 MW Maximum monthly 3-hour upward net load ramps for 2018 through ,000 Maximum Monthly 3-Hour Upward Ramps 20,000 16,000 12,000 8,000 4,000 0 Jan Feb Mar Apr May Jun Jul Aug Sep Oct Nov Dec 2018 (Actual) 13,326 14,440 14,777 12,553 11,571 11,057 8,679 10,805 10,866 13,082 13,087 14, (Actual) 15,639 14, Recom. 14,506 14,889 14,971 13,509 11,808 12,524 9,967 10,393 13,511 13,510 13,898 15, ,638 17,653 16,943 16,518 15,398 14,053 10,792 13,304 14,672 16,285 17,481 16, ,680 19,782 18,105 17,951 16,807 15,227 12,880 14,592 15,673 17,325 18,189 17, ,444 20,449 19,220 18,792 17,026 16,172 14,323 15,087 16,425 18,014 18,869 18, (Actual) 2019 (Actual) 2019 Recom *Please note Actuals in this graph may have solar/wind curtailments present Page 18
19 The flexible capacity methodology should provide the ISO with sufficient flexible capacity Methodology Flexible Req MTHy = Max[(3RR HRx ) MTHy ] + Max(MSSC, 3.5%*E(PL MTHy )) + ε Where: Max[(3RR HRx ) MTHy ] = Largest 3-hour contiguous ramp starting in hour x for month y E(PL) = Expected peak load MTH y = Month y MSSC = Most Severe Single Contingency ε = Annually adjustable error term to account for load forecast errors and variability. ε is currently set at zero For next year the ISO will work towards changing the Flex RA standard to be reflective of the current WECC/NERC reliability requirements.
20 MW Maximum monthly 3-hour upward flexible capacity needs for 2020 through 24,000 Flexible Capacity Monthly Requirement 20,000 16,000 12,000 8,000 4,000 0 Jan Feb Mar Apr May Jun Jul Aug Sep Oct Nov Dec 2018 (Actual) 14,476 15,590 15,927 13,703 12,721 12,373 10,300 12,380 12,216 14,298 14,237 15, (Recom.) 15,656 16,039 16,121 14,659 13,074 13,965 11,538 11,973 15,100 14,797 15,048 16, ,788 18,803 18,093 17,668 16,665 15,496 12,355 14,877 16,257 17,579 18,631 18, ,830 20,932 19,255 19,101 18,082 16,662 14,429 16,150 17,248 18,627 19,339 18, ,594 21,599 20,370 19,944 18,310 17,610 15,866 16,643 18,004 19,329 20,019 19, (Actual) 2019 (Recom.) *Please note Actuals in this graph may have solar/wind curtailments present Page 20
21 3-Hour Upward Ramps (MW) Example of the recommended monthly 2018 upward 3-hour ramps using 2016 actual 1-minute data 16, Forecast of Monthly 3-hour Upward Ramps for 2018 (Using 2016 actual 1-minute data) 14,000 12,000 10,000 8,000 6,000 4,000 2,000 0 Jan Feb Mar Apr May Jun Jul Aug Sep Oct Nov Dec 2017 (Actual) 12,378 12,659 12,733 10,939 10,591 11,774 8,403 8,706 12,108 11,949 12,591 12, Forecast for ,282 13,313 12,352 11,111 11,803 10,039 9,326 9,617 12,660 12,954 13,376 14, (Actual) 13,326 14,440 14,777 12,553 11,571 11,057 8,679 10,805 10,866 13,082 13,087 14, (Actual) 2017 Forecast for (Actual) *Please note Actuals in this graph may have solar/wind curtailments present Page 21

22 The actual net load and 3-hour ramps are about four years ahead of the ISO s original estimate primarily due to under forecasting rooftop solar PV installation Typical Spring Day Actual 3-hour ramp of 15,639 MW on 1/1/19 Net load of 6,844 MW on 3/23/19 Page 22
23 The 3-hour upward ramps are more than 50% of the daily peak demand, which indicates the need for faster ramping resources 30,000 Comparison of 3-Hour and 1-Hour upward Ramps 25,000 MW 20,000 15,000 53% of gross peak 56% of gross peak 48% of gross peak 10,000 5, /18/2018 3/4/2018 3/5/2018 Max 3-Hr UP Ramp 13,597 14,777 13,740 Max 1-Hr Up Ramp 7,101 7,545 7,537 Peak Demand 25,604 26,186 28,378 Max 3-Hr UP Ramp Max 1-Hr Up Ramp Peak Demand Page 23
24 Preliminary Results Hong Zhou. Market Development Analyst, Lead Amber Motley Manager, Short Term Forecasting
25 MW Forecasted monthly 2020 ISO system-wide flexible capacity needs* Forecasted monthly 2020 ISO system-wide flexible capacity needs* 20,000 18,000 16,000 14,000 12,000 10,000 8,000 6,000 4,000 2,000 0 Jan Feb Mar Apr May Jun Jul Aug Sep Oct Nov Dec flexneed 18,788 18,803 18,093 17,718 16,605 15,911 13,348 15,935 16,957 18,157 18,631 18,055 *Flexibility Requirement MTHy = Max[(3RR HRx ) MTHy ] + Max(MSSC, 3.5%*E(PL MTHy )) + ε Page 25
26 Components of the flexible capacity needs Month Average of Load contribution 2020 Average of Wind contribution 2020 Average of Solar contribution 2020 Total percent 2020 January 43.11% -1.61% % 100% February 39.86% 4.63% % 100% March 30.70% -4.79% % 100% April 32.26% -0.46% % 100% May 31.36% -2.56% % 100% June 26.46% -4.83% % 100% July 15.30% 2.43% % 100% August 24.06% -1.89% % 100% September 27.26% -1.36% % 100% October 34.39% -1.57% % 100% November 38.87% -5.43% % 100% December 44.27% -0.94% % 100% Δ Load Δ Wind Δ Solar = 100 Page 26
27 Flexible capacity categories allow a wide variety of resources to provide flexible capacity Category 1 (Base Flexibility): Operational needs determined by the magnitude of the largest 3-hour secondary net load ramp Category 2 (Peak Flexibility): Operational need determined by the difference between 95 percent of the maximum 3-hour net load ramp and the largest 3-hour secondary net load ramp Category 3 (Super-Peak Flexibility): Operational need determined by five percent of the maximum 3-hour net load ramp of the month Page 27
28 MW MW The 2020 forecasted distribution range of daily maximum and secondary 3-hour net load ramps Distribution of daily second 3-hour net load ramps Distribution of daily max 3-hour net load ramps 0 Jan Feb Mar Apr May Jun Jul Aug Sep Oct Nov Dec 0 Jan Feb Mar Apr May Jun Jul Aug Sep Oct Nov Dec max max
29 Seasonal breakout of flexible capacity needs Unadjusted Adjusted Month January February March April May June July August September October November December Super-Peak Base Flexibility Peak Flexibility Flexibility Super-Peak Base Flexibility Peak Flexibility Flexibility 37% 58% 5% 35% 60% 5% 38% 57% 5% 35% 60% 5% 34% 61% 5% 35% 60% 5% 34% 61% 5% 35% 60% 5% 44% 51% 5% 52% 43% 5% 43% 52% 5% 52% 43% 5% 63% 32% 5% 52% 43% 5% 57% 38% 5% 52% 43% 5% 51% 44% 5% 52% 43% 5% 37% 58% 5% 35% 60% 5% 31% 64% 5% 35% 60% 5% 34% 61% 5% 35% 60% 5% Page 29
30 MW Total flexible capacity needed in each category seasonally adjusted 20,000 18,000 16,000 14,000 12,000 10,000 8,000 6,000 4,000 2,000 0 Jan Feb Mar Apr May Jun Jul Aug Sep Oct Nov Dec Super-Peak Flexibility Peak Flexibility 11,303 11,312 10,885 10,659 7,190 6,890 5,780 6,900 7,342 10,924 11,209 10,862 Base Flexibility 6,545 6,551 6,303 6,173 8,584 8,226 6,901 8,238 8,766 6,326 6,491 6,290 Page 30
31 MW CPUC jurisdictional flexible capacity allocation - by flexible capacity category 20,000 18,000 16,000 14,000 12,000 10,000 8,000 6,000 4,000 2,000 0 Jan Feb Mar Apr May Jun Jul Aug Sep Oct Nov Dec Super-Peak Flexibility Peak Flexibility 10,790 10,946 10,461 10,245 6,902 6,591 5,542 6,609 7,056 10,522 10,869 10,481 Base Flexiblity 6,248 6,339 6,058 5,933 8,240 7,869 6,617 7,890 8,424 6,093 6,294 6,069
32 Start time of 3-Hour net load ramp to evaluate seasonal must offer obligations 3-Hour Net Load Ramp Start Hour (Hour Ending) Month 15:00 16:00 17:00 18:00 January 31 February March April May June 27 3 July August September 2 28 October 3 28 November 30 December 31
33 Seasonal must offer obligations for peak and super-peak flexible capacity Recommended Must-offer obligation hours in Hour Ending. HE 16- HE 20 (3:00 PM to 8:00 PM) January through April and October through December HE 16 HE 20 (3:00 PM to 8:00 PM) May through September Page 33
34 Review of preliminary assessment results Flexible Capacity need is largest in the off-peak months Flexible capacity makes up a greater percentage of resource adequacy needs during the off-peak months Increase almost exclusively caused by 3-hour ramp, not increase in peak load Growth of behind-the-meter solar PV and utility scale PV contributes to the larger flexible capacity requirements Using the ISO flexible capacity contribution calculation majority of 3-hour net load ramps are attributable to CPUC jurisdictional LSEs The Peak and Super-Peak MOO hours have not changed from the 2019 study (information below is in Hour Ending) January through April and October through December: HE 16- HE 20 (3:00 p.m. to 8:00 p.m.) May through September: HE 16 HE 20 (3:00 p.m. to 8:00 p.m.) Page 34
35 Allocation to SC Hong Zhou. Market Development Analyst, Lead Amber Motley Manager, Short Term Forecasting
36 Notation Notation : L (load), W (wind), S (solar), and NL(net load) R (reserve) = max(mscc, 3.5*peak_load) NL = L W S Δ Ramp, Δ NL = Δ L ΔW ΔS ΔNL 2020 Net Load Ramp Req in 2020 ΔNL sc,2020 Net Load Ramp Req SC Allocation in 2020 Σ summation of all SC 2020 forecast (L) and survey results (W and S); 2018 Load observed pl_r sc CEC peak load ratio The history of load allocation formula evolution is detailed in the draft paper <Add security classification here> Page 36
37 Allocation Formula Flax Requirement = ΔNL R 2020 = ΔNL Σpl_r sc R 2020 ΔNL 2020 = ΔL 2020 ΔW 2020 ΔS 2020 = ΔL 2020 ΣW sc,2020 W 2020 ΔW 2020 ΣS sc,2020 S 2020 ΔS 2020 Now, Focusing on allocating ΔL 2020 <Add security classification here> Page 37
38 Allocation load proportion to SC ΔL 2020 = ΔL ΔL 2020 ΔL 2018 = ΣΔL sc, ΣL M sc,2018 LM ΔL 2020 ΔL ΔL 2018 is the average load portion of top 5 maximum h ramps while matching 2020 maximum 3h ramp on month and M time, and L 2018 is the average load at beginning and the end of points during those top 5 ramps. The subscript SC is for LSC, Δ and Σ is the mathematic notation for difference and summation, Δ is denoted for the ramp here. Therefore, each SC will receive: ΔL sc, L M sc,2018 LM ΔL 2020 ΔL <Add security classification here> Page 38
39 AVAILABILITY ASSESSMENT HOURS
40 Availability assessment hours: Background and purpose Concept originally developed as part of the ISO standard capacity product (SCP) Maintained as part of Reliability Service Initiative Phase 1 (i.e. RA Availability Incentive Mechanism, or RAAIM) Determine the hours of greatest need to maximize the effectiveness of the availability incentive structure Resources are rewarded for availability during hours of greatest need Hours determined annually by ISO and published in the BPM See section 40.9 of the ISO tariff Page 40
41 Methodology overview of system/local availability assessment hours Used data described in previous slides to obtain: Hourly Average Load By Hour By Month Years Calculated: Top 5% of Load Hours within each month using an hourly load distribution Years 2020 through 2022 Page 41


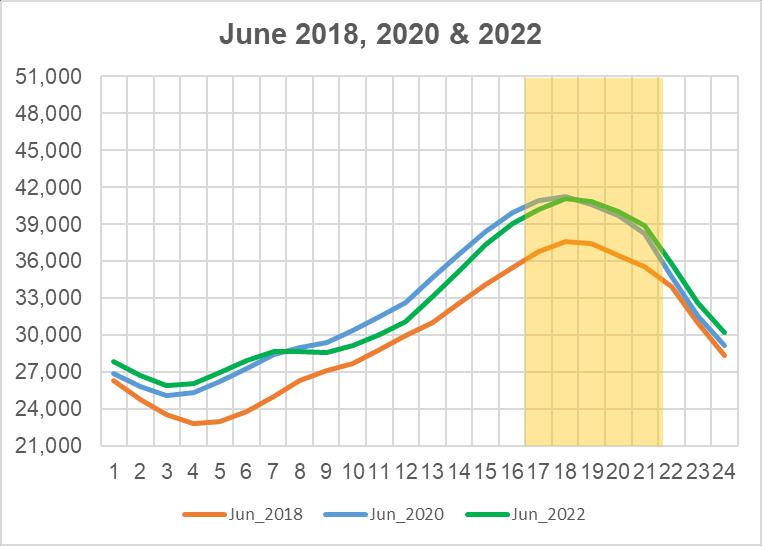

42 Expected load shape evolution: Summer season Page 42


43 Expected load shape evolution: Summer season Page 43
44 Summer Season 2020 top 5% of load hours (in HE) 20 Summer Season: Top 5% Hour Ending Apr May Jun Jul Aug Sep Oct Page 44

45 Expected load shape evolution: Winter season Page 45


46 Expected load shape evolution: Winter season Page 46
47 Winter Season 2020 top 5% of load hours (HE) 20 Winter Season: Top 5% Hour Ending Jan Feb Mar Nov Dec Page 47
48 Availability assessment hours draft recommendation Winter Season Draft Recommendation Summer Season Draft Recommendation Year Start End 2019 (Final) HE 17 HE (Draft) HE 17 HE (Estimate) HE 17 HE (Estimate) HE 17 HE 21 Year Start End 2019 (Final) HE 17 HE (Draft) HE 17 HE (Estimate) HE 17 HE (Estimate) HE 17 HE 21
49 Reliability Requirements; Section 7 No BPM Updates Needed 2019 System and Local Resource Adequacy Availability Assessment Hours Analysis employed: Top 5% of load hours using average hourly load Summer April 1 through October 31 Availability Assessment Hours: 4pm 9pm (HE17 HE21) Winter November 1 through March 31 Availability Assessment Hours: 4pm 9pm (HE17 HE21) 2019 Flexible Resource Adequacy Availability Assessment Hours and must offer obligation hours Flexible RA Capacity Type January April Category Designation Required Bidding Hours (All Hour Ending Times) October December Base Ramping Category 1 05:00am to 10:00pm (HE6-HE22) Peak Ramping Category 2 3:00pm to 8:00pm (HE16-HE20) Super-Peak Ramping Category 3 3:00pm to 8:00pm (HE16-HE20) Required Bidding Days All days All days Non-Holiday Weekdays* May September Base Ramping Category 1 05:00am to 10:00pm (HE6-HE22) Peak Ramping Category 2 3:00pm to 8:00pm (HE16-HE20) Super-Peak Ramping Category 3 3:00pm to 8:00pm (HE16-HE20) All days All days Non-Holiday Weekdays* Page 49
50 Next steps Published Draft Flexible Capacity Needs Assessment for 2019 April 4, 2019 Stakeholder call April 4, 2019 Comments due April 19, 2019 Please submit comments on the assumptions to Publish Final Flexible Capacity Needs Assessment for 2019 May 15th, 2019 Page 50


51 Questions Stay Download ISO Today mobile app Sign up for the Daily Briefing at Page 51
Operational Opportunities to Minimize Renewables Curtailments
 Operational Opportunities to Minimize Renewables Curtailments Clyde Loutan Principal, Renewable Energy Integration July 24, 2017 2017 CAISO - Public Page 1 Agenda Background Real-time control performance
Energy Storage and Distributed Energy Resources Phase 3 (ESDER 3)
") Energy Storage and Distributed Energy Resources Phase 3 (ESDER 3) Straw Proposal Technical Working Group March 9, 018 10 a.m. 4 p.m. (Pacific Standard Time) Agenda Time Item Speaker 10:00-10:10 Stakeholder
Energy Storage and Distributed Energy Resources Phase 3 (ESDER 3) Straw Proposal Technical Working Group March 9, 018 10 a.m. 4 p.m. (Pacific Standard Time) Agenda Time Item Speaker 10:00-10:10 Stakeholder
Total Production by Month (Acre Feet)
") Production by Month (acre-feet) 2008 2009 2010 2011 2012 2013 2014 2015 2016 January 25 339.10 228.90 249.50 297.99 243.06 327.14 247.66 212.37 February 234.00 218.80 212.10 241.52 245.82 279.08 234.16
Production by Month (acre-feet) 2008 2009 2010 2011 2012 2013 2014 2015 2016 January 25 339.10 228.90 249.50 297.99 243.06 327.14 247.66 212.37 February 234.00 218.80 212.10 241.52 245.82 279.08 234.16
Review of Reliability Must-Run and Capacity Procurement Mechanism BBB Issue Paper and Straw Proposal for Phase 1 Items
 Review of Reliability Must-Run and Capacity Procurement Mechanism BBB Issue Paper and Straw Proposal for Phase 1 Items Stakeholder Meeting January 30, 2018 Keith Johnson Infrastructure and Regulatory Policy
Economics of Integrating Renewables DAN HARMS MANAGER OF RATE, TECHNOLOGY & ENERGY POLICY SEPTEMBER 2017
 Economics of Integrating Renewables DAN HARMS MANAGER OF RATE, TECHNOLOGY & ENERGY POLICY SEPTEMBER 2017 Presentation Outline Understanding LPEA s expenses and what drives them Economics of net metering
September 2016 Water Production & Consumption Data
 September 2016 Water Production & Consumption Data September 2016 monthly water production (288.48 AF) was lowest in at least 17 years. Monthly water production has increased slightly each month since
NJ Solar Market Update As of 10/31/15
 NJ Solar Market Update As of 10/31/15 Prepared by Charlie Garrison Renewable Energy Committee Meeting November 10, 2015 SOLAR INSTALLED CAPACITY DATA The preliminary installed solar capacity as of 10/31/15
Flexible Ramping Product Technical Workshop
 Flexible Ramping Product Technical Workshop September 18, 2012 Lin Xu, Ph.D. Senior Market Development Engineer Don Tretheway Senior Market Design and Policy Specialist Agenda Time Topic Presenter 10:00
WESTERN EIM BENEFITS REPORT Second Quarter 2018
 WESTERN EIM BENEFITS REPORT Second Quarter 2018 July 31, 2018 www.westerneim.com CONTENTS EXECUTIVE SUMMARY... 3 BACKGROUND... 4 EIM BENEFITS IN Q2 2018... 4 INTER-REGIONAL TRANSFERS... 5 WHEEL THROUGH
PDR Energy Baseline Alternative. Proposal for Discussion October 27, 2015
 PDR Energy Baseline Alternative Proposal for Discussion October 27, 2015 Update Since Last Meeting Since the October 12 th Working Group Meeting Stem, Solar City, AMS and CESA have had over a half-dozen
The impact of electric vehicle development on peak demand and the load curve under different scenarios of EV integration and recharging options
 The impact of electric vehicle development on peak demand and the load curve under different scenarios of EV integration and recharging options Electricity demand in France: a paradigm shift Electricity
Presented by Eric Englert Puget Sound Energy September 11, 2002
 Results from PSE s First Year of Time of Use Program Presented by Eric Englert Puget Sound Energy September 11, 2002 Puget Sound Energy Overview 973,489 Total Electric Customers 908,949 are AMR Capable
WIM #37 was operational for the entire month of September Volume was computed using all monthly data.
 SEPTEMBER 2016 WIM Site Location WIM #37 is located on I-94 near Otsego in Wright county. The WIM is located only on the westbound (WB) side of I-94, meaning that all data mentioned in this report pertains
Regulation Update. Operating Committee September 12, PJM 2017
 Regulation Update Operating Committee September 12, 2017 Regulation Market Clearing Price *Data up to Aug 22 2 Mileage Ratio Mileage Ratio has increased since the new signal implementation Larger Utilization
Residential Load Profiles
 Residential Load Profiles TABLE OF CONTENTS PAGE 1 BACKGROUND... 1 2 DATA COLLECTION AND ASSUMPTIONS... 1 3 ANALYSIS AND RESULTS... 2 3.1 Load Profiles... 2 3.2 Calculation of Monthly Electricity Bills...
FOR IMMEDIATE RELEASE
 Article No. 7761 Available on www.roymorgan.com Roy Morgan Unemployment Profile Monday, 8 October 2018 Unemployment down to 9.4% in September off two-year high Australian employment has grown solidly over
THE TRES AMIGAS PROJECT
 UNITING THE NATION S ELECTRIC POWER GRID THE TRES AMIGAS PROJECT Project Development, Business Case, and Benefits -ERCOT Presentation Jan 22, 2010 Agenda Project Overview Project Objective Project Description,
Department of Market Quality and Renewable Integration November 2016
 Energy Imbalance Market March 23 June 3, 216 Available Balancing Capacity Report November 1, 216 California ISO Department of Market Quality and Renewable Integration California ISO i TABLE OF CONTENTS
NJ Solar Market Update As of 2/29/16
 NJ Solar Market Update As of 2/29/16 Prepared by Charlie Garrison March 24, 2016 SOLAR INSTALLED CAPACITY DATA The installed solar capacity as of 2/29/16 is approximately 1,644.3 MW. Approximately 20.3
Design Criteria Data
 OKLAHOMA CITY OK Latitude = 35.4 N WMO No. 72353 Longitude = 97.6 W Elevation = 133 feet Period of Record = 1973 to 1996 Average Pressure = 28.62 inches Hg Design Criteria Data Mean Coincident (Average)
Design Criteria Data
 MEDFORD/JACKSON CO. OR Latitude = 42.37 N WMO No. 72597 Longitude =122.8 W Elevation = 1329 feet Period of Record = 1973 to 1996 Average Pressure = 28.61 inches Hg Design Criteria Data Mean Coincident
NJ Solar Market Update As of 6/30/15
 NJ Solar Market Update As of 6/30/ Prepared by Charlie Garrison July 17, 20 SOLAR INSTALLED CAPACITY DATA The preliminary installed solar capacity as of 6/30/ is approximately 1,500.7 MW. Approximately
Appendix E Water Supply Modeling
 Supply Modeling Modesto Irrigation District Treatment Plant Expansion Project Modeling I. Introduction The Modesto Irrigation District (MID) is situated adjacent to and north of the Tuolumne River. Over
Design Criteria Data
 DES MOINES IA Latitude = 41.53 N WMO No. 72546 Longitude = 93.65 W Elevation = 965 feet Period of Record = 1973 to 1996 Average Pressure = 28.96 inches Hg Design Criteria Data Mean Coincident (Average)
August 15, Please contact the undersigned directly with any questions or concerns regarding the foregoing.
 California Independent System Operator Corporation The Honorable Kimberly D. Bose Secretary Federal Energy Regulatory Commission 888 First Street, NE Washington, DC 20426 August 15, 2017 Re: California
Commercial-in-Confidence Ashton Old Baths Financial Model - Detailed Cashflow
 Year 0 1 2 3 4 5 6 7 8 9 10 11 12 13 Oct-16 Nov-16 Dec-16 Jan-17 Feb-17 Mar-17 Apr-17 May-17 Jun-17 Jul-17 Aug-17 Sep-17 Oct-17 2,038 2,922 4,089 4,349 6,256 7,124 8,885 8,885 8,885 8,885 8,885 8,885 9,107
FOR IMMEDIATE RELEASE
 Article No. 7845 Available on www.roymorgan.com Roy Morgan Unemployment Profile Friday, 18 January 2019 Unemployment in December is 9.7% and under-employment is 8.8% FOR IMMEDIATE RELEASE Australian unemployment
FOR IMMEDIATE RELEASE
 Article No. 7353 Available on www.roymorgan.com Roy Morgan Unemployment Profile Wednesday, 11 October 2017 2.498 million Australians (18.9%) now unemployed or under-employed In September 1.202 million
Design Criteria Data
 LAS VEGAS/MCCARRAN NV Latitude = 36.8 N WMO No. 72386 Longitude =115.1 W Elevation = 2179 feet Period of Record = 1973 to 1996 Average Pressure = 27.67 inches Hg Design Criteria Data Mean Coincident (Average)
Design Criteria Data
 PHOENIX/SKY HARBOR AZ Latitude = 33.43 N WMO No. 72278 Longitude =112. W Elevation = 116 feet Period of Record = 1973 to 1996 Average Pressure = 28.72 inches Hg Design Criteria Data Mean Coincident (Average)
NJ Solar Market Update
 NJ Solar Market Update April 16, 20 Renewable Energy Committee Meeting Trenton, NJ Prepared by Charlie Garrison Solar Installed Capacity Data The preliminary installed solar capacity as of 3/31/ is approximately
Meter Insights for Downtown Store
 Meter Insights for Downtown Store Commodity: Analysis Period: Prepared for: Report Date: Electricity 1 December 2013-31 December 2014 Arlington Mills 12 February 2015 Electricity use over the analysis
Graph #1. Micro-Generation Generating Units in Alberta 20
 2, Graph #1. Micro-Generation Generating Units in Alberta 2 Cumulative # of Generating Units 1,9 1,8 1,7 1,6 1,5 1,4 1,3 1,2 1,1 1, 9 8 7 6 5 4 3 2 Number of MGG Units as of 216 Mar 31 Number of Solar
NEW HAMPSHIRE GAS CORPORATION WINTER PERIOD ORIGINAL FILING CONTENTS 3. CONVERSION OF GAS COSTS - GALLONS TO THERMS SCHEDULE A
 NEW HAMPSHIRE GAS CORPORATION COST OF GAS RATE FILING - DG 13- WINTER PERIOD 2013-2014 ORIGINAL FILING CONTENTS 1. TARIFF PAGE - COST OF GAS RATE 2. MARKED TARIFF PAGE - COST OF GAS RATE 3. CONVERSION
Docket No. ER June 2018 Informational Report Energy Imbalance Market Transition Period Report Idaho Power Company
 California Independent System Operator Corporation August 21, 2018 The Honorable Kimberly D. Bose Secretary Federal Energy Regulatory Commission 888 First Street, NE Washington, DC 20426 Re: California
The Role of Energy Storage in Planning our Energy Needs in the UAE. Bruce Smith Director of Forecasting and Planning
 The Role of Energy Storage in Planning our Energy Needs in the UAE Bruce Smith Director of Forecasting and Planning ADWEC s Planning Objectives Defined in Law and Licence: Policy directions (e.g. emissions
The Peoples Gas Light and Coke Company
 History of Gas Charges Due to the Operation of Rider 2 (Cents per Therm) Factors for Transportation Customers (Riders FST, SST, P, CFY and AGG) Non- Total Standby Standby Aggregation Commodity Commodity
Design Criteria Data
 COLUMBIA SC Latitude = 33.95 N WMO No. 7231 Longitude = 81.12 W Elevation = 226 feet Period of Record = 1973 to 1996 Average Pressure = 29.8 inches Hg Design Criteria Data Mean Coincident (Average) Values
FOR IMMEDIATE RELEASE
 Article No. 7433 Available on www.roymorgan.com Roy Morgan Unemployment Profile Friday, 12 January 2018 2.6m Australians unemployed or under-employed in December The latest data for the Roy Morgan employment
Design Criteria Data
 RAPID CITY SD Latitude = 44.5 N WMO No. 72662 Longitude =3. W Elevation = 3169 feet Period of Record = 1973 to 1996 Average Pressure = 26.67 inches Hg Design Criteria Data Mean Coincident (Average) Values
Design Criteria Data
 PHILADELPHIA PA Latitude = 39.88 N WMO No. 7248 Longitude = 75.25 W Elevation = 3 feet Period of Record = 1973 to 1996 Average Pressure = 29.98 inches Hg Design Criteria Data Mean Coincident (Average)
COMPARISON OF FIXED & VARIABLE RATES (25 YEARS) CHARTERED BANK ADMINISTERED INTEREST RATES - PRIME BUSINESS*
 CHARTERED BANK ADMINISTERED INTEREST RATES - PRIME BUSINESS*") COMPARISON OF FIXED & VARIABLE RATES (25 YEARS) 2 Fixed Rates Variable Rates For Internal Use Only. FIXED RATES OF THE PAST 25 YEARS AVERAGE RESIDENTIAL MORTGAGE LENDING RATE - 5 YEAR* (Per cent) Year
COMPARISON OF FIXED & VARIABLE RATES (25 YEARS) 2 Fixed Rates Variable Rates For Internal Use Only. FIXED RATES OF THE PAST 25 YEARS AVERAGE RESIDENTIAL MORTGAGE LENDING RATE - 5 YEAR* (Per cent) Year
COMPARISON OF FIXED & VARIABLE RATES (25 YEARS) CHARTERED BANK ADMINISTERED INTEREST RATES - PRIME BUSINESS*
 CHARTERED BANK ADMINISTERED INTEREST RATES - PRIME BUSINESS*") COMPARISON OF FIXED & VARIABLE RATES (25 YEARS) 2 Fixed Rates Variable Rates FIXED RATES OF THE PAST 25 YEARS AVERAGE RESIDENTIAL MORTGAGE LENDING RATE - 5 YEAR* (Per cent) Year Jan Feb Mar Apr May Jun
COMPARISON OF FIXED & VARIABLE RATES (25 YEARS) 2 Fixed Rates Variable Rates FIXED RATES OF THE PAST 25 YEARS AVERAGE RESIDENTIAL MORTGAGE LENDING RATE - 5 YEAR* (Per cent) Year Jan Feb Mar Apr May Jun
Design Criteria Data
 MACON/LEWIS WILSON GA Latitude = 32.7 N WMO No. 72217 Longitude = 83.65 W Elevation = 361 feet Period of Record = 1973 to 1996 Average Pressure = 29.66 inches Hg Design Criteria Data Mean Coincident (Average)
Design Criteria Data
 PIERRE SD Latitude = 44.38 N WMO No. 726686 Longitude =1.2 W Elevation = 1742 feet Period of Record = 1973 to 1996 Average Pressure = 28.1 inches Hg Design Criteria Data Mean Coincident (Average) Values
Design Criteria Data
 ANCHORAGE AK Latitude = 61.17 N WMO No. 7273 Longitude =15. W Elevation = 131 feet Period of Record = 1973 to 1996 Average Pressure = 29.6 inches Hg Design Criteria Data Mean Coincident (Average) Values
2016 UC Solar Research Symposium
 2016 UC Solar Research Symposium Beyond UCR s Sustainable Integrated Grid Initiative: Energy Management Projects in Southern California October 7, 2016 Presented by: Alfredo A. Martinez-Morales, Ph.D.
California ISO. Q Report on Market Issues and Performance. December 8, Department of Market Monitoring
 California Independent System Operator Corporation California ISO Q3 2017 Report on Market Issues and Performance December 8, 2017 Department of Market Monitoring TABLE OF CONTENTS Executive summary...
Design Criteria Data
 JACKSONVILLE FL Latitude = 3.5 N WMO No. 7226 Longitude = 81.7 W Elevation = 3 feet Period of Record = 1973 to 1996 Average Pressure = 3.1 inches Hg Design Criteria Data Mean Coincident (Average) Values
Design Criteria Data
 SPOKANE WA Latitude = 47.63 N WMO No. 72785 Longitude =117.5 W Elevation = 2366 feet Period of Record = 1973 to 1996 Average Pressure = 27.5 inches Hg Design Criteria Data Mean Coincident (Average) Values
Design Criteria Data
 LOUISVILLE/STANDIFORD KY Latitude = 38.18 N WMO No. 72423 Longitude = 85.73 W Elevation = 489 feet Period of Record = 1973 to 1996 Average Pressure = 29.49 inches Hg Design Criteria Data Mean Coincident
October 17, Please contact the undersigned directly with any questions or concerns regarding the foregoing.
 California Independent System Operator Corporation The Honorable Kimberly D. Bose Secretary Federal Energy Regulatory Commission 888 First Street, NE Washington, DC 20426 October 17, 2017 Re: California
Design Criteria Data
 DAYTON/JAMES M COX OH Latitude = 39.9 N WMO No. 72429 Longitude = 84.2 W Elevation = 14 feet Period of Record = 1973 to 1996 Average Pressure = 28.95 inches Hg Design Criteria Data Mean Coincident (Average)
Design Criteria Data
 SPRINGFLD MO Latitude = 37.23 N WMO No. 7244 Longitude = 93.38 W Elevation = 127 feet Period of Record = 1973 to 1996 Average Pressure = 28.66 inches Hg Design Criteria Data Mean Coincident (Average) Values
Design Criteria Data
 BIRMINGHAM AL Latitude = 33.57 N WMO No. 72228 Longitude = 86.75 W Elevation = 63 feet Period of Record = 1973 to 1996 Average Pressure = 29.36 inches Hg Design Criteria Data Mean Coincident (Average)
ELECTRICITY GENERATION AND DISTRIBUTION. Electricity Generation & Distribution Q2,
 Contact Statistician: Otsile Chelenyane Industry Statistics Unit Email: ochelenyane@statsbots.org.bw Tel: (+267) 367 1300; Ext. 333 ELECTRICITY GENERATION AND DISTRIBUTION Stats Brief, Quarter 2, 2018
FOR IMMEDIATE RELEASE
 Article No. 6928 Available on www.roymorgan.com Roy Morgan Unemployment Profile Wednesday, 17 August 2016 Australian real unemployment jumps to 10.5% (up 0.9%) in July during post-election uncertainty
Design Criteria Data
 MINNEAPOLIS-ST PAUL MN Latitude = 44.88 N WMO No. 72658 Longitude = 93.22 W Elevation = 837 feet Period of Record = 1973 to 1996 Average Pressure = 29.7 inches Hg Design Criteria Data Mean Coincident (Average)
December 4, Docket: ER Energy Imbalance Market Special Report Transition Period July 2018 for Idaho Power Company
 California Independent System Operator Corporation December 4, 2018 The Honorable Kimberly D. Bose Secretary Federal Energy Regulatory Commission 888 First Street, NE Washington, DC 20426 Re: California
STATISTICS BOTSWANA ELECTRICITY GENERATION & DISTRIBUTION 2016/2 STATS BRIEF, FIRST QUARTER Copyrights Statistics Botswana 2016
 2016/2 ELECTRICITY GENERATION & DISTRIBUTION STATS BRIEF, FIRST QUARTER 2016 Copyrights Statistics Botswana 2016 Statistics Botswana. Private Bag 0024 Botswana Tel: (267) 367 1300. Fax: (267) 395 2201.
Design Criteria Data
 DULUTH MN Latitude = 46.83 N WMO No. 72745 Longitude = 92.18 W Elevation = 1417 feet Period of Record = 1973 to 1996 Average Pressure = 28.43 inches Hg Design Criteria Data Mean Coincident (Average) Values
Review of U.S. market reforms for renewable integration, flexibility, and storage
 Review of U.S. market reforms for renewable integration, flexibility, and storage Eric Hsieh Director Office of Energy Finance and Incentives Analysis U.S. Department of Energy 14 July 2017 Transformations
DMM 2017 Q4 Report Highlights
 DMM 2017 Q4 Report Highlights Gabe Murtaugh Senior Analyst Department of Market Monitoring Conference Call February 21, 2018 Outline Real-time market performance Higher prices in the 15-minute market Large
Design Criteria Data
 MINOT AFB ND Latitude = 48.42 N WMO No. 727675 Longitude =11.3 W Elevation = 1667 feet Period of Record = 1967 to 1996 Average Pressure = 28.16 inches Hg Design Criteria Data Mean Coincident (Average)
FOR IMMEDIATE RELEASE
 Article No. 5842 Available on www.roymorgan.com Roy Morgan Unemployment Profile Thursday, 2 October 2014 Unemployment climbs to 9.9% in September as full-time work lowest since October 2011; 2.2 million
Design Criteria Data
 CHARLESTON/KANAWHA WV Latitude = 38.37 N WMO No. 72414 Longitude = 81.6 W Elevation = 981 feet Period of Record = 1973 to 1996 Average Pressure = 29. inches Hg Design Criteria Data Mean Coincident (Average)
Residential Time-of-Day Service Rate Schedule R-TOD
 I. Applicability This Rate Schedule 1-R-TOD applies to single- and three-phase service for the following types of residential premises: 1. Individual or dual metered residences with digital communicating
Design Criteria Data
 BURLINGTON VT Latitude = 44.47 N WMO No. 72617 Longitude = 73.15 W Elevation = 341 feet Period of Record = 1973 to 1996 Average Pressure = 29.61 inches Hg Design Criteria Data Mean Coincident (Average)
Design Criteria Data
 HONOLULU/OAHU HI Latitude = 21.35 N WMO No. 91182 Longitude =157.9 W Elevation = 16 feet Period of Record = 1967 to 1996 Average Pressure = 29.96 inches Hg Design Criteria Data Mean Coincident (Average)
Design Criteria Data
 INDIANAPOLIS IN Latitude = 39.73 N WMO No. 72438 Longitude = 86.27 W Elevation = 87 feet Period of Record = 1973 to 1996 Average Pressure = 29.15 inches Hg Design Criteria Data Mean Coincident (Average)
Design Criteria Data
 DENVER/STAPLETON CO Latitude = 39.75 N WMO No. 72469 Longitude =14.8 W Elevation = 5332 feet Period of Record = 1973 to 1995 Average Pressure = 24.66 inches Hg Design Criteria Data Mean Coincident (Average)
Design Criteria Data
 CHICAGO/O HARE IL Latitude = 41.98 N WMO No. 7253 Longitude = 87.9 W Elevation = 673 feet Period of Record = 1967 to 1996 Average Pressure = 29.27 inches Hg Design Criteria Data Mean Coincident (Average)
January 18, Docket: ER Energy Imbalance Market Special Report Transition Period August 2018 for Idaho Power Company
 California Independent System Operator Corporation January 18, 2019 The Honorable Kimberly D. Bose Secretary Federal Energy Regulatory Commission 888 First Street, NE Washington, DC 20426 Re: California
Design Criteria Data
 RENO/CANNON INTL NV Latitude = 39.5 N WMO No. 72488 Longitude =119.7 W Elevation = 44 feet Period of Record = 1973 to 1996 Average Pressure = 25.57 inches Hg Design Criteria Data Mean Coincident (Average)
Design Criteria Data
 BOSTON/LOGAN MA Latitude = 42.37 N WMO No. 7259 Longitude = 71.3 W Elevation = 3 feet Period of Record = 1967 to 1996 Average Pressure = 29.95 inches Hg Design Criteria Data Mean Coincident (Average) Values
Design Criteria Data
 MIDLAND TX Latitude = 31.95 N WMO No. 72265 Longitude =2. W Elevation = 2861 feet Period of Record = 1973 to 1996 Average Pressure = 27.3 inches Hg Design Criteria Data Mean Coincident (Average) Values
Date Event or Holiday :Sun, 2:Mon North Orchard Delong Preschool North Orchard Delong Preschool
 2018 6 1 1:Sun, 2:Mon 2018-2019 Date Event or Holiday Aug 16 Board Meeting 6pm Aug 23 Open House June 2018 July 2018 August 2018 Sep 06 Board Meeting 6pm Su M Tu W Th F Sa Su M Tu W Th F Sa Su M Tu W Th
Design Criteria Data
 NEW YORK/JOHN F KENNEDY NY Latitude = 4.65 N WMO No. 74486 Longitude = 73.78 W Elevation = 23 feet Period of Record = 1973 to 1996 Average Pressure = 29.98 inches Hg Design Criteria Data Mean Coincident
Design Criteria Data
 WASHINGTON/DULLES VA Latitude = 38.95 N WMO No. 7243 Longitude = 77.45 W Elevation = 322 feet Period of Record = 1973 to 1996 Average Pressure = 29.68 inches Hg Design Criteria Data Mean Coincident (Average)
Updates. Pat Reiten President and CEO, PacifiCorp Transmission
 PacifiCorp Transmission and Regional Updates Pat Reiten President and CEO, PacifiCorp Transmission PacifiCorp Transmission Overview 16,400 circuit-miles of transmission lines 12,685 MW record peak demand
Design Criteria Data
 LANDER/HUNT WY Latitude = 42.82 N WMO No. 72576 Longitude =18.7 W Elevation = 5558 feet Period of Record = 1973 to 1996 Average Pressure = 24.44 inches Hg Design Criteria Data Mean Coincident (Average)
MONTHLY PERFORMANCE DASHBOARD
 AUSTIN ENERGY JULY MONTHLY PERFORMANCE DASHBOARD A report highlighting key Austin Energy metrics for e FY FINANCIAL HEALTH Standard and Poor s Bond Rating Austin Energy Rating AA AA Budget Based Revenues
Design Criteria Data
 ALBUQUERQUE NM Latitude = 35.5 N WMO No. 72365 Longitude =16.6 W Elevation = 5315 feet Period of Record = 1967 to 1996 Average Pressure = 24.72 inches Hg Design Criteria Data Mean Coincident (Average)
New Jersey Solar Roundtable
 New Jersey Solar Roundtable Transition to a Market-based REC Financing System Scott Hunter, Renewable Energy Program Administrator NJBPU, Office of Clean Energy Presented at New Jersey Institute of Technology
GAZIFÈRE INC. Prime Rate Forecasting Process 2017 Rate Case
 Overview A consensus forecast is used to estimate the prime rate charged by commercial banks. As the prime rate is subject to competitive pressures faced by individual lenders and is set on an individual
2018 Load & Capacity Data Report
 Caution and Disclaimer The contents of these materials are for information purposes and are provided as is without representation or warranty of any kind, including without limitation, accuracy, completeness
Methodology of Cost Allocation
 Methodology of Cost Allocation Robin Kliethermes May 17, 2013 1 Purpose of Cost Allocation Determine whether each class of customers is providing the utility with a reasonable level of revenue necessary
Units of Instruction MISD Pacing Guide Days Date Range Test Date
 MISD Pacing Guide Date Range Test Date Introduction: Processes of Investigations (1 day) Aug. 21 Unit 01: Matter (12 days) Aug. 22-Sept. 7 Sep. 10 Unit 02: Atomic Structure and the Periodic Table (15 days)
March 14, Please contact the undersigned directly with any questions or concerns regarding the foregoing.
 California Independent System Operator Corporation The Honorable Kimberly D. Bose Secretary Federal Energy Regulatory Commission 888 First Street, NE Washington, DC 20426 March 14, 2017 Re: California
MONTHLY NEW RESIDENTIAL SALES, SEPTEMBER 2018
 FOR RELEASE AT 10:00 AM EDT, WEDNESDAY, OCTOBER 24, MONTHLY NEW RESIDENTIAL SALES, SEPTEMBER Release Number: CB18 160 October 24, The U.S. Census Bureau and the U.S. Department of Housing and Urban Development
February 10, The Honorable Kimberly D. Bose Secretary Federal Energy Regulatory Commission 888 First Street, NE Washington, DC 20426
 California Independent System Operator Corporation February 10, 2016 The Honorable Kimberly D. Bose Secretary Federal Energy Regulatory Commission 888 First Street, NE Washington, DC 20426 Re: California
a) The 2011 Net Metering and Buyback Tariff for Emission Free, Renewable Distributed Generation Serving Customer Load
 The 2011 Net Metering and Buyback Tariff for Emission Free, Renewable Distributed Generation Serving Customer Load") Memorandum To: Municipal Light Advisory Board; Municipal Light Board; file From: Belmont Light Staff Date: June 19, 2014 Re: Solar PV Distributed Generation 1. Background & Summary Belmont Light supports
Memorandum To: Municipal Light Advisory Board; Municipal Light Board; file From: Belmont Light Staff Date: June 19, 2014 Re: Solar PV Distributed Generation 1. Background & Summary Belmont Light supports
2017 Adjusted Count Report February 12, 2018
 A statewide multi-use trail user study and volunteer data collection program 2017 Adjusted Count Report February 12, 2018 The following report includes the final adjusted infrared (IR) counter data at
NEU Electric and Natural Gas Price Update
 Exelon s $24 Billion Energy Bill Senate Bill 2814 Short-Term Energy Price Outlook On November 15, 2016, Exelon, through its legislative supporters, introduced Senate Bill 2814, a massive 446 page document
Design Criteria Data
 MADISON/DANE CO. RGNL WI Latitude = 43.13 N WMO No. 72641 Longitude = 89.33 W Elevation = 866 feet Period of Record = 1973 to 1996 Average Pressure = 29.5 inches Hg Design Criteria Data Mean Coincident
Ameren Missouri. AMENDED Renewable Energy Standard Compliance Report Prepared in Compliance with 4 CSR
 Ameren Missouri AMENDED Renewable Energy Standard Compliance Report 2015 Prepared in Compliance with 4 CSR 240-20.100 June 23, 2016 NP Table of Contents Page INTRODUCTION...4 SECTION (8) (A) 1 A: TOTAL
Thank you for requesting information on our utility auditing services!
 - EXHIBIT A - ELECTRIC - CLIENT INVOICE: EXAMPLE #1 If we moved a client from an electrical rate 6 to a rate 6L, and, as a result, changed their KWH rate from $.06 per Kilowatt Hour to $.05 per Kilowatt
Cost Reflective Tariffs
 Cost Reflective Tariffs for Large Government,Commercial and Industrial Customers Customer Guide Introduction On September 2016, the Council of Ministers had approved the introduction Cost of Reflective
RE: Advice Schedule 45 Public DC Fast Charger Delivery Service Optional Transitional Rate REPLACEMENT PAGES
 January 31, 2017 VIA ELECTRONIC FILING Public Utility Commission of Oregon 201 High Street SE, Suite 100 Salem, OR 97301-3398 Attn: Filing Center RE: Advice 16-020 Schedule 45 Public DC Fast Charger Delivery
Merger of the generator interconnection processes of Valley Electric and the ISO;
 California Independent System Operator Corporation Memorandum To: ISO Board of Governors From: Karen Edson Vice President, Policy & Client Services Date: August 18, 2011 Re: Decision on Valley Electric