WIM #29 was operational for the entire month of October Volume was computed using all monthly data.
|
|
|
- Lindsey Harrison
- 6 years ago
- Views:
Transcription

1 OCTOBER 2015
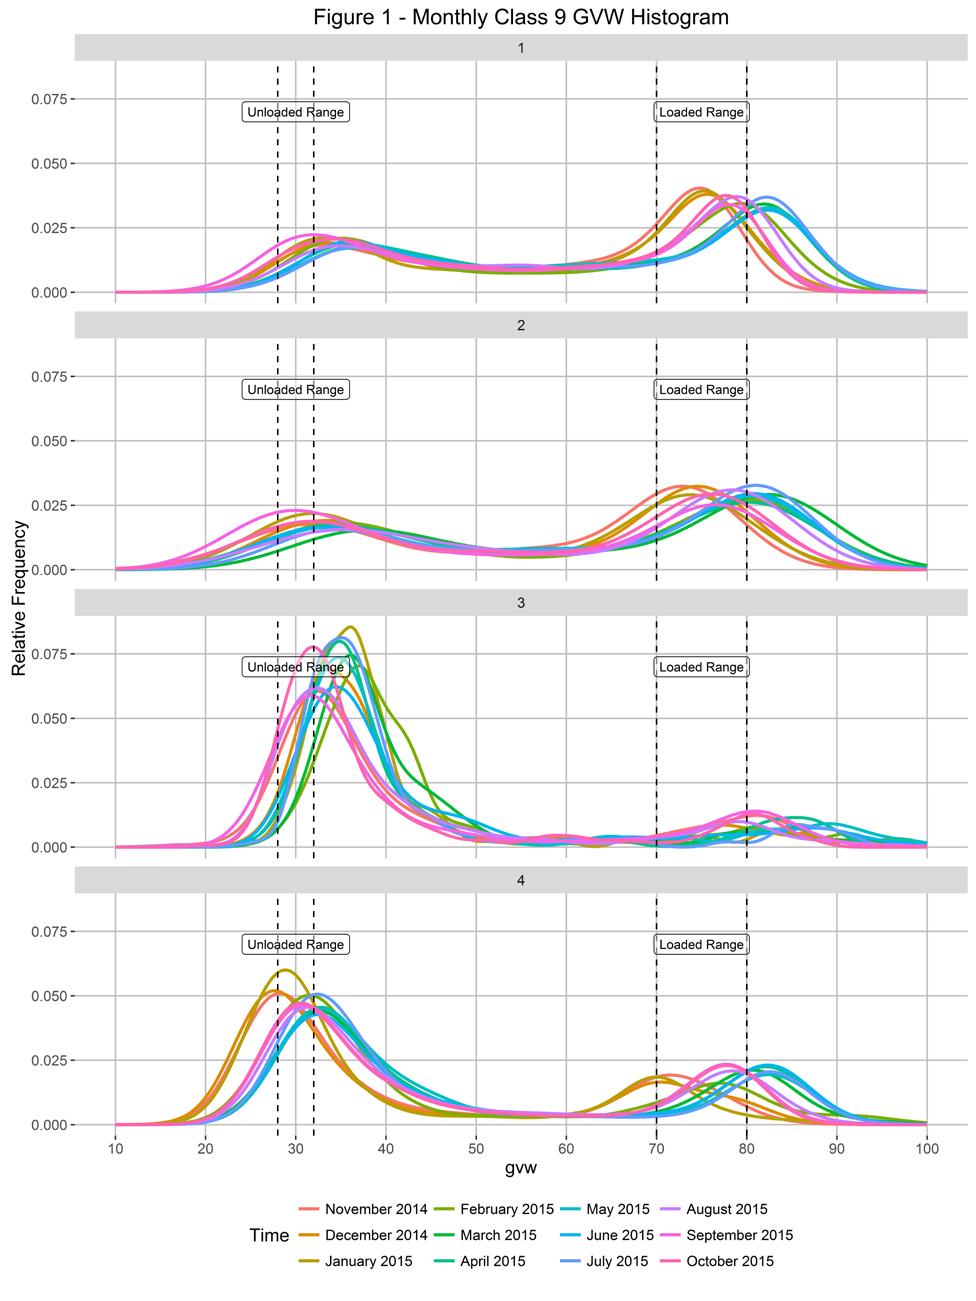
2 WIM Site Location WIM #29 is located on US 53 near Cotton in St Louis county. System Operation WIM #29 was operational for the entire month of October Volume was computed using all monthly data. System Calibration WIM #29 was most recently calibrated on Table 1 summarizes the front axle weights of class 9s by lane 1. Table 1 indicates that the class 9 front axle weights were all within ±9% of baseline calibration values for all lanes. Figure 1 shows the distribution of gross vehicle weights (GVW) in the Class 9s at this site for the last 12 months of operation 2. Figure 2 depicts the average front axle weight as a percent difference from the first full month following calibration. Summary of Volume Statistics Total Monthly Volume: Passenger Vehicles: Heavy Commercial Vehicles: Monthly Average Daily Traffic (MADT): 8501 Monthly Heavy Commercial Average Daily Traffic (MHCADT): 789 See Table 2 for vehicle class breakdown Passenger Vehicles (PVs) and Heavy Commercial Vehicles (HCVs) Volume trends. NB vehicles typically reached highest volume levels on Fridays, with lowest volumes reported on Mondays. SB vehicles typically reached highest volume levels on Sundays, with lowest volumes reported on Tuesdays (see Figure 3 and 4). Passenger Vehicles (PVs) Volume trends. On an average 24-hour day (see Figure 5), NB PVs generally reached peak volume levels between 03 PM and 05 PM. Similarly, SB PVs peaked in volume between 11 AM and 04 PM Heavy Commercial Vehicles (HCVs) Volume trends. On an average 24-hour day, HCVs traveling NB typically reached peak volume levels between 03 PM and 05 PM, while volume going SB peaked between 11 AM and 04 PM. See Figure 6. Out of all HCVs, the two highest traffic volumes were generated by Class 9's and Class 5's.
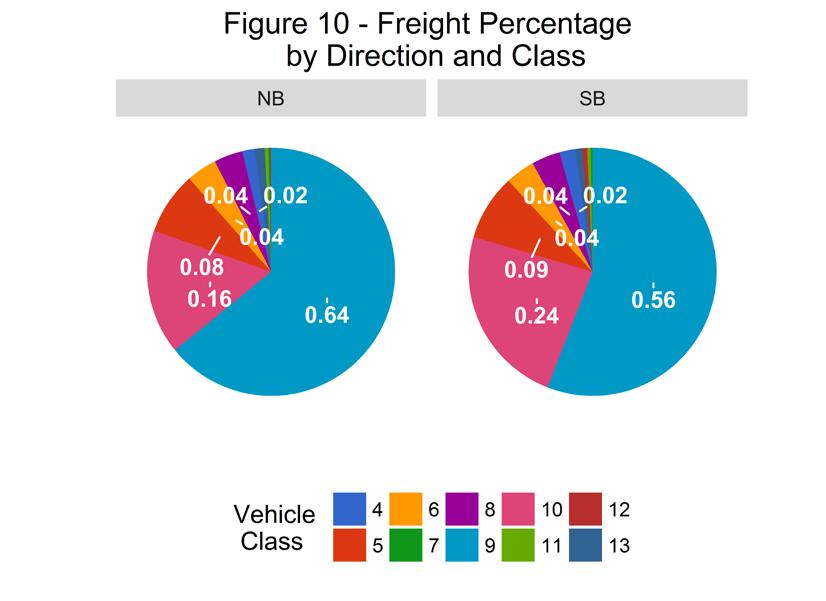
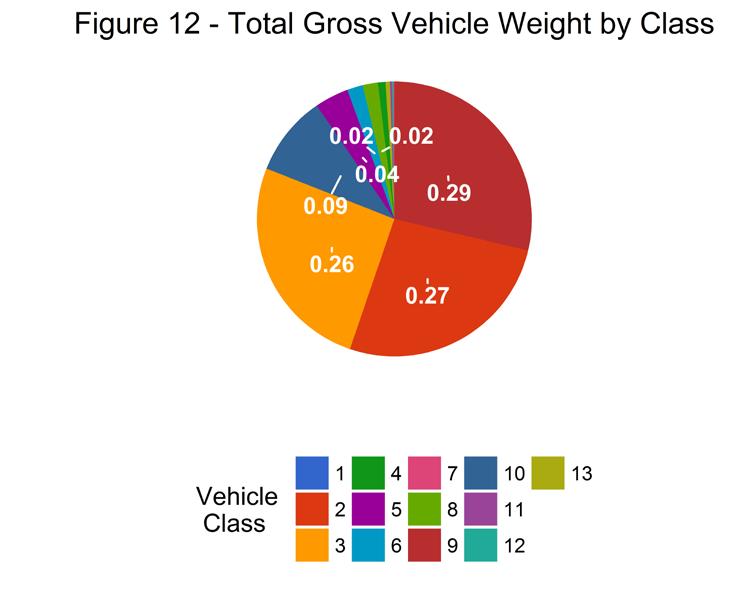
3 Overweight HCVs Volume trends. Of a total of HCVs, 3437 of them were overweight 3. These overweight HCVs contributed to 1.3% of total monthly volume, and 14.2% of total monthly HCV volume. NB overweight vehicles typically reached highest numbers on Thursdays, with lowest volumes reported on Sundays. SB overweight vehicles tended to reach highest volumes on Wednesdays, with lowest volumes reported on Sundays. See Figure 3. The top two overweight violators by class were the class 9 and class 10 vehicles. Overall, overweight vehicles tended to reach peak volume concentrations during typical business hours, with 58.6% of all overweight vehicles traveling SB this month (see Figure 7 & 8). Figure 9 shows the number of vehicles exceeding 88,000 pounds that crossed the WIM over the last 12 months. The highest number of 88,000+ vehicles within the last 12 months occurred in February. WIMs are currently used as a screening tool for weight enforcement, and it is estimated that the WIM scales can measure gross vehicle weights (GVW) within 90-95% of static weight scale measurements. Due to the possibility of measurement error, vehicles exceeding 10% of their legal weight limits (or 1.1 times their legal weight limits) are considered overweight in this report 4. Using normal load limits,119 NB vehicles exceeded 88,000 pounds (71 vehicles were Class 10's; 43 vehicles were Class 13's). Of vehicles traveling SB, 574 NB vehicles exceeded 88,000 pounds (520 vehicles were Class 10's; 29 vehicles were Class 13's). Refer to Table 3 for the Top 10 highest recorded GVWs from Classes 9 and 10 from October Loaded vs. Unloaded HCVs. Figure 10 shows the GVW distributions of Class 9s and 10s in October Data suggests that there were greater numbers of fully_loaded Class 9's than empty Class 9's traveling NB, while there were more empty Class 9's than fully_loaded traveling SB. Data also suggests that there were more fully_loaded Class 10's than empty traveling in the NB direction. In the SB direction, there were more fully_loaded class 10 vehicles. Freight Totals. A total of tons of freight was recorded to have crossed the WIM. More freight was shipped NB (53.9%) than SB (46.1%). See Table 4 and Figure 11 for more freight information. Infrastructure Considerations Bridge. Bridge No is approximately 5.8 miles north of WIM #29. Bridges No and No. 6603, which are respectively on the NB and SB side of MN 53, are 0.2 miles south of WIM #29. WIM #29 recorded a total of vehicles with a combined GVW of kips (1 kip = 1,000 pounds = 0.5 tons) in October See Table 5 and Figures for GVW information by vehicle class and lane. Pavement Design. A total of equivalent single axle loads (ESALs) passed over the pavement at this site. Approximately 51.4% of all ESALs were recorded NB while 48.6% was observed SB. In particular, 59% of all ESALs were generated by the Class 9's (Class 9's were also responsible for generating 29% of total GVW observed this month). See Table 6
4 and Figures for more information on ESALs (Table 6 also provides flexible ESAL factors for each vehicle class using a terminal serviceability of 2.5 and a structural number of 5). WIM monthly reports can be found at: MnDOT's vehicle classification scheme and vehicle class groupings for traffic forecasting can be found at: To request this document in an alternative format, please call or , or your request to ADArequest.dot@state.mn.us. Please request at least one week in advance. 1 Front axle weights of Class 9s are monitored on a monthly basis to assure performance between calibrations. The current goal of the WIM scale calibration is to have each individual axle weight stay within a range of ±9% of baseline calibration values 2 Previous WIM research indicates that unloaded Class 9s typically weigh kips, while loaded Class 9s generally fall in the kip range. More recent data from several WIM sites suggests that the unloaded Class 9 range may have moved a little higher over time (due to increased presence of sleeper cabs, etc.), although these ranges are also thought to be site-specific. 3 An HCV is considered overweight during normal load limits in this report if they satisfy any of the following 1) exceed a gross vehicle weight (GVW) of 80,000 pounds, 2) exceed any of the legal weight maximums on any axle configurations (legal maximums are: single axle = 20,000 pounds; tandem axles spaced 8' or less = 34,000 pounds; tridem axles spaced 9' or less = 43,000 pounds; quad axles spaced 13' or less = 51,000 pounds). Monthly reports use this standard regardless of the time of year however, the Winter Load Increase (WLI) allows a 10% across the board increase in axle and gross vehicle weights without a permit on US, state routes, and county roads. An HCV is considered overweight during Winter Load Increase(WLI) if they satisfy any of the following 1) exceed a gross vehicle weight (GVW) of 88,000 pounds, 2) exceed any of the legal weight maximums on any axle configurations (legal maximums are: single axle = 22,000 pounds; tandem axles spaced 8' or less = 37,400 pounds; tridem axles spaced 9' or less = 47,300 pounds; quad axles spaced 13' or less = 56,100 pounds). An overweight HCV is only included once in the overweight volume calculations regardless of how many of the aforementioned conditions are violated. For information on MN weight limit dates and statutes: 4 For example, Class 9s and 10s can legally have gross vehicle weights up to 80,000 lbs (with the exception of permitted loads) during normal load limits. To account for measurement error on the WIM scales, those exceeding 10% of the legal GVW maximum (or 1.1 times the legal GVW) should be screened (e.g., 80,000 lbs + 8,000 lbs = 88,000 lbs). Similarly during WLI vehicles weighing 96,800 lbs should be screened.
5
6
7
8
9
10

11 Vehicle Weights (Kips) Nov 2014 Dec 2014 Jan 2015 Feb 2015 Mar 2015 Apr 2015 May 2015 Jun 2015 Jul 2015 Aug 2015 Sep > Total Oct 2015
12
13
14
15 Table 1 Class 9 Front Axle Weight by Lane Month Lane 1 (Kips) Front Axle +/- 9% Lane 2 (Kips) Front Axle +/- 9% Lane 3 (Kips) Front Axle +/- 9% Lane 4 (kips) Front Axle +/- 9% September October
16 Table 2 Vehicle Classification Data Vehicle Class Monthly Average Daily Volume Monthly Total Volume Monthly Total Volume Percentage Monthly Total Overweight Vehicles TOTAL Monthly Total Overweight Percentage
17 Table 3 Top 10 Gross Vehicle Weight, Class 9 and 10 Date Day of Week Time Vehicle Class Direction Lane GVW (lbs) Thursday 20:14:39 10 SB Saturday 09:44:13 10 NB Friday 07:33:56 10 NB Friday 13:35:06 10 NB Monday 07:07:06 10 SB Tuesday 16:28:28 10 NB Friday 17:53:39 10 NB Monday 07:11:29 10 SB Thursday 09:12:10 10 NB Monday 12:29:14 10 NB
18 Table 4 Freight Summary Vehicle Class Direction Weight of Empty Vehicle (Kips) Total Number of Vehicles Number of Empty Vehicles Percentage of Empty Vehicles Total Weight of Vehicles with Freight (Kips) Total Weight of Empty Vehicles (Kips) 4 NB Total Weight of Freight (Tons) 5 NB NB NB NB NB NB NB NB NB TOTAL **** **** **** **** Total Weight of Vehicles with Freight (Kips) Total Weight of Freight (Tons) Vehicle Class Direction Weight of Empty Vehicle (Kips) Total Number of Vehicles Number of Empty Vehicles Percentage of Empty Vehicles Total Weight of Empty Vehicles (Kips) 4 SB SB SB SB SB SB SB SB SB SB TOTAL **** **** **** **** GRAND TOTAL **** ****
19 Table 5 Gross Vehicle Weight by Class and Lane Vehicle Class NB Driving Lane NB Passing Lane SB Passing Lane SB Driving Lane Total Percentage TOTAL GVW/LANE
20 Table 6 ESALs by Class and Lane and Flexible ESAL Factors Vehicle Class NB Driving Lane NB Passing Lane SB Passing Lane SB Driving Lane Total Percentage Flexible ESAL Factor e TOTAL ESALS/LANE
21 Table 7 Site Summary: Volume and Vehicle Class Month Total Volume Monthly ADT Monthly HCADT Passenger Vehicles Passenger Vehicles % Heavy Commercial Vehicles Heavy Commercial Vehicles % Heavy Commercial Vehicles in Driving Lane % Dec Jan Feb Mar Apr May Jun Jul Aug Sep Oct TOTAL AVERAGE Heavy Commercial Vehicles in Passing Lane %
22 ESALs Month ESALS NB Passing Lane ESALS NB Driving Lane ESALS SB Driving Lane ESALS SB Passing Lane Total ESALS Driving Lane ESALS % Passing Lane ESALS % Dec Jan Feb Mar Apr May Jun Jul Aug Sep Oct TOTAL AVERAGE Pavement Life Decrease Months
23 Gross Vehicle Weight Month GVW NB Passing Lane GVW NB Driving Lane GVW SB Passing Lane GVW SB Driving Lane Total GVW Kips Dec Jan Feb Mar Apr May Jun Jul Aug Sep Oct TOTAL AVERAGE
24 Overweight Vehicles Month Total Number of Overweight Vehicles Overweight / Total Volume Overweight / Heavy Commercial Volume Number Over 88,000 lbs Dec Jan Feb Mar Apr May Jun Jul Aug Sep Oct TOTAL AVERAGE Number Over 98,000 lbs
25 Freight Month NB Freight Tons SB Freight Tons Total Freight NB Freight % SB Freight % Dec Jan Feb Mar Apr May Jun Jul Aug Sep Oct TOTAL AVERAGE
WIM #48 is located on CSAH 5 near Storden in Cottonwood county.
 WIM Site Location WIM #48 is located on CSAH 5 near Storden in Cottonwood county. System Operation WIM #48 was operational for the entire month of August 2017. Volume was computed using all monthly data.
WIM #37 was operational for the entire month of September Volume was computed using all monthly data.
 SEPTEMBER 2016 WIM Site Location WIM #37 is located on I-94 near Otsego in Wright county. The WIM is located only on the westbound (WB) side of I-94, meaning that all data mentioned in this report pertains
WIM #40 is located on US 52 near South St. Paul in Dakota county.
 WIM Site Location WIM #40 is located on US 52 near South St. Paul in Dakota county. System Operation WIM #40 was operational for the entire month of November 2017. Volume was computed using all monthly
WIM #31 US 2, MP 8.0 EAST GRAND FORKS, MN JANUARY 2015 MONTHLY REPORT
 WIM #31 US 2, MP 8.0 EAST GRAND FORKS, MN JANUARY 2015 MONTHLY REPORT WIM #31 EAST GRAND FORKS MONTHLY REPORT - JANUARY 2015 WIM Site Location WIM #31 is located on US 2 at mile post 8.0, southeast of
WIM #41 CSAH 14, MP 14.9 CROOKSTON, MINNESOTA APRIL 2014 MONTHLY REPORT
 WIM #41 CSAH 14, MP 14.9 CROOKSTON, MINNESOTA APRIL 2014 MONTHLY REPORT In order to understand the vehicle classes and groupings, the MnDOT Vehicle Classification Scheme and the Vehicle Classification
WIM #41 CSAH 14, MP 14.9 CROOKSTON, MINNESOTA MAY 2013 MONTHLY REPORT
 WIM #41 CSAH 14, MP 14.9 CROOKSTON, MINNESOTA MAY 2013 MONTHLY REPORT In order to understand the vehicle classes and groupings the Mn/DOT Vehicle Classification Scheme and the Vehicle Classification Groupings
WIM #40 US 52, MP S. ST. PAUL, MN APRIL 2010 MONTHLY REPORT
 WIM #40 US 52, MP 126.8 S. ST. PAUL, MN APRIL 2010 MONTHLY REPORT In order to understand the vehicle classes and groupings the Mn/DOT Vehicle Classification Scheme and the Vehicle Class Groupings for Forecasting
WIM #39 MN 43, MP 45.2 WINONA, MN APRIL 2010 MONTHLY REPORT
 WIM #39 MN 43, MP 45.2 WINONA, MN APRIL 2010 MONTHLY REPORT In order to understand the vehicle classes and groupings the Mn/DOT Vehicle Classification Scheme and the Vehicle Class Groupings for Forecasting
Commercial-in-Confidence Ashton Old Baths Financial Model - Detailed Cashflow
 Year 0 1 2 3 4 5 6 7 8 9 10 11 12 13 Oct-16 Nov-16 Dec-16 Jan-17 Feb-17 Mar-17 Apr-17 May-17 Jun-17 Jul-17 Aug-17 Sep-17 Oct-17 2,038 2,922 4,089 4,349 6,256 7,124 8,885 8,885 8,885 8,885 8,885 8,885 9,107
COMPARISON OF FIXED & VARIABLE RATES (25 YEARS) CHARTERED BANK ADMINISTERED INTEREST RATES - PRIME BUSINESS*
 CHARTERED BANK ADMINISTERED INTEREST RATES - PRIME BUSINESS*") COMPARISON OF FIXED & VARIABLE RATES (25 YEARS) 2 Fixed Rates Variable Rates For Internal Use Only. FIXED RATES OF THE PAST 25 YEARS AVERAGE RESIDENTIAL MORTGAGE LENDING RATE - 5 YEAR* (Per cent) Year
COMPARISON OF FIXED & VARIABLE RATES (25 YEARS) 2 Fixed Rates Variable Rates For Internal Use Only. FIXED RATES OF THE PAST 25 YEARS AVERAGE RESIDENTIAL MORTGAGE LENDING RATE - 5 YEAR* (Per cent) Year
COMPARISON OF FIXED & VARIABLE RATES (25 YEARS) CHARTERED BANK ADMINISTERED INTEREST RATES - PRIME BUSINESS*
 CHARTERED BANK ADMINISTERED INTEREST RATES - PRIME BUSINESS*") COMPARISON OF FIXED & VARIABLE RATES (25 YEARS) 2 Fixed Rates Variable Rates FIXED RATES OF THE PAST 25 YEARS AVERAGE RESIDENTIAL MORTGAGE LENDING RATE - 5 YEAR* (Per cent) Year Jan Feb Mar Apr May Jun
COMPARISON OF FIXED & VARIABLE RATES (25 YEARS) 2 Fixed Rates Variable Rates FIXED RATES OF THE PAST 25 YEARS AVERAGE RESIDENTIAL MORTGAGE LENDING RATE - 5 YEAR* (Per cent) Year Jan Feb Mar Apr May Jun
September 2016 Water Production & Consumption Data
 September 2016 Water Production & Consumption Data September 2016 monthly water production (288.48 AF) was lowest in at least 17 years. Monthly water production has increased slightly each month since
Alberta. Collision Facts. 330 people killed. 17,907 people injured. 140,705 collisions.
 Collision Facts 330 people killed 17,907 people injured 140,705 collisions May 2017 www.transportation.alberta.ca/statistics Collision Facts 330 people killed 17,907 people injured 140,705 collisions Monday
Traffic Reports User Documentation
 Traffic Reports User Documentation Date: 2 April 204 Version:. Prepared by Opus International Consultants ( Canada ) Limited of 42 Table of Contents Introduction... 3 2 Background... 3 3 Traffic Reports
Total Production by Month (Acre Feet)
") Production by Month (acre-feet) 2008 2009 2010 2011 2012 2013 2014 2015 2016 January 25 339.10 228.90 249.50 297.99 243.06 327.14 247.66 212.37 February 234.00 218.80 212.10 241.52 245.82 279.08 234.16
Production by Month (acre-feet) 2008 2009 2010 2011 2012 2013 2014 2015 2016 January 25 339.10 228.90 249.50 297.99 243.06 327.14 247.66 212.37 February 234.00 218.80 212.10 241.52 245.82 279.08 234.16
The impact of electric vehicle development on peak demand and the load curve under different scenarios of EV integration and recharging options
 The impact of electric vehicle development on peak demand and the load curve under different scenarios of EV integration and recharging options Electricity demand in France: a paradigm shift Electricity
Meter Insights for Downtown Store
 Meter Insights for Downtown Store Commodity: Analysis Period: Prepared for: Report Date: Electricity 1 December 2013-31 December 2014 Arlington Mills 12 February 2015 Electricity use over the analysis
August ATR Monthly Report
 August ATR Monthly Report Minnesota Department of Transportation Office of Transportation Data and Analysis August 2011 Introduction The purpose of this report is to examine monthly traffic trends on
May ATR Monthly Report
 May ATR Monthly Report Minnesota Department of Transportation Office of Transportation Data and Analysis May 2011 Introduction The purpose of this report is to examine monthly traffic trends on Minnesota
Sound Transit Operations July 2016 Service Performance Report. Ridership
 Ridership Total Boardings by Mode Mode Jul-15 Jul-16 % YTD-15 YTD-16 % ST Express 1,618,779 1,545,852-4.5% 10,803,486 10,774,063-0.3% Sounder 333,000 323,233-2.9% 2,176,914 2,423,058 11.3% Tacoma Link
SPECIAL HAULING PERMITS
 ODOT PERMITS OMA, NOVEMBER 29, 2017 SPECIAL HAULING PERMITS Mike Moreland Supervisor of Permits, ODOT Special Hauling Permit Section (614) 351-5530 Mike.Moreland2@dot.ohio.gov 2 Ohio Manufacturers Association
FOR IMMEDIATE RELEASE
 Article No. 7761 Available on www.roymorgan.com Roy Morgan Unemployment Profile Monday, 8 October 2018 Unemployment down to 9.4% in September off two-year high Australian employment has grown solidly over
Automated Occupancy Detection October 2015 (Phase I) Demonstration Results Presented by Kathy McCune
 Demonstration Results Presented by Kathy McCune") Automated Occupancy Detection October 2015 (Phase I) Demonstration Results Presented by Kathy McCune 2016 TRB Managed Lanes Conference May 5th, Session 6 Presentation Background Outline Metro ExpressLanes
Automated Occupancy Detection October 2015 (Phase I) Demonstration Results Presented by Kathy McCune 2016 TRB Managed Lanes Conference May 5th, Session 6 Presentation Background Outline Metro ExpressLanes
Passive Investors and Managed Money in Commodity Futures. Part 2: Liquidity. Prepared for: The CME Group. Prepared by:
 Passive Investors and Managed Money in Commodity Futures Part 2: Liquidity Prepared for: The CME Group Prepared by: October, 2008 Table of Contents Section Slide Number Objectives and Approach 3 Findings
US Rt. 12/20/45 at US Rt. 20 <Westbound and Southbound>
 US Rt. 12/20/45 at US Rt. 20 Village of Stone Park, Illinois R L R F o l l o w - U p E v a l u a t i o n R e p o r t Reference No: 016-43280 December 2010 Table of Contents
Truck Axle Weight Distributions
 Truck Axle Weight Distributions Implementation Report IR-16-02 Prepared for Texas Department of Transportation Maintenance Division Prepared by Texas A&M Transportation Institute Cesar Quiroga Jing Li
ANCR CRU Statistics February 2007 to December 2007
 ANCR CRU Statistics February 2007 to December 2007 o Jan/07 Feb/07* Mar/07 Apr/07 May/07 Jun/07 Jul/07 Aug/07 Sep/07 Oct/07 Nov/07 Dec/07 Total notes data from Perimeter phone system unavailable prior
Appendix SAN San Diego, California 2003 Annual Report on Freeway Mobility and Reliability
 (http://mobility.tamu.edu/mmp) Office of Operations, Federal Highway Administration Appendix SAN San Diego, California 2003 Annual Report on Freeway Mobility and Reliability This report is a supplement
2017 Adjusted Count Report February 12, 2018
 A statewide multi-use trail user study and volunteer data collection program 2017 Adjusted Count Report February 12, 2018 The following report includes the final adjusted infrared (IR) counter data at
Fort York Food Bank Monthly Performance Report (FYFB)
") September 2012 Current Month Fort York Food Bank Monthly Performance Report (FYFB) 2010 2011 2012 % change 2010 2011 2012 2009 2010 2011 2012 % change Food Baskets Distributed (3 days of meals/basket)
September 2012 Current Month Fort York Food Bank Monthly Performance Report (FYFB) 2010 2011 2012 % change 2010 2011 2012 2009 2010 2011 2012 % change Food Baskets Distributed (3 days of meals/basket)
Red Light Cameras in Austin. Austin Police Department Highway Enforcement Command
 Red Light Cameras in Austin Austin Police Department Highway Enforcement Command video MLK WB/I35 EF SB Video 2014 Red Light Violations Ø 10 camera approaches (direction of cameras) in Austin throughout
LARGE TRUCK MONITORING PROGRAM
 LARGE TRUCK MONITORING PROGRAM WIM Station Annual Report for 2008 Prepared for: NEW JERSEY DEPARTMENT OF TRANSPORTATION Bureau of Freight Services Prepared by: LARGE TRUCK MONITORING PROGRAM WIM Station
FOR IMMEDIATE RELEASE
 Article No. 7845 Available on www.roymorgan.com Roy Morgan Unemployment Profile Friday, 18 January 2019 Unemployment in December is 9.7% and under-employment is 8.8% FOR IMMEDIATE RELEASE Australian unemployment
University of Michigan Eco-Driving Index (EDI) Latest data: October 2017
 Latest data: October 2017") University of Michigan Eco-Driving Index () http://www.ecodrivingindex.org Latest data: October 2017 Developed and issued monthly by Michael Sivak and Brandon Schoettle Sustainable Worldwide Transportation
University of Michigan Eco-Driving Index () http://www.ecodrivingindex.org Latest data: October 2017 Developed and issued monthly by Michael Sivak and Brandon Schoettle Sustainable Worldwide Transportation
NEU Electric and Natural Gas Price Update
 $ / MWH Jan-11 May-11 Sep-11 Sep-12 Jan-13 Electric: Short-Term Outlook The NYMEX Northern Illinois Hub 12-month forward price at the end of August 2016 for the September 2016 to August 2017 period was
NEWS Release. U.S. Manufacturing Technology Orders. Year-to-date U.S. manufacturing technology orders up 4.1% over 2011
 U.S. Manufacturing Technology Orders A statistical program of AMT NEWS Release FOR RELEASE: October 8, 2012 Contact: Pat McGibbon, AMT, 703-827-5255 Year-to-date U.S. manufacturing technology orders up
Project Manager: Neil Beckett. Prepared by: Bernadette Bañez. Reviewed by: Neil Beckett. Approved for issue by: David Darwin
 Annual Weigh-In-Motion (WiM) Report 2010 This report has been prepared for the benefit of the NZ Transport Agency (NZTA). No liability is accepted by this company or any employee or sub-consultant of this
FOR IMMEDIATE RELEASE
 Article No. 7433 Available on www.roymorgan.com Roy Morgan Unemployment Profile Friday, 12 January 2018 2.6m Australians unemployed or under-employed in December The latest data for the Roy Morgan employment
2013 Operations Statistics Report Triangle Expressway Fourth Quarter
 2013 Operations Statistics Report Fourth Quarter 1 S. Wilmington Street Raleigh, C 27601 2012 Annual Operations Last Updated: Report 1 11, 2014 Table of Contents 2013 Fourth Quarter Operations Statistics
Florida Courts E-Filing Authority Board. Service Desk Report October 2018
 Florida Courts E-Filing Authority Board Service Desk Report October 218 Customer Service Incidents October 218 Status August 218 September 218 October 218 Incidents Received 3,157 2,685 3,779 Incidents
RIDERSHIP TRENDS. March 2017
 RIDERSHIP TRENDS March 2017 Prepared by the Division of Strategic Capital Planning May 2017 Table of Contents Executive Summary...1 Ridership...3 Estimated Passenger Trips by Line...3 Estimated Passenger
Electrical Power Analysis of the Cal Poly Organic Farm for the Cal Poly SuPER Project
 Electrical Power Analysis of the Cal Poly Organic Farm for the Cal Poly SuPER Project Presentation For SARC March 21, 2008 Senior Project By Alex Liang Agenda Terminology Introduction to SuPER and This
NJ Solar Market Update
 NJ Solar Market Update April 16, 20 Renewable Energy Committee Meeting Trenton, NJ Prepared by Charlie Garrison Solar Installed Capacity Data The preliminary installed solar capacity as of 3/31/ is approximately
FOR IMMEDIATE RELEASE
 Article No. 5842 Available on www.roymorgan.com Roy Morgan Unemployment Profile Thursday, 2 October 2014 Unemployment climbs to 9.9% in September as full-time work lowest since October 2011; 2.2 million
FOR IMMEDIATE RELEASE
 Article No. 7353 Available on www.roymorgan.com Roy Morgan Unemployment Profile Wednesday, 11 October 2017 2.498 million Australians (18.9%) now unemployed or under-employed In September 1.202 million
STATISTICS BOTSWANA ELECTRICITY GENERATION & DISTRIBUTION 2016/2 STATS BRIEF, FIRST QUARTER Copyrights Statistics Botswana 2016
 2016/2 ELECTRICITY GENERATION & DISTRIBUTION STATS BRIEF, FIRST QUARTER 2016 Copyrights Statistics Botswana 2016 Statistics Botswana. Private Bag 0024 Botswana Tel: (267) 367 1300. Fax: (267) 395 2201.
GAZIFÈRE INC. Prime Rate Forecasting Process 2017 Rate Case
 Overview A consensus forecast is used to estimate the prime rate charged by commercial banks. As the prime rate is subject to competitive pressures faced by individual lenders and is set on an individual
Up and Down Months of the Stock Market
 Up and Down Months of the Stock Market 1926-2017 Positive years (66) in the stock market were not good all year long and losing years (24) were not losers throughout the year. Winning years produce losing
Presentation to the Customer Service, Operations and Safety Committee OPERATIONS PERFORMANCE INDICATORS
 Presentation to the Customer Service, Operations and Safety Committee OPERATIONS PERFORMANCE INDICATORS May 19, 2005 Department of Operations 100 95 90 85 80 75 70 65 A B C D RAIL PERFORMANCE INDEX FY
Economics of Integrating Renewables DAN HARMS MANAGER OF RATE, TECHNOLOGY & ENERGY POLICY SEPTEMBER 2017
 Economics of Integrating Renewables DAN HARMS MANAGER OF RATE, TECHNOLOGY & ENERGY POLICY SEPTEMBER 2017 Presentation Outline Understanding LPEA s expenses and what drives them Economics of net metering
City of Biddeford Solid Waste Management Commission January 10, :00 PM Public Works
 City of Biddeford Solid Waste Management Commission January 10, 2017 7:00 PM Public Works 1. Call to Order 2. Approval of Minutes - December 13, 3. Discussion / Approval 3.1. Food Waste curbside collection
Streetcar Update. Review of December 2018
 Streetcar Update Review of December 2018 Number of Incidents Safety Metrics: Near Miss Near Miss Incident Breakdown 19% decrease near-miss events year over year (2017 versus 2018) 66% decrease at 5 th
ELECTRICITY GENERATION AND DISTRIBUTION. Electricity Generation & Distribution Q2,
 Contact Statistician: Otsile Chelenyane Industry Statistics Unit Email: ochelenyane@statsbots.org.bw Tel: (+267) 367 1300; Ext. 333 ELECTRICITY GENERATION AND DISTRIBUTION Stats Brief, Quarter 2, 2018
NJ Solar Market Update As of 6/30/15
 NJ Solar Market Update As of 6/30/ Prepared by Charlie Garrison July 17, 20 SOLAR INSTALLED CAPACITY DATA The preliminary installed solar capacity as of 6/30/ is approximately 1,500.7 MW. Approximately
CHARACTERIZATION AND DEVELOPMENT OF TRUCK LOAD SPECTRA FOR CURRENT AND FUTURE PAVEMENT DESIGN PRACTICES IN LOUISIANA
 CHARACTERIZATION AND DEVELOPMENT OF TRUCK LOAD SPECTRA FOR CURRENT AND FUTURE PAVEMENT DESIGN PRACTICES IN LOUISIANA LSU Research Team Sherif Ishak Hak-Chul Shin Bharath K Sridhar OUTLINE BACKGROUND AND
COUNT, CLASSIFICATION & SPEED SAMPLE REPORTS
 Connected Solutions for Better Traffic Safety Outcomes COUNT, CLASSIFICATION & SPEED SAMPLE REPORTS AllTrafficSolutions.com Why You Need Traffic Data at Your Fingertips As traffic in your municipality
BOARD OF COUNTY COMMISSIONERS AGENDA ITEM SUMMARY. Consent Workshop [ ]
![BOARD OF COUNTY COMMISSIONERS AGENDA ITEM SUMMARY. Consent Workshop [ ]](/thumbs/82/86800449.jpg "BOARD OF COUNTY COMMISSIONERS AGENDA ITEM SUMMARY. Consent Workshop [ ]") - _j POSTPONED FROM THE JANUARY 14 BCC MEETING Agenda Item #5,::.. I BOARD OF COUNTY COMMISSIONERS AGENDA ITEM SUMMARY Meeting Date: February 4, 2014 [ ] [ ] Department: Submitted By: Engineering & Public
- _j POSTPONED FROM THE JANUARY 14 BCC MEETING Agenda Item #5,::.. I BOARD OF COUNTY COMMISSIONERS AGENDA ITEM SUMMARY Meeting Date: February 4, 2014 [ ] [ ] Department: Submitted By: Engineering & Public
Department of Highway Safety and Motor Vehicles
 Department of Highway Safety and Motor Vehicles Traffic Report 2005 A Compilation of Motor Vehicle Crash Data from the Florida Crash Records Database Fred O. Dickinson Executive Director Our Mission: Making
TRAFFIC VOLUME TRENDS July 2002
 TRAFFIC VOLUME TRENDS July 2002 Travel on all roads and streets changed by +2.3 percent for July 2002 as compared to July 2001. Estimated Vehicle-Miles of Travel by Region - July 2002 - (in Billions) West
Monthly STAR Report : Quality Inn Ashland For the Month of: December 2017 Currency: US Dollar / Competitive Set Data Excludes Subject Property
 STR # 33511 / Created January 18, 2018 ly STAR Report : Quality Inn Ashland For the of: December 2017 Currency: US Dollar / Competitive Set Data Excludes Subject Property Table Of Contents 1 ly Performance
The London Low Emission Zone. Nick Fairholme Head of the LEZ Transport for London
 The London Low Emission Zone Nick Fairholme Head of the LEZ Transport for London An introduction to the LEZ. Air Quality in London Air pollution is a serious problem in London - 1,000 premature deaths
Florida Courts E-Filing Authority Board. Service Desk Report December 2018
 Florida Courts E-Filing Authority Board Service Desk Report December 218 Customer Service Incidents December 218 Status October 218 November 218 December 218 Incidents Received 3,779 2,632 2,376 Incidents
FHWA/IN/JTRP-2000/23. Final Report. Sedat Gulen John Nagle John Weaver Victor Gallivan
 FHWA/IN/JTRP-2000/23 Final Report DETERMINATION OF PRACTICAL ESALS PER TRUCK VALUES ON INDIANA ROADS Sedat Gulen John Nagle John Weaver Victor Gallivan December 2000 Final Report FHWA/IN/JTRP-2000/23 DETERMINATION
THE PARTNERSHIP OF RAIL & COAL MOVING AHEAD 2014 RMCMI ANNUAL MEETING SEPTEMBER 19, 2014
 THE PARTNERSHIP OF RAIL & COAL MOVING AHEAD 2014 RMCMI ANNUAL MEETING SEPTEMBER 19, 2014 1 BNSF is a Leading U.S. Railroad A Berkshire Hathaway company 32,500 route miles in 28 states and two Canadian
RIDERSHIP TRENDS. July 2018
 RIDERSHIP TRENDS July Prepared by the Division of Strategic Capital Planning September Table of Contents Executive Summary...1 Ridership...3 Estimated Passenger Trips by Line...3 Estimated Passenger Trips
RIDERSHIP TRENDS. April 2018
 RIDERSHIP TRENDS April Prepared by the Division of Strategic Capital Planning June Table of Contents Executive Summary...1 Ridership...3 Estimated Passenger Trips by Line...3 Estimated Passenger Trips
NJ Solar Market Update As of 2/29/16
 NJ Solar Market Update As of 2/29/16 Prepared by Charlie Garrison March 24, 2016 SOLAR INSTALLED CAPACITY DATA The installed solar capacity as of 2/29/16 is approximately 1,644.3 MW. Approximately 20.3
Journey into quality for traffic monitoring equipment. Short session monitoring operations
 Journey into quality for traffic monitoring equipment Short session monitoring operations Introduction Quality assurance/quality control for short session portable equipment. Historically, quality assurance/quality
ITSMR Research Note. Motorcyclists and Impaired Driving ABSTRACT INTRODUCTION KEY FINDINGS. September 2013
 September 2013 KEY FINDINGS F&PI CRASHES INVOLVING IMPAIRED MOTORCYCLISTS 27% of the fatal MC crashes over the five year period, 2008-2012, were alcohol-related. 48% of the alcohol-related F&PI MC crashes
Expansion Projects Description
 Expansion Projects Description The Turnpike expansion program was authorized by the Florida Legislature in 1990 to meet the State s backlog of needed highway facilities. The Legislature set environmental
FOR IMMEDIATE RELEASE
 Article No. 6928 Available on www.roymorgan.com Roy Morgan Unemployment Profile Wednesday, 17 August 2016 Australian real unemployment jumps to 10.5% (up 0.9%) in July during post-election uncertainty
ENERGY SLIDESHOW. Federal Reserve Bank of Dallas
 ENERGY SLIDESHOW Updated: January 16, 2019 ENERGY PRICES www.dallasfed.org/research/energy Brent & WTI & Crude Brent Oil Crude Oil Dollars per barrel 140 120 100 Brent (Jan 11 = $58.64) WTI (Jan 11 = $50.78)
Michigan. Traffic. Profile
 June 2014 Revised 5/11/15 Michigan 2013 Traffic Crash Profile Reporting Criteria Please pay particular attention to the wording when interpreting the three levels of data gathered for this report. Crash
Design Criteria Data
 MINNEAPOLIS-ST PAUL MN Latitude = 44.88 N WMO No. 72658 Longitude = 93.22 W Elevation = 837 feet Period of Record = 1973 to 1996 Average Pressure = 29.7 inches Hg Design Criteria Data Mean Coincident (Average)
ANCR CRU Statistics Februa.. to December 2007
 ANCR CRU Statistics Februa.. to December 2007 Jan/07 Feb/07* Mar/07 Apr/07 May/07 Jun/07 Jul/07 Aug/07 Sep/07 Oct/07 Nov/07 Dec/07 Total notes Answered dato from Perimeter phone system unavailable prior
Data Current Through: February, Seattle (All Areas) RESIDENTIAL & CONDOMINIUM. Active, Pending, & Months Supply of Inventory 1,
 RESIDENTIAL & CONDOMINIUM. Active, Pending, & Months Supply of Inventory 1,") February, 2017 MTD MARKET UPDATE Data Current Through: February, 2017 Active, Pending, & Months Supply of Inventory 4,000 3,500 3,650 3,555 6.9 3,297 Active Listings at End of Month Pending Sales MTD 8
February, 2017 MTD MARKET UPDATE Data Current Through: February, 2017 Active, Pending, & Months Supply of Inventory 4,000 3,500 3,650 3,555 6.9 3,297 Active Listings at End of Month Pending Sales MTD 8
1. Trends in the current fiscal year and previous fiscal year 3. Business overview 2. Secular trends in first quarter financial results
 FY2/19 (March 2018~May 2018) Fact Book 1. Trends in the current fiscal year and previous fiscal year 3. Business overview (1) Performance overview P. 1 (1) No. of students at the end of month P. 6 (2)
Industry Overview. Powersports Market Update
 2017 Q1 Industry Overview Powersports Market Update Sport side-by-sides continue to lead led the powersports industry, with that segment s pricing once again averaging higher than any of the previous three
Annual Statistical Report
 Metro Area Motorist Assist Program Annual Statistical Report January - December Metro Area Motorist Assist Program Annual Statistical Report Table of Contents i. Introduction... i-iii ii. Report Maps...
Design Criteria Data
 DULUTH MN Latitude = 46.83 N WMO No. 72745 Longitude = 92.18 W Elevation = 1417 feet Period of Record = 1973 to 1996 Average Pressure = 28.43 inches Hg Design Criteria Data Mean Coincident (Average) Values
The Peoples Gas Light and Coke Company
 History of Gas Charges Due to the Operation of Rider 2 (Cents per Therm) Factors for Transportation Customers (Riders FST, SST, P, CFY and AGG) Non- Total Standby Standby Aggregation Commodity Commodity
Utah Fatal Crash Summary 2014
 Utah Fatal Crash Summary 1 State of Utah Department of Public Safety Highway Safety Office W Amelia Earhart Dr # Salt Lake City, UT 8116 81-366-6 www.highwaysafety.utah.gov Preliminary Totals as of 1/29/
August 2018 MLS Statistical Report
 January February March April May June July August Septem October Novem Decem August 218 MLS Statistical Report Total Sales Overall, sales are down 3%; however, total volume sold is up 7% and Median Sale
NEU Electric and Natural Gas Price Update
 Exelon s $24 Billion Energy Bill Senate Bill 2814 Short-Term Energy Price Outlook On November 15, 2016, Exelon, through its legislative supporters, introduced Senate Bill 2814, a massive 446 page document
Provisional Review of Fatal Collisions. January to December 31 st 2017
 Provisional Review of Fatal Collisions January to December 31 st 17 2 nd January 18 Review of 17 fatal collision statistics as of 31st December 17 Overview This report summarises the main trends in road
TRAFFIC VOLUME TRENDS
 Page 1 U. S. Department Transportation Federal Highway Administration Office Highway Policy Information TRAFFIC VOLUME TRENDS September Travel on all roads and streets changed by +2.5 (5.8 billion vehicle
Price Category Breakdown - February 2010
 SINGLE FAMILY RESIDENTIAL BREAKDOWN ruary 21 ruary Sales and Average Price Increase Annually TORONTO - Wednesday, March 3, 21 7.3 % 24.6 % 1.8 % 7.3%.2%.1 % Greater Toronto REALTORS reported 7,291 sales
Design Criteria Data
 OKLAHOMA CITY OK Latitude = 35.4 N WMO No. 72353 Longitude = 97.6 W Elevation = 133 feet Period of Record = 1973 to 1996 Average Pressure = 28.62 inches Hg Design Criteria Data Mean Coincident (Average)
Climatography of the United States No
 Climate Division: CA 5 NWS Call Sign: Month (1) Min (2) Month(1) Extremes Lowest (2) Temperature ( F) Lowest Month(1) Degree s (1) Base Temp 65 Heating Cooling 100 Number of s (3) Jan 45.9 26.0 36.0 67
Macau Visitor Arrivals. Visitors Inflow ( YTD)
") Macau Visitor Arrivals Macau Inflow 21 YOY Change 211 YOY Change 212 YOY Change Jan 2,46,556 6.8% 2,76,64 1.4% 2,461,64 18.6% Feb 2,57,566 24.4% 2,164,249 5.2% 2,13,977 1.5% Mar 2,11,99 6.7% 2,19,865 8.9%
Macau Visitor Arrivals Macau Inflow 21 YOY Change 211 YOY Change 212 YOY Change Jan 2,46,556 6.8% 2,76,64 1.4% 2,461,64 18.6% Feb 2,57,566 24.4% 2,164,249 5.2% 2,13,977 1.5% Mar 2,11,99 6.7% 2,19,865 8.9%
Michigan. Traffic. Profile
 June 2014 Revised 5/11/15 Michigan 2013 Traffic Crash Profile Reporting Criteria Please pay particular attention to the wording when interpreting the three levels of data gathered for this report. Crash
DRAFT. Total Month Average Point (MAP) A Massage 4/30/2014 8/1/2015 A CENTER E
 A Massage 4/30/2014 8/1/2015 A CENTER E") Total Month Average Point (MAP) A Massage 4/30/2014 8/1/2015 A CENTER E 2.25 2.00 2.00 2.25 2.00 2.00 1.00 2.25 2.00 2.25 2.00 A Massage 10/31/2017 9/1/2015 B MEZZANINE 2.25 2.00 2.00 2.25 2.25 2.25 2.25
Total Month Average Point (MAP) A Massage 4/30/2014 8/1/2015 A CENTER E 2.25 2.00 2.00 2.25 2.00 2.00 1.00 2.25 2.00 2.25 2.00 A Massage 10/31/2017 9/1/2015 B MEZZANINE 2.25 2.00 2.00 2.25 2.25 2.25 2.25
Van Ness Transit Corridor Improvement Project. Engineering, Maintenance and Safety Committee March 25, 2015
 Van Ness Transit Corridor Improvement Project Engineering, Maintenance and Safety Committee March 25, 2015 Project Need 16,000 daily passenger boardings within the project corridor Average bus speed 8
Design Criteria Data
 MEDFORD/JACKSON CO. OR Latitude = 42.37 N WMO No. 72597 Longitude =122.8 W Elevation = 1329 feet Period of Record = 1973 to 1996 Average Pressure = 28.61 inches Hg Design Criteria Data Mean Coincident
PDR Energy Baseline Alternative. Proposal for Discussion October 27, 2015
 PDR Energy Baseline Alternative Proposal for Discussion October 27, 2015 Update Since Last Meeting Since the October 12 th Working Group Meeting Stem, Solar City, AMS and CESA have had over a half-dozen
STOR Market Information Report TR27
 STOR Market Information Report TR27 Original Published 2 nd October 215. Update published 3 th October 215 minor volume corrections Foreword Welcome to the TR27 Market Information Report. It was good to
Daily Trends and Source Apportionment of Ultrafine Particulate Mass (PM 0.1 ) Over an Annual Cycle in a Typical California City
 Over an Annual Cycle in a Typical California City") Daily Trends and Source Apportionment of Ultrafine Particulate Mass (PM 0.1 ) Over an Annual Cycle in a Typical California City Toshihiro Kuwayama, Chris R. Ruehl, and Michael J. Kleeman* Department of
Daily Trends and Source Apportionment of Ultrafine Particulate Mass (PM 0.1 ) Over an Annual Cycle in a Typical California City Toshihiro Kuwayama, Chris R. Ruehl, and Michael J. Kleeman* Department of
OPERATIONS TOTALS ,135 7,511 8,823 8,056 8,021 8,319 8,039 8,283 8,001 8,738 8,219 8,094 98,239
 2007 OPERATIONS AIRCRAFT OPS-2006 JAN FEB MAR APR MAY JUN JUL AUG SEP OCT NOV DEC TOTAL AIR CARRIER - ITINERANT 748 725 907 804 930 969 832 996 841 899 990 1,249 10,890 AIR TAXI - ITINERANT 3,744 3,638
Impact of Overweight Traffic on Pavement Life Using WIM Data and Mechanistic- Empirical Pavement Analysis
 Impact of Overweight Traffic on Pavement Life Using WIM Data and Mechanistic- Empirical Pavement Analysis HAO WANG, PhD, Assistant Professor JINGNAN ZHAO and ZILONG WANG, Graduate Research Assistant RUTGERS,
Design Criteria Data
 DES MOINES IA Latitude = 41.53 N WMO No. 72546 Longitude = 93.65 W Elevation = 965 feet Period of Record = 1973 to 1996 Average Pressure = 28.96 inches Hg Design Criteria Data Mean Coincident (Average)