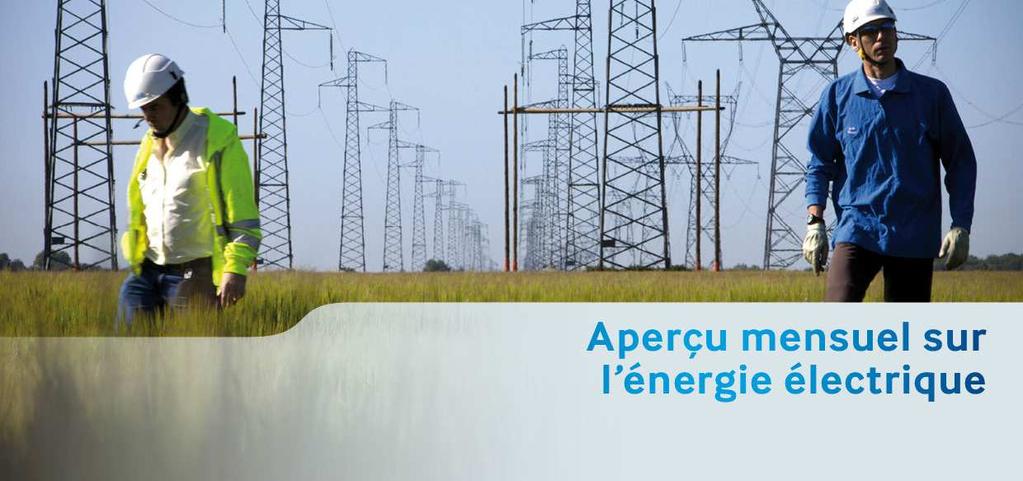
Monthly Electrical Energy Overview January 2017
|
|
|
- Allison Lester
- 6 years ago
- Views:
Transcription


1 uary 217

2 Monthly Electrical Energy Overview uary 217 The cold spell of uary 217 caused a strong increase in gross electricity demand (+.3%) compared to uary 2. The French exchange balance was in favour of imports for the second consecutive month. Demand recorded a peak on 2/1/217 at 94.2 GW. It is the highest peak since ruary 2. Corrected electricity demand trend stabilised in uary 217. Fossil fuel thermal generation was 8.3 TWh up by 71% compared to uary 2. Solar production grew significantly compared to last year with a 37.7% increase. The regions whose gross electricity demand increased the strongest as a result of the cold spell in uary, were Occitanie, Nouvelle-Aquitaine and Bourgogne-Franche-Comté. French prices were at their highest since ruary 2. The balance of exchanges was in favour of imports for the second consecutive month with a total of.95 Twh of electricity imported. 4 new installations went into service in uary 217. Monthly Overview - uary 217 2
3 Monthly Electrical Energy Overview uary 217 DEMAND Gross demand increased by.3% compared to uary 2, due to the cold spell that persisted in the month. This cold spell triggered a demand peak on 2/1/217 at 94.2 GW, the highest since 2. Demand corrected for weather vagaries, which was moving slightly downwards since ember 2, stabilised in uary 217. The increase in demand by large industry seen since September 2 slowed a little in uary 217. GENERATION Fossil fuel thermal generation has increased constantly since May 2. It reached a new record level since ruary 2 at 8.3 TWh. At the same time, hydraulic production fell by 8.1%. Nuclear generation fell only by 2.6% compared with uary 2. WIND AND SOLAR Since wind conditions were not favourable enough for wind generation, it again fell by 29% compared to uary 2. Solar generation increased significantly by nearly 38%. TERRITORIES AND REGIONS The regions of Occitanie and Nouvelle-Aquitaine were those which increased more significantly their gross demand in comparison to uary 2 with respectively +21% and 19%. The most important increase were for the regions for which the difference of temperature compared to uary 2 were better than 4 C. Grand-Est and Auvergne-Rhône- Alpes managed to moderate the increase in their demand compared to the drop record in temperatures that they suffered. ELECTRICITY MARKETS Prices are very high in most countries, in particular during the cold spell which affected Europe in the third and fourth weeks of the month. It reached 78/MWh as the monthly average in France, but also exceeded 7/MWh in Italy, Belgium, Spain, Slovenia and Portugal. The reduced availability of the nuclear base in France but also in Germany, the poor wind conditions and the increase in gas and coal prices were also factors contributing to the price increases. INTERNATIONAL EXCHANGES The balance of exchanges was in favour of imports for the second consecutive month and reached a new record with a total of.95 TWh of electricity imported. 5 hourly points were in favour of imports which is an historic record. Since ember 2, the export balance for France has become increasingly in favour of imports with respect to Great Britain. The balance became in favour of imports with Spain for the first time since il 2. In terms of physical exchanges, this was the highest import balance since uary 198. NEW INSTALLATIONS The purpose of the 4 installations commissioned in uary 217 was firstly to increase and secure the power supply in the territories in question and secondly, to connect a customer distributor. Monthly Overview - uary 217 3
4 Monthly electrical energy overview uary 217 Monthly energy consumption 7 6 Monthly gross consumption % 1% Trend by sector in sliding year adjusted from the climate effect % % -1% -,1%,% -,5% 1-1% May- - Jul- - Period 2- Period 2-17 Sep- Oct- - Dec % May- - Jul- - Sep- Oct- Adjusted national consumption Direct RTE customers * Adjusted consumption on PDN - Dec- -17 *without energy sector Peak consumption* uary GW Gross monthly consumption at the peak and actual temperature 94,2 GW C ma 1 je 3 sa 5 lu 7 me 9 ve 11 di ma je 17 sa 19 lu 21 me 23 ve 25 di 27 ma 29 Deviation from norm ( C) Gross consumption : daily peak (GW) Actual temperature -1 GW 11 1 Evolution of monthly power extrema,1 GW 94,2 GW ,7 GW ,5 GW Max power Min Power Absolute max Absolute min * Perimeter France excl. Corsica, losses included Monthly Overview - uary 217 4

5 Monthly electricical energy overview uary 217 Installed capacity (MW) uary 217 Energy generated () uary 217 Hydro-electric Nuclear 63 Conventional Thermal Hydro-electric 5 25 Conventional Thermal Other RES 797 Solar 366 Other RES Solar Wind Wind Nuclear Focus on generation sectors Nuclear generation Hydro-electric generation May Jul Sep Oct Dec May Jul Sep Oct Dec Period 2- Period 2-17 Period 2- Period 2-17 Fossil-fuel thermal generation RES generation excl. hydro-electric May Jul Sep Oct Dec May Jul Sep Oct Dec Period 2- Period 2-17 Period 2- Period 2-17 Monthly Overview - uary 217 5
 11,5% 6% 7,% 5% 5 846 4% 4 677 1,% 3% 2% 1% % 1-janv. 3-janv.")
6 Monthly electrical energy overview uary 217 Monthly generation Wind generation Photovoltaic generation May Jul Sep Oct Dec May Jul Sep Oct Dec Period 2- Period 2-17 Period 2- Period % 7% Load factor of wind generation uary 217 MW ,% Rate of coverage of consumption by wind generation (%) 11,5% 6% 7,% 5% % ,% 3% 2% 1% % 1-janv. 3-janv. 5-janv. 7-janv. 9-janv. 11-janv. -janv. -janv. 17-janv. 19-janv. 21-janv. 23-janv. 25-janv. 27-janv. 29-janv. Mean load factor by half-hour interval (%) and associated power Mean monthly load factor (%) and associated power 31-janv ,%,% May Jul Sep Oct Dec May Jul Sep Oct Dec May Jul Sep Oct Dec May Jul Sep Oct Dec May Jul Sep Oct Dec 17 Average value Maximal value Minimal value 3,5%,3% Fleet development in France Planned fleet on the PTN MW 1 Development of generating fleets in France** Technology Installed capacity* at 31/1/17 Queued projects * Nb Cumulative power Projects in preparation* Nb Cumulative power Wind of which Offshore 661 MW 3 MW 2211 MW MW MW MW 1 May 1 Sep 1 11 May 11 Sep 11 May Sep May Sep May Sep May Sep May Sep Photovoltaic 571 MW 4 11 MW 3 58 MW Wind farm Solar photovoltaic * Refer to glossary for category definitions Wind capacity awaiting connection at Enedis as of 31//2: MW ** data available up to December 2 Solar capacity awaiting connection at Enedis as of 31//2: 2 89 MW Monthly Overview - uary 217 6


7 Aperçu Monthly mensuel electrical sur l'énergie energy électrique overview Septembre uary Distribution of regional generation Distribution of regional consumption Impact of the cold spell of uary 217 on gross regional demand Demand of the regions of the South of France increased the most During uary 217, all regions felt a cold spell with difference temperatures compared to uary between -2 C and -6 C. The increase in regional demand varies from 8% to 21%. It's worth noting that the regions that suffered the most important drop in temperatures, Grand-Est and Auvergne-Rhône-Alpes, are not those that had the strongest increase in their demand. It seems then, that eco-citizen gestures have been more applied in these regions. Monthly Overview - uary

8 Monthly electrical energy overview uary 217 Spot prices in Europe Monthly average value Actuality of ket mechanisms 78, Price( /MWh) Spread direction price > FR price price < FR price 61,37 31,29 29,9 31,93 3,26 31, 33,99 33,55 5,77 37, 52,37 72,65 Very frequent price peaks in France in uary The hourly French price exceeded 1/MWh 1 times in the month (almost always between 8. and 2.), including times between and 26 uary, the most difficult period in the French market. These peaks are more frequent but lower than in the last quarter of 2: the hourly price reached a maximum of 26 /MWh on Wednesday 25 uary between 8. and , 71,52 71,49 76,8 78,19 73,87 61,36 58,97 61,36 62,91 /MWh Daily average value evolution of the spot prices during the month Moyenne sur le mois Belgium Netherland France Germany/Austrich Great Britain Spain Italia (north) Monthly Overview - uary 217 8

9 Monthly electrical energy overview uary 217 Commercial exchanges uary 217 MW Daily extrema of the export balance EXPORT : IMPORT : BALANCE : Monthly exchange balances on each border 3 With CWE zone With Great Britain 25 With Switzerland feb mar apr may jun jul aug sep oct nov dec jan feb mar apr may jun jul aug sep oct nov dec jan With Italy With Spain feb mar apr may jun jul aug sep oct 1/1 1/2 1/3 1/4 1/5 1/6 1/7 1/8 1/9 1/1 1/11 1/ 1/ 1/ 1/ 1/ 1/17 1/18 1/19 1/2 1/21 1/22 1/23 1/24 1/25 1/26 1/27 1/28 1/29 1/3 1/31 nov dec jan feb mar apr may jun jul aug sep oct nov dec jan feb mar apr may jun jul aug sep oct nov dec jan Minimal balance Maximal blance The energy values described correspond to contracted exchanges on Euronext. Monthly Overview - uary 217 9
 Partial burial of cables as part")
 connection of a distributor customer Overhead line Underground line Substation 63 to kv Monthly Overview - uary")
10 Monthly electrical energy overview uary kv underground cable Remise - Trie-Château Oise (6) Strengthening of the electricity supply of the Trie-Château substation 225 kv overhead-underground line Plessis-Gassot - Villiers-Le-Bel Val d'oise (95) Partial burial of cables as part of the reconstruction of the 225 kv substation of Villiers-le-Bel 63 kv substation 63 kv underground cable Messimy-Nemoz Messimy-Nemoz - Piquage à Chaponost Rhône (69) connection of a distributor customer Overhead line Underground line Substation 63 to kv Monthly Overview - uary 217 1


.")
11 Nb Puissance cumulée Nb Puissance cumulée 21 MW MW 42% 8% 238 MW 1 3 MW Monthly electrical energy overview uary 217 Data sources This document relies on metered data collected by RTE and also on data sent by the french DSOs, especially erdf and EDF SEI. Monthly gross consumption Perimeter : France with Corsica, losses included Gross national demands and actual temperatures Daily peak for perimeter France excl. Corsica For more information on how actual temperatures and reference temperatures are calculated, visit RTE's website: Extreme capacity value trend Max/Min Power: Maximum/minimum power consumption in France over the month, excluding Corsica Absolute extreme value: Extreme value for consumption observed since 1st uary 28 Trend by sector in sliding year adjusted from the climate effect Total consumption: Consumption of France, with Corsica, losses included. Adjusted from climate effect. Adjusted consumption on PDN: Represents the consumption of resditential and SMEs/SMIs sector. Data adjusted from weather effect. Direct RTE customers : Industrial sites connected directly to the PTN (excluding consumption at source). Energy sector is excluded Trend in sliding year : growth between the last cumulative monthly values and the previous Generation The "Hydro-electric" category includes all types of hydro plants (impoundment, run-of-river, etc.). Consumption for pumping by pumped storage facilities is not deducted from generation. The "Nuclear" category includes all nuclear units. Consumption by auxiliary units is deducted from generation. The "Fossil-fuel thermal" category includes Coal, Oil and Gas-fired technologies. The "Other RES" category includes PV solar, Biomass, Biogas and paper/card waste. The installed capacity values are valid for the end of the month, with the exception of the "Other RES" category, which is valid for the start of the month. Wind Generation Load factor : Ratio of wind power generated to nominal installed wind capacity Coverage of demand Coverage rate : Ratio of wind power generated to gros national consumption at a given time Puissance Filière installée Eolien 361 MW 22 dont Offshore Photovoltaïque 24 MW 9 Projets en file Projets en d'attente préparation Generation Wind: onshore and offshore wind projects. The share of offshore capacity is indicated in the row below Installed capacity: Cumulative capacity of installations for which a connection agreement has been signed. Queued projects: Projects which have entered the connection queue under RTE's connection procedure, i.e. projects which have signed a "queuing proposal" with RTE, following a detailed connection study or a "technical and financial proposal". Projects in preparation: Connection projects for which RTE has been asked to provide a detailed study or technical and financial proposal, currently being examined by RTE, or for which the Prices in Europe Monthly average of spot prices in the different price zones of the coupled area. France is always represented in white, the other areas are coloured based on the difference in price compared with France (blue: lower price, red: higher price, the deeper the colour, the greater the difference). Glossary Spot price: Wholesale price of electricity, determined by the power exchanges the day before for delivery the following day, for each hour of the day. Spread : Price differential between two price areas (here between each price area and France). Price area: Geographic area inside which the electricity price is identical and where exchanges are done with no allocation of capacity. A price area may combine several countries (for example: Germany, Austria, Luxembourg) and a country may be subdivided into more than one price area (for example: Italy, Norway). Daily spot price changes Change of the spot price in France and in the coupled neighbouring regions, over a month in daily average, (NB: for Italy the price of the northern area is shown, for Nordic countries the average of the areas displayed on the map is shown). Daily extrema : International exchanges Extrema of the half hour mean power value of the global international commercial exchanges, observed daily. Type of installation Name of installation (or substation) Département Nature of work Monthly Overview - uary


12
Monthly Electrical Energy Overview
 Monthly Electrical Energy Overview February 218 February 218 Monthly Electrical Energy Overview February 218 February 218 was characterised by extremely low temperatures, 3.5 C below normal, and consequently
Monthly Electrical Energy Overview January 2018
 January 218 Monthly Electrical Energy Overview January 218 January 218 was marked both by a very strong fall in gross demand and by significant hydraulic and wind generation because of the weather conditions.
Monthly Electrical Energy Overview January 2015
 uary 215 Monthly Electrical Energy Overview uary 215 The return to close to normal weather conditions, as opposed to the exceptionally warm uary 214, led to a rise in gross internal electricity demand.
Monthly Electrical Energy Overview May 2015
 215 Monthly Electrical Energy Overview 215 Launch of Central West Europe zone (CWE) Flow-Based market coupling on 2 -the threshold of 5, MW of exchange capacity was exceeded on 22. Fossil fuel thermal
Monthly Electrical Energy Overview
 Monthly Electrical Energy Overview il 218 Monthly Electrical Energy Overview il 218 il 218 was characterised by very mild temperatures during almost the whole of the month, 2.3 C above those of il 217,
Monthly Electrical Energy Overview March 2014
 ch 214 Monthly Electrical Energy Overview ch 214 ch marked the end of one of the mildest winters for electricity consumption since the winter of 24 25. The demand trend for SMIs / SMEs has moved from growth
Monthly Electrical Energy Overview June 2016
 e 216 Monthly Electrical Energy Overview e 216 Moderate national demand and a good level of hydraulic generation allowed France to achieve a significant export balance. Corrected for weather effects, total
Monthly Electrical Energy Overview January 2014
 uary 214 Monthly Electrical Energy Overview uary 214 In uary 214, particularly warm temperatures during that period led to a strong drop in national consumption and a high monthly level of exchanges. In
Monthly Electrical Energy Overview March 2015
 ch 215 Monthly Electrical Energy Overview ch 215 Temperatures in ch remained close to the reference temperatures leading to an increase in demand of 5%. Corrected for the climate uncertainty and continuing
Monthly Electrical Energy Overview April 2015
 il 215 Monthly Electrical Energy Overview il 215 Temperatures in il 215 were milder than the reference temperatures (+.6 C), and are close to those noted in il 214. It was noted that demand, generation
Monthly Electrical Energy Overview March 2018
 March 218 Monthly Electrical Energy Overview March 218 March was marked by a sharp fall in average temperatures (-3.1 C compared to last year), which led to an increase in electricity demand. Electricity
Monthly Electrical Energy Overview
 Monthly Electrical Energy Overview 218 Monthly Electrical Energy Overview 218 Moderate domestic demand and a good level of hydraulic generation enabled France to reach its highest export balance since
Monthly Electrical Energy Overview January 2016
 uary 216 Monthly Electrical Energy Overview uary 216 Thanks to good weather conditions, two new records were achieved in uary: that of the highest monthly level of wind generation and the highest monthly
Monthly Electrical Energy Overview April 2016
 il 216 Monthly Electrical Energy Overview il 216 Anincreasein gross consumption is observed on april, for the second consecutive month, because of lower temperatures. The difference in temperature is reflected
Monthly Electrical Energy Overview
 Monthly Electrical Energy Overview Monthly Electrical Energy Overview The weather conditions in led to an increase in renewable generation compared to October 217. Gross demand increased by 1.1% compared
Monthly Electrical Energy Overview November 2017
 November 217 Monthly Electrical Energy Overview November 217 Monthly gross domestic demand fell by 1.1% compared to November 216, due to below-normal temperatures. The monthly trade balance was in favour
Monthly Electrical Energy Overview October 2017
 October 217 Monthly Electrical Energy Overview October 217 Monthly gross domestic demand fell by 5.2% compared to October 216, due to above-normal temperatures. The monthly trade balance was in favour
Monthly Electrical Energy Overview
 Monthly Electrical Energy Overview December 217 December 217 Monthly Electrical Energy Overview December 217 The weather in December 217 experienced rainfall and three winter storms. Wind generation reached
Monthly Electrical Energy Overview July & August 2017
 July & August 217 Monthly Electrical Energy Overview July & August 217 Demand was stable compared to July and August 216. The average temperatures were close to those of 216:+.3 C in July and -.6 C in
Monthly Electrical Energy Overview July and August 2018
 July and August 218 Monthly Electrical Energy Overview July and August 218 Heatwave conditions in July and August led to an increase in demand compared to the same period of 217. The sunshine has led to
Monthly Electrical Energy Overview December 2016
 December 216 Monthly Electrical Energy Overview December 216 Demand in December 216 was higher by more than 13% compared to December 215, due to the significantly lower temperatures. The balance of exchanges
Monthly Electrical Energy Overview
 Monthly Electrical Energy Overview Monthly Electrical Energy Overview Electricity demand totalled 47.6 TWh (+3.7 TWh compared to the previous month) due in particular to average temperatures that were
Monthly Electrical Energy Overview October 2014
 ober 214 Monthly Electrical Energy Overview ober 214 Interconnections were particularly called upon during ober, for imports and exports alike. High temperatures led to relatively moderate demand for a
Monthly Electrical Energy Overview October 2015
 ober 215 Monthly Electrical Energy Overview ober 215 ober saw an increase in demand as a result of temperatures that were well below seasonal averages. To meet this demand thermal production was required,
MANAGING CRITICAL GRID SITUATIONS A MARKET ANALYSIS
 MANAGING CRITICAL GRID SITUATIONS A MARKET ANALYSIS MARKET ANALYSIS ANNEX TO THE ENTSO-E MAY 217 REPORT ON MANAGING CRITICAL GRID SITUATIONS: SUCCESS AND CHALLENGES NOVEMBER 217 European Network of Transmission
Commercial-in-Confidence Ashton Old Baths Financial Model - Detailed Cashflow
 Year 0 1 2 3 4 5 6 7 8 9 10 11 12 13 Oct-16 Nov-16 Dec-16 Jan-17 Feb-17 Mar-17 Apr-17 May-17 Jun-17 Jul-17 Aug-17 Sep-17 Oct-17 2,038 2,922 4,089 4,349 6,256 7,124 8,885 8,885 8,885 8,885 8,885 8,885 9,107
Security of Supply. on the European Electricity Market
 Security of Supply on the European Electricity Market What is Security of Supply? A reliable supply of energy Reliable transportation of supply Reliable distribution and delivery of supply to the final
EUROPEAN ENERGY MASTER CLASS
 EUROPEAN ENERGY MASTER CLASS Energy & Risk Management Services Matthew Osborne Principal Risk Manager Frans La Grand European Manager OUR PAN-EUROPEAN CAPABILITY Whilst most European markets are now liberalised,
D G A G R I D A S H B O A R D : T O M A T O E S Last update: EU AVG PRICES
 tonnes Weightedaverages by volume of production per MS Ongoing adjustments on weights by variety group 000 tonnes D G A G R I D A S H B O A R D : T O M A T O E S Last update: 20.04.2018 EU AVG PRICES MS
Storage in the energy market
 Storage in the energy market Richard Green Energy Transitions 216, Trondheim 1 including The long-run impact of energy storage on prices and capacity Richard Green and Iain Staffell Imperial College Business
COMPARISON OF FIXED & VARIABLE RATES (25 YEARS) CHARTERED BANK ADMINISTERED INTEREST RATES - PRIME BUSINESS*
 CHARTERED BANK ADMINISTERED INTEREST RATES - PRIME BUSINESS*") COMPARISON OF FIXED & VARIABLE RATES (25 YEARS) 2 Fixed Rates Variable Rates For Internal Use Only. FIXED RATES OF THE PAST 25 YEARS AVERAGE RESIDENTIAL MORTGAGE LENDING RATE - 5 YEAR* (Per cent) Year
COMPARISON OF FIXED & VARIABLE RATES (25 YEARS) 2 Fixed Rates Variable Rates For Internal Use Only. FIXED RATES OF THE PAST 25 YEARS AVERAGE RESIDENTIAL MORTGAGE LENDING RATE - 5 YEAR* (Per cent) Year
COMPARISON OF FIXED & VARIABLE RATES (25 YEARS) CHARTERED BANK ADMINISTERED INTEREST RATES - PRIME BUSINESS*
 CHARTERED BANK ADMINISTERED INTEREST RATES - PRIME BUSINESS*") COMPARISON OF FIXED & VARIABLE RATES (25 YEARS) 2 Fixed Rates Variable Rates FIXED RATES OF THE PAST 25 YEARS AVERAGE RESIDENTIAL MORTGAGE LENDING RATE - 5 YEAR* (Per cent) Year Jan Feb Mar Apr May Jun
COMPARISON OF FIXED & VARIABLE RATES (25 YEARS) 2 Fixed Rates Variable Rates FIXED RATES OF THE PAST 25 YEARS AVERAGE RESIDENTIAL MORTGAGE LENDING RATE - 5 YEAR* (Per cent) Year Jan Feb Mar Apr May Jun
D G A G R I D A S H B O A R D : A P P L E S
 75 79 60 56 49 74 65 59 54 42 76 63 58 53 78 55 42 43 79 44 81 63 47 83 64 59 53 48 Sources: Eurostat, MSs notifications, DG Agri, Comext, Comtrade, GTA, ITC, AMI, Expert groups, Freshfel, Wapa. 89 68
Asahi World Environmental Forum 14 September Global trends in clean energy investment. Michael Liebreich Chief Executive
 Asahi World Environmental Forum 14 September 2010 Global trends in clean energy investment Michael Liebreich Chief Executive Bloomberg New Energy Finance, 2004-2010 Global total new investment in clean
Monthly Operating Report. September 2016
 Monthly Operating Report September 20 September overview» For the month of September 20 Contact recorded: Electricity, gas and steam sales of 819 GWh (September 2015: 821 GWh) Netback of $79.50/MWh (September
The impact of electric vehicle development on peak demand and the load curve under different scenarios of EV integration and recharging options
 The impact of electric vehicle development on peak demand and the load curve under different scenarios of EV integration and recharging options Electricity demand in France: a paradigm shift Electricity
Operational Overview. Operational Forum, 24 th March 2010
 Operational Overview Operational Forum, 24 th March 21 Weather Weather February 21 The cold weather continued throughout February with all but one day being colder than the 17-year seasonal normal CWV.
Monthly Operating Report. January 2019
 Monthly Operating Report January 2019 January overview For the month of January 2019» The Customer business recorded: Mass market electricity and gas sales of 281 GWh (January 20: 282 GWh) Mass market
MONTHLY PERFORMANCE DASHBOARD
 AUSTIN ENERGY MONTHLY PERFORMANCE DASHBOARD A report highlighting key Austin Energy metrics for ember FY 219 FINANCIAL HEALTH Standard and Poor s Bond Rating Austin Energy Rating AA AA Budget Based Revenues
Up and Down Months of the Stock Market
 Up and Down Months of the Stock Market 1926-2017 Positive years (66) in the stock market were not good all year long and losing years (24) were not losers throughout the year. Winning years produce losing
Table of Contents... i List of Tables... vi List of Figures... x List of Abbreviations... xiv
 Table of Contents Table of Contents Table of Contents... i List of Tables... vi List of Figures... x List of Abbreviations... xiv Introduction... 1 Operating Support Incentives... 1 Feed-in Tariffs...
Elia System and market overview 2010
 Elia System and market overview 2010 Table of contents I. System and grid management and market data 01 I.1 Energy balance on the Elia grid in 2010 01 I.2 Consumption recovers in Elia control area in 2010
Global Monthly February 2018
 Global Monthly February 18 3 1-year Treasury yields 1-year breakeven inflation rate 1 1 15 16 17 18 February 18 5 3 Global GDP growth Composite PMI (RHS) Index 56 5 5 1 5 1 13 1 15 16 17 18 3..5. 1.5 1.
December. Next release: 13 February Oct/Sep Nov/Oct Dec/Nov Janu19 January Febru13 February 2018 Oct/Sep Nov/Oct Dec/Nov 2017
 Oct/Sep Nov/Oct Dec/Nov 2017 19 Janu19 January 2018 13 Febru13 February 2018 Oct/Sep Nov/Oct Dec/Nov 2017 Next release: 13 February 2018 DecembDecember December TABLE OF CONTENTS Page Charts 1 Latest IEA
Gas & electricity - at a glance
 $/barrel /tco 2 e p/therm /MWh Gas & electricity - at a glance Week-on-Week Annual Gas Price Changes Short-term gas contracts jump Cold snap forecast for the first half of February, lifting demand Longer-dated
MONTHLY PERFORMANCE DASHBOARD
 AUSTIN ENERGY MARCH 21 MONTHLY PERFORMANCE DASHBOARD A report highlighting key Austin Energy metrics for uary FY 21 FINANCIAL HEALTH Standard and Poor s Bond Rating Current AA AA Budget Based Revenues
Economics of Integrating Renewables DAN HARMS MANAGER OF RATE, TECHNOLOGY & ENERGY POLICY SEPTEMBER 2017
 Economics of Integrating Renewables DAN HARMS MANAGER OF RATE, TECHNOLOGY & ENERGY POLICY SEPTEMBER 2017 Presentation Outline Understanding LPEA s expenses and what drives them Economics of net metering
MONTHLY PERFORMANCE DASHBOARD
 AUSTIN ENERGY JULY MONTHLY PERFORMANCE DASHBOARD A report highlighting key Austin Energy metrics for e FY FINANCIAL HEALTH Standard and Poor s Bond Rating Austin Energy Rating AA AA Budget Based Revenues
D G A G R I D A S H B O A R D : A P P L E S
 Sources: Eurostat, MSs notifications, DG Agri, Comext, Comtrade, GTA, ITC, AMI, Expert groups, Freshfel, Wapa. 000 tonnes 39 41 31 22 29 22 32 27 17 18 9 27 15 12 6 6 6 4 5 6 5 4 11 25 15 9 9 93 62 51
Large scale solar power plant in Nordic conditions. Antti Kosonen, Jero Ahola, Christian Breyer, Albert Albó
 Large scale solar power plant in Nordic conditions Antti Kosonen, Jero Ahola, Christian Breyer, Albert Albó 25.8.214 Finland Finland: Location: between latitudes of 6 7 Area: 338 435 km 2 Population: 5.4
Analysis and dashboards on GRTgaz transmission activity. May 2013
 Analysis and dashboards on GRTgaz transmission activity May 213 1 A total of 97 shippers at end May 213 789 delivery points to industrial customers at end May213, for contracted capacities of 993 GWh/day,
UK gas and electricity supplies. A review of the winter John Greasley and Simon Griew Commercial. UK Transmission
 UK gas and electricity supplies A review of the winter 2003-04 John Greasley and Simon Griew Commercial UK Transmission Agenda What were we saying before the winter? What happened in electricity? What
November. Next release: 19 January Sep/AugOct/Sep Nov/Oct Dec 14 December Janu 19 January 2018 Sep/AugOct/Sep Nov/Oct 2017
 Sep/AugOct/Sep Nov/Oct 2017 14 Dec 14 December 2017 19 Janu 19 January 2018 Sep/AugOct/Sep Nov/Oct 2017 Next release: 19 January 2018 NovembNovember November Monthly Oil Price Statistics TABLE OF CONTENTS
Conditions for making competition work in the Central European electricity market
 Conditions for making competition work in the Central European electricity market Dr. Reinhard HAAS Institute of Power Systems and Energy Economics, Vienna University of Technology 7th European IAEE conference,
MONTHLY PERFORMANCE DASHBOARD
 AUSTIN ENERGY MONTHLY PERFORMANCE DASHBOARD A report highlighting key Austin Energy metrics for uary FY 219 FINANCIAL HEALTH Standard and Poor s Bond Rating Austin Energy Rating AA AA Budget Based Revenues
Graph #1. Micro-Generation Generating Units in Alberta 20
 2, Graph #1. Micro-Generation Generating Units in Alberta 2 Cumulative # of Generating Units 1,9 1,8 1,7 1,6 1,5 1,4 1,3 1,2 1,1 1, 9 8 7 6 5 4 3 2 Number of MGG Units as of 216 Mar 31 Number of Solar
Growth cycles in Industrial production (IIP) (percentage deviation from trend*, seasonally adjusted) Jan-00 Aug-06 Sep-94. Dec-01.
 (percentage deviation from trend*, seasonally adjusted) Jan-00 Aug-06 Sep-94. Dec-01.") Chile The reference series The reference series used for constructing OECD Composite ing Indicator (CLI) for Chile is the index of production in total manufacturing, which is a proxy for the monthly index
Chile The reference series The reference series used for constructing OECD Composite ing Indicator (CLI) for Chile is the index of production in total manufacturing, which is a proxy for the monthly index
OECD unemployment rate stable at 5.5% in January 2018
 OECD unemployment rate stable at.% in January 2018 The OECD unemployment rate was stable at.% in January 2018. Across the OECD area, 34. million people were unemployed, 1.9 million more than in April 2008.
Steers Heifers Young Bulls Cows
 Deadweight Prices /100Kg (Including VAT) Steers Heifers Young Bulls Cows U3 U4 R3 R4 O3 O4 P+ 435.7 432.4 423.2 422.8 402.9 404.2 384.7 451.8 447.8 435.2 433.5 413.7 417.0 382.2 423.5 422.0 413.4 415.3
The Energy Market 2004
 The Energy Market 24 Electrical energy generated by Swedish nuclear power per inhabitant in 21 compared to other countries kwh/inhabitant 9 8 7 6 5 4 3 2 1 Sweden Belgium Finland France Slovakia Spain
The Electric Power System
 The Electric Power System - Sweden- Swedish Power System 1 2 Basic facts 2014 Area: 450 295 km 2 Population: 9.6 Million Number of electricity consumers: 5.3 Million Number of TSOs: 1 Number of DSOs: 170
September 2003 Industrial producer prices stable in euro-zone and EU15
 STAT/03/123 31 October 2003 September 2003 Industrial producer prices stable in euro-zone and EU15 The euro-zone 1 industrial producer price index 2 remained unchanged in September 2003 compared with the
Results of annual simulation
 2 x Vitosol 100-FM SVKF Total gross surface area:4,46 m² Azimuth: 0 Incl.: 30 160 Liters/Day 50 C Gas-fired boiler 26 kw Vitocell 100-B Vol : 250 l Results of annual simulation Installed collector power:
Monthly Report on the Electricity System
 September 218 Monthly Report on the Electricity System September 218 Monthly Report on the Electricity System page 5 The Focus of this month provides a summary of the analysis of the 217 statistical data
MARKET RATES UPDATE Paula Gold-Williams Cory Kuchinsky
 MARKET RATES UPDATE I N T R O D U C T I O N BY: Paula Gold-Williams President & Chief Executive Officer (CEO) P R E S E N T E D BY: Cory Kuchinsky Interim Vice President, Financial Services September 24,
Analysis and dashboards on GRTgaz transmission activity. August 2014
 Analysis and dashboards on GRTgaz transmission activity August 214 1 A total of 127 shippers at end August 214 774 delivery points to industrial customers at end August 214, for contracted capacities of
MONTHLY PERFORMANCE DASHBOARD
 AUSTIN ENERGY MAY MONTHLY PERFORMANCE DASHBOARD A report highlighting key Austin Energy metrics for ch FY FINANCIAL HEALTH Standard and Poor s Bond Rating Current AA Target AA Budget Based Revenues and
What is the Future of Competitive Markets? Some Fundamental Preliminaries and View from Events in the PJM Market
 What is the Future of Competitive Markets? Some Fundamental Preliminaries and View from Events in the PJM Market Paul M. Sotkiewicz, Ph.D President December 7, 2016 What are the ideal properties of competitive
Monthly Operating Report. February 2018
 Monthly Operating Report February 2018 February overview» For the month of February 2018 Contact recorded: Electricity and gas sales of 534 GWh (February 20: 551 GWh) Netback of $82.16/MWh (February 20:
The role of Transmission System Operator in Belgium and in Europe. Vlerick Alumni Event 26 January 2016
 The role of Transmission System Operator in Belgium and in Europe Vlerick Alumni Event 26 January 2016 Agenda Introduction Infrastructure management Controlling the system Developing the EU Market 1/25/2016
Northern European power system scenarios for EMPS 2010 to 2030
 Stefan Jaehnert Northern European power system scenarios for EMPS 21 to 23 Brukermøte Produksjonsplanlegging 22. Mai 213 1 Outline 1. Basic modelling assumption Northern Europe 2. 23 scenario development
Monthly Operating Report. December 2017
 Monthly Operating Report December 20 December overview» For the month of December 20 Contact recorded: Electricity and gas sales of 571 GWh (December 2016: 582 GWh) Netback of $79.23/MWh (December 2016:
STATISTICS BOTSWANA ELECTRICITY GENERATION & DISTRIBUTION 2016/2 STATS BRIEF, FIRST QUARTER Copyrights Statistics Botswana 2016
 2016/2 ELECTRICITY GENERATION & DISTRIBUTION STATS BRIEF, FIRST QUARTER 2016 Copyrights Statistics Botswana 2016 Statistics Botswana. Private Bag 0024 Botswana Tel: (267) 367 1300. Fax: (267) 395 2201.
ANCR CRU Statistics February 2007 to December 2007
 ANCR CRU Statistics February 2007 to December 2007 o Jan/07 Feb/07* Mar/07 Apr/07 May/07 Jun/07 Jul/07 Aug/07 Sep/07 Oct/07 Nov/07 Dec/07 Total notes data from Perimeter phone system unavailable prior
Committee for the Common Organisation of the Agricultural Market Market Situation for Sheep & Goat Meats 22 March 2018
 Committee for the Common Organisation of the Agricultural Market Market Situation for Sheep & Goat Meats 22 March 218 Production In ' tonnes carcase weight P R O D U C T I O N 297.4 114.8 8.9 67.1 51.3
Electricity Networks Inter-regional market co-ordination (Session 8)
") Electricity Networks Inter-regional market co-ordination (Session 8) Dennis Volk Electricity Analyst Electricity System Training Week, Bangkok, November 2013 Theoretical benefits of inter-regional approaches
Electricity Networks Inter-regional market co-ordination (Session 8) Dennis Volk Electricity Analyst Electricity System Training Week, Bangkok, November 2013 Theoretical benefits of inter-regional approaches
P r e s s R e l e a s e. June 2007
 PRESS EMBARGO FOR ALL DATA: 26 July 27, 8. A.M. (6. A.M. GMT) P r e s s NEW COMMERCIAL VEHICLE REGISTRATIONS June 27 European Union + EFTA Countries LCVs up to 3.5t Heavy Trucks over 16t 25, 3, 2, 15,
MONTHLY PERFORMANCE DASHBOARD
 AUSTIN ENERGY MONTHLY PERFORMANCE DASHBOARD A report highlighting key Austin Energy metrics FINANCIAL HEALTH Standard and Poor s Bond Rating Austin Energy Rating AA AA Budget Based Revenues and Expenses
NEU Electric and Natural Gas Price Update
 Exelon s $24 Billion Energy Bill Senate Bill 2814 Short-Term Energy Price Outlook On November 15, 2016, Exelon, through its legislative supporters, introduced Senate Bill 2814, a massive 446 page document
US Crude Oil Reshaping International Crude Oil Flows. Olivier Jakob,
 US Crude Oil Reshaping International Crude Oil Flows Olivier Jakob, ojakob@petromatrix.com www.petromatrix.com Claimer Petromatrix publishes since 2006 a daily market note on the oil markets Our reports
Montana Renewable Energy Association
 Montana Renewable Energy Association Mission & Focus areas: Education and Outreach Policy and Advocacy Industry Engagement www.montanarenewables.org SolSmart Solar Ready communities making process of going
Committee for the Common Organisation of the Agricultural Market Market Situation for Sheep & Goat Meats 21 Septembre 2017
 Committee for the Common Organisation of the Agricultural Market Market Situation for Sheep & Goat Meats 21 Septembre 217 Production P R O D U C T I O N In ' tonnes carcase weight 14.1 58.4 43.8 3.6 29.2
Residential Load Profiles
 Residential Load Profiles TABLE OF CONTENTS PAGE 1 BACKGROUND... 1 2 DATA COLLECTION AND ASSUMPTIONS... 1 3 ANALYSIS AND RESULTS... 2 3.1 Load Profiles... 2 3.2 Calculation of Monthly Electricity Bills...
NEW COMMERCIAL VEHICLE REGISTRATIONS EUROPEAN UNION 1. December 2018
 PRESS EMBARGO: NEW COMMERCIAL VEHICLE REGISTRATIONS EUROPEAN UNION 1 December 2018 Commercial vehicle registrations: +3.2% in 2018; 4.0% in December Total new commercial vehicles In December 2018, commercial
Excess capacities and competition
 Excess capacities and competition Reinhard HAAS Institute of Power Systems and Energy Economics, Vienna University of Technology Salzburg, September 2005 CONTENT: 1. Introduction: The European electricity
20 January Road Safety in Provisional results. Manuelle SALATHÉ Head of the French Road Safety Observatory (ONISR)
") 20 January 2014 Road Safety in 2013 Provisional results Manuelle SALATHÉ Head of the French Road Safety Observatory (ONISR) 1 Table of contents 1. Provisional results in 2013 2. Long trends 3. 10-year
20 January 2014 Road Safety in 2013 Provisional results Manuelle SALATHÉ Head of the French Road Safety Observatory (ONISR) 1 Table of contents 1. Provisional results in 2013 2. Long trends 3. 10-year
System Status Briefing
 System Status Briefing Phakamani Hadebe Interim Group Chief Executive 3 May 2018 Contents 1 Performance summary 2 Operational highlights 3 Generation performance 4 Distribution overview 5 Transmission
ELECTRICITY GENERATION AND DISTRIBUTION. Electricity Generation & Distribution Q2,
 Contact Statistician: Otsile Chelenyane Industry Statistics Unit Email: ochelenyane@statsbots.org.bw Tel: (+267) 367 1300; Ext. 333 ELECTRICITY GENERATION AND DISTRIBUTION Stats Brief, Quarter 2, 2018
Alfen acquires Elkamo in Finland A platform for expansion in the Nordics
 Alfen acquires Elkamo in Finland A platform for expansion in the Nordics 2 July 2018 Disclaimer This communication may include forward-looking statements. All statements other than statements of historical
NEW PASSENGER CAR REGISTRATIONS EUROPEAN UNION 1
 PRESS EMBARGO: 8.00 AM (7.00 AM GMT), 16 January 2019 NEW PASSENGER CAR REGISTRATIONS EUROPEAN UNION 1 Passenger car registrations: +0.1% in 2018; 8.4% in In 2018, the EU passenger car market declined
FOR IMMEDIATE RELEASE
 Article No. 7761 Available on www.roymorgan.com Roy Morgan Unemployment Profile Monday, 8 October 2018 Unemployment down to 9.4% in September off two-year high Australian employment has grown solidly over
Meridian Energy monthly operating report for December 2017
 Release Stock exchange listings: NZX (MEL) ASX (MEZ) Meridian Energy monthly operating report for December 217 Attached is Meridian Energy Limited's monthly operating report for the month of December 217.
LARGE SCALE GRID INTEGRATION OF RENEWABLE ENERGY IN INDIA September 2017
 LARGE SCALE GRID INTEGRATION OF RENEWABLE ENERGY IN INDIA September 2017 Challenges and Solutions for System Operations with high share of RE Chile Experience National Electric Coordinator (Chilean ISO)
Basics of the European Electricity Market Dr. Achim Ufert
 Winter Academy 2018 Trading, Sales and Financing in the European Energy Market and Industry Basics of the European Electricity Market Dr. Achim Ufert 1 Agenda Liberalisation of the Electricity Market Basic
NEW PASSENGER CAR REGISTRATIONS EUROPEAN UNION 1
 PRESS EMBARGO: 8.00 AM (6.00 AM GMT), 19 September 2018 NEW PASSENGER CAR REGISTRATIONS EUROPEAN UNION 1 Passenger car registrations: +6.1% eight months into 2018; +10.5% in July and +31.2% in August In
Operational Opportunities to Minimize Renewables Curtailments
 Operational Opportunities to Minimize Renewables Curtailments Clyde Loutan Principal, Renewable Energy Integration July 24, 2017 2017 CAISO - Public Page 1 Agenda Background Real-time control performance
The ISM Manufacturing Survey Points to Imminent Economic Recovery, Possibly in 2009 May 1, Chart 1
 Northern Trust Global Economic Research 50 South LaSalle Chicago, Illinois 3 northerntrust.com Asha G. Bangalore agb3@ntrs.com The ISM Manufacturing Survey Points to Imminent Economic Recovery, Possibly
Improving the integration of electricity networks: Prospects of the European Network of Transmission System Operators for Electricity (ENTSO-E)
") Improving the integration of electricity networks: Prospects of the European Network of Transmission System Operators for Electricity (ENTSO-E) 1. Context: ENTSO-E, 10/20/40 year views, network codes 2.
Improving the integration of electricity networks: Prospects of the European Network of Transmission System Operators for Electricity (ENTSO-E) 1. Context: ENTSO-E, 10/20/40 year views, network codes 2.
Operational Forum Meeting. Wednesday 12th December 2012, 10:30AM Radisson Grafton Hotel, 130 Tottenham Court Road, London.
 Operational Forum Meeting Wednesday 12th December 212, 1:3AM Radisson Grafton Hotel, 13 Tottenham Court Road, London. System Management Principles Statement System Management Principles Statement Compliance
WIM #29 was operational for the entire month of October Volume was computed using all monthly data.
 OCTOBER 2015 WIM Site Location WIM #29 is located on US 53 near Cotton in St Louis county. System Operation WIM #29 was operational for the entire month of October 2015. Volume was computed using all monthly