D G A G R I D A S H B O A R D : A P P L E S
|
|
|
- Arthur Jacobs
- 5 years ago
- Views:
Transcription


 Simple avg of 4 MSs (the 4 major")


1 Sources: Eurostat, MSs notifications, DG Agri, Comext, Comtrade, GTA, ITC, AMI, Expert groups, Freshfel, Wapa. 000 tonnes tonnes D G A G R I D A S H B O A R D : A P P L E S INDEX PRICES PROD. TRADE BALANCE EXPORT DIV. Last update: /100 kg EU AVG PRICES Apple prices in the EU ( /100kg=Euro cents/kg) Simple avg of 4 MSs (the 4 major producers) Current 2018/19 () 2017/18 Monthly 5 year MAX 66% upper line 5 year avg 66% lower line Monthly 5 year MIN Those "producer" prices are ex packaging station, sorted and packaged Aug Sep Oct Nov Dec Jan Feb Mar Apr May Jun Jul YEAR /100 kg Apple prices in Poland ( /100kg=Euro cents/kg) Current 2018/19 () 2017/18 Monthly 5 year MAX 66% upper line 5 year avg 66% lower line Monthly 5 year MIN MS PRICES Aug Sep Oct Nov Dec Jan Feb Mar Apr May Jun Jul YEAR 42 /100 kg Apple prices in Italy ( /100kg=Euro cents/kg) Current 2018/19 () 2017/18 Monthly 5 year MAX % upper line 5 year avg 66% lower line Monthly 5 year MIN Those "producer" prices are ex packaging station, sorted and packaged Aug Sep Oct Nov Dec Jan Feb Mar Apr May Jun Jul YEAR /100 kg Apple prices in France ( /100kg=Euro cents/kg) Current 2018/19 () 2017/ Monthly 5 year MAX 66% upper line year avg 66% lower line Monthly 5 year MIN Those "producer" prices are ex packaging station, sorted and packaged Aug Sep Oct Nov Dec Jan Feb Mar Apr May Jun Jul YEAR /100 kg Apple prices in Germany ( /100kg=Euro cents/kg) Those "producer" prices are ex packaging station, sorted and packaged Current 2018/19 () 2017/18 Monthly 5 year MAX 66% upper line 73 5 year avg 66% lower line Monthly 5 year MIN Aug Sep Oct Nov Dec Jan Feb Mar Apr May Jun Jul YEAR EU apples supply (usable production), cider apples included (000 tonnes) The 4 major EU producers + other producers (24 MSs) France Italy Poland 597 Germany EU-other 2012/ / / / / /18[e] 2018/19[f] Apple stocks in the EU (tonnes) the 1st day of the month Current stocks minus 5 year average 2012/ / / / /17 Current 2017/ /17 minus avg 5 year avg Linear ( 5 year avg) Nov Dec Jan Feb Mar Apr May June July ExtraEU trade for apples - Aug to Jul - Tonnes Apples - Extra-EU monthly imports tonnes (= million kgs) 240 Apples - Extra-EU monthly exports tonnes (= million kgs) Exports Imports Severe weather event: spring frosts in 2017 destroyed 23 % of the crop (calculated on 3 year average crop) 2005/ / / / / / / / / / / / /18[e] 2018/19[f] Current 2017/ /17 Monthly 5 year MAX 66% upper line 5 year avg 66% lower line Monthly 5 year MIN Aug Sep Oct Nov Dec Jan Feb Mar Apr May Jun Jul MONTH AVG Current 2017/ /17 Monthly 5 year MAX 66% upper line 5 year avg 66% lower line Monthly 5 year MIN Aug Sep Oct Nov Dec Jan Feb Mar Apr May Jun Jul MONTH AVG Apples - key balance indicators including consumption Marketing year: Aug to Jul tonnes EU Supply (usable production) Imports (fresh) Total Supply (prod.+imports) Apparent Fresh Consumption Apparent processing consumption Exports (fresh) Years--> 2012/ / / / / /18[e] 2018/19[f] EU Supply (usable production) Imports (fresh) Total Supply (prod.+imports) Apparent Fresh Consumption Apparent processing consumption Exports (fresh)
2 INDEX 0. Summary overview, market update 1. Prices * EU prices * MS prices for major producers 2. Production (by variety + extreme weather events + stocks) 3. Trade * Evolution of the trade balance * Import monitoring * Export development 4. Key balance indicators including CONSUMPTION 5. Export diversification 2
3 0. SUMMARY OVERVIEW, MARKET UPDATE RECENT DEVELOPMENTS Marketing year 2018/19 (*) 1. Marketing year 2018/19 started the 1st of August. After a very small crop the preceding marketing year the ongoing season represents coming back to high volumes which in terms of prices implies moving from very high prices to lower prices. 2. EU average prices in this campaign were above reference period average (+31% in August and +11% in September) but moved to just below average in October (-1%). 3. At Member State level there are significant differences: September price for France is more than 6 times the price in Poland. 4. The situation by MS in October compared to the 5 year reference period is as follows: +10% in DE, +11% in FR, minus 6% in IT and minus 48% in PL. Some PL notifications did not have prices for the most expensive varieties, 5. Drought did not affect significantly apple production. Poland has a big crop and there are difficulties for selling it due to lack of adaptation to demand for some varieties and especially regarding apples for processing. (*) Adjustements to price figures are still possible and likely to happen in the context of methodological review and complementary notifications. Background 3
4 0. SUMMARY OVERVIEW, MARKET UPDATE FURTHER COMMENTS 1. The level of stocks that is going to be transferred to the next marketing year is very small (unlike for preceding years). 2. Regarding the international environment, export opportunities seem to be on the rise. China, a country representing over a half of the world's production and a major exporter, suffered a severe frost that could imply an important reduction of the world's supply and, therefore, favourable conditions for EU exports in Asia and the international markets. 3. The crops of the Sourthern Hemisphere (-4%) and the US are decreasing when compared the the preceding one. Background 4
5 BACKGROUND Marketing year 2017/18 1. Extreme weather events during April and May 2017, late spring frosts, are at the origin of a relatively small supply level implying high prices during this marketing year. This is the central weather event defining the ongoing marketing year. 2. The EU apple market has essentially two major "leading indicators": 2.1. The size of the crop for the ongoing marketing year; at EU level a 19% reduction of the current crop (when compared to a 5 year reference period) results on about 40% price increase (with huge differences depending on the relative size of the crop of each MS and the historical reference level of prices); => in the current year the price band is situated well above the historical range for prices; => [PLACEMENT OF THE BAND WHEN COMPARED TO REFERENCE PERIOD AVERAGE PRICES] 2.2 The depletion or unstocking rate month after month during the marketing year; => that rate and price evolve towards opposite directions; = [MONTHLY ADJUSTMENTS WITHIN THE BAND ABOVE] 3. The depletion or unstocking rate depends on 3 sub-factors: 3.1 Monthly consumption; 3.2 Monthly trade balance (the EU apple market is sensitive to extra-eu export developments) ; 3.2 Small adjustments in terms of product expecting to go to fresh consumption but that due to quality issues has to go finally for processing. 4. In conclusion, the current marketing year is caracterized by a significantly smaller than average supply and very high prices. 5
6 1. PRICES 1.1. EU Prices 1.2. MS prices for major producers * Poland (1st EU28 volume producer) * Italy (2nd) * France (3rd) * Germany (4th) 6
7 Market summary /100 kg Apple prices in the EU ( /100kg=Euro cents/kg) Simple avg of 4 MSs (the 4 major producers) Current 2018/19 () 2017/18 Monthly 5 year MAX 66% upper line 5 year avg 66% lower line Monthly 5 year MIN Those "producer" prices are ex packaging station, sorted and packaged Aug Sep Oct Nov Dec Jan Feb Mar Apr May Jun Jul YEAR 7
8 Market summary Provisional price data for Nov in graphs (up to week 45) EU Apple prices /100kg (= Euro cents/kg) and % changes Oct 2018 CURRENT PRICES COMPARED TO 5 YEAR AVERAGE Sep->Oct 2018, Price, /100 kg 65->58 Sep->Oct 2018, comparison to 5 year avg, base = 100 % 111->99 CURRENT PRICES COMPARED TO ONE MONTH AGO 5 year avg price, changes from Sep to Oct % -1 % 2018, changes from Sep to Oct % -12 % PL-Poland 19->14 69->52-7% -30 % IT-Italy 68->69 99->94 +4 % +1 % FR-France 104-> >111-6 % -11 % DE-Germany 70-> > % -21 % month 8

9 Market summary Apple prices /100kg (= Euro cents/kg) and % changes Sep 2018 CURRENT PRICES COMPARED TO 5 YEAR AVERAGE CURRENT PRICES COMPARED TO ONE MONTH AGO Sep 2018, Price, /100 kg Aug->Sep 2018, comparison to 5 year avg, base = 100 % 5 year avg price, changes from Aug to Sep % 2018, changes from Aug to Sep % EU >111-2 % -17 % PL-Poland >69-12% -36 % IT-Italy >99-2 % -6 % FR-France >118-7 % -16 % DE-Germany > % -20 % month 9
10 Market summary Apple prices /100kg (= Euro cents/kg) and % changes Aug 2018 CURRENT PRICES COMPARED TO 5 YEAR AVERAGE CURRENT PRICES COMPARED TO ONE MONTH AGO Aug 2018, Price, /100 kg Jul->Aug 2018, comparison to 5 year avg, base = 100 % 5 year avg price, changes from July to Aug % 2018, changes from July to Aug % EU > % -15 % PL-Poland >95-3% -16 % IT-Italy >104-5 % -31 % FR-France > % +5 % DE-Germany >201-6 % -20 % month 10
11 Market summary Apple prices /100kg (= Euro cents/kg) and % changes July 2018 CURRENT PRICES COMPARED TO 5 YEAR AVERAGE CURRENT PRICES COMPARED TO ONE MONTH AGO July 2018, Price, /100 kg July 2018, comparison to 5 year avg, base = 100 % 5 year avg price, changes from June to July % 2017/18, changes from June to July % EU % +2 % PL-Poland % -7 % IT-Italy % +2 % FR-France % +2 % DE-Germany % +4 % 11
12 /100 kg Apple prices in Poland ( /100kg=Euro cents/kg) Current 2018/19 () 2017/18 Monthly 5 year MAX 66% upper line 5 year avg 66% lower line Monthly 5 year MIN Aug Sep Oct Nov Dec Jan Feb Mar Apr May Jun Jul YEAR 12

13 /100 kg Apple prices in Italy ( /100kg=Euro cents/kg) Current 2018/19 () 2017/18 Monthly 5 year MAX 66% upper line 5 year avg 66% lower line Monthly 5 year MIN Those "producer" prices are ex packaging station, sorted and packaged Aug Sep Oct Nov Dec Jan Feb Mar Apr May Jun Jul YEAR
14 /100 kg Apple prices in France ( /100kg=Euro cents/kg) Current 2018/19 () 2017/18 Monthly 5 year MAX 66% upper line 5 year avg 66% lower line Monthly 5 year MIN Those "producer" prices are ex packaging station, sorted and packaged Aug Sep Oct Nov Dec Jan Feb Mar Apr May Jun Jul YEAR
15 /100 kg Apple prices in Germany ( /100kg=Euro cents/kg) Those "producer" prices are ex packaging station, sorted and packaged Current 2018/19 () 2017/18 Monthly 5 year MAX 66% upper line 5 year avg 66% lower line Monthly 5 year MIN Aug Sep Oct Nov Dec Jan Feb Mar Apr May Jun Jul YEAR 15
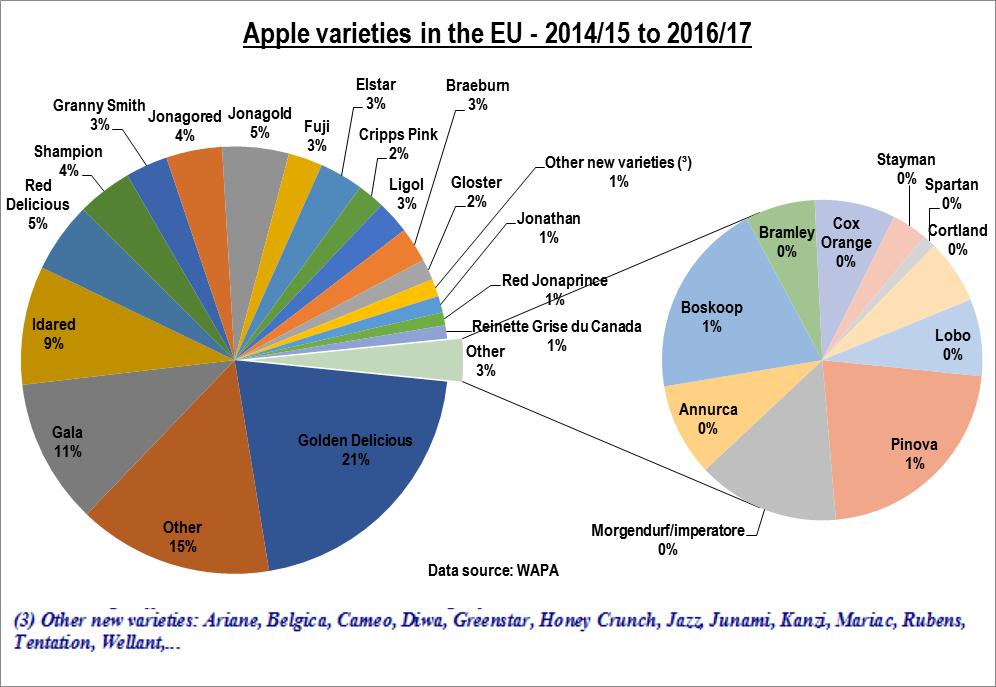
16 2. PRODUCTION 2.1. EU production for MSs that are major producers 2.2. EU production by variety (%) 2.3. Extreme weather events 2.4. Apple stocks 16
17 5 000 EU apples supply (usable production), cider apples included (000 tonnes) The 4 major EU producers + other producers (24 MSs) France Italy Poland Germany EU-other 2012/ / / / / /18[e] 2018/19[f] 597 Further detail 17
18 18


19 General index AGRO-WEATHER INDEX Agro-weather index 1. Background with main elements 2. Summary multi-event map * main events 3. Precipitation analysis * 90 day * 30 day * maps of current or recent droughts in the EU 4. Temperature analysis * 30 day average, C, regional deviations * Relative number of cold days 5. Other agro-weather events WEATHER FACTORS IN FRUIT AND VEGETABLE PRODUCTIONS 19


20 Further detail Source: JRC Agro-weather start page 20
 - % of normal Agro-weather start page Further detail")
21 EXTREME WEATHER EVENTS IN EUROPE 90 DAY PRECIPITATION ANALYSIS OF ANOMALIES 14 Aug 2018 to 13 Nov 2018 (90 days) - % of normal Agro-weather start page Further detail 21
 - % of normal Agro-weather start page Further detail")
22 EXTREME WEATHER EVENTS IN EUROPE 30 DAY PRECIPITATION ANALYSIS OF ANOMALIES 14 Oct 2018 to 13 Nov 2018 (30 days) - % of normal Agro-weather start page Further detail 22
 Agro-weather start page Further detail")
23 EXTREME WEATHER EVENTS IN EUROPE TEMPERATURE ANOMALIES +/- C ON AVG 15 Oct 2018 to 13 Nov 2018 (+/- 30 days) Agro-weather start page Further detail 23

24 EXTREME WEATHER EVENTS IN EUROPE 01 Oct 2018 to 15 Nov 2018 Agro-weather start page Main area of severe wind 24
25 Apple stocks in the EU (tonnes) the 1st day of the month 2012/ / / / /17 Current 2017/ Current stocks minus 5 year average /17 minus avg 5 year avg Linear ( 5 year avg) Nov Dec Jan Feb Mar Apr May June July Data sources: WAPA&AMI Further detail 25

26 tonnes Apples - Monthly unstocking rates in the EU - tonnes Current 2017/ /17 Monthly 5 year MAX /-66% upper line 5 year avg +/-66% lower line Monthly 5 year MIN Nov Dec Jan Feb Mar Apr May Jun YEAR AVG
27 3. TRADE 3.1. Evolution of the trade balance 3.2. Import monitoring 2.3. Export development (export diversification is under section 5) 27
28 ExtraEU trade for apples - Aug to Jul - Tonnes Exports Imports Severe weather event: spring frosts in 2017 destroyed 23 % of the crop (calculated on 3 year average crop) / / / / / / / / / / / / /18[e] 2018/19[f] 28
29 000 tonnes Apples - Extra-EU monthly imports tonnes (= million kgs) Current 2017/ /17 Monthly 5 year MAX 66% upper line year avg 66% lower line Monthly 5 year MIN Aug Sep Oct Nov Dec Jan Feb Mar Apr May Jun Jul MONTH AVG 29
30 tonnes Apples - Extra-EU monthly exports tonnes (= million kgs) Current 2017/ /17 Monthly 5 year MAX 66% upper line 5 year avg 66% lower line Monthly 5 year MIN Aug Sep Oct Nov Dec Jan Feb Mar Apr May Jun Jul MONTH AVG 30
31 - Production - Imports - Total supply (production +imports) * Apparent fresh consumption * Apples for processing * Exports - Market access (Imports/Fresh consumption) - Fresh production exported (%) - Apparent fresh consumption (kg/person) 4. KEY BALANCE INDICATORS including CONSUMPTION 31
32 Apples - key balance indicators including consumption Marketing year: Aug to Jul tonnes EU Supply (usable production) Imports (fresh) Total Supply (prod.+imports) Apparent Fresh Consumption Apparent processing consumption Exports (fresh) Years--> / / / / / /18[e] 2018/19[f] EU Supply (usable production) Imports (fresh) Total Supply (prod.+imports) Apparent Fresh Consumption Apparent processing consumption Exports (fresh) Further detail 32
33 Apples - key balance indicators including consumption (+) Marketing year: Aug to Jul - Units: % and kg per person (consumption) Market Access (Imp./Cons. %) Exported fresh production % Apparent Fresh Cons. Kg/person Years--> / / / / /17[e] 2017/18[f] 2017/18[f] Market Access (Imp./Cons. %) Exported fresh production % Apparent Fresh Cons. Kg/person
34 5. EXPORT DIVERSIFICATION - Map of top world importers of apples - Bar chart on top world importers and annual growth rates - Key trade indicators on top world importers of apples - Main apple traders in the world and degree of diversification - World consumption of apples, main players 34

35 TOP WORLD IMPORTERS FROM ALL ORIGINS Further detail 35

36 TOP WORLD APPLE IMPORTERS FROM ALL ORIGINS 2017 and % Annual growth in value Further detail 36

37 TOP WORLD APPLE IMPORTERS FROM ALL ORIGINS Further detail 37

38 TOP 25 APPLE IMPORTERS OF THE WORLD FROM ALL ORIGINS Value Terms Remark: Interesting method of analysis, the scale is not accurate, just indicative <- diversified, many trade partners concentrated, few trade partners-> Further detail 38
39 World consumption of apples 2015/16 (volume) Main players Russia 2% India 4% Turkey 4% Iran 2% Other 15% United States 4% European Union 11% China 58% 39
40 End Thank you 40
D G A G R I D A S H B O A R D : A P P L E S
 75 79 60 56 49 74 65 59 54 42 76 63 58 53 78 55 42 43 79 44 81 63 47 83 64 59 53 48 Sources: Eurostat, MSs notifications, DG Agri, Comext, Comtrade, GTA, ITC, AMI, Expert groups, Freshfel, Wapa. 89 68
D G A G R I D A S H B O A R D : T O M A T O E S Last update: EU AVG PRICES
 tonnes Weightedaverages by volume of production per MS Ongoing adjustments on weights by variety group 000 tonnes D G A G R I D A S H B O A R D : T O M A T O E S Last update: 20.04.2018 EU AVG PRICES MS
COMPARISON OF FIXED & VARIABLE RATES (25 YEARS) CHARTERED BANK ADMINISTERED INTEREST RATES - PRIME BUSINESS*
 CHARTERED BANK ADMINISTERED INTEREST RATES - PRIME BUSINESS*") COMPARISON OF FIXED & VARIABLE RATES (25 YEARS) 2 Fixed Rates Variable Rates For Internal Use Only. FIXED RATES OF THE PAST 25 YEARS AVERAGE RESIDENTIAL MORTGAGE LENDING RATE - 5 YEAR* (Per cent) Year
COMPARISON OF FIXED & VARIABLE RATES (25 YEARS) 2 Fixed Rates Variable Rates For Internal Use Only. FIXED RATES OF THE PAST 25 YEARS AVERAGE RESIDENTIAL MORTGAGE LENDING RATE - 5 YEAR* (Per cent) Year
COMPARISON OF FIXED & VARIABLE RATES (25 YEARS) CHARTERED BANK ADMINISTERED INTEREST RATES - PRIME BUSINESS*
 CHARTERED BANK ADMINISTERED INTEREST RATES - PRIME BUSINESS*") COMPARISON OF FIXED & VARIABLE RATES (25 YEARS) 2 Fixed Rates Variable Rates FIXED RATES OF THE PAST 25 YEARS AVERAGE RESIDENTIAL MORTGAGE LENDING RATE - 5 YEAR* (Per cent) Year Jan Feb Mar Apr May Jun
COMPARISON OF FIXED & VARIABLE RATES (25 YEARS) 2 Fixed Rates Variable Rates FIXED RATES OF THE PAST 25 YEARS AVERAGE RESIDENTIAL MORTGAGE LENDING RATE - 5 YEAR* (Per cent) Year Jan Feb Mar Apr May Jun
Committee for the Common Organisation of the Agricultural Market Market Situation for Sheep & Goat Meats 21 Septembre 2017
 Committee for the Common Organisation of the Agricultural Market Market Situation for Sheep & Goat Meats 21 Septembre 217 Production P R O D U C T I O N In ' tonnes carcase weight 14.1 58.4 43.8 3.6 29.2
Commercial-in-Confidence Ashton Old Baths Financial Model - Detailed Cashflow
 Year 0 1 2 3 4 5 6 7 8 9 10 11 12 13 Oct-16 Nov-16 Dec-16 Jan-17 Feb-17 Mar-17 Apr-17 May-17 Jun-17 Jul-17 Aug-17 Sep-17 Oct-17 2,038 2,922 4,089 4,349 6,256 7,124 8,885 8,885 8,885 8,885 8,885 8,885 9,107
EU Market Situation for Poultry. Civil Dialogue Group. 25 October 2016
 EU Market Situation for Poultry Civil Dialogue Group 25 October 216 Thousand Tons F O R E C A S T 16 14 Experts EU production forecast on Poultry and Rabbit (Missing data (BE-EL-AT-RO-LT-SE) - No expert
Committee for the Common Organisation of the Agricultural Market Market Situation for Sheep & Goat Meats 22 March 2018
 Committee for the Common Organisation of the Agricultural Market Market Situation for Sheep & Goat Meats 22 March 218 Production In ' tonnes carcase weight P R O D U C T I O N 297.4 114.8 8.9 67.1 51.3
Sheep Market Outlook. Mark Kozlowski, AHDB Beef & Lamb AHDB Outlook Conference 9 February 2016
 Sheep Market Outlook Mark Kozlowski, AHDB Beef & Lamb AHDB Outlook Conference 9 February 2016 Overview Current situation UK Current situation rest of the world UK outlook Wildcards Current situation in
Steers Heifers Young Bulls Cows
 Deadweight Prices /100Kg (Including VAT) Steers Heifers Young Bulls Cows U3 U4 R3 R4 O3 O4 P+ 435.7 432.4 423.2 422.8 402.9 404.2 384.7 451.8 447.8 435.2 433.5 413.7 417.0 382.2 423.5 422.0 413.4 415.3
EU Market Situation for Eggs. Committee for the Common Organisation of the Agricultural Markets 23 June 2016
 EU Market Situation for Eggs Committee for the Common Organisation of the Agricultural Markets 23 June 216 FARM STRUCTURE SURVEY Number of Laying Hens 215 by way of keeping based on the EU Member States
/ PRELIMINARY STEEL IMPORTS INCREASE 2% IN MAY Import Market Share 23% in May
 News Release FOR IMMEDIATE RELEASE June 25, 2013 CONTACT Lisa Harrison 202.452.7115/ lharrison@steel.org PRELIMINARY STEEL IMPORTS INCREASE 2% IN MAY Import Market Share 23% in May Washington, D.C. Based
Market situation in the Olive oil and Table olives sectors
 Market situation in the Olive oil and Table olives sectors Committee for the Common Organisation of the Agricultural Markets Arable crops and olive oil 30 May 2017 Lucie Zolichová, AGRI G.4 lucie.zolichova@ec.europa.eu
Up and Down Months of the Stock Market
 Up and Down Months of the Stock Market 1926-2017 Positive years (66) in the stock market were not good all year long and losing years (24) were not losers throughout the year. Winning years produce losing
3. Atmospheric Supply of Nitrogen to the Baltic Sea in 2009
 3. Atmospheric Supply of Nitrogen to the Baltic Sea in 2009 Nitrogen emission data, as well as the model results presented here have been approved by the 35 th Session of the Steering Body of EMEP in Geneva
increase of over four per cent compared to the average of $409,058 reported in January 2010.
 SINGLE FAMILY RESIDENTIAL BREAKDOWN uary 211 26.8 % 1.7 % 7.%.4%.1 % Good Start to 211 TORONTO - February 4, 211 Greater Toronto REALTORS reported 4,337 transactions through the TorontoMLS system in uary
Soybean Trade Growth: A Story of Brazil, the United States, and China
 United States Department of Agriculture Foreign Agricultural Service October 2017 Soybean Trade Growth: A Story of Brazil, the United States, and China 12-Month Soybean Export Growth Year Ending September
Preliminary Steel Imports, Down 14% in June, Increase 35% in First Half of Year; Import Market Share 21% in Second Quarter 2010
 News Release FOR IMMEDIATE RELEASE July 27, 2010 CONTACT: NANCY GRAVATT 202.452.7115/ ngravatt@steel.org Preliminary Steel Imports, Down 14% in June, Increase 35% in First Half of Year; Import Market Share
Argentine Exporters Switch to Soybean Oil as Biodiesel Exports Fall
 United States Department of Agriculture Foreign Agricultural Service Circular Series FOP 08-13 Argentine Exporters Switch to Soybean Oil as Biodiesel Exports Fall Argentina s soybean oil exports have surged
Preliminary Steel Imports Decline 9% in September Import Market Share at 20%
 News Release FOR IMMEDIATE RELEASE October 25, 2011 CONTACT: NANCY GRAVATT 202.452.7115/ ngravatt@steel.org Preliminary Steel Imports Decline 9% in September Import Market Share at 20% Washington, D.C.
Global Monthly March 2019
 Global Monthly March 19 Percent of world bonds outstanding 3 5 15 5 Jan-1 Jun-1 Nov-1 Apr-15 Sep-15 Feb-1 Jul-1 Dec-1 May-17 Oct-17 Mar-1 Aug-1 Dec-1 Mar-19 March 19 Percent, year-on-year 7 5 3 1 1Q1 1Q
China s Global Peanut Export Share Declines
 United States Department of Agriculture Foreign Agricultural Service Circular Series FOP 07-13 China s Global Peanut Export Share Declines U.S. 10% Others 19% Argentina 17% U.S. 11% Others 16% Argentina
Indian Soybean Meal Exports Unlikely to Recover in 2015/16
 United States Department of Agriculture Foreign Agricultural Service November 2015 Indian Soybean Meal Exports Unlikely to Recover in Though once a significant regional exporter of soybean meal, India
/ PRELIMINARY STEEL IMPORTS INCREASE 15% IN APRIL Import Market Share 27% in April
 News Release FOR IMMEDIATE RELEASE May 23, 2014 CONTACT Lisa Harrison 202.452.7115/ lharrison@steel.org PRELIMINARY STEEL IMPORTS INCREASE 15% IN APRIL Import Market Share 27% in April Washington, D.C.
Drought in South America to Limit Soybean Exports
 United States Department of Agriculture Foreign Agricultural Service Circular Series FOP 2-09 ruary 2009 Drought in South America to Limit Soybean Exports Million Tons 16 14 12 10 8 6 4 2 Annual Change
Price Category Breakdown - February 2010
 SINGLE FAMILY RESIDENTIAL BREAKDOWN ruary 21 ruary Sales and Average Price Increase Annually TORONTO - Wednesday, March 3, 21 7.3 % 24.6 % 1.8 % 7.3%.2%.1 % Greater Toronto REALTORS reported 7,291 sales
Soybean Oil Prices Diverge on Different Supply Situations
 United States Department of Agriculture Foreign Agricultural Service Circular Series FOP 10-09 October 2009 Soybean Oil Prices Diverge on Different Supply Situations Soybean Oil Price ($/ton) $900 $850
NJ Solar Market Update
 NJ Solar Market Update April 16, 20 Renewable Energy Committee Meeting Trenton, NJ Prepared by Charlie Garrison Solar Installed Capacity Data The preliminary installed solar capacity as of 3/31/ is approximately
About Czarnikow. The Premier Provider of Sugar Market Services. Czarnikow has been in the sugar business since 1861
 About Czarnikow The Premier Provider of Sugar Market Services Czarnikow has been in the sugar business since 1861 Czarnikow is the leading professional services company in the sugar market Czarnikow has
EUR/100 kg MAR FEB JAN * : provisional figures. Jan 14 MAR JAN FEB EUR/100 kg
 EU Trade EU Productions Sources : EUROSTAT, Reg. (EU) 479/2010, Clal.it, USDA, Lto.nl, Nasdaq, European Central Bank, Dairyaustralia, Dcanz, Global Trade Atlas, 01 02 1000 Tonnes 03 World Trade 04 05 06
EUR/100 kg MAR FEB JAN * : provisional figures. Jan 15. Jan 16 JAN MAR FEB EUR/100 kg
 GDT Auction EU Trade World Trade EU Productions World Productions 1000 Tonnes USD/Feed/Energy EUR/100 kg JAN FEB MAR APR MAY JUN JUL AUG SEP OCT NOV DEC 03 04 05 06 07 08 09 10 11 12 13 14 15 16 01 02
EUR/100 kg FEB JAN MAR 29,7 26,1 25. * : provisional figures. Jan 13 JAN MAR FEB 36,0 21,7. EUR/100 kg
 GDT Auction EU Trade World Trade EU Productions World Productions 1000 Tonnes USD/Feed/Energy EUR/100 kg JAN FEB MAR APR MAY JUN JUL AUG SEP OCT NOV DEC 03 04 05 06 07 08 09 10 11 12 13 14 15 16 01 02
/
 News Release FOR IMMEDIATE RELEASE June 26, 2012 CONTACT: NANCY GRAVATT 202.452.7115/ ngravatt@steel.org May Preliminary Finished Steel Imports 2 nd Highest Monthly Amount in 2012 Import Market Share at
Economic and Financial Outlook
 Economic and Financial Outlook Euro Area October 2017 Summary 1 2 3 4 Robust GDP growth in Euro Area, but subdued inflation Spanish GDP growth has stabilized at elevated rates Short View of France and
University of Michigan Eco-Driving Index (EDI) Latest data: October 2017
 Latest data: October 2017") University of Michigan Eco-Driving Index () http://www.ecodrivingindex.org Latest data: October 2017 Developed and issued monthly by Michael Sivak and Brandon Schoettle Sustainable Worldwide Transportation
University of Michigan Eco-Driving Index () http://www.ecodrivingindex.org Latest data: October 2017 Developed and issued monthly by Michael Sivak and Brandon Schoettle Sustainable Worldwide Transportation
September 2016 Water Production & Consumption Data
 September 2016 Water Production & Consumption Data September 2016 monthly water production (288.48 AF) was lowest in at least 17 years. Monthly water production has increased slightly each month since
November. Next release: 19 January Sep/AugOct/Sep Nov/Oct Dec 14 December Janu 19 January 2018 Sep/AugOct/Sep Nov/Oct 2017
 Sep/AugOct/Sep Nov/Oct 2017 14 Dec 14 December 2017 19 Janu 19 January 2018 Sep/AugOct/Sep Nov/Oct 2017 Next release: 19 January 2018 NovembNovember November Monthly Oil Price Statistics TABLE OF CONTENTS
Total Production by Month (Acre Feet)
") Production by Month (acre-feet) 2008 2009 2010 2011 2012 2013 2014 2015 2016 January 25 339.10 228.90 249.50 297.99 243.06 327.14 247.66 212.37 February 234.00 218.80 212.10 241.52 245.82 279.08 234.16
Production by Month (acre-feet) 2008 2009 2010 2011 2012 2013 2014 2015 2016 January 25 339.10 228.90 249.50 297.99 243.06 327.14 247.66 212.37 February 234.00 218.80 212.10 241.52 245.82 279.08 234.16
Wheat Marketing Situation
 Wheat Marketing Situation Prepared by: Darrell L. Hanavan Executive Director Colorado Wheat Administrative Committee If you would like to receive an email when this report is updated, email gmostek@coloradowheat.org
2016/17 Global Olive Oil Production Down But Prices Stabilize
 United States Department of Agriculture Foreign Agricultural Service November 2016 Global Olive Oil Down But Prices Stabilize Global Olive Oil and Stocks 4000 3500 5000 Extra Virgin Olive Oil Prices Stabilizing
Brazil s Soybean Oil Exports Squeezed by Rising Biodiesel Demand
 United States Department of Agriculture Foreign Agricultural Service Circular Series FOP 6-09 e 2009 Brazil s Soybean Oil Exports Squeezed by Rising Biodiesel Demand Soybean Oil Exports and Industrial
STEEL IMPORTS DOWN 23% FROM PRIOR MONTH IN MAY Finished Import Market Share YTD at 26%
 News Release FOR IMMEDIATE RELEASE June 25, 2018 CONTACT Lisa Harrison 202.452.7115/lharrison@steel.org STEEL IMPORTS DOWN 23% FROM PRIOR MONTH IN MAY Finished Import Market Share YTD at 26% Washington,
EXECUTIVE SUMMARY ATLANTIC SALMON NO 03/06
 MARKET This table shows development in supply/consumption of Atlantic salmon in the main markets per month, in tonnes r.w The table contains preliminary figures and may diverge from same figures in the
STEEL IMPORTS DOWN 10% YEAR-TO-DATE Finished Import Market Share YTD at 25%
 News Release FOR IMMEDIATE RELEASE August 24, 2018 CONTACT Lisa Harrison 202.452.7115/lharrison@steel.org STEEL IMPORTS DOWN 10% YEAR-TO-DATE Finished Import Market Share YTD at 25% Washington, D.C. Based
Weak Real to Boost Brazil s Soybean Exports in 2016
 United States Department of Agriculture Foreign Agricultural Service October 2015 Weak Real to Boost Brazil s Soybean Exports in 2016 Brazil s exchange rate is having a significant impact on domestic and
Sharp Decline in Vegetable Oil Stocks Leads to Steeply Higher Prices
 United States Department of Agriculture Foreign Agricultural Service Circular Series FOP 1-11 Sharp Decline in Vegetable Oil Leads to Steeply Higher Prices Commodity prices have been on an upward trend
EU Market Situation for Poultry. Committee for the Common Organisation of the Agricultural Markets 22 October 2015
 EU Market Situation for Poultry Committee for the Common Organisation of the Agricultural Markets 22 October 215 Euro Dollar exchange rate 1.6 22/9/215: 1 EUR = 1.12 USD 1.4 1.2 1. Exchange rate: Spot,
Apple Market Analysis & Trends PROGNOSFRUIT - CONGRESS 2016 HELWIG SCHWARTAU, AMI
 Apple Market Analysis & Trends PROGNOSFRUIT - CONGRESS 2016 HELWIG SCHWARTAU, AMI Development of apple market Analysis for the next season possible? Facts Forecast apples Russian ban continueing? Political
M onthly arket. Jan Table of Contents. Monthly Highlights
 Table of Contents Market Inventory...2 www.gaar.com Monthly Highlights January 2014 had a 12.29% increase in the number of homes sales when compared to same time last year. The average sale price of single-family
[Title] Crop report - Pepper. China Spice Conference 1 November 2018 Wuxi, China
![[Title] Crop report - Pepper. China Spice Conference 1 November 2018 Wuxi, China](/thumbs/90/102194396.jpg "[Title] Crop report - Pepper. China Spice Conference 1 November 2018 Wuxi, China") [Title] Crop report - Pepper [Date] Jos van Gulick China Spice Conference November 28 Wuxi, China US$ US$ / / MT MT US$ / MT Have we seen the bottom yet? 6, 6, 6, 4, 4, 4, Black pepper peaks at US$9,976/MT
[Title] Crop report - Pepper [Date] Jos van Gulick China Spice Conference November 28 Wuxi, China US$ US$ / / MT MT US$ / MT Have we seen the bottom yet? 6, 6, 6, 4, 4, 4, Black pepper peaks at US$9,976/MT
Martin Stopford President, Clarkson Research
 9//5 Current and past policies for expanding maintaining or reducing shipbuilding capacity: OECD Working Party No 6 9 th November 5 Martin Stopford President, Clarkson Research Martin Stopford, Clarkson
NZPork Monthly Import Report
 NZPork Monthly Import Report IW Barugh and EJ Neumann December 10, 2017 1 Data summary for October 2017 Data from January 2000 through October 2017 was downloaded from the Statistics NZ website (http://www.stats.govt.
December. Next release: 13 February Oct/Sep Nov/Oct Dec/Nov Janu19 January Febru13 February 2018 Oct/Sep Nov/Oct Dec/Nov 2017
 Oct/Sep Nov/Oct Dec/Nov 2017 19 Janu19 January 2018 13 Febru13 February 2018 Oct/Sep Nov/Oct Dec/Nov 2017 Next release: 13 February 2018 DecembDecember December TABLE OF CONTENTS Page Charts 1 Latest IEA
MARKET NEWS for pig meat
 MARKET NEWS for pig meat Market analysis 4 July 2016 Week 27 MARKET SITUATION Europe: Trade in pork legs took place at slightly rising prices this week. Loins and collars as well as other cuts were traded
Market situation in the Olive oil and Table olives sectors
 Market situation in the Olive oil and Table olives sectors Committee for the Common Organisation of the Agricultural Markets Arable crops and olive oil 26 January 2017 Lucie Zolichová, AGRI G.4 lucie.zolichova@ec.europa.eu
Early-Season U.S. Soybean Meal Sales Surge
 United States Department of Agriculture Foreign Agricultural Service November 2014 Early-Season U.S. Soybean Meal Sales Surge U.S. soybean meal export commitments (accumulated exports plus outstanding
EUR/100 kg JAN FEB APR * : provisional figures. Jan 18 JAN APR FEB MAR
 GDT Auction EU Trade World Trade EU Productions World Productions 1 Tonnes 21 22 23 24 25 26 27 28 29 21 211 212 213 214 215 216 217 218 USD/Feed/Energy EUR/1 kg JAN FEB MAR APR MAY JUN JUL AUG SEP OCT
/ Preliminary Steel Imports Increase 6% in May Import Market Share at 21%
 News Release FOR IMMEDIATE RELEASE June 21, 2011 CONTACT: NANCY GRAVATT 202.452.7115/ ngravatt@steel.org Preliminary Steel Imports Increase 6% in May Import Market Share at 21% Washington, D.C. Based on
NEWS Release. U.S. Manufacturing Technology Orders. Year-to-date U.S. manufacturing technology orders up 4.1% over 2011
 U.S. Manufacturing Technology Orders A statistical program of AMT NEWS Release FOR RELEASE: October 8, 2012 Contact: Pat McGibbon, AMT, 703-827-5255 Year-to-date U.S. manufacturing technology orders up
India & Asia. Steel Scrap Industry BY: VED PRAKASH GEMINI CORPORATION N. V., BELGIUM
 India & Asia Steel Scrap Industry BY: VED PRAKASH GEMINI CORPORATION N. V., BELGIUM 1 GEMINI CORPORATION N. V. Steel, Recyclable Plastics, Rubber and Engineered Wood Panels 2 Content How competitive are
The ISM Manufacturing Survey Points to Imminent Economic Recovery, Possibly in 2009 May 1, Chart 1
 Northern Trust Global Economic Research 50 South LaSalle Chicago, Illinois 3 northerntrust.com Asha G. Bangalore agb3@ntrs.com The ISM Manufacturing Survey Points to Imminent Economic Recovery, Possibly
US Crude Oil Reshaping International Crude Oil Flows. Olivier Jakob,
 US Crude Oil Reshaping International Crude Oil Flows Olivier Jakob, ojakob@petromatrix.com www.petromatrix.com Claimer Petromatrix publishes since 2006 a daily market note on the oil markets Our reports
Update of Poultry Fundamentals April 18
 Update of Poultry Fundamentals April 18 Contact us: 402.898.9458 www.advancedeconomicsolutions.com knox@aesresearch.com Visit our updated website Follow us on Twitter @AES_Research 4/13/2018 AdvancedEconomicSolutions
Canola Weekly. Index. WCE May/07 Canola Jul 9-Aug 14-Sep 20-Oct 27-Nov 4-Jan 8-Feb 16-Mar
 March 2, 2 Canola Weekly Index ) Canola Steady Despite Weak Soy Complex 2) Slow Crush Improves Canola Oil Basis ) Export Demand Underpins Canola Last week, we mentioned that May canola had key support
Growing Soybean Oil Price Raises Oil s Contribution to Total Soybean Value
 United States Department of Agriculture Foreign Agricultural Service Circular Series FOP 10-07 October 2007 Growing Soybean Oil Price Raises Oil s Contribution to Total Soybean Value Relative Share Value:
/
 News Release FOR IMMEDIATE RELEASE July 5, 0 CONTACT: NANCY GRAVATT 0.45.75/ ngravatt@steel.org Finished Steel Imports Decline in June, But Up Percent in First Half 0 Import Market Share in 0 at 4 Percent
Automotive Aftermarket Giorgio Brusco
 Automotive Aftermarket Giorgio Brusco Vice President Automotive Aftermarket Europe Agenda The global business today Recent progress in automotive Future growth drivers Summary 2 Worldwide Automotive Aftermarket:
Soybean and Oilseed Meal Import Prospects Higher as Severe Weather Damages EU Crops
 Million Tons Million Tons Million Tons United States Department of Agriculture Foreign Agricultural Service August 2018 Soybean and Oilseed Meal Import Prospects Higher as Severe Weather Damages EU Crops
NJ Solar Market Update As of 6/30/15
 NJ Solar Market Update As of 6/30/ Prepared by Charlie Garrison July 17, 20 SOLAR INSTALLED CAPACITY DATA The preliminary installed solar capacity as of 6/30/ is approximately 1,500.7 MW. Approximately
GROWTH IN TENTH DISTRICT MANUFACTURING ACTIVITY EXPANDED SOLIDLY Federal Reserve Bank of Kansas City Releases May Manufacturing Survey
 FOR RELEASE Thursday, May 22, 2014 EMBARGOED FOR 10 A.M. CENTRAL TIME CONTACT: Pam Campbell 405-270-8617 Pam.Campbell@kc.frb.org GROWTH IN TENTH DISTRICT MANUFACTURING ACTIVITY EXPANDED SOLIDLY Federal
Who are the. Metalforming? The leading trade association for the metalforming industry.
 Confederation of British Metalforming John Houseman Director General Who are the Confederation of British Metalforming? The leading trade association for the metalforming industry. National Metalforming
Monthly Hog Market Update United States Hog Production
 This information is provided as a resource by Saskatchewan Agriculture staff All prices are in Canadian dollars unless otherwise noted. Please use this information at your own risk. Monthly Hog Market
Rising Coconut Oil Prices Foreshadow Tight Supplies in 2007
 United States Department of Agriculture Foreign Agricultural Service Circular Series FOP 2-07 ruary 2007 Rising Coconut Oil Prices Foreshadow Tight Supplies in 2007 800 Coconut Oil Price: CIF Rotterdam
System Management Principles Statement
 System Management Principles Statement Compliance report for June 214 to August 214 Summary of balancing actions and breaches for June 214 to Aug 214 Performance compared to last year Summary Report Jun-14
MARKET RATES UPDATE Paula Gold-Williams Cory Kuchinsky
 MARKET RATES UPDATE I N T R O D U C T I O N BY: Paula Gold-Williams President & Chief Executive Officer (CEO) P R E S E N T E D BY: Cory Kuchinsky Interim Vice President, Financial Services September 24,
Operational Overview. Operational Forum, 24 th March 2010
 Operational Overview Operational Forum, 24 th March 21 Weather Weather February 21 The cold weather continued throughout February with all but one day being colder than the 17-year seasonal normal CWV.
History gives hope for wheat rally Be sure to reward $2 rally. By Bryce Knorr, Senior Grain Market Analyst
 History gives hope for wheat rally Be sure to reward $2 rally By Bryce Knorr, Senior Grain Market Analyst For years the wheat market stagnated waiting for a single trigger: A sharp reduction in global
Market situation Sugar Market Observatory 12 April 2018
 Market situation Sugar Market Observatory 12 April 2018 Arable crops, Sugar team DG Agriculture and Rural Development European Commission Sugar Prices Sugar Market Observatory 12 April 2018 2007 2008 2009
Global Monthly February 2018
 Global Monthly February 18 3 1-year Treasury yields 1-year breakeven inflation rate 1 1 15 16 17 18 February 18 5 3 Global GDP growth Composite PMI (RHS) Index 56 5 5 1 5 1 13 1 15 16 17 18 3..5. 1.5 1.
Palm and Soy Oil Use Expands at Expense of Other Oils
 United States Department of Agriculture Foreign Agricultural Service September 2015 Revised on September 15, 2015 Palm and Soy Oil Use Expands at Expense of Other Oils As global demand for vegetable oil
Port Botany Trade Statistics Bulletin. 1 July May 2017
 Port Botany Trade Statistics Bulletin 1 July 2016 31 May 2017 YTD May 2017 Port Botany Container Trade Jul 2016 Aug 2016 Sep 2016 Oct 2016 Nov 2016 Dec 2016 Jan 2017 Feb 2017 Mar 2017 Apr 2017 May 2017
Economic & Steel Market Development in Japan
 1 Economic & Steel Market Development in Japan 68 th OECD Steel Committee Paris May 6-7, 2010 The Japan Iron & Steel Federation 2 Macro-economic overview Steel Supply and Demand v v v Steel Production
STANDARDIZED MILK PRICE CALCULATIONS for MAY 2013 deliveries
 STANDARDIZED MILK PRICE CALCULATIONS for MAY 2013 deliveries Company Milcobel Alois Müller Humana Milchunion eg Nordmilch Arla Foods Hämeenlinnan Osuusmeijeri Bongrain CLE (Basse Normandie) Da (Pas de
FOR IMMEDIATE RELEASE
 Article No. 7845 Available on www.roymorgan.com Roy Morgan Unemployment Profile Friday, 18 January 2019 Unemployment in December is 9.7% and under-employment is 8.8% FOR IMMEDIATE RELEASE Australian unemployment
Pakistan Oilseed Processors Seize Opportunity to Crush Soybeans
 United States Department of Agriculture Foreign Agricultural Service December 2015 Pakistan Oilseed Processors Seize Opportunity to Crush Soybeans Pakistan, long an importer of soybean meal, is transitioning
System Management Principles Statement
 System Management Principles Statement Compliance report for September 214 and October 214 Summary of balancing actions and breaches for September 214 October 214 Performance compared to last year Summary
MARKET NEWS for pig meat
 MARKET NEWS for pig meat Market analysis 18 June 2018 Week 25 MARKET SITUATION Europe: Trading in fresh legs and other cuts is at unchanged prices. UK: Sales remain stable. Sales are reported as sluggish
Share of Brazil s Soybean Exports to China Spikes in August
 United States Department of Agriculture Foreign Agricultural Service September 2018 Share of Brazil s Soybean Exports to China Spikes in August Monthly Share of Brazil's Soybean Exports to China 85% 75%
Global Overview of Middle Distillates Supply and Demand ICE Market Forum Rotterdam, November 2012
 Global Overview of Middle Distillates Supply and Demand ICE Market Forum Rotterdam, November 2012 About Petromatrix Based in Switzerland (city of Zug) Publishes a daily newsletter on oil markets Mix of
As China s Soybean Oil Imports Fall, Production Expands
 United States Department of Agriculture Foreign Agricultural Service Circular Series FOP 10-10 October 2010 As China s Soybean Oil Fall, Expands 12 10 Million Metric Tons 8 6 4 2 0 2006/07 2007/08 China
NJ Solar Market Update As of 10/31/15
 NJ Solar Market Update As of 10/31/15 Prepared by Charlie Garrison Renewable Energy Committee Meeting November 10, 2015 SOLAR INSTALLED CAPACITY DATA The preliminary installed solar capacity as of 10/31/15
System Management Principles Statement
 System Management Principles Statement Compliance report for December 213 and January 214 Summary of balancing actions and breaches for December 213 - January 214 Performance compared to last year Summary
2007 AAEA Livestock Outlook Symposium
 27 AAEA Livestock Outlook Symposium Ron Plain Professor of Agricultural Economics University of Missouri-Columbia www.ssu.missouri.edu/faculty/rplain Hog Price Outlook Production Efficiency 1 Head 9.5
Construction Sector Indices
 STATISTICAL RELEASE UGANDA BUREAU OF STATISTICS January to April 212 Construction Sector Indices HIGHLIGHTS Annual Changes show that the prices for the Whole Construction Sector (covering material prices,
Growing Fuel Use Limits Exports of Soybean Oil by South America
 United States Department of Agriculture Foreign Agricultural Service Circular Series FOP 11-09 ember 2009 Growing Fuel Use Limits of Soybean Oil by South America 2006/07 Soybean Oil Distribution Soybean
U.S. Soybean Exports Forecast to Reach Record
 United States Department of Agriculture Foreign Agricultural Service July 2017 U.S. Soybean Exports Forecast to Reach Record 60 Accumulated Exports by Week Total Commitments of Soybeans as of End of June
Port Botany. Trade Statistics Bulletin 1 July June 2018
 Port Botany Trade Statistics Bulletin 1 July 2017 30 June 2018 FY 2017/18 Port Botany Container Trade Jul 2017 Aug 2017 Sep 2017 Oct 2017 Nov 2017 Dec 2017 Jan 2018 Feb 2018 Mar 2018 Apr 2018 May 2018
International Coal Markets
 International Coal Markets www.coalimp.org.uk Nigel Yaxley Managing Director, CoalImp 26 th November 28 International Coal Markets World supply and demand Seaborne trade Reserves and resources International
COMPILED BY GLASS S. Auction Report - LCV November 2013
 GLASS S Auction Report - LCV November 2013 Contents Market Commentary Page 3 Whole Market Summary Page 8 Average Sales Price Year on Year Page 9 Sales Price Compared to Number of Entries (all ages) Page
U.S. Soybean Prices Fall as Buyers Focus Turns to South America
 United States Department of Agriculture Foreign Agricultural Service Circular Series FOP 2-10 ruary 2010 U.S. Soybean Prices Fall as Buyers Focus Turns to South America $11.00 Daily U.S. Soybean Cash Price