Update of Poultry Fundamentals April 18
|
|
|
- Julianna Todd
- 5 years ago
- Views:
Transcription
1 Update of Poultry Fundamentals April 18 Contact us: Visit our updated website Follow us on 4/13/2018 AdvancedEconomicSolutions 1
2 Discussion Broiler producers are cutting back on the size of the broiler supply flock, presumably in an effort to combat smaller profits. Protein prices are under immense bearish pressure, and recent developments in Argentinian soybean crop have caused soymeal prices to surge. A decline in production potential is reassuring, but producers were already holding chicken output to levels only modestly ahead of YA levels. That trend continues, with recent production growth falling short of 1%. Weak production growth will likely persist throughout most of Producers are probably aware that waiting for beef and pork producers to move into a dire margin situation is the best time to ramp up production. Given the amount of beef and pork expected during this year, it may be reasonable to anticipate more substantial chicken production growth in The price outlook for 2018, given weak production trends, is moderately bullish. Turkey producers are facing negative margins, with whole bird prices remaining weak despite relatively strong export activity. Producers have taken decisive action, slashing poult numbers in an effort to curb output, which is already below YA levels. The price outlook is quite bullish as prices have surged recently. Only minor AI outbreaks have been reported in the US so far this year, and no substantial disease spread has occurred. The cases have been low pathogenic, and have failed to make headlines. The risk is present through June. Chicken production was up -0.2% over the past 90 days The broiler supply flock was up 3.1% YOY as of March 1st Chicken exports were up 1.2% YOY during February Total chicken in cold storage was up 15% YOY on March 1 st ; Wing inventories approaching YA levels Turkey production was down 1.3% over the past 90 days Turkey hatchery data shows poult placements down 3.3% YOY during February Turkey exports were up 9.9% YOY in February Total turkey in cold storage was up 13% YOY on Mar 1 st, with breast meat inventories up 16% YOY 4/13/2018 AdvancedEconomicSolutions 2

3 Lbs $/Lb Executive Summary: Major Proteins Producer margins vary, but production of major proteins is mostly higher regardless Exports have been strengthening, but risk of weaker exports looms as trade disputes heat up Meat supplies are expected to exceed YA by more than 2% this year Cattle, Hog, Broiler, & Turkey Producer Spot Margins (0.10) (0.20) (0.30) Forecast Cattle Margins Hog Margins Broiler Margins Turkey Margins Total US Meat Trade (Million Lbs) 18,000 16,000 14,000 12,000 10,000 8,000 6,000 4,000 2, % -6.1% 3.2% 14.6% 8.6% -17.0% 12.9% 1.6% 3.9% -1.3%-0.9% 28.1% -6.0% 3.5% -8.8% 6.3%5.7% 4.4%-2.0% 14.1% -2.9% -10.7%-0.6%-15.2%2.4%-7.4%-8.9% 5.1%4.1% 24.6%13.5% -7.6%0.2%0.1% % Per Capita Meat Supplies Beef, Pork, Chicken, & Turkey -2.5% -0.9% -1.9% -1.1% 0.7% -0.6% 4.4% 1.6% 1.1% 2.1% Imports Exports 4/13/2018 AdvancedEconomicSolutions 3


4 Jan Feb Mar Apr May Jun Jul Aug Sep Oct Nov Dec 000 Head Executive Summary: Chicken The broiler supply flock is still much larger than YA, but is shrinking counter-seasonally as producer margins erode On a 13-week basis, chicken production growth is actually negative vs YA Per capita chicken supplies are expected to be up fractionally during ,000 58,000 57,000 56,000 55,000 54,000 53,000 52, % 3.5% 3.1% Broiler Supply Flock W/ YOY Change 2.0% 0.5% -0.6% -0.9% -1.2% -1.6% -1.1% -0.8% -1.0% 10% 8% 6% 4% 2% 0% Live Weight Chicken Production: YOY % Change 13-Wk Avg -2% /13/2018 AdvancedEconomicSolutions % -4.4% 5-Yr Avg F 2018 Per Capita Chicken Supplies 3.3% 0.7% -3.0% 1.9% 1.8% 6.6% 0.9% 1.6% 0.5%
 (0.")
5 $/lb Executive Summary: Turkey Turkey producer margins have tanked on lower whole bird prices Production growth has been mostly negative over the past 6 months Weak production growth will likely drive negative turkey supply growth this year Estimated Turkey Producer Margins (0.10) (0.20) Month Avg Forecast Actual Current % 10% 5% 0% -5% -10% Live Weight Turkey Production: YOY % Change 13-Wk Avg -15% /13/2018 AdvancedEconomicSolutions % -4.0% Per Capita Turkey Supplies -3.0% -1.8% -0.6% 0.0% -1.3% 1.3% 3.8% -1.2% -1.2%
6 Chicken Fundamentals 4/13/2018 AdvancedEconomicSolutions 6

 (120) (15) 2012 2013 2014 2015 2016 2017 2018 2019 0 (60) 2010 2011 2012 2013 2014 2015 2016 2017 2018 (180) 6-Month Avg Forecast Weekly Current Sanderson")
7 cents/lb Millions of Dollars - Sanderson Millions of Dollars - Pilgrim's Broiler Producer Margins >Broiler margins are positive with positive outlook >Major producer net income is positive by weakening unlikely to move negative for long 35 Estimated Broiler Producer Margins Major Producers: Quarterly Net Income (5) 0.2 (20) (60) (10) 0.1 (40) (120) (15) (60) (180) 6-Month Avg Forecast Weekly Current Sanderson Pilgrims % YA 4/13/2018 AdvancedEconomicSolutions 7
8 Index (Jan 2007 = 100) Broiler Feed Price Index >Feed costs expected to remain relatively low this year and next >South American soybean crop issues more than offsetting Chinese soybean import duties Pro Forma Index of Broiler Feed Prices w/ Forecast /13/2018 AdvancedEconomicSolutions 8

9 Broiler Supply Flock & Hatchery >Mar 1 supply flock 56.3 million hens, up 3.1% YOY >Growth expected to slow and turn negative by midyear 4/13/2018 AdvancedEconomicSolutions 9
 Weekly Liveweight Chicken Production (52-Week Moving Average Thousands of Lbs) 340,000 1,000,000 20.0% 18.0% 16.")
10 Production by Size Total Production Broiler Production >Total broiler production YoY: 4-week +0.9% 13-week -0.2% 52-week +1.3% YTD +0.1% >Slaughter YoY: YTD -0.6%, 13-week -0.9% Weights YoY: YTD +0.6%, 13-week +0.36% 22.0% Chicken Production Growth by Size (52-Week Moving Average) Weekly Liveweight Chicken Production (52-Week Moving Average Thousands of Lbs) 340,000 1,000, % 18.0% 16.0% 320, , , % 12.0% 280, , % 260, % 6.0% 240, , % 2.0% 0.0% 220, , , % 180, , % -6.0% -8.0% 160, , , % -12.0% , ,000 Small Bird Production Growth Large Bird Production Growth Small-Med Prod Growth Med-Large Prod Growth Total Small Bird Production Total Production Large Bird Production 4/13/2018 AdvancedEconomicSolutions 10
11 Q Q Q Q Q Q Q Q Q Q Q Q Q Q Q Q Q Q Q Q Broiler Production >2018 production: 41.9 billion lbs, % YoY (AES Forecast) 10,700 Quarterly U.S. Broiler Production w/ AES Forecasts 10,200 9,700 9,200 8,700 Q1 Q2 Q3 Q4 5-Yr Avg Chicken Production w/ AES Forecasts YOY % Change 6% 5% 4% 3% 2% 1% 0% -1% -2% 1.5% 1.6% 1.6% 3.1% 4.7% 4.2% 5.5% 1.1% 3.3% 2.3% -0.3% 1.3% 1.9% 1.5% 2.1% 4.0% 1.6% 1.1% 1.7% -1.6% 4/13/2018 AdvancedEconomicSolutions 11

12 Feb Mar Apr May Jun Jul Aug Sep Oct Nov Dec Jan Feb Mar Apr May Jun Jul Aug Sep Oct Nov Dec Jan 000 lbs 000 lbs Feb Mar Apr May Jun Jul Aug Sep Oct Nov Dec Jan Feb Mar Apr May Jun Jul Aug Sep Oct Nov Dec Jan 000 lbs 000 lbs Chicken in Cold Storage >March 1st Total inventories: +15% YoY >Breasts +6.5% LQs -25% Wings -2% Chicken in Cold Storage ("FOM") LQs in Cold Storage ("FOM") 950, , , , , , , , , , ,000 80, Yr Yr Breast Meat in Cold Storage ("FOM") Wings in Cold Storage ("FOM") 220,000 90, , , , ,000 80,000 70,000 60, ,000 50, Yr Yr 4/13/2018 AdvancedEconomicSolutions 12


13 M Lbs Chicken Trade >The US exported 552 M lbs of chicken in February, up 1.2% YOY >USDA expects 2018 exports to exceed YA by 2.5% 660, , , , ,000 YTD: -0.1% 6,650,000 6,450,000 6,250,000 Chicken Exports Ann Exports % -1% -2% -3% Jan Feb Mar Apr May Jun Jul Aug Sep Oct Nov Dec 5-Yr Y Ann Exports % ,918, ,555,285 13% ,807,184-13% ,920,013 2% ,783,454-3% ,202,730 9% ,205,457 0% ,903,997 13% ,960,761 18% ,817,938-2% ,762,148-1% ,977,612 3% ,274, % ,345, % ,304, % ,321, % ,644, % ,780, % ,950, % 4/13/2018 AdvancedEconomicSolutions 13
14 1/1/2013 3/1/2013 5/1/2013 7/1/2013 9/1/ /1/2013 1/1/2014 3/1/2014 5/1/2014 7/1/2014 9/1/ /1/2014 1/1/2015 3/1/2015 5/1/2015 7/1/2015 9/1/ /1/2015 1/1/2016 3/1/2016 5/1/2016 7/1/2016 9/1/ /1/2016 1/1/2017 3/1/2017 5/1/2017 7/1/2017 9/1/ /1/2017 1/1/2018 3/1/ Lbs Chicken Trade Detail 700,000 Total US Chicken Exports by Trade Partner 600, , , , , ,000 - Mexico Russia Angola Canada Cuba Other 4/13/2018 AdvancedEconomicSolutions 14

15 B/S Chicken Breast 4/13/2018 AdvancedEconomicSolutions 15

16 Chicken Wings 4/13/2018 AdvancedEconomicSolutions 16

17 Cents/Lb Wings Continued 230 Wing Prices by Size Small Small Forecast Medium Medium Forecat Jumbo Jumbo Forecast Size This Wk Year Jan Feb Mar Apr May Jun Jul Aug Sep Oct Nov Dec Ann % YoY Jumbo Medium Small % % -11.8% % 6.6% 4/13/2018 AdvancedEconomicSolutions 17

18 Leg Quarters 4/13/2018 AdvancedEconomicSolutions 18
19 AES, Inc. Jan Feb Mar Apr May Jun Jul Aug Sep Oct Nov Dec Ann Avg % YA Q1 Q2 Q3 Q % Wings (Jumbo) % % % AES, Inc. Jan Feb Mar Apr May Jun Jul Aug Sep Oct Nov Dec Ann Avg % YA Q1 Q2 Q3 Q MDC <15% % Fat, Fresh % % % AES, Inc. Jan Feb Mar Apr May Jun Jul Aug Sep Oct Nov Dec Ann Avg % YA Q1 Q2 Q3 Q4 117 White Trim, % <15% Fat, % Fresh % % AES, Inc. Jan Feb Mar Apr May Jun Jul Aug Sep Oct Nov Dec Ann Avg % YA Q1 Q2 Q3 Q Chunk Meat % Chicken % % % AES, Inc. Jan Feb Mar Apr May Jun Jul Aug Sep Oct Nov Dec Ann Avg % YA Q1 Q2 Q3 Q Tenders, Line % Run, Clipped % % % AES, Inc. Jan Feb Mar Apr May Jun Jul Aug Sep Oct Nov Dec Ann Avg % YA Q1 Q2 Q3 Q % Tenders, Small % % % AES, Inc. Jan Feb Mar Apr May Jun Jul Aug Sep Oct Nov Dec Ann Avg % YA Q1 Q2 Q3 Q % Thighs % % % AES, Inc. Jan Feb Mar Apr May Jun Jul Aug Sep Oct Nov Dec Ann Avg % YA Q1 Q2 Q3 Q % B/S Thigh % % % /13/2018 AdvancedEconomicSolutions 19
20 AES, Inc. Jan Feb Mar Apr May Jun Jul Aug Sep Oct Nov Dec Ann Avg % YA Q1 Q2 Q3 Q Chicken Leg % Meat % % % AES, Inc. Jan Feb Mar Apr May Jun Jul Aug Sep Oct Nov Dec Ann Avg % YA Q1 Q2 Q3 Q Drumsticks, % Bulk % % % AES, Inc. Jan Feb Mar Apr May Jun Jul Aug Sep Oct Nov Dec Ann Avg % YA Q1 Q2 Q3 Q WBE/Broiler % Cutout % % % AES, Inc. Jan Feb Mar Apr May Jun Jul Aug Sep Oct Nov Dec Ann Avg % YA Q1 Q2 Q3 Q % WOGs (Small) % % % AES, Inc. Jan Feb Mar Apr May Jun Jul Aug Sep Oct Nov Dec Ann Avg % YA Q1 Q2 Q3 Q % B/S Breast % % % AES, Inc. Jan Feb Mar Apr May Jun Jul Aug Sep Oct Nov Dec Ann Avg % YA Q1 Q2 Q3 Q % Wings (Small) % % % AES, Inc. Jan Feb Mar Apr May Jun Jul Aug Sep Oct Nov Dec Ann Avg % YA Q1 Q2 Q3 Q % Leg Quarters % % % /13/2018 AdvancedEconomicSolutions 20


21 Price Inflation >Wholesale chicken prices: -5.1% YOY over the past 3 months >Retail chicken prices: +2.6% YOY over the past 3 months 40.0% Chicken PPI vs Chicken CPI (YoY % ) 30.0% 20.0% 10.0% 0.0% -10.0% -20.0% -30.0% End-User Margin Compression PPI Chicken CPI Chicken 4/13/2018 AdvancedEconomicSolutions 21
22 Turkey Fundamentals 4/13/2018 AdvancedEconomicSolutions 22
23 $/lb Turkey Producer Margins & Hatchery >Margins remain negative as producers struggle with sharply lower whole bird prices >Producers are responding with major cuts to poult production (0.10) Estimated Turkey Producer Margins (0.20) Month Avg Forecast Actual Current Turkey Poults Hatched Turkey Poults Placed 26,000,000 24,500,000 25,500,000 24,000,000 25,000,000 23,500,000 24,500,000 23,000,000 24,000,000 22,500,000 23,500,000 22,000,000 23,000,000 21,500,000 22,500,000 21,000,000 22,000,000 20,500,000 21,500,000 Jan Feb Mar Apr May Jun Jul Aug Sep Oct Nov Dec 20,000,000 Jan Feb Mar Apr May Jun Jul Aug Sep Oct Nov Dec 5-Yr Avg Yr /13/2018 AdvancedEconomicSolutions 23


24 Turkey Slaughter & Weights >During the past 13 weeks, turkey production was down 1.25% YoY >Weights are down 0.7% YoY during that time 15% 13-Week MA Turkey Production Week MA Turkey Weights % % % % % % /13/2018 AdvancedEconomicSolutions 24
: 5.95 billion lbs, down 0.")

25 Q Q Q Q Q Q Q Q Q Q Q Q Q Q Q Q Q Q Q Q Turkey Production >2018 production (USDA): 5.95 billion lbs, down 0.6 YoY 1,650 1,600 1,550 1,500 1,450 1,400 1,350 1,300 Quarterly U.S. Turkey Production Q1 Q2 Q3 Q4 5-Yr Avg Turkey Production YOY % Change 15% 12.1% 10% 6.9% 7.3% 9.4% 5% 0% 2.6% 0.4% 3.7% 3.7% 1.4% 0.4% 0.5% -5% -3.9% -2.7% -4.0% -2.5% -2.4% -1.5% -1.8% -10% -8.7% -8.5% 4/13/2018 AdvancedEconomicSolutions 25


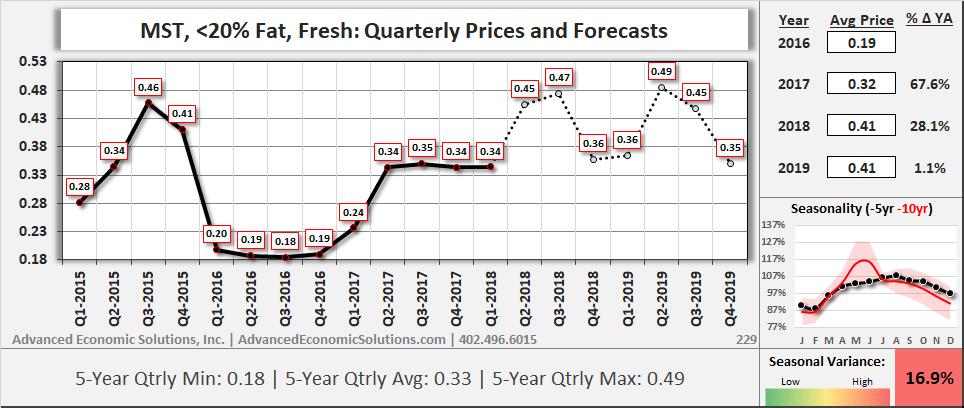
26 Turkey in Cold Storage >March 1 st Total: +13% YoY >Whole bird +20% YoY Breasts +16% YoY MST +13% YoY 000 lbs 000 lbs Jan Jan Feb Feb Mar Mar Apr Apr May May Jun Jun Jul Jul Aug Aug Sep Sep Oct Oct Nov Nov Dec Dec 660, , , , , ,000 Turkey in Cold Storage 5-Yr ,000 Turkey Breast in Cold Storage 75,000 25,000 5-Yr /13/2018 AdvancedEconomicSolutions 26


27 M Lbs Turkey Trade >US exports of turkey were 48 million lbs in February, up 9.9% YOY >Absent an AI outbreak, exports could be stronger on the year, supporting 6% prices 70,000 65,000 60,000 55,000 50,000 45,000 40,000 YTD: 12.2% 300, , ,000 - Turkey Exports Ann Exports % 3% 0% -3% -6% Jan Feb Mar Apr May Jun Jul Aug Sep Oct Nov Dec 5-Yr Y Ann Exports % , ,999 9% ,579-10% ,714 10% ,500-9% ,550 29% ,608-4% ,522 0% ,252 24% ,834-21% ,800 9% ,307 21% , % , % , % , % , % , % , % 4/13/2018 AdvancedEconomicSolutions 27

28 Turkey Prices 4/13/2018 AdvancedEconomicSolutions 28
29 Update of Poultry Fundamentals April 18 Contact us: Visit our updated website Follow us on 4/13/2018 AdvancedEconomicSolutions 29
Monthly Hog Market Update United States Hog Production
 This information is provided as a resource by Saskatchewan Agriculture staff All prices are in Canadian dollars unless otherwise noted. Please use this information at your own risk. Monthly Hog Market
2007 AAEA Livestock Outlook Symposium
 27 AAEA Livestock Outlook Symposium Ron Plain Professor of Agricultural Economics University of Missouri-Columbia www.ssu.missouri.edu/faculty/rplain Hog Price Outlook Production Efficiency 1 Head 9.5
USA Weekly Federally Inspected Hog Slaughter Actual Weekly Hog Slaughter + Implied Slaughter from June Hogs/Pigs Survey
 Pork Merchandiser s Profit Maximizer - Retail Edition - 2016 The National Pork Board, Des Moines, IA 515-223-2600; Prepared by Steiner and Company, Manchester, NH 800-526-4612. September 19, 2016 Hog value
US PORK EXPORTS: FRESH/FROZEN/PROC.
 Pork Merchandiser s Profit Maximizer - Retail Edition - 2017 The National Pork Board, Des Moines, IA 515-223-2600; Prepared by Steiner and Company, Manchester, NH 800-526-4612. April 17, 2017 February
Sheep Market Outlook. Mark Kozlowski, AHDB Beef & Lamb AHDB Outlook Conference 9 February 2016
 Sheep Market Outlook Mark Kozlowski, AHDB Beef & Lamb AHDB Outlook Conference 9 February 2016 Overview Current situation UK Current situation rest of the world UK outlook Wildcards Current situation in
Canada Meat Market Report
 January 2018 January 18th, 2018 Canada Meat Market Report - Supply and Price Situa on for Domes c and Imported Beef - Prepared for Meat and Livestock Australia Steiner Consul ng Group, Manchester, NH,
Corn Outlook. David Miller Director of Research & Commodity Services Iowa Farm Bureau Federation December 2013
 Corn Outlook David Miller Director of Research & Commodity Services Iowa Farm Bureau Federation December 2013 Source: USDA-WAOB U.S. Corn Supply & Usage U.S. Corn Supply & Usage Comments With the largest
COMPARISON OF FIXED & VARIABLE RATES (25 YEARS) CHARTERED BANK ADMINISTERED INTEREST RATES - PRIME BUSINESS*
 CHARTERED BANK ADMINISTERED INTEREST RATES - PRIME BUSINESS*") COMPARISON OF FIXED & VARIABLE RATES (25 YEARS) 2 Fixed Rates Variable Rates For Internal Use Only. FIXED RATES OF THE PAST 25 YEARS AVERAGE RESIDENTIAL MORTGAGE LENDING RATE - 5 YEAR* (Per cent) Year
COMPARISON OF FIXED & VARIABLE RATES (25 YEARS) 2 Fixed Rates Variable Rates For Internal Use Only. FIXED RATES OF THE PAST 25 YEARS AVERAGE RESIDENTIAL MORTGAGE LENDING RATE - 5 YEAR* (Per cent) Year
COMPARISON OF FIXED & VARIABLE RATES (25 YEARS) CHARTERED BANK ADMINISTERED INTEREST RATES - PRIME BUSINESS*
 CHARTERED BANK ADMINISTERED INTEREST RATES - PRIME BUSINESS*") COMPARISON OF FIXED & VARIABLE RATES (25 YEARS) 2 Fixed Rates Variable Rates FIXED RATES OF THE PAST 25 YEARS AVERAGE RESIDENTIAL MORTGAGE LENDING RATE - 5 YEAR* (Per cent) Year Jan Feb Mar Apr May Jun
COMPARISON OF FIXED & VARIABLE RATES (25 YEARS) 2 Fixed Rates Variable Rates FIXED RATES OF THE PAST 25 YEARS AVERAGE RESIDENTIAL MORTGAGE LENDING RATE - 5 YEAR* (Per cent) Year Jan Feb Mar Apr May Jun
Monthly Mexico Meat Market Report
 Monthly Mexico Meat Market Report Supply and Price Situation for Domestic and Traded Beef February 27, 2017 Prepared for Meat and Livestock Australia Steiner Consul ng Group, Manchester, NH, U.S.A table
4,405 5,084 2,706 1,838
 Pork Merchandiser s Profit Maximizer - Retail Edition - 2017 The National Pork Board, Des Moines, IA 515-223-2600; Prepared by Steiner and Company, Manchester, NH 800-526-4612. August 7, 2017 1. Exports
Commercial-in-Confidence Ashton Old Baths Financial Model - Detailed Cashflow
 Year 0 1 2 3 4 5 6 7 8 9 10 11 12 13 Oct-16 Nov-16 Dec-16 Jan-17 Feb-17 Mar-17 Apr-17 May-17 Jun-17 Jul-17 Aug-17 Sep-17 Oct-17 2,038 2,922 4,089 4,349 6,256 7,124 8,885 8,885 8,885 8,885 8,885 8,885 9,107
RESTAURANT PERFORMANCE INDEX: Total Index and Customer Traffic National Tracking Index. Values over 100 Indicate Expansion
 Pork Merchandiser s Profit Maximizer - Retail Edition - 2016 The National Pork Board, Des Moines, IA 515-223-2600; Prepared by Steiner and Company, Manchester, NH 800-526-4612. October 31, 2016 1. Higher
Global Monthly March 2019
 Global Monthly March 19 Percent of world bonds outstanding 3 5 15 5 Jan-1 Jun-1 Nov-1 Apr-15 Sep-15 Feb-1 Jul-1 Dec-1 May-17 Oct-17 Mar-1 Aug-1 Dec-1 Mar-19 March 19 Percent, year-on-year 7 5 3 1 1Q1 1Q
August 11, Bob Costello Senior Vice President & Chief Economist American Trucking Associations
 Economic & Industry Update for U.S. Bank Are You Prepared For An Industry Acceleration? August 11, 2015 Bob Costello Senior Vice President & Chief Economist American Trucking Associations Twitter: @ATAEconBob
Canola Weekly. Index. WCE May/07 Canola Jul 9-Aug 14-Sep 20-Oct 27-Nov 4-Jan 8-Feb 16-Mar
 March 2, 2 Canola Weekly Index ) Canola Steady Despite Weak Soy Complex 2) Slow Crush Improves Canola Oil Basis ) Export Demand Underpins Canola Last week, we mentioned that May canola had key support
Pakistan Oilseed Processors Seize Opportunity to Crush Soybeans
 United States Department of Agriculture Foreign Agricultural Service December 2015 Pakistan Oilseed Processors Seize Opportunity to Crush Soybeans Pakistan, long an importer of soybean meal, is transitioning
Argentine Exporters Switch to Soybean Oil as Biodiesel Exports Fall
 United States Department of Agriculture Foreign Agricultural Service Circular Series FOP 08-13 Argentine Exporters Switch to Soybean Oil as Biodiesel Exports Fall Argentina s soybean oil exports have surged
/ PRELIMINARY STEEL IMPORTS INCREASE 15% IN APRIL Import Market Share 27% in April
 News Release FOR IMMEDIATE RELEASE May 23, 2014 CONTACT Lisa Harrison 202.452.7115/ lharrison@steel.org PRELIMINARY STEEL IMPORTS INCREASE 15% IN APRIL Import Market Share 27% in April Washington, D.C.
U.S. Classes 3-8 Used Trucks
 Americas Commercial Transportation Research Co., LLC www.actresearch.net COMMERCIAL VEHICLES State of the Industry U.S. Classes 3-8 Used Trucks May 215 Data Published June 24, 215 Contributor to Blue Chip
FOR IMMEDIATE RELEASE
 Article No. 7353 Available on www.roymorgan.com Roy Morgan Unemployment Profile Wednesday, 11 October 2017 2.498 million Australians (18.9%) now unemployed or under-employed In September 1.202 million
Indian Soybean Meal Exports Unlikely to Recover in 2015/16
 United States Department of Agriculture Foreign Agricultural Service November 2015 Indian Soybean Meal Exports Unlikely to Recover in Though once a significant regional exporter of soybean meal, India
U.S. Soybean Exports Forecast to Reach Record
 United States Department of Agriculture Foreign Agricultural Service July 2017 U.S. Soybean Exports Forecast to Reach Record 60 Accumulated Exports by Week Total Commitments of Soybeans as of End of June
Palm and Soy Oil Use Expands at Expense of Other Oils
 United States Department of Agriculture Foreign Agricultural Service September 2015 Revised on September 15, 2015 Palm and Soy Oil Use Expands at Expense of Other Oils As global demand for vegetable oil
Soybean and Oilseed Meal Import Prospects Higher as Severe Weather Damages EU Crops
 Million Tons Million Tons Million Tons United States Department of Agriculture Foreign Agricultural Service August 2018 Soybean and Oilseed Meal Import Prospects Higher as Severe Weather Damages EU Crops
FOR IMMEDIATE RELEASE
 Article No. 7433 Available on www.roymorgan.com Roy Morgan Unemployment Profile Friday, 12 January 2018 2.6m Australians unemployed or under-employed in December The latest data for the Roy Morgan employment
STEEL IMPORTS DOWN 5% YEAR-TO-DATE THROUGH FEBRUARY Finished Import Market Share YTD at 25%
 News Release FOR IMMEDIATE RELEASE March 23, 2018 CONTACT Lisa Harrison 202.452.7115/lharrison@steel.org STEEL IMPORTS DOWN 5% YEAR-TO-DATE THROUGH FEBRUARY Finished Import Market Share YTD at 25% Washington,
FOR IMMEDIATE RELEASE
 Article No. 7845 Available on www.roymorgan.com Roy Morgan Unemployment Profile Friday, 18 January 2019 Unemployment in December is 9.7% and under-employment is 8.8% FOR IMMEDIATE RELEASE Australian unemployment
STEEL IMPORTS DOWN 23% FROM PRIOR MONTH IN MAY Finished Import Market Share YTD at 26%
 News Release FOR IMMEDIATE RELEASE June 25, 2018 CONTACT Lisa Harrison 202.452.7115/lharrison@steel.org STEEL IMPORTS DOWN 23% FROM PRIOR MONTH IN MAY Finished Import Market Share YTD at 26% Washington,
EU Market Situation for Poultry. Civil Dialogue Group. 25 October 2016
 EU Market Situation for Poultry Civil Dialogue Group 25 October 216 Thousand Tons F O R E C A S T 16 14 Experts EU production forecast on Poultry and Rabbit (Missing data (BE-EL-AT-RO-LT-SE) - No expert
2017 Risk and Profit Conference Breakout Session Presenters. 13. Ethanol and Biodiesel Market and Profitability Prospects
 2017 Risk and Profit Conference Breakout Session Presenters 13. Ethanol and Biodiesel Market and Profitability Prospects Dan O Brien Daniel O Brien was raised on a grain and livestock
Monthly Mexico Meat Market Report
 Monthly Mexico Meat Market Report Supply and Price Situation for Domestic and Traded Beef June 21, 2018 Prepared for Meat and Livestock Australia Steiner Consul ng Group, Manchester, NH, U.S.A table of
/ PRELIMINARY STEEL IMPORTS INCREASE 2% IN MAY Import Market Share 23% in May
 News Release FOR IMMEDIATE RELEASE June 25, 2013 CONTACT Lisa Harrison 202.452.7115/ lharrison@steel.org PRELIMINARY STEEL IMPORTS INCREASE 2% IN MAY Import Market Share 23% in May Washington, D.C. Based
October 23, September year. in 1Q confidence in our. exacerbated by the. 0.3 percent. outpu. (over) Index of Sales. Mar 12.
 Index of Sales. Mar 12.") October 23, 20122 REPORT ON BUSINESSS TRENDS September 20122 Industry Performance Reverts to Pace off GDP in Broad Economy Index of Sales September 2011 - September 2012 140 130 125 127 125 120 114 117
October 23, 20122 REPORT ON BUSINESSS TRENDS September 20122 Industry Performance Reverts to Pace off GDP in Broad Economy Index of Sales September 2011 - September 2012 140 130 125 127 125 120 114 117
Energy Outlook. U.S. Energy Information Administration. For EnerCom Dallas February 22, 2018 Dallas, TX
 Energy Outlook For EnerCom Dallas Dallas, TX Jeff Barron Industry Economist, U.S. Energy Information Administration U.S. Energy Information Administration Independent Statistics & Analysis www.eia.gov
STEEL IMPORTS UP 17% IN JANUARY Finished Import Market Share at 26%
 News Release FOR IMMEDIATE RELEASE February 26, 2018 CONTACT Lisa Harrison 202.452.7115/lharrison@steel.org STEEL IMPORTS UP 17% IN JANUARY Finished Import Market Share at 26% Washington, D.C. Based on
Strong Global Grain Production Isn t Good Enough. David Hightower The Hightower Report
 Strong Global Grain Production Isn t Good Enough David Hightower The Hightower Report Big Picture Factors Cost of Production Pricing Not a downtrend signal Goldman $20 oil Forecast was wrong 8.9 mbd!
Market Outlook. David Reinbott.
 Market Outlook David Reinbott Agriculture Business Specialist P.O. Box 187 Benton, MO 63736 (573) 545-3516 http://extension.missouri.edu/scott/agriculture.aspx reinbottd@missouri.edu Trending Issues Volatile
Steers Heifers Young Bulls Cows
 Deadweight Prices /100Kg (Including VAT) Steers Heifers Young Bulls Cows U3 U4 R3 R4 O3 O4 P+ 435.7 432.4 423.2 422.8 402.9 404.2 384.7 451.8 447.8 435.2 433.5 413.7 417.0 382.2 423.5 422.0 413.4 415.3
Soybean Trade Growth: A Story of Brazil, the United States, and China
 United States Department of Agriculture Foreign Agricultural Service October 2017 Soybean Trade Growth: A Story of Brazil, the United States, and China 12-Month Soybean Export Growth Year Ending September
ANALYST BRIEFING FOR THE FOURTH QUARTER ENDED FEBRUARY 2017
 ANALYST BRIEFING FOR THE FOURTH QUARTER ENDED 2016 22 FEBRUARY 2017 MSM Malaysia Holdings Berhad Analyst Briefing Q4 2016 22/2/2017 1 CONTENTS 01 02 03 04 05 Group Financial Highlights Performance Review
2011 Indiana Agricultural Outlook
 2011 Indiana Agricultural Outlook Corinne Alexander & Chris Hurt hurtc@purdue.edu September 13, 2010 World Economic Growth Ethanol Dollar Value Surprises and Uncertainty! Change Wheat Production 2010 vs.
Gas & electricity - at a glance
 $/barrel /tco 2 e p/therm /MWh Gas & electricity - at a glance Week-on-Week Annual Gas Price Changes Short-term gas contracts jump Cold snap forecast for the first half of February, lifting demand Longer-dated
Sharp Decline in Vegetable Oil Stocks Leads to Steeply Higher Prices
 United States Department of Agriculture Foreign Agricultural Service Circular Series FOP 1-11 Sharp Decline in Vegetable Oil Leads to Steeply Higher Prices Commodity prices have been on an upward trend
EU Market Situation for Poultry. Committee for the Common Organisation of the Agricultural Markets 22 October 2015
 EU Market Situation for Poultry Committee for the Common Organisation of the Agricultural Markets 22 October 215 Euro Dollar exchange rate 1.6 22/9/215: 1 EUR = 1.12 USD 1.4 1.2 1. Exchange rate: Spot,
Economic & Steel Market Development in Japan
 1 Economic & Steel Market Development in Japan 68 th OECD Steel Committee Paris May 6-7, 2010 The Japan Iron & Steel Federation 2 Macro-economic overview Steel Supply and Demand v v v Steel Production
D G A G R I D A S H B O A R D : A P P L E S
 75 79 60 56 49 74 65 59 54 42 76 63 58 53 78 55 42 43 79 44 81 63 47 83 64 59 53 48 Sources: Eurostat, MSs notifications, DG Agri, Comext, Comtrade, GTA, ITC, AMI, Expert groups, Freshfel, Wapa. 89 68
Dave Carroll Capital Markets Day Markets Update
 Dave Carroll Capital Markets Day 2004 Markets Update Tomkins Operates in Diverse End Markets Breakdown 2003 Sales ( 3,150m, US$4,795m) Non-Residential Construction 11% Other 9% Automotive OE 27% Residential
The ISM Manufacturing Survey Points to Imminent Economic Recovery, Possibly in 2009 May 1, Chart 1
 Northern Trust Global Economic Research 50 South LaSalle Chicago, Illinois 3 northerntrust.com Asha G. Bangalore agb3@ntrs.com The ISM Manufacturing Survey Points to Imminent Economic Recovery, Possibly
Weak Real to Boost Brazil s Soybean Exports in 2016
 United States Department of Agriculture Foreign Agricultural Service October 2015 Weak Real to Boost Brazil s Soybean Exports in 2016 Brazil s exchange rate is having a significant impact on domestic and
Wheat Marketing Situation
 Wheat Marketing Situation Prepared by: Darrell L. Hanavan Executive Director Colorado Wheat Administrative Committee If you would like to receive an email when this report is updated, email gmostek@coloradowheat.org
It s time to start buying propane for fall Expect to pay more to dry 2017 corn crop By Bryce Knorr, senior grain market analyst
 It s time to start buying propane for fall Expect to pay more to dry 2017 corn crop By Bryce Knorr, senior grain market analyst It s the end of winter hopefully and that means it s a good time to buy coats,
2018 Outlook for Grains and Oilseeds
 2018 Outlook for Grains and Oilseeds Present to the American Fats and Oils Associa;on October 2017 AdvancedEconomicSolu0ons US$ Declines from Peak - Now at lowest point since October 2015 Currently in
/
 News Release FOR IMMEDIATE RELEASE June 26, 2012 CONTACT: NANCY GRAVATT 202.452.7115/ ngravatt@steel.org May Preliminary Finished Steel Imports 2 nd Highest Monthly Amount in 2012 Import Market Share at
Livestock, Dairy, and Poultry Outlook
 United States Department of Agriculture Electronic Outlook Report from the Economic Research Service www.ers.usda.gov LDP-M-94 Apr. 23, 2002 Livestock, Dairy, and Poultry Outlook Leland Southard (Coordinator)
GROWTH IN TENTH DISTRICT MANUFACTURING ACTIVITY EDGED HIGHER Federal Reserve Bank of Kansas City Releases September Manufacturing Survey
 FOR RELEASE Thursday, September 25, 2014 EMBARGOED FOR 10 A.M. CENTRAL TIME CONTACT: Pam Campbell 405-270-8617 Pam.Campbell@kc.frb.org GROWTH IN TENTH DISTRICT MANUFACTURING ACTIVITY EDGED HIGHER Federal
FINISHED STEEL IMPORT MARKET SHARE AT 25% IN JANUARY
 News Release FOR IMMEDIATE RELEASE March 27, 2019 CONTACT Lisa Harrison 202.452.7115/lharrison@steel.org FINISHED STEEL IMPORT MARKET SHARE AT 25% IN JANUARY Washington, D.C. Based on preliminary Census
May 2018 Short-Term Energy Outlook
 May 2018 for Williston Basin Petroleum Conference Bismarck, N.D. by Dr. Linda Capuano Administrator U.S. Energy Information Administration Independent Statistics & Analysis www.eia.gov Brent crude oil
/
 News Release FOR IMMEDIATE RELEASE July 5, 0 CONTACT: NANCY GRAVATT 0.45.75/ ngravatt@steel.org Finished Steel Imports Decline in June, But Up Percent in First Half 0 Import Market Share in 0 at 4 Percent
China s Rapeseed Meal Imports Rise as Seed Imports Decline
 United States Department of Agriculture Foreign Agricultural Service February 2017 China s Rapeseed Meal Rise as Seed Decline Trend in China Rapeseed 12-Month Moving Totals Trend In China Rapeseed Meal
Major Junctions Ahead Energy, Grains and Metals. David Hightower President, The Hightower Report
 Major Junctions Ahead Energy, Grains and Metals David Hightower President, The Hightower Report 30 25 23.55 2018 Commodity Performance - Annual Percent Change 20 16.49 15 10 10.09 6.44 5 0 0.24-5 -10-15
Monthly Mexico Meat Market Report
 Monthly Mexico Meat Market Report Supply and Price Situation for Domestic and Traded Beef June 19, 2017 Prepared for Meat and Livestock Australia Steiner Consul ng Group, Manchester, NH, U.S.A table of
/ Preliminary Steel Imports Increase 6% in May Import Market Share at 21%
 News Release FOR IMMEDIATE RELEASE June 21, 2011 CONTACT: NANCY GRAVATT 202.452.7115/ ngravatt@steel.org Preliminary Steel Imports Increase 6% in May Import Market Share at 21% Washington, D.C. Based on
High fuel costs could last Diesel and propane may not get much cheaper in 2019 By Bryce Knorr, senior grain market analyst
 High fuel costs could last Diesel and propane may not get much cheaper in 2019 By Bryce Knorr, senior grain market analyst In July I recommended using a dip in the energy market to lock in propane for
China 2017/18 Soybean Imports Soar on Appetite for Pork, Aquaculture, and Dairy
 United States Department of Agriculture Foreign Agricultural Service June 2017 China Soybean Soar on Appetite for Pork, Aquaculture, and Dairy China: Booming Farmed Aquaculture Production China: Record
Soybean Oil Prices Diverge on Different Supply Situations
 United States Department of Agriculture Foreign Agricultural Service Circular Series FOP 10-09 October 2009 Soybean Oil Prices Diverge on Different Supply Situations Soybean Oil Price ($/ton) $900 $850
Diesel prices at multi-year highs mean pain at the pump
 Diesel prices at multi-year highs mean pain at the pump Conflicting signals from Wall Street keep commodity prices unsettled By Bryce Knorr, senior grain market analyst Headline news this week provided
STEEL IMPORTS DOWN 10% YEAR-TO-DATE Finished Import Market Share YTD at 25%
 News Release FOR IMMEDIATE RELEASE August 24, 2018 CONTACT Lisa Harrison 202.452.7115/lharrison@steel.org STEEL IMPORTS DOWN 10% YEAR-TO-DATE Finished Import Market Share YTD at 25% Washington, D.C. Based
Prices indeed dropped on Thursday, aided by a surprise increase in crude oil supplies caused by stronger imports.
 Trump s war on OPEC Farm fuel prices resist President s attempt to jawbone cartel By Bryce Knorr, senior grain market analyst For a day or two, at least, it looked like President Trump s attempt to tweet
Diesel prices finally ease Winter weather and international events could determine your fuel bill for 2018 By Bryce Knorr, senior grain market analyst
 Diesel prices finally ease Winter weather and international events could determine your fuel bill for 2018 By Bryce Knorr, senior grain market analyst After rallying to their highest level in nearly three
COMPILED BY GLASS S. Auction Report - LCV November 2013
 GLASS S Auction Report - LCV November 2013 Contents Market Commentary Page 3 Whole Market Summary Page 8 Average Sales Price Year on Year Page 9 Sales Price Compared to Number of Entries (all ages) Page
Share of Brazil s Soybean Exports to China Spikes in August
 United States Department of Agriculture Foreign Agricultural Service September 2018 Share of Brazil s Soybean Exports to China Spikes in August Monthly Share of Brazil's Soybean Exports to China 85% 75%
Preliminary Steel Imports, Down 14% in June, Increase 35% in First Half of Year; Import Market Share 21% in Second Quarter 2010
 News Release FOR IMMEDIATE RELEASE July 27, 2010 CONTACT: NANCY GRAVATT 202.452.7115/ ngravatt@steel.org Preliminary Steel Imports, Down 14% in June, Increase 35% in First Half of Year; Import Market Share
FOR IMMEDIATE RELEASE
 Article No. 7761 Available on www.roymorgan.com Roy Morgan Unemployment Profile Monday, 8 October 2018 Unemployment down to 9.4% in September off two-year high Australian employment has grown solidly over
State of the Industry: U.S. Classes 3-8 Used Trucks
 Americas Commercial Transportation Research Co., LLC www.actresearch.net State of the Industry: U.S. Classes 3-8 Used Trucks November 212 Data Published December 24, 212 State of the Industry: U.S. Classes
Livestock, Dairy, and Poultry Outlook
 United States Department of Agriculture Electronic Outlook Report from the Economic Research Service www.ers.usda.gov LDP-M-125 Nov. 23, 2004 Livestock, Dairy, and Poultry Outlook Leland Southard (Coordinator)
ENERGY SLIDESHOW. Federal Reserve Bank of Dallas
 ENERGY SLIDESHOW Updated: March 13, 2018 ENERGY PRICES www.dallasfed.org/research/energy Brent & WTI & Crude Brent Oil Crude Oil Dollars per barrel 140 Brent (Mar 9 = $65.12) WTI (Mar 9 = $61.65) 120 100
D G A G R I D A S H B O A R D : A P P L E S
 Sources: Eurostat, MSs notifications, DG Agri, Comext, Comtrade, GTA, ITC, AMI, Expert groups, Freshfel, Wapa. 000 tonnes 39 41 31 22 29 22 32 27 17 18 9 27 15 12 6 6 6 4 5 6 5 4 11 25 15 9 9 93 62 51
Meat Price Outlook. MPO15-29 Weekly Update and Forecasts for Livestock, Meat and Poultry Professionals Jul 24, 2015
 MILLIONS 07-Jan 28-Jan 18-Feb 11-Mar 01-Apr 22-Apr 13-May 03-Jun 24-Jun 15-Jul 05-Aug 26-Aug 16-Sep 07-Oct 28-Oct 18-Nov 09-Dec 30-Dec Thousand Head 07-Jan 28-Jan 18-Feb 11-Mar 01-Apr 22-Apr 13-May 03-Jun
NJ Solar Market Update As of 10/31/15
 NJ Solar Market Update As of 10/31/15 Prepared by Charlie Garrison Renewable Energy Committee Meeting November 10, 2015 SOLAR INSTALLED CAPACITY DATA The preliminary installed solar capacity as of 10/31/15
Preliminary Steel Imports Decline 9% in September Import Market Share at 20%
 News Release FOR IMMEDIATE RELEASE October 25, 2011 CONTACT: NANCY GRAVATT 202.452.7115/ ngravatt@steel.org Preliminary Steel Imports Decline 9% in September Import Market Share at 20% Washington, D.C.
Early-Season U.S. Soybean Meal Sales Surge
 United States Department of Agriculture Foreign Agricultural Service November 2014 Early-Season U.S. Soybean Meal Sales Surge U.S. soybean meal export commitments (accumulated exports plus outstanding
U.S. Soybeans Facing Stiff Competition from Brazil. Brazil Soybean Export Price (Dollars and Reals) and Exchange Rate
 and Exchange Rate") United States Department of Agriculture Foreign Agricultural Service June, 2018 U.S. Soybeans Facing Stiff Competition from Brazil Brazil Soybean Export Price (Dollars and Reals) and Exchange Rate FOB
United States Department of Agriculture Foreign Agricultural Service June, 2018 U.S. Soybeans Facing Stiff Competition from Brazil Brazil Soybean Export Price (Dollars and Reals) and Exchange Rate FOB
US biofuel Indicators and a changing market dynamic
 US biofuel Indicators and a changing market dynamic Seth Meyer AMIS October 1-2, 13, Rome Movement of Ag and Energy Ethanol production and capacity 16 35 Crude oil and maize prices 14 3 billion gallons
1. Trends in the current fiscal year and previous fiscal year 3. Business overview 2. Secular trends in first quarter financial results
 FY2/19 (March 2018~May 2018) Fact Book 1. Trends in the current fiscal year and previous fiscal year 3. Business overview (1) Performance overview P. 1 (1) No. of students at the end of month P. 6 (2)
Up and Down Months of the Stock Market
 Up and Down Months of the Stock Market 1926-2017 Positive years (66) in the stock market were not good all year long and losing years (24) were not losers throughout the year. Winning years produce losing
Soybean Prices Fall on Rising South American Production
 United States Department of Agriculture Foreign Agricultural Service April 2017 Soybean Prices Fall on Rising South American Production Million Tons Change in South America Soybean Production Forecast
Devaluation Energizes Argentine Soybean Crush
 United States Department of Agriculture Foreign Agricultural Service March 2016 Devaluation Energizes Argentine Soybean Crush Argentina Quarterly Soybean Crush Volume Exchange Rate* and Constant Dollar
FOR IMMEDIATE RELEASE
 Article No. 5842 Available on www.roymorgan.com Roy Morgan Unemployment Profile Thursday, 2 October 2014 Unemployment climbs to 9.9% in September as full-time work lowest since October 2011; 2.2 million
ENERGY SLIDESHOW. Federal Reserve Bank of Dallas
 ENERGY SLIDESHOW Updated: January 16, 2019 ENERGY PRICES www.dallasfed.org/research/energy Brent & WTI & Crude Brent Oil Crude Oil Dollars per barrel 140 120 100 Brent (Jan 11 = $58.64) WTI (Jan 11 = $50.78)
Wholesale Market Insights Through March J o n a t h a n S m o k e & Zo R a h i m - C o x A u t o m o t i v e
 Wholesale Market Insights Through March 2018 J o n a t h a n S m o k e & Zo R a h i m - C o x A u t o m o t i v e T R A N S F O R M I N G T H E W A Y T H E W O R L D B U Y S, S E L L S & O W N S C A R
282m 75% +575m. Net sales Operating income before non-recurring items. Operating margin before non-recurring items. Net Loss.
 First-Half 2009 Financial Highlights Net sales Operating income before non-recurring items Operating margin before non-recurring items Net Loss Net debt-to-equity ratio Free cash flow** 7,134m 282m 4.0%
China Tariffs Driving U.S. Soybean Exports To the European Union to a 30-Year High
 United States Department of Agriculture Foreign Agricultural Service March 2019 China Tariffs Driving U.S. Soybean Exports To the European Union to a 30-Year High 12-MONTH MOVING TOTAL U.S. SOYBEAN EXPORTS
MARKET UPDATE & ECONOMIC OUTLOOK
 MARKET UPDATE & ECONOMIC OUTLOOK Economic Expansion Accelerates For the Moment Growth surged in Q2 from average 2.1% pace over prior 14 quarters; best quarter since 2014 10.0 Real Gross Domestic Product
POSITIONED FOR GROWTH BNSF Railway. John Miller Group Vice President Agricultural Products BNSF Railway
 POSITIONED FOR GROWTH BNSF Railway John Miller Group Vice President Agricultural Products BNSF Railway 1 Historic Rail Industry Volumes U.S. Class I Weekly Rail Volumes 800,000 2006 2007 2008 2009 2010
Baseline Update for International Livestock Markets
 Baseline Update for International Livestock Markets September 2018 FAPRI-MU Report #04-18 www.fapri.missouri.edu Published by the Food and Agricultural Policy Research Institute (FAPRI) at the University
GROWTH IN TENTH DISTRICT MANUFACTURING ACTIVITY EXPANDED SOLIDLY Federal Reserve Bank of Kansas City Releases May Manufacturing Survey
 FOR RELEASE Thursday, May 22, 2014 EMBARGOED FOR 10 A.M. CENTRAL TIME CONTACT: Pam Campbell 405-270-8617 Pam.Campbell@kc.frb.org GROWTH IN TENTH DISTRICT MANUFACTURING ACTIVITY EXPANDED SOLIDLY Federal
CREDIT UNION ESTIMATES
 MONTHLY CREDIT UNION ESTIMATES Prepared May 1, 2018 by Credit Union National Association Economics and Statistics Department cuna.org/mcue Loans Credit union loans outstanding grew 1.1% in, compared to
CREDIT UNION ESTIMATES
 MONTHLY CREDIT UNION ESTIMATES Prepared July 2, 2018 by Credit Union National Association Economics and Statistics Department cuna.org/mcue Loans Credit union loans outstanding grew 1.3% in, compared to
U.S. Soybean Prices Fall as Buyers Focus Turns to South America
 United States Department of Agriculture Foreign Agricultural Service Circular Series FOP 2-10 ruary 2010 U.S. Soybean Prices Fall as Buyers Focus Turns to South America $11.00 Daily U.S. Soybean Cash Price