Global Overview of Middle Distillates Supply and Demand ICE Market Forum Rotterdam, November 2012
|
|
|
- Allyson Lindsey
- 6 years ago
- Views:
Transcription

1 Global Overview of Middle Distillates Supply and Demand ICE Market Forum Rotterdam, November 2012
2 About Petromatrix Based in Switzerland (city of Zug) Publishes a daily newsletter on oil markets Mix of fundamentals, technicals, and analysis of investment flows Subscription basis Free trial: info@petromatrix.com mbpd = 000 b/d


3 Some of our top-tier subscribers:
4 World Oil Demand Y-O-Y Growth myn b/d (source: IEA)
5 World Oil Demand 1.8 IEA estimate of 2012 Demand Growth (myn b/d)
6 World Oil Demand IEA, mbpd 60,000 55,000 50,000 45,000 40,000 35,000 30,000 25,000 20,000 15,000 10,000 OECD NON-OECD
7 World Oil Non-OECD Demand IEA, mbpd 30,000 25,000 20,000 15,000 10,000 5,000 0 East of Suez West of Suez
8 2012 Demand Growth by Products mbpd Resid Naphtha Others Jet Gasoline Distillates -200
9 Share of Diesel demand Source: OPEC 25% 20% 15% 10% 5% 0% Pacific Latam Mideast Others Other Asia China Nth Am Europe
10 West of Suez
11 Europe Distillates Demand 000 b/d (source: IEA) 6,400 6,200 6,000 5,800 5,600 5,400 5,200 5,000
12 Europe Distillates Demand 000 b/d (source: IEA) 5,000 4,500 4,000 3,500 3,000 2,500 2,000 1,500 1,000 Diesel Gasoil
13 Europe Driving Fuels Demand 000 b/d (source: IEA) 7,500 7,000 6,500 6,000 5,500 5,000
14 Europe Driving fuel Demand 000 b/d (source: IEA) 5,000 4,500 4,000 3,500 3,000 2,500 2,000 1,500 1,000 Diesel Gasoline
15 Europe % Diesel of Driving Fuels 75% 70% 65% 60% 55% 50% 45%
16 Europe % Diesel of Driving Fuels 90% 80% 70% 60% 50% 40% 30% 20% 10% France Germany Spain Switzerland
17 70% 65% 60% 55% 50% 45% 40% 35% 30% Europe % Diesel of Driving Fuels vs Distillates refinery yields (IEA) Diesel share of driving fuel Distillates yield
18 Europe Refinery runs (IEA, mbpd) 15,000 14,500 14,000 13,500 13,000 12,500 12,000 11,500 11,000
19 Europe Diesel Demand 000 b/d (source: IEA) 1,700 Diesel dmd in SPA/POR/ITA/TKY mbpd 1,600 1,500 1,400 1,300 1,200 1,100 1,000 Jan Feb Mar Apr May Jun Jul Aug Sep Oct Nov Dec
20 Europe Diesel Demand % (source: IEA) 15% Diesel dmd in SPA/POR/ITA/TKY % 10% 5% 0% -5% -10%
21 Europe Diesel Demand 000 b/d (source: IEA) 2,200 2,100 2,000 1,900 1,800 1,700 1,600 Diesel dmd in FRA/GER/UK/NL mbpd 1,500 Jan Feb Mar Apr May Jun Jul Aug Sep Oct Nov Dec
22 Europe Diesel Demand % (source: IEA) 15% Diesel dmd in FRA/GER/UK/NL % 10% 5% 0% -5% -10%
23 Demand vs prev year Jul-12 Aug-12 Sep-12 Oct-12 Mogas Diesel Mogas Diesel Mogas Diesel Mogas Diesel Germany -2.4% 3.8% -8.1% -2.0% France -0.6% 5.6% -5.7% -1.3% -11.9% -5.0% UK -5.6% 0.2% -3.8% 7.0% Italy -6.7% -5.5% -10.1% -9.7% -18.2% -15.6% Spain -8.5% -6.7% -6.0% -5.7% -14.0% -13.5%
24 30 Unemployment % by EU country NL DE SE UK PL IT FR PT GR ES
25
26 Europe net Distillates imports (IEA, mbpd) 1, Jan-09 Jan-10 Jan-11 Jan Med NWE
27 Spain net Distillates imports
28 Europe net Distillates imports (IEA,k MT) FSU US Asia
29 US Distillates Demand 000 b/d (source: IEA)
30 US Distillates Demand mbpd(source: IEA) 4,500 4,000 3,500 3,000 2,500 2,000 1,500 1, Diesel Other Gasoil
31 Nth Atlantic Basin Distillates Demand mb/d (source: IEA) 5,000 4,500 4,000 3,500 3,000 2,500 2,000 1,500 1, USA Diesel Europe Diesel USA Gasoil Europe Gasoil
32 US & EUR % Diesel of Driving Fuels 70% 60% 50% 40% 30% 20% Europe USA
33 US & Europe Refinery runs (IEA,mbpd) 17,000 16,000 15,000 14,000 13,000 12,000 11,000 Europe USA
34 US Distillates S&D (mbpd) 5,000 4,800 4,600 4,400 4,200 4,000 3,800 3,600 3,400 3,200 3,000 Supply Demand
35 US Products exports (DOE,mbpd) 1,200 1, Jan-05 Jan-06 Jan-07 Jan-08 Jan-09 Jan-10 Jan-11 Jan-12 Distillates Gasoline
36 US Distillates exports (DOE,mbpd) Europe Latin America
37 Jan-09 Apr-09 Jul-09 Oct-09 Jan-10 Apr-10 Jul-10 Oct-10 Jan-11 Apr-11 Jul-11 Floating Storage Distillates Distillate Floating Storage US onshore Distillate Stocks March 2008

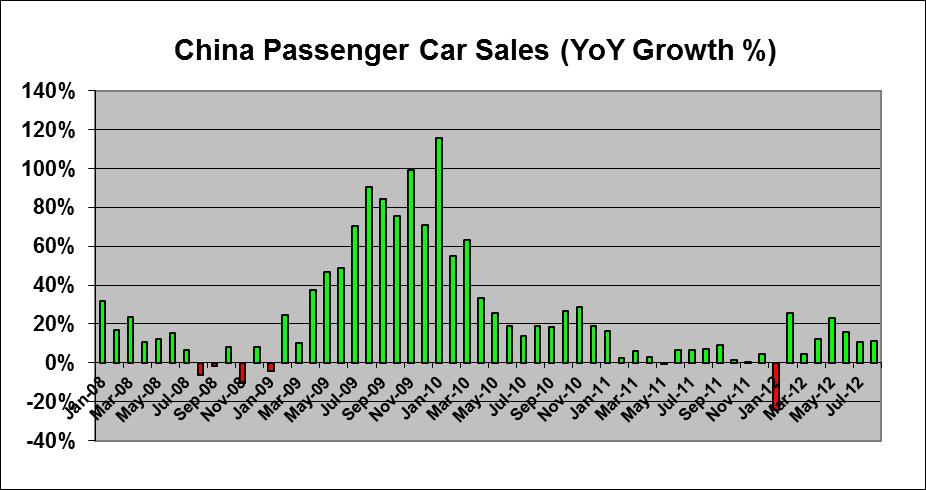
38 US Midwest refinery economics
39 US, cheapest crude at market price
40 Latam Distillates demand (JODI, mbpd) Arg/Braz/Chi/Ecua/Mex/Per/Venz) 2,400 2,200 2,000 1,800 1,600 1,400 1,200
41 Latam Distillates demand & imports (JODI,mbpd) Arg/Braz/Chi/Ecua/Mex/Per/Venz) 2,400 2,200 2,000 1,800 1,600 1,400 1, Demand (LH) Imports (RH)
42 East of Suez
43 Asia Distillates demand (JODI,mbpd) (China/India/Jap/Skor/Thai) 7,200 6,700 6,200 5,700 5,200 4,700 4,200 Jan-04 Jan-05 Jan-06 Jan-07 Jan-08 Jan-09 Jan-10 Jan-11 Jan-12
44 China Internal Retail Prices Yuan/MT 10,000 9,500 9,000 8,500 8,000 7,500 7,000 6,500 6,000 Gasoline Diesel 5,500 5,000

45 China Passenger Car Sales
46 250 Imports of Distillates (JODI, IEA, 000 b/d) Jan-04 Jan-05 Jan-06 Jan-07 Jan-08 Jan-09 Jan-10 Jan-11 Jan-12 China Switzerland
47 China refinery runs (mbpd) 10,200 9,700 9,200 8,700 8,200 7,700 7,200 6,700 6,200 5,700 5,200 Jan-04 Jan-05 Jan-06 Jan-07 Jan-08 Jan-09 Jan-10 Jan-11 Jan-12
48 China refinery runs vs year ago (mbpd) 800 China crude oil refinery runs vs previous year (mbpd) Jan-12 Feb-12 Mar-12 Apr-12 May-12 Jun-12 Jul-12 Aug-12 Sep-12 Oct
49 Refinery runs (mbpd) 15,000 14,000 13,000 12,000 11,000 10,000 9,000 8,000 7,000 6,000 Jan-04 Jan-05 Jan-06 Jan-07 Jan-08 Jan-09 Jan-10 Jan-11 Jan-12 Europe China+India
50 600 Exports of Distillates (JODI, mbpd) Jan-04 Jan-05 Jan-06 Jan-07 Jan-08 Jan-09 Jan-10 Jan-11 Jan-12 China India
51 Saudi Arabia Distillates demand ( JODI,mbpd) Demand Imports
52 Large Refinery expansion in Middle East next two years (mbpd) Saudi Jubail End 2012 UAE Ruwais end 2013 Saudi Yanbu end 2014
53 Q & A/ Follow-up Now and/or later also at Free trials to our daily market note: just send an to any of the above addresses
US Crude Oil Reshaping International Crude Oil Flows. Olivier Jakob,
 US Crude Oil Reshaping International Crude Oil Flows Olivier Jakob, ojakob@petromatrix.com www.petromatrix.com Claimer Petromatrix publishes since 2006 a daily market note on the oil markets Our reports
Regional Refining Outlook
 Regional Refining Outlook Implications for Crude Demand Platts Crude Summit 15 May 213 David Wech JBC Energy GmbH 13 th May 213 Research - Energy Studies - Consulting - Training Disclaimer All statements
Commercial-in-Confidence Ashton Old Baths Financial Model - Detailed Cashflow
 Year 0 1 2 3 4 5 6 7 8 9 10 11 12 13 Oct-16 Nov-16 Dec-16 Jan-17 Feb-17 Mar-17 Apr-17 May-17 Jun-17 Jul-17 Aug-17 Sep-17 Oct-17 2,038 2,922 4,089 4,349 6,256 7,124 8,885 8,885 8,885 8,885 8,885 8,885 9,107
Fundamental Oil Market Outlook
 Fundamental Oil Market Outlook ICE Forum David Wech JBC Energy GmbH 13 November 2012 Research - Energy Studies - Consulting - Training 21 November 2012 Slide 1 Disclaimer All statements other than statements
Recent Developments in EU Refining and in the Supply and Trade of Petroleum Products
 Recent Developments in EU Refining and in the Supply and Trade of Petroleum Products Second Meeting of the EU Refining Forum Brussels, 27 November 2013 Toril Bosoni, International Energy Agency OECD/IEA
North American Storage and Transportation Trends
 North American Storage and Transportation Trends Brian Busch Director, Oil Markets and Business Development www.genscape.com 2016 Genscape Incorporated. All rights reserved. What we do 2 Current State
IEA Refinery Outlook European Recovery in Sight?
 IEA Refinery Outlook European Recovery in Sight? Platts 6 th Annual European Refining Markets Conference Brussels, 24-25 September 2012 Toril Bosoni, International Energy Agency Subdued Global Oil Demand
Recent Developments in EU Refining and Product Supply. EU Refining Forum, 12 April 2013
 Recent Developments in EU Refining and Product Supply EU Refining Forum, 12 April 2013 OECD/IEA 2012 EU refinery closures to date mb/d Refinery Closure 500 400 300 200 100 0 2 008 2009 2010 2011 2012 2013
A perspective on the refining industry. Platts European Refining Summit Brussels, 29 September2016 Kristine Petrosyan, International Energy Agency
 A perspective on the refining industry Platts European Refining Summit Brussels, 29 September2016 Kristine Petrosyan, International Energy Agency OECD/IEA 2016 mb/d European refiners: busy 2015 OECD Europe
Recent Developments in EU Refining and in the Supply and Trade of Petroleum Products
 Recent Developments in EU Refining and in the Supply and Trade of Petroleum Products Third Meeting of the EU Refining Forum Brussels, 22 May 2014 Toril Bosoni, International Energy Agency OECD/IEA 2014
A summary of national and global energy indicators. FEDERAL RESERVE BANK of KANSAS CITY
 THE U.S. Energy DATABOOK A summary of national and global energy indicators JULY 1, 17 FEDERAL RESERVE BANK of KANSAS CITY SUMMARY OF CURRENT ENERGY CONDITIONS The number of total active drilling rigs
Global Monthly March 2019
 Global Monthly March 19 Percent of world bonds outstanding 3 5 15 5 Jan-1 Jun-1 Nov-1 Apr-15 Sep-15 Feb-1 Jul-1 Dec-1 May-17 Oct-17 Mar-1 Aug-1 Dec-1 Mar-19 March 19 Percent, year-on-year 7 5 3 1 1Q1 1Q
Global Monthly February 2018
 Global Monthly February 18 3 1-year Treasury yields 1-year breakeven inflation rate 1 1 15 16 17 18 February 18 5 3 Global GDP growth Composite PMI (RHS) Index 56 5 5 1 5 1 13 1 15 16 17 18 3..5. 1.5 1.
World Oil Outlook A Perspective from OPEC
 World Oil Outlook A Perspective from OPEC Dr. Fuad Siala OPEC Secretariat Transport, Energy & Fuels Working Together for a Sustainable Future Brussels, Belgium May 8-1, 27 Energy demand by fuel type 18
Petroplus. Overview & Outlook: Independent Refining February 17, 2009
 Petroplus Overview & Outlook: Independent Refining February 17, 29 Disclaimer While all reasonable care has been taken to ensure that the facts stated herein are accurate and that the opinions contained
International Coal Markets
 International Coal Markets www.coalimp.org.uk Nigel Yaxley Managing Director, CoalImp 26 th November 28 International Coal Markets World supply and demand Seaborne trade Reserves and resources International
D G A G R I D A S H B O A R D : T O M A T O E S Last update: EU AVG PRICES
 tonnes Weightedaverages by volume of production per MS Ongoing adjustments on weights by variety group 000 tonnes D G A G R I D A S H B O A R D : T O M A T O E S Last update: 20.04.2018 EU AVG PRICES MS
About Czarnikow. The Premier Provider of Sugar Market Services. Czarnikow has been in the sugar business since 1861
 About Czarnikow The Premier Provider of Sugar Market Services Czarnikow has been in the sugar business since 1861 Czarnikow is the leading professional services company in the sugar market Czarnikow has
Table 1 TABLES INTERNATIONAL ENERGY AGENCY OIL MARKET REPORT 15 MAY
 INTERNATIONAL ENERGY AGENCY OIL MARKET REPORT TABLES Table 1 Table WORLD 1 - World OIL SUPPLY Oil Supply AND DEMAND and Demand (million barrels per day) 2010 2011 1Q12 2Q12 3Q12 4Q12 2012 1Q13 2Q13 3Q13
WORLD OIL SUPPLY AND DEMAND (million barrels per day)
") INTERNATIONAL ENERGY AGENCY OIL MARKET REPORT TABLES TABLES Table 1 WORLD OIL SUPPLY AND DEMAND (million barrels per day) 2005 2006 1Q07 2Q07 3Q07 4Q07 2007 1Q08 2Q08 3Q08 4Q08 2008 1Q09 2Q09 3Q09 4Q09
INTERNATIONAL ENERGY AGENCY OIL MARKET REPORT TABLES TABLES Table 1 WORLD OIL SUPPLY AND DEMAND (million barrels per day) 2005 2006 1Q07 2Q07 3Q07 4Q07 2007 1Q08 2Q08 3Q08 4Q08 2008 1Q09 2Q09 3Q09 4Q09
Current Oil Market Issues. Energy Training Week Paris, April 2013
 Current Oil Market Issues Energy Training Week Paris, April 2013 Short and Medium-Term Analysis & Forecasting: Current Oil Market Issues Antoine Halff Crude oil prices retreat from recent highs $/bbl 130
Table 1 WORLD OIL SUPPLY AND DEMAND (million barrels per day)
") INTERNATIONAL ENERGY AGENCY - OIL MARKET REPORT TABLES TABLES Table 1 WORLD OIL SUPPLY AND DEMAND (million barrels per day) 2011 2012 1Q13 2Q13 3Q13 4Q13 2013 1Q14 2Q14 3Q14 4Q14 2014 1Q15 2Q15 3Q15 4Q15
INTERNATIONAL ENERGY AGENCY - OIL MARKET REPORT TABLES TABLES Table 1 WORLD OIL SUPPLY AND DEMAND (million barrels per day) 2011 2012 1Q13 2Q13 3Q13 4Q13 2013 1Q14 2Q14 3Q14 4Q14 2014 1Q15 2Q15 3Q15 4Q15
Performing In A Volatile Oil Market
 Performing In A Volatile Oil Market Matti Lehmus Executive Vice President, Oil Products Capital Markets Day Key Trends Impacting Refining Margins Demand growth to resume after steep drop Supply growth
Table 1: World Oil Supply And Demand
 INTERNATIONAL ENERGY AGENCY - OIL MARKET REPORT TABLES Table 1 WORLD OIL SUPPLY AND DEMAND Table 1: World Oil Supply And Demand (million barrels per day) TABLES 2012 2013 1Q14 2Q14 3Q14 4Q14 2014 1Q15
ANNUAL STATISTICAL SUPPLEMENT
 ANNUAL STATISTICAL SUPPLEMENT with 2008 data 2009 Edition This Statistical Supplement has been prepared to provide a longer historical perspective for the oil demand, supply, trade, stocks, prices and
The Changing composition of bunker fuels: Implications for refiners, traders, and shipping
 Platts 4 th European Refining Markets Conference The Changing composition of bunker fuels: Implications for refiners, traders, and shipping Wade DeClaris, EVP Marine World Fuel Services Corp. Agenda: Role
COMPARISON OF FIXED & VARIABLE RATES (25 YEARS) CHARTERED BANK ADMINISTERED INTEREST RATES - PRIME BUSINESS*
 CHARTERED BANK ADMINISTERED INTEREST RATES - PRIME BUSINESS*") COMPARISON OF FIXED & VARIABLE RATES (25 YEARS) 2 Fixed Rates Variable Rates For Internal Use Only. FIXED RATES OF THE PAST 25 YEARS AVERAGE RESIDENTIAL MORTGAGE LENDING RATE - 5 YEAR* (Per cent) Year
COMPARISON OF FIXED & VARIABLE RATES (25 YEARS) 2 Fixed Rates Variable Rates For Internal Use Only. FIXED RATES OF THE PAST 25 YEARS AVERAGE RESIDENTIAL MORTGAGE LENDING RATE - 5 YEAR* (Per cent) Year
COMPARISON OF FIXED & VARIABLE RATES (25 YEARS) CHARTERED BANK ADMINISTERED INTEREST RATES - PRIME BUSINESS*
 CHARTERED BANK ADMINISTERED INTEREST RATES - PRIME BUSINESS*") COMPARISON OF FIXED & VARIABLE RATES (25 YEARS) 2 Fixed Rates Variable Rates FIXED RATES OF THE PAST 25 YEARS AVERAGE RESIDENTIAL MORTGAGE LENDING RATE - 5 YEAR* (Per cent) Year Jan Feb Mar Apr May Jun
COMPARISON OF FIXED & VARIABLE RATES (25 YEARS) 2 Fixed Rates Variable Rates FIXED RATES OF THE PAST 25 YEARS AVERAGE RESIDENTIAL MORTGAGE LENDING RATE - 5 YEAR* (Per cent) Year Jan Feb Mar Apr May Jun
Table 1 WORLD OIL SUPPLY AND DEMAND (million barrels per day)
") INTERNATIONAL ENERGY AGENCY - OIL MARKET REPORT TABLES Table 1 WORLD OIL SUPPLY AND DEMAND (million barrels per day) 2004 2005 1Q06 2Q06 3Q06 4Q06 2006 1Q07 2Q07 3Q07 4Q07 2007 1Q08 2Q08 3Q08 4Q08 2008
INTERNATIONAL ENERGY AGENCY - OIL MARKET REPORT TABLES Table 1 WORLD OIL SUPPLY AND DEMAND (million barrels per day) 2004 2005 1Q06 2Q06 3Q06 4Q06 2006 1Q07 2Q07 3Q07 4Q07 2007 1Q08 2Q08 3Q08 4Q08 2008
New York Energy Forum
 Presentation at the New York Energy Forum 30 June 2014 Antoine Halff The oil market at a junction Balances loosen up on paper but must be seen in perspective The unconventional supply revolution enters
End-use petroleum product prices and average crude oil import costs March 2011
 March 211 International Energy Agency L'Agence internationale de l'énergie 9, rue de la Fédération, 75739 PARIS CEDEX 15 FRANCE prices@iea.org 18 e-mail: prices@iea.org 14 Petroleum products (USD/unit)
Implications for Security of Supply. Clingendael International Energy Programme The Hague 4 April Toril Bosoni, International Energy Agency
 IEA Refinery Rationalisation Implications for Security of Supply Clingendael International Energy Programme The Hague 4 April 20122 Toril Bosoni, International Energy Agency Background Since the economic
World Geographic Shares
 World Geographic Shares North America South America Europe Africa Asia Australia/ Oceania 18% 13% 7% 22% 33% 6% World Population Shares North America South America Europe Africa Asia Australia/ Oceania
The Changing Face of Global Refining
 The Changing Face of Global Refining OPIS National Supply Summit Las Vegas, Nevada October 24-26, 2010 John B. O Brien, Executive Chairman Baker & O Brien, Inc. All rights reserved. The Changing Face of
Gas & electricity - at a glance
 $/barrel /tco 2 e p/therm /MWh Gas & electricity - at a glance Week-on-Week Annual Gas Price Changes Short-term gas contracts jump Cold snap forecast for the first half of February, lifting demand Longer-dated
End-use petroleum product prices and average crude oil import costs January 2010
 January 21 International Energy Agency L'Agence internationale de l'énergie 9, rue de la Fédération, 75739 PARIS CEDEX 15 FRANCE prices@iea.org 18 e-mail: prices@iea.org 14 Petroleum products (USD/unit)
November. Next release: 19 January Sep/AugOct/Sep Nov/Oct Dec 14 December Janu 19 January 2018 Sep/AugOct/Sep Nov/Oct 2017
 Sep/AugOct/Sep Nov/Oct 2017 14 Dec 14 December 2017 19 Janu 19 January 2018 Sep/AugOct/Sep Nov/Oct 2017 Next release: 19 January 2018 NovembNovember November Monthly Oil Price Statistics TABLE OF CONTENTS
MEG Oil Market Outlook
 MEG Oil Market Outlook (covering crude oil and oil products) July 2018 bancosta blue studies volume WET 2017/#13 research www.bancosta.com ; research@bancosta.com Jul 2018 MEG Oil Market Outlook 1 Index
ARA TT Market Projections
 StocExpo Rotterdam Conference 2017 ARA TT Market Projections www.pjk-international.com www.tankterminals.com Tank Terminal Market Research ir. Patrick Kulsen, MSc. B. Mail: patrick.kulsen@pjk-international.com
Stockholm. What s Driving OPEC? 4 March Network Oil & Gas Sweden. Stephen George, Chief Economist KBC Advanced Technologies plc
 What s Driving OPEC? Stockholm 4 March 215 Network Oil & Gas Sweden Stephen George, Chief Economist KBC Advanced Technologies plc Contents copyright KBC Advanced Technologies plc, 215 KBC Advanced Technologies
Oil Markets into Peter Davies Chief Economist, BP plc British Institute of Energy Economics London. 24 January, 2006
 Oil Markets into 26 Peter Davies Chief Economist, BP plc British Institute of Energy Economics London. 24 January, 26 Outline Oil and energy today How did we get to here? Prospects for 26 Into the medium
EXECUTIVE SUMMARY ATLANTIC SALMON NO 03/06
 MARKET This table shows development in supply/consumption of Atlantic salmon in the main markets per month, in tonnes r.w The table contains preliminary figures and may diverge from same figures in the
ANNUAL STATISTICAL SUPPLEMENT
 ANNUAL STATISTICAL SUPPLEMENT with 2016 data 2017 Edition This Statistical Supplement has been prepared to provide a longer historical perspective for the oil demand, supply, trade, stocks, prices and
ERGMed Coastal. Refining
 ERGMed Coastal Refining 11 Refining Industry Trend: Capacity World total oil products demand and crude runs increasing, faster than refining capacity. World Source: International Energy Agency (IEA), Oil
December. Next release: 13 February Oct/Sep Nov/Oct Dec/Nov Janu19 January Febru13 February 2018 Oct/Sep Nov/Oct Dec/Nov 2017
 Oct/Sep Nov/Oct Dec/Nov 2017 19 Janu19 January 2018 13 Febru13 February 2018 Oct/Sep Nov/Oct Dec/Nov 2017 Next release: 13 February 2018 DecembDecember December TABLE OF CONTENTS Page Charts 1 Latest IEA
Overseas Market Conditions of Construction and Mining Equipment
 1 Overseas Market Conditions of Construction and Mining Equipment December 17, 2012 Hisashi Shinozuka Senior Executive Officer President of Construction and Mining Marketing Division Komatsu Ltd. 2 1.
ASPHALT SUPPLY IN A VOLATILE OIL WORLD
 ASPHALT SUPPLY IN A VOLATILE OIL WORLD Bill Haverland ConocoPhillips Baxter Burns Ergon CRUDE OIL SUPPLY A WORLD LOOK Crude Oil Supply (2006) World Crude Oil Production Millions of Barrels Per Day FSU/E.
Market Report Series: Oil 2018 Analysis & Forecasts to Energy Community 10 th Oil Forum, Belgrade, 25 September 2018
 Market Report Series: Oil 218 Analysis & Forecasts to 223 Energy Community 1 th Oil Forum, Belgrade, 25 September 218 Short term update: crude prices (excl. WTI) up strongly Aug/Sep $/bbl 8 Benchmark Crude
Committee for the Common Organisation of the Agricultural Market Market Situation for Sheep & Goat Meats 22 March 2018
 Committee for the Common Organisation of the Agricultural Market Market Situation for Sheep & Goat Meats 22 March 218 Production In ' tonnes carcase weight P R O D U C T I O N 297.4 114.8 8.9 67.1 51.3
Port Botany Trade Statistics Bulletin. 1 July April 2017
 Port Botany Trade Statistics Bulletin 1 July 2016 30 April 2017 YTD April 2017 Port Botany Container Trade Jul 2016 Aug 2016 Sep 2016 Oct 2016 Nov 2016 Dec 2016 Jan 2017 Feb 2017 Mar 2017 Apr 2017 Export
EU Market Situation for Poultry. Civil Dialogue Group. 25 October 2016
 EU Market Situation for Poultry Civil Dialogue Group 25 October 216 Thousand Tons F O R E C A S T 16 14 Experts EU production forecast on Poultry and Rabbit (Missing data (BE-EL-AT-RO-LT-SE) - No expert
Rice Global E&C Forum August 9, 2013
 Rice Global E&C Forum August 9, 2013 Midyear Forecast: July 1, 2013 Conglin Xu, Senior Editor-Economics Laura Bell, Statistics Editor Alan Petzet, Chief Editor-Exploration Forecast & Review: Jan. 7, 2013
Global Downstream Petroleum Outlook
 Global Downstream Petroleum Outlook Claude Mandil Executive Director International Energy Agency 3 rd OPEC International Seminar Vienna, 12 September 26 Spare Refinery Capacity Has Tightened 9 1% 85 95%
High fuel costs could last Diesel and propane may not get much cheaper in 2019 By Bryce Knorr, senior grain market analyst
 High fuel costs could last Diesel and propane may not get much cheaper in 2019 By Bryce Knorr, senior grain market analyst In July I recommended using a dip in the energy market to lock in propane for
Macroeconomic Outlook. Presented by Dr. Bruce A. Scherr Chairman of the Board Chief Executive Officer Emeritus
 Macroeconomic Outlook Presented by Dr. Bruce A. Scherr Chairman of the Board Chief Executive Officer Emeritus Waterways Symposium Cincinnati, OH November 15-17, 2016 Topics Energy Macro Implications Inflation
Global Refining: Fueling Profitability in the Turbulent Times Ahead. Sponsored by:
 Global Refining: Fueling Profitability in the Turbulent Times Ahead Sponsored by: The Outlook for Energy: A View to 24 Roland L. Moreau ExxonMobil Upstream Research Company Hart Energy Breakfast Club February
Evolving Global Oil Trade Flows. IEA-IEF-OPEC Joint Meeting Vienna, March 2018
 Evolving Global Oil Trade Flows IEA-IEF-OPEC Joint Meeting Vienna, March 2018 SHIFTING FLOWS: WHAT HAS THIS MEANT IN PRACTICE? US/Europe crude imports & exports Saudi crude to Poland Chinese teapots importing
Latest Update. OMR 14 Nov 2013
 Latest Update OMR 14 Nov 2013 Prices $/bbl 120 115 110 105 100 95 90 85 Oil Prices Hit Four Month Lows WTI Downturn Far Outpaced Brent Losses Crude Futures Front Month Close 80 Oct 12 Jan 13 Apr 13 Jul
Petroplus. UBS European Mid-Cap Oil Conference London March 26, 2009
 Petroplus UBS European Mid-Cap Oil Conference London March 26, 29 Disclaimer While all reasonable care has been taken to ensure that the facts stated herein are accurate and that the opinions contained
ENERGY SLIDESHOW. Federal Reserve Bank of Dallas
 ENERGY SLIDESHOW Updated: March 13, 2018 ENERGY PRICES www.dallasfed.org/research/energy Brent & WTI & Crude Brent Oil Crude Oil Dollars per barrel 140 Brent (Mar 9 = $65.12) WTI (Mar 9 = $61.65) 120 100
May 2018 Short-Term Energy Outlook
 May 2018 for Williston Basin Petroleum Conference Bismarck, N.D. by Dr. Linda Capuano Administrator U.S. Energy Information Administration Independent Statistics & Analysis www.eia.gov Brent crude oil
D G A G R I D A S H B O A R D : A P P L E S
 75 79 60 56 49 74 65 59 54 42 76 63 58 53 78 55 42 43 79 44 81 63 47 83 64 59 53 48 Sources: Eurostat, MSs notifications, DG Agri, Comext, Comtrade, GTA, ITC, AMI, Expert groups, Freshfel, Wapa. 89 68
It s time to start buying propane for fall Expect to pay more to dry 2017 corn crop By Bryce Knorr, senior grain market analyst
 It s time to start buying propane for fall Expect to pay more to dry 2017 corn crop By Bryce Knorr, senior grain market analyst It s the end of winter hopefully and that means it s a good time to buy coats,
INTERTANKO Istanbul Tanker Event. Demand Developments. David Martin Oil Industry & Markets Division OECD/IEA
 INTERTANKO Istanbul Tanker Event Demand Developments David Martin Industry & s Division david.martin@iea.org - Istanbul, April 20-23, 2008 Medium-Term Outlook What is driving oil prices? Fundamentals or
Medium-term Coal Market Report 2011 Carlos Fernández Alvarez. Senior Coal Analyst. Gas, Coal and Power Markets Division
 Medium-term Coal Market Report 211 Carlos Fernández Alvarez. Senior Coal Analyst. Gas, Coal and Power Markets Division Madrid, 31 January 212 The context Uncertainties will fundamentally shape the medium-term
ASPHALT SUPPLY IN A VOLATILE OIL WORLD. Bill Haverland ConocoPhillips Company
 ASPHALT SUPPLY IN A VOLATILE OIL WORLD Bill Haverland ConocoPhillips Company Issues to be Discussed Crude Oil Supply Crude Oil Pricing Refining Capacity Products Supply Products Pricing Future of the Industry
Petroleum and Natural Gas Situation
 Petroleum and Natural Gas Situation John C. Felmy Chief Economist and Director Statistics Department American Petroleum Institute Felmyj@api.org www.api.org www.gasolineandyou.org www.naturalgasfacts.org
ENERGY SLIDESHOW. Federal Reserve Bank of Dallas
 ENERGY SLIDESHOW Updated: January 16, 2019 ENERGY PRICES www.dallasfed.org/research/energy Brent & WTI & Crude Brent Oil Crude Oil Dollars per barrel 140 120 100 Brent (Jan 11 = $58.64) WTI (Jan 11 = $50.78)
Oil Market Outlook 100 dollar oil In the cards again?
 Oil Market Outlook 100 dollar oil In the cards again? Geopolitical events, a global bunker spec change plus the effect of CAPEX cuts in 2014-16 makes for a potent mix in 2020 DNB oil story in pictures
Port Botany. Trade Statistics Bulletin 1 July June 2018
 Port Botany Trade Statistics Bulletin 1 July 2017 30 June 2018 FY 2017/18 Port Botany Container Trade Jul 2017 Aug 2017 Sep 2017 Oct 2017 Nov 2017 Dec 2017 Jan 2018 Feb 2018 Mar 2018 Apr 2018 May 2018
ASPHALT SUPPLY IN A VOLATILE OIL WORLD. Bill Haverland ConocoPhillips Company
 ASPHALT SUPPLY IN A VOLATILE OIL WORLD Bill Haverland ConocoPhillips Company Issues to be Discussed Crude Oil Supply Crude Oil Pricing Refining Capacity Products Supply Products Pricing Future of the Industry
WEEKLY REFINING INDICATORS REPORT WEEK ENDING 06/17/2016
 WEEKLY REFINING INDICATORS REPORT WEEK ENDING 06/17/2016 Blake Fernandez, Analyst 713.393.4524 blakef@howardweil.com Quick Take: Somewhat bearish stats on the refining side as we had hoped for some gasoline
Midwest Association of Rail Shippers
 January 13, 2016 Midwest Association of Rail Shippers Lance Fritz Chairman and CEO Union Pacific 1 2015 Economic Results Consumer-driven growth 1 Consumer Spending 2 Light Vehicle Sales 3.6% 3.0% 3.0%
January Manufacturing Technology Orders Off After a Strong December
 Contact: Bonnie Gurney, AMT, 703-827-5277 bgurney@amtonline.org For Release: March 9, 2015 January Manufacturing Technology Orders Off After a Strong December January U.S. manufacturing technology orders
Economic and Financial Outlook
 Economic and Financial Outlook Euro Area October 2017 Summary 1 2 3 4 Robust GDP growth in Euro Area, but subdued inflation Spanish GDP growth has stabilized at elevated rates Short View of France and
Sulphur Market Outlook
 Sulphur Market Outlook The Outlook for the future Supply and Balance of the Global Sulphur Market Joanne Peacock, CRU International/BSC Creon Moscow December 2009 LONDON RALEIGH WASHINGTON MINNEAPOLIS
M O T O R V E H I C L E S T A T I S T l C S
 M O T O R V E H I C L E S T A T I S T l C S of Japan 2017 JAPAN AUTOMOBILE MANUFACTURERS ASSOCIATlON, INC. C O N T E N T S Motor Vehicles in Use Cars, Trucks, Buses and Special Purpose Vehicles, 1945-2016
2016 U.S. ETHANOL EXPORTS AND IMPORTS
 2016 U.S. ETHANOL EXPORTS AND IMPORTS STATISTICAL SUMMARY Copyright 2017 Renewable Fuels Association. All Rights Reserved 2016 U.S. ETHANOL EXPORTS U.S. Ethanol Exports, 2006-2016 1,200 1,000 800 600 396
Thursday, March 6, 2014 Houston, TX. 8:30 9:40 a.m. AN ECONOMIST S-EYE VIEW OF THE ENERGY INDUSTRY: HYDROCARBON HAT TRICK
 Thursday, March 6, 214 Houston, TX 8:3 9:4 a.m. AN ECONOMIST S-EYE VIEW OF THE ENERGY INDUSTRY: HYDROCARBON HAT TRICK Presented by Jesse Thompson Business Economist Federal Reserve Bank of Dallas, Houston
Q3 Results November 16, 2006 Analyst Presentation
 Q3 Results 2006 November 16, 2006 Analyst Presentation Group Sales (in million Euro) Total Sales 2,395 +3.3% (+2.4%)* 2,474 Split per Business Group (YTD) Specialty Products 7% Q3 797 +1.0% (+2.5%)* 805
Tanker Market Outlook
 Tanker Market Outlook 4 th Maritime Indonesia Simon Chattrabhuti, Director, Head of Tanker Market Analysis Jakarta, 22 March 212 Disclaimer THIS PRESENTATION IS CONFIDENTIAL AND IS SOLELY FOR THE USE OF
282m 75% +575m. Net sales Operating income before non-recurring items. Operating margin before non-recurring items. Net Loss.
 First-Half 2009 Financial Highlights Net sales Operating income before non-recurring items Operating margin before non-recurring items Net Loss Net debt-to-equity ratio Free cash flow** 7,134m 282m 4.0%
Information Technology and Economic Development: An Introduction to the Research Issues
 November 1998 Working Papers No. 153 Information Technology and Economic Development: An Introduction to the Research Issues TABLE 1 WORLD-WIDE INFORMATION TECHNOLOGY MARKET BREAKDOWN, 1995
Committee for the Common Organisation of the Agricultural Market Market Situation for Sheep & Goat Meats 21 Septembre 2017
 Committee for the Common Organisation of the Agricultural Market Market Situation for Sheep & Goat Meats 21 Septembre 217 Production P R O D U C T I O N In ' tonnes carcase weight 14.1 58.4 43.8 3.6 29.2
ANCR CRU Statistics February 2007 to December 2007
 ANCR CRU Statistics February 2007 to December 2007 o Jan/07 Feb/07* Mar/07 Apr/07 May/07 Jun/07 Jul/07 Aug/07 Sep/07 Oct/07 Nov/07 Dec/07 Total notes data from Perimeter phone system unavailable prior
Where next for vegetable oil prices?
 Where next for vegetable oil prices? POTS Korea 2015 David Jackson, LMC International LMC International, 2015 1 The outline of this presentation We begin by looking at how oil demand in Korea is maturing.
CERI Commodity Report Crude Oil
 1-Jun-10 1-Jul-10 1-Aug-10 1-Sep-10 1-Oct-10 1-Nov-10 1-Dec-10 1-Jan-11 1-Feb-11 1-Mar-11 1-Apr-11 1-May-11 1-Jun-11 1-Jun-10 1-Jul-10 1-Aug-10 1-Sep-10 1-Oct-10 1-Nov-10 1-Dec-10 1-Jan-11 1-Feb-11 1-Mar-11
Product Tanker Market Outlook IMSF Geneva - May 2017
 Product Tanker ket Outlook IMSF Geneva - 217 Global Presence 16 staff in strategic locations LONDON HOUSTON BEIJING SEOUL HONG KONG SINGAPORE Product Tanker ket Outlook 217 2 Where are we now? Product
XXII Jornadas del Arroz Zaragoza (Spain) 9 th March 2016 EU RICE MARKET. Damien PLAN European Commission DG AGRI
 9 th March 2016 EU RICE MARKET. Damien PLAN European Commission DG AGRI") XXII Jornadas del Arroz Zaragoza (Spain) 9 th March 2016 EU RICE MARKET Damien PLAN European Commission DG AGRI Contents 1. EU Rice - Overview 2. EU Rice Trade Imports/Exports 3. EU Rice Market 2015/16
XXII Jornadas del Arroz Zaragoza (Spain) 9 th March 2016 EU RICE MARKET Damien PLAN European Commission DG AGRI Contents 1. EU Rice - Overview 2. EU Rice Trade Imports/Exports 3. EU Rice Market 2015/16
Chemical Feedstocks: Heavy Squeeze, All Light Long JIWON CHUNG DIRECTOR, ASIA BUSINESS DEVELOPMENT & CONTENT
 Chemical Feedstocks: Heavy Squeeze, All Light Long JIWON CHUNG DIRECTOR, ASIA BUSINESS DEVELOPMENT & CONTENT JCHUNG@OPISNET.COM BRENT SEP 2014-OCT 2016 $/barrel 125 100 75 50 25 0 September 2014 February
The Impact of Shale Oil Production Growth in the US
 The Impact of Shale Oil Production Growth in the US Presentation to IMSF, Copenhagen By Selena Yan, Senior Analyst www.clarksons.com Disclaimer The material and the information (including, without limitation,
/ PRELIMINARY STEEL IMPORTS INCREASE 15% IN APRIL Import Market Share 27% in April
 News Release FOR IMMEDIATE RELEASE May 23, 2014 CONTACT Lisa Harrison 202.452.7115/ lharrison@steel.org PRELIMINARY STEEL IMPORTS INCREASE 15% IN APRIL Import Market Share 27% in April Washington, D.C.
Recent Developments in International Seaborne Trade and Maritime Transport
 Recent Developments in International Seaborne Trade and Maritime Transport IFSPA, Hong Kong, 3-5 June 2013 Dr. Vincent F. Valentine Officer-in-Charge, Transport Section Division on Technology and Logistics
/ PRELIMINARY STEEL IMPORTS INCREASE 2% IN MAY Import Market Share 23% in May
 News Release FOR IMMEDIATE RELEASE June 25, 2013 CONTACT Lisa Harrison 202.452.7115/ lharrison@steel.org PRELIMINARY STEEL IMPORTS INCREASE 2% IN MAY Import Market Share 23% in May Washington, D.C. Based
European Energy Union Impact on the Refining & Petrochemical Business. John Cooper, Director General Budapest, 13th October 2015
 European Energy Union Impact on the Refining & Petrochemical Business John Cooper, Director General Budapest, 13th October 2015 FuelsEurope represents 42 Member Companies 100% of EU Refining Page 2 AGENDA
OCTANE THE NEW ECONOMICS OF. What Drives the Cost of Octane and Why Octane Costs Have Risen Since 2012 T. J. HIGGINS. A Report By:
 THE NEW ECONOMICS OF OCTANE What Drives the Cost of Octane and Why Octane Costs Have Risen Since 2012 A Report By: T. J. HIGGINS Contents Foreword... 1 1. Executive Summary... 2 2. Tracking the Changing
NEWS Release. U.S. Manufacturing Technology Orders. Year-to-date U.S. manufacturing technology orders up 4.1% over 2011
 U.S. Manufacturing Technology Orders A statistical program of AMT NEWS Release FOR RELEASE: October 8, 2012 Contact: Pat McGibbon, AMT, 703-827-5255 Year-to-date U.S. manufacturing technology orders up
Start covering fall fuel needs OPEC unity stabilizes oil market for now By Bryce Knorr, senior grain market analyst
 Start covering fall fuel needs OPEC unity stabilizes oil market for now By Bryce Knorr, senior grain market analyst OPEC and its allies are a strange bunch. Iran hates Saudi Arabia as much as it dislikes
Where are palm oil prices heading?
 Where are palm oil prices heading? Grepalma Congress August 2016 2016 LMC International. All rights reserved. www.lmc.co.uk Palm oil is still tied to petroleum today. El Niño and the Chinese Strategic
Energy Outlook. U.S. Energy Information Administration. For EnerCom Dallas February 22, 2018 Dallas, TX
 Energy Outlook For EnerCom Dallas Dallas, TX Jeff Barron Industry Economist, U.S. Energy Information Administration U.S. Energy Information Administration Independent Statistics & Analysis www.eia.gov