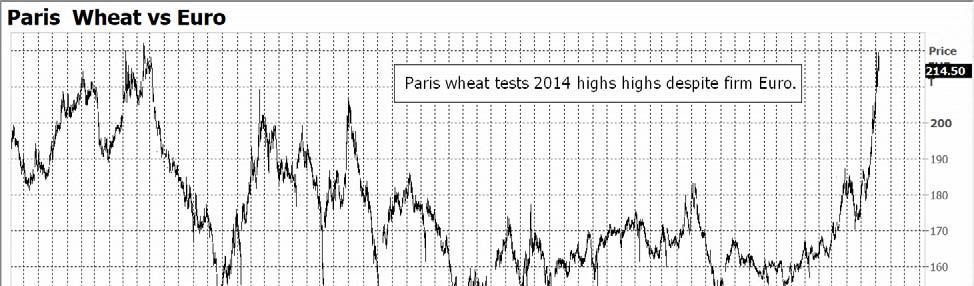
History gives hope for wheat rally Be sure to reward $2 rally. By Bryce Knorr, Senior Grain Market Analyst
|
|
|
- Giles Lindsey
- 5 years ago
- Views:
Transcription
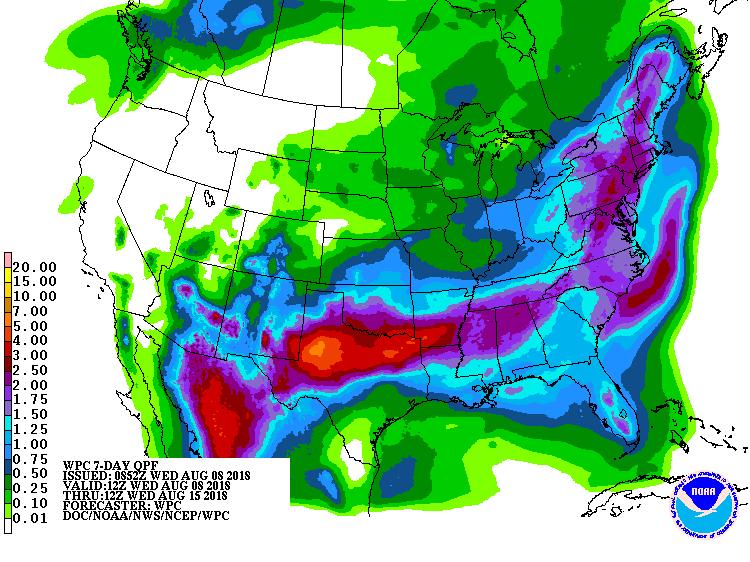
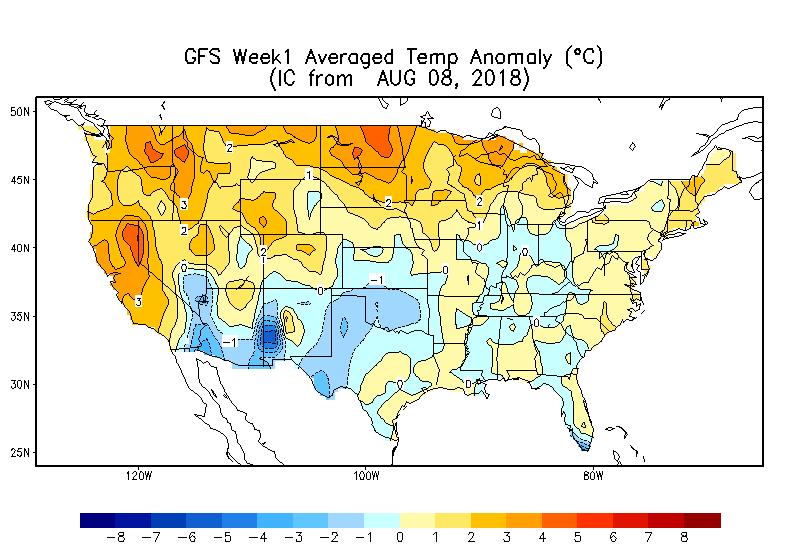
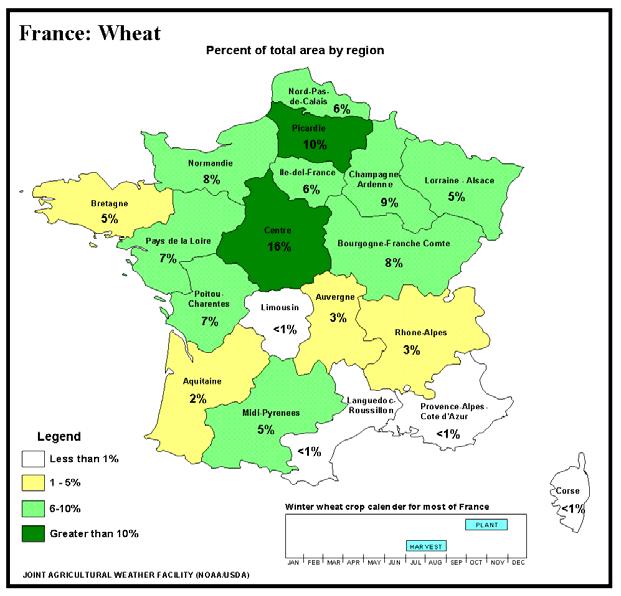
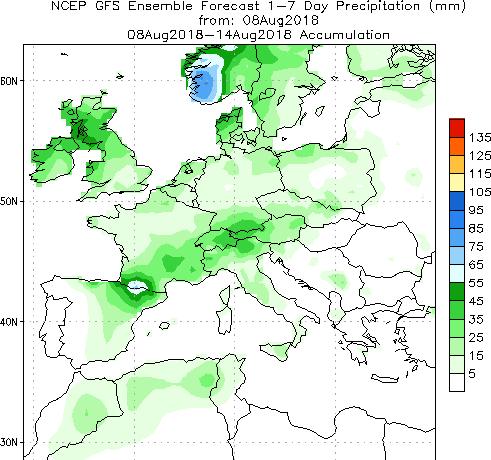
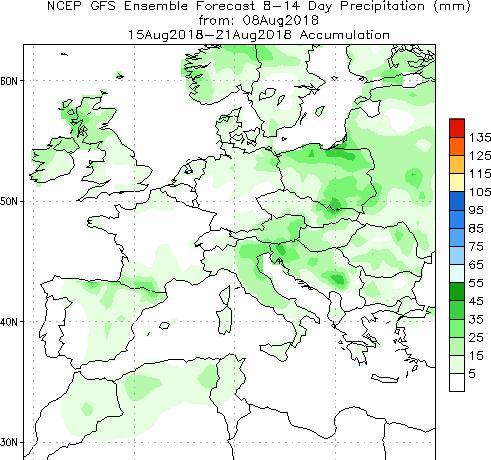
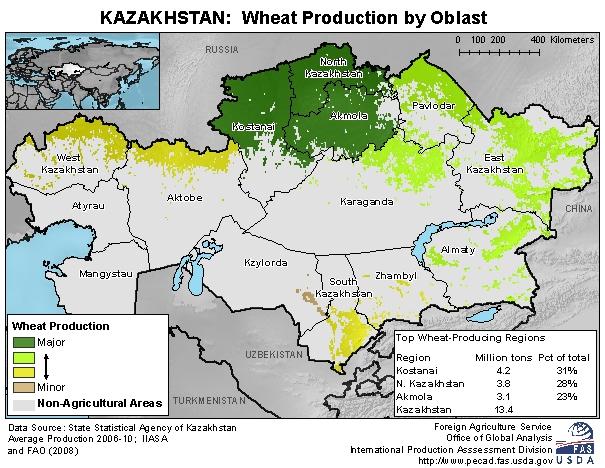
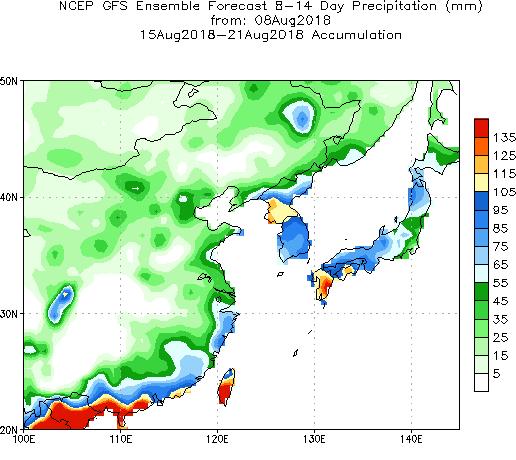
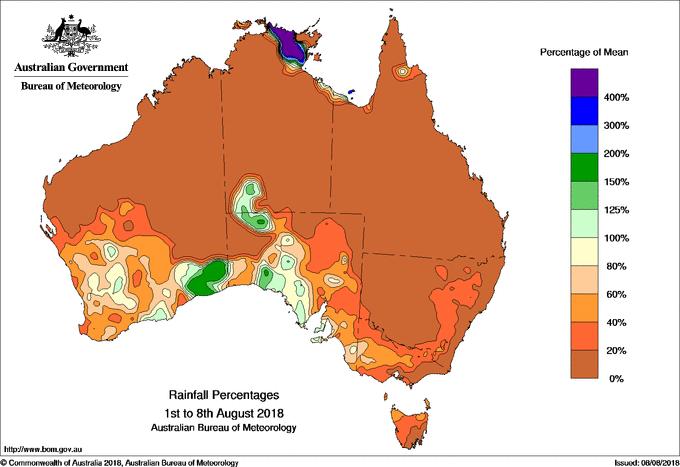
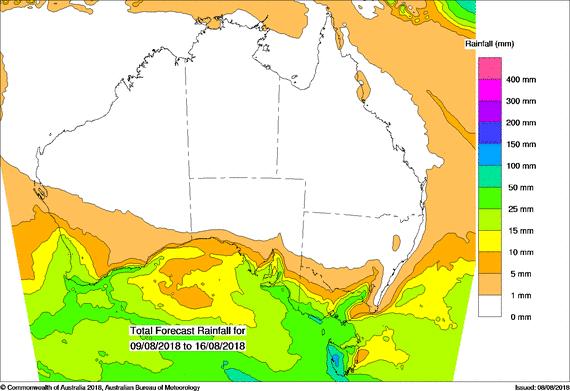
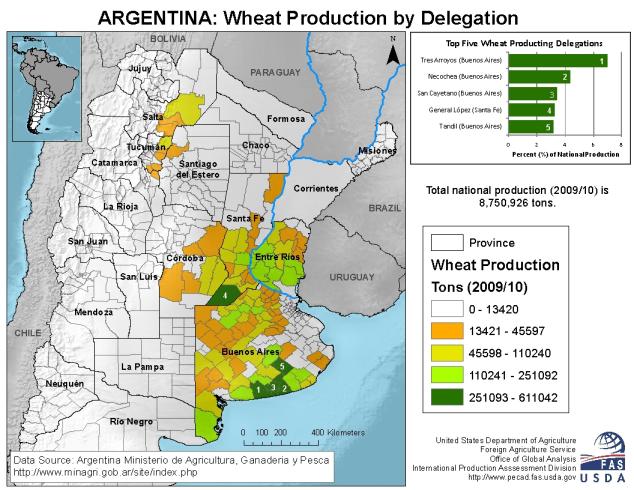
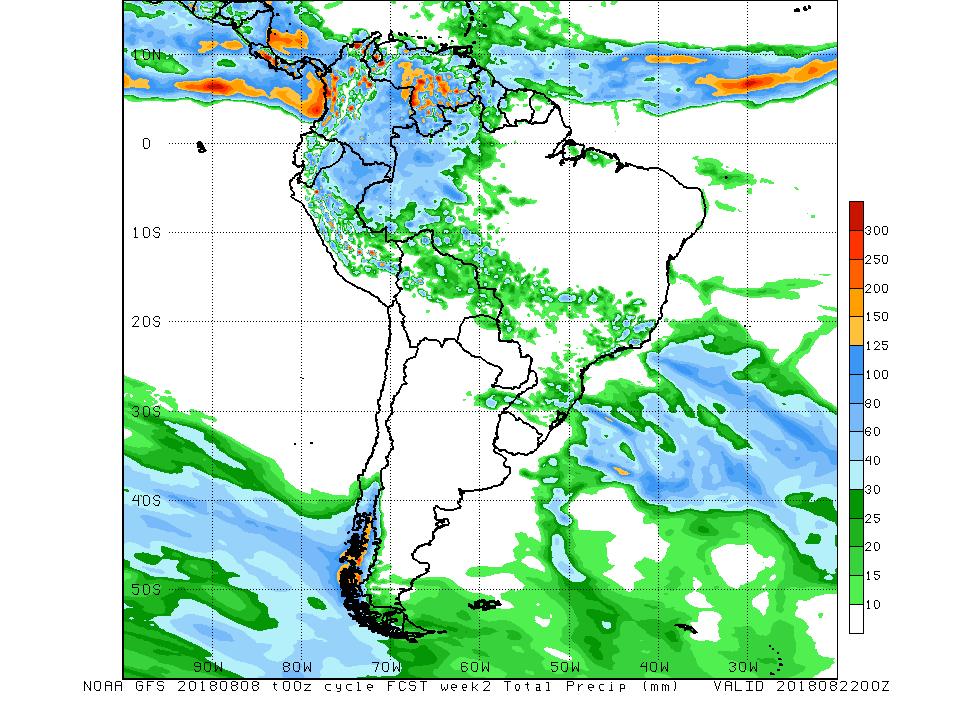
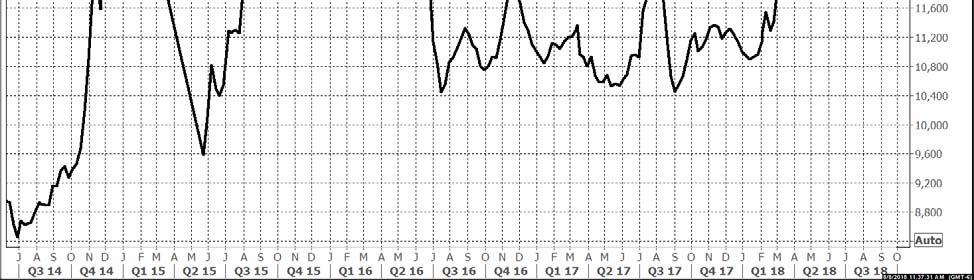
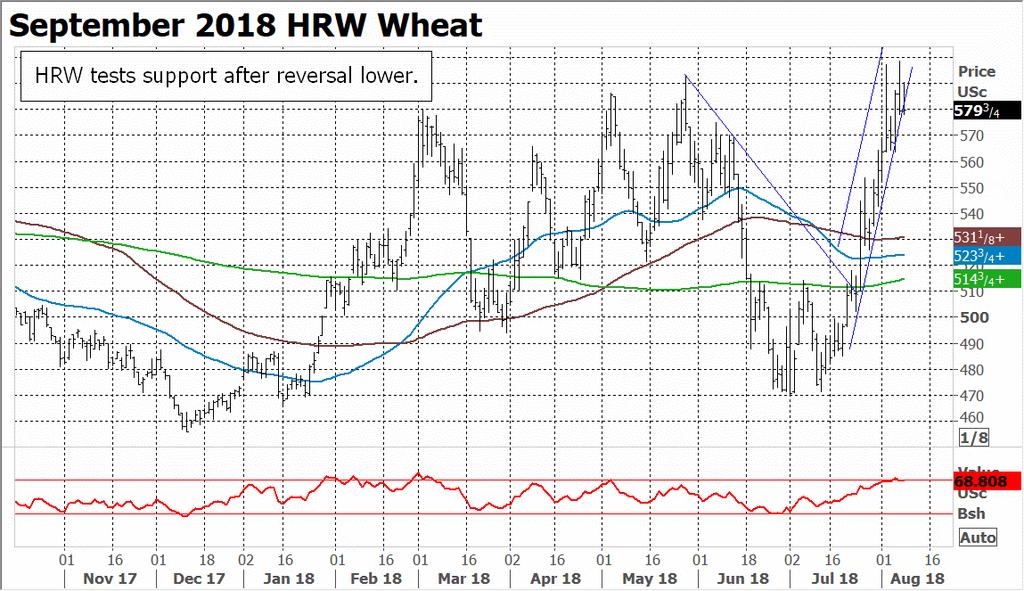
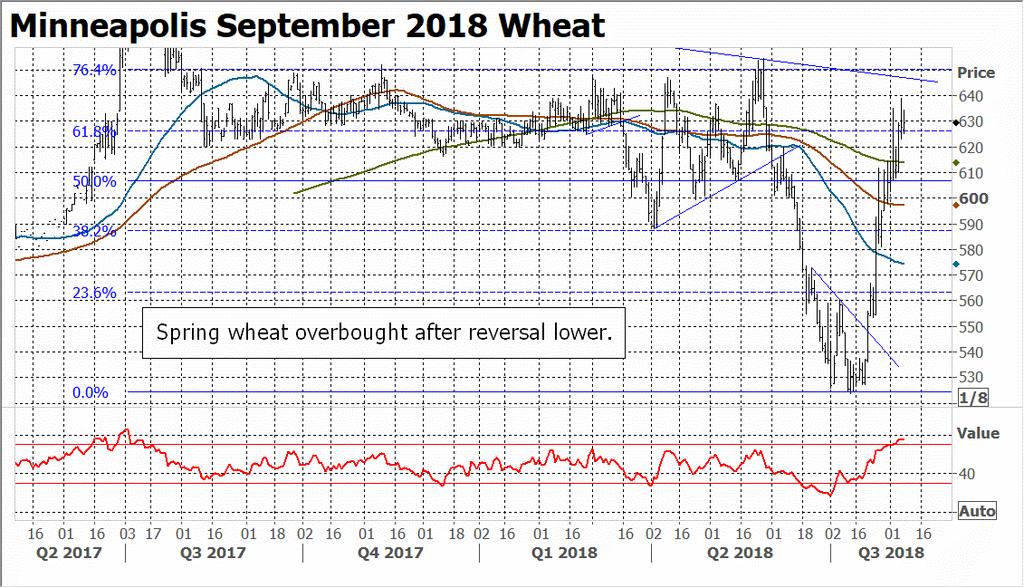
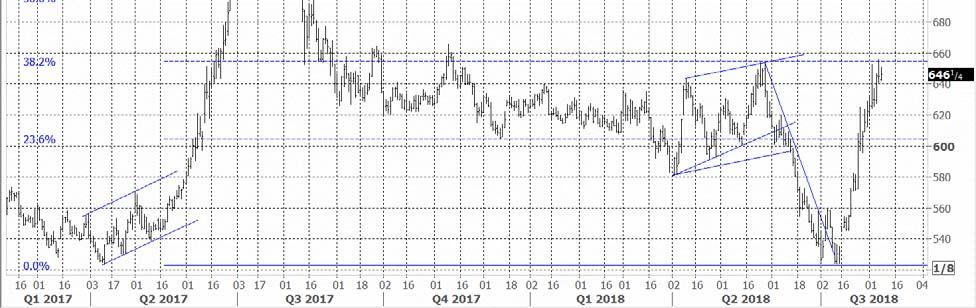
1 History gives hope for wheat rally Be sure to reward $2 rally By Bryce Knorr, Senior Grain Market Analyst For years the wheat market stagnated waiting for a single trigger: A sharp reduction in global production. That worldwide event finally occurred this year, lifting prices to four-year highs. Wheat is a market that likes to trend once it gets going. Bottoms typically occur around five years apart. Rallies eat up the first three years of the cycle, with down markets taking up the next two. At least that s the Cliff s Notes version of wheat marketing. The last cycle took nearly seven years to confirm. Fallout from the financial collapse a decade ago soured investors on commodities. And while U.S. acreage dwindled, other producers gained market share, namely Russia and its former Soviet Union satel-lites. Good weather and improving technology boosted their yields twice as fast as those in the U.S. That streak ended this year in the Black Sea region. Yields and acres both declined, part of a pattern seen across the result of Europe too. Now, a brewing El Nino warming of the equatorial Pacific threatens to slash Australian production by a third. If wheat returns to its old cycle, prices might be expected to rally into Dry conditions for seeding next year s winter wheat crop extend from the southwest Plains to France, though Ukraine and Russia are starting to trend wetter. Production in Argentina should rebound, with good moisture as seeding ends. A return to normal production will be needed to keep inventories from dropping further. The stocks-to-use ratio among major exports could drop to its lowest level ever by the summer of But higher prices should lure more acres into production too. Futures are starting to show signs of fatigue, and that s especially a warning sign for soft red winter wheat, which tends to top first in bullish years. Hard wheat contracts can extend rallies into September if conditions for seeding are a concern. Storms over the next week could help ease some of those concerns. As a result, it s time to get more aggressive pricing 2018 inventory after a $2 rally. Deferred futures are moving into my projected selling ranges. Winter wheat carries are rising again, not a bullish sign, but provide opportunity for good storage hedges for those with on farm storage and year-round markets. Also get started price 2019 winter wheat production. USDA s Aug. 10 report could lower the size of the U.S. crop, but this rally is about what s happening around the world.
2 Wheat Supply & Demand Table USDA Bryce Area Planted 50,154 46,012 47,300 46,012 47,821 Harvested 43,890 37,586 38,900 37,586 38,336 Yield Beginning stocks 976 1,181 1,100 1,181 1,100 Production 2,309 1,741 1,881 1,741 1,863 Imports Supply, total 3,402 3,078 3,117 3,079 3,094 Food Seed Feed and residual Domestic, total 1,171 1,077 1,157 1,077 1,101 Exports 1, Use, total 2,222 1,979 2,132 1,979 2,066 Ending stocks 1,181 1, ,100 1,028 Average price $3.89 $4.73 $5.00 $3.91 $5.19 Stocks to use ratio 53.1% 55.6% 46.2% 55.6% 49.8% Ave. Nearby Futures Chicago $5.65 Kansas City Hard Red $5.79 Minneapolis $6.10 Top Third of Price Range 2018 Chicago $5.81 to $6.17 Kansas City Hard Red $5.99 to $6.40 Minneapolis $6.10 to $6.65
3 Beginning Stocks Production Total Supply Domestic use Exports Total Use Ending stocks Soft Red Winter BK White BK Durum BK Hard Red Spring BK Hard Red Winter ,018 1, , , ,000 1, , , ,082 1, , , BK ,

4 55 Projected U.S. Spring Wheat Yields /21 6/4 6/18 7/2 7/16 7/30 8/13 8/27 9/10 Previous year State Model U.S. Model
5
6

7 80% ODDS 'EL NINO' WILL EMERGE 70% 60% 50% 40% 30% 20% 10% 0% JJA 2018 JAS 2018 ASO 2018 SON 2018 OND 2018 NDJ 2018 DJF 2019 JFM 2019 FMA 2019 Source: NOAA
8
9
10
11
12
13
14
15
16
17
18
19
20
21
22
23
24
25
26
27
28 Total Ending Stocks of Major Exporters 120, ,000 80,000 60,000 40,000 20, Includes U.S., Argentina, Australia, Canada, EU and FSU Total Wheat Exports (Year to Date) 50% 45% 40% 35% 30% 25% 20% 15% 10% 5% 0% Total Commitments % of USDA Forecast
29 Accumulated Wheat Export Shipments % 18% 16% 14% 12% 10% 8% 6% 4% 2% 0% Total Shipments % of USDA Forecast Hard Red Winter Wheat Exports (Year to Date) 60% 50% 40% 30% 20% 10% 0% Total Commitments % of USDA Forecast
30 Soft Red Winter Wheat Exports (Year to Date) 80% 70% 60% 50% 40% 30% 20% 10% 0% Total Commitments % of USDA Forecast Hard Red Spring Wheat Exports (Year to Date) 50% 45% 40% 35% 30% 25% 20% 15% 10% 5% 0% Total Commitments % of USDA Forecast
31 White Wheat Exports (Year to Date) 60% 50% 40% 30% 20% 10% 0% Total Commitments % of USDA Forecast Weekly Wheat Export Inspections 35,000 30,000 Thousand bushels 25,000 20,000 15,000 10,000 5, Yr. Avg. 0 J J A S O N D J F M A M SOURCE: USDA
32 Chicago December Futures /6 3/6 5/6 7/6 9/6 11/6 Bull Non-Bull Dec Dec-17 Chicago December Wheat Futures Seasonal Trend Start Date +1 Week +2 Weeks +3 Weeks +4 Weeks +5 Weeks 8/6 8/13 8/20 8/27 9/3 9/10 Ave. Gain/Loss (2.7) (0.5) 0.8 (2.7) (1.5) % Up 23/44 20/44 21/44 19/44 19/44 % Down 20/44 24/44 23/44 25/44 25/44 Ave. Gain - Up year Ave Loss - Down Year (14.6) (15.0) (17.2) (20.6) (22.4) Biggest Gain Biggest Loss (71.5) (101.0) (126.8) (106.5) (111.3) This table shows the typical seasonal pattern at weekly intervals from the start date, based on average daily futures prices from Gains and losses are based on the difference between the closing price on the start date and the closing price on the weekly date shown.
33 Kansas City December Futures /1 2/1 3/1 4/1 5/1 6/1 7/1 8/1 9/1 10/1 11/1 Bull Years Non-Bull Years Dec Seasonal Trend for Kansas City December Futures Start +1 Week +2 Weeks +3 Weeks +4 Weeks +5 Weeks +6 Weeks 8/6 8/13 8/20 8/27 9/3 9/10 9/17 Ave. Gain/Loss (0.0) (0.7) (1.2) (2.1) % Up 23/42 22/42 21/42 19/42 20/42 18/42 % Down 17/42 19/42 21/42 22/42 22/42 24/42 Ave. Gain - Up year Ave Loss - Down Year (15.7) (18.5) (23.1) (20.0) (23.8) (28.9) Biggest Gain Biggest Loss (55.0) (74.8) (90.0) (68.3) (104.5) (97.0) This table shows the typical seasonal pattern at weekly intervals from the start date, based on average daily futures prices from Gains and losses are based on the difference between the closing price on the start date and the closing price on the weekly date shown.

34 Minneapolis December Futures Feb Mar Apr May Jun Jul Aug Sep Oct Nov December 2018 Bull Years Bear Years
35 Kansas City July Futures /1 10/1 12/1 2/1 4/1 6/1 300 Bull Year July 2018 Normal Year 700 Minneapolis September Futures Normal Year /4 2/4 3/4 4/4 5/4 6/4 7/4 8/4 350 Bull Years Sepember 2018 Normal Years
36 650 Chicago July Futures /25 7/25 9/25 11/25 1/25 3/25 5/25 Bull Non-Bull Jul-18 Chicago July Wheat Futures Seasonal Trend Start Date +1 Week +2 Weeks +3 Weeks +4 Weeks +5 Weeks +6 Weeks 5/15 5/22 5/29 6/5 6/12 6/19 6/26 Ave. Gain/Loss (2.3) (4.0) (4.7) (5.6) (4.7) (3.8) % Up 19/43 14/43 18/43 17/43 15/43 18/43 % Down 24/43 29/43 25/43 26/43 28/43 25/43 Ave. Gain - Up year Ave Loss - Down Year (12.2) (15.9) (21.5) (23.0) (25.2) (34.0) Biggest Gain Biggest Loss (34.8) (52.0) (87.0) (93.0) (96.0) (139.5) This table shows the typical seasonal pattern at weekly intervals from the start date, based on average daily futures prices from Gains and losses are based on the difference between the closing price on the start date and the closing price on the weekly date shown.
37 Commitment of Traders - Chicago Wheat $7.00 $ $6.00 net position in contracts $5.50 $5.00 $4.50 $4.00 $3.50 nearby futures /15 3/15 5/15 7/15 9/15 11/15 1/16 3/16 5/16 7/16 9/16 11/16 1/17 3/17 5/17 7/17 9/17 11/17 1/18 3/18 5/18 7/18 $3.00 Source: CFTC Index funds Hedge funds Futures Commitment of Traders - K.C. Wheat $ $6.50 net position in contracts $6.00 $5.50 $5.00 $4.50 nearby futures $ /15 4/15 7/15 10/15 1/16 4/16 7/16 10/16 1/17 4/17 7/17 10/17 1/18 4/18 7/18 $3.50 Source: CFTC Index funds Hedge funds Futures

38 Commitment of Traders - Minneapolis Wheat (Futures and Options Combined) $8.00 Contracts /14 7/14 1/15 7/15 1/16 7/16 1/17 7/17 1/18 7/18 $7.00 $6.00 $5.00 $4.00 $3.00 Large traders Nearby Futures
39
40
41
42
43
44
Diesel prices finally ease Winter weather and international events could determine your fuel bill for 2018 By Bryce Knorr, senior grain market analyst
 Diesel prices finally ease Winter weather and international events could determine your fuel bill for 2018 By Bryce Knorr, senior grain market analyst After rallying to their highest level in nearly three
World Wheat Supply and Demand Situation
 World Wheat Supply and Demand Situation September 218 Major data source: USDA World Agricultural Supply and Demand Estimates released September 12, 218. Projections will change over the course of the year
World Wheat Supply and Demand Situation
 World Wheat Supply and Demand Situation November 218 Major data source: USDA World Agricultural Supply and Demand Estimates released November, 218. Projections will change over the course of the year depending
World Wheat Supply and Demand Situation October 2018
 World Wheat Supply and Demand Situation October 218 Major data source: USDA World Agricultural Supply and Demand Estimates released October 12, 218. Projections will change over the course of the year
World Wheat Supply and Demand Situation December 2018
 World Wheat Supply and Demand Situation December 218 Major data source: USDA World Agricultural Supply and Demand Estimates released December 11, 218. Projections will change over the course of the year
World Wheat Supply and Demand Situation August 2018
 World Wheat Supply and Demand Situation August 218 Major data source: USDA World Agricultural Supply and Demand Estimates released August 1, 218. Projections will change over the course of the year depending
Canola Weekly. Index. WCE May/07 Canola Jul 9-Aug 14-Sep 20-Oct 27-Nov 4-Jan 8-Feb 16-Mar
 March 2, 2 Canola Weekly Index ) Canola Steady Despite Weak Soy Complex 2) Slow Crush Improves Canola Oil Basis ) Export Demand Underpins Canola Last week, we mentioned that May canola had key support
World Wheat Supply and Demand Situation March 2018
 World Wheat Supply and Demand Situation March 218 Major data source: USDA World Agricultural Supply and Demand Estimates released March 8, 218. Projections will change over the course of the year depending
Diesel prices at multi-year highs mean pain at the pump
 Diesel prices at multi-year highs mean pain at the pump Conflicting signals from Wall Street keep commodity prices unsettled By Bryce Knorr, senior grain market analyst Headline news this week provided
Market Outlook. David Reinbott.
 Market Outlook David Reinbott Agriculture Business Specialist P.O. Box 187 Benton, MO 63736 (573) 545-3516 http://extension.missouri.edu/scott/agriculture.aspx reinbottd@missouri.edu Trending Issues Volatile
High fuel costs could last Diesel and propane may not get much cheaper in 2019 By Bryce Knorr, senior grain market analyst
 High fuel costs could last Diesel and propane may not get much cheaper in 2019 By Bryce Knorr, senior grain market analyst In July I recommended using a dip in the energy market to lock in propane for
It s time to start buying propane for fall Expect to pay more to dry 2017 corn crop By Bryce Knorr, senior grain market analyst
 It s time to start buying propane for fall Expect to pay more to dry 2017 corn crop By Bryce Knorr, senior grain market analyst It s the end of winter hopefully and that means it s a good time to buy coats,
Prices indeed dropped on Thursday, aided by a surprise increase in crude oil supplies caused by stronger imports.
 Trump s war on OPEC Farm fuel prices resist President s attempt to jawbone cartel By Bryce Knorr, senior grain market analyst For a day or two, at least, it looked like President Trump s attempt to tweet
Start covering fall fuel needs OPEC unity stabilizes oil market for now By Bryce Knorr, senior grain market analyst
 Start covering fall fuel needs OPEC unity stabilizes oil market for now By Bryce Knorr, senior grain market analyst OPEC and its allies are a strange bunch. Iran hates Saudi Arabia as much as it dislikes
Wheat Marketing Situation
 Wheat Marketing Situation Prepared by: Darrell L. Hanavan Executive Director Colorado Wheat Administrative Committee If you would like to receive an email when this report is updated, email gmostek@coloradowheat.org
Crop Market Outlook 8/22/2017
 MSU is an affirmativeaction, equal-opportunity employer. Michigan State University Extension programs and materials are open to all without regard to race, color, national origin, gender, gender identity,
Soybean Trade Growth: A Story of Brazil, the United States, and China
 United States Department of Agriculture Foreign Agricultural Service October 2017 Soybean Trade Growth: A Story of Brazil, the United States, and China 12-Month Soybean Export Growth Year Ending September
2007 AAEA Livestock Outlook Symposium
 27 AAEA Livestock Outlook Symposium Ron Plain Professor of Agricultural Economics University of Missouri-Columbia www.ssu.missouri.edu/faculty/rplain Hog Price Outlook Production Efficiency 1 Head 9.5
2016/17 Global Olive Oil Production Down But Prices Stabilize
 United States Department of Agriculture Foreign Agricultural Service November 2016 Global Olive Oil Down But Prices Stabilize Global Olive Oil and Stocks 4000 3500 5000 Extra Virgin Olive Oil Prices Stabilizing
Argentine Exporters Switch to Soybean Oil as Biodiesel Exports Fall
 United States Department of Agriculture Foreign Agricultural Service Circular Series FOP 08-13 Argentine Exporters Switch to Soybean Oil as Biodiesel Exports Fall Argentina s soybean oil exports have surged
Indian Soybean Meal Exports Unlikely to Recover in 2015/16
 United States Department of Agriculture Foreign Agricultural Service November 2015 Indian Soybean Meal Exports Unlikely to Recover in Though once a significant regional exporter of soybean meal, India
Pakistan Oilseed Processors Seize Opportunity to Crush Soybeans
 United States Department of Agriculture Foreign Agricultural Service December 2015 Pakistan Oilseed Processors Seize Opportunity to Crush Soybeans Pakistan, long an importer of soybean meal, is transitioning
U.S. Soybean Exports Forecast to Reach Record
 United States Department of Agriculture Foreign Agricultural Service July 2017 U.S. Soybean Exports Forecast to Reach Record 60 Accumulated Exports by Week Total Commitments of Soybeans as of End of June
Sharp Decline in Vegetable Oil Stocks Leads to Steeply Higher Prices
 United States Department of Agriculture Foreign Agricultural Service Circular Series FOP 1-11 Sharp Decline in Vegetable Oil Leads to Steeply Higher Prices Commodity prices have been on an upward trend
China s Global Peanut Export Share Declines
 United States Department of Agriculture Foreign Agricultural Service Circular Series FOP 07-13 China s Global Peanut Export Share Declines U.S. 10% Others 19% Argentina 17% U.S. 11% Others 16% Argentina
THIS REPORT CONTAINS ASSESSMENTS OF COMMODITY AND TRADE ISSUES MADE BY USDA STAFF AND NOT NECESSARILY STATEMENTS OF OFFICIAL U.S.
 THIS REPORT CONTAINS ASSESSMENTS OF COMMODITY AND TRADE ISSUES MADE BY USDA STAFF AND NOT NECESSARILY STATEMENTS OF OFFICIAL U.S. GOVERNMENT POLICY Required Report - public distribution Oilseeds and Products
2019 Grain Update December 4, 2018
 2019 Grain Update December 4, 2018 Orange Juice (Jan '19) Live Cattle (Dec '18) S&P 500 E-Mini (Dec '18) Dow Indu 30 E-Mini (Dec '18) Cotton #2 (Dec '18) U.S. Dollar Index (Dec '18) Wheat (Dec '18) Nasdaq
Strong Global Grain Production Isn t Good Enough. David Hightower The Hightower Report
 Strong Global Grain Production Isn t Good Enough David Hightower The Hightower Report Big Picture Factors Cost of Production Pricing Not a downtrend signal Goldman $20 oil Forecast was wrong 8.9 mbd!
Weak Real to Boost Brazil s Soybean Exports in 2016
 United States Department of Agriculture Foreign Agricultural Service October 2015 Weak Real to Boost Brazil s Soybean Exports in 2016 Brazil s exchange rate is having a significant impact on domestic and
SOYBEAN OUTLOOK Midwest & Great Plains/Western Extension Summer Outlook Conference. St. Louis, Missouri
 SOYBEAN OUTLOOK 2014 Midwest & Great Plains/Western Extension Summer Outlook Conference St. Louis, Missouri Jim Hilker Department of Agricultural, Food, And Resource Economics Michigan State University
Passive Investors and Managed Money in Commodity Futures. Part 2: Liquidity. Prepared for: The CME Group. Prepared by:
 Passive Investors and Managed Money in Commodity Futures Part 2: Liquidity Prepared for: The CME Group Prepared by: October, 2008 Table of Contents Section Slide Number Objectives and Approach 3 Findings
India Soybean Meal Exports: Revised and Rebounding
 United States Department of Agriculture Foreign Agricultural Service January 2017 India Soybean Meal Exports: Revised and Rebounding India Soybean Meal Exports Forecast to Rise in 8.0 Data Series Comparison
2017 SC Producers Whole Farm Revenue Protection Expected Price Justification
 2017 SC Producers Whole Farm Revenue Protection Expected Price Justification RMA Projected Expected As of Average Futures Price Close As of RMA Projected Prices 4 Feb 2011 2015 % Differ 4 Feb Crop Contract
D G A G R I D A S H B O A R D : A P P L E S
 75 79 60 56 49 74 65 59 54 42 76 63 58 53 78 55 42 43 79 44 81 63 47 83 64 59 53 48 Sources: Eurostat, MSs notifications, DG Agri, Comext, Comtrade, GTA, ITC, AMI, Expert groups, Freshfel, Wapa. 89 68
China s Rapeseed Meal Imports Rise as Seed Imports Decline
 United States Department of Agriculture Foreign Agricultural Service February 2017 China s Rapeseed Meal Rise as Seed Decline Trend in China Rapeseed 12-Month Moving Totals Trend In China Rapeseed Meal
Soybean and Oilseed Meal Import Prospects Higher as Severe Weather Damages EU Crops
 Million Tons Million Tons Million Tons United States Department of Agriculture Foreign Agricultural Service August 2018 Soybean and Oilseed Meal Import Prospects Higher as Severe Weather Damages EU Crops
Palm and Soy Oil Use Expands at Expense of Other Oils
 United States Department of Agriculture Foreign Agricultural Service September 2015 Revised on September 15, 2015 Palm and Soy Oil Use Expands at Expense of Other Oils As global demand for vegetable oil
Drought in South America to Limit Soybean Exports
 United States Department of Agriculture Foreign Agricultural Service Circular Series FOP 2-09 ruary 2009 Drought in South America to Limit Soybean Exports Million Tons 16 14 12 10 8 6 4 2 Annual Change
Early-Season U.S. Soybean Meal Sales Surge
 United States Department of Agriculture Foreign Agricultural Service November 2014 Early-Season U.S. Soybean Meal Sales Surge U.S. soybean meal export commitments (accumulated exports plus outstanding
Share of Brazil s Soybean Exports to China Spikes in August
 United States Department of Agriculture Foreign Agricultural Service September 2018 Share of Brazil s Soybean Exports to China Spikes in August Monthly Share of Brazil's Soybean Exports to China 85% 75%
Drought Forecast to Reduce Australian Rapeseed Exports in 2007
 United States Department of Agriculture Foreign Agricultural Service Circular Series FOP 11-06 November 2006 Drought Forecast to Reduce Australian Rapeseed Exports in 2007 1800 1600 1400 1200 1000 800
Brazil s Soybean Oil Exports Squeezed by Rising Biodiesel Demand
 United States Department of Agriculture Foreign Agricultural Service Circular Series FOP 6-09 e 2009 Brazil s Soybean Oil Exports Squeezed by Rising Biodiesel Demand Soybean Oil Exports and Industrial
Devaluation Energizes Argentine Soybean Crush
 United States Department of Agriculture Foreign Agricultural Service March 2016 Devaluation Energizes Argentine Soybean Crush Argentina Quarterly Soybean Crush Volume Exchange Rate* and Constant Dollar
COMPARISON OF FIXED & VARIABLE RATES (25 YEARS) CHARTERED BANK ADMINISTERED INTEREST RATES - PRIME BUSINESS*
 CHARTERED BANK ADMINISTERED INTEREST RATES - PRIME BUSINESS*") COMPARISON OF FIXED & VARIABLE RATES (25 YEARS) 2 Fixed Rates Variable Rates For Internal Use Only. FIXED RATES OF THE PAST 25 YEARS AVERAGE RESIDENTIAL MORTGAGE LENDING RATE - 5 YEAR* (Per cent) Year
COMPARISON OF FIXED & VARIABLE RATES (25 YEARS) 2 Fixed Rates Variable Rates For Internal Use Only. FIXED RATES OF THE PAST 25 YEARS AVERAGE RESIDENTIAL MORTGAGE LENDING RATE - 5 YEAR* (Per cent) Year
COMPARISON OF FIXED & VARIABLE RATES (25 YEARS) CHARTERED BANK ADMINISTERED INTEREST RATES - PRIME BUSINESS*
 CHARTERED BANK ADMINISTERED INTEREST RATES - PRIME BUSINESS*") COMPARISON OF FIXED & VARIABLE RATES (25 YEARS) 2 Fixed Rates Variable Rates FIXED RATES OF THE PAST 25 YEARS AVERAGE RESIDENTIAL MORTGAGE LENDING RATE - 5 YEAR* (Per cent) Year Jan Feb Mar Apr May Jun
COMPARISON OF FIXED & VARIABLE RATES (25 YEARS) 2 Fixed Rates Variable Rates FIXED RATES OF THE PAST 25 YEARS AVERAGE RESIDENTIAL MORTGAGE LENDING RATE - 5 YEAR* (Per cent) Year Jan Feb Mar Apr May Jun
Market situation Cereals Oilseeds Protein crops
 Market situation Cereals Oilseeds Protein crops DG AGRI C 4 Civil Dialogue Group on Animal Products Pig Meat 13 April 2016 Exchange rates & crude oil 2 Euro US Dollar exchange rate 1.40 1.15 From the last
Commercial-in-Confidence Ashton Old Baths Financial Model - Detailed Cashflow
 Year 0 1 2 3 4 5 6 7 8 9 10 11 12 13 Oct-16 Nov-16 Dec-16 Jan-17 Feb-17 Mar-17 Apr-17 May-17 Jun-17 Jul-17 Aug-17 Sep-17 Oct-17 2,038 2,922 4,089 4,349 6,256 7,124 8,885 8,885 8,885 8,885 8,885 8,885 9,107
Oilseeds and Products
 Oilseeds and Products Oilseeds compete with major grains for area. As a result, weather impacts soybeans, rapeseed, and sunflowerseed similarly to grain and other crops grown in the same regions. The same
Growing Dependence on Palm Oil in World Trade and Consumption
 Growing Dependence on Palm Oil in World Trade and Consumption Plenary Lecture at the Malaysia Russia Palm Oil Trade Fair & Seminar (POTS) there somebody in Moscow to pick on me 16 Sept up tomorrow 2013
Coconut Oil Prices Spike
 United States Department of Agriculture Foreign Agricultural Service Coconut Oil Prices Spike Coconut oil prices have surged over the past year in contrast to the general downward trend in other vegetable
Rudi Swanepoel. Fax:
 Commodity Future CME CORN FUURES Main Board Close Change Last Change CME Corn Sep'12 7971/4 71/2 7961/4-1 CME Corn Dec'12 7981/2 73/4 7971/4-11/4 CME Corn Mar'13 8011/2 63/4 8001/4-11/4 CME Corn May'13
AOF Forum Oilseeds Outlook October, 2006
 AOF Forum Oilseeds Outlook October, 2006 Josh Roberts Senior Trading Manager Grain Pool Pty Ltd 30 Delhi Street West Perth Tel: +61 8 9237 9859 josh.roberts@grainpool.com.au Oilseeds trends versus other
No sale Farmers continue to hold tight By Bryce Knorr
 No sale Farmers continue to hold tight By Bryce Knorr Basis in the grain cash market didn t firm everywhere during Thanksgiving week, but overall the trend is for strengthening as growers resist selling
2018 Outlook for Grains and Oilseeds
 2018 Outlook for Grains and Oilseeds Present to the American Fats and Oils Associa;on October 2017 AdvancedEconomicSolu0ons US$ Declines from Peak - Now at lowest point since October 2015 Currently in
Soybean Oil Prices Diverge on Different Supply Situations
 United States Department of Agriculture Foreign Agricultural Service Circular Series FOP 10-09 October 2009 Soybean Oil Prices Diverge on Different Supply Situations Soybean Oil Price ($/ton) $900 $850
Monthly Hog Market Update United States Hog Production
 This information is provided as a resource by Saskatchewan Agriculture staff All prices are in Canadian dollars unless otherwise noted. Please use this information at your own risk. Monthly Hog Market
China is Key to Slow Pace of U.S. Soybean Exports
 United States Department of Agriculture Foreign Agricultural Service January 2018 China is Key to Slow Pace of U.S. Soybean Exports U.S. and Brazil Soybean Exports by Destination (Accumulated Exports:
A summary of national and global energy indicators. FEDERAL RESERVE BANK of KANSAS CITY
 THE U.S. Energy DATABOOK A summary of national and global energy indicators JULY 1, 17 FEDERAL RESERVE BANK of KANSAS CITY SUMMARY OF CURRENT ENERGY CONDITIONS The number of total active drilling rigs
Gas & electricity - at a glance
 $/barrel /tco 2 e p/therm /MWh Gas & electricity - at a glance Week-on-Week Annual Gas Price Changes Short-term gas contracts jump Cold snap forecast for the first half of February, lifting demand Longer-dated
China Tariffs Driving U.S. Soybean Exports To the European Union to a 30-Year High
 United States Department of Agriculture Foreign Agricultural Service March 2019 China Tariffs Driving U.S. Soybean Exports To the European Union to a 30-Year High 12-MONTH MOVING TOTAL U.S. SOYBEAN EXPORTS
Canada Meat Market Report
 January 2018 January 18th, 2018 Canada Meat Market Report - Supply and Price Situa on for Domes c and Imported Beef - Prepared for Meat and Livestock Australia Steiner Consul ng Group, Manchester, NH,
Week Ending: Oct. 25, 2018
 Week Ending: Oct. 25, 2018 Market Page 1. Thurs. Close Last Thurs. Close Weekly Change Week's High Week's Low Life of Contract High Life of Contract Low NEW YORK COTTON FUTURES (Cents/Lb.) December-18
Record U.S. Peanut Exports on Strong Shipments to China and Vietnam
 United States Department of Agriculture Foreign Agricultural Service September 2016 Record U.S. Peanut Exports on Strong Shipments to China and Vietnam Thousand Metric Tons 800 700 600 500 400 300 200
2017/18 Cotton Outlook
 217/1 Cotton Outlook 217 Ag Econ In service Training Dr. S. Aaron Smith, Assistant Professor, Department of Agricultural and Resource Economics, University of Tennessee https://ag.tennessee.edu/arec/pages/cropeconomics.aspx
Up and Down Months of the Stock Market
 Up and Down Months of the Stock Market 1926-2017 Positive years (66) in the stock market were not good all year long and losing years (24) were not losers throughout the year. Winning years produce losing
Soybean Prices Fall on Rising South American Production
 United States Department of Agriculture Foreign Agricultural Service April 2017 Soybean Prices Fall on Rising South American Production Million Tons Change in South America Soybean Production Forecast
As China s Soybean Oil Imports Fall, Production Expands
 United States Department of Agriculture Foreign Agricultural Service Circular Series FOP 10-10 October 2010 As China s Soybean Oil Fall, Expands 12 10 Million Metric Tons 8 6 4 2 0 2006/07 2007/08 China
U.S. Soybean Prices Fall as Buyers Focus Turns to South America
 United States Department of Agriculture Foreign Agricultural Service Circular Series FOP 2-10 ruary 2010 U.S. Soybean Prices Fall as Buyers Focus Turns to South America $11.00 Daily U.S. Soybean Cash Price
Strong Brazilian Soybean Sales Expected to Slow Rebound in Argentine Exports
 United States Department of Agriculture Foreign Agricultural Service December 2018 Strong Brazilian Soybean Sales Expected to Slow Rebound in Argentine Exports Oct. 1 - Nov. 30 Brazil Soybean Exports (Million
Week Ending: Dec. 8, 2016
 Week Ending: Dec. 8, 2016 Market Page 1. Thurs. Close Last Thurs. Close Weekly Change Week's High Week's Low Life of Contract High Life of Contract Low NEW YORK COTTON FUTURES (Cents/Lb.) March-17 71.42
U.S. Soybeans Facing Stiff Competition from Brazil. Brazil Soybean Export Price (Dollars and Reals) and Exchange Rate
 and Exchange Rate") United States Department of Agriculture Foreign Agricultural Service June, 2018 U.S. Soybeans Facing Stiff Competition from Brazil Brazil Soybean Export Price (Dollars and Reals) and Exchange Rate FOB
United States Department of Agriculture Foreign Agricultural Service June, 2018 U.S. Soybeans Facing Stiff Competition from Brazil Brazil Soybean Export Price (Dollars and Reals) and Exchange Rate FOB
D G A G R I D A S H B O A R D : A P P L E S
 Sources: Eurostat, MSs notifications, DG Agri, Comext, Comtrade, GTA, ITC, AMI, Expert groups, Freshfel, Wapa. 000 tonnes 39 41 31 22 29 22 32 27 17 18 9 27 15 12 6 6 6 4 5 6 5 4 11 25 15 9 9 93 62 51
Market Report. Grain HIGHLIGHTS INTERNATIONAL GRAINS COUNCIL. WORLD ESTIMATES. GMR November 2018
 Grain INTERNATIONAL GRAINS COUNCIL www.igc.int Market Report GMR 494 22 November 2018 HIGHLIGHTS With small adjustments for wheat, maize and sorghum, the forecast for world total grains (wheat and coarse
Major Junctions Ahead Energy, Grains and Metals. David Hightower President, The Hightower Report
 Major Junctions Ahead Energy, Grains and Metals David Hightower President, The Hightower Report 30 25 23.55 2018 Commodity Performance - Annual Percent Change 20 16.49 15 10 10.09 6.44 5 0 0.24-5 -10-15
NEU Electric and Natural Gas Price Update
 $ / MWH Jan-11 May-11 Sep-11 Sep-12 Jan-13 Electric: Short-Term Outlook The NYMEX Northern Illinois Hub 12-month forward price at the end of August 2016 for the September 2016 to August 2017 period was
Sheep Market Outlook. Mark Kozlowski, AHDB Beef & Lamb AHDB Outlook Conference 9 February 2016
 Sheep Market Outlook Mark Kozlowski, AHDB Beef & Lamb AHDB Outlook Conference 9 February 2016 Overview Current situation UK Current situation rest of the world UK outlook Wildcards Current situation in
Growing Soybean Oil Price Raises Oil s Contribution to Total Soybean Value
 United States Department of Agriculture Foreign Agricultural Service Circular Series FOP 10-07 October 2007 Growing Soybean Oil Price Raises Oil s Contribution to Total Soybean Value Relative Share Value:
China 2017/18 Soybean Imports Soar on Appetite for Pork, Aquaculture, and Dairy
 United States Department of Agriculture Foreign Agricultural Service June 2017 China Soybean Soar on Appetite for Pork, Aquaculture, and Dairy China: Booming Farmed Aquaculture Production China: Record
TOOL #5: C&S WASDE PRICE STUDY FOR DECEMBER CORN 7/09/10 For the July 9 th to the August 12 th time frame for CZ 2010
 TOOL #5: C&S WASDE PRICE STUDY FOR DECEMBER CORN 7/09/10 For the July 9 th to the August 12 th time frame for CZ 2010 Brief summary: In the month ahead, my best estimate is that CZ 2010 could trade in
China Soybean Imports Stagnant Despite Record Consumption as Production Rebounds
 United States Department of Agriculture Foreign Agricultural Service Circular Series FOP 9-08 tember 2008 China Soybean Stagnant Despite Record Consumption as Rebounds Million Tons 60 50 40 30 20 10 0
Global Supply, Demand and Price Outlook for Oilseeds, Oils and Meals
 Global Supply, Demand and Price Outlook for Oilseeds, Oils and Meals Presentation at the Australian Grains Industry Conference on 2 Aug 2017 in Melbourne there somebody to pick me up tomorrow at the airport
Algeria. Grain and Feed Update. Wheat update
 THIS REPORT CONTAINS ASSESSMENTS OF COMMODITY AND TRADE ISSUES MADE BY USDA STAFF AND NOT NECESSARILY STATEMENTS OF OFFICIAL U.S. GOVERNMENT POLICY Required Report - public distribution Grain and Feed
Global Monthly March 2019
 Global Monthly March 19 Percent of world bonds outstanding 3 5 15 5 Jan-1 Jun-1 Nov-1 Apr-15 Sep-15 Feb-1 Jul-1 Dec-1 May-17 Oct-17 Mar-1 Aug-1 Dec-1 Mar-19 March 19 Percent, year-on-year 7 5 3 1 1Q1 1Q
FOR IMMEDIATE RELEASE
 Article No. 7845 Available on www.roymorgan.com Roy Morgan Unemployment Profile Friday, 18 January 2019 Unemployment in December is 9.7% and under-employment is 8.8% FOR IMMEDIATE RELEASE Australian unemployment
Rice Outlook Slide Show U.S. and World August 10, 2017
 Rice Outlook Slide Show U.S. and World August 10, 2017 Bobby Coats, Ph.D. Professor Economics Department of Agricultural Economics and Agribusiness Division of Agriculture Cooperative Extension Service
US Crude Oil Reshaping International Crude Oil Flows. Olivier Jakob,
 US Crude Oil Reshaping International Crude Oil Flows Olivier Jakob, ojakob@petromatrix.com www.petromatrix.com Claimer Petromatrix publishes since 2006 a daily market note on the oil markets Our reports
Advance Trading, Inc. Supply/Demand Summary
 Advance Trading, Inc. Supply/Demand Summary Corn Planted Acres 88.0 94.0 90.2 90.2 0.0 88.0 88.0 0.0 % Harvested 91.8% 92.2% 91.7% 91.7% 91.7% 91.7% Harvested Acres 80.8 86.7 82.7 82.7 0.0 80.7 80.7 0.0
Rudi Swanepoel. Fax:
 Commodity Future CME CORN FUURES Main Board Month Close Change Last Change CME Corn May'13 6511/4 21/4 654 23/4 CME Corn Jul'13 6331/2 1 6353/4 21/4 CME Corn Sep'13 567 1/4 5671/2 1/2 CME Corn Dec'13 544
Basis gains despite transport woes Floods shut river system while congestion snarls rail traffic to Mexico By Bryce Knorr
 Basis gains despite transport woes Floods shut river system while congestion snarls rail traffic to Mexico By Bryce Knorr Transportation problems at harvest are nothing new for farmers, but when they occur
Energy Outlook. U.S. Energy Information Administration. For EnerCom Dallas February 22, 2018 Dallas, TX
 Energy Outlook For EnerCom Dallas Dallas, TX Jeff Barron Industry Economist, U.S. Energy Information Administration U.S. Energy Information Administration Independent Statistics & Analysis www.eia.gov
Reviewing a volatile year for PET What does the future hold?
 Reviewing a volatile year for PET What does the future hold? Matt Tudball Head of European Markets www.icis.com 1 Agenda PET price and sentiment drivers in 2017: Europe, Americas, Asia & feedstocks Predictions
US biofuel Indicators and a changing market dynamic
 US biofuel Indicators and a changing market dynamic Seth Meyer AMIS October 1-2, 13, Rome Movement of Ag and Energy Ethanol production and capacity 16 35 Crude oil and maize prices 14 3 billion gallons
TENTH DISTRICT MANUFACTURING SURVEY REBOUNDED MODERATELY Federal Reserve Bank of Kansas City Releases January Manufacturing Survey
 FOR RELEASE Thursday, January 23, 2014 EMBARGOED FOR 10 A.M. CENTRAL TIME CONTACT: Bill Medley 816-881-2556 Bill.Medley@kc.frb.org TENTH DISTRICT MANUFACTURING SURVEY REBOUNDED MODERATELY Federal Reserve
Rising Coconut Oil Prices Foreshadow Tight Supplies in 2007
 United States Department of Agriculture Foreign Agricultural Service Circular Series FOP 2-07 ruary 2007 Rising Coconut Oil Prices Foreshadow Tight Supplies in 2007 800 Coconut Oil Price: CIF Rotterdam
Update of Poultry Fundamentals April 18
 Update of Poultry Fundamentals April 18 Contact us: 402.898.9458 www.advancedeconomicsolutions.com knox@aesresearch.com Visit our updated website Follow us on Twitter @AES_Research 4/13/2018 AdvancedEconomicSolutions
Growing Fuel Use Limits Exports of Soybean Oil by South America
 United States Department of Agriculture Foreign Agricultural Service Circular Series FOP 11-09 ember 2009 Growing Fuel Use Limits of Soybean Oil by South America 2006/07 Soybean Oil Distribution Soybean
The ISM Manufacturing Survey Points to Imminent Economic Recovery, Possibly in 2009 May 1, Chart 1
 Northern Trust Global Economic Research 50 South LaSalle Chicago, Illinois 3 northerntrust.com Asha G. Bangalore agb3@ntrs.com The ISM Manufacturing Survey Points to Imminent Economic Recovery, Possibly
Refined Oils Weekly Wire 04/27/2012
 Refined Oils Weekly Wire 04/27/2012 The following is provided for informational purposes only and is not a recommendation to buy or sell a commodity. Much of this information is derived from sources that
What Does the March Prospective Plantings Report Mean for the Outlook? Chris Hurt & Corinne Alexander
 What Does the March Prospective Plantings Report Mean for the 2014-2015 Outlook? Chris Hurt & Corinne Alexander hurtc@purdue.edu cealexan@purdue.edu Purdue University April 1, 2014" Webinar: April 1, 2014
Market Report INTERNATIONAL GRAINS COUNCIL. HIGHLIGHTS WORLD ESTIMATES
 Grain GMR 467 1 July 2016 INTERNATIONAL GRAINS COUNCIL www.igc.int Market Report HIGHLIGHTS The forecast for total grains (wheat and coarse grains) production in 2016/17 is up by 10m t m/m (month-on-month),