SOYBEAN OUTLOOK Midwest & Great Plains/Western Extension Summer Outlook Conference. St. Louis, Missouri
|
|
|
- Lesley Peters
- 5 years ago
- Views:
Transcription
1 SOYBEAN OUTLOOK 2014 Midwest & Great Plains/Western Extension Summer Outlook Conference St. Louis, Missouri Jim Hilker Department of Agricultural, Food, And Resource Economics Michigan State University August 13-14, 2014
2 Continued Volatility relative to pre 2007 Weather, Frost Scare, U.S. and World But less Volatility than U.S. and World Economy Energy Prices Value of the Dollar Fight for Acres Price seems higher than fundamentals Perhaps more optimistic on world demand Or Crop is not made, risk premium
3 Monthly Soybean Futures
4 Nov 2014 Soybean Futures
5 Nov 2014 Soybean Futures
6 SUPPLY/DEMAND BALANCE SHEET FOR SOYBEANS Source: USDA/WASDE and Jim Hilker. ( ) Est. Proj (Million Acres) Acres Planted Acres Harvested Yield/Bushels (Million Bushels) Beginning Stocks Production Imports Total Supply Use: Crushings Exports Seed Residual Total Use Ending Stocks Ending Stocks, %of Use U.S. Loan Rate $5.00 $5.00 $5.00 $5.00 $5.00 $5.00 $5.00 $5.00 $5.00 $5.00 $5.00 $5.00 $5.00 U.S. Season Ave Farm Price, $/Bu. $5.53 $7.34 $5.74 $5.66 $6.43 $10.10 $9.97 $9.59 $11.30 $12.50 $14.40 $13.00 $10.35
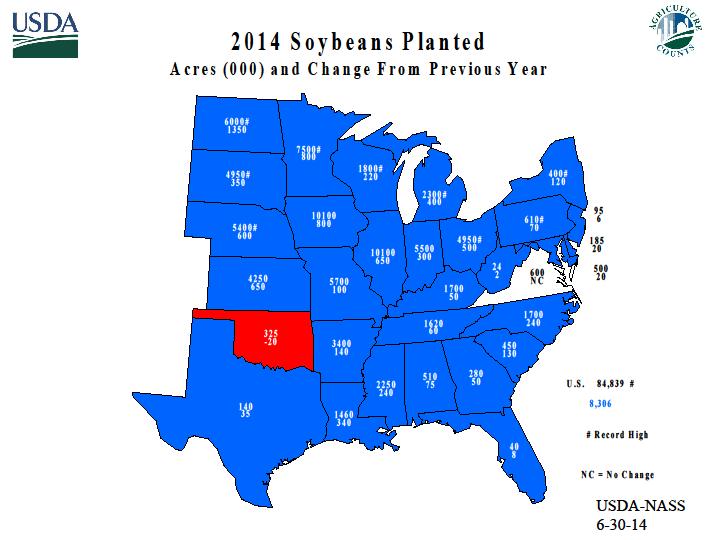
7 August 2014 Crop Production Crop Unit August 2014 % Change from Previous Forecast % Change from Previous Season Soybeans Planted Mil Ac 84.8 NC Harvested Mil Ac 84.1 NC Yield Bu/Ac Production Bil Bu USDA-NASS
8
9
10 Bushels/Acre U.S. Soybean Yield USDA-NASS
11 S o y b e a n Y ie ld s, A u g u s t 1, B u s h e ls a n d C h a n g e F r o m P r e v io u s Y e a r NC # # 5 51 NC 36 NC NC # NC # NC # # 2 48# U.S # 2.1 # R e c o r d H ig h N C = N o C h a n g e USDA-NASS
12


13 U.S. Soybean Production Billion bushels USDA-NASS
14 Soybean Weekly Crop Progress Soybeans Blooming - Selected States [These 18 States planted 95% of the 2013 soybean acreage] : Week ending : : : State : August 10, : August 3, : August 10, : : 2013 : 2014 : 2014 : Average : percent : Arkansas...: Illinois...: Indiana...: Iowa...: Kansas...: Kentucky...: Louisiana...: Michigan...: Minnesota...: Mississippi...: Missouri...: Nebraska...: North Carolina.: North Dakota...: Ohio...: South Dakota...: Tennessee...: Wisconsin...: : 18 States...:
15 Soybean Weekly Crop Progress Soybeans Setting Pods - Selected States [These 18 States planted 95% of the 2013 soybean acreage] : Week ending : : : State : August 10, : August 3, : August 10, : : 2013 : 2014 : 2014 : Average : percent : Arkansas...: Illinois...: Indiana...: Iowa...: Kansas...: Kentucky...: Louisiana...: Michigan...: Minnesota...: Mississippi...: Missouri...: Nebraska...: North Carolina.: North Dakota...: Ohio...: South Dakota...: Tennessee...: Wisconsin...: : 18 States...:
16 Soybean Weekly Crop Condition Soybean Condition - Selected States: Week Ending August 10, 2014 [National crop conditions for selected States are weighted based on 2013 planted acreage] State : Very poor : Poor : Fair : Good : Excellent : percent : Arkansas...: Illinois...: Indiana...: Iowa...: Kansas...: Kentucky...: Louisiana...: Michigan...: Minnesota...: Mississippi...: Missouri...: Nebraska...: North Carolina.: North Dakota...: Ohio...: South Dakota...: Tennessee...: Wisconsin...: : 18 States...: : Previous week..: Previous year..:
17
18
19
20 SUPPLY/DEMAND BALANCE SHEET FOR SOYBEANS Source: USDA/WASDE and Jim Hilker. ( ) Est. Proj (Million Acres) Acres Planted Acres Harvested Yield/Bushels (Million Bushels) Beginning Stocks Production Imports Total Supply Use: Crushings Exports Seed Residual Total Use Ending Stocks Ending Stocks, %of Use U.S. Loan Rate $5.00 $5.00 $5.00 $5.00 $5.00 $5.00 $5.00 $5.00 $5.00 $5.00 $5.00 $5.00 $5.00 U.S. Season Ave Farm Price, $/Bu. $5.53 $7.34 $5.74 $5.66 $6.43 $10.10 $9.97 $9.59 $11.30 $12.50 $14.40 $13.00 $10.35
21 WASDE August 2014 U.S. Soybeans and Products Supply and Use (Domestic Measure) 1/ SOYBEAN OIL 2012/1 2013/14 Est. 2014/15 Proj. Jul 2014/15 Proj. Aug Million Pounds Beginning Stocks Production 4/ Imports Supply, Total Domestic Disappearance Biodiesel 3/ Food, Feed & other Industrial Exports Use, Total Ending stocks Avg. Price (c/lb) 2/
22 WASDE August 2014 U.S. Soybeans and Products Supply and Use (Domestic Measure) 1/ SOYBEAN MEAL 2012/1 2013/14 Est. 2014/15 Proj. Jul 2014/15 Proj. Aug Thousand Short Tons Beginning Stocks Production 4/ Imports Supply, Total Domestic Disappearance Exports Use, Total Ending Stocks Avg. Price ($/s.t.) 2/
23 October 2014 Soybean Meal Futures
24 SUPPLY/DEMAND BALANCE SHEET FOR SOYBEANS Source: USDA/WASDE and Jim Hilker. ( ) Est. Proj (Million Acres) Acres Planted Acres Harvested Yield/Bushels (Million Bushels) Beginning Stocks Production Imports Total Supply Use: Crushings Exports Seed Residual Total Use Ending Stocks Ending Stocks, %of Use U.S. Loan Rate $5.00 $5.00 $5.00 $5.00 $5.00 $5.00 $5.00 $5.00 $5.00 $5.00 $5.00 $5.00 $5.00 U.S. Season Ave Farm Price, $/Bu. $5.53 $7.34 $5.74 $5.66 $6.43 $10.10 $9.97 $9.59 $11.30 $12.50 $14.40 $13.00 $10.35
25
26 World Soybean Production Country or Region 2013/14 estimate 2014/15 forecast Change from July 11 Change from 2013/14 Million Tons Percent Percent World United States Foreign Argentina Brazil Paraguay Ukraine India China August 12, 2014
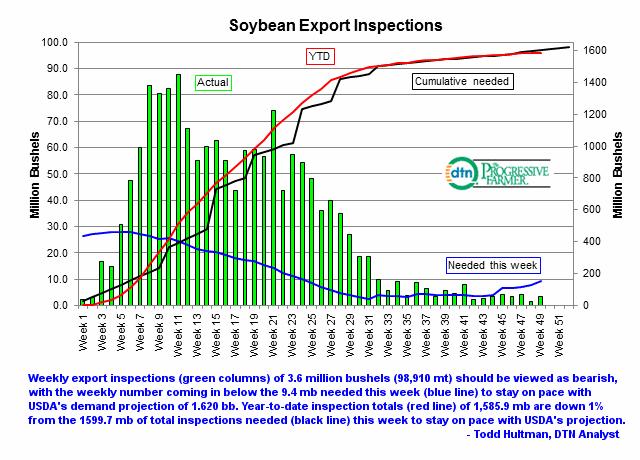
27 GRAINS INSPECTED AND/OR WEIGHED FOR EXPORT REPORTED IN WEEK ENDING AUG 07, METRIC TONS CURRENT PREVIOUS WEEK ENDING MARKET YEAR MARKET YEAR GRAIN 08/07/ /31/ /08/2013 TO DATE TO DATE BARLEY 0 2, ,119 6,985 CORN 905,137 1,140, ,101 43,874,727 16,739,637 FLAXSEED MIXED OATS RYE SORGHUM 318, ,702 88,830 4,633,612 1,703,563 SOYBEANS 98,910 39,256 93,289 43,160,611 35,464,128 SUNFLOWER WHEAT 526, , ,145 4,555,805 6,523,550 Total 1,849,182 1,689,645 1,244,291 96,258,536 60,439,
28
29 U.S. EXPORT SALES FOR WEEK ENDING 7/31/2014 New Crop Weekly Prev Weekly Sales Unshipped Total Year Sales Unshipped --GRAINS-- (in million bushels) Corn , Sorghum Soybeans , , All Wheat Durum Hard Red Spring Hard Red Winter Soft Red Winter White OTHER-- (in thousand metric tons) Soyoil Soymeal , , ,143.4 Rice (in thousand bales) Upland Cotton , , ,
30 Brazil Soybean Supply and Use 2012/ / /15 Est. Proj. Beginning Stocks Production Imports Total Supply Domestic Crush DomesticTotal Exports Total Use Ending Stocks Aug. 2014
31 Aug Argentina Soybean Supply and Use 2012/ / /15 Est. Proj. Beginning Stocks Production Imports Total Supply Domestic Crush DomesticTotal Exports Total Use Ending Stocks
32 World Soybean Meal Supply and Use 1/ (Million Metric Tons) 2012/13 Beginning Stocks Production Imports Domestic Total Exports Ending Stocks World 2/ United States Total Foreign Major Exporters 3/ Argentina Brazil India Major Importers 4/ European Union Southeast Asia 5/ /14 Est. Begi nni ng St ocks Pr oduct i on I m por t s Dom est i c Tot al Expor t s Endi ng St ocks World 2/ United States Total Foreign Major Exporters 3/ Argentina Brazil India Major Importers 4/ European Union Southeast Asia 5/
33 World Soybean Oil Supply and Use 1/ (Million Metric Tons) 2012/13 Beginning Stocks Production Imports Domestic Total Exports Ending Stocks World 2/ United States Total Foreign Major Exporters 3/ Argentina Brazil European Union Major Importers 4/ China India North Africa 5/ /14 Est. Begi nni ng St ocks Pr oduct i on I m por t s Dom est i c Tot al Expor t s Endi ng St ocks World 2/ United States Total Foreign Major Exporters 3/ Argentina Brazil European Union Major Importers 4/ China India North Africa 5/
34 China Soybean Supply and Use 2012/ / /15 Est. Proj. Beginning Stocks Production Imports Total Supply Domestic Crush DomesticTotal Exports Total Use Ending Stocks Aug. 2014
35 U.S. Soybean Supply and Use 2012/ / /15 Est. Proj. Beginning Stocks Production Imports Total Supply Domestic Crush DomesticTotal Exports Total Use Ending Stocks
36 World Soybean Supply and Use 2012/ / /15 Est. Proj. Beginning Stocks Production Imports Total Supply Domestic Crush DomesticTotal Exports Total Use Ending Stocks Aug. 2014
37 SUPPLY/DEMAND BALANCE SHEET FOR SOYBEANS Source: USDA/WASDE and Jim Hilker. ( ) Est. Proj (Million Acres) Acres Planted Acres Harvested Yield/Bushels (Million Bushels) Beginning Stocks Production Imports Total Supply Use: Crushings Exports Seed Residual Total Use Ending Stocks Ending Stocks, %of Use U.S. Loan Rate $5.00 $5.00 $5.00 $5.00 $5.00 $5.00 $5.00 $5.00 $5.00 $5.00 $5.00 $5.00 $5.00 U.S. Season Ave Farm Price, $/Bu. $5.53 $7.34 $5.74 $5.66 $6.43 $10.10 $9.97 $9.59 $11.30 $12.50 $14.40 $13.00 $10.35
38
39
40
41
42
43
44
45 SUPPLY/DEMAND BALANCE SHEET FOR SOYBEANS Source: USDA/WASDE and Jim Hilker. ( ) Est. Proj (Million Acres) Acres Planted Acres Harvested Yield/Bushels (Million Bushels) Beginning Stocks Production Imports Total Supply Use: Crushings Exports Seed Residual Total Use Ending Stocks Ending Stocks, %of Use U.S. Loan Rate $5.00 $5.00 $5.00 $5.00 $5.00 $5.00 $5.00 $5.00 $5.00 $5.00 $5.00 $5.00 $5.00 U.S. Season Ave Farm Price, $/Bu. $5.53 $7.34 $5.74 $5.66 $6.43 $10.10 $9.97 $9.59 $11.30 $12.50 $14.40 $13.00 $10.35
46 Soybean Futures 8/12/14 S - SOYBEANS - CBOT Month Last Change Open High Low Close Time More Aug '0 3'0 1290'0 1293'0 1290'0 1290'0 07:27P Sep '6 1'4 1094'0 1098'4 1093'4 1094'2 07:27P Nov '4 0'0 1058'0 1062'6 1058'0 1059'4 07:27P Jan '4 0'2 1067'0 1071'0 1067'0 1068'2 07:27P Mar '4 1'4 1080'0 1080'0 1078'4 1077'0 07:27P May '0 0'0 1084'0 1084'0 1084'0 1084'0 07:27P Jul '2-1'0 1089'0 1089'0 1088'2 1089'2 07:27P Aug '6-11'4 1100'0 1100'0 1079'6 1086'4s 07:26P Sep '0-12'0 1070'2s 07:26P Nov '6-1'0 1061'6 1065'0 1061'6 1062'6 07:27P Jan '6-11'2 1075'6 1076'0 1060'0 1067'2s 07:26P
47 Soybean Futures - SOYBEANS - CBOT Month Last Change Open High Low Close T Aug '2-25'4 1290'0 1293'0 1245'0 1264'4s 05 Sep '0-1'4 1080'0 1083'4 1071'2 1079'4 05 Nov '6-3'0 1046'6 1049'4 1038'6 1046'6 05 Jan '2-3'2 1056'0 1058'0 1048'0 1055'4 05 Mar '4-4'4 1065'2 1066'0 1056'6 1064'0 05 May '0-5'4 1072'4 1073'2 1064'0 1071'4 05 Jul '2-3'4 1078'0 1078'6 1069'6 1076'6 05 Aug '2 1073'6 Sep '2 1060'2 Nov '4-1'4 1050'0 1052'0 1047'0 1051'0 05
48 Aug 2014 Soybean Futures
49 Nov 2014 Soybean Futures
50 Nov 2014 Soybean Futures 8/14/14
51 July 2015 Soybean Futures 8/14/14
52 2015 and Beyond Fight for acres Nov 15 Soybeans/Dec 15 Corn ¾ / 4.09 ¾ = 2.56 Continued Volatility Weather, U.S. and World U.S. and World Economy Value of the Dollar U.S. and World Trade Policy Geopolitical Food Versus Fuel Couple very short world soybean crop A very large soybean crop
53 Pricing Considerations What should Sellers Do? Can we predict the basis?
54
55
56 Pricing Considerations What should Buyers Do? Buying opportunity? Soymeal Corn DDG s Other
57 Thanks Questions/Discussion Jim Hilker s Web Page

58 MSU is an affirmativeaction, equal-opportunity employer. Michigan State University Extension programs and materials are open to all without regard to race, color, national origin, gender, gender identity, religion, age, height, weight, disability, political beliefs, sexual orientation, marital status, family status or veteran status.
Crop Market Outlook 8/22/2017
 MSU is an affirmativeaction, equal-opportunity employer. Michigan State University Extension programs and materials are open to all without regard to race, color, national origin, gender, gender identity,
Market Outlook. David Reinbott.
 Market Outlook David Reinbott Agriculture Business Specialist P.O. Box 187 Benton, MO 63736 (573) 545-3516 http://extension.missouri.edu/scott/agriculture.aspx reinbottd@missouri.edu Trending Issues Volatile
World Wheat Supply and Demand Situation August 2018
 World Wheat Supply and Demand Situation August 218 Major data source: USDA World Agricultural Supply and Demand Estimates released August 1, 218. Projections will change over the course of the year depending
Rice Outlook Slide Show U.S. and World August 10, 2017
 Rice Outlook Slide Show U.S. and World August 10, 2017 Bobby Coats, Ph.D. Professor Economics Department of Agricultural Economics and Agribusiness Division of Agriculture Cooperative Extension Service
Wheat Marketing Situation
 Wheat Marketing Situation Prepared by: Darrell L. Hanavan Executive Director Colorado Wheat Administrative Committee If you would like to receive an email when this report is updated, email gmostek@coloradowheat.org
World Wheat Supply and Demand Situation March 2018
 World Wheat Supply and Demand Situation March 218 Major data source: USDA World Agricultural Supply and Demand Estimates released March 8, 218. Projections will change over the course of the year depending
World Wheat Supply and Demand Situation
 World Wheat Supply and Demand Situation September 218 Major data source: USDA World Agricultural Supply and Demand Estimates released September 12, 218. Projections will change over the course of the year
World Wheat Supply and Demand Situation December 2018
 World Wheat Supply and Demand Situation December 218 Major data source: USDA World Agricultural Supply and Demand Estimates released December 11, 218. Projections will change over the course of the year
Fats and Oils: Oilseed Crushings, Production, Consumption and Stocks
 ISSN: 2379-9862 Fats and Oils: Oilseed Crushings, Production, and Released November 1, 2018, by the National Agricultural Statistics Service (NASS), Agricultural Statistics Board, United States Department
Fats and Oils: Oilseed Crushings, Production, Consumption and Stocks
 ISSN: 2379-9862 Fats and Oils: Oilseed Crushings, Production, and Released October 1, 2018, by the National Agricultural Statistics Service (NASS), Agricultural Statistics Board, United States Department
World Wheat Supply and Demand Situation October 2018
 World Wheat Supply and Demand Situation October 218 Major data source: USDA World Agricultural Supply and Demand Estimates released October 12, 218. Projections will change over the course of the year
World Wheat Supply and Demand Situation
 World Wheat Supply and Demand Situation November 218 Major data source: USDA World Agricultural Supply and Demand Estimates released November, 218. Projections will change over the course of the year depending
Weak Real to Boost Brazil s Soybean Exports in 2016
 United States Department of Agriculture Foreign Agricultural Service October 2015 Weak Real to Boost Brazil s Soybean Exports in 2016 Brazil s exchange rate is having a significant impact on domestic and
Fats and Oils: Oilseed Crushings, Production, Consumption and Stocks
 ISSN: 2379-9862 Fats and Oils: Oilseed Crushings, Production, and Released August 1, 2017, by the National Agricultural Statistics Service (NASS), Agricultural Statistics Board, United States Department
2017/18 Cotton Outlook
 217/1 Cotton Outlook 217 Ag Econ In service Training Dr. S. Aaron Smith, Assistant Professor, Department of Agricultural and Resource Economics, University of Tennessee https://ag.tennessee.edu/arec/pages/cropeconomics.aspx
Fundamentals Driving U.S. Agricultural Prosperity
 Fundamentals Driving U.S. Agricultural Prosperity Chris Hurt Purdue Extension Service March 2013, hurtc@purdue.edu Economic Shock Transition to New-Equilibrium 250 Hypothetical 29 Year Cycle: Index Base
Early-Season U.S. Soybean Meal Sales Surge
 United States Department of Agriculture Foreign Agricultural Service November 2014 Early-Season U.S. Soybean Meal Sales Surge U.S. soybean meal export commitments (accumulated exports plus outstanding
Soybean Trade Growth: A Story of Brazil, the United States, and China
 United States Department of Agriculture Foreign Agricultural Service October 2017 Soybean Trade Growth: A Story of Brazil, the United States, and China 12-Month Soybean Export Growth Year Ending September
The Outlook for Biofuels
 PRX BlueSky Outlook, Page 1 The Fertilizer Institute Fertilizer Outlook and Technology Conference The Outlook for Biofuels November 6, 2007 Ross Korves Economic Policy Analyst The ProExporter Network ross.korves@proexporter.com
Fats and Oils: Oilseed Crushings, Production, Consumption and Stocks
 ISSN: 2379-9862 Fats and Oils: Oilseed Crushings, Production, and Released September 1, 2017, by the National Agricultural Statistics Service (NASS), Agricultural Statistics Board, United States Department
2016/17 Global Olive Oil Production Down But Prices Stabilize
 United States Department of Agriculture Foreign Agricultural Service November 2016 Global Olive Oil Down But Prices Stabilize Global Olive Oil and Stocks 4000 3500 5000 Extra Virgin Olive Oil Prices Stabilizing
Week Ending: Oct. 25, 2018
 Week Ending: Oct. 25, 2018 Market Page 1. Thurs. Close Last Thurs. Close Weekly Change Week's High Week's Low Life of Contract High Life of Contract Low NEW YORK COTTON FUTURES (Cents/Lb.) December-18
Pakistan Oilseed Processors Seize Opportunity to Crush Soybeans
 United States Department of Agriculture Foreign Agricultural Service December 2015 Pakistan Oilseed Processors Seize Opportunity to Crush Soybeans Pakistan, long an importer of soybean meal, is transitioning
Indian Soybean Meal Exports Unlikely to Recover in 2015/16
 United States Department of Agriculture Foreign Agricultural Service November 2015 Indian Soybean Meal Exports Unlikely to Recover in Though once a significant regional exporter of soybean meal, India
Soybean and Oilseed Meal Import Prospects Higher as Severe Weather Damages EU Crops
 Million Tons Million Tons Million Tons United States Department of Agriculture Foreign Agricultural Service August 2018 Soybean and Oilseed Meal Import Prospects Higher as Severe Weather Damages EU Crops
U.S. Soybean Exports Forecast to Reach Record
 United States Department of Agriculture Foreign Agricultural Service July 2017 U.S. Soybean Exports Forecast to Reach Record 60 Accumulated Exports by Week Total Commitments of Soybeans as of End of June
China s Rapeseed Meal Imports Rise as Seed Imports Decline
 United States Department of Agriculture Foreign Agricultural Service February 2017 China s Rapeseed Meal Rise as Seed Decline Trend in China Rapeseed 12-Month Moving Totals Trend In China Rapeseed Meal
Economic and Commodity Market Outlook
 Economic and Commodity Market Outlook August 12, 2016 By Robert Coats, Ph.D. Professor Economics Department of Agricultural Economics and Agribusiness Division of Agriculture University of Arkansas System
Corn & Bean Producers-1
 Largest Corn Producing Countries - 2016 est. Largest Corn Importing Countries - 2016 est. (Marketing year - thousands of hectares, tons per hectare, and thousands of metric tons) (Marketing year - thousands
Coconut Oil Prices Spike
 United States Department of Agriculture Foreign Agricultural Service Coconut Oil Prices Spike Coconut oil prices have surged over the past year in contrast to the general downward trend in other vegetable
Advance Trading, Inc. Supply/Demand Summary
 Advance Trading, Inc. Supply/Demand Summary Corn Planted Acres 88.0 94.0 90.2 90.2 0.0 88.0 88.0 0.0 % Harvested 91.8% 92.2% 91.7% 91.7% 91.7% 91.7% Harvested Acres 80.8 86.7 82.7 82.7 0.0 80.7 80.7 0.0
CHARTS AND PRICE PROJECTIONS
 CHARTS AND PRICE PROJECTIONS 18 / Charts and Price Projections: FAPRI 27 Agricultural Outlook Average Annual GDP Growth Percent Change 9 8 7 6 4 3 2 1 26-216 Canada China EU NMS EU- India Japan Latin America
CHARTS AND PRICE PROJECTIONS
 CHARTS AND PRICE PROJECTIONS 18 / Charts and Price Projections: FAPRI 28 Agricultural Outlook Average Annual GDP Growth, 27-217 Percent Change 1 8 8.4 7.92 6 4 4.44 3.67 4.6 4.34 2 2.37 2.17 1.38 2.44
What Does the March Prospective Plantings Report Mean for the Outlook? Chris Hurt & Corinne Alexander
 What Does the March Prospective Plantings Report Mean for the 2014-2015 Outlook? Chris Hurt & Corinne Alexander hurtc@purdue.edu cealexan@purdue.edu Purdue University April 1, 2014" Webinar: April 1, 2014
China Soybean Imports Stagnant Despite Record Consumption as Production Rebounds
 United States Department of Agriculture Foreign Agricultural Service Circular Series FOP 9-08 tember 2008 China Soybean Stagnant Despite Record Consumption as Rebounds Million Tons 60 50 40 30 20 10 0
Fats and Oils: Oilseed Crushings, Production, Consumption and Stocks
 ISSN: 23799862 Fats and Oils: Oilseed Crushings, Production, and Released February 1, 2018, by the National Agricultural Statistics Service (NASS), Agricultural Statistics Board, United States Department
Growing Soybean Oil Price Raises Oil s Contribution to Total Soybean Value
 United States Department of Agriculture Foreign Agricultural Service Circular Series FOP 10-07 October 2007 Growing Soybean Oil Price Raises Oil s Contribution to Total Soybean Value Relative Share Value:
Preliminary Assessment of the Drought s Impacts on Crop Prices and Biofuel Production
 CARD Policy Brief 12-PB 7 July 2012 Preliminary Assessment of the Drought s Impacts on Crop Prices and Biofuel Production by Bruce Babcock Partial support for this work is based upon work supported by
Oil Crops Outlook. Mark Ash Soybean Oil Exports Maintain Strong Pace
 Oil Crops Outlook OCS-11c Mar 11, 2011 Mark Ash mash@ers.usda.gov Soybean Oil Exports Maintain Strong Pace Contents Domestic Outlook Intl. Outlook Contacts & Links Tables Soybean S&D Soybean Meal Soybean
External Market Factors Impacting US Soybean Meal
 External Market Factors Impacting US Soybean Meal USSEC Luncheon International Production and Processing Expo January 3, 213 Atlanta, GA Paul Smolen Presentation Objectives Examine the economic drivers
Share of Brazil s Soybean Exports to China Spikes in August
 United States Department of Agriculture Foreign Agricultural Service September 2018 Share of Brazil s Soybean Exports to China Spikes in August Monthly Share of Brazil's Soybean Exports to China 85% 75%
Week Ending: Dec. 8, 2016
 Week Ending: Dec. 8, 2016 Market Page 1. Thurs. Close Last Thurs. Close Weekly Change Week's High Week's Low Life of Contract High Life of Contract Low NEW YORK COTTON FUTURES (Cents/Lb.) March-17 71.42
Palm and Soy Oil Use Expands at Expense of Other Oils
 United States Department of Agriculture Foreign Agricultural Service September 2015 Revised on September 15, 2015 Palm and Soy Oil Use Expands at Expense of Other Oils As global demand for vegetable oil
Drought in South America to Limit Soybean Exports
 United States Department of Agriculture Foreign Agricultural Service Circular Series FOP 2-09 ruary 2009 Drought in South America to Limit Soybean Exports Million Tons 16 14 12 10 8 6 4 2 Annual Change
2017 Risk and Profit Conference Breakout Session Presenters. 13. Ethanol and Biodiesel Market and Profitability Prospects
 2017 Risk and Profit Conference Breakout Session Presenters 13. Ethanol and Biodiesel Market and Profitability Prospects Dan O Brien Daniel O Brien was raised on a grain and livestock
Sharp Decline in Vegetable Oil Stocks Leads to Steeply Higher Prices
 United States Department of Agriculture Foreign Agricultural Service Circular Series FOP 1-11 Sharp Decline in Vegetable Oil Leads to Steeply Higher Prices Commodity prices have been on an upward trend
U.S. Soybean Prices Fall as Buyers Focus Turns to South America
 United States Department of Agriculture Foreign Agricultural Service Circular Series FOP 2-10 ruary 2010 U.S. Soybean Prices Fall as Buyers Focus Turns to South America $11.00 Daily U.S. Soybean Cash Price
2019 Grain Update December 4, 2018
 2019 Grain Update December 4, 2018 Orange Juice (Jan '19) Live Cattle (Dec '18) S&P 500 E-Mini (Dec '18) Dow Indu 30 E-Mini (Dec '18) Cotton #2 (Dec '18) U.S. Dollar Index (Dec '18) Wheat (Dec '18) Nasdaq
Devaluation Energizes Argentine Soybean Crush
 United States Department of Agriculture Foreign Agricultural Service March 2016 Devaluation Energizes Argentine Soybean Crush Argentina Quarterly Soybean Crush Volume Exchange Rate* and Constant Dollar
Argentine Exporters Switch to Soybean Oil as Biodiesel Exports Fall
 United States Department of Agriculture Foreign Agricultural Service Circular Series FOP 08-13 Argentine Exporters Switch to Soybean Oil as Biodiesel Exports Fall Argentina s soybean oil exports have surged
Rising Coconut Oil Prices Foreshadow Tight Supplies in 2007
 United States Department of Agriculture Foreign Agricultural Service Circular Series FOP 2-07 ruary 2007 Rising Coconut Oil Prices Foreshadow Tight Supplies in 2007 800 Coconut Oil Price: CIF Rotterdam
Soybean Oil Prices Diverge on Different Supply Situations
 United States Department of Agriculture Foreign Agricultural Service Circular Series FOP 10-09 October 2009 Soybean Oil Prices Diverge on Different Supply Situations Soybean Oil Price ($/ton) $900 $850
Oil Crops Outlook Economic Research Service October 12, 2012 U.S. Department of Agriculture
 Oil Crops Outlook Economic Research Service October 12, 2012 U.S. Department of Agriculture OCS-12j text Approved by the World Agricultural Outlook Board Advancing Soybean Harvest Eases Near-term Prices
Strong Global Grain Production Isn t Good Enough. David Hightower The Hightower Report
 Strong Global Grain Production Isn t Good Enough David Hightower The Hightower Report Big Picture Factors Cost of Production Pricing Not a downtrend signal Goldman $20 oil Forecast was wrong 8.9 mbd!
Biofuels: Implications for Prices and Production. Darrel L. Good and Scott H. Irwin
 Biofuels: Implications for Prices and Production Darrel L. Good and Scott H. Irwin Why Ethanol? Convert relatively abundant domestic sources of energy into a substitute for imported petroleum Energy Conversion
Drought Forecast to Reduce Australian Rapeseed Exports in 2007
 United States Department of Agriculture Foreign Agricultural Service Circular Series FOP 11-06 November 2006 Drought Forecast to Reduce Australian Rapeseed Exports in 2007 1800 1600 1400 1200 1000 800
Soybean Prices Fall on Rising South American Production
 United States Department of Agriculture Foreign Agricultural Service April 2017 Soybean Prices Fall on Rising South American Production Million Tons Change in South America Soybean Production Forecast
China s Global Peanut Export Share Declines
 United States Department of Agriculture Foreign Agricultural Service Circular Series FOP 07-13 China s Global Peanut Export Share Declines U.S. 10% Others 19% Argentina 17% U.S. 11% Others 16% Argentina
Rice Outlook U.S. and World February 9, 2017
 Rice Outlook U.S. and World February 9, 217 Bobby Coats, Ph.D. Professor Economics Department of Agricultural Economics and Agribusiness Division of Agriculture University of Arkansas System 51.671.21
2011 Indiana Agricultural Outlook
 2011 Indiana Agricultural Outlook Corinne Alexander & Chris Hurt hurtc@purdue.edu September 13, 2010 World Economic Growth Ethanol Dollar Value Surprises and Uncertainty! Change Wheat Production 2010 vs.
US biofuel Indicators and a changing market dynamic
 US biofuel Indicators and a changing market dynamic Seth Meyer AMIS October 1-2, 13, Rome Movement of Ag and Energy Ethanol production and capacity 16 35 Crude oil and maize prices 14 3 billion gallons
China 2017/18 Soybean Imports Soar on Appetite for Pork, Aquaculture, and Dairy
 United States Department of Agriculture Foreign Agricultural Service June 2017 China Soybean Soar on Appetite for Pork, Aquaculture, and Dairy China: Booming Farmed Aquaculture Production China: Record
Strong Brazilian Soybean Sales Expected to Slow Rebound in Argentine Exports
 United States Department of Agriculture Foreign Agricultural Service December 2018 Strong Brazilian Soybean Sales Expected to Slow Rebound in Argentine Exports Oct. 1 - Nov. 30 Brazil Soybean Exports (Million
Algeria. Grain and Feed Update. Wheat update
 THIS REPORT CONTAINS ASSESSMENTS OF COMMODITY AND TRADE ISSUES MADE BY USDA STAFF AND NOT NECESSARILY STATEMENTS OF OFFICIAL U.S. GOVERNMENT POLICY Required Report - public distribution Grain and Feed
India Soybean Meal Exports: Revised and Rebounding
 United States Department of Agriculture Foreign Agricultural Service January 2017 India Soybean Meal Exports: Revised and Rebounding India Soybean Meal Exports Forecast to Rise in 8.0 Data Series Comparison
Market situation Cereals Oilseeds Protein crops
 Market situation Cereals Oilseeds Protein crops DG AGRI C 4 Civil Dialogue Group on Animal Products Pig Meat 13 April 2016 Exchange rates & crude oil 2 Euro US Dollar exchange rate 1.40 1.15 From the last
USDA Projections of Bioenergy-Related Corn and Soyoil Use for
 USDA Projections of Bioenergy-Related Corn and Soyoil Use for 2010-2019 Daniel M. O Brien, Extension Agricultural Economist K-State Research and Extension The United States Department of Agriculture released
Brazil s Soybean Oil Exports Squeezed by Rising Biodiesel Demand
 United States Department of Agriculture Foreign Agricultural Service Circular Series FOP 6-09 e 2009 Brazil s Soybean Oil Exports Squeezed by Rising Biodiesel Demand Soybean Oil Exports and Industrial
TRAFFIC VOLUME TRENDS July 2002
 TRAFFIC VOLUME TRENDS July 2002 Travel on all roads and streets changed by +2.3 percent for July 2002 as compared to July 2001. Estimated Vehicle-Miles of Travel by Region - July 2002 - (in Billions) West
Growing Fuel Use Limits Exports of Soybean Oil by South America
 United States Department of Agriculture Foreign Agricultural Service Circular Series FOP 11-09 ember 2009 Growing Fuel Use Limits of Soybean Oil by South America 2006/07 Soybean Oil Distribution Soybean
History gives hope for wheat rally Be sure to reward $2 rally. By Bryce Knorr, Senior Grain Market Analyst
 History gives hope for wheat rally Be sure to reward $2 rally By Bryce Knorr, Senior Grain Market Analyst For years the wheat market stagnated waiting for a single trigger: A sharp reduction in global
As China s Soybean Oil Imports Fall, Production Expands
 United States Department of Agriculture Foreign Agricultural Service Circular Series FOP 10-10 October 2010 As China s Soybean Oil Fall, Expands 12 10 Million Metric Tons 8 6 4 2 0 2006/07 2007/08 China
Record U.S. Peanut Exports on Strong Shipments to China and Vietnam
 United States Department of Agriculture Foreign Agricultural Service September 2016 Record U.S. Peanut Exports on Strong Shipments to China and Vietnam Thousand Metric Tons 800 700 600 500 400 300 200
China is Key to Slow Pace of U.S. Soybean Exports
 United States Department of Agriculture Foreign Agricultural Service January 2018 China is Key to Slow Pace of U.S. Soybean Exports U.S. and Brazil Soybean Exports by Destination (Accumulated Exports:
Regional Vegetable Oil Situation: Cut in Sun Oil Production, Imports Leaves North Africa & the Middle East Looking for Soy & Palm Oil to Fill Demand
 United States Department of Agriculture Foreign Agricultural Service Circular Series FOP 09-07 tember 2007 Regional Vegetable Oil Situation: Cut in Sun Oil, Leaves North Africa & the Middle East Looking
TRAFFIC VOLUME TRENDS
 Page 1 U. S. Department Transportation Federal Highway Administration Office Highway Policy Information TRAFFIC VOLUME TRENDS September Travel on all roads and streets changed by +2.5 (5.8 billion vehicle
U.S. Soybeans Facing Stiff Competition from Brazil. Brazil Soybean Export Price (Dollars and Reals) and Exchange Rate
 and Exchange Rate") United States Department of Agriculture Foreign Agricultural Service June, 2018 U.S. Soybeans Facing Stiff Competition from Brazil Brazil Soybean Export Price (Dollars and Reals) and Exchange Rate FOB
United States Department of Agriculture Foreign Agricultural Service June, 2018 U.S. Soybeans Facing Stiff Competition from Brazil Brazil Soybean Export Price (Dollars and Reals) and Exchange Rate FOB
China Tariffs Driving U.S. Soybean Exports To the European Union to a 30-Year High
 United States Department of Agriculture Foreign Agricultural Service March 2019 China Tariffs Driving U.S. Soybean Exports To the European Union to a 30-Year High 12-MONTH MOVING TOTAL U.S. SOYBEAN EXPORTS
Monthly Biodiesel Production Report
 Monthly Biodiesel Production Report With data for June 2017 August 2017 Independent Statistics & Analysis www.eia.gov U.S. Department of Energy Washington, DC 20585 This report was prepared by the U.S.
Oil Crops Outlook. Mark Ash Abundant U.S. Soybean Supplies Propel 2013/14 Exports
 Economic Research Service Situation and Outlook Report OCS-13l Release Date December 12, 2013 Oil Crops Outlook Mark Ash mash@ers.usda.gov Abundant U.S. Soybean Supplies Propel 2013/14 Exports Oil Crops
Mid-term Outlook for World Agricultural Markets
 Mid-term Outlook for World Agricultural Markets Jacinto Fabiosa Co-Director, (515) 294-6183 jfabiosa@iastate.edu Food and Agricultural Policy Research Institute The Question of Interest? In 27 we asked,
Quarterly Hogs and Pigs
 Quarterly Hogs and Pigs ISSN: 949-92 Released September 27, 208, by the National Agricultural Statistics Service (NASS), Agricultural Statistics Board, United s Department of Agriculture (USDA). United
2017/18 Olive Oil Export Forecast Rises with Slight Growth in Production
 United States Department of Agriculture Foreign Agricultural Service November 2017 Olive Oil Export Forecast Rises with Slight Growth in Production Million Metric Tons 3.4 3.2 3.0 2.8 2.6 Olive Oil Prices
2017 SC Producers Whole Farm Revenue Protection Expected Price Justification
 2017 SC Producers Whole Farm Revenue Protection Expected Price Justification RMA Projected Expected As of Average Futures Price Close As of RMA Projected Prices 4 Feb 2011 2015 % Differ 4 Feb Crop Contract
"Double Colored Man Tou" steamed buns, photo by Roy Chung Soft Red Winter Wheat Quality Survey
 "Double Colored Man Tou" steamed buns, photo by Roy Chung 2014 Soft Red Winter Wheat Quality Survey Survey Overview Hard Red Winter Hard Red Spring Soft White Hard White U.S. Wheat Class Production Areas
2018 Outlook for Grains and Oilseeds
 2018 Outlook for Grains and Oilseeds Present to the American Fats and Oils Associa;on October 2017 AdvancedEconomicSolu0ons US$ Declines from Peak - Now at lowest point since October 2015 Currently in
Quarterly Hogs and Pigs
 Quarterly Hogs and Pigs ISSN: 19-11 Released September 26, 2014, by the National Agricultural Statistics Service (NASS), Agricultural Statistics Board, United s Department of Agriculture (USDA). United
Explosive Growth in Vegetable Oil Demand Exacerbates Chinese Supply Deficit, Reliance on Imports. Imports
 United States Department of Agriculture Foreign Agricultural Service Circular Series FOP 12-07 ember 2007 Million tons 35 Explosive Growth in Vegetable Oil Demand Exacerbates Chinese Supply Deficit, Reliance
Updated Assessment of the Drought's Impacts on Crop Prices and Biofuel Production
 CARD Policy Briefs CARD Reports and Working Papers 8-2012 Updated Assessment of the Drought's Impacts on Crop Prices and Biofuel Production Bruce A. Babcock Iowa State University, babcock@iastate.edu Follow
India. Oilseeds and Products Update. February 2012
 THIS REPORT CONTAINS ASSESSMENTS OF COMMODITY AND TRADE ISSUES MADE BY STAFF AND NOT NECESSARILY STATEMENTS OF OFFICIAL U.S. GOVERNMENT POLICY Required Report - public distribution India Oilseeds and Products
Achieving Energy Security and Greenhouse. Biomass Crop Assistance Program. Madhu Khanna
 Achieving Energy Security and Greenhouse Gas Reduction Cost-Effectively: The Biomass Crop Assistance Program Madhu Khanna Professor, Agricultural and Environmental Economics University of Illinois, Urbana-Champaign
United States Boosts Share in South Korea s Soybean Oil Market
 United States Department of Agriculture Foreign Agricultural Service February, 2018 United States Boosts Share in South Korea s Soybean Oil Market Thousand Metric Tons 350 300 250 200 150 100 50 50% 45%
THIS REPORT CONTAINS ASSESSMENTS OF COMMODITY AND TRADE ISSUES MADE BY USDA STAFF AND NOT NECESSARILY STATEMENTS OF OFFICIAL U.S.
 THIS REPORT CONTAINS ASSESSMENTS OF COMMODITY AND TRADE ISSUES MADE BY USDA STAFF AND NOT NECESSARILY STATEMENTS OF OFFICIAL U.S. GOVERNMENT POLICY Required Report - public distribution Oilseeds and Products
Lingering Effects of Truckers Strike Impact Planting Plans
 THIS REPORT CONTAINS ASSESSMENTS OF COMMODITY AND TRADE ISSUES MADE BY USDA STAFF AND NOT NECESSARILY STATEMENTS OF OFFICIAL U.S. GOVERNMENT POLICY Required Report - public distribution Brazil Post: Brasilia
Baseline Update for International Livestock Markets
 Baseline Update for International Livestock Markets September 2018 FAPRI-MU Report #04-18 www.fapri.missouri.edu Published by the Food and Agricultural Policy Research Institute (FAPRI) at the University
Market Report. Grain HIGHLIGHTS INTERNATIONAL GRAINS COUNCIL. WORLD ESTIMATES. GMR November 2018
 Grain INTERNATIONAL GRAINS COUNCIL www.igc.int Market Report GMR 494 22 November 2018 HIGHLIGHTS With small adjustments for wheat, maize and sorghum, the forecast for world total grains (wheat and coarse
2007 AAEA Livestock Outlook Symposium
 27 AAEA Livestock Outlook Symposium Ron Plain Professor of Agricultural Economics University of Missouri-Columbia www.ssu.missouri.edu/faculty/rplain Hog Price Outlook Production Efficiency 1 Head 9.5
TOOL #5: C&S WASDE PRICE STUDY FOR DECEMBER CORN 7/09/10 For the July 9 th to the August 12 th time frame for CZ 2010
 TOOL #5: C&S WASDE PRICE STUDY FOR DECEMBER CORN 7/09/10 For the July 9 th to the August 12 th time frame for CZ 2010 Brief summary: In the month ahead, my best estimate is that CZ 2010 could trade in
Bangladesh: A Growing Market for U.S. Soybeans
 United States Department of Agriculture Foreign Agricultural Service December 2017 Bangladesh: A Growing Market for U.S. Soybeans 100% 310 3 Meal Equivalent Share 90% 80% 70% 60% 50% 40% 30% 20% 10% Animal
No sale Farmers continue to hold tight By Bryce Knorr
 No sale Farmers continue to hold tight By Bryce Knorr Basis in the grain cash market didn t firm everywhere during Thanksgiving week, but overall the trend is for strengthening as growers resist selling