2019 Grain Update December 4, 2018
|
|
|
- Logan Peter Newman
- 5 years ago
- Views:
Transcription

1 2019 Grain Update December 4, 2018
2 Orange Juice (Jan '19) Live Cattle (Dec '18) S&P 500 E-Mini (Dec '18) Dow Indu 30 E-Mini (Dec '18) Cotton #2 (Dec '18) U.S. Dollar Index (Dec '18) Wheat (Dec '18) Nasdaq 100 E-Mini (Dec '18) Oats (Dec '18) Natural Gas (Jan '19) 0.00% 10.00% 20.00% 30.00% 40.00% 50.00% 60.00%
3 Bitcoin CME Futures (Dec '18) Lumber (Jan '19) High Grade Copper (Dec '18) Soybean Oil (Dec '18) Ethanol Futures (Dec '18) Crude Oil WTI (Jan '19) Lean Hogs (Dec '18) Soybeans (Jan '19) Gold (Dec '18) Spring Wheat (Dec '18) Canadian Dollar (Dec '18) Corn (Dec '18) Soybean Meal (Dec '18) Canola (Jan '19) Hard Red Wheat (Dec '18) Feeder Cattle (Jan '19) % % % % % % -5.00% 0.00%
4
5
6
7
8
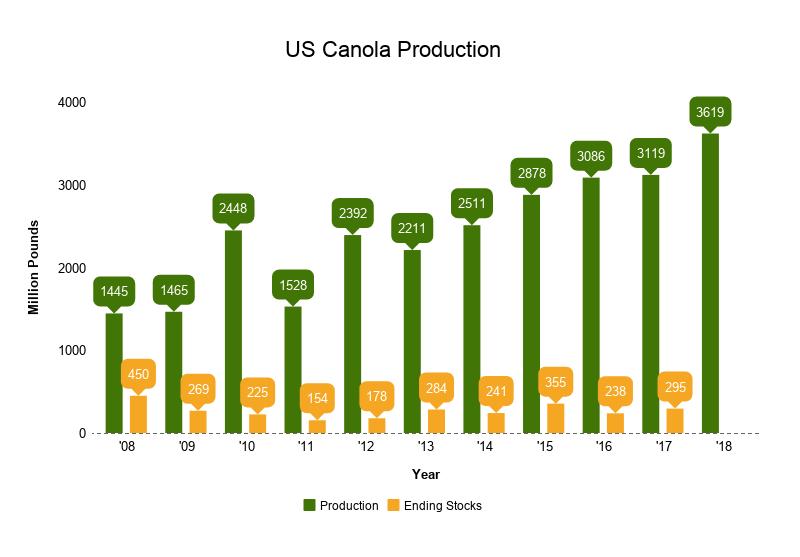
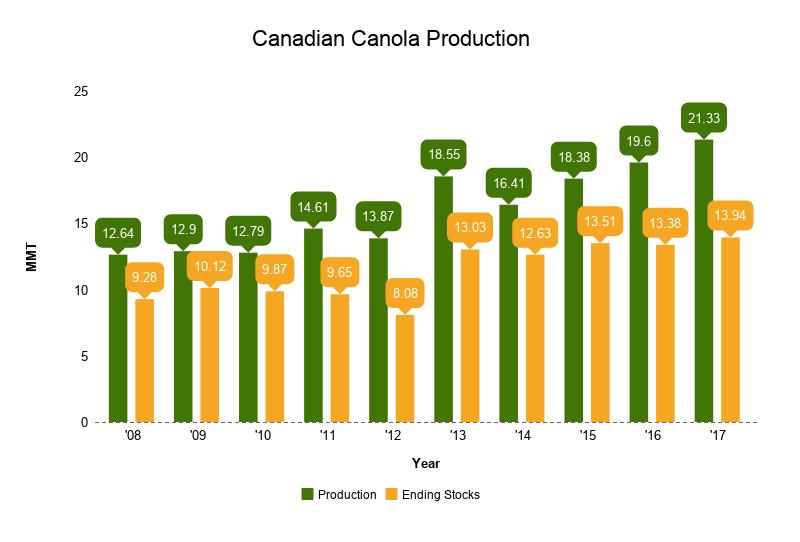
9 CANOLA
10 Canola s Issues Canada's 2018 harvest season did not go well Stats Canada production estimate at 20.8 MMT vs MMT in Sept and 21.3 MMT last year Price drop due to good US crop and soybean tariff issues Acres likely see increase in 2019
11
12
13
14
15
16 Canola Mar 19
17 Canola Nov 19
18 WHEAT
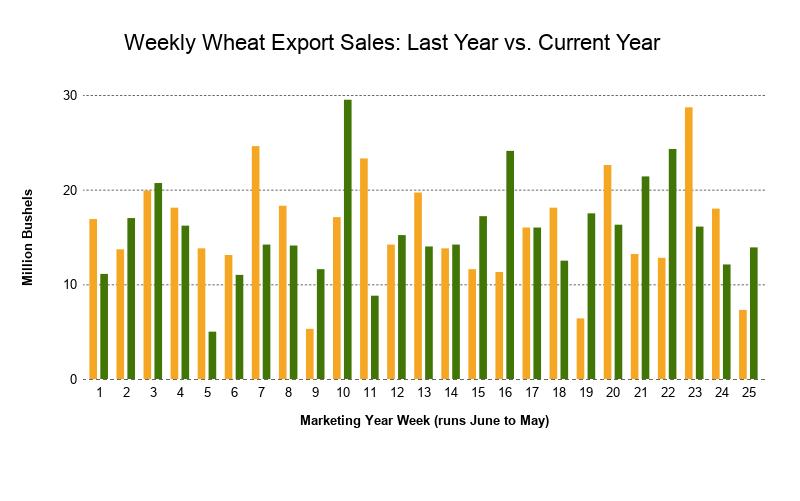
19 Wheat s Issues US Exports disappointing but improving, Black Sea dominating World production issues in all major exporting countries: Argentina getting rain during harvest, Australia dry, EU dry, Canada winter came early with good production poor quality 2019 winter wheat acres expected to increase 10 to 15%, but cold wet fall and delayed harvest likely results in 10% acreage decrease Where are spring wheat acres headed
20 Wheat Category 08/09 09/10 10/11 11/12 12/13 13/14 14/15 15/16 16/17 17/18 18/19 19/20 EST Planted Acres Harvested Acres Yield Per Acre (Bu.) Supply Beginning Stocks ,181 1, Production 2,499 2,218 2,207 1,999 2,252 2,135 2,026 2,062 2,309 1,740 1,884 2,060 Imports Total Supply 2,932 2,993 3,279 2,974 3,118 3,026 2,768 2,927 3,402 3,078 3,123 3,139 Use Food Seed Feed and Residual Exports 1, ,289 1,051 1,012 1, , ,025 1,050 Total Use 2,275 2,018 2,417 2,231 2,400 2,436 2,015 1,951 2,222 1,979 2,174 2,213 Ending Stocks Total Ending Stock ,181 1, Stocks/Use Ratio Average Price
21 Wheat Acres /09 09/10 10/11 11/12 12/13 13/14 14/15 15/16 16/17 17/18 18/19 19/20 Planted Acres Harvested Acres
22
23
24
25 3,000 2,500 2,000 2,499 2,275 2,218 2,207 2,018 2,417 1,999 2,231 2,252 2,400 2,436 2,135 2,026 2,015 2,062 1,951 2,309 2,222 1,979 1,884 2,174 Production Total Use Total Ending Stocks Linear ( Production) 2,060 2,213 1,740 1,500 1,181 1,099 1, /09 09/10 10/11 11/12 12/13 13/14 14/15 15/16 16/17 17/18 18/19 19/20
26 1,415 1,315 1,289 1,215 1,176 1,115 1, , ,051 1,051 1, ,025 1, Food 615 Seed Feed and Residual 515 Exports /09 09/10 10/11 11/12 12/13 13/14 14/15 15/16 16/17 17/18 18/19 19/20
27
28
29
30 National Wheat Price Date
31 World Wheat Production of Major Exporting Countries 11,000 10,000 9,000 8,000 Million Bu 7,000 6,000 5,000 4,000 3,000 Year
32 Major Exporting Countries Ending Stocks/Price 3, , , ,000 5 BB 1,500 4 Price 3 1, Year
33 Major Exporting Countries Days of Supply/Wheat Days of Supply Avg Year Price Date
34 WW Conditions Nov 2017 Nov 2018 Change Kansas 51% 46% -5% Oklahoma 30% 56% 26% Texas 36% 48% 12% Colorado 66% 54% -12% Montana 33% 80% 47% US 56% 55% -1%
35 Wheat s Issues
36 Mpls Mar 19
37 Mpls Sept 19
38 CORN
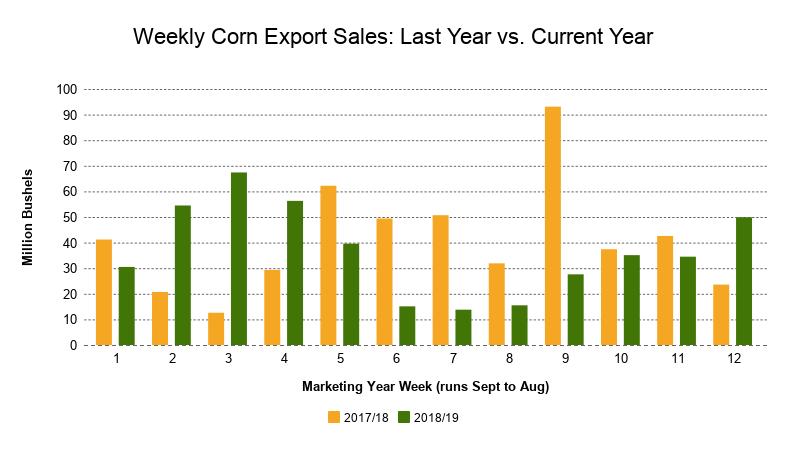
39 Corn s Issues 2018 interesting year, acres decline slightly, tough planting season, fast warm up in most regions but some remain too wet, end result, another potential large production year But harvest has been a fun one: as of Nov 25-6% left to harvest in US, or 5.3 million acres or 950 MB Likely acres will get harvested but yield likely will see decline Look for USDA to lower production in Dec report, demand should remain steady
40 Corn EST Category 08/09 09/10 10/11 11/12 12/13 13/14 14/15 15/16 16/17 17/18 18/19 19/20 Planted Acres Harvested Acres Yield Per Acre (Bu.) Supply Beginning Stocks 1,624 1,673 1,708 1, ,232 1,731 1,737 2,293 2,140 1,736 Production 12,092 13,092 12,447 12,360 10,755 13,829 14,216 13,602 15,148 14,604 14,626 14,930 Imports Total Supply 13,729 14,774 14,182 13,517 11,904 14,686 15,479 15,401 16,942 16,934 16,816 16,716 Use Feed and Residual 5,182 5,125 4,795 4,557 4,315 5,040 5,280 5,114 5,470 5,298 5,500 5,575 Food, Seed, Ind. 1,316 1,370 1,407 1,428 1,397 1,369 1,401 1,424 1,453 1,453 1,480 1,490 Ethanol 3,709 4,591 5,019 5,000 4,641 5,124 5,200 5,224 5,432 5,605 5,650 5,700 Exports 1,849 1,980 1,834 1, ,920 1,867 1,901 2,294 2,438 2,450 2,425 Total Use 12,056 13,066 13,055 12,528 11,083 13,454 13,748 13,664 14,649 14,793 15,080 15,190 Ending Stocks Total Ending Stock 1,673 1,708 1, ,232 1,731 1,737 2,293 2,140 1,736 1,526 Stocks/Use Ratio Average Price
41 Planted Acres Harvested Acres /09 09/10 10/11 11/12 12/13 13/14 14/15 15/16 16/17 17/18 18/19 19/20
42
43
44
45 14,000 12,000 Production Total Use Total Ending Stocks 13,066 13,092 12,092 12,056 13,055 12,447 12,360 12,528 11,083 10,755 13,829 13,454 14,216 13,748 13,664 13,602 15,148 14,649 14,793 15,080 14,930 15,190 14,604 14,626 10,000 8,000 6,000 4,000 2,000 1,673 1,708 1, ,232 1,731 1,737 2,293 2,140 1,736 1, /09 09/10 10/11 11/12 12/13 13/14 14/15 15/16 16/17 17/18 18/19 19/20
46 6,000 5,000 5,182 5,125 4,591 5,019 5,000 4,795 4,557 4,641 5,124 5,040 5,280 5,200 5,224 5,114 5,432 5,470 5,605 5,650 5,700 5,575 5,500 5,298 4,315 4,000 3,000 3,709 Feed and Residual Food, Seed, Ind. Ethanol Exports 2,294 2,438 2,450 2,425 2,000 1,980 1,849 1,920 1,834 1,867 1,901 1,543 1,316 1,370 1,407 1,428 1,397 1,369 1,401 1,424 1,453 1,453 1,480 1,490 1, /09 09/10 10/11 11/12 12/13 13/14 14/15 15/16 16/17 17/18 18/19 19/20
47
48
49
50
51 National Corn Price Price Date
52 US Corn S/U Days Supply Date
53 World Corn S/U Days Supply Date
54 Corn Mar 19

55 Corn Dec 19
56 SOYBEAN
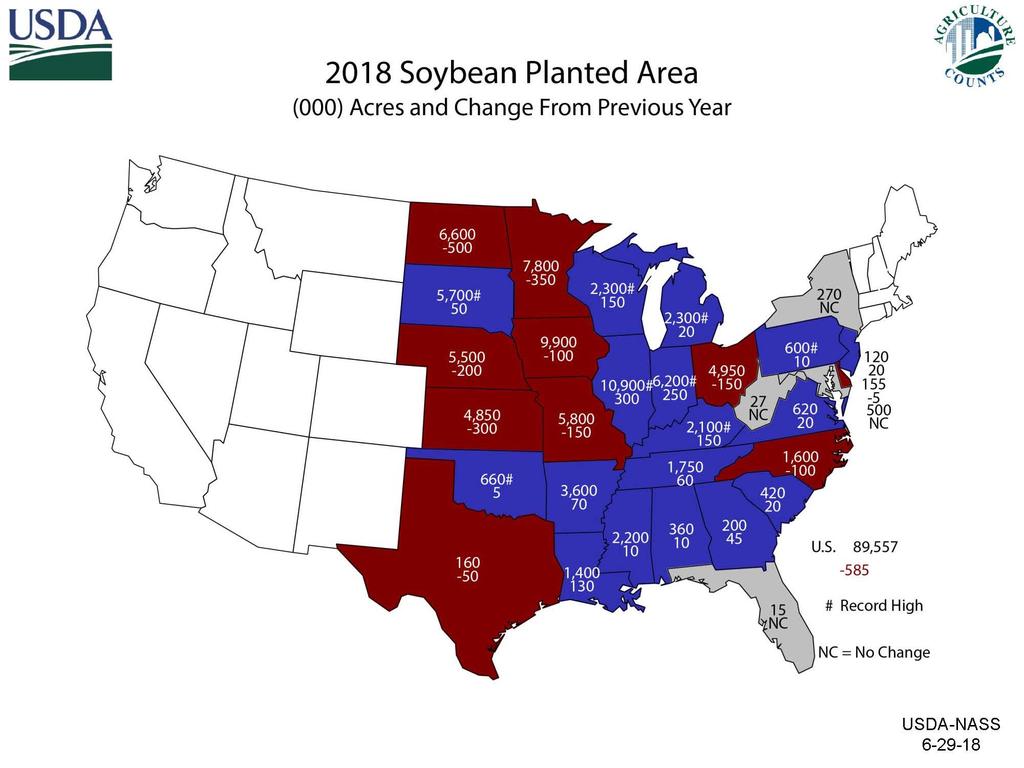
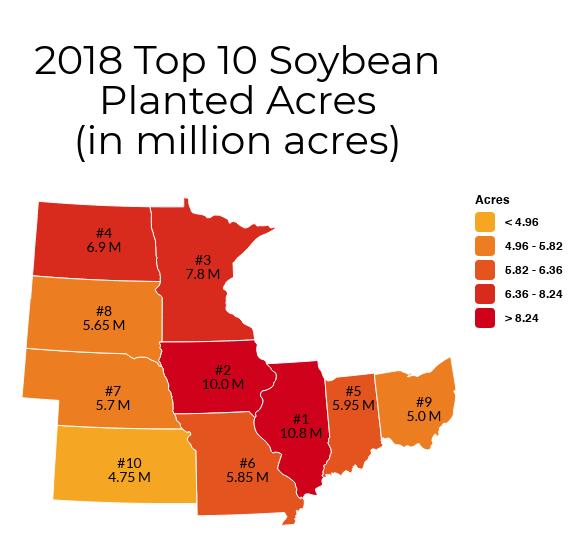
57 Soybean s Issues 2018 saw increase in acreage and what appeared to a record setting production year but soybean s world was flipped upside down in early spring with the announcement of tariffs on China SA production ended with Brazil at record while Argentina dropped 30% To add insult, winter showed up in Oct in US As of Nov 25, 6% of soybeans still in field, or 5.3 million acres, or 275 MB, an these acres might not get harvested Million dollar question what happens in 2019
58 Soybeans Category 08/09 09/10 10/11 11/12 12/13 13/14 14/15 15/16 16/17 17/18 18/19 19/20 EST Planted Acres Harvested Acres Yield Per Acre (Bu.) Supply Beginning Stocks Production 2,967 3,359 3,329 3,094 3,042 3,358 3,927 3,926 4,296 4,411 4,600 4,090 Imports Total Supply 3,185 3,512 3,495 3,325 3,252 3,570 4,052 4,140 4,515 4,734 5,063 5,070 Use Crush 1,662 1,752 1,648 1,703 1,689 1,734 1,873 1,886 1,901 2,055 2,080 2,075 Exports 1,279 1,499 1,501 1,365 1,317 1,638 1,842 1,942 2,166 2,129 1,900 2,075 Seed and Feed Residual Total Use 3,047 3,361 3,280 3,155 3,111 3,478 3,862 3,944 4,214 4,296 4,107 4,277 Ending Stocks Stocks/Use Ratio Average Price
59 100.0 Planted Acres 90.0 Harvested Acres /09 09/10 10/11 11/12 12/13 13/14 14/15 15/16 16/17 17/18 18/19 19/20
60
61
62
63
64 4,600 4,500 4,000 3,927 3,926 3,944 3,862 4,296 4,214 4,411 4,296 4,107 4,090 4,277 3,500 3,000 3,047 2,967 3,359 3,361 3,329 3,280 3,155 3,094 3,111 3,042 3,478 3,358 2,500 2,000 Production Total Use Ending Stocks 1,500 1, /09 09/10 10/11 11/12 12/13 13/14 14/15 15/16 16/17 17/18 18/19 19/20
65 2,475 2,166 2,129 2,055 2,080 2,075 1,975 1,662 1,752 1,648 1,703 1,689 1,734 1,638 1,942 1,873 1,886 1,901 1,842 1,900 1,499 1,501 1,475 1,279 1,365 1,317 Crush Exports Seed and Feed 975 Residual /09 09/10 10/11 11/12 12/13 13/14 14/15 15/16 16/17 17/18 18/19 19/20
66
67
68
69
70
71
72 Soybean Issues
73 US Soybean Price Price Date
74 US Soybean S/U Days Date
75 World Prod'n Ending Stocks World Soybean Production/Ending Stocks 16,000 14,000 12,000 10,000 Million Bu 8,000 6,000 4,000 2,000 0 Year
76 World Soybean S/U Days Date
77 Soybean Mar 19
78 Soybean Nov 19
79
80
81
82


83 Any Questions? Martinson Ag Risk Management 1555 S 43 rd St, Suite 105A Fargo, ND Randy Martinson randy@martinsonag.com Cell: Office Phone:
Crop Market Outlook 8/22/2017
 MSU is an affirmativeaction, equal-opportunity employer. Michigan State University Extension programs and materials are open to all without regard to race, color, national origin, gender, gender identity,
Market Outlook. David Reinbott.
 Market Outlook David Reinbott Agriculture Business Specialist P.O. Box 187 Benton, MO 63736 (573) 545-3516 http://extension.missouri.edu/scott/agriculture.aspx reinbottd@missouri.edu Trending Issues Volatile
World Wheat Supply and Demand Situation December 2018
 World Wheat Supply and Demand Situation December 218 Major data source: USDA World Agricultural Supply and Demand Estimates released December 11, 218. Projections will change over the course of the year
World Wheat Supply and Demand Situation
 World Wheat Supply and Demand Situation September 218 Major data source: USDA World Agricultural Supply and Demand Estimates released September 12, 218. Projections will change over the course of the year
Wheat Marketing Situation
 Wheat Marketing Situation Prepared by: Darrell L. Hanavan Executive Director Colorado Wheat Administrative Committee If you would like to receive an email when this report is updated, email gmostek@coloradowheat.org
World Wheat Supply and Demand Situation August 2018
 World Wheat Supply and Demand Situation August 218 Major data source: USDA World Agricultural Supply and Demand Estimates released August 1, 218. Projections will change over the course of the year depending
World Wheat Supply and Demand Situation
 World Wheat Supply and Demand Situation November 218 Major data source: USDA World Agricultural Supply and Demand Estimates released November, 218. Projections will change over the course of the year depending
World Wheat Supply and Demand Situation March 2018
 World Wheat Supply and Demand Situation March 218 Major data source: USDA World Agricultural Supply and Demand Estimates released March 8, 218. Projections will change over the course of the year depending
World Wheat Supply and Demand Situation October 2018
 World Wheat Supply and Demand Situation October 218 Major data source: USDA World Agricultural Supply and Demand Estimates released October 12, 218. Projections will change over the course of the year
2011 Indiana Agricultural Outlook
 2011 Indiana Agricultural Outlook Corinne Alexander & Chris Hurt hurtc@purdue.edu September 13, 2010 World Economic Growth Ethanol Dollar Value Surprises and Uncertainty! Change Wheat Production 2010 vs.
What Does the March Prospective Plantings Report Mean for the Outlook? Chris Hurt & Corinne Alexander
 What Does the March Prospective Plantings Report Mean for the 2014-2015 Outlook? Chris Hurt & Corinne Alexander hurtc@purdue.edu cealexan@purdue.edu Purdue University April 1, 2014" Webinar: April 1, 2014
Major Junctions Ahead Energy, Grains and Metals. David Hightower President, The Hightower Report
 Major Junctions Ahead Energy, Grains and Metals David Hightower President, The Hightower Report 30 25 23.55 2018 Commodity Performance - Annual Percent Change 20 16.49 15 10 10.09 6.44 5 0 0.24-5 -10-15
SOYBEAN OUTLOOK Midwest & Great Plains/Western Extension Summer Outlook Conference. St. Louis, Missouri
 SOYBEAN OUTLOOK 2014 Midwest & Great Plains/Western Extension Summer Outlook Conference St. Louis, Missouri Jim Hilker Department of Agricultural, Food, And Resource Economics Michigan State University
Rice Outlook Slide Show U.S. and World August 10, 2017
 Rice Outlook Slide Show U.S. and World August 10, 2017 Bobby Coats, Ph.D. Professor Economics Department of Agricultural Economics and Agribusiness Division of Agriculture Cooperative Extension Service
History gives hope for wheat rally Be sure to reward $2 rally. By Bryce Knorr, Senior Grain Market Analyst
 History gives hope for wheat rally Be sure to reward $2 rally By Bryce Knorr, Senior Grain Market Analyst For years the wheat market stagnated waiting for a single trigger: A sharp reduction in global
2017/18 Cotton Outlook
 217/1 Cotton Outlook 217 Ag Econ In service Training Dr. S. Aaron Smith, Assistant Professor, Department of Agricultural and Resource Economics, University of Tennessee https://ag.tennessee.edu/arec/pages/cropeconomics.aspx
THIS REPORT CONTAINS ASSESSMENTS OF COMMODITY AND TRADE ISSUES MADE BY USDA STAFF AND NOT NECESSARILY STATEMENTS OF OFFICIAL U.S.
 THIS REPORT CONTAINS ASSESSMENTS OF COMMODITY AND TRADE ISSUES MADE BY USDA STAFF AND NOT NECESSARILY STATEMENTS OF OFFICIAL U.S. GOVERNMENT POLICY Required Report - public distribution Oilseeds and Products
India. Oilseeds and Products Update. February 2012
 THIS REPORT CONTAINS ASSESSMENTS OF COMMODITY AND TRADE ISSUES MADE BY STAFF AND NOT NECESSARILY STATEMENTS OF OFFICIAL U.S. GOVERNMENT POLICY Required Report - public distribution India Oilseeds and Products
Economic and Commodity Market Outlook
 Economic and Commodity Market Outlook August 12, 2016 By Robert Coats, Ph.D. Professor Economics Department of Agricultural Economics and Agribusiness Division of Agriculture University of Arkansas System
AOF Forum Oilseeds Outlook October, 2006
 AOF Forum Oilseeds Outlook October, 2006 Josh Roberts Senior Trading Manager Grain Pool Pty Ltd 30 Delhi Street West Perth Tel: +61 8 9237 9859 josh.roberts@grainpool.com.au Oilseeds trends versus other
Strong Global Grain Production Isn t Good Enough. David Hightower The Hightower Report
 Strong Global Grain Production Isn t Good Enough David Hightower The Hightower Report Big Picture Factors Cost of Production Pricing Not a downtrend signal Goldman $20 oil Forecast was wrong 8.9 mbd!
Corn Outlook. David Miller Director of Research & Commodity Services Iowa Farm Bureau Federation December 2013
 Corn Outlook David Miller Director of Research & Commodity Services Iowa Farm Bureau Federation December 2013 Source: USDA-WAOB U.S. Corn Supply & Usage U.S. Corn Supply & Usage Comments With the largest
Fundamentals Driving U.S. Agricultural Prosperity
 Fundamentals Driving U.S. Agricultural Prosperity Chris Hurt Purdue Extension Service March 2013, hurtc@purdue.edu Economic Shock Transition to New-Equilibrium 250 Hypothetical 29 Year Cycle: Index Base
2018 Outlook for Grains and Oilseeds
 2018 Outlook for Grains and Oilseeds Present to the American Fats and Oils Associa;on October 2017 AdvancedEconomicSolu0ons US$ Declines from Peak - Now at lowest point since October 2015 Currently in
Advance Trading, Inc. Supply/Demand Summary
 Advance Trading, Inc. Supply/Demand Summary Corn Planted Acres 88.0 94.0 90.2 90.2 0.0 88.0 88.0 0.0 % Harvested 91.8% 92.2% 91.7% 91.7% 91.7% 91.7% Harvested Acres 80.8 86.7 82.7 82.7 0.0 80.7 80.7 0.0
Week Ending: Oct. 25, 2018
 Week Ending: Oct. 25, 2018 Market Page 1. Thurs. Close Last Thurs. Close Weekly Change Week's High Week's Low Life of Contract High Life of Contract Low NEW YORK COTTON FUTURES (Cents/Lb.) December-18
CHARTS AND PRICE PROJECTIONS
 CHARTS AND PRICE PROJECTIONS 18 / Charts and Price Projections: FAPRI 27 Agricultural Outlook Average Annual GDP Growth Percent Change 9 8 7 6 4 3 2 1 26-216 Canada China EU NMS EU- India Japan Latin America
The Outlook for Biofuels
 PRX BlueSky Outlook, Page 1 The Fertilizer Institute Fertilizer Outlook and Technology Conference The Outlook for Biofuels November 6, 2007 Ross Korves Economic Policy Analyst The ProExporter Network ross.korves@proexporter.com
CHARTS AND PRICE PROJECTIONS
 CHARTS AND PRICE PROJECTIONS 18 / Charts and Price Projections: FAPRI 28 Agricultural Outlook Average Annual GDP Growth, 27-217 Percent Change 1 8 8.4 7.92 6 4 4.44 3.67 4.6 4.34 2 2.37 2.17 1.38 2.44
Corn & Bean Producers-1
 Largest Corn Producing Countries - 2016 est. Largest Corn Importing Countries - 2016 est. (Marketing year - thousands of hectares, tons per hectare, and thousands of metric tons) (Marketing year - thousands
DAILY MARKET REPORT 01 NOVEMBER 2018
 DAILY MARKET REPORT 01 NOVEMBER 2018 Unigrain (Pty) Ltd Tel. No. : +27 11 692 4400 Fax. No. : +27 11 412 1183 Economic Indicators Quote at 12h00 previous day Current quote Change % Change Rand/Dollar 14.74
FAPRI Food and Agricultural Policy Research Institute
 26 WORLD OUTLOOK Presentation Food and Agricultural Policy Research Institute Global Macroeconomic Overview Sustained and widespread real economic growth for the decade averaging 3.1%. Industrialized countries
Canola Weekly. Index. WCE May/07 Canola Jul 9-Aug 14-Sep 20-Oct 27-Nov 4-Jan 8-Feb 16-Mar
 March 2, 2 Canola Weekly Index ) Canola Steady Despite Weak Soy Complex 2) Slow Crush Improves Canola Oil Basis ) Export Demand Underpins Canola Last week, we mentioned that May canola had key support
PNS Soybean Workgroup
 PNS Soybean Workgroup 2 February 2017 Nico Hawkins General Manager Supply & Demand (National vs. International) SAGIS NAMC (S&D) International (USDA) Mar - Feb Final Projection: 2015/16 (c) 2016/17 (c)
Monthly Economic Letter
 Monthly Economic Letter Cotton Market Fundamentals & Price Outlook RECENT PRICE MOVEMENT Global cotton prices were mostly stable over the past month, with NY futures, the A Index, and the CC Index virtually
Week Ending: Dec. 8, 2016
 Week Ending: Dec. 8, 2016 Market Page 1. Thurs. Close Last Thurs. Close Weekly Change Week's High Week's Low Life of Contract High Life of Contract Low NEW YORK COTTON FUTURES (Cents/Lb.) March-17 71.42
THIS REPORT CONTAINS ASSESSMENTS OF COMMODITY AND TRADE ISSUES MADE BY USDA STAFF AND NOT NECESSARILY STATEMENTS OF OFFICIAL U.S.
 THIS REPORT CONTAINS ASSESSMENTS OF COMMODITY AND TRADE ISSUES MADE BY USDA STAFF AND NOT NECESSARILY STATEMENTS OF OFFICIAL U.S. GOVERNMENT POLICY Required Report - public distribution Date: GAIN Report
Biofuels: Implications for Prices and Production. Darrel L. Good and Scott H. Irwin
 Biofuels: Implications for Prices and Production Darrel L. Good and Scott H. Irwin Why Ethanol? Convert relatively abundant domestic sources of energy into a substitute for imported petroleum Energy Conversion
Shemen Industries Ltd.
 Shemen Industries Ltd. מפגש לקוחות תחום הזנת בעלי חיים 14.05.2012 2 I יבוא לארץ 3 היקף יבוא מוצרי מספוא )אלפי טון( )תירס, חיטת מספוא, שעורה, דורה, כוספאות ומוצרים( 3,500 כוספאות ומוצרים גרעינים 3,000 2,500
Market situation Cereals Oilseeds Protein crops
 Market situation Cereals Oilseeds Protein crops DG AGRI C 4 Civil Dialogue Group on Animal Products Pig Meat 13 April 2016 Exchange rates & crude oil 2 Euro US Dollar exchange rate 1.40 1.15 From the last
Monthly Hog Market Update United States Hog Production
 This information is provided as a resource by Saskatchewan Agriculture staff All prices are in Canadian dollars unless otherwise noted. Please use this information at your own risk. Monthly Hog Market
External Market Factors Impacting US Soybean Meal
 External Market Factors Impacting US Soybean Meal USSEC Luncheon International Production and Processing Expo January 3, 213 Atlanta, GA Paul Smolen Presentation Objectives Examine the economic drivers
Weak Real to Boost Brazil s Soybean Exports in 2016
 United States Department of Agriculture Foreign Agricultural Service October 2015 Weak Real to Boost Brazil s Soybean Exports in 2016 Brazil s exchange rate is having a significant impact on domestic and
DAILY MARKET REPORT 24 DECEMBER 2018
 DAILY MARKET REPORT 24 DECEMBER 2018 Unigrain (Pty) Ltd Tel. No. : +27 11 692 4400 Fax. No. : +27 11 412 1183 Economic Indicators Quote at 12h00 previous day Current quote Change % Change Rand/Dollar 14.47
US biofuel Indicators and a changing market dynamic
 US biofuel Indicators and a changing market dynamic Seth Meyer AMIS October 1-2, 13, Rome Movement of Ag and Energy Ethanol production and capacity 16 35 Crude oil and maize prices 14 3 billion gallons
Mid-term Outlook for World Agricultural Markets
 Mid-term Outlook for World Agricultural Markets Jacinto Fabiosa Co-Director, (515) 294-6183 jfabiosa@iastate.edu Food and Agricultural Policy Research Institute The Question of Interest? In 27 we asked,
Sunflower Oil Imports Increase for Ration Card Program
 THIS REPORT CONTAINS ASSESSMENTS OF COMMODITY AND TRADE ISSUES MADE BY USDA STAFF AND NOT NECESSARILY STATEMENTS OF OFFICIAL U.S. GOVERNMENT POLICY Required Report - public distribution Date: GAIN Report
Oil Crops Outlook Economic Research Service October 12, 2012 U.S. Department of Agriculture
 Oil Crops Outlook Economic Research Service October 12, 2012 U.S. Department of Agriculture OCS-12j text Approved by the World Agricultural Outlook Board Advancing Soybean Harvest Eases Near-term Prices
2016/17 Global Olive Oil Production Down But Prices Stabilize
 United States Department of Agriculture Foreign Agricultural Service November 2016 Global Olive Oil Down But Prices Stabilize Global Olive Oil and Stocks 4000 3500 5000 Extra Virgin Olive Oil Prices Stabilizing
PNS Soybean Workgroup
 PNS Soybean Workgroup 12 April 2016 Nico Hawkins General Manager Supply & Demand (National vs. International) Soybean: Supply and dem and (RSA vs International) SAGIS NAMC (S&D) International (USDA) Marketing
Rudi Swanepoel. Fax:
 Commodity Future CME CORN FUURES Main Board Month Close Change Last Change CME Corn May'13 6511/4 21/4 654 23/4 CME Corn Jul'13 6331/2 1 6353/4 21/4 CME Corn Sep'13 567 1/4 5671/2 1/2 CME Corn Dec'13 544
TOOL #5: C&S WASDE PRICE STUDY FOR DECEMBER CORN 7/09/10 For the July 9 th to the August 12 th time frame for CZ 2010
 TOOL #5: C&S WASDE PRICE STUDY FOR DECEMBER CORN 7/09/10 For the July 9 th to the August 12 th time frame for CZ 2010 Brief summary: In the month ahead, my best estimate is that CZ 2010 could trade in
Brazil s Soybean Oil Exports Squeezed by Rising Biodiesel Demand
 United States Department of Agriculture Foreign Agricultural Service Circular Series FOP 6-09 e 2009 Brazil s Soybean Oil Exports Squeezed by Rising Biodiesel Demand Soybean Oil Exports and Industrial
USDA Projections of Bioenergy-Related Corn and Soyoil Use for
 USDA Projections of Bioenergy-Related Corn and Soyoil Use for 2010-2019 Daniel M. O Brien, Extension Agricultural Economist K-State Research and Extension The United States Department of Agriculture released
Early-Season U.S. Soybean Meal Sales Surge
 United States Department of Agriculture Foreign Agricultural Service November 2014 Early-Season U.S. Soybean Meal Sales Surge U.S. soybean meal export commitments (accumulated exports plus outstanding
Diesel prices finally ease Winter weather and international events could determine your fuel bill for 2018 By Bryce Knorr, senior grain market analyst
 Diesel prices finally ease Winter weather and international events could determine your fuel bill for 2018 By Bryce Knorr, senior grain market analyst After rallying to their highest level in nearly three
2007 AAEA Livestock Outlook Symposium
 27 AAEA Livestock Outlook Symposium Ron Plain Professor of Agricultural Economics University of Missouri-Columbia www.ssu.missouri.edu/faculty/rplain Hog Price Outlook Production Efficiency 1 Head 9.5
Market Report. Grain HIGHLIGHTS INTERNATIONAL GRAINS COUNCIL. WORLD ESTIMATES. GMR November 2018
 Grain INTERNATIONAL GRAINS COUNCIL www.igc.int Market Report GMR 494 22 November 2018 HIGHLIGHTS With small adjustments for wheat, maize and sorghum, the forecast for world total grains (wheat and coarse
China s Rapeseed Meal Imports Rise as Seed Imports Decline
 United States Department of Agriculture Foreign Agricultural Service February 2017 China s Rapeseed Meal Rise as Seed Decline Trend in China Rapeseed 12-Month Moving Totals Trend In China Rapeseed Meal
2017 Risk and Profit Conference Breakout Session Presenters. 13. Ethanol and Biodiesel Market and Profitability Prospects
 2017 Risk and Profit Conference Breakout Session Presenters 13. Ethanol and Biodiesel Market and Profitability Prospects Dan O Brien Daniel O Brien was raised on a grain and livestock
Grain Outlook Dean Cooper INTL FCStone Inc.
 Grain Outlook Dean Cooper dean.cooper@intlfcstone.com INTL FCStone Inc. www.intlfcstone.com Disclaimer The trading of derivatives such as futures, options, and swaps may not be suitable for all investors.
Drought in South America to Limit Soybean Exports
 United States Department of Agriculture Foreign Agricultural Service Circular Series FOP 2-09 ruary 2009 Drought in South America to Limit Soybean Exports Million Tons 16 14 12 10 8 6 4 2 Annual Change
China Soybean Imports Stagnant Despite Record Consumption as Production Rebounds
 United States Department of Agriculture Foreign Agricultural Service Circular Series FOP 9-08 tember 2008 China Soybean Stagnant Despite Record Consumption as Rebounds Million Tons 60 50 40 30 20 10 0
Rice Outlook U.S. and World February 9, 2017
 Rice Outlook U.S. and World February 9, 217 Bobby Coats, Ph.D. Professor Economics Department of Agricultural Economics and Agribusiness Division of Agriculture University of Arkansas System 51.671.21
Sunflower & Soybean Forum
 Sunflower & Soybean Forum 11 October 2017 Nico Hawkins General Manager Sunflower Sunflower: Supply & Demand National vs. International Marketing season SAGIS NAMC (S&D) International (USDA) Marketing year
Canada Meat Market Report
 January 2018 January 18th, 2018 Canada Meat Market Report - Supply and Price Situa on for Domes c and Imported Beef - Prepared for Meat and Livestock Australia Steiner Consul ng Group, Manchester, NH,
Soybean and Oilseed Meal Import Prospects Higher as Severe Weather Damages EU Crops
 Million Tons Million Tons Million Tons United States Department of Agriculture Foreign Agricultural Service August 2018 Soybean and Oilseed Meal Import Prospects Higher as Severe Weather Damages EU Crops
DAILY MARKET REPORT 12 APRIL 2019
 DAILY MARKET REPORT 12 APRIL 2019 Unigrain (Pty) Ltd Tel. No. : +27 11 692 4400 Fax. No. : +27 11 412 1183 Economic Indicators Quote at 12h00 previous day Current quote Change % Change Rand/Dollar 13.94
Commodity Sector Weighting for Current Period: Please see Section A2 in Appendix A.
 Index Information RBC Commodity Index Dynamic Commodity 01 Section 1. General Information Index Name: RBC Commodity Index Dynamic Commodity 01 Index Ticker: RBCADC01 Index Type: Excess Return First Calculation
Groundnut Forum. 15 February Nico Hawkins General Manager
 Groundnut Forum 15 February 2018 Nico Hawkins General Manager Groundnuts: Supply & Demand (National vs. International Marketing season) SAGIS Grain SA International (USDA) Marketing year Mar - Feb Sep
Soybean Trade Growth: A Story of Brazil, the United States, and China
 United States Department of Agriculture Foreign Agricultural Service October 2017 Soybean Trade Growth: A Story of Brazil, the United States, and China 12-Month Soybean Export Growth Year Ending September
Indian Soybean Meal Exports Unlikely to Recover in 2015/16
 United States Department of Agriculture Foreign Agricultural Service November 2015 Indian Soybean Meal Exports Unlikely to Recover in Though once a significant regional exporter of soybean meal, India
FAPRI 2006 Preliminary Baseline December 15-16, 2005
 FAPRI 26 Preliminary Baseline December 15-16, 25 INTERNATIONAL OILSEEDS Tun-Hsiang (Edward) Yu 515-294-815 edyucard@iastate.edu FAPRI Food and Agricultural Policy Research Institute Center for Agricultural
Pakistan Oilseed Processors Seize Opportunity to Crush Soybeans
 United States Department of Agriculture Foreign Agricultural Service December 2015 Pakistan Oilseed Processors Seize Opportunity to Crush Soybeans Pakistan, long an importer of soybean meal, is transitioning
EU BIO-FUEL POTENTIAL CHANGES IN INTERNATIONAL RAPESEED TRADE FLOWS
 Mercantile, April 2013 1 EU BIO-FUEL POTENTIAL CHANGES IN INTERNATIONAL RAPESEED TRADE FLOWS GCIRC Technical Meeting 2013 Mercantile Consulting Venture Inc. Marlene Boersch Mercantile, April 2013 2 Overview
Growing Soybean Oil Price Raises Oil s Contribution to Total Soybean Value
 United States Department of Agriculture Foreign Agricultural Service Circular Series FOP 10-07 October 2007 Growing Soybean Oil Price Raises Oil s Contribution to Total Soybean Value Relative Share Value:
Lingering Effects of Truckers Strike Impact Planting Plans
 THIS REPORT CONTAINS ASSESSMENTS OF COMMODITY AND TRADE ISSUES MADE BY USDA STAFF AND NOT NECESSARILY STATEMENTS OF OFFICIAL U.S. GOVERNMENT POLICY Required Report - public distribution Brazil Post: Brasilia
It s time to start buying propane for fall Expect to pay more to dry 2017 corn crop By Bryce Knorr, senior grain market analyst
 It s time to start buying propane for fall Expect to pay more to dry 2017 corn crop By Bryce Knorr, senior grain market analyst It s the end of winter hopefully and that means it s a good time to buy coats,
2017 SC Producers Whole Farm Revenue Protection Expected Price Justification
 2017 SC Producers Whole Farm Revenue Protection Expected Price Justification RMA Projected Expected As of Average Futures Price Close As of RMA Projected Prices 4 Feb 2011 2015 % Differ 4 Feb Crop Contract
Algeria. Grain and Feed Update. Wheat update
 THIS REPORT CONTAINS ASSESSMENTS OF COMMODITY AND TRADE ISSUES MADE BY USDA STAFF AND NOT NECESSARILY STATEMENTS OF OFFICIAL U.S. GOVERNMENT POLICY Required Report - public distribution Grain and Feed
Oilseeds and Products
 Oilseeds and Products Oilseeds compete with major grains for area. As a result, weather impacts soybeans, rapeseed, and sunflowerseed similarly to grain and other crops grown in the same regions. The same
Groundnut Forum. 18 February Nico Hawkins General Manager
 Groundnut Forum 18 February 2016 Nico Hawkins General Manager Supply & Demand (National vs. International) SAGIS Grain SA International (USDA) Marketing year Final Projection Estimate Projection Mar -
Share of Brazil s Soybean Exports to China Spikes in August
 United States Department of Agriculture Foreign Agricultural Service September 2018 Share of Brazil s Soybean Exports to China Spikes in August Monthly Share of Brazil's Soybean Exports to China 85% 75%
Palm and Soy Oil Use Expands at Expense of Other Oils
 United States Department of Agriculture Foreign Agricultural Service September 2015 Revised on September 15, 2015 Palm and Soy Oil Use Expands at Expense of Other Oils As global demand for vegetable oil
Oilseeds and Products
 Oilseeds and Products Oilseeds compete with major grains for area. As a result, weather impacts soybeans, rapeseed, and sunflowerseed similarly to the grain and other crops grown in the same regions. The
How important is sugar in the global ethanol equation? (and vice-versa)
") How important is sugar in the global ethanol equation? (and vice-versa) Kingsman Indian Sugar Summit Tom McNeill 1 September 2010 Global sugar/ethanol picture Sugar Other Ethanol Sugar in 2010/11 crowding
How important is sugar in the global ethanol equation? (and vice-versa) Kingsman Indian Sugar Summit Tom McNeill 1 September 2010 Global sugar/ethanol picture Sugar Other Ethanol Sugar in 2010/11 crowding
China is Key to Slow Pace of U.S. Soybean Exports
 United States Department of Agriculture Foreign Agricultural Service January 2018 China is Key to Slow Pace of U.S. Soybean Exports U.S. and Brazil Soybean Exports by Destination (Accumulated Exports:
China Tariffs Driving U.S. Soybean Exports To the European Union to a 30-Year High
 United States Department of Agriculture Foreign Agricultural Service March 2019 China Tariffs Driving U.S. Soybean Exports To the European Union to a 30-Year High 12-MONTH MOVING TOTAL U.S. SOYBEAN EXPORTS
Market Report INTERNATIONAL GRAINS COUNCIL. HIGHLIGHTS WORLD ESTIMATES
 Grain GMR 467 1 July 2016 INTERNATIONAL GRAINS COUNCIL www.igc.int Market Report HIGHLIGHTS The forecast for total grains (wheat and coarse grains) production in 2016/17 is up by 10m t m/m (month-on-month),
Presentation at 50 th Anniversary of Aniame in Mexico City on 23 Oct 2008
 Global Supply, Demand and Price Outlook for Oilseeds, Veg. Oils and Oilmeals Reation of the Global Oilseed Sector to the New Price Price Determining Factors Thomas Mielke Presentation at 5 th Anniversary
Manitoba Economic Highlights
 Economic Overview Real Gross Domestic Product The Manitoba Bureau of Statistics estimates that Manitoba s real GDP grew 1.9% in 2016, above the national average of 1.4%. Manitoba s real GDP is expected
Economic Research Service Situation and Outlook Report. Brazil Soybean Exports Still Outpace U.S. Trade
 Economic Research Service Situation and Outlook Report OCS-18l December 13, 2018 Next release is January 15, 2019 Oil Crops Outlook Mark Ash Mariana Matias Brazil Soybean Exports Still Outpace U.S. Trade
Prices indeed dropped on Thursday, aided by a surprise increase in crude oil supplies caused by stronger imports.
 Trump s war on OPEC Farm fuel prices resist President s attempt to jawbone cartel By Bryce Knorr, senior grain market analyst For a day or two, at least, it looked like President Trump s attempt to tweet
United States Boosts Share in South Korea s Soybean Oil Market
 United States Department of Agriculture Foreign Agricultural Service February, 2018 United States Boosts Share in South Korea s Soybean Oil Market Thousand Metric Tons 350 300 250 200 150 100 50 50% 45%
Devaluation Energizes Argentine Soybean Crush
 United States Department of Agriculture Foreign Agricultural Service March 2016 Devaluation Energizes Argentine Soybean Crush Argentina Quarterly Soybean Crush Volume Exchange Rate* and Constant Dollar
U.S. Soybean Exports Forecast to Reach Record
 United States Department of Agriculture Foreign Agricultural Service July 2017 U.S. Soybean Exports Forecast to Reach Record 60 Accumulated Exports by Week Total Commitments of Soybeans as of End of June
Rudi Swanepoel. Fax:
 Commodity Future CME CORN FUURES Main Board Month Close Change Last Change CME Corn Sep'13 4811/2 163/4 4781/4-31/4 CME Corn Dec'13 4721/4 17 4691/4-3 CME Corn Mar'14 4841/2 161/4 4821/2-2 CME Corn May'14
Soybean Oil Prices Diverge on Different Supply Situations
 United States Department of Agriculture Foreign Agricultural Service Circular Series FOP 10-09 October 2009 Soybean Oil Prices Diverge on Different Supply Situations Soybean Oil Price ($/ton) $900 $850
POSITIONED FOR GROWTH BNSF Railway. John Miller Group Vice President Agricultural Products BNSF Railway
 POSITIONED FOR GROWTH BNSF Railway John Miller Group Vice President Agricultural Products BNSF Railway 1 Historic Rail Industry Volumes U.S. Class I Weekly Rail Volumes 800,000 2006 2007 2008 2009 2010
India Soybean Meal Exports: Revised and Rebounding
 United States Department of Agriculture Foreign Agricultural Service January 2017 India Soybean Meal Exports: Revised and Rebounding India Soybean Meal Exports Forecast to Rise in 8.0 Data Series Comparison