Shemen Industries Ltd.
|
|
|
- Dwain Burke
- 5 years ago
- Views:
Transcription

1 Shemen Industries Ltd.
2 מפגש לקוחות תחום הזנת בעלי חיים
3 I יבוא לארץ 3


4 היקף יבוא מוצרי מספוא )אלפי טון( )תירס, חיטת מספוא, שעורה, דורה, כוספאות ומוצרים( 3,500 כוספאות ומוצרים גרעינים 3,000 2, ,000 1,500 2,188 2,342 2,194 2,123 2,292 2,223 2,311 2,537 2,380 1, Source: Israel Ministry of Agriculture 4

5 ייבוא גרעינים לישראל מקור: משרד החקלאות


6 6 יבוא וייצור כוספת לפתית מקור: שמן תעשיות


7 יבוא וייצור כוספת סויה מקור: שמן תעשיות ייצור סו ר ייצור מ ייצור סו ר ייצור מ י וא ייצור י וא מ י וא ייצור


8 ייבוא קמחים לישראל מקור: משרד החקלאות 8

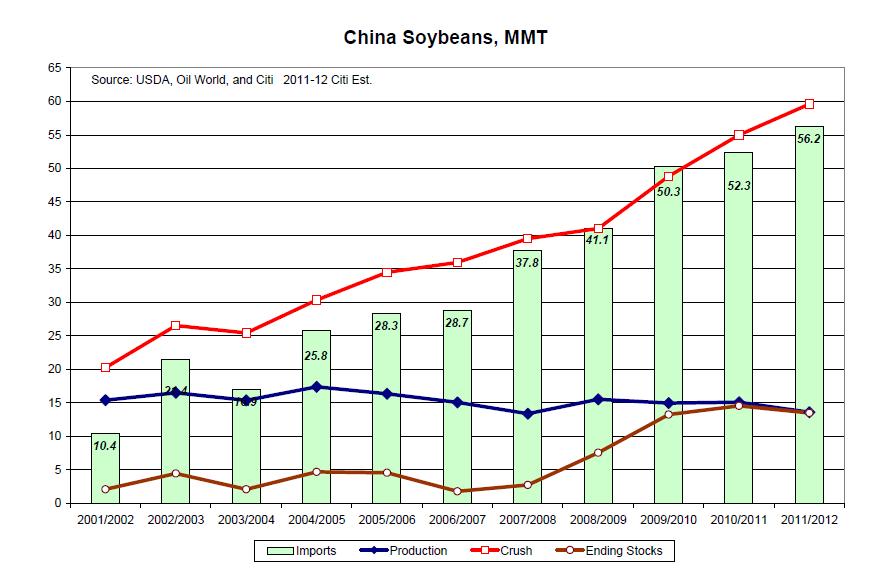
9 9 ייבוא פולי סויה לפי שנים מקור: משרד החקלאות

10 10 ייבוא כוספאות לפי שנים מקור: משרד החקלאות
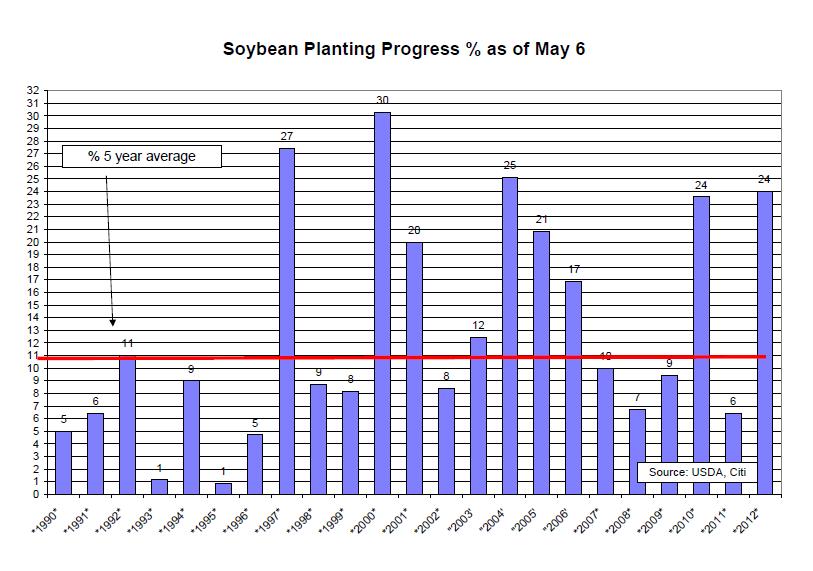
11 II ביקוש והיצע - דו"חות 11
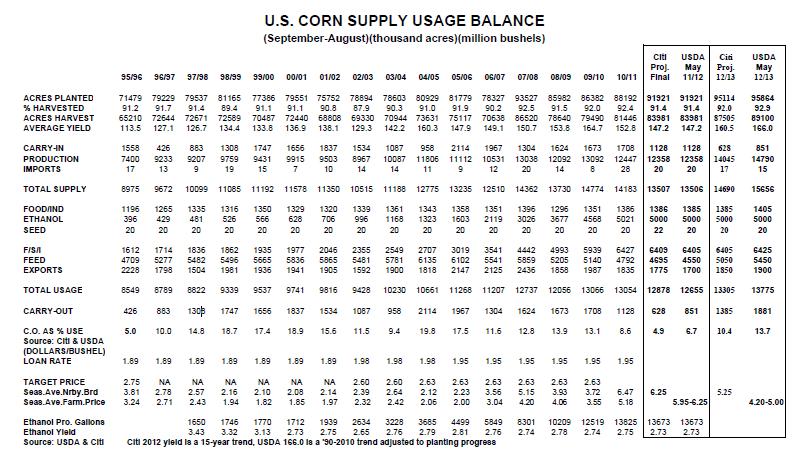
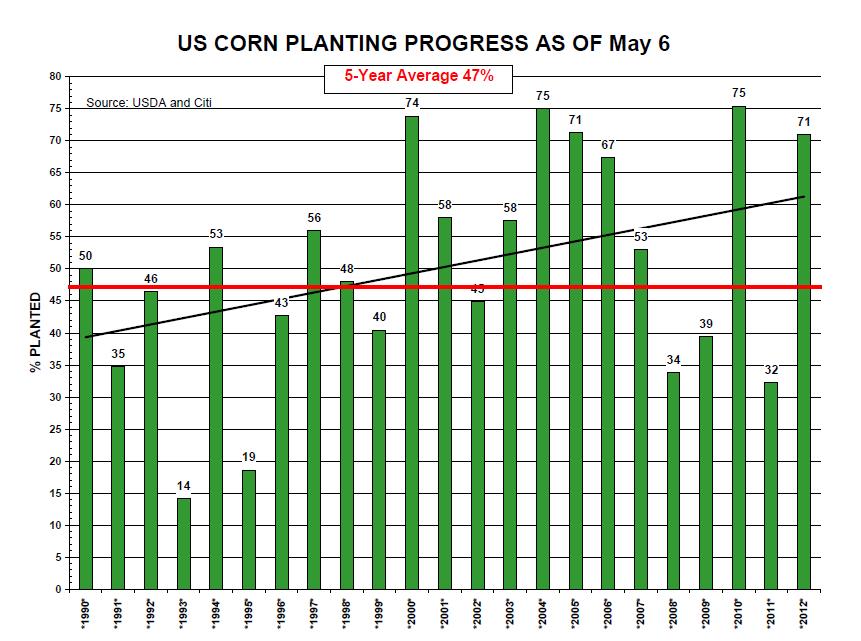
12 400 US planted areas (M acres) Small Sorghum Cotton Conservation Hay All Wheat Soybeans Corn Mar-11 Jun-11 Final 2011 Mar-12 12


13 250,000 US Acreage of 3 major crops (M acres) Soybeans All Wheat Corn 200,000 72,025 73,730 74,266 74,075 73,963 73,404 75,208 72,032 75,522 64,741 75,718 77,451 77,400 75,000 73, , ,000 65,799 62,814 62,946 59,617 60,358 60,940 59,674 57,229 57,873 60,433 63,457 59,133 53,600 54,400 55,908 50,000 80,165 77,386 79,551 75,752 78,894 78,603 80,929 81,779 78,327 93,527 85,982 86,482 88,200 91,900 95, May 11/12 May 12/13 Proj. source : Grain Supply/Demand 13
14 Ending stock Stock to Use 13% U.S Soybean Carry-Out and Stock To Use as % (Mb) 16% 19% 20.0% 15.0% % 10.0% % 9% 7% 6% 9% 7% 7% 7% 200 5% 5% 5% 4% 5.0% /98 98/99 99/00 00/01 01/02 02/03 03/04 04/05 05/06 06/07 07/08 08/09 09/10 10/11 11/12 May source: Grain Supply/Demand 12/13 Proj. May %
15 15
16 US Soybean Average Yield /00 00/01 01/02 02/03 03/04 04/05 05/06 06/07 07/08 08/09 09/10 10/11 May 11/12 May 12/13 16
17 17
18 18
19 19
20 20
21 Ending stock World soybean Carry-Out and Stock To Use as % (MMT) 20.38% 20.00% Stock to Use 18.53% 18.00% % 16.00% % % 14.00% % /9 2009/10 May 2011/12 Proj. May 2012/ % source: Grain Supply/Demand 21
22 8.50% /12 World Soybean Carry- Out and Stock to Use estimation elaboration (MMT) 8.00% 7.50% % 17.86% Ending stock Stock to Use % 7.00% 6.50% % % 6.00% % % 5.00% DEC 2011/12 source : Grain Supply/Demand JAN 2011/12 FEB 2011/12 MARCH 2011/12 APR 2011/12 MAY 2011/12 22
23 1.00% /12 World Soybean Carry- Out and Stock to Use estimation Elaboration (MMT) 0.00% % 19.47% 20.20% 19.88% 19.94% 19.94% 20.05% 19.98% 9.00% Ending stock 18.99% 8.00% Stock to Use 18.23% 18.23% % 7.00% 6.00% % 16.55% 5.00% FEB MAR APR MAY June July Aug Sep Oct Nov Dec Jan Feb March source : Grain Supply/Demand 23
24 24


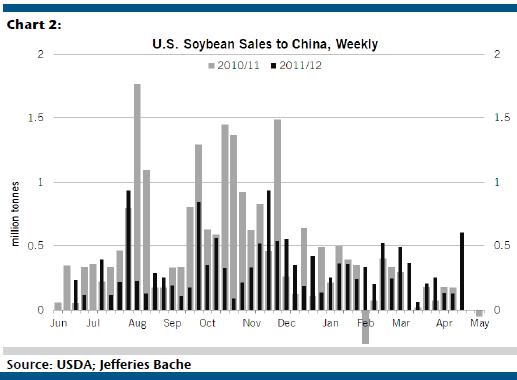
25 China s Imports Jan-Mar (1,000 tonnes). Source: Reuters, Jefferies Bache, LLC 25
26 26
27 27
28 28
29 2,000 1,500 Ending stock Stock to Use U.S Corn Carry-Out and Stock To Use as % (Mb) 19.80% 18.70% 18.90% 17.40% 17.50% 15.60% 14.80% 13.90% 12.80% 13.10% 11.50% 11.60% 20% 15% 13.66% 1, % 9.40% 8.64% 10% 6.72% % 5% - 95/96 96/97 97/98 98/99 99/00 00/01 01/02 02/03 03/04 04/05 05/06 06/07 07/08 08/09 09/10 10/11 11/12 source: Grain Supply/Demand May 12/13 Proj. May 29 0%
30 30
31 US Corn Average Yield /96 96/97 97/98 98/99 99/00 00/01 01/02 02/03 03/04 04/05 05/06 06/07 07/08 08/09 09/10 10/11 May May 11/12 12/13 31
32 32
33 160 World Corn Carry-Out and Stock To Use as% (MMT) % Ending stock Stock to Use 20.00% 18.00% % 14.86% 16.00% % 13.23% 14.00% % /9 2009/10 May 2011/12 Proj. May 2012/ % source: Grain Supply/Demand 33
34 4.00% 3.80% 3.60% /12 World Corn Carry- Out and Stock to Use estimation Elaboration (MMT) Ending stock Stock to Use 3.40% % % 13.31% 13.23% 3.00% % 12.90% 2.80% % 2.60% % % % DEC 2011/12 source : Grain Supply/Demand JAN 2011/12 FEB 2011/12 MAR 2011/12 APR 2011/12 MAY 2011/12 34
35 35

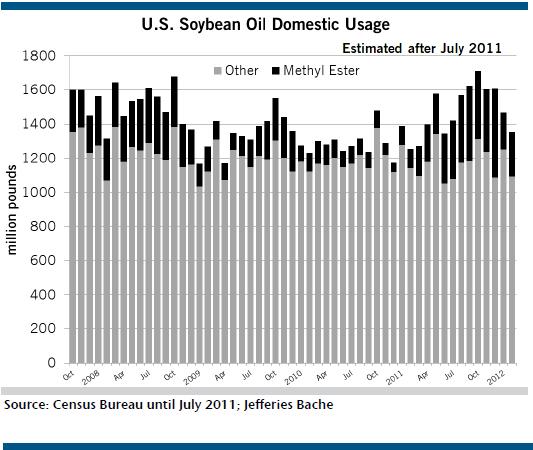
36 Monthly Ethanol Production 36

37 U.S. use for Ethanol Grind (mil bu) Source: CITI, EIA, and Renewable 37 Fuels Association

38 U.S. Production of DDG (mil ton) Source: CITI, EIA, FAPRI and 38 Renewable Fuels Association
39 4.00% 3.80% 3.60% 3.40% 3.20% /12 World Corn Carry- Out and Stock to Use Estimated elaboration (MMT) Ending stock Stock to Use 13.60% 13.30% 13.21% 13.17% 13.18% 13.15% 13.15% 13.06% 13.93% 13.81% 13.74% 13.71% 13.80% 13.79% 3.00% % % % % % FEB MAR source : Grain Supply/Demand APR MAY June July Aug Sep Oct Nov Dec Jan Feb 39 March
40 40
41 IV מחירים 41
42 Soy complex (weekly) /11/ /09/ /06/ /04/ /02/ /01/ /29/ /25/ /23/ /22/ /20/ /18/ /16/ /12/ /11/ /09/ /07/ /05/ /03/ /30/ /28/ /26/ /25/ /23/ /20/ /18/ /16/ /14/ /13/ /11/ /09/ /05/ /03/ /01/ /30/ /28/ /24/ /23/ /21/ /19/ /17/ /15/ /11/ /10/ /08/ /06/ /04/ /02/ /30/ /24/ /22/ /20/ /17/ /14/ /13/ /11/ /09/ /07/2002 Soybean Meal US$/MT Soybean US$/MT Soybean Oil US$/MT
43 /11/ /24/ /09/ /23/ /08/ /21/ /04/ /19/ /03/ /18/ /01/ /15/ /30/ /14/ /29/ /13/ /26/ /10/ /25/ /09/ /22/ /07/ /21/ /06/ /20/ /02/ /17/ /01/ /16/ /31/ /13/ /28/ /12/ /27/ /11/ /23/ /08/ /23/ /07/ /20/ /31/ /15/ /30/ /14/ /27/ /11/ /26/2002 Corn July 2012 (weekly)
44 44 Soybean / Corn Spread /11/ /02/ /23/ /14/ /05/ /27/ /18/ /07/ /29/ /20/ /11/ /01/ /22/ /13/ /04/ /26/ /17/ /06/ /28/ /19/ /11/ /02/ /22/ /14/ /05/ /27/ /18/ /09/ /29/ /20/ /11/ /02/ /24/ /13/ /04/ /26/ /17/ /08/ /28/ /19/ /10/ /02/ /23/ /13/ /31/ /22/ /13/ /04/ /24/ /15/ /06/ /28/2002
45 45 Soybean meal /Corn Spread /11/ /02/ /23/ /14/ /05/ /27/ /18/ /07/ /29/ /20/ /11/ /01/ /22/ /13/ /04/ /26/ /17/ /06/ /28/ /19/ /11/ /02/ /22/ /14/ /05/ /27/ /18/ /09/ /29/ /20/ /11/ /02/ /24/ /13/ /04/ /26/ /17/ /08/ /28/ /19/ /10/ /02/ /23/ /13/ /31/ /22/ /13/ /04/ /24/ /15/ /06/ /28/2002
46 46 JULY DEC Corn Spread /11/ /27/ /13/ /29/ /15/ /01/ /15/ /01/ /18/ /03/ /16/ /02/ /17/ /03/ /20/ /06/ /22/ /08/ /24/ /10/ /27/ /13/ /28/ /14/ /31/ /16/ /02/ /15/ /01/ /18/ /04/ /17/ /03/ /20/ /05/ /21/ /07/ /22/ /08/ /25/ /11/ /27/ /13/ /27/ /13/ /30/ /16/ /01/ /17/ /03/ /19/2010
47 /11/ /02/ /23/ /12/ /02/ /22/ /13/ /02/ /22/ /10/ /01/ /23/ /11/ /30/ /20/ /09/ /30/ /18/ /09/ /31/ /20/ /11/ /30/ /21/ /12/ /31/ /22/ /11/ /02/ /22/ /13/ /01/ /22/ /13/ /02/ /23/ /12/ /03/ /21/ /12/ /01/ /23/ /14/ /03/ /22/ /10/ /01/ /21/ /11/ /31/ /21/ /10/ /01/ /19/ /10/2010 JULY DEC Soybean Meal Spread
48 השוואה 2012/13 ל- 2008/9 48
49 US Soybean Supply and Use - US (acres/mb) / / / Est Acres Planted % Harvested Acres Harvested Average yield Carry-In Production Imports TOTAL SUPPLY 5 Crush Exports Seed Feed/Residual TOTAL USAGE 5 Ending Stocks Stocks-to Use %. %.5%. % 49
50 WORLD Soybeans Supply and Use, 12/13 08/09 09/10 Est BEGINNING STOCKS South America U.S World PRODUCTION South America U.S World IMPORTS.. 5. Thereof China Domestic Usage Thereof China China as % Domestic Thereof US Rest of the World EXPORTS ENDING STOCKS South America U.S China Other World Stocks to Use %. % 5.5%. % 50
51 51 הובלה ימית

52 Dry bulk Indexes 52

53 Dry bulk Indexes 53
54 54

55 Thank you!! 55
Market Outlook. David Reinbott.
 Market Outlook David Reinbott Agriculture Business Specialist P.O. Box 187 Benton, MO 63736 (573) 545-3516 http://extension.missouri.edu/scott/agriculture.aspx reinbottd@missouri.edu Trending Issues Volatile
Crop Market Outlook 8/22/2017
 MSU is an affirmativeaction, equal-opportunity employer. Michigan State University Extension programs and materials are open to all without regard to race, color, national origin, gender, gender identity,
Wheat Marketing Situation
 Wheat Marketing Situation Prepared by: Darrell L. Hanavan Executive Director Colorado Wheat Administrative Committee If you would like to receive an email when this report is updated, email gmostek@coloradowheat.org
2017 Risk and Profit Conference Breakout Session Presenters. 13. Ethanol and Biodiesel Market and Profitability Prospects
 2017 Risk and Profit Conference Breakout Session Presenters 13. Ethanol and Biodiesel Market and Profitability Prospects Dan O Brien Daniel O Brien was raised on a grain and livestock
Commercial-in-Confidence Ashton Old Baths Financial Model - Detailed Cashflow
 Year 0 1 2 3 4 5 6 7 8 9 10 11 12 13 Oct-16 Nov-16 Dec-16 Jan-17 Feb-17 Mar-17 Apr-17 May-17 Jun-17 Jul-17 Aug-17 Sep-17 Oct-17 2,038 2,922 4,089 4,349 6,256 7,124 8,885 8,885 8,885 8,885 8,885 8,885 9,107
SOYBEAN OUTLOOK Midwest & Great Plains/Western Extension Summer Outlook Conference. St. Louis, Missouri
 SOYBEAN OUTLOOK 2014 Midwest & Great Plains/Western Extension Summer Outlook Conference St. Louis, Missouri Jim Hilker Department of Agricultural, Food, And Resource Economics Michigan State University
Strong Global Grain Production Isn t Good Enough. David Hightower The Hightower Report
 Strong Global Grain Production Isn t Good Enough David Hightower The Hightower Report Big Picture Factors Cost of Production Pricing Not a downtrend signal Goldman $20 oil Forecast was wrong 8.9 mbd!
2019 Grain Update December 4, 2018
 2019 Grain Update December 4, 2018 Orange Juice (Jan '19) Live Cattle (Dec '18) S&P 500 E-Mini (Dec '18) Dow Indu 30 E-Mini (Dec '18) Cotton #2 (Dec '18) U.S. Dollar Index (Dec '18) Wheat (Dec '18) Nasdaq
Advance Trading, Inc. Supply/Demand Summary
 Advance Trading, Inc. Supply/Demand Summary Corn Planted Acres 88.0 94.0 90.2 90.2 0.0 88.0 88.0 0.0 % Harvested 91.8% 92.2% 91.7% 91.7% 91.7% 91.7% Harvested Acres 80.8 86.7 82.7 82.7 0.0 80.7 80.7 0.0
US biofuel Indicators and a changing market dynamic
 US biofuel Indicators and a changing market dynamic Seth Meyer AMIS October 1-2, 13, Rome Movement of Ag and Energy Ethanol production and capacity 16 35 Crude oil and maize prices 14 3 billion gallons
2017 SC Producers Whole Farm Revenue Protection Expected Price Justification
 2017 SC Producers Whole Farm Revenue Protection Expected Price Justification RMA Projected Expected As of Average Futures Price Close As of RMA Projected Prices 4 Feb 2011 2015 % Differ 4 Feb Crop Contract
World Wheat Supply and Demand Situation
 World Wheat Supply and Demand Situation November 218 Major data source: USDA World Agricultural Supply and Demand Estimates released November, 218. Projections will change over the course of the year depending
World Wheat Supply and Demand Situation
 World Wheat Supply and Demand Situation September 218 Major data source: USDA World Agricultural Supply and Demand Estimates released September 12, 218. Projections will change over the course of the year
COMPARISON OF FIXED & VARIABLE RATES (25 YEARS) CHARTERED BANK ADMINISTERED INTEREST RATES - PRIME BUSINESS*
 CHARTERED BANK ADMINISTERED INTEREST RATES - PRIME BUSINESS*") COMPARISON OF FIXED & VARIABLE RATES (25 YEARS) 2 Fixed Rates Variable Rates For Internal Use Only. FIXED RATES OF THE PAST 25 YEARS AVERAGE RESIDENTIAL MORTGAGE LENDING RATE - 5 YEAR* (Per cent) Year
COMPARISON OF FIXED & VARIABLE RATES (25 YEARS) 2 Fixed Rates Variable Rates For Internal Use Only. FIXED RATES OF THE PAST 25 YEARS AVERAGE RESIDENTIAL MORTGAGE LENDING RATE - 5 YEAR* (Per cent) Year
COMPARISON OF FIXED & VARIABLE RATES (25 YEARS) CHARTERED BANK ADMINISTERED INTEREST RATES - PRIME BUSINESS*
 CHARTERED BANK ADMINISTERED INTEREST RATES - PRIME BUSINESS*") COMPARISON OF FIXED & VARIABLE RATES (25 YEARS) 2 Fixed Rates Variable Rates FIXED RATES OF THE PAST 25 YEARS AVERAGE RESIDENTIAL MORTGAGE LENDING RATE - 5 YEAR* (Per cent) Year Jan Feb Mar Apr May Jun
COMPARISON OF FIXED & VARIABLE RATES (25 YEARS) 2 Fixed Rates Variable Rates FIXED RATES OF THE PAST 25 YEARS AVERAGE RESIDENTIAL MORTGAGE LENDING RATE - 5 YEAR* (Per cent) Year Jan Feb Mar Apr May Jun
Rudi Swanepoel. Fax:
 Commodity Future CME CORN FUURES Main Board Close Change Last Change CME Corn Sep'12 7971/4 71/2 7961/4-1 CME Corn Dec'12 7981/2 73/4 7971/4-11/4 CME Corn Mar'13 8011/2 63/4 8001/4-11/4 CME Corn May'13
Fundamentals Driving U.S. Agricultural Prosperity
 Fundamentals Driving U.S. Agricultural Prosperity Chris Hurt Purdue Extension Service March 2013, hurtc@purdue.edu Economic Shock Transition to New-Equilibrium 250 Hypothetical 29 Year Cycle: Index Base
World Wheat Supply and Demand Situation October 2018
 World Wheat Supply and Demand Situation October 218 Major data source: USDA World Agricultural Supply and Demand Estimates released October 12, 218. Projections will change over the course of the year
World Wheat Supply and Demand Situation December 2018
 World Wheat Supply and Demand Situation December 218 Major data source: USDA World Agricultural Supply and Demand Estimates released December 11, 218. Projections will change over the course of the year
World Wheat Supply and Demand Situation March 2018
 World Wheat Supply and Demand Situation March 218 Major data source: USDA World Agricultural Supply and Demand Estimates released March 8, 218. Projections will change over the course of the year depending
World Wheat Supply and Demand Situation August 2018
 World Wheat Supply and Demand Situation August 218 Major data source: USDA World Agricultural Supply and Demand Estimates released August 1, 218. Projections will change over the course of the year depending
Rice Outlook Slide Show U.S. and World August 10, 2017
 Rice Outlook Slide Show U.S. and World August 10, 2017 Bobby Coats, Ph.D. Professor Economics Department of Agricultural Economics and Agribusiness Division of Agriculture Cooperative Extension Service
Rudi Swanepoel. Fax:
 Commodity Future CME CORN FUURES Main Board Month Close Change Last Change CME Corn Sep'13 4811/2 163/4 4781/4-31/4 CME Corn Dec'13 4721/4 17 4691/4-3 CME Corn Mar'14 4841/2 161/4 4821/2-2 CME Corn May'14
What Does the March Prospective Plantings Report Mean for the Outlook? Chris Hurt & Corinne Alexander
 What Does the March Prospective Plantings Report Mean for the 2014-2015 Outlook? Chris Hurt & Corinne Alexander hurtc@purdue.edu cealexan@purdue.edu Purdue University April 1, 2014" Webinar: April 1, 2014
Major Junctions Ahead Energy, Grains and Metals. David Hightower President, The Hightower Report
 Major Junctions Ahead Energy, Grains and Metals David Hightower President, The Hightower Report 30 25 23.55 2018 Commodity Performance - Annual Percent Change 20 16.49 15 10 10.09 6.44 5 0 0.24-5 -10-15
External Market Factors Impacting US Soybean Meal
 External Market Factors Impacting US Soybean Meal USSEC Luncheon International Production and Processing Expo January 3, 213 Atlanta, GA Paul Smolen Presentation Objectives Examine the economic drivers
Rice Outlook U.S. and World February 9, 2017
 Rice Outlook U.S. and World February 9, 217 Bobby Coats, Ph.D. Professor Economics Department of Agricultural Economics and Agribusiness Division of Agriculture University of Arkansas System 51.671.21
Rudi Swanepoel. Fax:
 Commodity Future CME CORN FUURES Main Board Month Close Change Last Change CME Corn May'13 6511/4 21/4 654 23/4 CME Corn Jul'13 6331/2 1 6353/4 21/4 CME Corn Sep'13 567 1/4 5671/2 1/2 CME Corn Dec'13 544
Soybean and Oilseed Meal Import Prospects Higher as Severe Weather Damages EU Crops
 Million Tons Million Tons Million Tons United States Department of Agriculture Foreign Agricultural Service August 2018 Soybean and Oilseed Meal Import Prospects Higher as Severe Weather Damages EU Crops
Early-Season U.S. Soybean Meal Sales Surge
 United States Department of Agriculture Foreign Agricultural Service November 2014 Early-Season U.S. Soybean Meal Sales Surge U.S. soybean meal export commitments (accumulated exports plus outstanding
THIS REPORT CONTAINS ASSESSMENTS OF COMMODITY AND TRADE ISSUES MADE BY USDA STAFF AND NOT NECESSARILY STATEMENTS OF OFFICIAL U.S.
 THIS REPORT CONTAINS ASSESSMENTS OF COMMODITY AND TRADE ISSUES MADE BY USDA STAFF AND NOT NECESSARILY STATEMENTS OF OFFICIAL U.S. GOVERNMENT POLICY Required Report - public distribution Date: GAIN Report
Growing Soybean Oil Price Raises Oil s Contribution to Total Soybean Value
 United States Department of Agriculture Foreign Agricultural Service Circular Series FOP 10-07 October 2007 Growing Soybean Oil Price Raises Oil s Contribution to Total Soybean Value Relative Share Value:
PNS Soybean Workgroup
 PNS Soybean Workgroup 12 April 2016 Nico Hawkins General Manager Supply & Demand (National vs. International) Soybean: Supply and dem and (RSA vs International) SAGIS NAMC (S&D) International (USDA) Marketing
2017/18 Cotton Outlook
 217/1 Cotton Outlook 217 Ag Econ In service Training Dr. S. Aaron Smith, Assistant Professor, Department of Agricultural and Resource Economics, University of Tennessee https://ag.tennessee.edu/arec/pages/cropeconomics.aspx
The Outlook for Biofuels
 PRX BlueSky Outlook, Page 1 The Fertilizer Institute Fertilizer Outlook and Technology Conference The Outlook for Biofuels November 6, 2007 Ross Korves Economic Policy Analyst The ProExporter Network ross.korves@proexporter.com
Up and Down Months of the Stock Market
 Up and Down Months of the Stock Market 1926-2017 Positive years (66) in the stock market were not good all year long and losing years (24) were not losers throughout the year. Winning years produce losing
Canola Weekly. Index. WCE May/07 Canola Jul 9-Aug 14-Sep 20-Oct 27-Nov 4-Jan 8-Feb 16-Mar
 March 2, 2 Canola Weekly Index ) Canola Steady Despite Weak Soy Complex 2) Slow Crush Improves Canola Oil Basis ) Export Demand Underpins Canola Last week, we mentioned that May canola had key support
Port Botany. Trade Statistics Bulletin 1 July June 2018
 Port Botany Trade Statistics Bulletin 1 July 2017 30 June 2018 FY 2017/18 Port Botany Container Trade Jul 2017 Aug 2017 Sep 2017 Oct 2017 Nov 2017 Dec 2017 Jan 2018 Feb 2018 Mar 2018 Apr 2018 May 2018
PNS Soybean Workgroup
 PNS Soybean Workgroup 2 February 2017 Nico Hawkins General Manager Supply & Demand (National vs. International) SAGIS NAMC (S&D) International (USDA) Mar - Feb Final Projection: 2015/16 (c) 2016/17 (c)
Biofuels: Implications for Prices and Production. Darrel L. Good and Scott H. Irwin
 Biofuels: Implications for Prices and Production Darrel L. Good and Scott H. Irwin Why Ethanol? Convert relatively abundant domestic sources of energy into a substitute for imported petroleum Energy Conversion
Drought in South America to Limit Soybean Exports
 United States Department of Agriculture Foreign Agricultural Service Circular Series FOP 2-09 ruary 2009 Drought in South America to Limit Soybean Exports Million Tons 16 14 12 10 8 6 4 2 Annual Change
China Soybean Imports Stagnant Despite Record Consumption as Production Rebounds
 United States Department of Agriculture Foreign Agricultural Service Circular Series FOP 9-08 tember 2008 China Soybean Stagnant Despite Record Consumption as Rebounds Million Tons 60 50 40 30 20 10 0
Technical Corn Oil Review December 2017
 Technical Corn Oil Review December 2017 Brian Engel GM, Vegetable Oil Trading Green Plains Inc. NASDAQ: GPRE www.gpreinc.com Green Plains Partners LP NASDAQ: GPP www.greenplainspartners.com Corn Kernel
Weak Real to Boost Brazil s Soybean Exports in 2016
 United States Department of Agriculture Foreign Agricultural Service October 2015 Weak Real to Boost Brazil s Soybean Exports in 2016 Brazil s exchange rate is having a significant impact on domestic and
Sorghum Forum. 6 November Nico Hawkins General Manager
 Sorghum Forum 6 November 2015 Nico Hawkins General Manager Supply & demand (National vs. International) Marketing year: Mar - Feb SAGIS NAMC (S&DEC) International (IGC) Actual 2014/15 Projection: 2015/16
CURRENT AGRICULTURAL INDUSTRIAL REPORTS
 CURRENT AGRICULTURAL INDUSTRIAL REPORTS USDA Agricultural Outlook Forum Troy Joshua, Chief Environmental, Economics, and Demographics Branch 2/20/2015 10:26 AM 1 Objectives Discuss the history of the Current
Soybean Oil Prices Diverge on Different Supply Situations
 United States Department of Agriculture Foreign Agricultural Service Circular Series FOP 10-09 October 2009 Soybean Oil Prices Diverge on Different Supply Situations Soybean Oil Price ($/ton) $900 $850
China s Rapeseed Meal Imports Rise as Seed Imports Decline
 United States Department of Agriculture Foreign Agricultural Service February 2017 China s Rapeseed Meal Rise as Seed Decline Trend in China Rapeseed 12-Month Moving Totals Trend In China Rapeseed Meal
THIS REPORT CONTAINS ASSESSMENTS OF COMMODITY AND TRADE ISSUES MADE BY USDA STAFF AND NOT NECESSARILY STATEMENTS OF OFFICIAL U.S.
 THIS REPORT CONTAINS ASSESSMENTS OF COMMODITY AND TRADE ISSUES MADE BY USDA STAFF AND NOT NECESSARILY STATEMENTS OF OFFICIAL U.S. GOVERNMENT POLICY Required Report - public distribution Oilseeds and Products
2007 AAEA Livestock Outlook Symposium
 27 AAEA Livestock Outlook Symposium Ron Plain Professor of Agricultural Economics University of Missouri-Columbia www.ssu.missouri.edu/faculty/rplain Hog Price Outlook Production Efficiency 1 Head 9.5
Brazil s Soybean Oil Exports Squeezed by Rising Biodiesel Demand
 United States Department of Agriculture Foreign Agricultural Service Circular Series FOP 6-09 e 2009 Brazil s Soybean Oil Exports Squeezed by Rising Biodiesel Demand Soybean Oil Exports and Industrial
Regional Vegetable Oil Situation: Cut in Sun Oil Production, Imports Leaves North Africa & the Middle East Looking for Soy & Palm Oil to Fill Demand
 United States Department of Agriculture Foreign Agricultural Service Circular Series FOP 09-07 tember 2007 Regional Vegetable Oil Situation: Cut in Sun Oil, Leaves North Africa & the Middle East Looking
TOOL #5: C&S WASDE PRICE STUDY FOR DECEMBER CORN 7/09/10 For the July 9 th to the August 12 th time frame for CZ 2010
 TOOL #5: C&S WASDE PRICE STUDY FOR DECEMBER CORN 7/09/10 For the July 9 th to the August 12 th time frame for CZ 2010 Brief summary: In the month ahead, my best estimate is that CZ 2010 could trade in
Devaluation Energizes Argentine Soybean Crush
 United States Department of Agriculture Foreign Agricultural Service March 2016 Devaluation Energizes Argentine Soybean Crush Argentina Quarterly Soybean Crush Volume Exchange Rate* and Constant Dollar
Economic and Commodity Market Outlook
 Economic and Commodity Market Outlook August 12, 2016 By Robert Coats, Ph.D. Professor Economics Department of Agricultural Economics and Agribusiness Division of Agriculture University of Arkansas System
China s Global Peanut Export Share Declines
 United States Department of Agriculture Foreign Agricultural Service Circular Series FOP 07-13 China s Global Peanut Export Share Declines U.S. 10% Others 19% Argentina 17% U.S. 11% Others 16% Argentina
China 2017/18 Soybean Imports Soar on Appetite for Pork, Aquaculture, and Dairy
 United States Department of Agriculture Foreign Agricultural Service June 2017 China Soybean Soar on Appetite for Pork, Aquaculture, and Dairy China: Booming Farmed Aquaculture Production China: Record
2016/17 Global Olive Oil Production Down But Prices Stabilize
 United States Department of Agriculture Foreign Agricultural Service November 2016 Global Olive Oil Down But Prices Stabilize Global Olive Oil and Stocks 4000 3500 5000 Extra Virgin Olive Oil Prices Stabilizing
Port Botany Trade Statistics Bulletin. 1 July April 2017
 Port Botany Trade Statistics Bulletin 1 July 2016 30 April 2017 YTD April 2017 Port Botany Container Trade Jul 2016 Aug 2016 Sep 2016 Oct 2016 Nov 2016 Dec 2016 Jan 2017 Feb 2017 Mar 2017 Apr 2017 Export
As China s Soybean Oil Imports Fall, Production Expands
 United States Department of Agriculture Foreign Agricultural Service Circular Series FOP 10-10 October 2010 As China s Soybean Oil Fall, Expands 12 10 Million Metric Tons 8 6 4 2 0 2006/07 2007/08 China
Sunflower & Soybean Forum
 Sunflower & Soybean Forum 11 October 2017 Nico Hawkins General Manager Sunflower Sunflower: Supply & Demand National vs. International Marketing season SAGIS NAMC (S&D) International (USDA) Marketing year
U.S. Soybeans Facing Stiff Competition from Brazil. Brazil Soybean Export Price (Dollars and Reals) and Exchange Rate
 and Exchange Rate") United States Department of Agriculture Foreign Agricultural Service June, 2018 U.S. Soybeans Facing Stiff Competition from Brazil Brazil Soybean Export Price (Dollars and Reals) and Exchange Rate FOB
United States Department of Agriculture Foreign Agricultural Service June, 2018 U.S. Soybeans Facing Stiff Competition from Brazil Brazil Soybean Export Price (Dollars and Reals) and Exchange Rate FOB
It s time to start buying propane for fall Expect to pay more to dry 2017 corn crop By Bryce Knorr, senior grain market analyst
 It s time to start buying propane for fall Expect to pay more to dry 2017 corn crop By Bryce Knorr, senior grain market analyst It s the end of winter hopefully and that means it s a good time to buy coats,
Sorghum Forum. 4 November Nico Hawkins General Manager
 Sorghum Forum 4 November 2016 Nico Hawkins General Manager Sorghum: Supply & demand (National vs. International Marketing season) SAGIS NAMC (S&DEC) International (IGC) Marketing year: Mar - Feb Sep -
Argentine Exporters Switch to Soybean Oil as Biodiesel Exports Fall
 United States Department of Agriculture Foreign Agricultural Service Circular Series FOP 08-13 Argentine Exporters Switch to Soybean Oil as Biodiesel Exports Fall Argentina s soybean oil exports have surged
U.S. Soybean Exports Forecast to Reach Record
 United States Department of Agriculture Foreign Agricultural Service July 2017 U.S. Soybean Exports Forecast to Reach Record 60 Accumulated Exports by Week Total Commitments of Soybeans as of End of June
Sharp Decline in Vegetable Oil Stocks Leads to Steeply Higher Prices
 United States Department of Agriculture Foreign Agricultural Service Circular Series FOP 1-11 Sharp Decline in Vegetable Oil Leads to Steeply Higher Prices Commodity prices have been on an upward trend
Groundnut Forum. 18 February Nico Hawkins General Manager
 Groundnut Forum 18 February 2016 Nico Hawkins General Manager Supply & Demand (National vs. International) SAGIS Grain SA International (USDA) Marketing year Final Projection Estimate Projection Mar -
Indian Soybean Meal Exports Unlikely to Recover in 2015/16
 United States Department of Agriculture Foreign Agricultural Service November 2015 Indian Soybean Meal Exports Unlikely to Recover in Though once a significant regional exporter of soybean meal, India
Drought Forecast to Reduce Australian Rapeseed Exports in 2007
 United States Department of Agriculture Foreign Agricultural Service Circular Series FOP 11-06 November 2006 Drought Forecast to Reduce Australian Rapeseed Exports in 2007 1800 1600 1400 1200 1000 800
2016 U.S. ETHANOL EXPORTS AND IMPORTS
 2016 U.S. ETHANOL EXPORTS AND IMPORTS STATISTICAL SUMMARY Copyright 2017 Renewable Fuels Association. All Rights Reserved 2016 U.S. ETHANOL EXPORTS U.S. Ethanol Exports, 2006-2016 1,200 1,000 800 600 396
Palm and Soy Oil Use Expands at Expense of Other Oils
 United States Department of Agriculture Foreign Agricultural Service September 2015 Revised on September 15, 2015 Palm and Soy Oil Use Expands at Expense of Other Oils As global demand for vegetable oil
Share of Brazil s Soybean Exports to China Spikes in August
 United States Department of Agriculture Foreign Agricultural Service September 2018 Share of Brazil s Soybean Exports to China Spikes in August Monthly Share of Brazil's Soybean Exports to China 85% 75%
India. Oilseeds and Products Update. February 2012
 THIS REPORT CONTAINS ASSESSMENTS OF COMMODITY AND TRADE ISSUES MADE BY STAFF AND NOT NECESSARILY STATEMENTS OF OFFICIAL U.S. GOVERNMENT POLICY Required Report - public distribution India Oilseeds and Products
Global Monthly March 2019
 Global Monthly March 19 Percent of world bonds outstanding 3 5 15 5 Jan-1 Jun-1 Nov-1 Apr-15 Sep-15 Feb-1 Jul-1 Dec-1 May-17 Oct-17 Mar-1 Aug-1 Dec-1 Mar-19 March 19 Percent, year-on-year 7 5 3 1 1Q1 1Q
Pakistan Oilseed Processors Seize Opportunity to Crush Soybeans
 United States Department of Agriculture Foreign Agricultural Service December 2015 Pakistan Oilseed Processors Seize Opportunity to Crush Soybeans Pakistan, long an importer of soybean meal, is transitioning
CHARTS AND PRICE PROJECTIONS
 CHARTS AND PRICE PROJECTIONS 18 / Charts and Price Projections: FAPRI 27 Agricultural Outlook Average Annual GDP Growth Percent Change 9 8 7 6 4 3 2 1 26-216 Canada China EU NMS EU- India Japan Latin America
The Global Oils & Fats Markets and Price Outlook 2014/15
 The Global Oils & Fats Markets and Price Outlook 214/15 Presentation there at POTS somebody Malaysia to pick in Kuala me up Lumpur tomorrow on at Oct 28-29, 214 the airport Thomas Mielke, Executive Director
China Tariffs Driving U.S. Soybean Exports To the European Union to a 30-Year High
 United States Department of Agriculture Foreign Agricultural Service March 2019 China Tariffs Driving U.S. Soybean Exports To the European Union to a 30-Year High 12-MONTH MOVING TOTAL U.S. SOYBEAN EXPORTS
India Soybean Meal Exports: Revised and Rebounding
 United States Department of Agriculture Foreign Agricultural Service January 2017 India Soybean Meal Exports: Revised and Rebounding India Soybean Meal Exports Forecast to Rise in 8.0 Data Series Comparison
Port Botany Trade Statistics Bulletin. 1 July May 2017
 Port Botany Trade Statistics Bulletin 1 July 2016 31 May 2017 YTD May 2017 Port Botany Container Trade Jul 2016 Aug 2016 Sep 2016 Oct 2016 Nov 2016 Dec 2016 Jan 2017 Feb 2017 Mar 2017 Apr 2017 May 2017
Soybean Prices Fall on Rising South American Production
 United States Department of Agriculture Foreign Agricultural Service April 2017 Soybean Prices Fall on Rising South American Production Million Tons Change in South America Soybean Production Forecast
U.S. Soybean Prices Fall as Buyers Focus Turns to South America
 United States Department of Agriculture Foreign Agricultural Service Circular Series FOP 2-10 ruary 2010 U.S. Soybean Prices Fall as Buyers Focus Turns to South America $11.00 Daily U.S. Soybean Cash Price
BioFuels Lessons Learned From Georgia
 The University of Georgia Center for Agribusiness and Economic Development College of Agricultural and Environmental Sciences BioFuels Lessons Learned From Georgia www.caed.uga.edu John McKissick, George
AOF Forum Oilseeds Outlook October, 2006
 AOF Forum Oilseeds Outlook October, 2006 Josh Roberts Senior Trading Manager Grain Pool Pty Ltd 30 Delhi Street West Perth Tel: +61 8 9237 9859 josh.roberts@grainpool.com.au Oilseeds trends versus other
Rising Coconut Oil Prices Foreshadow Tight Supplies in 2007
 United States Department of Agriculture Foreign Agricultural Service Circular Series FOP 2-07 ruary 2007 Rising Coconut Oil Prices Foreshadow Tight Supplies in 2007 800 Coconut Oil Price: CIF Rotterdam
Groundnut Forum. 15 February Nico Hawkins General Manager
 Groundnut Forum 15 February 2018 Nico Hawkins General Manager Groundnuts: Supply & Demand (National vs. International Marketing season) SAGIS Grain SA International (USDA) Marketing year Mar - Feb Sep
2018 Outlook for Grains and Oilseeds
 2018 Outlook for Grains and Oilseeds Present to the American Fats and Oils Associa;on October 2017 AdvancedEconomicSolu0ons US$ Declines from Peak - Now at lowest point since October 2015 Currently in
About Czarnikow. The Premier Provider of Sugar Market Services. Czarnikow has been in the sugar business since 1861
 About Czarnikow The Premier Provider of Sugar Market Services Czarnikow has been in the sugar business since 1861 Czarnikow is the leading professional services company in the sugar market Czarnikow has
Soybean Trade Growth: A Story of Brazil, the United States, and China
 United States Department of Agriculture Foreign Agricultural Service October 2017 Soybean Trade Growth: A Story of Brazil, the United States, and China 12-Month Soybean Export Growth Year Ending September
Dynamics of Cottonseed Oil Price
 Dynamics of Cottonseed Oil Price By Govindbhai G. Patel Managing Partner Cottonseed Conclave 2017 On 16 th December, 2017 At Ahmedabad (Gujarat) 1 India s Cotton Sowing Area (Figures in Lakh Ha.) During
Corn & Bean Producers-1
 Largest Corn Producing Countries - 2016 est. Largest Corn Importing Countries - 2016 est. (Marketing year - thousands of hectares, tons per hectare, and thousands of metric tons) (Marketing year - thousands
Monthly vfff Report on Oilseeds
 Page 1 Market Movements ahead Domestic Fundamentals: Soybean futures (May) S2 S1 Pivot R1 R2 3599 3671 3752 3824 3905 In days to come, we may see an upside momentum in soybean futures (May) as it can test
Explosive Growth in Vegetable Oil Demand Exacerbates Chinese Supply Deficit, Reliance on Imports. Imports
 United States Department of Agriculture Foreign Agricultural Service Circular Series FOP 12-07 ember 2007 Million tons 35 Explosive Growth in Vegetable Oil Demand Exacerbates Chinese Supply Deficit, Reliance
Strong Brazilian Soybean Sales Expected to Slow Rebound in Argentine Exports
 United States Department of Agriculture Foreign Agricultural Service December 2018 Strong Brazilian Soybean Sales Expected to Slow Rebound in Argentine Exports Oct. 1 - Nov. 30 Brazil Soybean Exports (Million
CHARTS AND PRICE PROJECTIONS
 CHARTS AND PRICE PROJECTIONS 18 / Charts and Price Projections: FAPRI 28 Agricultural Outlook Average Annual GDP Growth, 27-217 Percent Change 1 8 8.4 7.92 6 4 4.44 3.67 4.6 4.34 2 2.37 2.17 1.38 2.44
Cellulosic Biofuels and Energy Grasses Energy Policy Issues Committee March 21, 2012
 Cellulosic Biofuels and Energy Grasses Energy Policy Issues Committee March 21, 2012 Agenda Commercializing cellulosic biofuels in North Carolina Feedstock (Biomass) is key Chemtex International, M&G Group
History gives hope for wheat rally Be sure to reward $2 rally. By Bryce Knorr, Senior Grain Market Analyst
 History gives hope for wheat rally Be sure to reward $2 rally By Bryce Knorr, Senior Grain Market Analyst For years the wheat market stagnated waiting for a single trigger: A sharp reduction in global
/ PRELIMINARY STEEL IMPORTS INCREASE 2% IN MAY Import Market Share 23% in May
 News Release FOR IMMEDIATE RELEASE June 25, 2013 CONTACT Lisa Harrison 202.452.7115/ lharrison@steel.org PRELIMINARY STEEL IMPORTS INCREASE 2% IN MAY Import Market Share 23% in May Washington, D.C. Based
Total Production by Month (Acre Feet)
") Production by Month (acre-feet) 2008 2009 2010 2011 2012 2013 2014 2015 2016 January 25 339.10 228.90 249.50 297.99 243.06 327.14 247.66 212.37 February 234.00 218.80 212.10 241.52 245.82 279.08 234.16
Production by Month (acre-feet) 2008 2009 2010 2011 2012 2013 2014 2015 2016 January 25 339.10 228.90 249.50 297.99 243.06 327.14 247.66 212.37 February 234.00 218.80 212.10 241.52 245.82 279.08 234.16