2017/18 Cotton Outlook
|
|
|
- Dustin Carson
- 5 years ago
- Views:
Transcription
1 217/1 Cotton Outlook 217 Ag Econ In service Training Dr. S. Aaron Smith, Assistant Professor, Department of Agricultural and Resource Economics, University of Tennessee Overview Domestic (U.S.) Supply and Demand Tennessee Global Supply and Demand Price and Crop Insurance 21 Price Outlook 1
2 Recent Past Cotton Economic Factors Declining Demand High Stocks World and China High stocks were not as influential on price because the majority was held in China and the market knew that most of that was not going into the world pipeline. It was China s stocks policy that was important, not the actual stocks number. Declining US Acreage and Production Demand is Improving The New Dynamics of the Cotton Market China stocks have been reduced Massive stocks had less impact on prices than most imagined because China reduced area and production, cut imports, and utilized stocks in their mills 2 years of very good government reserve sales. Emergence of new export markets US has gained market share 2


3 U.S. Supply Increased production Growing domestic stocks
4 U.S. Upland Cotton Acres Planted and Harvested, Millions of Acres Harvested Planted 1% U.S. Upland Cotton Harvested to Planted Ratio, % Harvested to Planted Ratio (%) % 7% 6% 5% % % 2% Min 6% Max 97% Average 91% StDev 7% Abandonment in Texas drives domestic production 1% %

5 1 9 7 U.S. Upland Cotton Yield, US Yield = 7.666x R² =.5 Yield (lbs/acre) National yield increasing on average 7. lbs/acre/year

6 U.S. Cotton Production, Billions of Dollars $.7 $5.2 $2. $.6 $6.9 $6. $5. $.7 $.7 $.7 $ Millions of lb bales $ Bales 6

7 12 U.S. Cotton Marketing Year Ending Stocks Millions of lb. Bales Tennessee Acres up Near record yield 7
 Harvested Planted H/P Cotton Acres Planted In Tennessee, 217 (FSA")
8 Acres, 7, 6, 5,,, 2, 1, Tennessee Cotton Acres Planted and Harvested, % 9% 96% 9% 92% 9% % 6% % Harvested to Planted Ratio (%) Harvested Planted H/P Cotton Acres Planted In Tennessee, 217 (FSA Certified)
")
9 Tennessee Top 5 Planted Acres of Cotton, 217 (FSA Certified) 9
10 12 Tennessee Upland Cotton Yield, TN Yield = 7.756x +.9 R² =.5 Yield (lbs/acre) 6 2 Tennessee yield increasing 7.76 lbs/acre/year greater than the national average! Tennessee Cotton Production, Billions of Dollars $. $.16 $.1 $.15 $.2 $.7 $.26 $.16 $.15 $.9 $ Millions of lb bales $ Bales. 1


11 U.S. Demand Reliance on exports Millions of lb Bales U.S. cotton use moved from roughly 5/5 exports to domestic consumption to 7 5% exports in the early 2s U.S. Cotton Use,
12 25 U.S. Cotton Days on Hand [Ending Stocks/(Use/65)], Days on Hand Cotton Domestic Balance Sheet, USDA WASDE 217/1 Projected September 217/1 Projected October 217/1 Change From Previous Month Change 216/17 to 217/1 21/1 21/15 215/16 216/17 Est Planted and Harvested Acres & Yield Planted (Million Acres) Harvested (Million Acres) U.S. Yield (lbs/acre) Supply (Million Bales) Beg. Stocks Production Imports Total Supply Use & Ending Stocks (Million Bales) Domestic Exports Total Use U.S. Ending Stocks Foreign Stocks Chinese Stocks Price and Stocks to Use Ratio U.S. Avg. Price ($/lb) $.779 $.61 $.612 $.6 $.5-$.66 $.55-$.65 $. -$. U.S. Stocks/Use 17% 25% % 15% % 2% -.% 17.6% Chinese Stocks/Use 12% 197% 166% 129% 1% 1%.% -26.6% 12

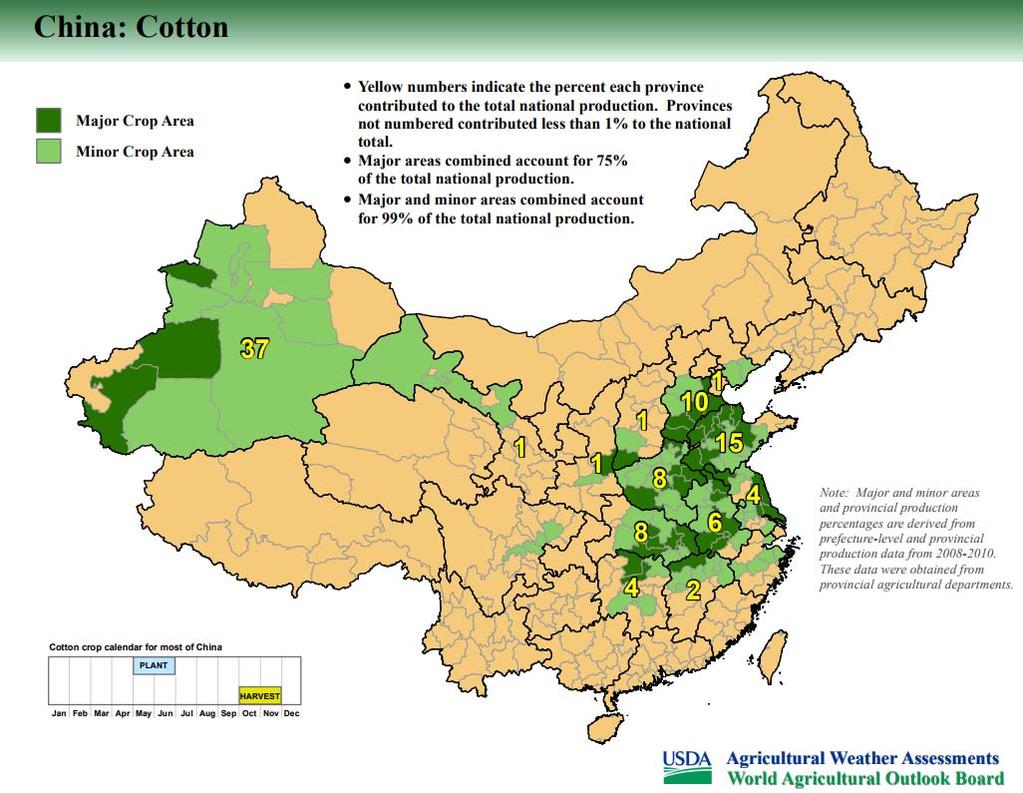
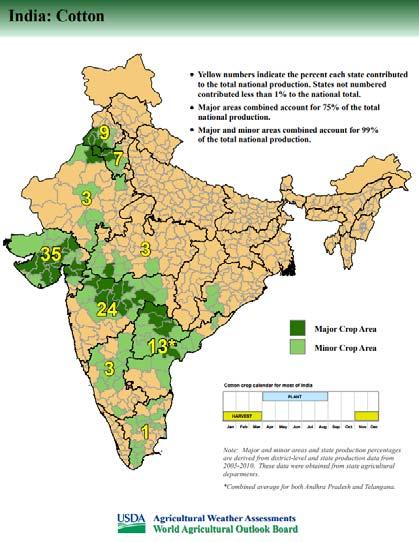
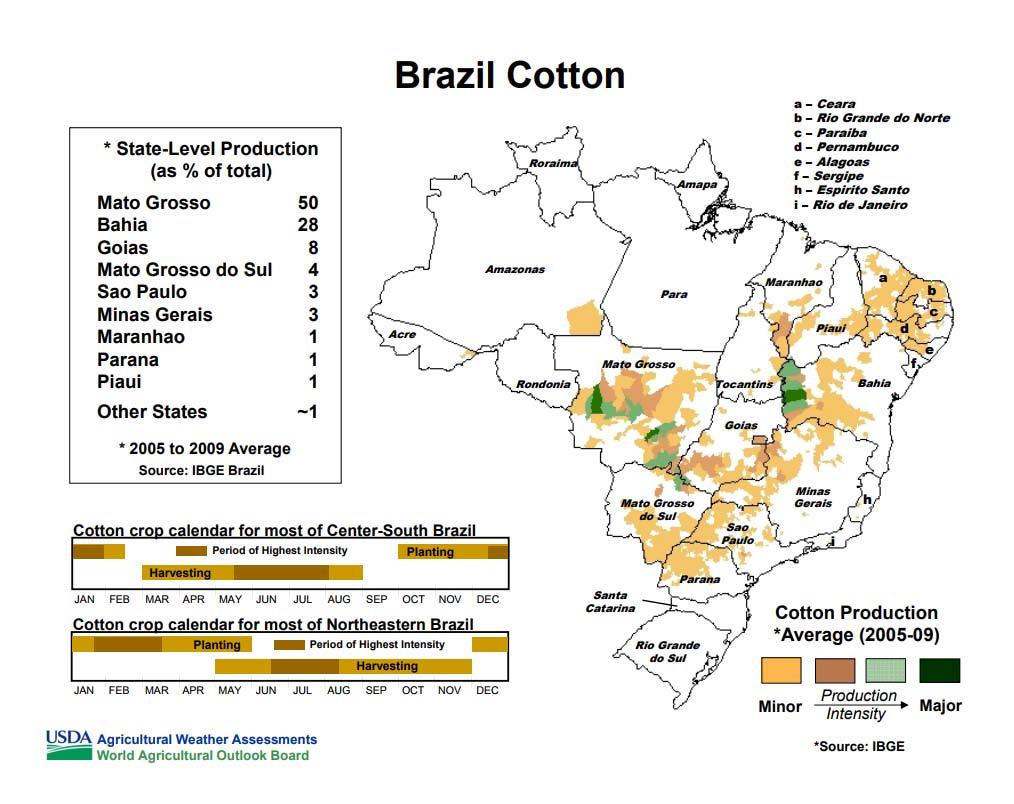
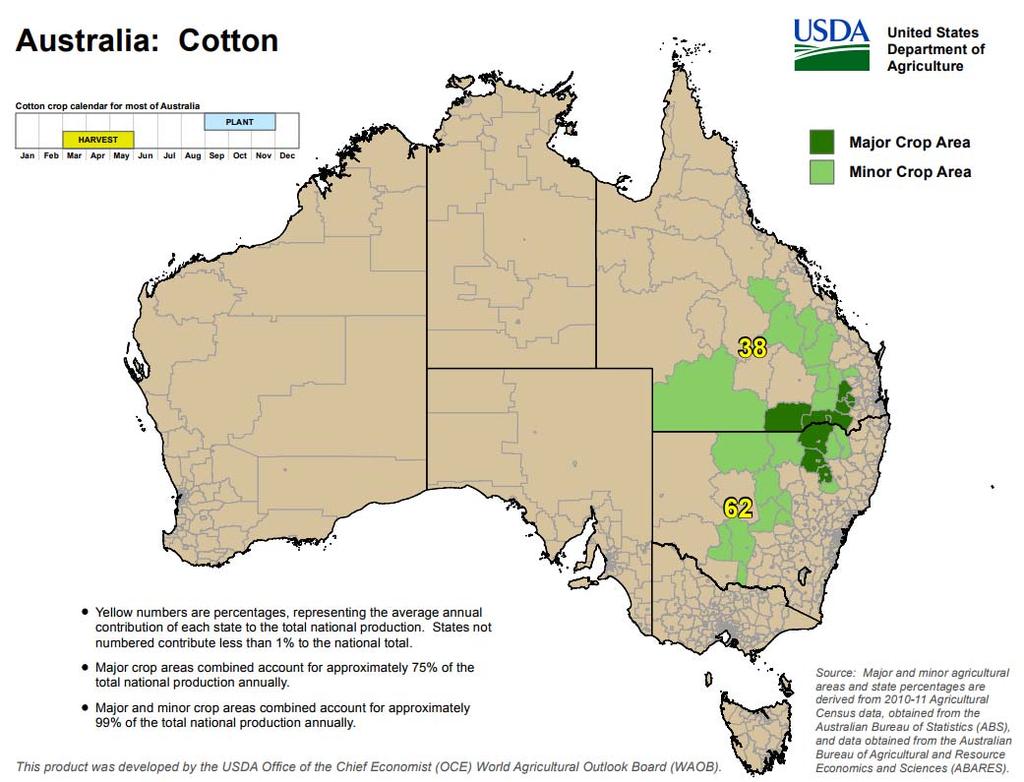
13 Global Supply & Demand Southeast asia 1 World Cotton Acres Harvested, Millions of Acres India United States China Pakistan Uzbekistan Brazil ROW 1
14 1 9 World Cotton Harvested Acres, Acres Harvested (millions) % Increase in Cotton Acres Harvested From 196 to 217. Corn 1%; Soybeans 2%; and Wheat 9% World Cotton Yields by Country(lbs/acre) Country 26 Yield 1 Year Average Yield 217/1 Yield Difference from 1 Year Average Australia 1,79 1,762 2,2 261 Brazil 1,2 1,297 1,7 China 1,159 1,27 1,52 25 India Pakistan United States World
15 15
16 16
, 26 217 India China ROW United States Pakistan Brazil Australia US share of world corn production has decreased from 21% in 26 to 17% in")

17 1 12 Global Cotton Production (millions of lb. bales), India China ROW United States Pakistan Brazil Australia US share of world corn production has decreased from 21% in 26 to 17% in 217. Millions of lb. Bales Millions of lb. Bales Global Cotton Production, Consumption, and Ending Stocks, Ending Stocks Production Domestic Consumption 17
18 Global Cotton Consumption Per Capita, lbs/person/year : 7.27 lbs/person/year Rise in use of synthetic fibers has limited cotton market expansion. 217: 7.5 lbs/person/year % U.S. Share of Global Cotton Exports, U.S. Share of Global Cotton Exports (%) 5% % 5% % 25% 2% 15% 1% 5% %
19 Millions of lb Bales Cotton Imports By Country (Millions of lb. Bales), China s share of global importers has decline from 5% in 211 to 1% in ROW Bangladesh Vietnam China Indonesia Turkey Pakistan India Millions of lb. Bales Cotton Exports by Country (Millions of lb. Bales), United States ROW India Australia Brazil Uzbekistan 19
20 Global Cotton Stocks by Country, Percent of global stocks held in China is down to % (peak of 61% in 21) Millions of lb. Bales China India Brazil United States ROW 6 "China's Gap" Consumption less Production, Production Domestic Consumption 5 Millions of Bales
![Cotton Global Days on Hand [Ending Stocks/(Consumption/65)], 26 217 Days on Hand 19 19 211 16 16 262 12 5 66 17 2 26 26 27 2 29 21 211 212 21 21 215 216 217 World Cotton Supply and Use (Million lb](/docs-images/85/91668135/images/21-0.jpg "Bales) 217/1 (October) Country / Region Beginning Stocks Production Imports Domestic Use Exports Loss Ending Stocks World 9.57 12.6.2 11.1.22. 92. US 2.75 21.12.1.5 1.5.2 5. Foreign 6.2 99.75.19 11.")
21 Cotton Global Days on Hand [Ending Stocks/(Consumption/65)], Days on Hand World Cotton Supply and Use (Million lb Bales) 217/1 (October) Country / Region Beginning Stocks Production Imports Domestic Use Exports Loss Ending Stocks World US Foreign Central Asia Afr. Fr. Zone Australia Brazil India Mexico China EU Turkey Pakistan Indonesia Thailand Bangladesh Vietnam ROW
22 Price and Crop Insurance Big push to get cotton back into commodity programs Continuous Nearby Cotton Futures Price and Marketing Year Average Price 211/12 $. 29/1 27/ $ /7 $.59 2/9 $.65 $.7 21/11 $ /1 $ /1 $ /15 $ /16 $ /17 $ /1 $.55 $.65 22
23 December Cotton Futures 7 Cents / lb Dec 1 Dec Jan 1 Mar 1 Mar Apr May 29 Jun 29 Jul 2 Aug 27 Sep 27 Oct 26 Nov Daily Cotton Spot Price Quotes (1 5), May 15, 217 Price cents per lb March 2, 216 Southeast North Delta US Average 2
24 Fiber Prices 27 Cents per Pound 25 A FE Index Asian Polyester Staple Source: NCC October Outlook Acres 1,, 1,6, 1,, 1,2, 1,,, 6,, 2, Tennessee Base, Planted, and Insured Acres 21: 26,12 acres of cotton planted on generic base 215: 157,5 acres of cotton planted on generic base Base Acres FSA Planted ('1 '16) NASS Planted ('1 '16) RMA Insured ('1 '16) 2


25 Tennessee Corn Crop Insurance Summary AVERAGE ANNUAL NUMBER OF CROP INSURANCE POLICIES PURCHASED BY INSURANCE PLAN FOR COTTON IN TENNESSEE, STAX, 19 ARP, 2 AYP, 5 RPHPE, YP CAT, 1,5 RP, 1,1 Number of Policies Revenue Protection Crop Insurance For Coton by Buy up Level Purchased in Tennessee, YP, 11 5% 55% 6% 65% 7% 75% % 5% Buy up AVERAGE ANNUAL NUMBER OF ACRES INSURED BY INSURANCE PLAN FOR COTTON IN TENNESSEE, STAX, 29 ARP, 92 RPHPE, 1 AYP, YP CAT, 65,1 Number of Policies Yield Protection Crop Insurance For Coton by Buy up Level Purchased in Tennessee, YP, 1,976 RP, 19,6 5% 55% 6% 65% 7% 75% % Buy up Price Outlook Production projected to exceed global demand again..but for how long. 25


26 Hurricane Harvey Texas 9. million bales Estimates, to, bales loss Hurricane Irma Georgia 2.7 million bales Estimated 1 to 2% loss, highly variable 26
27 Tennessee Considerations for 21 Old crop (217) Tennessee producers should take advantage of quality premiums Macro conditions and USD Export sales pace Harvest weather New crop (21) Domestic carry over will weigh on prices Planted acreage will be dictated by relative prices 27
28 21 Price Projections Source 21 Price CBOT $.69 CBO $.6 FAPRI $.6 WASDE $.55 $.65 Cotton - Net Return Table ($/acre) Assumes a cost of production of $65/acre Yield (lb/acre) , 1,5 1,1 1,15 1,2 6. (2) (2) (17) (1) (11) () (5) (2) (229) (199) (16) (1) (17) (76) (6) (15) (221) (19) (15) (127) (96) (6) () (2) (212) (1) (1) (116) () (5) (21) (2) (171) (1) (16) (7) (1) () (19) (161) (12) (95) (62) (29) (16) (152) (11) () (51) (17) Price 6.75 (177) (1) (1) (7) (9) (5) (cent/lb) 7. (16) (1) (9) (6) (2) (159) (12) () (5) (17) (151) (11) (7) (2) (6) (12) (15) (6) (1) (1) (96) (5) (21) (12) (6) () (1) (116) (77) () (17) (6) (2)
29 Soybean/Corn (s/c) Price Ratio Monthly U.S. Price Ratios Corn, Soybeans, and Upland Cotton, Price ratio is one out of three relative ratios to consider (price, yield, & cost) Cotton/Corn and Cotton/Soybean Price Ratio s/c ct/c ct/s Key Issues for 21 USDA numbers will reduce the crop but by how much Look to see if projected exports remain strong Will demand continue to improve? Crops in India, China, Australia Prices likely 6 to 7 cents (maybe 55 65) Cottonseed program still a possibility USDA may look to authorize CGCS Program for 217 and 21 Getting cotton back into commodity programs 29
30 Resources Crop Economics Webpage Market highlights Crop Budgets UT Crop Blog Quarterly Market Zoom Meeting (next one Nov ) Thank you Questions?
Monthly Economic Letter
 Monthly Economic Letter Cotton Market Fundamentals & Price Outlook RECENT PRICE MOVEMENT The global cotton market was volatile over the past month, with values for most benchmark prices moving strongly
Monthly Economic Letter
 Monthly Economic Letter Cotton Market Fundamentals & Price Outlook RECENT PRICE MOVEMENT Benchmark prices were flat or slightly higher over the past month. Prices for the May NY futures contract increased
Monthly Economic Letter
 Monthly Economic Letter Cotton Market Fundamentals & Price Outlook RECENT PRICE MOVEMENT All benchmark prices except the CC Index increased over the past month. Prices for the March NY futures contract
Monthly Economic Letter
 Monthly Economic Letter Cotton Market Fundamentals & Price Outlook RECENT PRICE MOVEMENT Global cotton prices were mostly stable over the past month, with NY futures, the A Index, and the CC Index virtually
Monthly Economic Letter
 Monthly Economic Letter Cotton Market Fundamentals & Price Outlook RECENT PRICE MOVEMENT Most cotton prices were stable over the past month. Chinese prices moved slightly higher. Indian prices moved slightly
Week Ending: Oct. 25, 2018
 Week Ending: Oct. 25, 2018 Market Page 1. Thurs. Close Last Thurs. Close Weekly Change Week's High Week's Low Life of Contract High Life of Contract Low NEW YORK COTTON FUTURES (Cents/Lb.) December-18
Market Outlook. David Reinbott.
 Market Outlook David Reinbott Agriculture Business Specialist P.O. Box 187 Benton, MO 63736 (573) 545-3516 http://extension.missouri.edu/scott/agriculture.aspx reinbottd@missouri.edu Trending Issues Volatile
Weak Real to Boost Brazil s Soybean Exports in 2016
 United States Department of Agriculture Foreign Agricultural Service October 2015 Weak Real to Boost Brazil s Soybean Exports in 2016 Brazil s exchange rate is having a significant impact on domestic and
Soybean Trade Growth: A Story of Brazil, the United States, and China
 United States Department of Agriculture Foreign Agricultural Service October 2017 Soybean Trade Growth: A Story of Brazil, the United States, and China 12-Month Soybean Export Growth Year Ending September
Crop Market Outlook 8/22/2017
 MSU is an affirmativeaction, equal-opportunity employer. Michigan State University Extension programs and materials are open to all without regard to race, color, national origin, gender, gender identity,
Week Ending: Dec. 8, 2016
 Week Ending: Dec. 8, 2016 Market Page 1. Thurs. Close Last Thurs. Close Weekly Change Week's High Week's Low Life of Contract High Life of Contract Low NEW YORK COTTON FUTURES (Cents/Lb.) March-17 71.42
Monthly Economic Letter
 Monthly Economic Letter Cotton Market Fundamentals & Price Outlook RECENT PRICE MOVEMENT NY futures experienced volatility in early April. Current values for all benchmark prices are flat to lower relative
Monthly Economic Letter
 Monthly Economic Letter Cotton Market Fundamentals & Price Outlook RECENT PRICE MOVEMENT Benchmark prices either increased or were stable over the past month. Prices for the May NY futures contract increased,
Monthly Economic Letter
 Monthly Economic Letter Cotton Market Fundamentals & Price Outlook RECENT PRICE MOVEMENT The A Index, NY Nearby, and Indian spot prices all increased over the past month. Chinese and Pakistani prices were
SOYBEAN OUTLOOK Midwest & Great Plains/Western Extension Summer Outlook Conference. St. Louis, Missouri
 SOYBEAN OUTLOOK 2014 Midwest & Great Plains/Western Extension Summer Outlook Conference St. Louis, Missouri Jim Hilker Department of Agricultural, Food, And Resource Economics Michigan State University
Sharp Decline in Vegetable Oil Stocks Leads to Steeply Higher Prices
 United States Department of Agriculture Foreign Agricultural Service Circular Series FOP 1-11 Sharp Decline in Vegetable Oil Leads to Steeply Higher Prices Commodity prices have been on an upward trend
Indian Soybean Meal Exports Unlikely to Recover in 2015/16
 United States Department of Agriculture Foreign Agricultural Service November 2015 Indian Soybean Meal Exports Unlikely to Recover in Though once a significant regional exporter of soybean meal, India
Pakistan Oilseed Processors Seize Opportunity to Crush Soybeans
 United States Department of Agriculture Foreign Agricultural Service December 2015 Pakistan Oilseed Processors Seize Opportunity to Crush Soybeans Pakistan, long an importer of soybean meal, is transitioning
Early-Season U.S. Soybean Meal Sales Surge
 United States Department of Agriculture Foreign Agricultural Service November 2014 Early-Season U.S. Soybean Meal Sales Surge U.S. soybean meal export commitments (accumulated exports plus outstanding
Argentine Exporters Switch to Soybean Oil as Biodiesel Exports Fall
 United States Department of Agriculture Foreign Agricultural Service Circular Series FOP 08-13 Argentine Exporters Switch to Soybean Oil as Biodiesel Exports Fall Argentina s soybean oil exports have surged
China s Global Peanut Export Share Declines
 United States Department of Agriculture Foreign Agricultural Service Circular Series FOP 07-13 China s Global Peanut Export Share Declines U.S. 10% Others 19% Argentina 17% U.S. 11% Others 16% Argentina
U.S. Soybeans Facing Stiff Competition from Brazil. Brazil Soybean Export Price (Dollars and Reals) and Exchange Rate
 and Exchange Rate") United States Department of Agriculture Foreign Agricultural Service June, 2018 U.S. Soybeans Facing Stiff Competition from Brazil Brazil Soybean Export Price (Dollars and Reals) and Exchange Rate FOB
United States Department of Agriculture Foreign Agricultural Service June, 2018 U.S. Soybeans Facing Stiff Competition from Brazil Brazil Soybean Export Price (Dollars and Reals) and Exchange Rate FOB
Growing Soybean Oil Price Raises Oil s Contribution to Total Soybean Value
 United States Department of Agriculture Foreign Agricultural Service Circular Series FOP 10-07 October 2007 Growing Soybean Oil Price Raises Oil s Contribution to Total Soybean Value Relative Share Value:
Soybean Oil Prices Diverge on Different Supply Situations
 United States Department of Agriculture Foreign Agricultural Service Circular Series FOP 10-09 October 2009 Soybean Oil Prices Diverge on Different Supply Situations Soybean Oil Price ($/ton) $900 $850
Coconut Oil Prices Spike
 United States Department of Agriculture Foreign Agricultural Service Coconut Oil Prices Spike Coconut oil prices have surged over the past year in contrast to the general downward trend in other vegetable
Drought in South America to Limit Soybean Exports
 United States Department of Agriculture Foreign Agricultural Service Circular Series FOP 2-09 ruary 2009 Drought in South America to Limit Soybean Exports Million Tons 16 14 12 10 8 6 4 2 Annual Change
China s Rapeseed Meal Imports Rise as Seed Imports Decline
 United States Department of Agriculture Foreign Agricultural Service February 2017 China s Rapeseed Meal Rise as Seed Decline Trend in China Rapeseed 12-Month Moving Totals Trend In China Rapeseed Meal
Share of Brazil s Soybean Exports to China Spikes in August
 United States Department of Agriculture Foreign Agricultural Service September 2018 Share of Brazil s Soybean Exports to China Spikes in August Monthly Share of Brazil's Soybean Exports to China 85% 75%
2016/17 Global Olive Oil Production Down But Prices Stabilize
 United States Department of Agriculture Foreign Agricultural Service November 2016 Global Olive Oil Down But Prices Stabilize Global Olive Oil and Stocks 4000 3500 5000 Extra Virgin Olive Oil Prices Stabilizing
U.S. Soybean Prices Fall as Buyers Focus Turns to South America
 United States Department of Agriculture Foreign Agricultural Service Circular Series FOP 2-10 ruary 2010 U.S. Soybean Prices Fall as Buyers Focus Turns to South America $11.00 Daily U.S. Soybean Cash Price
Wheat Marketing Situation
 Wheat Marketing Situation Prepared by: Darrell L. Hanavan Executive Director Colorado Wheat Administrative Committee If you would like to receive an email when this report is updated, email gmostek@coloradowheat.org
As China s Soybean Oil Imports Fall, Production Expands
 United States Department of Agriculture Foreign Agricultural Service Circular Series FOP 10-10 October 2010 As China s Soybean Oil Fall, Expands 12 10 Million Metric Tons 8 6 4 2 0 2006/07 2007/08 China
World Wheat Supply and Demand Situation
 World Wheat Supply and Demand Situation September 218 Major data source: USDA World Agricultural Supply and Demand Estimates released September 12, 218. Projections will change over the course of the year
U.S. Soybean Exports Forecast to Reach Record
 United States Department of Agriculture Foreign Agricultural Service July 2017 U.S. Soybean Exports Forecast to Reach Record 60 Accumulated Exports by Week Total Commitments of Soybeans as of End of June
China is Key to Slow Pace of U.S. Soybean Exports
 United States Department of Agriculture Foreign Agricultural Service January 2018 China is Key to Slow Pace of U.S. Soybean Exports U.S. and Brazil Soybean Exports by Destination (Accumulated Exports:
Brazil s Soybean Oil Exports Squeezed by Rising Biodiesel Demand
 United States Department of Agriculture Foreign Agricultural Service Circular Series FOP 6-09 e 2009 Brazil s Soybean Oil Exports Squeezed by Rising Biodiesel Demand Soybean Oil Exports and Industrial
Rising Coconut Oil Prices Foreshadow Tight Supplies in 2007
 United States Department of Agriculture Foreign Agricultural Service Circular Series FOP 2-07 ruary 2007 Rising Coconut Oil Prices Foreshadow Tight Supplies in 2007 800 Coconut Oil Price: CIF Rotterdam
Soybean and Oilseed Meal Import Prospects Higher as Severe Weather Damages EU Crops
 Million Tons Million Tons Million Tons United States Department of Agriculture Foreign Agricultural Service August 2018 Soybean and Oilseed Meal Import Prospects Higher as Severe Weather Damages EU Crops
Devaluation Energizes Argentine Soybean Crush
 United States Department of Agriculture Foreign Agricultural Service March 2016 Devaluation Energizes Argentine Soybean Crush Argentina Quarterly Soybean Crush Volume Exchange Rate* and Constant Dollar
World Wheat Supply and Demand Situation August 2018
 World Wheat Supply and Demand Situation August 218 Major data source: USDA World Agricultural Supply and Demand Estimates released August 1, 218. Projections will change over the course of the year depending
China Tariffs Driving U.S. Soybean Exports To the European Union to a 30-Year High
 United States Department of Agriculture Foreign Agricultural Service March 2019 China Tariffs Driving U.S. Soybean Exports To the European Union to a 30-Year High 12-MONTH MOVING TOTAL U.S. SOYBEAN EXPORTS
Palm and Soy Oil Use Expands at Expense of Other Oils
 United States Department of Agriculture Foreign Agricultural Service September 2015 Revised on September 15, 2015 Palm and Soy Oil Use Expands at Expense of Other Oils As global demand for vegetable oil
India Soybean Meal Exports: Revised and Rebounding
 United States Department of Agriculture Foreign Agricultural Service January 2017 India Soybean Meal Exports: Revised and Rebounding India Soybean Meal Exports Forecast to Rise in 8.0 Data Series Comparison
2017 SC Producers Whole Farm Revenue Protection Expected Price Justification
 2017 SC Producers Whole Farm Revenue Protection Expected Price Justification RMA Projected Expected As of Average Futures Price Close As of RMA Projected Prices 4 Feb 2011 2015 % Differ 4 Feb Crop Contract
China Soybean Imports Stagnant Despite Record Consumption as Production Rebounds
 United States Department of Agriculture Foreign Agricultural Service Circular Series FOP 9-08 tember 2008 China Soybean Stagnant Despite Record Consumption as Rebounds Million Tons 60 50 40 30 20 10 0
Strong Brazilian Soybean Sales Expected to Slow Rebound in Argentine Exports
 United States Department of Agriculture Foreign Agricultural Service December 2018 Strong Brazilian Soybean Sales Expected to Slow Rebound in Argentine Exports Oct. 1 - Nov. 30 Brazil Soybean Exports (Million
World Wheat Supply and Demand Situation October 2018
 World Wheat Supply and Demand Situation October 218 Major data source: USDA World Agricultural Supply and Demand Estimates released October 12, 218. Projections will change over the course of the year
Soybean Prices Fall on Rising South American Production
 United States Department of Agriculture Foreign Agricultural Service April 2017 Soybean Prices Fall on Rising South American Production Million Tons Change in South America Soybean Production Forecast
CHARTS AND PRICE PROJECTIONS
 CHARTS AND PRICE PROJECTIONS 18 / Charts and Price Projections: FAPRI 27 Agricultural Outlook Average Annual GDP Growth Percent Change 9 8 7 6 4 3 2 1 26-216 Canada China EU NMS EU- India Japan Latin America
Global Monthly March 2019
 Global Monthly March 19 Percent of world bonds outstanding 3 5 15 5 Jan-1 Jun-1 Nov-1 Apr-15 Sep-15 Feb-1 Jul-1 Dec-1 May-17 Oct-17 Mar-1 Aug-1 Dec-1 Mar-19 March 19 Percent, year-on-year 7 5 3 1 1Q1 1Q
Rice Outlook Slide Show U.S. and World August 10, 2017
 Rice Outlook Slide Show U.S. and World August 10, 2017 Bobby Coats, Ph.D. Professor Economics Department of Agricultural Economics and Agribusiness Division of Agriculture Cooperative Extension Service
World Wheat Supply and Demand Situation December 2018
 World Wheat Supply and Demand Situation December 218 Major data source: USDA World Agricultural Supply and Demand Estimates released December 11, 218. Projections will change over the course of the year
Economic and Commodity Market Outlook
 Economic and Commodity Market Outlook August 12, 2016 By Robert Coats, Ph.D. Professor Economics Department of Agricultural Economics and Agribusiness Division of Agriculture University of Arkansas System
Explosive Growth in Vegetable Oil Demand Exacerbates Chinese Supply Deficit, Reliance on Imports. Imports
 United States Department of Agriculture Foreign Agricultural Service Circular Series FOP 12-07 ember 2007 Million tons 35 Explosive Growth in Vegetable Oil Demand Exacerbates Chinese Supply Deficit, Reliance
World Wheat Supply and Demand Situation March 2018
 World Wheat Supply and Demand Situation March 218 Major data source: USDA World Agricultural Supply and Demand Estimates released March 8, 218. Projections will change over the course of the year depending
CHARTS AND PRICE PROJECTIONS
 CHARTS AND PRICE PROJECTIONS 18 / Charts and Price Projections: FAPRI 28 Agricultural Outlook Average Annual GDP Growth, 27-217 Percent Change 1 8 8.4 7.92 6 4 4.44 3.67 4.6 4.34 2 2.37 2.17 1.38 2.44
World Wheat Supply and Demand Situation
 World Wheat Supply and Demand Situation November 218 Major data source: USDA World Agricultural Supply and Demand Estimates released November, 218. Projections will change over the course of the year depending
Corn & Bean Producers-1
 Largest Corn Producing Countries - 2016 est. Largest Corn Importing Countries - 2016 est. (Marketing year - thousands of hectares, tons per hectare, and thousands of metric tons) (Marketing year - thousands
2007 AAEA Livestock Outlook Symposium
 27 AAEA Livestock Outlook Symposium Ron Plain Professor of Agricultural Economics University of Missouri-Columbia www.ssu.missouri.edu/faculty/rplain Hog Price Outlook Production Efficiency 1 Head 9.5
China 2017/18 Soybean Imports Soar on Appetite for Pork, Aquaculture, and Dairy
 United States Department of Agriculture Foreign Agricultural Service June 2017 China Soybean Soar on Appetite for Pork, Aquaculture, and Dairy China: Booming Farmed Aquaculture Production China: Record
Bangladesh: A Growing Market for U.S. Soybeans
 United States Department of Agriculture Foreign Agricultural Service December 2017 Bangladesh: A Growing Market for U.S. Soybeans 100% 310 3 Meal Equivalent Share 90% 80% 70% 60% 50% 40% 30% 20% 10% Animal
Record U.S. Peanut Exports on Strong Shipments to China and Vietnam
 United States Department of Agriculture Foreign Agricultural Service September 2016 Record U.S. Peanut Exports on Strong Shipments to China and Vietnam Thousand Metric Tons 800 700 600 500 400 300 200
Regional Vegetable Oil Situation: Cut in Sun Oil Production, Imports Leaves North Africa & the Middle East Looking for Soy & Palm Oil to Fill Demand
 United States Department of Agriculture Foreign Agricultural Service Circular Series FOP 09-07 tember 2007 Regional Vegetable Oil Situation: Cut in Sun Oil, Leaves North Africa & the Middle East Looking
2019 Grain Update December 4, 2018
 2019 Grain Update December 4, 2018 Orange Juice (Jan '19) Live Cattle (Dec '18) S&P 500 E-Mini (Dec '18) Dow Indu 30 E-Mini (Dec '18) Cotton #2 (Dec '18) U.S. Dollar Index (Dec '18) Wheat (Dec '18) Nasdaq
Drought Forecast to Reduce Australian Rapeseed Exports in 2007
 United States Department of Agriculture Foreign Agricultural Service Circular Series FOP 11-06 November 2006 Drought Forecast to Reduce Australian Rapeseed Exports in 2007 1800 1600 1400 1200 1000 800
COMPARISON OF FIXED & VARIABLE RATES (25 YEARS) CHARTERED BANK ADMINISTERED INTEREST RATES - PRIME BUSINESS*
 CHARTERED BANK ADMINISTERED INTEREST RATES - PRIME BUSINESS*") COMPARISON OF FIXED & VARIABLE RATES (25 YEARS) 2 Fixed Rates Variable Rates For Internal Use Only. FIXED RATES OF THE PAST 25 YEARS AVERAGE RESIDENTIAL MORTGAGE LENDING RATE - 5 YEAR* (Per cent) Year
COMPARISON OF FIXED & VARIABLE RATES (25 YEARS) 2 Fixed Rates Variable Rates For Internal Use Only. FIXED RATES OF THE PAST 25 YEARS AVERAGE RESIDENTIAL MORTGAGE LENDING RATE - 5 YEAR* (Per cent) Year
COMPARISON OF FIXED & VARIABLE RATES (25 YEARS) CHARTERED BANK ADMINISTERED INTEREST RATES - PRIME BUSINESS*
 CHARTERED BANK ADMINISTERED INTEREST RATES - PRIME BUSINESS*") COMPARISON OF FIXED & VARIABLE RATES (25 YEARS) 2 Fixed Rates Variable Rates FIXED RATES OF THE PAST 25 YEARS AVERAGE RESIDENTIAL MORTGAGE LENDING RATE - 5 YEAR* (Per cent) Year Jan Feb Mar Apr May Jun
COMPARISON OF FIXED & VARIABLE RATES (25 YEARS) 2 Fixed Rates Variable Rates FIXED RATES OF THE PAST 25 YEARS AVERAGE RESIDENTIAL MORTGAGE LENDING RATE - 5 YEAR* (Per cent) Year Jan Feb Mar Apr May Jun
Monthly Hog Market Update United States Hog Production
 This information is provided as a resource by Saskatchewan Agriculture staff All prices are in Canadian dollars unless otherwise noted. Please use this information at your own risk. Monthly Hog Market
2017/18 Olive Oil Export Forecast Rises with Slight Growth in Production
 United States Department of Agriculture Foreign Agricultural Service November 2017 Olive Oil Export Forecast Rises with Slight Growth in Production Million Metric Tons 3.4 3.2 3.0 2.8 2.6 Olive Oil Prices
280 / World Cotton: FAPRI 2005 Agricultural Outlook. World Cotton
 WORLD COTTON 280 / World Cotton: FAPRI 2005 Agricultural Outlook World Cotton The 2004/05 crop can be characterized simply as record breaking. A record 35.8 mha of cotton were harvested, producing a record
Growing Fuel Use Limits Exports of Soybean Oil by South America
 United States Department of Agriculture Foreign Agricultural Service Circular Series FOP 11-09 ember 2009 Growing Fuel Use Limits of Soybean Oil by South America 2006/07 Soybean Oil Distribution Soybean
FAPRI Food and Agricultural Policy Research Institute
 26 WORLD OUTLOOK Presentation Food and Agricultural Policy Research Institute Global Macroeconomic Overview Sustained and widespread real economic growth for the decade averaging 3.1%. Industrialized countries
Citrus: World Markets and Trade
 United States Department of Agriculture Foreign Agricultural Service July 2015 Citrus: World Markets and Trade Oranges Global orange production for is estimated to decline 7 percent from the previous year
THIS REPORT CONTAINS ASSESSMENTS OF COMMODITY AND TRADE ISSUES MADE BY USDA STAFF AND NOT NECESSARILY STATEMENTS OF OFFICIAL U.S.
 THIS REPORT CONTAINS ASSESSMENTS OF COMMODITY AND TRADE ISSUES MADE BY USDA STAFF AND NOT NECESSARILY STATEMENTS OF OFFICIAL U.S. GOVERNMENT POLICY Required Report - public distribution Oilseeds and Products
2016 U.S. ETHANOL EXPORTS AND IMPORTS
 2016 U.S. ETHANOL EXPORTS AND IMPORTS STATISTICAL SUMMARY Copyright 2017 Renewable Fuels Association. All Rights Reserved 2016 U.S. ETHANOL EXPORTS U.S. Ethanol Exports, 2006-2016 1,200 1,000 800 600 396
External Market Factors Impacting US Soybean Meal
 External Market Factors Impacting US Soybean Meal USSEC Luncheon International Production and Processing Expo January 3, 213 Atlanta, GA Paul Smolen Presentation Objectives Examine the economic drivers
TOOL #5: C&S WASDE PRICE STUDY FOR DECEMBER CORN 7/09/10 For the July 9 th to the August 12 th time frame for CZ 2010
 TOOL #5: C&S WASDE PRICE STUDY FOR DECEMBER CORN 7/09/10 For the July 9 th to the August 12 th time frame for CZ 2010 Brief summary: In the month ahead, my best estimate is that CZ 2010 could trade in
US biofuel Indicators and a changing market dynamic
 US biofuel Indicators and a changing market dynamic Seth Meyer AMIS October 1-2, 13, Rome Movement of Ag and Energy Ethanol production and capacity 16 35 Crude oil and maize prices 14 3 billion gallons
USDA Projections of Bioenergy-Related Corn and Soyoil Use for
 USDA Projections of Bioenergy-Related Corn and Soyoil Use for 2010-2019 Daniel M. O Brien, Extension Agricultural Economist K-State Research and Extension The United States Department of Agriculture released
United States Boosts Share in South Korea s Soybean Oil Market
 United States Department of Agriculture Foreign Agricultural Service February, 2018 United States Boosts Share in South Korea s Soybean Oil Market Thousand Metric Tons 350 300 250 200 150 100 50 50% 45%
2017 Risk and Profit Conference Breakout Session Presenters. 13. Ethanol and Biodiesel Market and Profitability Prospects
 2017 Risk and Profit Conference Breakout Session Presenters 13. Ethanol and Biodiesel Market and Profitability Prospects Dan O Brien Daniel O Brien was raised on a grain and livestock
About Czarnikow. The Premier Provider of Sugar Market Services. Czarnikow has been in the sugar business since 1861
 About Czarnikow The Premier Provider of Sugar Market Services Czarnikow has been in the sugar business since 1861 Czarnikow is the leading professional services company in the sugar market Czarnikow has
Citrus: World Markets and Trade
 United States Department of Agriculture Foreign Agricultural Service uary 2015 Citrus: World Markets and Trade Oranges Global orange production for is forecast to decline 4 percent from the previous year
Contents. List of Tables...1 Internet Access to Sugar-Related Data...4
 Sugar and Sweetener Situation and Outlook Yearbook. Market and Trade Economics Division, Economic Research Service, U.S. Department of Agriculture, June 2002, SSS-2002. Contents List of Tables.................................................1
Strong Global Grain Production Isn t Good Enough. David Hightower The Hightower Report
 Strong Global Grain Production Isn t Good Enough David Hightower The Hightower Report Big Picture Factors Cost of Production Pricing Not a downtrend signal Goldman $20 oil Forecast was wrong 8.9 mbd!
India. Oilseeds and Products Update. February 2012
 THIS REPORT CONTAINS ASSESSMENTS OF COMMODITY AND TRADE ISSUES MADE BY STAFF AND NOT NECESSARILY STATEMENTS OF OFFICIAL U.S. GOVERNMENT POLICY Required Report - public distribution India Oilseeds and Products
2011 Indiana Agricultural Outlook
 2011 Indiana Agricultural Outlook Corinne Alexander & Chris Hurt hurtc@purdue.edu September 13, 2010 World Economic Growth Ethanol Dollar Value Surprises and Uncertainty! Change Wheat Production 2010 vs.
Major Junctions Ahead Energy, Grains and Metals. David Hightower President, The Hightower Report
 Major Junctions Ahead Energy, Grains and Metals David Hightower President, The Hightower Report 30 25 23.55 2018 Commodity Performance - Annual Percent Change 20 16.49 15 10 10.09 6.44 5 0 0.24-5 -10-15
Reviewing a volatile year for PET What does the future hold?
 Reviewing a volatile year for PET What does the future hold? Matt Tudball Head of European Markets www.icis.com 1 Agenda PET price and sentiment drivers in 2017: Europe, Americas, Asia & feedstocks Predictions
Preliminary Steel Imports Decline 9% in September Import Market Share at 20%
 News Release FOR IMMEDIATE RELEASE October 25, 2011 CONTACT: NANCY GRAVATT 202.452.7115/ ngravatt@steel.org Preliminary Steel Imports Decline 9% in September Import Market Share at 20% Washington, D.C.
/ Preliminary Steel Imports Increase 6% in May Import Market Share at 21%
 News Release FOR IMMEDIATE RELEASE June 21, 2011 CONTACT: NANCY GRAVATT 202.452.7115/ ngravatt@steel.org Preliminary Steel Imports Increase 6% in May Import Market Share at 21% Washington, D.C. Based on
Grain: World Markets and Trade
 Department of Agriculture Foreign Agricultural Service Circular Series FG 11-1 Nov 21 Grain: World Markets and Trade Global Wheat and Coarse Grain Ending Stocks Drop MMT 8 6 4 2-2 -4-6 -8 Year-to-Year
Corn Outlook. David Miller Director of Research & Commodity Services Iowa Farm Bureau Federation December 2013
 Corn Outlook David Miller Director of Research & Commodity Services Iowa Farm Bureau Federation December 2013 Source: USDA-WAOB U.S. Corn Supply & Usage U.S. Corn Supply & Usage Comments With the largest
Global Monthly February 2018
 Global Monthly February 18 3 1-year Treasury yields 1-year breakeven inflation rate 1 1 15 16 17 18 February 18 5 3 Global GDP growth Composite PMI (RHS) Index 56 5 5 1 5 1 13 1 15 16 17 18 3..5. 1.5 1.
Citrus: World Markets and Trade
 United States Department of Agriculture Foreign Agricultural Service y 2018 Citrus: World Markets and Trade Oranges Global orange production for is forecast to tumble 6.0 million metric tons (tons) from
India & Asia. Steel Scrap Industry BY: VED PRAKASH GEMINI CORPORATION N. V., BELGIUM
 India & Asia Steel Scrap Industry BY: VED PRAKASH GEMINI CORPORATION N. V., BELGIUM 1 GEMINI CORPORATION N. V. Steel, Recyclable Plastics, Rubber and Engineered Wood Panels 2 Content How competitive are
FAPRI 2006 Preliminary Baseline December 15-16, 2005
 FAPRI 26 Preliminary Baseline December 15-16, 25 INTERNATIONAL DAIRY FAPRI Food and Agricultural Policy Research Institute Fengxia Dong (515) 294-47 fdong@iastate.edu Center for Agricultural and Rural
Cotton and Wool. Situation and Outlook Yearbook ERS. U.S. fiber demand contracts in United States Department of Agriculture
 United States Department of Agriculture ERS Economic Research Service Cotton and Wool Situation and Outlook Yearbook CWS-2001 November 2001 U.S. fiber demand contracts in 2001 Lb per capita 100 80 Total
History gives hope for wheat rally Be sure to reward $2 rally. By Bryce Knorr, Senior Grain Market Analyst
 History gives hope for wheat rally Be sure to reward $2 rally By Bryce Knorr, Senior Grain Market Analyst For years the wheat market stagnated waiting for a single trigger: A sharp reduction in global
2017 U.S. Ethanol Exports and Imports. Statistical Summary Renewable Fuels Association. All Rights Reserved.
 2017 U.S. Ethanol Exports and Imports Statistical Summary 2018 Renewable Fuels Association. All Rights Reserved. 2017 U.S. ETHANOL EXPORTS Annual U.S. Ethanol Exports 1, 1, 1,000 800 600-1,367 1,193 1,169