PARISH OF ASCENSION OFFICE OF PLANNING AND DEVELOPMENT PLANNING DEPARTMENT
|
|
|
- Monica Rose
- 5 years ago
- Views:
Transcription
1 1. Call To Order 2. Roll Call of Members 3. Introduction of Staff 4. Chairman's Comments PARISH OF ASCENSION OFFICE OF PLANNING AND DEVELOPMENT PLANNING DEPARTMENT Joint Planning and Zoning Meeting March 12, 214 6: PM Courthouse Annex Irma Blvd Council Meeting Room 2nd Floor (Following the Planning Commission Meeting) AGENDA 5. Public Hearing to Recommend Approval or Denial to the Parish Council to Consider the following: (A) Legacy Oaks PUD - Concept Plan Zoning Review ID Tract A of the Resubdivision of the Portion of the Gonzales Country Club for Legacy Oaks Development, LLC Quality Engineering & Surveying, LLC (Council District 3) 6. Public Hearing to Approve or Deny the following: 7. Adjourn
2 Description: Legacy Oaks PUD - Concept Plan Zoning Review ID Tract A of the Resubdivision of the Portion of the Gonzales Country Club for Legacy Oaks Development, LLC Quality Engineering & Surveying, LLC (Council District 3) ATTACHMENTS: Name: Legacy_Oaks_Concept_Plan.pdf _Legacy_Oaks_DIS_(2-5-14).pdf Legacy_Oaks_TIS_Report_-_Final.pdf Description: Legacy Oaks PUD Concept Plan Drainage Impact Study Traffic Impact Study

3


4


5


6


7

8

9


10


11


12


13


14


15 DRAINAGE IMPACT STUDY OF LEGACY OAKS RESIDENTIAL SUBDIVISION LA Highway 429 (Cornerview Rd.) Ascension Parish, LA For Legacy Oaks, LLC 9614 Brookline Baton Rouge, La 789 February 214
16 TABLE OF CONTENTS I. DRAINAGE CALCULATIONS SUMMARY LIST OF EXHIBITS EXHIBIT 1 VICINITY MAP...8 EXHIBIT 2 FEMA FLOOD MAP...9 EXHIBIT 3 PRE-DEVELOPMENT DRAINAGE AREA MAP...1 EXHIBIT 4 POST-DEVELOPMENT DRAINAGE AREA MAP...11 EXHIBIT 5 POND OUTFALL STRUCTURE SKETCH...12 LIST OF APPENDICES APPENDIX A PRE-DEVELOPMENT HYDROCAD CALCS FOR A 1YR STORM EVENT APPENDIX B POST-DEVELOPMENT HYDROCAD CALCS FOR A 1YR STORM EVENT AND 1 YR POND ROUTING CALC APPENDIX C APPROVED G.W. CARVER SCHOOL DRAINAGE IMPACT STUDY APPENDIX D G.W. CARVER SCHOOL STORM DRAINAGE AS-BUILT
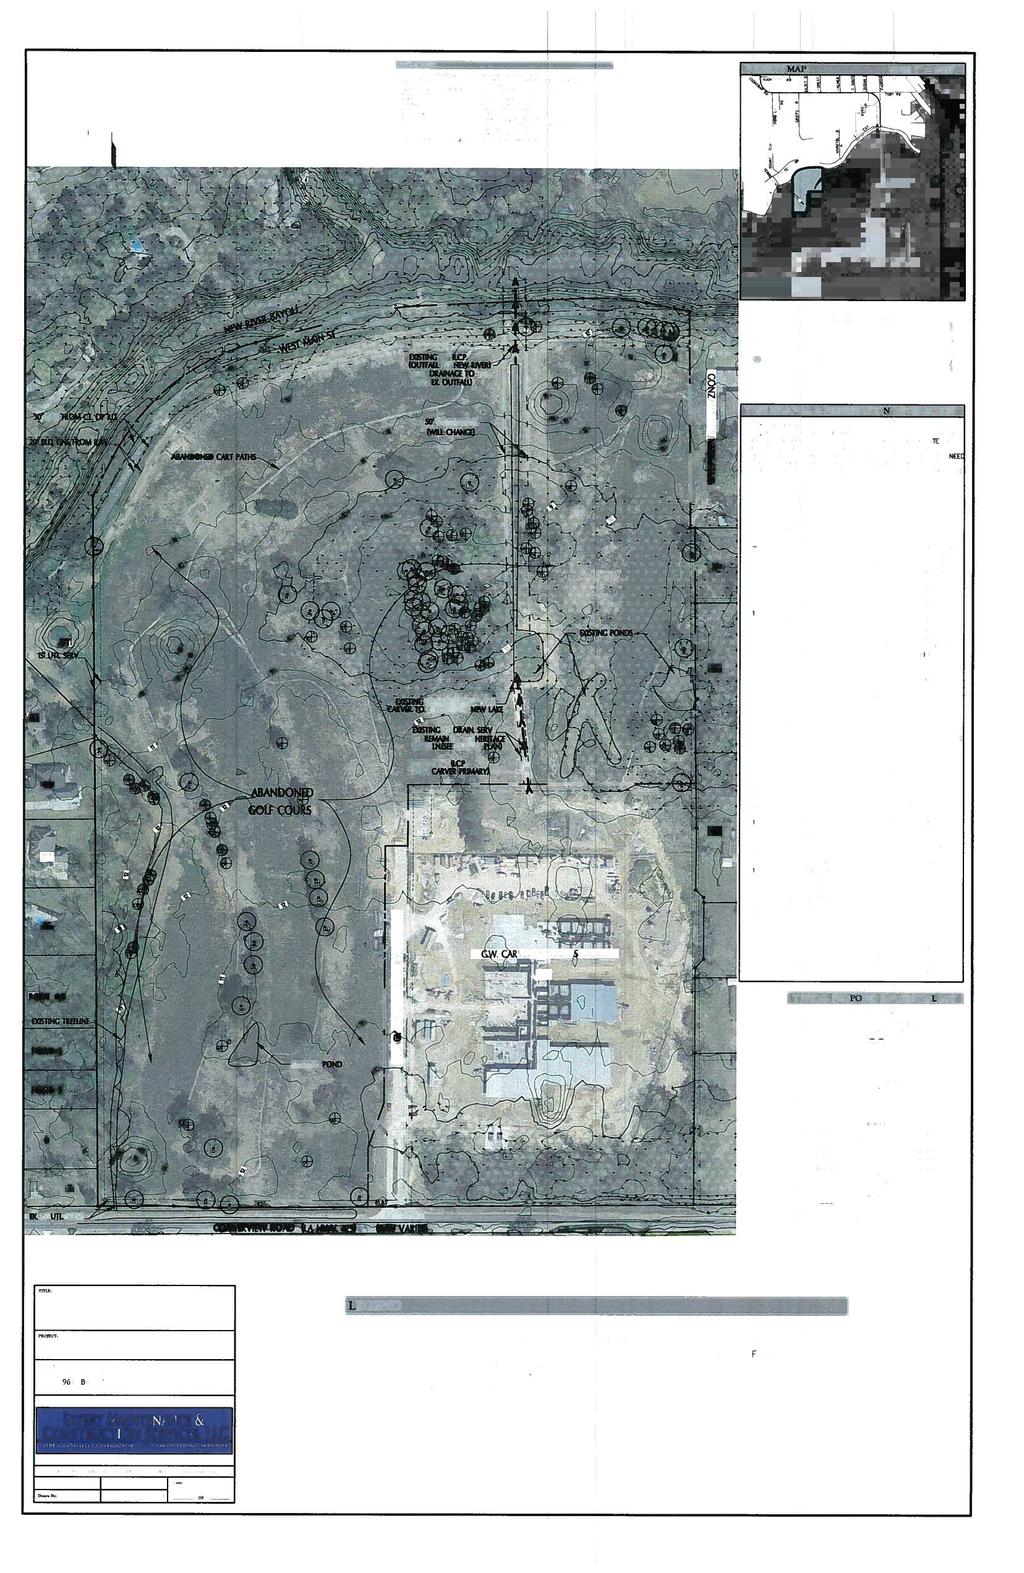
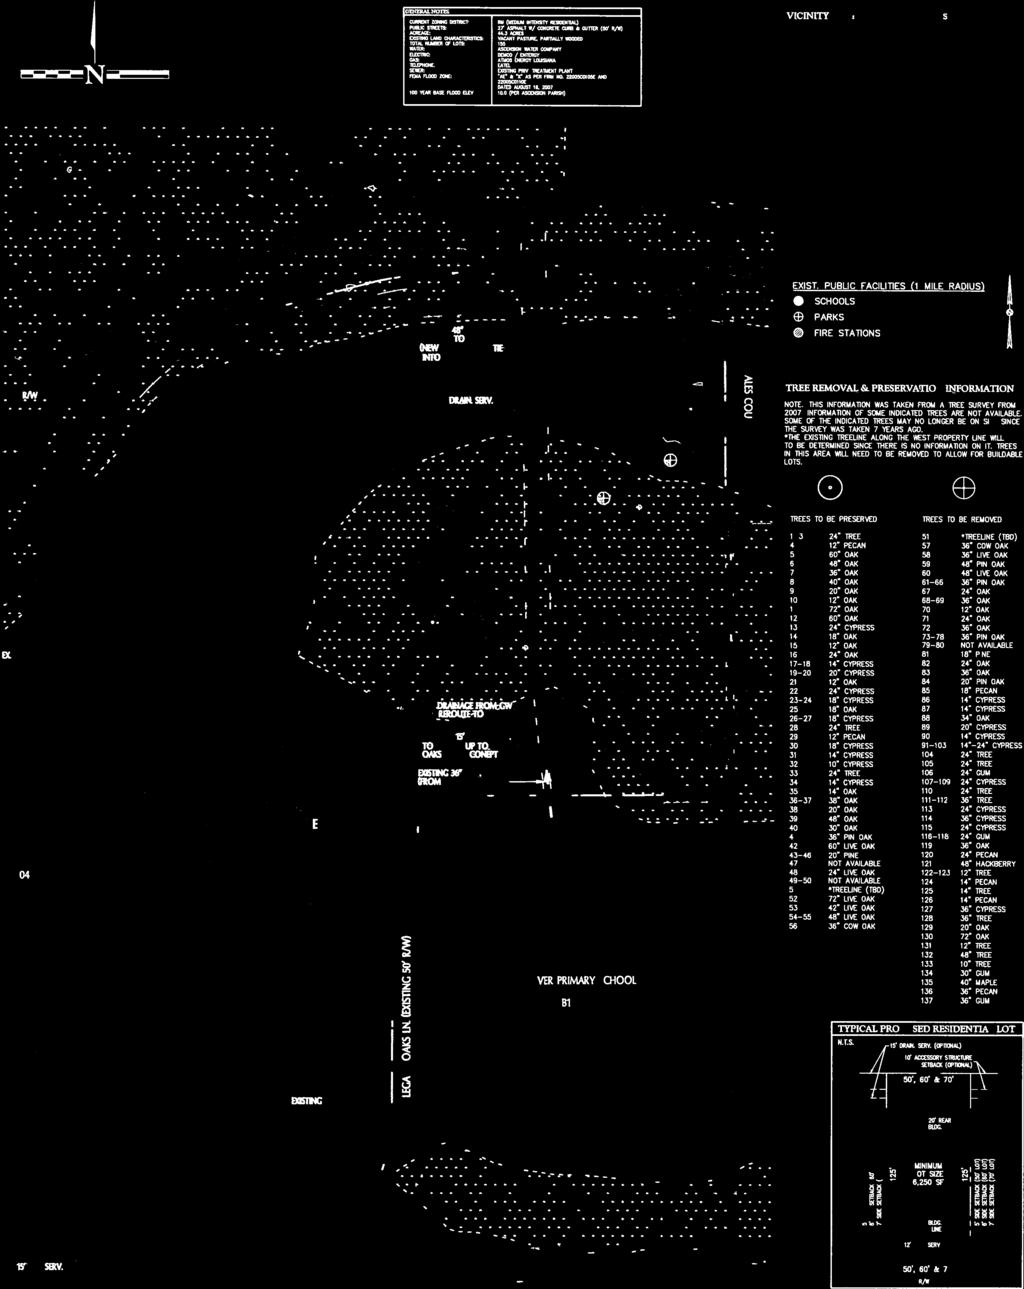
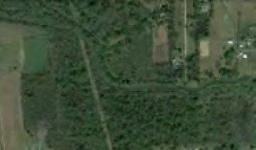
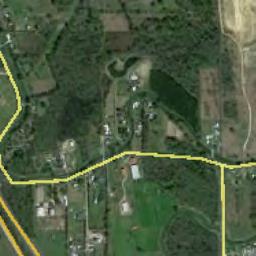
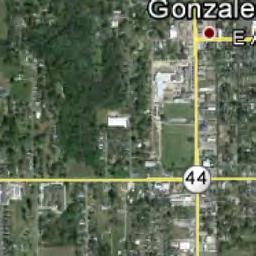
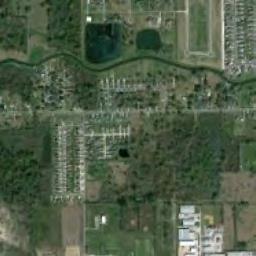
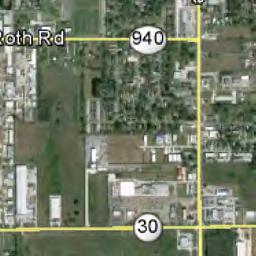
17 Drainage Impact Study Legacy Oaks Subdivision February 5, 214 I. Site Location and Description The proposed residential development is comprised of approximately 44.4 acres located in Section 3, Township 9 South, Range 3 East, Southeastern Land District, East of the Mississippi River, Ascension Parish, Louisiana. The site is further located on the northern right of way of LA Highway 429 (Cornerview Rd.) approximately 1.1 miles west of the intersection with LA Highway 44 as shown on Exhibit 1, the Vicinity Map. The pre-developed site is an abandoned golf course with a mix of grassed park area and scattered trees. The site is bounded by New River Bayou and West Main Street on the north, residential subdivisions on the east, Cornerview Road to the South, recently constructed G.W. Carver School to the south and east, then residential subdivision and the Gonzales Country Club along the western border. The site has two existing outfalls, New River Bayou to the north and Bayou Francois to the south. Approximately acres of the site drains south to the Corenerview roadside ditch and Bayou Francois watershed while acres of the site drains north to New River Bayou. Both Bayou Francois and New River Bayou ultimately outfall to the Amite River. The existing site conditions are depicted on Exhibit 3, Pre-Development Drainage Area Map. The development plan for this property is to construct a residential subdivision having 155 lots with varied dimensions, as shown in Exhibit 4, Post-Development Drainage Area Map. Preliminary Designs consist of two entrances from existing Legacy Oaks Boulevard and one entrance from West Main Street, with curb & gutter streets and subsurface drainage. One proposed detention pond will be utilized to reduce the 1-year post-development runoff from the site to the 1-year pre-development flow rate. Page 1 of 7
18 Drainage Impact Study Legacy Oaks Subdivision February 5, 214 The subject site is located within Flood Zones X and AE as shown on the Flood Insurance rate Map Number 225C15E attached as Exhibit 2. According to FEMA, the 1-Year Base Flood Elevation is 1. (NAVD). The prevailing natural ground elevations range from 11 near the center of the site to approximately 8 along the northern and southern boundaries of the site. In accordance with Ascension Parish Subdivision Regulations, all minimum finished floor elevations shall meet or exceed elevation 12.' ( , base flood elevation + 1. free board). II. Design Considerations and Analysis The purpose of this study is to demonstrate how storm water management techniques will be utilized to mitigate the increase in flows from the proposed development. HydroCAD Storm Water Modeling Software was used for calculation purposes. This program combines both the capabilities of the Soil Conservation Service Method TR-2 and TR-55. The flows produced by the 1-year and 1-year postdeveloped conditions will be mitigated to Pre-Development flows by utilizing two storm water detention ponds. A 24-hour storm of 1 and 1-year frequencies were analyzed and results can be found in the appendences. In order to minimize the impact due to the increased rate of storm water runoff from this project to the adjacent properties, existing and proposed conditions were analyzed. The SCS method was utilized to determine peak flows and hydrographs for each of these conditions. These peak flows and hydrographs were analyzed with HydroCAD Storm Water Modeling Software to design a storm water detention pond capable of performing all the necessary detention. All detention facilities were designed Page 2 of 7
19 Drainage Impact Study Legacy Oaks Subdivision February 5, 214 based on a 1-year 24-hour storm as required by the Ascension Parish Drainage Ordinance. The modeling results for a 1-year and 1-year storm can be found in the Appendices. The Pre-Development condition of this property is an abandoned golf course with a mix of grassed park area and scattered trees. A CN-value of 83 was used to model the on-site Pre-Development conditions. Approximately 14. acres at the interior of the site drains to a detention pond that was recently constructed to facilitate drainage received from the development of the G.W. Carver School. An existing subsurface drainage line extends from Legacy Oaks Boulevard to an inlet in the north school yard and then north to the existing detention pond. The pond outfalls through a 42 RCP into an existing ditch draining north to an existing 48 RCP cross-drain under West Main Street and into New River Bayou. The approved Drainage Impact Study and Storm Drainage As-Built for the G.W. Carver School were used as references for this report and are included as Appendices C and D. Approximately 4.57 acres of the site drains to the eastern property line and then south, into a small pond with a swale ditch outfall draining east to another pond and eventually into New River Bayou. An area of 8.48 acres drains west to an existing ditch, sloping north along the western boundary. The ditch leads into an existing subsurface drainage system at the rear lot lines of Greenside Estates which outfalls to an existing 24 RCP cross-drain under West Main Street and into New River Bayou. Along West Main Street approximately 8.42 acres sheet flows from the site directly into New River Bayou via 3 existing 12 RCP cross-drains under West Main Street. Approximately 7.79 acres of the site drains south, to the existing Cornerview roadside ditch and on to Bayou Page 3 of 7
20 Drainage Impact Study Legacy Oaks Subdivision February 5, 214 Francois. In addition, 1.84 acres of the site drains to the existing Legacy Oaks Boulevard subsurface system and existing pond. Approximately acres of off-site area drains from the G.W. Carver School site to the north while approximately 3.69 acres drains south, to the Cornerview roadside ditch. Along the western boundary of the site, approximately 4.62 acres of off-site area from rear lot drainage of adjacent residential properties drain to the existing ditch sloping north along the western boundary and into the existing subsurface drainage system at Greenside Estates. From this site and immediately adjacent properties, New River Bayou will has a combined 1-year peak discharge of 76.4 cfs and Bayou Francois receives 24.8 cfs. These conditions can be seen on Exhibit 3, the Pre-Development Drainage Area Map. The Pre-Development conditions for a 1-year storm are shown below: NODE DESCRIPTION AREA (AC.) CN* Tc (min) Q1 (CFS) ON SITE 3S Site to Legacy Oaks Blvd NR 8S Site to Cornerview BF 1S Site Interior NR 11S Site to Exist Ditch on E PL NR 13S Site to Exist Ditch on W PL NR 14S Site to W Main St NR SUB TOTAL OFF SITE 2S Carver School (South) BF 5S Carver School (North) NR 15S Greenside Estates NR SUB TOTAL L Bayou Francois (BF) ** 15L New River Bayou (NR) ** ** Combined Routing as per HydroCAD Software Page 4 of 7
21 Drainage Impact Study Legacy Oaks Subdivision February 5, 214 Under Post-Development conditions, the site is considered Residential with 155 home sites. A CN-value of 87 is used which is consistent with a 1/4 acre average lot size with soil type D. Storm water generated from the post-development condition will be captured in sub-surface drainage systems and routed to the proposed detention pond. The rear lot areas along the perimeter of the developed area will be allowed to sheet flow directly to the existing ditches and subsurface drainage, which will reduce runoff received by those systems from this site. The detention pond will reduce the 1-year post-developed flow back to pre-development levels. Proposed Drainage is shown on Exhibit 4, the Post-Development Drainage Area Map. The Post-Development conditions for a 1-year storm event are shown below: NODE DESCRIPTION AREA (AC.) CN* Tc (min) Q1 (CFS) ON SITE A Site Interior NR B Pond Area NR C Site to Cornerview BF D Site to Exist Ditch on W PL NR E Site to Exist Ditch on E PL NR F Site to W Main St NR SUB TOTAL OFF SITE 2S Carver School (South) BF 5S Carver School (North) NR 15S Greenside Estates NR SUB TOTAL L Bayou Francois (BF) ** 15L New River Bayou (NR) ** ** Combined Routing as per HydroCAD Software Page 5 of 7
22 Drainage Impact Study Legacy Oaks Subdivision February 5, 214 The proposed detention pond will have a static water surface area of approx acres at elev. 5.5' with 4:1 side slopes and a top bank elevation of 1.. The outfall structure for the pond will consist of a custom concrete box structure including three (3)- 3 wide x 6 tall rectangular orifices at elevation 5.5 and a 24 x24 grated top at elevation 8.2. The pond will discharge to a 42 diameter CMP culvert from the pond to the existing 48 RCP outfall to New River Bayou. The 1-year storm will utilize approximately 57,474 cu-ft of pond volume; have a peak 1-year water surface of 8.55, and an exiting peak flow of cfs for the 1 year storm. The 1-year storm will produce a peak water surface elevation of 9.66 which is.34' less than the existing base flood elevation of 1.. Due to the natural and proposed topography of the site, the large majority of the site will drain through the development and to the pond. Rear lot areas along the perimeter of the subdivision will reduce area and peak runoff rates draining directly to the existing ditches and subsurface drainage. The flow received from the G.W. Carver School site and Legacy Oaks Boulevard will be routed through the site to the proposed detention pond. From this site and immediately adjacent properties, New River Bayou will have a combined 1-year peak discharge of 62. cfs and Bayou Francois will receive 17.9 cfs. Peak runoff to these outfalls will be reduced by 14.4 cfs and 6.9 cfs. The calculations provided in the Appendix show that the proposed development and improvements described will reduce the 1 year peak discharges to all existing outfalls. Page 6 of 7
23 Drainage Impact Study Legacy Oaks Subdivision February 5, 214 III. Recommendations and Conclusions The purpose of this Drainage Impact study is to identify the potential drainage impacts from the development of this project, and to demonstrate that the proposed storm water detention methods will result in no significant impacts to the adjacent watershed. The existing and proposed drainage conditions were analyzed and the results shown. As the computations indicate, the post-development 1-year peak flow from this site and immediately adjacent properties, the 1-year peak discharge to New River Bayou will be reduced by 14.4 cfs and reduced by 6.9 cfs to Bayou Francois. In fact, the project will result in a total decrease in the 1-year peak discharge for the regional watersheds of approximately 21.3 cfs. It is also demonstrated in the calculations that the 1-year storm event is contained within the proposed ponds without over-topping while maintaining a peak water surface that is less than the existing base flood elevation. This hydrologic analysis concludes that this development with the aforementioned storm water management methods will not adversely impact the upstream or downstream properties. Page 7 of 7
24


25
26
27

28
29 APPENDIX A PRE -DEVELOPMENT HYDROCAD CALCS FOR A 1 YEAR STORM EVENT
30 15S Greenside Estates to rear ditch 16L 13S Exist Greenside Estates Site to Exist Ditch on W PL 14S 8S 1S Site to W. Main St - Roadside Ditch 9L Site to Cornerview (South) Site Interior 3P 15L Bayou Francois 2S 5S Exist Pond New River Carver School (South) Carver School (North) 11S 3S Site to Exist Ditch on E PL Site to Legacy Oaks Blvd Subcat Reach Pond Link Routing Diagram for PRE DEVELOPMENT Prepared by qes, llc, Printed 2/5/214 HydroCAD 1. s/n M HydroCAD Software Solutions LLC
31 PRE DEVELOPMENT Prepared by qes, llc HydroCAD 1. s/n M HydroCAD Software Solutions LLC Printed 2/5/214 Page 2 Area (acres) CN Description (subcatchment-numbers) Area Listing (all nodes) (2S) (3S, 8S, 1S, 11S, 13S) (5S) /2 acre lots, 25% imp, HSG D (15S) % Grass cover, Fair, HSG D (14S) TOTAL AREA
32 PRE DEVELOPMENT Prepared by qes, llc HydroCAD 1. s/n M HydroCAD Software Solutions LLC Printed 2/5/214 Page 3 Line# Node Number In-Invert (feet) Out-Invert (feet) Pipe Listing (all nodes) Length (feet) Slope (ft/ft) n Diam/Width (inches) Height (inches) Inside-Fill (inches) 1 5S.. 1, P
33 PRE DEVELOPMENT Type III 24-hr 1 yr Rainfall=8.6" Prepared by qes, llc Printed 2/5/214 HydroCAD 1. s/n M HydroCAD Software Solutions LLC Page 4 Summary for Subcatchment 2S: Carver School (South) Runoff = hrs, Volume= af, Depth> 7.36" Runoff by SCS TR-2 method, UH=SWFWMD-256, Weighted-CN, Time Span=.-24. hrs, dt=.5 hrs Type III 24-hr 1 yr Rainfall=8.6" Area (ac) CN Description * % Pervious Area Tc Length Slope Velocity Capacity Description (min) (feet) (ft/ft) (ft/sec) (cfs) Lag/CN Method, 1 Subcatchment 2S: Carver School (South) Hydrograph Flow (cfs) cfs Type III 24-hr 1 yr Rainfall=8.6" Runoff Area=3.689 ac Runoff Volume=2.261 af Runoff Depth>7.36" Flow Length=4' Slope=.3 '/' Tc=19.6 min CN=9 Runoff Time (hours)
34 PRE DEVELOPMENT Type III 24-hr 1 yr Rainfall=8.6" Prepared by qes, llc Printed 2/5/214 HydroCAD 1. s/n M HydroCAD Software Solutions LLC Page 5 Summary for Subcatchment 3S: Site to Legacy Oaks Blvd Runoff = hrs, Volume=.589 af, Depth> 6.52" Runoff by SCS TR-2 method, UH=SWFWMD-256, Weighted-CN, Time Span=.-24. hrs, dt=.5 hrs Type III 24-hr 1 yr Rainfall=8.6" Area (ac) CN Description * % Pervious Area Tc Length Slope Velocity Capacity Description (min) (feet) (ft/ft) (ft/sec) (cfs) Sheet Flow, 1 Grass: Short n=.15 P2= 5.4" Subcatchment 3S: Site to Legacy Oaks Blvd Hydrograph Flow (cfs) cfs Type III 24-hr 1 yr Rainfall=8.6" Runoff Area=1.84 ac Runoff Volume=.589 af Runoff Depth>6.52" Flow Length=17' Slope=.1 '/' Tc=15.2 min CN=83 Runoff Time (hours)
35 PRE DEVELOPMENT Type III 24-hr 1 yr Rainfall=8.6" Prepared by qes, llc Printed 2/5/214 HydroCAD 1. s/n M HydroCAD Software Solutions LLC Page 6 Summary for Subcatchment 5S: Carver School (North) Runoff = hrs, Volume= 7.51 af, Depth> 7.57" Runoff by SCS TR-2 method, UH=SWFWMD-256, Weighted-CN, Time Span=.-24. hrs, dt=.5 hrs Type III 24-hr 1 yr Rainfall=8.6" Area (ac) CN Description * % Pervious Area Tc Length Slope Velocity Capacity Description (min) (feet) (ft/ft) (ft/sec) (cfs) Sheet Flow, 1 Grass: Short n=.15 P2= 5.4" Sheet Flow, 2 Smooth surfaces n=.11 P2= 5.4" Shallow Concentrated Flow, 3 Paved Kv= 2.3 fps 7.2 1, Pipe Channel, 4 24." Round Area= 3.1 sf Perim= 6.3' r=.5' n=.12 Concrete pipe, finished 31. 1,95 Total Subcatchment 5S: Carver School (North) Hydrograph Flow (cfs) cfs Type III 24-hr 1 yr Rainfall=8.6" Runoff Area= ac Runoff Volume=7.51 af Runoff Depth>7.57" Flow Length=1,95' Tc=31. min CN=92 Runoff Time (hours)
36 PRE DEVELOPMENT Type III 24-hr 1 yr Rainfall=8.6" Prepared by qes, llc Printed 2/5/214 HydroCAD 1. s/n M HydroCAD Software Solutions LLC Page 7 Summary for Subcatchment 8S: Site to Cornerview (South) Runoff = hrs, Volume= af, Depth> 6.43" Runoff by SCS TR-2 method, UH=SWFWMD-256, Weighted-CN, Time Span=.-24. hrs, dt=.5 hrs Type III 24-hr 1 yr Rainfall=8.6" Area (ac) CN Description * % Pervious Area Tc Length Slope Velocity Capacity Description (min) (feet) (ft/ft) (ft/sec) (cfs) Lag/CN Method, 1 Subcatchment 8S: Site to Cornerview (South) Hydrograph Flow (cfs) cfs Type III 24-hr 1 yr Rainfall=8.6" Runoff Area=7.794 ac Runoff Volume=4.176 af Runoff Depth>6.43" Flow Length=8' Slope=.2 '/' Tc=54. min CN=83 Runoff Time (hours)
37 PRE DEVELOPMENT Type III 24-hr 1 yr Rainfall=8.6" Prepared by qes, llc Printed 2/5/214 HydroCAD 1. s/n M HydroCAD Software Solutions LLC Page 8 Summary for Subcatchment 1S: Site Interior Runoff = hrs, Volume= 7.54 af, Depth> 6.43" Runoff by SCS TR-2 method, UH=SWFWMD-256, Weighted-CN, Time Span=.-24. hrs, dt=.5 hrs Type III 24-hr 1 yr Rainfall=8.6" Area (ac) CN Description * % Pervious Area Tc Length Slope Velocity Capacity Description (min) (feet) (ft/ft) (ft/sec) (cfs) Lag/CN Method, 1 Subcatchment 1S: Site Interior Hydrograph Flow (cfs) cfs Type III 24-hr 1 yr Rainfall=8.6" Runoff Area=14.4 ac Runoff Volume=7.54 af Runoff Depth>6.43" Flow Length=8' Slope=.2 '/' Tc=54. min CN=83 Runoff Time (hours)
38 PRE DEVELOPMENT Type III 24-hr 1 yr Rainfall=8.6" Prepared by qes, llc Printed 2/5/214 HydroCAD 1. s/n M HydroCAD Software Solutions LLC Page 9 Summary for Subcatchment 11S: Site to Exist Ditch on E PL Runoff = hrs, Volume= af, Depth> 6.5" Runoff by SCS TR-2 method, UH=SWFWMD-256, Weighted-CN, Time Span=.-24. hrs, dt=.5 hrs Type III 24-hr 1 yr Rainfall=8.6" Area (ac) CN Description * % Pervious Area Tc Length Slope Velocity Capacity Description (min) (feet) (ft/ft) (ft/sec) (cfs) Lag/CN Method, 1 Subcatchment 11S: Site to Exist Ditch on E PL Hydrograph Flow (cfs) cfs Type III 24-hr 1 yr Rainfall=8.6" Runoff Area=4.574 ac Runoff Volume=2.478 af Runoff Depth>6.5" Flow Length=4' Slope=.3 '/' Tc=25.3 min CN=83 Runoff Time (hours)
39 PRE DEVELOPMENT Type III 24-hr 1 yr Rainfall=8.6" Prepared by qes, llc Printed 2/5/214 HydroCAD 1. s/n M HydroCAD Software Solutions LLC Page 1 Summary for Subcatchment 13S: Site to Exist Ditch on W PL Runoff = hrs, Volume= af, Depth> 6.41" Runoff by SCS TR-2 method, UH=SWFWMD-256, Weighted-CN, Time Span=.-24. hrs, dt=.5 hrs Type III 24-hr 1 yr Rainfall=8.6" Area (ac) CN Description * % Pervious Area Tc Length Slope Velocity Capacity Description (min) (feet) (ft/ft) (ft/sec) (cfs) , Lag/CN Method, 1 Subcatchment 13S: Site to Exist Ditch on W PL Hydrograph Flow (cfs) cfs Type III 24-hr 1 yr Rainfall=8.6" Runoff Area=8.477 ac Runoff Volume=4.527 af Runoff Depth>6.41" Flow Length=1,1' Slope=.25 '/' Tc=62.3 min CN=83 Runoff Time (hours)
40 PRE DEVELOPMENT Type III 24-hr 1 yr Rainfall=8.6" Prepared by qes, llc Printed 2/5/214 HydroCAD 1. s/n M HydroCAD Software Solutions LLC Page 11 Summary for Subcatchment 14S: Site to W. Main St - Roadside Ditch Runoff = hrs, Volume= af, Depth> 6.53" Runoff by SCS TR-2 method, UH=SWFWMD-256, Weighted-CN, Time Span=.-24. hrs, dt=.5 hrs Type III 24-hr 1 yr Rainfall=8.6" Area (ac) CN Description % Grass cover, Fair, HSG D % Pervious Area Tc Length Slope Velocity Capacity Description (min) (feet) (ft/ft) (ft/sec) (cfs) ,.2.27 Lag/CN Method, 1 Subcatchment 14S: Site to W. Main St - Roadside Ditch Hydrograph Flow (cfs) cfs Type III 24-hr 1 yr Rainfall=8.6" Runoff Area=8.423 ac Runoff Volume=4.582 af Runoff Depth>6.53" Flow Length=1,' Slope=.2 '/' Tc=62.4 min CN=84 Runoff Time (hours)
41 PRE DEVELOPMENT Type III 24-hr 1 yr Rainfall=8.6" Prepared by qes, llc Printed 2/5/214 HydroCAD 1. s/n M HydroCAD Software Solutions LLC Page 12 Summary for Subcatchment 15S: Greenside Estates to rear ditch Runoff = hrs, Volume= af, Depth> 6.72" Runoff by SCS TR-2 method, UH=SWFWMD-256, Weighted-CN, Time Span=.-24. hrs, dt=.5 hrs Type III 24-hr 1 yr Rainfall=8.6" Area (ac) CN Description /2 acre lots, 25% imp, HSG D % Pervious Area % Impervious Area Tc Length Slope Velocity Capacity Description (min) (feet) (ft/ft) (ft/sec) (cfs) Sheet Flow, 1 Grass: Bermuda n=.41 P2= 5.4" Subcatchment 15S: Greenside Estates to rear ditch Hydrograph Flow (cfs) cfs Type III 24-hr 1 yr Rainfall=8.6" Runoff Area=4.618 ac Runoff Volume=2.587 af Runoff Depth>6.72" Flow Length=2' Slope=.15 '/' Tc=32.9 min CN=85 Runoff Time (hours)
42 PRE DEVELOPMENT Type III 24-hr 1 yr Rainfall=8.6" Prepared by qes, llc Printed 2/5/214 HydroCAD 1. s/n M HydroCAD Software Solutions LLC Page 13 Summary for Pond 3P: Exist Pond Inflow Area = ac,.% Impervious, Inflow Depth > 6.92" for 1 yr event Inflow = hrs, Volume= af Outflow = hrs, Volume= af, Atten= 44%, Lag= 58.6 min Primary = hrs, Volume= af Routing by Dyn-Stor-Ind method, Time Span=.-24. hrs, dt=.5 hrs Peak Elev= hrs Surf.Area= ac Storage= af Plug-Flow detention time= 14.2 min calculated for af (91% of inflow) Center-of-Mass det. time= 99.8 min ( ) Volume Invert Avail.Storage Storage Description #1 4.5' af Custom Stage Data (Prismatic)Listed below (Recalc) Elevation Surf.Area Inc.Store Cum.Store (feet) (acres) (acre-feet) (acre-feet) Device Routing Invert Outlet Devices #1 Primary 4.5' 42." Round Culvert L= 4.' CPP, projecting, no headwall, Ke=.9 Inlet / Outlet Invert= 4.5' / 4.42' S=.2 '/' Cc=.9 n=.2 Corrugated PE, corrugated interior, Flow Area= 9.62 sf Primary OutFlow Max= hrs HW=7.66' TW=.' (Dynamic Tailwater) 1=Culvert (Barrel Controls fps)
43 PRE DEVELOPMENT Type III 24-hr 1 yr Rainfall=8.6" Prepared by qes, llc Printed 2/5/214 HydroCAD 1. s/n M HydroCAD Software Solutions LLC Page 14 Pond 3P: Exist Pond Hydrograph Flow (cfs) Inflow Area= ac Peak Elev=7.66' Storage=4.956 af 42." Round Culvert n=.2 L=4.' S=.2 '/' 6.24 cfs cfs Inflow Primary Time (hours)
44 PRE DEVELOPMENT Type III 24-hr 1 yr Rainfall=8.6" Prepared by qes, llc Printed 2/5/214 HydroCAD 1. s/n M HydroCAD Software Solutions LLC Page 15 Summary for Link 9L: Bayou Francois Inflow Area = ac,.% Impervious, Inflow Depth > 6.73" for 1 yr event Inflow = hrs, Volume= af Primary = hrs, Volume= af, Atten= %, Lag=. min Primary outflow = Inflow, Time Span=.-24. hrs, dt=.5 hrs Link 9L: Bayou Francois Hydrograph cfs cfs Inflow Area= ac Inflow Primary Flow (cfs) Time (hours)
45 PRE DEVELOPMENT Type III 24-hr 1 yr Rainfall=8.6" Prepared by qes, llc Printed 2/5/214 HydroCAD 1. s/n M HydroCAD Software Solutions LLC Page 16 Summary for Link 15L: New River Inflow Area = ac, 2.21% Impervious, Inflow Depth > 6.41" for 1 yr event Inflow = hrs, Volume= af Primary = hrs, Volume= af, Atten= %, Lag=. min Primary outflow = Inflow, Time Span=.-24. hrs, dt=.5 hrs Link 15L: New River Hydrograph cfs cfs Inflow Area= ac Inflow Primary Flow (cfs) Time (hours)
46 PRE DEVELOPMENT Type III 24-hr 1 yr Rainfall=8.6" Prepared by qes, llc Printed 2/5/214 HydroCAD 1. s/n M HydroCAD Software Solutions LLC Page 17 Summary for Link 16L: Exist Greenside Estates Inflow Area = ac, 8.82% Impervious, Inflow Depth > 6.52" for 1 yr event Inflow = hrs, Volume= af Primary = hrs, Volume= af, Atten= %, Lag=. min Primary outflow = Inflow, Time Span=.-24. hrs, dt=.5 hrs Link 16L: Exist Greenside Estates Hydrograph cfs cfs Inflow Area=13.95 ac Inflow Primary Flow (cfs) Time (hours)
47 APPENDIX B POST--DEVELOPMENT HYDROCAD CALCS FOR A 1 YEAR STORM EVENT AND 1YR POND ROUTING CALCS
48 15S Greenside Estates to rear ditch 16L D Exist Greenside Estates Site to Exist Ditch on W PL B F C A Pond Area Site to W. Main St - Roadside Ditch Site to Cornerview (South) Site Interior 9L 3P 15L Bayou Francois New Pond New River 2S 5S Carver School (South) Carver School (North) E Site to Exist Ditch on E PL Subcat Reach Pond Link Routing Diagram for POST DEVELOPMENT Prepared by qes, llc, Printed 2/5/214 HydroCAD 1. s/n M HydroCAD Software Solutions LLC
49 POST DEVELOPMENT Prepared by qes, llc HydroCAD 1. s/n M HydroCAD Software Solutions LLC Printed 2/5/214 Page 2 Area (acres) CN Description (subcatchment-numbers) Area Listing (all nodes) (2S) (5S) (5S) /2 acre lots, 25% imp, HSG D (15S) /4 acre lots, 38% imp, HSG D (A, B, C, D, E, F) % Grass cover, Fair, HSG D (F) Green Space, HSG D (B) Water Surface, HSG D (B) TOTAL AREA
50 POST DEVELOPMENT Prepared by qes, llc HydroCAD 1. s/n M HydroCAD Software Solutions LLC Printed 2/5/214 Page 3 Line# Node Number In-Invert (feet) Out-Invert (feet) Pipe Listing (all nodes) Length (feet) Slope (ft/ft) n Diam/Width (inches) Height (inches) Inside-Fill (inches) 1 5S.. 1, A.. 1, B.. 1, E F P P
51 POST DEVELOPMENT Type III 24-hr 1 yr Rainfall=8.6" Prepared by qes, llc Printed 2/5/214 HydroCAD 1. s/n M HydroCAD Software Solutions LLC Page 4 Summary for Subcatchment 2S: Carver School (South) Runoff = hrs, Volume= af, Depth> 7.36" Runoff by SCS TR-2 method, UH=SWFWMD-256, Weighted-CN, Time Span=.-24. hrs, dt=.5 hrs Type III 24-hr 1 yr Rainfall=8.6" Area (ac) CN Description * % Pervious Area Tc Length Slope Velocity Capacity Description (min) (feet) (ft/ft) (ft/sec) (cfs) Lag/CN Method, 1 Subcatchment 2S: Carver School (South) Hydrograph Flow (cfs) cfs Type III 24-hr 1 yr Rainfall=8.6" Runoff Area=3.689 ac Runoff Volume=2.261 af Runoff Depth>7.36" Flow Length=4' Slope=.3 '/' Tc=19.6 min CN=9 Runoff Time (hours)
52 POST DEVELOPMENT Type III 24-hr 1 yr Rainfall=8.6" Prepared by qes, llc Printed 2/5/214 HydroCAD 1. s/n M HydroCAD Software Solutions LLC Page 5 Summary for Subcatchment 5S: Carver School (North) Runoff = hrs, Volume= af, Depth> 7.45" Runoff by SCS TR-2 method, UH=SWFWMD-256, Weighted-CN, Time Span=.-24. hrs, dt=.5 hrs Type III 24-hr 1 yr Rainfall=8.6" Area (ac) CN Description * * Weighted Average % Pervious Area Tc Length Slope Velocity Capacity Description (min) (feet) (ft/ft) (ft/sec) (cfs) Sheet Flow, 1 Grass: Short n=.15 P2= 5.4" Sheet Flow, 2 Smooth surfaces n=.11 P2= 5.4" Shallow Concentrated Flow, 3 Paved Kv= 2.3 fps 7.2 1, Pipe Channel, 4 24." Round Area= 3.1 sf Perim= 6.3' r=.5' n=.12 Concrete pipe, finished 31. 1,95 Total Subcatchment 5S: Carver School (North) Hydrograph Flow (cfs) cfs Type III 24-hr 1 yr Rainfall=8.6" Runoff Area= ac Runoff Volume=7.612 af Runoff Depth>7.45" Flow Length=1,95' Tc=31. min CN= Time (hours) Runoff
53 POST DEVELOPMENT Type III 24-hr 1 yr Rainfall=8.6" Prepared by qes, llc Printed 2/5/214 HydroCAD 1. s/n M HydroCAD Software Solutions LLC Page 6 Summary for Subcatchment 15S: Greenside Estates to rear ditch Runoff = hrs, Volume= af, Depth> 6.72" Runoff by SCS TR-2 method, UH=SWFWMD-256, Weighted-CN, Time Span=.-24. hrs, dt=.5 hrs Type III 24-hr 1 yr Rainfall=8.6" Area (ac) CN Description /2 acre lots, 25% imp, HSG D % Pervious Area % Impervious Area Tc Length Slope Velocity Capacity Description (min) (feet) (ft/ft) (ft/sec) (cfs) Sheet Flow, 1 Grass: Bermuda n=.41 P2= 5.4" Subcatchment 15S: Greenside Estates to rear ditch Hydrograph Flow (cfs) cfs Type III 24-hr 1 yr Rainfall=8.6" Runoff Area=4.618 ac Runoff Volume=2.587 af Runoff Depth>6.72" Flow Length=2' Slope=.15 '/' Tc=32.9 min CN=85 Runoff Time (hours)
54 POST DEVELOPMENT Type III 24-hr 1 yr Rainfall=8.6" Prepared by qes, llc Printed 2/5/214 HydroCAD 1. s/n M HydroCAD Software Solutions LLC Page 7 Summary for Subcatchment A: Site Interior Runoff = hrs, Volume= af, Depth> 6.96" Runoff by SCS TR-2 method, UH=SWFWMD-256, Weighted-CN, Time Span=.-24. hrs, dt=.5 hrs Type III 24-hr 1 yr Rainfall=8.6" Area (ac) CN Description /4 acre lots, 38% imp, HSG D % Pervious Area % Impervious Area Tc Length Slope Velocity Capacity Description (min) (feet) (ft/ft) (ft/sec) (cfs) Sheet Flow, 1 Grass: Bermuda n=.41 P2= 5.4" Shallow Concentrated Flow, 2 Paved Kv= 2.3 fps 4.8 1, Pipe Channel, 3 24." Round Area= 3.1 sf Perim= 6.3' r=.5' n=.12 Concrete pipe, finished ,33 Total Subcatchment A: Site Interior Hydrograph Flow (cfs) cfs Type III 24-hr 1 yr Rainfall=8.6" Runoff Area= ac Runoff Volume= af Runoff Depth>6.96" Flow Length=1,33' Tc=32.6 min CN=87 Runoff Time (hours)
55 POST DEVELOPMENT Type III 24-hr 1 yr Rainfall=8.6" Prepared by qes, llc Printed 2/5/214 HydroCAD 1. s/n M HydroCAD Software Solutions LLC Page 8 Summary for Subcatchment B: Pond Area Runoff = hrs, Volume= af, Depth> 7.21" Runoff by SCS TR-2 method, UH=SWFWMD-256, Weighted-CN, Time Span=.-24. hrs, dt=.5 hrs Type III 24-hr 1 yr Rainfall=8.6" Area (ac) CN Description /4 acre lots, 38% imp, HSG D * Green Space, HSG D Water Surface, HSG D Weighted Average % Pervious Area % Impervious Area Tc Length Slope Velocity Capacity Description (min) (feet) (ft/ft) (ft/sec) (cfs) Sheet Flow, 1 Grass: Bermuda n=.41 P2= 5.4" Shallow Concentrated Flow, 2 Paved Kv= 2.3 fps 4.8 1, Pipe Channel, 3 24." Round Area= 3.1 sf Perim= 6.3' r=.5' n=.12 Concrete pipe, finished ,33 Total Subcatchment B: Pond Area Hydrograph Flow (cfs) cfs Type III 24-hr 1 yr Rainfall=8.6" Runoff Area= ac Runoff Volume=7.491 af Runoff Depth>7.21" Flow Length=1,33' Tc=32.6 min CN= Time (hours) Runoff
56 POST DEVELOPMENT Type III 24-hr 1 yr Rainfall=8.6" Prepared by qes, llc Printed 2/5/214 HydroCAD 1. s/n M HydroCAD Software Solutions LLC Page 9 Summary for Subcatchment C: Site to Cornerview (South) Runoff = hrs, Volume= 1.27 af, Depth> 6.96" Runoff by SCS TR-2 method, UH=SWFWMD-256, Weighted-CN, Time Span=.-24. hrs, dt=.5 hrs Type III 24-hr 1 yr Rainfall=8.6" Area (ac) CN Description /4 acre lots, 38% imp, HSG D % Pervious Area % Impervious Area Tc Length Slope Velocity Capacity Description (min) (feet) (ft/ft) (ft/sec) (cfs) Sheet Flow, 1 Grass: Bermuda n=.41 P2= 5.4" Subcatchment C: Site to Cornerview (South) Hydrograph Flow (cfs) cfs Type III 24-hr 1 yr Rainfall=8.6" Runoff Area=1.771 ac Runoff Volume=1.27 af Runoff Depth>6.96" Flow Length=12' Slope=.5 '/' Tc=34. min CN=87 Runoff Time (hours)
57 POST DEVELOPMENT Type III 24-hr 1 yr Rainfall=8.6" Prepared by qes, llc Printed 2/5/214 HydroCAD 1. s/n M HydroCAD Software Solutions LLC Page 1 Summary for Subcatchment D: Site to Exist Ditch on W PL Runoff = hrs, Volume= af, Depth> 6.98" Runoff by SCS TR-2 method, UH=SWFWMD-256, Weighted-CN, Time Span=.-24. hrs, dt=.5 hrs Type III 24-hr 1 yr Rainfall=8.6" Area (ac) CN Description /4 acre lots, 38% imp, HSG D % Pervious Area % Impervious Area Tc Length Slope Velocity Capacity Description (min) (feet) (ft/ft) (ft/sec) (cfs) Sheet Flow, 1 Grass: Bermuda n=.41 P2= 5.4" Subcatchment D: Site to Exist Ditch on W PL Hydrograph Flow (cfs) cfs Type III 24-hr 1 yr Rainfall=8.6" Runoff Area=1.914 ac Runoff Volume=1.114 af Runoff Depth>6.98" Flow Length=8' Slope=.5 '/' Tc=24.6 min CN=87 Runoff Time (hours)
58 POST DEVELOPMENT Type III 24-hr 1 yr Rainfall=8.6" Prepared by qes, llc Printed 2/5/214 HydroCAD 1. s/n M HydroCAD Software Solutions LLC Page 11 Summary for Subcatchment E: Site to Exist Ditch on E PL Runoff = hrs, Volume=.954 af, Depth> 6.97" Runoff by SCS TR-2 method, UH=SWFWMD-256, Weighted-CN, Time Span=.-24. hrs, dt=.5 hrs Type III 24-hr 1 yr Rainfall=8.6" Area (ac) CN Description /4 acre lots, 38% imp, HSG D % Pervious Area % Impervious Area Tc Length Slope Velocity Capacity Description (min) (feet) (ft/ft) (ft/sec) (cfs) Sheet Flow, 1 Grass: Bermuda n=.41 P2= 5.4" Pipe Channel, 2 15." Round Area= 1.2 sf Perim= 3.9' r=.31' n=.2 Corrugated PE, corrugated interior Total Subcatchment E: Site to Exist Ditch on E PL Hydrograph Flow (cfs) cfs Type III 24-hr 1 yr Rainfall=8.6" Runoff Area=1.641 ac Runoff Volume=.954 af Runoff Depth>6.97" Flow Length=43' Tc=28.4 min CN=87 Runoff Time (hours)
59 POST DEVELOPMENT Type III 24-hr 1 yr Rainfall=8.6" Prepared by qes, llc Printed 2/5/214 HydroCAD 1. s/n M HydroCAD Software Solutions LLC Page 12 Summary for Subcatchment F: Site to W. Main St - Roadside Ditch Runoff = hrs, Volume= 2.61 af, Depth> 6.85" Runoff by SCS TR-2 method, UH=SWFWMD-256, Weighted-CN, Time Span=.-24. hrs, dt=.5 hrs Type III 24-hr 1 yr Rainfall=8.6" Area (ac) CN Description % Grass cover, Fair, HSG D /4 acre lots, 38% imp, HSG D /4 acre lots, 38% imp, HSG D Weighted Average % Pervious Area % Impervious Area Tc Length Slope Velocity Capacity Description (min) (feet) (ft/ft) (ft/sec) (cfs) Sheet Flow, 1 Grass: Bermuda n=.41 P2= 5.4" Shallow Concentrated Flow, 2 Grassed Waterway Kv= 15. fps Pipe Channel, 3 12." Round Area=.8 sf Perim= 3.1' r=.25' n=.12 Concrete pipe, finished Total Subcatchment F: Site to W. Main St - Roadside Ditch Hydrograph Flow (cfs) cfs Type III 24-hr 1 yr Rainfall=8.6" Runoff Area=4.559 ac Runoff Volume=2.61 af Runoff Depth>6.85" Flow Length=39' Tc=31.3 min CN=86 Runoff Time (hours)
60 POST DEVELOPMENT Type III 24-hr 1 yr Rainfall=8.6" Prepared by qes, llc Printed 2/5/214 HydroCAD 1. s/n M HydroCAD Software Solutions LLC Page 13 Summary for Pond 3P: New Pond Inflow Area = ac, 3.39% Impervious, Inflow Depth > 7.16" for 1 yr event Inflow = hrs, Volume= af Outflow = hrs, Volume= af, Atten= 69%, Lag= 1. min Primary = hrs, Volume= af Secondary =. hrs, Volume=. af Routing by Dyn-Stor-Ind method, Time Span=.-24. hrs, dt=.5 hrs Peak Elev= hrs Surf.Area= 19,181 sf Storage= 57,474 cf Plug-Flow detention time= min calculated for af (96% of inflow) Center-of-Mass det. time= 15.1 min ( ) Volume Invert Avail.Storage Storage Description #1 4.' 8,695 cf Custom Stage Data (Prismatic)Listed below (Recalc) Elevation Surf.Area Inc.Store Cum.Store (feet) (sq-ft) (cubic-feet) (cubic-feet) , , ,958 8,695 Device Routing Invert Outlet Devices #1 Device 2 4.' 42." Round Culvert L= 66.' CMP, square edge headwall, Ke=.5 Inlet / Outlet Invert= 4.' / 3.1' S=.14 '/' Cc=.9 n=.25 Corrugated metal, Flow Area= 9.62 sf #2 Primary 8.2' 24." x 24." Horiz. Orifice/Grate C=.6 Limited to weir flow at low heads #3 Primary 5.5' 36." W x 6." H Vert. Orifice/Grate X 3. C=.6 #4 Secondary 8.6' 15." Round Culvert X 2. L= 2.' RCP, groove end w/headwall, Ke=.2 Inlet / Outlet Invert= 8.6' / 7.' S=.8 '/' Cc=.9 n=.12 Concrete pipe, finished, Flow Area= 1.23 sf Primary OutFlow Max= hrs HW=8.54' TW=.' (Dynamic Tailwater) 2=Orifice/Grate (Weir Controls fps) 1=Culvert (Passes 5.3 cfs of cfs potential flow) 3=Orifice/Grate (Orifice Controls fps) Secondary OutFlow Max=. hrs HW=4.' TW=.' (Dynamic Tailwater) 4=Culvert ( Controls. cfs)
61 POST DEVELOPMENT Type III 24-hr 1 yr Rainfall=8.6" Prepared by qes, llc Printed 2/5/214 HydroCAD 1. s/n M HydroCAD Software Solutions LLC Page 14 Pond 3P: New Pond Hydrograph cfs Inflow Area= ac Peak Elev=8.55' Storage=57,474 cf Inflow Outflow Primary Secondary Flow (cfs) cfs cfs cfs Time (hours)
62 POST DEVELOPMENT Type III 24-hr 1 yr Rainfall=8.6" Prepared by qes, llc Printed 2/5/214 HydroCAD 1. s/n M HydroCAD Software Solutions LLC Page 15 Summary for Link 9L: Bayou Francois Inflow Area = 5.46 ac, 12.33% Impervious, Inflow Depth > 7.23" for 1 yr event Inflow = hrs, Volume= af Primary = hrs, Volume= af, Atten= %, Lag=. min Primary outflow = Inflow, Time Span=.-24. hrs, dt=.5 hrs Link 9L: Bayou Francois Hydrograph Flow (cfs) cfs cfs Inflow Area=5.46 ac Time (hours) Inflow Primary
63 POST DEVELOPMENT Type III 24-hr 1 yr Rainfall=8.6" Prepared by qes, llc Printed 2/5/214 HydroCAD 1. s/n M HydroCAD Software Solutions LLC Page 16 Summary for Link 15L: New River Inflow Area = ac, 29.76% Impervious, Inflow Depth > 6.84" for 1 yr event Inflow = hrs, Volume= af Primary = hrs, Volume= af, Atten= %, Lag=. min Primary outflow = Inflow, Time Span=.-24. hrs, dt=.5 hrs Link 15L: New River Hydrograph cfs cfs Inflow Area= ac Inflow Primary Flow (cfs) Time (hours)
64 POST DEVELOPMENT Type III 24-hr 1 yr Rainfall=8.6" Prepared by qes, llc Printed 2/5/214 HydroCAD 1. s/n M HydroCAD Software Solutions LLC Page 17 Summary for Link 16L: Exist Greenside Estates Inflow Area = ac, 28.81% Impervious, Inflow Depth > 6.8" for 1 yr event Inflow = hrs, Volume= 3.71 af Primary = hrs, Volume= 3.71 af, Atten= %, Lag=. min Primary outflow = Inflow, Time Span=.-24. hrs, dt=.5 hrs Link 16L: Exist Greenside Estates Hydrograph Flow (cfs) cfs 18.3 cfs Inflow Area=6.532 ac Time (hours) Inflow Primary
65 POST DEVELOPMENT Type III 24-hr 1 yr Rainfall=12.6" Prepared by qes, llc Printed 2/5/214 HydroCAD 1. s/n M HydroCAD Software Solutions LLC Page 1 Summary for Pond 3P: New Pond Inflow Area = ac, 3.39% Impervious, Inflow Depth > 11.7" for 1 yr event Inflow = hrs, Volume= af Outflow = hrs, Volume= af, Atten= 63%, Lag= 82.3 min Primary = hrs, Volume= af Secondary = hrs, Volume= af Routing by Dyn-Stor-Ind method, Time Span=.-24. hrs, dt=.5 hrs Peak Elev= hrs Surf.Area= 27,65 sf Storage= 729,452 cf Plug-Flow detention time= min calculated for af (95% of inflow) Center-of-Mass det. time= min ( ) Volume Invert Avail.Storage Storage Description #1 4.' 8,695 cf Custom Stage Data (Prismatic)Listed below (Recalc) Elevation Surf.Area Inc.Store Cum.Store (feet) (sq-ft) (cubic-feet) (cubic-feet) , , ,958 8,695 Device Routing Invert Outlet Devices #1 Device 2 4.' 42." Round Culvert L= 66.' CMP, square edge headwall, Ke=.5 Inlet / Outlet Invert= 4.' / 3.1' S=.14 '/' Cc=.9 n=.25 Corrugated metal, Flow Area= 9.62 sf #2 Primary 8.2' 24." x 24." Horiz. Orifice/Grate C=.6 Limited to weir flow at low heads #3 Primary 5.5' 36." W x 6." H Vert. Orifice/Grate X 3. C=.6 #4 Secondary 8.6' 15." Round Culvert X 2. L= 2.' RCP, groove end w/headwall, Ke=.2 Inlet / Outlet Invert= 8.6' / 7.' S=.8 '/' Cc=.9 n=.12 Concrete pipe, finished, Flow Area= 1.23 sf Primary OutFlow Max= hrs HW=9.66' TW=.' (Dynamic Tailwater) 2=Orifice/Grate (Orifice Controls fps) 1=Culvert (Passes cfs of cfs potential flow) 3=Orifice/Grate (Orifice Controls fps) Secondary OutFlow Max= hrs HW=9.66' TW=.' (Dynamic Tailwater) 4=Culvert (Barrel Controls fps)
66 POST DEVELOPMENT Type III 24-hr 1 yr Rainfall=12.6" Prepared by qes, llc Printed 2/5/214 HydroCAD 1. s/n M HydroCAD Software Solutions LLC Page 2 Pond 3P: New Pond Hydrograph Flow (cfs) cfs Inflow Area= ac Peak Elev=9.66' Storage=729,452 cf cfs cfs 8.49 cfs Time (hours) Inflow Outflow Primary Secondary
67 APPENDIX C APPROVED G.W. CARVER SCHOOL DRAINAGE IMPACT STUDY
68
69
70
71

72

73
74
75
76
77
78
79
80
81
82
83
84
85
86
87
88
89 APPENDIX D G.W. CARVER SCHOOL STORM DRAINAGE AS-BUILT
90


91 Traffic Impact Study Legacy Oaks Subdivision Ascension Parish Prepared for: P.O Box 741, Prairieville, LA 7769 February 5, 214 Neel-Schaffer, Inc. Neel-Schaffer, Inc. Neel-Schaffer, Inc. Neel-Schaffer, Inc Bricksome Avenue 83 Coolidge Boulevard 8 Jackson Street 6425 Youree Drive Baton Rouge, LA 7816 Lafayette, LA 7596 Mandeville, LA 7448 Shreveport, LA 7115
92 Table of Contents Executive Summary I Introduction... 1 II Existing Conditions and Traffic Volumes... 4 III Future Conditions... 6 IV Analyses... 9 V Conclusions and Recommendations List of Figures Figure 1: Vicinity Map... 2 Figure 2: Site Plan... 3 Figure 3: Existing Peak Hour Volumes... 5 Figure 4: Trip Generation Volumes... 7 Figure 5: Future Build Peak Hour Volumes... 8 List of Tables Table 1: Trip Generation... 6 Table 2: Roadway Analyses... 9 Table 3: Intersection of LA 429 (Cornerview Road) at Legacy Oaks Lane... 1 Table 4: Intersection of LA 429 (Cornerview Road) at Boudreaux Road Table 5: Intersection of LA 429 (Cornerview Road) at LA Neel-Schaffer, Inc. LA\Ascension\1189\Submittal\Report.docx Baton Rouge, LA. February 5, 214
93 Executive Summary The proposed Legacy Oaks Subdivision will include 155 Single Family Detached Housing lots and will be located on the north side of LA 429 (Cornerview Road) in Ascension Parish, Louisiana. The analyses performed indicate that this development will not have a significant impact on LA 429 (Cornerview Road) in the vicinity of this development. Upon completion of the development the intersection of LA 429 (Cornerview Road) at the Legacy Oaks Lane is anticipated to operate at an acceptable Levels of Service (LOS) during the AM and PM peaks. In addition, this development will not have a significant impact on the LOS at the intersections of LA 429 (Cornerview Road) at LA 44 and LA 429 (Cornerview Road) at Boudreaux Road. Neel-Schaffer, Inc. LA\Ascension\1189\Submittal\Report.docx Baton Rouge, LA. February 5, 214
94 I Introduction This study is in reference to the proposed Legacy Oaks Subdivision which is to be located on the north side of LA 429 (Cornerview Road) in Ascension Parish, Louisiana. A vicinity map of the development is shown in Figure 1. The proposed development will consist of 155 single-family homes. The proposed development will directly access LA 429 (Cornerview Road) via Legacy Oaks Lane. Legacy Oaks Lane is the existing driveway for G.W. Carver Elementary School. A site plan is shown in Figure 2. The purpose of this study is to evaluate the impact of the development at the intersections of LA 429 (Cornerview Road) at Legacy Oaks Lane, LA 429 (Cornerview Road) at LA 44, and LA 429 (Cornerview Road) at Boudreaux Road. Methodology The analyses performed include the following elements: Determined existing traffic counts at relevant intersections to the study area from counts performed by Neel-Schaffer, Inc (NSI). Determined future generated trips using the ITE Trip Generation Handbook, 9 th edition. Distributed generated trips onto adjacent roadway and intersections for both AM and PM peak periods. Determined the capacity and Levels of Service (LOS) of unsignalized intersections using the HCM 2 Unsignalized module of the Synchro Software (Version 8). Determined the capacity and Levels of Service (LOS) of signalized intersections using the HCM 2 Signalized module of the Synchro Software (Version 8). Performed Left Turn Lane Warrants Analyses using Figure 2-5 of the National Cooperative Highway Research Program (NCHRP) Report 457 Evaluating Intersection Improvements: An Engineering Study Guide. Determined LOS of the adjacent roadway segment using the Two-Lane Highway module of the Highway Capacity Software (HCS21), Version 6.4. Neel-Schaffer, Inc. LA\Ascension\1189\Submittal\Report.docx Baton Rouge, LA. February 5, 214 1


95
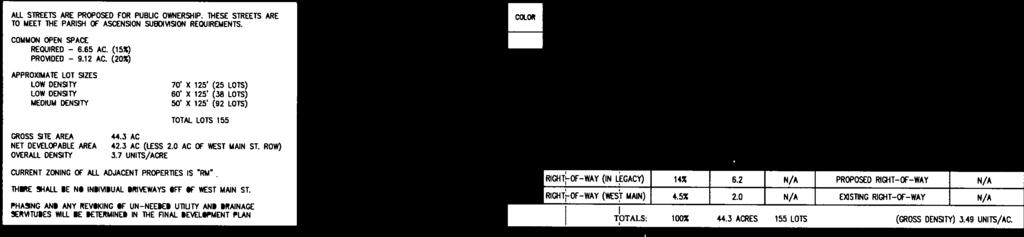
 FIGURE 2: SITE PLAN LEGEND: QTY. 92 5' LOTS 38 6' LOTS 25 7' LOTS 4.2 AC. POND 5. AC. COMMON SPACE 155 TOTAL LOTS")
96 N LEGACY OAKS - PRELIMINARY LAYOUT SITE SUMMARY: SITE: (44.3 AC.) LOTS: PARK: ROAD: 155 PROPOSED LOTS 4. AC. PROPOSED (5,325 L.F.) FIGURE 2: SITE PLAN LEGEND: QTY. 92 5' LOTS 38 6' LOTS 25 7' LOTS 4.2 AC. POND 5. AC. COMMON SPACE 155 TOTAL LOTS
97 II Existing Conditions and Traffic Volumes LA 429 (Cornerview Road) in the vicinity of the development is a two (2) lane roadway with a posted speed limit of 45 miles per hour (mph). A twenty-four (24) hour count on LA 429 (Cornerview Road) adjacent to the proposed site indicates that LA 429 (Cornerview Road) currently accommodates approximately 4,7 vehicles per day. The intersection of LA 429 (Cornerview Road) at Legacy Oaks Lane is a three (3) legged unsignalized intersection with stop control for the southbound approach on Legacy Oaks Lane. The southbound approach consists of one (1) shared left/right turn lane. The westbound approach on LA 429 (Cornerview Road) consists of one (1) exclusive right turn lane and one (1) through lane. The eastbound approach consists of one (1) through lane. Turning movement counts at this intersection, collected by NSI personnel on January 15, 214, indicate that the AM peak occurs from 7: to 8: AM and the PM peak occurs from 4:15 to 5:15 PM. These volumes are shown in Figure 3 and are also provided in the Appendix. The intersection of LA 429 (Cornerview Road) at Boudreaux Road is a three (3) legged unsignalized intersection with stop control for the northbound approach on Boudreaux Road. The northbound approach consists of one (1) exclusive left turn lane and one (1) exclusive right turn lane. The eastbound approach on LA 429 (Cornerview Road) consists of one (1) shared through/right lane and the westbound approach consists of one (1) shared through/left lane. Turning movement counts at this intersection, collected by NSI personnel on January 15, 214, indicate that the AM peak occurs from 7: to 8: AM and the PM peak occurs from 4:45 to 5:45 PM. These volumes are shown in Figure 3 and are also provided in the Appendix. The intersection of LA 44 at LA 429 (Cornerview Road) is a four (4) legged signalized intersection that operates as a semi-actuated intersection. The left turn phases for all approaches consist of protected/permitted operations. The northbound and southbound approaches on LA 44 consist of one (1) exclusive left turn lane, one (1) through lane and one (1) shared through/right lane. The eastbound and westbound approaches on LA 429 (Cornerview Road) consists of one (1) exclusive left turn lane and one (1) shared through/right lane. Turning movement counts at this intersection, collected by Reliable Traffic Data Services, LLC personnel on November 2, 213, indicate that the AM peak occurs from 7: to 8: AM and the PM peak occurs from 4:3 to 5:3 PM. These volumes are shown in Figure 3 and are also provided in the Appendix. Neel-Schaffer, Inc. LA\Ascension\1189\Submittal\Report.docx Baton Rouge, LA. February 5, 214 4
98 LA 429 LA 44 8 (28) 89 (154) 1 (154) (37) 37 (531) 676 (55) (159) 384 (89) 141 (18) (119) 39 (22) 131 (145) 154 G.W. CARVER SCHOOL 116 (12) 97 (159) 73 (1) 57 (6) 59 (52) 47 (92) (34) 77 (12) 22 (3) 48 (343) 135 (126) 86 (333) 113 BOUDREAUX ROAD FIGURE 3: EXISTING PEAK HOUR VOLUMES AM (PM) LEGACY OAKS SUBDIVISION TIS ASCENSION PARISH
99 III Future Conditions Additional traffic generated by this development was determined using the Institute of Transportation Engineers (ITE) Trip Generation Manual, 9 th edition. The additional traffic generated was determined using the land use for 155 Single Family Detached Housing dwelling units. A summary of the AM and PM peak generated trips is shown in Table 1. Land Use Single Family Detached Housing Table 1: Trip Generation AM Peak Entering AM Peak Exiting PM Peak Entering PM Peak Exiting These generated traffic volumes were distributed onto LA 429 (Cornerview Road) based on existing traffic patterns. The AM and PM peak distribution of generated volumes are shown in Figure 4. By adding the generated traffic from the proposed development to the existing traffic volumes on LA 429 (Cornerview Road), existing plus generated turning volumes were estimated. These existing and generated turning movement counts are shown in Figure 5. Neel-Schaffer, Inc. LA\Ascension\1189\Submittal\Report.docx Baton Rouge, LA. February 5, 214 6
100 LA % (13%) 12% (15%) LA 44 23% (39%) 4% (22%) 31% (44%) 5% (31%) 4 (13) 9 (44) (22) 12 (23) 21 (9) 11 (18) 45 G.W. CARVER SCHOOL 25 (79) (5) 77 (8) 13 (21) 5 6 (4) 7 (4) 2 (5) (16) 3 6% (5%) 8% (7%) BOUDREAUX ROAD 7% (8%) 11% (16%) FIGURE 4: TRIP GENERATION VOLUMES AM (PM) HOLLOWS AT DUTCHTOWN TIS ASCENSION PARISH
101 LA 429 LA 44 8 (28) 93 (167) 1 (154) (37) 37 (531) 676 (77) (159) 384 (89) 15 (224) (142) 6 (211) 142 (163) 199 G.W. CARVER SCHOOL 141 (91) 97 (159) 79 (14) 64 (64) 61 (57) 47 (92) (84) 154 (2) 35 (24) 53 (343) 135 (126) 86 (349) 116 BOUDREAUX ROAD FIGURE 5: FUTURE PEAK HOUR VOLUMES AM (PM) LEGACY OAKS SUBDIVISION TIS ASCENSION PARISH
102 IV Analyses Turn Lane Analysis By using existing plus generated traffic volumes for the development, the left turn-lane warrant analysis was performed for the intersection LA 429 (Cornerview Road) at Legacy Oaks Lane. The left turn-lane warrant analyses were performed using National Cooperative Highway Research Program (NCHRP) Report Number 457 entitled Evaluating Intersection Improvements. The analyses indicated that the generated volume does not warrants an exclusive left turn lane for the eastbound approach on LA 429 (Cornerview Road). Detailed turn-lane analyses for the generated volumes are provided in the Appendix. Roadway Analysis By using existing and existing plus generated traffic volumes for the development, roadway analyses were performed for LA 429 (Cornerview Road) in the vicinity of the proposed development. The roadway analyses were performed using the Highway Capacity Software (HCS 21), Version 6.4. The LOS analyses for this roadway during the AM and PM peaks upon completion of the development are presented in Table 2. Detailed roadway analyses are provided in the Appendix. Table 2: Roadway Analyses Hour Scenario LOS AM Peak Existing B Build B Existing B PM Peak Build B These analyses indicate that this development will not have an impact on the existing LOS of LA 429 (Cornerview Road) during the AM and PM peak. Sight Distance Analyses NSI personnel performed intersection sight distance evaluation along LA 429 (Cornerview Road) at the intersection of LA 429 (Cornerview Road) at Legacy Oaks Lane. The left turn and right turn movements for the driveway were observed to have sight distances exceeding 6 feet. As per AASHTO s A Policy on Geometric Design of Highways and Streets (211), the recommended minimum sight distance for a vehicle performing a left turn maneuver onto a major roadway with a design speed of 45 mph is 5 ft. Similarly, the recommended sight distance for a vehicle performing a right turn maneuver onto a major roadway is 43 ft. Neel-Schaffer, Inc. LA\Ascension\1189\Submittal\Report.docx Baton Rouge, LA. February 5, 214 9
103 Crash Analyses The historic crash data on LA 429 (Cornerview Road) within the vicinity of the proposed development was obtained from LADOTD. The summary of the four (4) years crash data indicates that there are no crashes on LA 429 (Cornerview Road) within 1 feet from the intersection of LA 429 (Cornerview Road) and Legacy Oaks Lane. Unsignalized Intersection Analysis By using traffic volumes for existing and full build out of the development, unsignalized intersection analyses were performed for the intersections of LA 429 (Cornerview Road) at Legacy Oaks Lane and LA 429 (Cornerview Road) at Boudreaux Road during the AM and PM peaks. The unsignalized intersection analyses were performed using the HCM 2 Unsignalized module of the Synchro Software (Version 8). LA 429 (Cornerview Road) at Legacy Oaks Lane The LOS analyses for this intersection during the AM and PM peaks upon completion of the development are presented in Table 3. These analyses are presented in the Appendix. Table 3: Intersection of LA 429 (Cornerview Road) at Legacy Oaks Lane EBL SB Hour Scenario LOS / Delay LOS / Delay Existing A / 2.3 B / 11.4 AM Peak Build A / 2.5 B / 13.1 Existing A /.1 B / 11.9 PM Peak Build A /.7 B / 13.9 Delay seconds/vehicle These analyses indicate that upon completion of the development, the LA 429 (Cornerview Road) approaches are anticipated to operate at LOS A during AM and PM peak periods. The approach on Legacy Oaks Lane is anticipated to operate at a LOS B during AM and PM peaks. LOS B is considered as an acceptable LOS, therefore no roadway improvements are recommended. Neel-Schaffer, Inc. LA\Ascension\1189\Submittal\Report.docx Baton Rouge, LA. February 5, 214 1
104 LA 429 (Cornerview Road) at Boudreaux Road The LOS analyses for this intersection during the AM and PM peaks upon completion of the development are presented in Table 4. These analyses are presented in the Appendix. Table 4: Intersection of LA 429 (Cornerview Road) at Boudreaux Road NB WBL Hour Scenario LOS / Delay LOS / Delay AM Peak Existing B / 1.4 A / 3.6 Build B / 1.5 A / 3.7 PM Peak Existing C / 15. A / 3.6 Build C / 15.5 A / 3.7 Delay seconds/vehicle These analyses indicate that this development will not have an impact on this intersection during the AM and PM peaks. Signalized Intersection Analysis By using traffic volumes for existing and full build out of the development, signalized intersection analyses were performed for intersections of LA 429 (Cornerview Road) at LA 44 during the AM and PM peaks. The signalized intersection analyses were performed using the HCM 2 Signalized module of the Synchro Software (Version 8). LA 429 (Cornerview Road) at LA 44 The LOS analyses for this intersection during the AM and PM peaks upon completion of the development are presented in Table 5. These analyses are presented in the Appendix. Table 5: Intersection of LA 429 (Cornerview Road) at LA 44 NB SB EB WB Overall Hour Scenario LOS / Delay LOS / Delay LOS / Delay LOS / Delay LOS / Delay Existing B / 18.2 C / 25.6 D / 5.8 D / 35.4 C / 28.6 AM Peak Build C / 2.5 C / 28.5 D / 49.4 D / 33.6 C / 3.8 Existing C / 23.4 C / 21.6 D / 44.9 D / 47.6 C / 29.8 PM Peak Build C / 24.8 C / 22.6 D / 46.3 D / 5.4 C / 31.5 Delay seconds/vehicle These analyses indicate that this development will not have an impact on this intersection during the AM and PM peaks. Neel-Schaffer, Inc. LA\Ascension\1189\Submittal\Report.docx Baton Rouge, LA. February 5,
105 V Conclusions and Recommendations The proposed Legacy Oaks Subdivision will include 155 Single Family Detached Housing lots and will be located on the north side of LA 429 (Cornerview Road) in Ascension Parish, Louisiana. The analyses performed indicate that this development will not have a significant impact on LA 429 (Cornerview Road) in the vicinity of this development. Upon completion of the development the intersection of LA 429 (Cornerview Road) at the Legacy Oaks Lane is anticipated to operate at an acceptable Levels of Service (LOS) during the AM and PM peaks. In addition, this development will not have a significant impact on the LOS at the intersections of LA 429 (Cornerview Road) at LA 44 and LA 429 (Cornerview Road) at Boudreaux Road. Neel-Schaffer, Inc. LA\Ascension\1189\Submittal\Report.docx Baton Rouge, LA. February 5,
106 APPENDIX
107 Trip Generation
108 Trip Generation Summary - Phase 1 Average Weekday Driveway Volumes Project: Alternative: Legacy Oaks Subdivision Alternative 1 Open Date: Analysis 1/24/214 1/24/214 AM Peak Hour PM Peak Hour Average Daily Trips Adjacent Street Traffic Adjacent Street Traffic ITE Land Use Enter Exit Total Enter Exit Total Enter Exit Total 21 SFHOUSE Dwelling Units Unadjusted Driveway Volume Unadjusted Pass-By Trips Internal Capture Trips Adjusted Driveway Volume Adjusted Pass-By Trips Adjusted Volume Added to Adjacent Streets Total AM Peak Hour Internal Capture = Percent Total PM Peak Hour Internal Capture = Percent Source: Institute of Transportation Engineers, Trip Generation Manual 9th Edition, 212 TRIP GENERATION 213, TRAFFICWARE, LLC 1
109 Detailed Land Use Data For 157 Dwelling Units of SFHOUSE 1 ( 21 ) Single-Family Detached Housing Project: Phase: Description: Legacy Oaks Subdivision Phase 1 Traffic Impact Study Open Date: Analysis Date: 1/24/214 1/24/214 Day / Period Total Trips Pass-By Trips Avg Rate Min Rate Max Rate Std Dev Avg Size % % Enter Exit Use Eq. Equation R2 Weekday Average Daily Trips True Ln(T) =.92 Ln(X) Weekday AM Peak Hour of Adjacent Street Traffic True T =.7(X) Weekday PM Peak Hour of Adjacent Street Traffic True Ln(T) =.9 Ln(X) Source: Institute of Transportation Engineers, Trip Generation Manual 9th Edition, 212 TRIP GENERATION 213, TRAFFICWARE, LLC 1
110 Neel-Schaffer, Inc Bricksome Ave, Baton Rouge, LA 7816 Page 1 Site Code: 1189 Station ID: LA 429 Just west of Legancy Oaks Ln. Latitude: '. Undefined Start 15-Jan-14 Eastbound Hour Totals Westbound Hour Totals Combined Totals Time Wed Morning Afternoon Morning Afternoon Morning Afternoon Morning Afternoon Morning Afternoon 12: : : : : : : : : : : : : : : : : : : : : : : : : : : : : : : : : : : : : : : : : : : : : : : : Total Percent 32.5% 67.5% 41.2% 58.8% 36.6% 63.4%
111 Neel-Schaffer, Inc Bricksome Ave, Baton Rouge, LA 7816 Page 2 Site Code: 1189 Station ID: LA 429 Just west of Legancy Oaks Ln. Latitude: '. Undefined Start 16-Jan-14 Eastbound Hour Totals Westbound Hour Totals Combined Totals Time Thu Morning Afternoon Morning Afternoon Morning Afternoon Morning Afternoon Morning Afternoon 12: : : : : : : : : : : : : : : : : : : : : : : : : : : : : : : : : : : : : : : : : : : : : : : : Total Percent 32.7% 67.3% 4.1% 59.9% 36.1% 63.9% Grand Total Percent 32.6% 67.4% 4.7% 59.3% 36.4% 63.6% ADT ADT 4,66 AADT 4,66
112 Turn Lane Warrant Analysis
113 Legacy Oaks Subdivision LA 429 EBL - Existing AM Peak Figure 2-5. Guideline for determining the need for a major-road left-turn bay at a two-way stop-controlled intersection. 2-lane roadway (English) INPUT Variable 85 th percentile speed, mph: Percent of left-turns in advancing volume (V A ), %: Advancing volume (V A ), veh/h: Opposing volume (V O ), veh/h: OUTPUT Variable Limiting advancing volume (V A ), veh/h: Guidance for determining the need for a major-road left-turn bay: Left-turn treatment NOT warranted. Value 45 26% Value 289 Opposing Volume (V O ), veh/h Left-turn treatment not Left-turn treatment warranted Advancing Volume (V A ), veh/h CALIBRATION CONSTANTS Variable Average time for making left-turn, s: Critical headway, s: Average time for left-turn vehicle to clear the advancing lane, s: Value
114 Legacy Oaks Subdivision LA 429 EBL - Existing PM Peak Figure 2-5. Guideline for determining the need for a major-road left-turn bay at a two-way stop-controlled intersection. 2-lane roadway (English) INPUT Variable 85 th percentile speed, mph: Percent of left-turns in advancing volume (V A ), %: Advancing volume (V A ), veh/h: Opposing volume (V O ), veh/h: OUTPUT Variable Limiting advancing volume (V A ), veh/h: Guidance for determining the need for a major-road left-turn bay: Left-turn treatment NOT warranted. Value 45 1% Value 1334 Opposing Volume (V O ), veh/h Left-turn treatment not Left-turn treatment warranted Advancing Volume (V A ), veh/h CALIBRATION CONSTANTS Variable Average time for making left-turn, s: Critical headway, s: Average time for left-turn vehicle to clear the advancing lane, s: Value
115 Legacy Oaks Subdivision LA 429 EBL - Future AM Peak Figure 2-5. Guideline for determining the need for a major-road left-turn bay at a two-way stop-controlled intersection. 2-lane roadway (English) INPUT Variable 85 th percentile speed, mph: Percent of left-turns in advancing volume (V A ), %: Advancing volume (V A ), veh/h: Opposing volume (V O ), veh/h: OUTPUT Variable Limiting advancing volume (V A ), veh/h: Guidance for determining the need for a major-road left-turn bay: Left-turn treatment NOT warranted. Value 45 28% Value 289 Opposing Volume (V O ), veh/h Left-turn treatment not Left-turn treatment warranted Advancing Volume (V A ), veh/h CALIBRATION CONSTANTS Variable Average time for making left-turn, s: Critical headway, s: Average time for left-turn vehicle to clear the advancing lane, s: Value
116 Legacy Oaks Subdivision LA 429 EBL - Future PM Peak Figure 2-5. Guideline for determining the need for a major-road left-turn bay at a two-way stop-controlled intersection. 2-lane roadway (English) INPUT Variable 85 th percentile speed, mph: Percent of left-turns in advancing volume (V A ), %: Advancing volume (V A ), veh/h: Opposing volume (V O ), veh/h: OUTPUT Variable Limiting advancing volume (V A ), veh/h: Guidance for determining the need for a major-road left-turn bay: Left-turn treatment NOT warranted. Value 45 7% Value 476 Opposing Volume (V O ), veh/h Left-turn treatment not Left-turn treatment warranted Advancing Volume (V A ), veh/h CALIBRATION CONSTANTS Variable Average time for making left-turn, s: Critical headway, s: Average time for left-turn vehicle to clear the advancing lane, s: Value
117 Roadway Analysis
118 Directional file:///c:/users/pmalisetty/appdata/local/temp/s2k36b2.tmp Page 1 of 1 2/3/214 General Information Analyst EB Agency or Company NSI Date Performed 1/23/214 Analysis Time Period Existing AM Project Description: Legacy Oaks Subdivision Input Data DIRECTIONAL TWO-LANE HIGHWAY SEGMENT WORKSHEET Site Information Highway / Direction of Travel LA 429 From/To Boudreaux Rd to LA 44 Jurisdiction Ascension Parish Analysis Year 214 Analysis direction vol., V d 213veh/h Opposing direction vol., V o 212veh/h Shoulder width ft. Lane Width ft 12. Segment Length mi 2. Average Travel Speed Class I highway Class II highway Class III highway Terrain Level Rolling Grade Length mi Up/down Peak-hour factor, PHF.92 No-passing zone 5% % Trucks and Buses, P T 5 % % Recreational vehicles, P R % Access points mi 35/mi Analysis Direction (d) Opposing Direction (o) Passenger-car equivalents for trucks, E T (Exhibit or 15-12) Passenger-car equivalents for RVs, E R (Exhibit or 15-13) Heavy-vehicle adjustment factor, f HV,ATS =1/ (1+ P T (E T -1)+P R (E R -1) ) Grade adjustment factor 1, f g,ats (Exhibit 15-9) Demand flow rate 2, v i (pc/h) v i =V i / (PHF* f g,ats * f HV,ATS ) Mean speed of sample 3, S FM Total demand flow rate, both directions, v Free-flow speed, FFS=S FM +.776(v/ f HV,ATS ) Free-Flow Speed from Field Measurement Adj. for no-passing zones, f np,ats (Exhibit 15-15) 2.2 mi/h Percent Time-Spent-Following Base free-flow speed 4, BFFS Estimated Free-Flow Speed Adj. for lane and shoulder width, 4 f LS (Exhibit 15-7) Adj. for access points 4, f A (Exhibit 15-8) Free-flow speed, FFS (FSS=BFFS-f LS -f A ) 55. mi/h 4.2 mi/h 8.8 mi/h 42. mi/h Average travel speed, ATS d =FFS-.776(v d,ats + v o,ats ) - f np,ats 36.2 mi/h Percent free flow speed, PFFS 86.2 % Analysis Direction (d) Opposing Direction (o) Passenger-car equivalents for trucks, E T (Exhibit or 15-19) Passenger-car equivalents for RVs, E R (Exhibit or 15-19) Heavy-vehicle adjustment factor, f HV =1/ (1+ P T (E T -1)+P R (E R -1) ) Grade adjustment factor 1, f g,ptsf (Exhibit or Ex 15-17) Directional flow rate 2, v i (pc/h) v i =V i /(PHF*f HV,PTSF * f g,ptsf ) Base percent time-spent-following 4, BPTSF d (%)=1(1-e av d b ) 25.1 Adj. for no-passing zone, f np,ptsf (Exhibit 15-21) 55.4 Percent time-spent-following, PTSF d (%)=BPTSF d +f np,ptsf *(v d,ptsf / v d,ptsf + v o,ptsf ) 52.9 Level of Service and Other Performance Measures Level of service, LOS (Exhibit 15-3) Volume to capacity ratio, v/c.14 Capacity, C d,ats (Equation 15-12) pc/h 1659 Capacity, C d,ptsf (Equation 15-13) pc/h 1692 Percent Free-Flow Speed PFFS d (Equation Class III only) 86.2 Bicycle Level of Service Directional demand flow rate in outside lane, v OL (Eq ) veh/h Effective width, Wv (Eq ) ft 12. Effective speed factor, S t (Eq. 15-3) 4.42 Bicycle level of service score, BLOS (Eq ) 4.92 Bicycle level of service (Exhibit 15-4) Notes 1. Note that the adjustment factor for level terrain is 1.,as level terrain is one of the base conditions. For the purpose of grade adjustment, specific downgrade segments are treated as level terrain. 2. If v i (v d or v o ) >=1,7 pc/h, terminate analysis--the LOS is F. 3. For the analysis direction only and for v>2 veh/h. 4. For the analysis direction only 5. Exhibit 15-2 provides coefficients a and b for Equation Use alternative Exhibit if some trucks operate at crawl speeds on a specific downgrade. Copyright 213 University of Florida, All Rights Reserved HCS 21 TM Version 6.5 Generated: 2/3/214 3:58 PM B E
119 Directional file:///c:/users/pmalisetty/appdata/local/temp/s2kf2dc.tmp Page 1 of 1 2/3/214 General Information Analyst EB Agency or Company NSI Date Performed 1/23/214 Analysis Time Period Future AM Project Description: Legacy Oaks Subdivision Input Data DIRECTIONAL TWO-LANE HIGHWAY SEGMENT WORKSHEET Site Information Highway / Direction of Travel LA 429 From/To Boudreaux Rd to LA 44 Jurisdiction Ascension Parish Analysis Year 214 Analysis direction vol., V d 289veh/h Opposing direction vol., V o 238veh/h Shoulder width ft. Lane Width ft 12. Segment Length mi 2. Average Travel Speed Class I highway Class II highway Class III highway Terrain Level Rolling Grade Length mi Up/down Peak-hour factor, PHF.92 No-passing zone 5% % Trucks and Buses, P T 5 % % Recreational vehicles, P R % Access points mi 35/mi Analysis Direction (d) Opposing Direction (o) Passenger-car equivalents for trucks, E T (Exhibit or 15-12) Passenger-car equivalents for RVs, E R (Exhibit or 15-13) Heavy-vehicle adjustment factor, f HV,ATS =1/ (1+ P T (E T -1)+P R (E R -1) ) Grade adjustment factor 1, f g,ats (Exhibit 15-9) Demand flow rate 2, v i (pc/h) v i =V i / (PHF* f g,ats * f HV,ATS ) Mean speed of sample 3, S FM Total demand flow rate, both directions, v Free-flow speed, FFS=S FM +.776(v/ f HV,ATS ) Free-Flow Speed from Field Measurement Adj. for no-passing zones, f np,ats (Exhibit 15-15) 2. mi/h Percent Time-Spent-Following Base free-flow speed 4, BFFS Estimated Free-Flow Speed Adj. for lane and shoulder width, 4 f LS (Exhibit 15-7) Adj. for access points 4, f A (Exhibit 15-8) Free-flow speed, FFS (FSS=BFFS-f LS -f A ) 55. mi/h 4.2 mi/h 8.8 mi/h 42. mi/h Average travel speed, ATS d =FFS-.776(v d,ats + v o,ats ) - f np,ats 35.5 mi/h Percent free flow speed, PFFS 84.5 % Analysis Direction (d) Opposing Direction (o) Passenger-car equivalents for trucks, E T (Exhibit or 15-19) Passenger-car equivalents for RVs, E R (Exhibit or 15-19) Heavy-vehicle adjustment factor, f HV =1/ (1+ P T (E T -1)+P R (E R -1) ) Grade adjustment factor 1, f g,ptsf (Exhibit or Ex 15-17) Directional flow rate 2, v i (pc/h) v i =V i /(PHF*f HV,PTSF * f g,ptsf ) Base percent time-spent-following 4, BPTSF d (%)=1(1-e av d b ) 32.8 Adj. for no-passing zone, f np,ptsf (Exhibit 15-21) 49.6 Percent time-spent-following, PTSF d (%)=BPTSF d +f np,ptsf *(v d,ptsf / v d,ptsf + v o,ptsf ) 6. Level of Service and Other Performance Measures Level of service, LOS (Exhibit 15-3) Volume to capacity ratio, v/c.19 Capacity, C d,ats (Equation 15-12) pc/h 1666 Capacity, C d,ptsf (Equation 15-13) pc/h 1692 Percent Free-Flow Speed PFFS d (Equation Class III only) 84.5 Bicycle Level of Service Directional demand flow rate in outside lane, v OL (Eq ) veh/h Effective width, Wv (Eq ) ft 12. Effective speed factor, S t (Eq. 15-3) 4.42 Bicycle level of service score, BLOS (Eq ) 5.7 Bicycle level of service (Exhibit 15-4) Notes 1. Note that the adjustment factor for level terrain is 1.,as level terrain is one of the base conditions. For the purpose of grade adjustment, specific downgrade segments are treated as level terrain. 2. If v i (v d or v o ) >=1,7 pc/h, terminate analysis--the LOS is F. 3. For the analysis direction only and for v>2 veh/h. 4. For the analysis direction only 5. Exhibit 15-2 provides coefficients a and b for Equation Use alternative Exhibit if some trucks operate at crawl speeds on a specific downgrade. Copyright 213 University of Florida, All Rights Reserved HCS 21 TM Version 6.5 Generated: 2/3/214 3:57 PM B E
120 Directional file:///c:/users/pmalisetty/appdata/local/temp/s2kc41.tmp Page 1 of 1 2/3/214 General Information Analyst EB Agency or Company NSI Date Performed 1/23/214 Analysis Time Period Existing PM Project Description: Legacy Oaks Subdivision Input Data DIRECTIONAL TWO-LANE HIGHWAY SEGMENT WORKSHEET Site Information Highway / Direction of Travel LA 429 From/To Boudreaux Rd to LA 44 Jurisdiction Ascension Parish Analysis Year 214 Analysis direction vol., V d 377veh/h Opposing direction vol., V o 171veh/h Shoulder width ft. Lane Width ft 12. Segment Length mi 2. Average Travel Speed Class I highway Class II highway Class III highway Terrain Level Rolling Grade Length mi Up/down Peak-hour factor, PHF.95 No-passing zone 5% % Trucks and Buses, P T 5 % % Recreational vehicles, P R % Access points mi 35/mi Analysis Direction (d) Opposing Direction (o) Passenger-car equivalents for trucks, E T (Exhibit or 15-12) Passenger-car equivalents for RVs, E R (Exhibit or 15-13) Heavy-vehicle adjustment factor, f HV,ATS =1/ (1+ P T (E T -1)+P R (E R -1) ) Grade adjustment factor 1, f g,ats (Exhibit 15-9) Demand flow rate 2, v i (pc/h) v i =V i / (PHF* f g,ats * f HV,ATS ) Mean speed of sample 3, S FM Total demand flow rate, both directions, v Free-flow speed, FFS=S FM +.776(v/ f HV,ATS ) Free-Flow Speed from Field Measurement Adj. for no-passing zones, f np,ats (Exhibit 15-15) 2.2 mi/h Percent Time-Spent-Following Base free-flow speed 4, BFFS Estimated Free-Flow Speed Adj. for lane and shoulder width, 4 f LS (Exhibit 15-7) Adj. for access points 4, f A (Exhibit 15-8) Free-flow speed, FFS (FSS=BFFS-f LS -f A ) 55. mi/h 4.2 mi/h 8.8 mi/h 42. mi/h Average travel speed, ATS d =FFS-.776(v d,ats + v o,ats ) - f np,ats 35.3 mi/h Percent free flow speed, PFFS 84. % Analysis Direction (d) Opposing Direction (o) Passenger-car equivalents for trucks, E T (Exhibit or 15-19) Passenger-car equivalents for RVs, E R (Exhibit or 15-19) Heavy-vehicle adjustment factor, f HV =1/ (1+ P T (E T -1)+P R (E R -1) ) Grade adjustment factor 1, f g,ptsf (Exhibit or Ex 15-17) Directional flow rate 2, v i (pc/h) v i =V i /(PHF*f HV,PTSF * f g,ptsf ) Base percent time-spent-following 4, BPTSF d (%)=1(1-e av d b ) 37.8 Adj. for no-passing zone, f np,ptsf (Exhibit 15-21) 41.7 Percent time-spent-following, PTSF d (%)=BPTSF d +f np,ptsf *(v d,ptsf / v d,ptsf + v o,ptsf ) 66.5 Level of Service and Other Performance Measures Level of service, LOS (Exhibit 15-3) Volume to capacity ratio, v/c.24 Capacity, C d,ats (Equation 15-12) pc/h 1651 Capacity, C d,ptsf (Equation 15-13) pc/h 1692 Percent Free-Flow Speed PFFS d (Equation Class III only) 84. Bicycle Level of Service Directional demand flow rate in outside lane, v OL (Eq ) veh/h Effective width, Wv (Eq ) ft 12. Effective speed factor, S t (Eq. 15-3) 4.79 Bicycle level of service score, BLOS (Eq ) 5.37 Bicycle level of service (Exhibit 15-4) Notes 1. Note that the adjustment factor for level terrain is 1.,as level terrain is one of the base conditions. For the purpose of grade adjustment, specific downgrade segments are treated as level terrain. 2. If v i (v d or v o ) >=1,7 pc/h, terminate analysis--the LOS is F. 3. For the analysis direction only and for v>2 veh/h. 4. For the analysis direction only 5. Exhibit 15-2 provides coefficients a and b for Equation Use alternative Exhibit if some trucks operate at crawl speeds on a specific downgrade. Copyright 213 University of Florida, All Rights Reserved HCS 21 TM Version 6.5 Generated: 2/3/214 3:58 PM B E
121 Directional file:///c:/users/pmalisetty/appdata/local/temp/s2k5679.tmp Page 1 of 1 2/3/214 General Information Analyst EB Agency or Company NSI Date Performed 1/23/214 Analysis Time Period Future PM Project Description: Legacy Oaks Subdivision Input Data DIRECTIONAL TWO-LANE HIGHWAY SEGMENT WORKSHEET Site Information Highway / Direction of Travel LA 429 From/To Boudreaux Rd to LA 44 Jurisdiction Ascension Parish Analysis Year 214 Analysis direction vol., V d 427veh/h Opposing direction vol., V o 25veh/h Shoulder width ft 1. Lane Width ft 12. Segment Length mi 2. Average Travel Speed Class I highway Class II highway Class III highway Terrain Level Rolling Grade Length mi Up/down Peak-hour factor, PHF.95 No-passing zone 5% % Trucks and Buses, P T 5 % % Recreational vehicles, P R % Access points mi 35/mi Analysis Direction (d) Opposing Direction (o) Passenger-car equivalents for trucks, E T (Exhibit or 15-12) Passenger-car equivalents for RVs, E R (Exhibit or 15-13) Heavy-vehicle adjustment factor, f HV,ATS =1/ (1+ P T (E T -1)+P R (E R -1) ) Grade adjustment factor 1, f g,ats (Exhibit 15-9) Demand flow rate 2, v i (pc/h) v i =V i / (PHF* f g,ats * f HV,ATS ) Mean speed of sample 3, S FM Total demand flow rate, both directions, v Free-flow speed, FFS=S FM +.776(v/ f HV,ATS ) Free-Flow Speed from Field Measurement Adj. for no-passing zones, f np,ats (Exhibit 15-15) 2.1 mi/h Percent Time-Spent-Following Base free-flow speed 4, BFFS Estimated Free-Flow Speed Adj. for lane and shoulder width, 4 f LS (Exhibit 15-7) Adj. for access points 4, f A (Exhibit 15-8) Free-flow speed, FFS (FSS=BFFS-f LS -f A ) 55. mi/h. mi/h 8.8 mi/h 46.3 mi/h Average travel speed, ATS d =FFS-.776(v d,ats + v o,ats ) - f np,ats 38.5 mi/h Percent free flow speed, PFFS 83.3 % Analysis Direction (d) Opposing Direction (o) Passenger-car equivalents for trucks, E T (Exhibit or 15-19) Passenger-car equivalents for RVs, E R (Exhibit or 15-19) Heavy-vehicle adjustment factor, f HV =1/ (1+ P T (E T -1)+P R (E R -1) ) Grade adjustment factor 1, f g,ptsf (Exhibit or Ex 15-17) Directional flow rate 2, v i (pc/h) v i =V i /(PHF*f HV,PTSF * f g,ptsf ) Base percent time-spent-following 4, BPTSF d (%)=1(1-e av d b ) 44.4 Adj. for no-passing zone, f np,ptsf (Exhibit 15-21) 39.2 Percent time-spent-following, PTSF d (%)=BPTSF d +f np,ptsf *(v d,ptsf / v d,ptsf + v o,ptsf ) 69.1 Level of Service and Other Performance Measures Level of service, LOS (Exhibit 15-3) Volume to capacity ratio, v/c.27 Capacity, C d,ats (Equation 15-12) pc/h 1666 Capacity, C d,ptsf (Equation 15-13) pc/h 1692 Percent Free-Flow Speed PFFS d (Equation Class III only) 83.3 Bicycle Level of Service Directional demand flow rate in outside lane, v OL (Eq ) veh/h Effective width, Wv (Eq ) ft 32. Effective speed factor, S t (Eq. 15-3) 4.79 Bicycle level of service score, BLOS (Eq ) 1.3 Bicycle level of service (Exhibit 15-4) Notes 1. Note that the adjustment factor for level terrain is 1.,as level terrain is one of the base conditions. For the purpose of grade adjustment, specific downgrade segments are treated as level terrain. 2. If v i (v d or v o ) >=1,7 pc/h, terminate analysis--the LOS is F. 3. For the analysis direction only and for v>2 veh/h. 4. For the analysis direction only 5. Exhibit 15-2 provides coefficients a and b for Equation Use alternative Exhibit if some trucks operate at crawl speeds on a specific downgrade. Copyright 213 University of Florida, All Rights Reserved HCS 21 TM Version 6.5 Generated: 2/3/214 3:57 PM B A


122 LOOKING WEST ON LA 429 LOOKING EAST ON LA 429
HYDROLOGIC/HYDRAULIC ANALYSIS REPORT FOR THE TROLLEY BROOK CULVERT ASHLAND, MA
 HYDROLOGIC/HYDRAULIC ANALYSIS REPORT FOR THE TROLLEY BROOK CULVERT ASHLAND, MA Prepared for: THE TOWN OF ASHLAND BOARD OF SELECTMEN AND PLANNING DEPARTMENT Prepared by: June 3, 216 Hydrologic/Hydraulic
King Soopers #116 Thornton, Colorado
 Traffic Impact Study King Soopers #116 Thornton, Colorado Prepared for: Galloway & Company, Inc. T R A F F I C I M P A C T S T U D Y King Soopers #116 Thornton, Colorado Prepared for Galloway & Company
Swale Storage/ Length Between Ditch Blocks
 Swale Storage/ Length Between Ditch Blocks Input: Roadway Grade 1.00 % Front Slope 4 :1 Bottom Width 0 ft Back Slope 3 :1 Swale Depth 1.50 ft Calculations: Cross-Sectional Swale Area = 7.88 ft 2 DITCH
Traffic Impact Statement (TIS)
") Traffic Impact Statement (TIS) Vincentian PUDA Collier County, FL 10/18/2013 Prepared for: Global Properties of Naples Prepared by: Trebilcock Consulting Solutions, PA 2614 Tamiami Trail N, Suite 615 1205
Traffic Impact Statement (TIS) Vincentian PUDA Collier County, FL 10/18/2013 Prepared for: Global Properties of Naples Prepared by: Trebilcock Consulting Solutions, PA 2614 Tamiami Trail N, Suite 615 1205
LAWRENCE TRANSIT CENTER LOCATION ANALYSIS 9 TH STREET & ROCKLEDGE ROAD / 21 ST STREET & IOWA STREET LAWRENCE, KANSAS
 LAWRENCE TRANSIT CENTER LOCATION ANALYSIS 9 TH STREET & ROCKLEDGE ROAD / 21 ST STREET & IOWA STREET LAWRENCE, KANSAS TRAFFIC IMPACT STUDY FEBRUARY 214 OA Project No. 213-542 TABLE OF CONTENTS 1. INTRODUCTION...
City of Houston Fondren Road Paving and Drainage
 City of Houston Fondren Road Paving and Drainage From Braeswood Boulevard to Creekbend Drive TRC Meeting March 2016 Location and Vicinity Maps City Council District K Key Map 530 Z, 530 Y Land Use Commercial
ATTACHMENT D (As referenced in Attachment B ) (Hydrology and Hydraulics Study)
 (Hydrology and Hydraulics Study)") ATTACHMENT D (As referenced in Attachment B ) (Hydrology and Hydraulics Study) Southern California Edison So Cal Gas Sub-transmission Project Hydrology and Hydraulics Study January 2014 2 Hydrology & Hydraulics
ATTACHMENT D (As referenced in Attachment B ) (Hydrology and Hydraulics Study) Southern California Edison So Cal Gas Sub-transmission Project Hydrology and Hydraulics Study January 2014 2 Hydrology & Hydraulics
STAFF REPORT # CHANGE OF ZONING
 STAFF REPORT #17-2000-0007 CHANGE OF ZONING PLANNING COMMISSION MEETING DATE: November 16, 2017 (Applicant Provided Materials / Traffic Study = Blue) 1. APPLICATION: A public hearing for an application
Traffic Engineering Study
 Traffic Engineering Study Bellaire Boulevard Prepared For: International Management District Technical Services, Inc. Texas Registered Engineering Firm F-3580 November 2009 Executive Summary has been requested
Transportation & Traffic Engineering
 Transportation & Traffic Engineering 1) Project Description This report presents a summary of findings for a Traffic Impact Analysis (TIA) performed by A+ Engineering, Inc. for the Hill Country Family
EXECUTIVE SUMMARY. The following is an outline of the traffic analysis performed by Hales Engineering for the traffic conditions of this project.
 EXECUTIVE SUMMARY This study addresses the traffic impacts associated with the proposed Shopko redevelopment located in Sugarhouse, Utah. The Shopko redevelopment project is located between 1300 East and
Challenges in a Post-Katrina Environment East-West Corridor Project Overview February, 2007
 EAST-WEST CORRIDOR Challenges in a Post-Katrina Environment East-West Corridor Project Overview February, 2007 Presentation Agenda Project Overview / Purpose and Need Highway Component Transit Component
APPENDIX C1 TRAFFIC ANALYSIS DESIGN YEAR TRAFFIC ANALYSIS
 APPENDIX C1 TRAFFIC ANALYSIS DESIGN YEAR TRAFFIC ANALYSIS DESIGN YEAR TRAFFIC ANALYSIS February 2018 Highway & Bridge Project PIN 6754.12 Route 13 Connector Road Chemung County February 2018 Appendix
TRAFFIC IMPACT ANALYSIS
 TRAFFIC IMPACT ANALYSIS Emerald Isle Commercial Development Prepared by SEPI Engineering & Construction Prepared for Ark Consulting Group, PLLC March 2016 I. Executive Summary A. Site Location The Emerald
TIMBERVINE TRANSPORTATION IMPACT STUDY FORT COLLINS, COLORADO JANUARY Prepared for:
 TIMBERVINE TRANSPORTATION IMPACT STUDY FORT COLLINS, COLORADO JANUARY 2014 Prepared for: Hartford Companies 1218 W. Ash Street Suite A Windsor, Co 80550 Prepared by: DELICH ASSOCIATES 2272 Glen Haven Drive
Table of Contents INTRODUCTION... 3 PROJECT STUDY AREA Figure 1 Vicinity Map Study Area... 4 EXISTING CONDITIONS... 5 TRAFFIC OPERATIONS...
 Crosshaven Drive Corridor Study City of Vestavia Hills, Alabama Table of Contents INTRODUCTION... 3 PROJECT STUDY AREA... 3 Figure 1 Vicinity Map Study Area... 4 EXISTING CONDITIONS... 5 TRAFFIC OPERATIONS...
BARRHAVEN FELLOWSHIP CRC 3058 JOCKVALE ROAD OTTAWA, ONTARIO TRANSPORTATION BRIEF. Prepared for:
 BARRHAVEN FELLOWSHIP CRC 3058 JOCKVALE ROAD OTTAWA, ONTARIO TRANSPORTATION BRIEF Prepared for: Barrhaven Fellowship CRC 3058 Jockvale Road Ottawa, ON K2J 2W7 December 7, 2016 116-649 Report_1.doc D. J.
Alpine Highway to North County Boulevard Connector Study
 Alpine Highway to North County Boulevard Connector Study prepared by Avenue Consultants March 16, 2017 North County Boulevard Connector Study March 16, 2017 Table of Contents 1 Summary of Findings... 1
Craig Scheffler, P.E., PTOE HNTB North Carolina, P.C. HNTB Project File: Subject
 TECHNICAL MEMORANDUM To Kumar Neppalli Traffic Engineering Manager Town of Chapel Hill From Craig Scheffler, P.E., PTOE HNTB North Carolina, P.C. Cc HNTB Project File: 38435 Subject Obey Creek TIS 2022
Proposed Inn at Bellefield Traffic Impact Assessment
 Proposed Inn at Bellefield Traffic Impact Assessment Town of Hyde Park Dutchess County, New York Prepared for: T-Rex Hyde Park Owner LLC 500 Mamroneck Avenue, Suite 300 Harrison, NY 10528 June 21, 2017
2.0 Development Driveways. Movin Out June 2017
 Movin Out June 2017 1.0 Introduction The proposed Movin Out development is a mixed use development in the northeast quadrant of the intersection of West Broadway and Fayette Avenue in the City of Madison.
4.14 TRANSPORTATION AND CIRCULATION
 4.14 TRANSPORTATION AND CIRCULATION 4.14.1 Summary Table 4.14-1 summarizes the identified environmental impacts, proposed mitigation measures, and residual impacts of the proposed project with regard to
HIGHWAY 28 FUNCTIONAL DESIGN
 HIGHWAY 28 FUNCTIONAL DESIGN PUBLIC OPEN HOUSE #1 WEDNESDAY, MARCH 12, 2014 Stantec Presenters: Brad Vander Heyden, Project Engineer Neal Cormack, Project Manager Dave Parker, Project Engineer Beth Thola,
TRAFFIC IMPACT STUDY DERRY GREEN CORPORATE BUSINESS PARK MILTON SECONDARY PLAN MODIFICATION
 TRAFFIC IMPACT STUDY DERRY GREEN CORPORATE BUSINESS PARK MILTON SECONDARY PLAN MODIFICATION TRAFFIC IMPACT STUDY DERRY GREEN CORPORATE BUSINESS PARK MILTON SECONDARY PLAN MODIFICATION DECEMBER 24 UPDATED
LOTUS RANCH TRAFFIC IMPACT ANALYSIS. LLG Ref Senior Transportation Engineer & Charlene Sadiarin Transportation Engineer II
 TRAFFIC IMPACT ANALYSIS LOTUS RANCH El Centro, California July 31, 2015February 12, 2016 LLG Ref. 3-14-2392 Prepared by: KC Yellapu, P.E Senior Transportation Engineer & Charlene Sadiarin Transportation
PARISH OF ASCENSION OFFICE OF PLANNING AND DEVELOPMENT PLANNING DEPARTMENT. Planning Commission
 1. Call to Order 2. Roll Call of Members 3. Pledge of Allegiance 4. Introduction of Staff 5. Chairman's Comments 6. General Business 7. Minutes (A) 8. Consent Agenda (A) PARISH OF ASCENSION OFFICE OF PLANNING
King County Metro. Columbia Street Transit Priority Improvements Alternative Analysis. Downtown Southend Transit Study. May 2014.
 King County Metro Columbia Street Transit Priority Improvements Alternative Analysis Downtown Southend Transit Study May 2014 Parametrix Table of Contents Introduction... 1 Methodology... 1 Study Area...
MINERVA PARK SITE TRAFFIC IMPACT STUDY M/I HOMES. September 2, 2015
 5500 New Albany Road Columbus, Ohio 43054 Phone: 614.775.4500 Fax: 614.775.4800 Toll Free: 1-888-775-EMHT emht.com 2015-1008 MINERVA PARK SITE TRAFFIC IMPACT STUDY M/I HOMES September 2, 2015 Engineers
Clean Harbors Canada, Inc.
 Clean Harbors Canada, Inc. Proposed Lambton Landfill Expansion Environmental Assessment Terms of Reference Transportation Assessment St. Clair Township, Ontario September 2009 itrans Consulting Inc. 260
Traffic Impact Analysis 5742 BEACH BOULEVARD MIXED USE PROJECT
 Traffic Impact Analysis 5742 BEACH BOULEVARD MIXED USE PROJECT CITY OF BUENA PARK Prepared by Project No. 14139 000 April 17 th, 2015 DKS Associates Jeffrey Heald, P.E. Rohit Itadkar, T.E. 2677 North Main
CHAPTER 9: VEHICULAR ACCESS CONTROL Introduction and Goals Administration Standards
 9.00 Introduction and Goals 9.01 Administration 9.02 Standards 9.1 9.00 INTRODUCTION AND GOALS City streets serve two purposes that are often in conflict moving traffic and accessing property. The higher
TRAFFIC SIGNAL DESIGN REPORT KING OF PRUSSIA ROAD & RAIDER ROAD RADNOR TOWNSHIP PENNSYLVANIA
 TRAFFIC SIGNAL DESIGN REPORT KING OF PRUSSIA ROAD & RAIDER ROAD RADNOR TOWNSHIP PENNSYLVANIA PREPARED FOR: UNIVERSITY OF PENNSYLVANIA HEALTH SYSTEM 34 CIVIC CENTER BOULEVARD PHILADELPHIA, PA 1987 (61)
Proposed location of Camp Parkway Commerce Center. Vicinity map of Camp Parkway Commerce Center Southampton County, VA
 Proposed location of Camp Parkway Commerce Center Vicinity map of Camp Parkway Commerce Center Southampton County, VA Camp Parkway Commerce Center is a proposed distribution and industrial center to be
Volume 1 Traffic Impact Analysis Turtle Creek Boulevard Dallas, Texas. Kimley-Horn and Associates, Inc. Dallas, Texas.
 Volume 1 Traffic Impact Analysis 2727 Dallas, Texas June 18, 2018 Kimley-Horn and Associates, Inc. Dallas, Texas Project #064523000 Registered Firm F-928 Traffic Impact Analysis 2727 Dallas, Texas Prepared
LCPS Valley Service Center
 Traffic Impact Study LCPS Valley Service Center Loudoun County, Virginia November 4, 2015 Prepared For: Loudoun County Public Schools 21000 Education Court Ashburn, VA 20148 Prepared by: 1140 Connecticut
DRAFT REPORT TXDOT SH 183 MASTER DRAINAGE STUDY HYDRAULIC ANALYSIS OF ELM FORK OF TRINITY RIVER CROSSING AT SH 183 WITHIN THE ELM FORK WATERSHED
 DRAFT REPORT TXDOT SH 183 MASTER DRAINAGE STUDY HYDRAULIC ANALYSIS OF ELM FORK OF TRINITY RIVER CROSSING AT SH 183 WITHIN THE ELM FORK WATERSHED FOR TEXAS DEPARTMENT OF TRANSPORTATION DALLAS DISTRICT CONTRACT
Mineola Village Green
 Traffic Impact Analysis Report Mineola Village Green 199 2 nd Street Mineola, New York Prepared for Mineola Metro LLC c/o Lalezarian Properties 1999 Marcus Avenue, Suite 310 Lake Success, NY 11042 Prepared
Traffic Impact Analysis West Street Garden Plots Improvements and DuPage River Park Garden Plots Development Naperville, Illinois
 Traffic Impact Analysis West Street Garden Plots Improvements and DuPage River Park Garden Plots Development Naperville, Illinois Submitted by April 9, 2009 Introduction Kenig, Lindgren, O Hara, Aboona,
CONCEPTUAL UTILITY REPORT FOR THE CANYONS PHASE 1 CITY OF CASTLE PINES, CO
 CONCEPTUAL UTILITY REPORT FOR THE CANYONS PHASE 1 CITY OF CASTLE PINES, CO PREPARED FOR: SHEA HOMES 9380 STATION ST., SUITE 600 LONE TREE, CO 80124 PHONE: 303-791-8180 CONTACT: RYAN MCDERMED PREPARED BY:
INFLOW DESIGN FLOOD CONTROL SYSTEM PLAN
 INFLOW DESIGN FLOOD CONTROL SYSTEM PLAN CFR 257.82(c) Bottom Ash Complex Mitchell Power Plant Marshall County, West Virginia October, 2016 Prepared for: Wheeling Power Company & Kentucky Power Company
Lacey Gateway Residential Phase 1
 Lacey Gateway Residential Phase Transportation Impact Study April 23, 203 Prepared for: Gateway 850 LLC 5 Lake Bellevue Drive Suite 02 Bellevue, WA 98005 Prepared by: TENW Transportation Engineering West
Bennett Pit. Traffic Impact Study. J&T Consulting, Inc. Weld County, Colorado. March 3, 2017
 Bennett Pit Traffic Impact Study J&T Consulting, Inc. Weld County, Colorado March 3, 217 Prepared By: Sustainable Traffic Solutions, Inc. http://www.sustainabletrafficsolutions.com/ Joseph L. Henderson,
PUBLIC INFRASTRUCTURE PROJECTS
 PUBLIC INFRASTRUCTURE PROJECTS FM 664 / OVILLA ROAD WIDENING & IMPROVEMENTS FM 664 / OVILLA ROAD CONNECTS US 287 WITH I-45 (SOURCE: TEXAS DEPARTMENT OF TRANSPORTATION. 2016 FM 664 / OVILLA ROAD WIDENING
INDUSTRIAL DEVELOPMENT
 INDUSTRIAL DEVELOPMENT Traffic Impact Study Plainfield, Illinois August 2018 Prepared for: Seefried Industrial Properties, Inc. TABLE OF CONTENTS Executive Summary 2 Introduction 3 Existing Conditions
Traffic Impact Study Speedway Gas Station Redevelopment
 Traffic Impact Study Speedway Gas Station Redevelopment Warrenville, Illinois Prepared For: Prepared By: April 11, 2018 Table of Contents 1. Introduction... 1 2. Existing Conditions... 4 Site Location...
December 5, Red Bank Planning Board Municipal Building 90 Monmouth Street Red Bank, NJ 07701
 Dynamic Traffic, LLC www.dynamic-traffic.com 1904 Main Street Lake Como, NJ 07719 T. 732.681.0760 December 5, 2016 Red Bank Planning Board Municipal Building 90 Monmouth Street Red Bank, NJ 07701 Re: Traffic
Proposed Hotel and Restaurant Development
 Traffic Impact Study Proposed Hotel and Restaurant Development Marbledale Road Tuckahoe, NY PREPARED FOR BILLWIN DEVELOPMENT AFFILIATES, LLC 365 WHITE PLAINS ROAD EASTCHESTER, NY. 10709 PREPARED BY Engineering
Town of Londonderry, New Hampshire NH Route 28 Western Segment Traffic Impact Fee Methodology
 Town of Londonderry, New Hampshire NH Route 28 Western Segment Traffic Impact Fee Methodology Prepared by the Londonderry Community Development Department Planning & Economic Development Division Based
NEWCASTLE MIDDLE SCHOOL Traffic Impact Analysis
 Gibson Traffic Consultants 2802 Wetmore Avenue Suite 220 Everett, WA 98201 425.339.8266 NEWCASTLE MIDDLE SCHOOL Traffic Impact Analysis Prepared for: Renton School District Jurisdiction: City of Newcastle
Escondido Marriott Hotel and Mixed-Use Condominium Project TRAFFIC IMPACT ANALYSIS REPORT
 Escondido Marriott Hotel and Mixed-Use Condominium Project TRAFFIC IMPACT ANALYSIS REPORT Prepared for Phelps Program Management 420 Sixth Avenue, Greeley, CO 80632 Prepared by 5050 Avenida Encinas, Suite
CULVERT DESIGN WITH HY-8
 Back to the Basics CULVERT DESIGN WITH HY-8 Purdue University Road School 2006 Your Presenters... Merril Dougherty INDOT, Hydraulics Unit Supervisor David Finley CTE Engineers, Inc. 1 Part One: Culvert
TRAFFIC IMPACT ANALYSIS SHORTBREAD LOFTS 2009 MODIFICATION Chapel Hill, North Carolina
 TRAFFIC IMPACT ANALYSIS SHORTBREAD LOFTS 2009 MODIFICATION Chapel Hill, North Carolina Prepared for: The Town of Chapel Hill, NC Prepared by: Architects-Engineers-Planners, Inc. November 2009 Traffic Impact
TRAFFIC IMPACT ANALYSIS FOR. McDONALD S RESTAURANT IN CARMICAEL Sacramento County, CA. Prepared For:
 TRAFFIC IMPACT ANALYSIS FOR McDONALD S RESTAURANT IN CARMICAEL Sacramento County, CA Prepared For: McDonald s USA, LLC Pacific Sierra Region 2999 Oak Road, Suite 900 Walnut Creek, CA 94597 Prepared By:
GASOLINE SERVICE STATION 1618, 1622 ROGER STEVENS DRIVE OTTAWA, ONTARIO TRANSPORTATION IMPACT ASSESSMENT. Prepared for:
 GASOLINE SERVICE STATION 1618, 1622 ROGER STEVENS DRIVE OTTAWA, ONTARIO TRANSPORTATION IMPACT ASSESSMENT Prepared for: Invecta Development (Ottawa) Corporation 758 Shanks Height Milton, ON L9T 7P7 May
Traffic Impact Analysis. Alliance Cole Avenue Residential Site Dallas, Texas. Kimley-Horn and Associates, Inc. Dallas, Texas.
 Traffic Impact Analysis Alliance Cole Avenue Residential Site Dallas, Texas February 15, 2018 Kimley-Horn and Associates, Inc. Dallas, Texas Project #064524900 Registered Firm F-928 Traffic Impact Analysis
Traffic Feasibility Study
 Traffic Feasibility Study Town Center South Robbinsville Township, Mercer County, New Jersey December 19, 2017 Prepared For Robbinsville Township Department of Community Development 2298 Route 33 Robbinsville,
MILLERSVILLE PARK TRAFFIC IMPACT ANALYSIS ANNE ARUNDEL COUNTY, MARYLAND
 MILLERSVILLE PARK TRAFFIC IMPACT ANALYSIS ANNE ARUNDEL COUNTY, MARYLAND Prepared for: Department of Public Works Anne Arundel County Prepared by: URS Corporation 4 North Park Drive, Suite 3 Hunt Valley,
Hydraulic Report. County Road 595 Bridge over Second River. Prepared By AECOM Brian A. Hintsala, P.E
 Prepared for: Prepared by: Marquette County Road Commission AECOM Ishpeming, MI Marquette, MI 60240279 December 9, 2011 Hydraulic Report County Road 595 Bridge over Second River Prepared By AECOM Brian
SECTION 9 STORM SEWER INLETS
 SECTION 9 STORM SEWER INLETS CITY OF WESTMINSTER STORM DRAINAGE DESIGN AND TECHNICAL CRITERIA SECTION 9 STORM SEWER INLETS 9.1 INTRODUCTION There are three types of inlets: curb opening, grated, and combination
APPENDIX C-2. Traffic Study Supplemental Analysis Memo
 APPENDIX C-2 Traffic Study Supplemental Analysis Memo The Mobility Group Transportation Strategies & Solutions Memorandum To: From: Subject: Tomas Carranza, LADOT Matthew Simons Traffic Review - Revised
DEVELOPMENT PROPERTY 1627 MAXIME STREET CITY OF OTTAWA TRANSPORTATION OVERVIEW. Prepared for: Subhas Bhargava. July 9, Overview_1.
 DEVELOPMENT PROPERTY 1627 MAXIME STREET CITY OF OTTAWA TRANSPORTATION OVERVIEW Prepared for: Subhas Bhargava July 9, 2015 115-620 Overview_1.doc D. J. Halpenny & Associates Ltd. Consulting Transportation
Continued coordination and facilitation with City of Austin staff on documentation of processes to permit construction activities at the site.
 Project Manager Ed Collins LJA Engineering, Inc. Transportation Planning Manager 5316 Highway 290 West Austin Public Infrastructure Group Austin, TX 78735 (512) 762-6301 cell (512) 439-4757 office CARTS
Construction Staging Area 4 Avenue Road
 REPORT FOR ACTION Construction Staging Area 4 Avenue Road Date: September 27, 2017 To: Toronto and East York Community Council From: Acting Director, Transportation Services, Toronto and East York District
APPENDIX E. Traffic Analysis Report
 APPENDIX E Traffic Analysis Report THIS PAGE INTENTIONALLY BLANK EAGLE RIVER TRAFFIC MITIGATION PHASE I OLD GLENN HIGHWAY/EAGLE RIVER ROAD INTERSECTION IMPROVEMENTS TRAFFIC ANALYSIS Eagle River, Alaska
THE CORNERSTONE APARTMENTS TRAFFIC IMPACT STUDY R&M PROJECT NO
 THE CORNERSTONE APARTMENTS SITUATED AT N/E/C OF STAUDERMAN AVENUE AND FOREST AVENUE VILLAGE OF LYNBROOK NASSAU COUNTY, NEW YORK TRAFFIC IMPACT STUDY R&M PROJECT NO. 2018-089 September 2018 50 Elm Street,
Traffic Impact Study for the proposed. Town of Allegany, New York. August Project No Prepared For:
 Appendix B SRF Traffic Study (Revised November 2005) Draft Environmental Impact Statement University Commons Town of Allegany, Cattaraugus County, NY December 2005 Traffic Impact Study for the proposed
Construction Realty Co.
 MEMORANDUM TO: FROM : Jeff Pickus Construction Realty Co. Luay R. Aboona, PE Principal 9575 West Higgins Road, Suite 400 Rosemont, Illinois 60018 p: 847-518-9990 f: 847-518-9987 DATE: May 22, 2014 SUBJECT:
RICHMOND OAKS HEALTH CENTRE 6265 PERTH STREET OTTAWA, ONTARIO TRANSPORTATION BRIEF. Prepared for: Guycoki (Eastern) Limited.
 Limited.") RICHMOND OAKS HEALTH CENTRE 6265 PERTH STREET OTTAWA, ONTARIO TRANSPORTATION BRIEF Prepared for: Guycoki (Eastern) Limited June 16, 2016 116-638 Brief_1.doc D. J. Halpenny & Associates Ltd. Consulting
RICHMOND OAKS HEALTH CENTRE 6265 PERTH STREET OTTAWA, ONTARIO TRANSPORTATION BRIEF Prepared for: Guycoki (Eastern) Limited June 16, 2016 116-638 Brief_1.doc D. J. Halpenny & Associates Ltd. Consulting
Re: Addendum No. 4 Transportation Overview 146 Mountshannon Drive Ottawa, Ontario
 April 18 th, 2017 Mr. Kevin Yemm Vice President, Land Development Richraft Group of Companies 2280 St. Laurent Boulevard, Suite 201 Ottawa, Ontario (Tel: 613.739.7111 / e-mail: keviny@richcraft.com) Re:
Appendix C-5: Proposed Refinements Rail Operations and Maintenance Facility (ROMF) Traffic Impact Analysis. Durham-Orange Light Rail Transit Project
 Traffic Impact Analysis. Durham-Orange Light Rail Transit Project") Appendix C-5: Proposed Refinements Rail Operations and Maintenance Facility (ROMF) Traffic Impact Analysis Durham-Orange Light Rail Transit Project July 25, 218 ROMF Transportation Impact Analysis Version
Appendix C-5: Proposed Refinements Rail Operations and Maintenance Facility (ROMF) Traffic Impact Analysis Durham-Orange Light Rail Transit Project July 25, 218 ROMF Transportation Impact Analysis Version
Plan Check Policies and Guidelines
 VIII. TRAFFIC SIGNING AND STRIPING PLANS A. INTRODUCTION Traffic signing and striping plans are required for all General Plan Roads and any roadway that is 56-foot wide curb-to-curb (78 R/W) or wider.
West Hills Shopping Centre Lowe s Expansion Traffic Impact Study
 West Hills Shopping Centre Lowe s Expansion Traffic Impact Study Prepared for: Armel Corporation January 2015 Paradigm Transportation Solutions Ltd. 22 King Street South, Suite 300 Waterloo ON N2J 1N8
Appendix 5. Haymeadow Interim Traffic Analysis
 Appendix 5 Haymeadow Interim Traffic Analysis 20 MEMORANDUM To: From: Rick Pylman Gary Brooks Bill Fox Date: September 15, 2016 Project: Subject: Haymeadow Evaluation of interim access configuration Currently
TABLE OF CONTENTS EXECUTIVE SUMMARY...1 INTRODUCTION...3 PROJECTED FUTURE GROWTH...3 ROADWAY IMPROVEMENT PROJECTS...4 POTENTIAL FUNDING SOURCES...
 Transportation Impact Fee Study September 2014 TABLE OF CONTENTS EXECUTIVE SUMMARY...1 INTRODUCTION...3 PROJECTED FUTURE GROWTH...3 ROADWAY IMPROVEMENT PROJECTS......4 POTENTIAL FUNDING SOURCES...7 PROPOSED
PROJECT: Wilkinson Road Corridor Improvement Traffic Management Planning Project SUBJECT: Traffic Analysis
 TECHNICAL MEMORANDUM DATE: September 10, 2014 PROJECT 5861.03 NO: PROJECT: Wilkinson Road Corridor Improvement Traffic Management Planning Project SUBJECT: Traffic Analysis TO: Steve Holroyd - District
FINAL UTILITY REPORT Eastcreek Farm Thornton, CO
 FINAL UTILITY REPORT Eastcreek Farm Thornton, CO October 14, 2016 JN: 13049 Prepared for: York 80, LLC 12460 1 st Street Eastelake, CO 80614 P: 303.457.2966 Prepared by: Jansen Strawn Consulting Engineers
L1TILE BEARS DAY CARE TRANSPORTATION IMPACT STUDY FORT COLLINS, COLORADO MAY Prepared for:
 L1TILE BEARS DAY CARE TRANSPORTATION IMPACT STUDY FORT COLLINS, COLORADO MAY 2012 Prepared for: Hillside Construction, Inc. 216 Hemlock Street, Suite B Fort Collins, CO 80534 Prepared by: DELICH ASSOCIATES
Traffic Management Plan and Queuing Analysis Lakehill Preparatory School Z Hillside Drive, Dallas, TX October 27, 2015
 Traffic Management Plan and Queuing Analysis Lakehill Preparatory School Z145-235 2720 Hillside Drive, Dallas, TX October 27, 2015 Introduction: The Lakehill Preparatory School is located on the northeast
Environmental Assessment Derry Road and Argentia Road Intersection
 Air and Noise Study Environmental Assessment Derry Road and Argentia Road Intersection Project 11-4295 City of Mississauga, Region of Peel October 17, 2014 1 Region of Peel Environmental Assessment for
TRAFFIC IMPACT STUDY DERRY GREEN CORPORATE BUSINESS PARK MILTON SECONDARY PLAN MODIFICATION
 TRAFFIC IMPACT STUDY DERRY GREEN CORPORATE BUSINESS PARK MILTON SECONDARY PLAN MODIFICATION TRAFFIC IMPACT STUDY DERRY GREEN CORPORATE BUSINESS PARK MILTON SECONDARY PLAN MODIFICATION DECEMBER 2014 UPDATED
V. DEVELOPMENT OF CONCEPTS
 Martin Luther King, Jr. Drive Extension FINAL Feasibility Study Page 9 V. DEVELOPMENT OF CONCEPTS Throughout the study process several alternative alignments were developed and eliminated. Initial discussion
LOTUS RANCH TRAFFIC IMPACT ANALYSIS. LLG Ref Senior Transportation Engineer & Charlene Sadiarin Transportation Engineer II
 TRAFFIC IMPACT ANALYSIS LOTUS RANCH El Centro, California April 26, 2016 LLG Ref. 3-14-2392 Prepared by: KC Yellapu, P.E Senior Transportation Engineer & Charlene Sadiarin Transportation Engineer II Under
DRIVEWAY DESIGN AND CONSTRUCTION GUIDELINES
 DRIVEWAY DESIGN AND CONSTRUCTION GUIDELINES These guidelines are provided to assist you in the construction of your driveway to help you determine: The best location on your property. What you need to
Oakbrook Village Plaza City of Laguna Hills
 Oakbrook Village Plaza City of Laguna Hills Traffic Impact Analysis Prepared by: HDR Engineering 3230 El Camino Real, Suite 200 Irvine, CA 92602 October 2012 Revision 3 D-1 Oakbrook Village Plaza Laguna
Prepared For: Toronto Transit Commission 1138 Bathurst Street Toronto, Ontario M5R 3H2. Prepared By:
 TRAFFIC IMPACT STUDY FOR THE TTC MCNICOLL BUS GARAGE CITY OF TORONTO Prepared For: Toronto Transit Commission 1138 Bathurst Street Toronto, Ontario M5R 3H2 Prepared By: Canada Inc. 4th Floor, 3 Leek Crescent
TRAFFIC IMPACT STUDY VICDOM BROCK ROAD PIT EXPANSION
 TRAFFIC IMPACT STUDY VICDOM BROCK ROAD PIT EXPANSION TOWNSHIP OF UXBRIDGE P/N 05-1993 June 2011 Revised -August 2011 Prepared by: Skelton, Brumwell & Associates Inc. 93 Bell Farm Road, Suite 107 Barrie,
DRAFT TRANSPORTATION IMPACT STUDY CASTILIAN REDEVELOPMENT PROJECT
 DRAFT TRANSPORTATION IMPACT STUDY CASTILIAN REDEVELOPMENT PROJECT Prepared for: Submitted by: 299 Lava Ridge Ct. Suite 2 Roseville, CA. 95661 June 212 TABLE OF CONTENTS 1. Introduction... 1 Project Location
Traffic Impact Analysis Update
 Willow Bend Traffic Impact Analysis Update TABLE OF CONTENTS Page I. INTRODUCTION -------------------------------------------------------------------------------------------- 1 II. EXISTING CONDITIONS
Purpose and Need Report
 Purpose and Need Report State Highway (SH) 29 From Southwestern Boulevard to SH 95 Williamson County, Texas (CSJ: 0337-02-045) Prepared by Blanton & Associates, Inc. Date: November, 2015 The environmental
IV. REVISIONS TO THE DRAFT IS/MND
 IV. REVISIONS TO THE DRAFT IS/MND 1. REVISIONS TO THE DRAFT IS/MND This section presents corrections and clarifications that have been made to the text of the Draft IS/MND. These changes include revisions
4131 Chain Bridge Road
 Traffic Impact Study 4131 Chain Bridge Road City of Fairfax, VA 05/04/16 May 4, 2016 Prepared for: Paradigm 1415 North Taft Street Suite 100 Arlington, VA 22201 This report is printed on environmentally
APPENDIX B Traffic Analysis
 APPENDIX B Traffic Analysis Rim of the World Unified School District Reconfiguration Prepared for: Rim of the World School District 27315 North Bay Road, Blue Jay, CA 92317 Prepared by: 400 Oceangate,
FREQUENTLY ASKED QUESTIONS
 THE PROJECT Last updated on 9/8/16 FREQUENTLY ASKED QUESTIONS What s happening on Highway 169? The Minnesota Department of Transportation (MnDOT) is planning to rebuild and repair the infrastructure on
TRANSPORTATION STUDY FOR THE 8899 BEVERLY BOULEVARD PROJECT
 DRAFT TRANSPORTATION STUDY FOR THE 8899 BEVERLY BOULEVARD PROJECT WEST HOLLYWOOD, CALIFORNIA NOVEMBER 2013 PREPARED FOR BEVERLY BOULEVARD ASSOCIATION PREPARED BY DRAFT TRANSPORTATION STUDY FOR THE 8899
MEMO VIA . Ms. Amy Roth DPS Director, City of Three Rivers. To:
 MEMO To: Ms. Amy Roth DPS Director, City of Three Rivers VIA EMAIL From: Michael J. Labadie, PE Julie M. Kroll, PE, PTOE Brandon Hayes, PE, P.Eng. Fleis & VandenBrink Date: January 5, 2017 Re: Proposed
Traffic, Transportation & Civil Engineering Ali R. Khorasani, P.E. P.O. Box 804, Spencer, MA 01562, Tel: (508)
") Associates Traffic, Transportation & Civil Engineering Ali R. Khorasani, P.E. P.O. Box 804, Spencer, MA 01562, Tel: (508) 885-5121 Ms. Teri Ford, Associate 800 Boylston Street, Suite 1570 Boston, MA July
Associates Traffic, Transportation & Civil Engineering Ali R. Khorasani, P.E. P.O. Box 804, Spencer, MA 01562, Tel: (508) 885-5121 Ms. Teri Ford, Associate 800 Boylston Street, Suite 1570 Boston, MA July
 Traffic Analysis For Approved Uses within the St. Lucie West DRI Aldi Port St. Lucie, FL Prepared for: Bohler Engineering, LLC 1000 Corporate Drive Suite 250 Fort Lauderdale, FL 33334 Prepared by: 10795
Table Existing Traffic Conditions for Arterial Segments along Construction Access Route. Daily
 5.8 TRAFFIC, ACCESS, AND CIRCULATION This section describes existing traffic conditions in the project area; summarizes applicable regulations; and analyzes the potential traffic, access, and circulation
SASD 2010 SYSTEM CAPACITY PLAN EXPANSION TRUNK SHEDS BR EAST RANCHO TRUNK SHED 2015 AMENDMENT
 SASD 2010 SYSTEM CAPACITY PLAN EXPANSION TRUNK SHEDS BR EAST RANCHO TRUNK SHED 2015 AMENDMENT Introduction This amendment summarizes the new near-term and buildout expansion trunk shed plans. Due to recent
Date: February 7, 2017 John Doyle, Z-Best Products Robert Del Rio. T.E. Z-Best Traffic Operations and Site Access Analysis
 Memorandum Date: February 7, 07 To: From: Subject: John Doyle, Z-Best Products Robert Del Rio. T.E. Z-Best Traffic Operations and Site Access Analysis Introduction Hexagon Transportation Consultants, Inc.