APPENDIX E 5(9,6(' TRAFFIC STUDY
|
|
|
- Barbara Wade
- 6 years ago
- Views:
Transcription
1 APPENDIX E TRAFFIC STUDY
2

3 GENERAL PLAN UPDATE TRAFFIC ANALYSIS Submitted to: CITY OF ORANGE Prepared by: PB Americas, Inc. Revised June 009
4
5 TABLE OF CONTENTS ES EXECUTIVE SUMMARY...A.0 INTRODUCTION.... Analysis Area....0 ELEMENTS OF THE CIRCULATION SYSTEM.... Freeways.... Arterials...4. Public Transportation Railroad Operations Bikeway System Recreation Trails Parking Truck Routes....9 Emergency Response Routes....0 EXISTING TRAFFIC CONDITIONS LOS Definitions...5. ICU Analysis Existing Daily Conditions Existing Intersection Peak Hour Conditions FUTURE CONDITIONS Future Traffic Volume Post-Processing Methodology No Project Future Daily Conditions No Project Future Intersection Peak Hour Conditions No Project Future Baseline Improvements Project Future Daily Conditions Project Future Intersection Peak Hour Conditions Project Future Mitigation Alternative Future Daily Conditions Alternative Future Intersection Peak Hour Conditions Alternative Future Mitigation Alternative Future Daily Conditions Alternative Future Intersection Peak Hour Conditions Alternative Future Mitigation Future Traffic Analysis Summary i
6 List of Figures Figure ES. Future MPAH with General Plan Implementation and Mitigation...I Figure. Analysis Area... Figure. Existing Roadway Facility Types... Figure. Existing Public Transportation...7 Figure. Existing Railroad...9 Figure.4 Existing Bikeways... Figure.5 Existing Public Parking Lots... Figure.6 Existing Truck Routes...4 Figure. Existing Average Daily Traffic on Arterial Segments (in Thousands)... Figure. Existing Arterial Daily Level of Service... Figure. Existing Intersection Level of Service... 5 Figure 4. Proposed Bikeways...9 Figure 4. No Project Future Average Daily Traffic on Arterial Segments (in Thousands)... 6 Figure 4. No Project Future Arterial Daily Level of Service... 7 Figure 4.4 No Project Future Intersection Level of Service Figure 4.5 Project Future Average Daily Traffic on Arterial Segments (in Thousands)... 5 Figure 4.6 Project Future Arterial Daily Level of Service... 5 Figure 4.7 Project Future Intersection Level of Service Figure 4.8 Alternative Future Average Daily Traffic on Arterial Segments (in Thousands) Figure 4.9 Alternative Future Arterial Daily Level of Service Figure 4.0 Alternative Future Intersection Level of Service... 7 Figure 4. Alternative Future Average Daily Traffic on Arterial Segments (in Thousands)... 8 Figure 4. Alternative Future Arterial Daily Level of Service... 8 Figure 4. Alternative Future Intersection Level of Service Figure 4.4 Future MPAH with General Plan Implementation and Mitigation List of Tables Table ES. Future Scenarios...A Table ES. Trip Generation Summary...B Table ES. Project Future Arterial Mitigation Recommendations...E Table ES.4 Project Future Intersection Mitigation Recommendations... G Table. Roadway Facility Types...4 Table. Existing Bus Routes...5 Table. Level of Service Definitions... 5 Table. Arterial Daily Capacity Threshold Assumptions... 5 Table. Existing Arterial Daily Level of Service... 6 Table.4 Existing Intersections Level of Service... Table 4. Trip Generation Summary... 6 Table 4. Future Scenarios...8 Table 4. No Project Existing MPAH Arterial Daily Level of Service... Table 4.4 No Project Intersection Level of Service... 9 Table 4.5 No Project Future Arterial Baseline Improvement Recommendations... 4 Table 4.6 No Project Future Intersection Baseline Improvement Recommendations... 4 Table 4.7 Project Future Arterial Daily Level of Service Table 4.8 Project Future Intersection Level of Service Table 4.9 Project Future Arterial Mitigation Recommendations Table 4.0 Project Future Intersection Mitigation Recommendations... 6 Table 4. Alternative Future Arterial Daily Level of Service... 6 Table 4. Alternative Future Intersection Level of Service Table 4. Alternative Future Arterial Mitigation Recommendations...7 ii
7 Table 4.4 Alternative Future Intersection Mitigation Recommendations...74 Table 4.5 Alternative Future Arterial Daily Level of Service Table 4.6 Alternative Future Intersection Level of Service Table 4.7 Alternative Future Arterial Mitigation Recommendations...86 Table 4.8 Alternative Future Intersection Mitigation Recommendations...87 Table 4.9 Alternative Future Arterial Daily Level of Service Summary Table 4.0 Alternative Intersection Level of Service Summary List of Appendices Appendix A Appendix B Appendix C Appendix D Appendix E Appendix F Appendix G Appendix H Appendix I Appendix J Existing and Future No Project (MPAH) Intersection Lane Geometry Existing and Future No Project Intersection ICU Worksheets Future No Project Mitigated Intersection ICU Worksheets Future No Project (MPAH) and Project (Revised MPAH) Intersection Lane Geometry Future No Project, Project, Alternative and Alternative Intersection ICU Worksheets Future Project Mitigated Intersection ICU Worksheets Future Alternative Mitigated Intersection ICU Worksheets Future Alternative Mitigated Intersection ICU Worksheets Key City Intersection Geometric Diagrams Orange County MPAH Amendment Process iii
8
9 ES EXECUTIVE SUMMARY The objective of the Circulation Element is to document existing transportation facilities in the Orange General Plan Planning Area, their conditions, and impacts resulting from future land use identified in the City s General Plan. Impact analysis will assist in the determination of the future Master Plan of Arterial Highways (MPAH) throughout the City to serve future forecast traffic demands. The Circulation Element Traffic Analysis describes the existing circulation system, including arterial network and intersections, the public transit system, bicycle paths, recreation facilities, parking, and railroad operations, before evaluating future traffic conditions. Four future alternative land use and circulation system scenarios were evaluated, as described in Table ES.. Table ES. Future Scenarios Scenario Land Use Assumption Circulation Assumption No Project 00 Buildout of Existing General Plan 00 Buildout of Existing MPAH Project Alternative Alternative 00 Buildout of Proposed General Plan 00 Buildout of Proposed General Plan 00 Reduced Intensity General Plan 00 Buildout of Proposed MPAH with the Meats Avenue/SR-55 Interchange 00 Buildout of Proposed MPAH without the Meats Avenue/SR-55 Interchange 00 Buildout of Proposed MPAH with the Meats Avenue/SR-55 Interchange A key assumption in the development of future traffic conditions is the underlying roadway network, which assumes buildout of the existing City Master Plan of Arterial Highways (MPAH) and includes the following roadway improvements: Cambridge Street, Katella Avenue to South City Limits improve to 4-lane secondary facility Cannon Avenue, Serrano Avenue to Santiago Canyon Road improve to 6-lane major facility Chapman Avenue, Lemon Street to Grand Street improve to 4-lane primary facility Crawford Canyon Road, Chapman Avenue to Newport Avenue improve to 4-lane secondary facility Eckhoff Street, Orangewood Avenue to Collins Avenue improve to 4-lane secondary facility Glassell Street, La Veta Avenue to Collins Avenue improve to 4-lane secondary facility La Veta Avenue, Flower Street to Parker Street improve to 6-lane major facility La Veta Avenue, Glassell Street to Cambridge Street improve to 4-lane secondary facility Lewis Street, Metropolitan Drive to Chapman Avenue improve to 4-lane primary facility Lincoln Avenue, west City Limits to Nohl Ranch Road improve to 6-lane major facility Main Street, La Veta Avenue to Collins Avenue improve to 6-lane major facility Metropolitan Drive, The City Drive to Chapman Avenue add 4-lane secondary facility Orangewood Avenue, Eckhoff Street to Main Street improve to 6-lane major facility Parker Street, South City Limit to La Veta Avenue improve to 4-lane secondary facility Prospect Street, Fairhaven Avenue to La Veta Avenue improve to 4-lane secondary facility Rampart Street, Chapman Avenue to Orangewood Avenue improve to 4-lane secondary facility Santiago Boulevard, north of Lincoln Avenue/Nohl Ranch Road improve to 6-lane major facility Santiago Canyon Road/Villa Park Road, Handy Street to Newport Avenue improve to 6-lane major facility Taft Avenue, west City limits to Tustin Street improve to 6-lane major facility The City Drive, Garden Grove Boulevard to SR- improve to 6-lane major facility Walnut Avenue, Main Street to Prospect Street improve to/add 4-lane secondary facility A
10 While the No Project Alternative, which represents buildout of the Existing General Plan land use scenario, assumes the Existing MPAH as the background roadway system, the remaining alternatives refine the Existing MPAH with minor improvements that define the Proposed MPAH. The Proposed MPAH represents a more realistic future base network and accounts for the following deviations from the Existing MPAH: Cambridge Street, Katella Avenue to South City Limits maintain existing -lane configuration Chapman Avenue, Lemon Street to Grand Street maintain existing -lane configuration Walnut Avenue, Main Street to Prospect Street maintain existing -lane configuration Glassell Street, Almond Avenue to Palm Avenue maintain existing -lane configuration Implementation of a full-diamond interchange at Meats Avenue/SR-55 These arterial facilities are residential collectors or located in the Orange Plaza; hence, improvements to them are unlikely due to political, historical, residential, right-of-way, and environmental issues, among others. As there are no plans to widen these arterials to four-lane facilities as specified in the Existing City MPAH and that the City desires to retain the existing configurations on these facilities, these deviations define the Proposed MPAH. A full diamond interchange at SR-55 and Meats Avenue was also incorporated into the Project Scenario and Alternative. The Meats Avenue interchange with SR-55 has the potential to relieve the congestion experienced at the SR-55 and Lincoln Avenue/Nohl Ranch Road and Katella Avenue interchanges. Level of service analysis was performed on arterial segments and at key citywide intersections using turning movement volumes forecast by the Orange Traffic Analysis Model. The level of service analysis for both arterial segments and intersections assumes full buildout of the City Master Plan of Arterial Highways (Proposed or Existing, as identified in Table ES.), therefore, intersection lane improvements were incorporated into the intersection analysis. The future alternative trip generation comparison to existing conditions is presented in Table ES.. The Project Scenario generates approximately 50% more trips than are currently generated within the City. Alternative generates approximately 5% fewer trips than the Project Scenario. Table ES. Scenario Trip Generation Summary Daily Trips Generated Existing 995,000 No Project,87,00 Project,456,700 Alternative,456,700 Alternative,76,00 Source: OTAM Based on the Proposed Project land use and trip generation, several arterial segments and intersections are forecast to operate at deficient levels of service under daily and peak hour conditions. Mitigation measures for the arterial segments that operate at an unacceptable LOS under daily conditions and intersections that operate at an unacceptable LOS during either A.M. or P.M. peak hours have been identified. Generally, arterial segment performance is dictated by upstream and downstream intersection performance because the capacity of arterial segments is often constricted to what can filter through the intersections during the peak hours. Since arterial segment mitigation may not be warranted based on peak hour intersection performance, mitigation measures are generally applied to intersections to facilitate peak period traffic flow throughout the roadway network. Although mitigation measures are often tied to intersections, mitigation measures based on the daily performance of arterial segments throughout the City have been recommended. Table ES. presents recommended arterial mitigation measures for the deficient segments within Orange under Project B
11 Buildout conditions. Although Chapman Avenue and Glassell Street through the Historic Orange Plaza operate at deficient levels of service, mitigation is not recommended through the Orange Plaza as capacity enhancements, i.e. widening, of these facilities would be detrimental to preserving the heritage of the Plaza. The significant unavoidable traffic impacts to the arterials through the Orange Plaza are outweighed and found to be acceptable due to the following specific economic, social, and historical benefits: The Plaza Historic District achieved California Historic Landmark significance in 98 and the Plaza Historic District was placed on the National Register of Historic Places on March 9, 98; Old Town Orange became a national historic district and was placed in the National Registry of Historic Places in 997; The Orange Plaza traffic circle is the focal point of the Historic District; The City has developed a Historic Preservation Element of the General Plan; The mission of the Old Towne Preservation Association is to preserve and enhance the unique Old Towne Orange Area through education, communication, and community development; In order to enhance and preserve its heritage, the City established design and development standards for the Old Towne District; The character, ambiance, and historical nature of the district could be compromised by four-lane divided facilities through the Orange Plaza; and In order to maintain the integrity of the traffic circle, it would be difficult to improve Glassell Street and Chapman Avenue to four-lane divided standards and maintain the capacity of a facility through the circle. In addition, the circulation system around the Orange Plaza is a dense grid; therefore, it has the capability of providing relief to potential future traffic demands on Glassell Street or Chapman Avenue through additional available capacity on parallel facilities. Many of the arterial deficiencies occur at freeway interchanges as traffic filters through the City and onto the regional transportation system. Taft Avenue at the west City Limit, east of SR-57, is forecast to operate at LOS E. Coordination of intersections through the Taft Avenue corridor is recommended to accommodate heavy daily traffic demands. Taft Avenue at the west City Limit is not recommended for improvement without detailed peak hour analysis to warrant physical arterial segment widening. In addition, evaluation of this segment must be coordinated with the City of Anaheim as widening of this segment in Orange will necessitate widening in the City of Anaheim to maintain consistency across jurisdictional boundaries. Widening of this segment of Taft Avenue requires widening the bridge over the Santa Ana River and minor impacts to fronting retail/industrial uses. Chapman Avenue through the SR-55 interchange is also forecast to exceed daily capacity thresholds. Advance Traffic Management System strategies, such as signal coordination, is also recommended for the Chapman Avenue corridor. Chapman Avenue between SR-55 and Yorba Street operates just above the LOS E/F threshold. Due to the issues identified with the baseline improvement identified under No Project conditions, it is not recommended to improve this segment beyond its current configuration. Between Yorba Street and Prospect Street, future forecast volumes specify that an 8-lane facility is required. This improvement would be very costly and have significant retail, office, medical facility, and residential right-of-way impacts. Accessibility to fronting retail could also be impacted by implementation of this improvement measure. Chapman Avenue east of SR-55 should continually be monitored and operational improvements incorporated as appropriate to maintain mobility through this key corridor. The segment of Chapman Avenue to Canyon View Avenue operates at LOS F and improvement to a 6-lane facility would improve the LOS to acceptable levels. Widening this short segment may require earthwork but it is likely that property impacts would be minimal. No arterial widening improvements are recommended for Glassell Street through the SR- interchange to La Veta Avenue. Implementation of widening along this segment would impact the historically designated Hart Park and the historic Morton Bay Fig tree in front of Holy Family Catholic Church. In C
12 addition, fronting residential properties would be significantly impacted by any widening along this segment and on-street parking would likely need to be eliminated. Batavia Street is recommended to be improved to a 4-lane divided facility for multiple segments between Walnut Avenue and Lincoln Avenue. The segment between Walnut and Collins Avenue could be widened by removal of on-street parking with minimal, if any, right-of-way impacts. On-street parking along this segment is heavily utilized by the fronting industrial uses on a daily basis. The segments between Taft Avenue and Lincoln Avenue, while classified as a 4-lane undivided secondary, actually operates more like a 4-lane divided primary facility because the entire stretch has a two-way left turn lane. The mitigation for this segment would be to reclassify as a primary facility. Collins Avenue, similar to Batavia Street, is classified as a 4-lane undivided facility. Upgrading to a 4-lane divided configuration would provide for an acceptable LOS. Improvement to a divided facility would require widening, which may impact fronting residential and industrial properties. Glassell Street between Katella Avenue and Orange Olive Road is recommended to be improved to a 6- lane facility. While this improvement can potentially be implemented with minimal right-of-way acquisition required, on-street parking would be eliminated for fronting business and residential uses. Several segments of Katella Avenue are forecast to operate at LOS E under future conditions. Widening of Katella Avenue could have significant adverse impacts to fronting retail, office, and industrial uses and therefore is not recommended. Removal of on-street parking, where currently available, would be required under a widening scenario. The intersections along Katella Avenue should be continually monitored to ensure acceptable performance during the peak hours. Utilizing the full capacity of the system may result in acceptable operations through the corridor. Main Street between Town & County Road and La Veta Avenue is forecast to operate at LOS E. Widening this segment to an 8-lane facility is recommended. This improvement would likely require bridge widening over SR- and could potentially impact fronting commercial uses, specifically at the northeast corner of Town & County Road and Main Street. The implementation of the Meats Avenue interchange with SR-55 requires upgrading Meats Avenue between Tustin Street and the SR-55 Southbound Ramps to a 6-lane facility and the segment between the northbound and southbound ramps to a 6-lane facility. The segment between the northbound ramps and Santiago Boulevard would require an upgrade to a 4-lane divided facility. Even with the improvement of the segment west of the southbound ramps, this segment is forecast to operate at LOS E. Widening to an 8-lane segment is not recommended. Implementation of the interchange would have right-of-way impacts to residential uses on all four quadrants of the interchange, likely displacing several residential units, including trailer park units north of Meats Avenue west of SR-55 in the Orange Mobile Home Park. In addition, the bridge over SR-55 would require widening to ensure appropriate intersection geometry is provided to support the ramp intersections. Although Prospect Street between Chapman Avenue and Walnut Avenue and Wanda Road between Katella Avenue and Santiago Boulevard are labeled as 4-lane undivided secondary facilities, they operate as a 4-lane divided primary facility since the entirety of the segments either include a two-way left turn lane or a raised median. Typically, improving a facility from a 4-lane undivided configuration to a 4-lane divided configuration involves removal of on-street parking, construction of a raised median or restriping to account for a two-way left turn lane and potential widening to achieve a divided configuration. The classification for these segments could be correctly revised to identify as primary facilities. Recommended mitigation measures for deficient intersections under Project conditions are presented in Table ES.4. Twelve intersections are forecast to operate at a deficient level of service under Future Project conditions. Generally, intersection mitigation measures proposed include the provision of additional turning lane capacity. Under Project conditions, the implementation of the Meats Avenue/SR- 55 interchange requires mitigation resulting from increased demand through the intersection as a result of the new interchange. D
13 Table ES. Project Future Arterial Mitigation Recommendations ID Arterial From To MPAH Lanes 00 ADT City of Orange: Circulation Element Traffic Analysis LOS E Capacity V/C Ratio 8 Batavia Street Walnut Avenue Collins Avenue 4U,00 4, E 9 Batavia Street Collins Avenue Katella Avenue 4U,00 4, E Batavia Street Taft Avenue Fletcher Avenue 4U,800 4, E Batavia Street Fletcher Avenue Lincoln Avenue 4U,900 4, E Chapman Avenue Lemon Street Glassell Street U,500, F Chapman Avenue Glassell Street Grand Street U,600, F 5 Chapman Avenue SR-55 Yorba Street 8D 75,00 75, F LOS Mitigation Measure Improve to 4-lane divided facility No mitigation recommended through Historic Orange Plaza Monitor segment and evaluate intersections along Chapman Avenue between Tustin Street and Prospect Street to maximize throughput. 6 Chapman Avenue Yorba Street Prospect Street 6D 6,600 56,00. F Widen to 8-lane facility 40 Chapman Avenue Crawford Cyn Rd. Canyon View Avenue 4D 9,700 7, F Widen to 6-lane facility 47 Collins Avenue Batavia Street Glassell Street 4U,000 4, E Improve to 4-lane divided facility 49 Collins Avenue Cambridge Street Tustin Street 4U,900 4, E Improve to 4-lane divided facility 7 Glassell Street SR- La Veta Avenue 4D 4,600 7, E No mitigation recommended 74 Glassell Street Chapman Avenue Palm Avenue U,900, E No mitigation recommended through Historic Orange Plaza 77 Glassell Street Katella Avenue Orange Olive Road 4D 7,700 7,500.0 F Improve to 6-lane divided facility 89 Katella Avenue Struck Avenue Main Street 6D 56,500 59, E 90 Katella Avenue Main Street Batavia Street 6D 55,00 59,5 0.9 E 9 Katella Avenue Batavia Street Glassell Street 6D 5,700 59,5 0.9 E 9 Katella Avenue Glassell Street Cambridge Street 6D 54,500 59,5 0.9 E Monitor upstream and downstream intersections to evaluate need for widening segment. 7 Main Street Town & Country Road La Veta Avenue 6D 55,500 56, E Widen to 8-lane facility 7 Meats Avenue Tustin Street SR-55 SB Ramps 4U 5,00 4,000. F Improve to 6-lane divided facility 7 Meats Avenue SR-55 SB Ramps SR-55 NB Ramps 4U 45,500 4, F Improve to 6-lane divided facility 7 Meats Avenue SR-55 NB Ramps Santiago Boulevard 4U,900 4,000.7 F Improve to 4-lane divided facility 5 Prospect Street Chapman Avenue Spring Street 4U,000 4, E Improve to 4-lane divided facility 54 Prospect Street Spring Street Walnut Avenue 4U,00 4, E Improve to 4-lane divided facility 77 Taft Avenue West City Limit Main Street 6D 56,400 56,00.00 F Monitor upstream and downstream intersections to evaluate need for widening segment. 0 Wanda Road Katella Avenue Santiago Boulevard (VP) 4U 7,800 4,000.6 F Improve to 4-lane divided facility Deficient Segment, LOS E Deficient Segment, LOS F Arterial Segment Level of Service With Mitigation Measure Implementation 8 Batavia Street Walnut Avenue Collins Avenue 4D,00 7,500 9 A 9 Batavia Street Collins Avenue Katella Avenue 4D,00 7, B Batavia Street Taft Avenue Fletcher Avenue 4D,800 7,500 8 A Batavia Street Fletcher Avenue Lincoln Avenue 4D,900 7, B Chapman Avenue Lemon Street Glassell Street U,500, F Chapman Avenue Glassell Street Grand Street U,600, F 5 Chapman Avenue SR-55 Yorba Street 8D 75,00 75, F 6 Chapman Avenue Yorba Street Prospect Street 8D 6,600 75, D 40 Chapman Avenue Crawford Cyn Rd. Canyon View Avenue 6D 9,700 56, C 47 Collins Avenue Batavia Street Glassell Street 4D,000 7, B 49 Collins Avenue Cambridge Street Tustin Street 4D,900 7, B 7 Glassell Street SR- La Veta Avenue 6D 4,600 56, B 74 Glassell Street Chapman Avenue Palm Avenue U,900, E 77 Glassell Street Katella Avenue Orange Olive Road 6D 7,700 56, B 89 Katella Avenue Struck Avenue Main Street 6D 56,500 59, E 90 Katella Avenue Main Street Batavia Street 6D 55,00 59,5 0.9 E 9 Katella Avenue Batavia Street Glassell Street 6D 5,700 59,5 0.9 E 9 Katella Avenue Glassell Street Cambridge Street 6D 54,500 59,5 0.9 E 7 Main Street Town & Country Road La Veta Avenue 8D 55,500 75, C 7 Meats Avenue Tustin Street SR-55 SB Ramps 6D 5,00 56, E 7 Meats Avenue SR-55 SB Ramps SR-55 NB Ramps 6D 45,500 56, D 7 Meats Avenue SR-55 NB Ramps Santiago Boulevard 4D,900 7, D 5 Prospect Street Chapman Avenue Spring Street 4D,000 7,500 9 A 54 Prospect Street Spring Street Walnut Avenue 4D,00 7, B 77 Taft Avenue West City Limit Main Street 6D 56,400 56,00.00 F 0 Wanda Road Katella Avenue Santiago Boulevard (VP) 4D 7,800 7, C E
14 Typical intersection mitigation measures include intersection widening to add capacity through additional turn or through lanes. Additional mitigation measures for intersections include re-striping the existing turn movement configuration to allow for more capacity for critical movements. Critical movements are the movements on the intersection approaches that generally have high volumes and result in deficient intersection operations. Advanced Transportation Management Systems (ATMS) are components that are implemented to maximize intersection capacity without physical capacity to intersections. ATMS strategies typically include revised signalization and signal coordination to increase throughput through a corridor. ATMS strategies generally increase capacity by five percent, therefore a 0.05 V/C ratio credit will be applied to intersections where these strategies may be recommended. Since the Cannon Santiago Canyon Road intersection operates just above the allowable threshold, it is recommended to apply ATMS strategies at this location to maximize operational capacity and throughput of the intersection. The recommended improvement for the Cannon Serrano Avenue intersection requires reconstruction of the westbound approach of Serrano Avenue to provide for triple westbound left turns. However, this improvement requires Cannon Street to be widened in the southbound direction to accommodate a triple left turn lane. Impacts to residences would be required to implement this improvement measure. Forecast volumes at Jamboree Chapman Avenue require a rd northbound left turn lane. Based on the current configuration and the vacant property in the southeast corner of this intersection, this improvement appears feasible. The recommended improvement to add a second westbound left turn lane for the Katella SR- 55 southbound ramps intersection may result in impacts and potential bridge reconstruction to provide an additional turn lane onto southbound SR-55 under the existing freeway. The cost and construction impacts may be prohibitive to implementation of this improvement measure. The intersection of Main La Veta Avenue is forecast to operate at LOS E. Application of ATMS strategies at this location are recommended to achieve acceptable operations. Widening this intersection beyond its buildout configuration may result in significant right-of-way impacts due to directly adjacent major office building structures. The intersection of Santiago Meats Avenue operates at LOS E under Project conditions during the A.M. peak hour. Due to the implementation of the Meats Avenue/SR-55 interchange, additional capacity is required at this intersection. An exclusive right turn lane could be implemented, although right-of-way and potential residential property impacts may result. Another alternative is to incorporate ATMS strategies at this location, although capacity enhancements to account for the new interchange would likely result in more efficient operations. The ramp intersections of Meats Avenue with SR-55 were evaluated under peak hour conditions to identify potential deficiencies associated with the proposed interchange. In order to obtain acceptable peak hour operations at the southbound SR-55 intersection with Meats Avenue, the southbound off-ramp should include an exclusive left turn lane, an exclusive right turn lane, and a shared left turn-right turn lane. Although the intersection operates at LOS C during the peak hours, the westbound left turn volume of approximately 500 vehicles during the A.M. peak hour suggests a second westbound left turn lane might be necessary to ensure there are no queuing issues with the west turn traffic onto southbound SR- 55 on the Meats Avenue overcrossing bridge. Both intersections assume through lanes in each direction and an exclusive right turn lane to access the SR-55 ramps. For the northbound SR-55 intersection with Meats Avenue, dual northbound left turn lanes are required to satisfy forecast demands. In addition, dual eastbound left turn lanes are required on the overcrossing bridge to support the high P.M. peak hour volumes accessing SR-55 northbound. The Wanda Villa Park Road requires additional capacity for the westbound and northbound movements. This is currently a very tight intersection with little room for future expansion. Increased capacity in the westbound direction would likely impact fronting single and multi-family residences located adjacent to the right-of-way. F
15 Table ES.4 ID Project Future Intersection Mitigation Recommendations Intersection Location A.M. Peak Hour P.M. Peak Hour ICU LOS ICU LOS Mitigation Measure 7 Cannon Santiago Canyon Road 0.94 E 0.9 E Apply ATMS to enhance capacity 8 Cannon Serrano Avenue 0.99 E 0.88 D Add rd Westbound Left Turn Lane Jamboree Chapman Avenue 0.94 E 0.90 D Add rd Northbound Left Turn Lane 7 Southbound SR-55 Katella Avenue 0.97 E 0.87 D Add nd Westbound Left Turn Lane 0 Main La Veta Avenue 0.8 D 0.95 E Apply ATMS applications to enhance capacity 40 Santiago Meats Avenue 0.9 E 0.77 C Restripe shared Westbound Through Right Lane to nd Through Lane, Add Westbound Right Turn Lane 4 Wanda Villa Park Road.8 F 0.97 E Add rd Westbound Through Lane, Add nd Southbound Left Turn Lane 48 Tustin Lincoln Avenue 0.9 E.0 F Add rd Eastbound Through Lane and nd Eastbound Right Turn Lane 56 Main Struck Avenue.08 F 0.70 B Add nd Eastbound and nd Westbound Through lanes 57 Main Collin Avenue 0.9 E.8 F Add one Northbound and Eastbound Right Turn Lane, Restripe Westbound approach to Left Turn Lanes and Though Lane 58 SR-57 SB Orangewood Avenue 0.97 E 0.94 E Convert Eastbound Right Turn Lane to rd Through Lane, Add nd Westbound Left Turn Lane 64 SR-57 SB Chapman Avenue 0.76 C 0.9 E Deficient Intersection, LOS E Deficient Intersection, LOS F Intersection Level of Service with Mitigation Measure Implementation ID Intersection Location A.M. Peak Hour P.M. Peak Hour ICU LOS ICU LOS 7 Cannon Santiago Canyon Road 0.89 D 0.88 D 8 Cannon Serrano Avenue 0.86 D 0.88 D Jamboree Chapman Avenue 0.88 D 0.90 D 7 Southbound SR-55 Katella Avenue 0.74 C 0.76 C 0 Main La Veta Avenue 0.77 C 0.90 D 40 Santiago Meats Avenue 0.87 D 0.77 C 4 Wanda Villa Park Road 0.88 D 0.86 D 48 Tustin Lincoln Avenue 0.74 C 0.90 D 56 Main Struck Avenue 0.79 C 0.6 B 57 Main Collin Avenue 0.8 D 0.86 D 58 SR-57 SB Orangewood Avenue 0.74 C 0.7 C 64 SR-57 SB Chapman Avenue 0.80 C 0.89 D 0.7 C 0.7 C Convert Northbound and Southbound Right Turn Lane to Through Lane, Convert Northbound and Southbound shared Left and Through lane to Left-Turn only lane; Alternate mitigation Apply ATMS The Tustin Lincoln Avenue intersection is constrained by restaurant and gas station/retail uses fronting on the western side of the intersection and the SR-55 under-crossing on the eastern side of the intersection. Even with implementation of the Meats Avenue interchange, this intersection is forecast to operate at unacceptable levels of service. This improvement would potentially require significant right-ofway acquisition and bridge replacement/construction costs and, as a result, may be considered infeasible. The intersection of Main Struck Avenue operates at LOS F under Project conditions during the A.M. peak hour. Addition of a second eastbound and westbound through lane along Struck Avenue is required to bring this intersection to perform with acceptable LOS. Located within an existing commercial and industrial area, it is feasible that these improvements can be implemented although the through lane needs to be carried through the intersection prior to transitioning back to lanes. G
16 The intersection of Main Collins Avenue operates at LOS E and LOS F under Project conditions during the A.M. and P.M. peak hour, respectively. Addition of a northbound and an eastbound right-turn lanes as well as restriping the westbound approach from one left-turn, two through lanes to two left-turn lanes and one through lane are recommended to bring the intersection within the acceptable LOS D threshold. The addition of the northbound right-turn lane has been recommended as part of the City of Anaheim Platinum Triangle Trafic Study. Similar to the intersection of Main Struck Avenue, this intersection is located in a predominantly industrial area although implementation of these improvements will potentially require right-of-way. The intersection of Southbound SR-57 Orangewood Avenue operates at LOS E under Project conditions for both peak hours. Improvements recommended at this location in the City of Anaheim Platinum Triangle Traffic Study include the conversion of the eastbound right-turn lane to a third eastbound through lane and the addition of a second westbound left-turn lane. These improvements bring the intersection within the acceptable LOS threshold. The intersection of Southbound SR-57 Chapman Avenue operates at LOS E under Project conditions for P.M. peak hour. Conversion of the north and south right-turn lane into a through lane and the conversion of the shared northbound and southbound left and through lane to a left-turn only lane are adequate to improve the intersection to perform within acceptable LOS D. Since this intersection is forecast to perform marginally above the recommended threshold, an alternative mitigation measure is to apply ATMS strategies at this location to improve traffic flow. The other three future arterials experience similar daily and peak hour deficiencies throughout the city s circulation system. Recommended mitigation or improvement measures between the alternatives are generally consistent. Alternative, which is consistent with the Project Scenario with the exception of the Meats Avenue interchange at SR-55, does not reveal significant impacts to the circulation system along the SR-55 corridor. The implementation of an interchange at Meats provides additional regional accessibility and provides relief to adjacent interchanges that experience congestion, although minor impacts are expected to the local system with implementation of an interchange. The intersection of Santiago Meats Avenue deteriorates, as would be expected, with a Meats Avenue interchange. Meats Avenue would need to be upgraded to satisfy future demands for traffic accessing SR-55. Figure ES. presents the recommended City Master Plan of Arterial Highways. H
17 I A I O R ES. - Future MPAH with General Plan Implementation and Mitigation ANAHEIM STATE COLLEGE BLVD 57 S A N T A A N A R V E R LINCOLN A VE FLETCHER ST GLASSELL ST BATAVIA ST R I V 9 ORANGE OLIVE RD E R D A L E A V E HEIM AVE MEATS AVE TAFT AVE S ANTIAG O BLVD 55 TAFT AVE S A NT A AN A CANYON RD L DR N O HL V R EA L L R A N CH R D VILLA PARK V I A ES 9 CO L A SE R RANO ANAHEIM HILLS AVE LEGEND City of Orange Water Area Roadway Sphere of Influence Adjacent Cities Railroad Freeway 8 Lane Divided 6 Lane Divided 4 Lane Divided 4 Lane Undivided Lane Undivided Smart Street Outside City Limits Miles MAIN ST VILLA PARK RD SANTIAGO CANYON RD 5 LEWIS ST METROPOLITAN DR GARDEN GROVE BLVD T H E C IT Y ORANGEWOOD ST BRISTOL ST DR A RT AVE RA M P FLOWER ST ECKHOFF ST STRUCK AVE DEVON RD ALMOND AVE LAWSON WY M E M O Y R L PARKER ST N LEMON ST SHAFFER ST GRAND ST LA VETA AVE KATELLA AVE COLLINS AVE WALNUT AVE PALM AVE PALMYRA AVE CAMBRIDGE ST SANTA ANA TUSTIN ST 55 S A N T WANDA RD HANDY ST ORANGE I A GO CRE EK CHAPMAN AVE BOND AVE SPRING ST ESPLANADE ST PROSPECT ST YORBA ST FAIRHAVEN AVE HEWES ST RANCHO SANTIAGO BLVD C A NNO N ST ORANGE PARK BLVD C A N Y O N TUSTIN A M V A N E W P O I E W T P OR L A A V E B L V D A V E J A M B R D R E E EAST ORANGE S T 6 4 E E T 4 D 5 Source File: Fig4-4-y0-Prop-Facility-0609.map
18
19 .0 INTRODUCTION The objective of the Circulation Element is to document existing transportation facilities in the Orange General Plan Planning Area, their condition, and impacts resulting from future land use identified in the City s General Plan. It describes the existing circulation system including arterial network and intersections, the public transit system, bicycle paths, recreation facilities, parking, railroad operations and includes a chapter on the future traffic conditions.. Analysis Area The analysis area for the City of Orange Circulation Study is illustrated in Figure.. The City is located in the central part of Orange County, California, bounded by the City of Anaheim on the north-westerly side, unincorporated county on the east, and the cities of Santa Ana and Tustin on the south. The City envelopes the City of Villa Park located in the north-east portion of the analysis area. Figure. Analysis Area \]^5 \]^5 &' 57 YORBA LINDA FULLERTON &' 9 BUENA PARK &' 9 ANAHEIM CYPRESS ANAHEIM VILLA PARK &' 4 \]^5 ORANGE E. ORANGE \]^405 SEAL BEACH GARDEN GROVE &' &' 55 TUSTIN HILLS &' 6 &' 4 SANTA ANA TUSTIN HUNTINGTON BEACH &' \]^405 IRVINE &' 4 &' 55 LAKE FOREST Pacific Ocean NEWPORT BEACH &' 7 LAGUNA WOODS \]^5 MISSION VIEJO L LEGEND Adjacent Cities County Line Water Area Roadway Orange Planning Area 0 Miles
20 .0 ELEMENTS OF THE CIRCULATION SYSTEM This chapter documents the existing circulation system in the City of Orange. The City s circulation network includes an extensive network of roadways, bus transit service, commuter rail and freight rail. This chapter also includes the City s current bikeway system, recreational trail system and parking facility inventory.. Freeways The City s roadway network can be broadly classified as a limited access freeway system and arterial system. The City s freeway and arterial system is shown in Figure.. Interstate and regional access to the City is provided predominantly by Interstate 5 (Santa Ana Freeway). In addition, connections to the City from northern Orange County, San Diego County, Los Angeles County, Riverside County, and San Bernardino County are provided by State Route 57 (Orange Freeway), State Route 55 (Costa Mesa Freeway) and State Route (Garden Grove Freeway). State Route 9 (Riverside Freeway) traverses just outside the northern edge of the City providing additional freeway access to the City. State Route 4 (Eastern Transportation Corridor) is a toll facility that directly serves the easternmost portion of the Planning Area and provides additional access to the City. Caltrans is responsible for maintenance and improvements to non-toll freeways while the Transportation Corridor Agency (TCA) is responsible for the Eastern Transportation Corridor toll facility. The Santa Ana Freeway (Interstate 5) is a northwest-southeast freeway traversing through the south-west corner of the City providing direct access to Los Angeles County to the north and San Diego County to the south. This facility is comprised of six general purpose lanes and one high-occupancy-vehicle (HOV) lane in each direction for its entire length of approximately two miles through the City. Interstate 5 (I-5) has two interchanges within the City limits - one located at its junction with State Route 57 (SR-57) and SR-, commonly known as the Orange Crush, and the other at State College Boulevard. The Orange Freeway (SR-57) is a north-south freeway originating at the junction of I-5 and SR- extending to San Dimas in Los Angeles County. It provides access for the most part to the central and northern parts of Orange County, and eastern parts of Los Angeles County. The facility has five general purpose lanes and one HOV lane in each direction. There are three interchanges along its length of approximately one and a half miles through the City. They are located at the junctions of I-5 and SR-, Chapman Avenue, and Orangewood Avenue. The Costa Mesa Freeway (SR-55) is a north-south freeway, passing through the center of the City providing access to the coastal communities of Orange County (i.e. Costa Mesa, Huntington Beach, and Newport Beach). The freeway is a ten-lane facility with four general purpose lanes and one HOV lane in each direction. It extends approximately four miles across the City with four interchanges. These interchanges are located at Lincoln Avenue, Katella Avenue, Chapman Avenue, and the SR- junction. The Garden Grove Freeway (SR-) is an east-west freeway that traverses through the southern portion of the City. The facility is currently being improved to include an HOV lane and additional general purpose lanes. Through the City of Orange, SR- will include three general purpose lanes and one HOV lane. It extends approximately four miles across the City with five interchanges. These interchanges are located at Tustin Street, Glassell Street, Main Street/La Veta Avenue, I-5/SR-57/Bristol Street, and The City Drive. The Riverside Freeway (SR-9) is an east-west freeway that traverses just north of the City. SR-9 provides access to key arterial facilities in Orange including interchanges at Tustin Street and Glassell Street. Additionally, SR-9 provides regional access through interchanges with SR-55 and SR-57 and the Eastern Transportation Corridor.
21 O Figure. - Existing Roadway Facility Types ANAHEIM STATE COLLEGE BLVD 57 S A N T A MAIN ST A N A R I V E R LINCOLN AVE FLETCHER ST GLASSELL ST BATAVIA ST R I V 9 E R ORANGE OLIVE RD D A L E MEATS AVE A V HEIM AVE TAFT AVE E S ANT IAGO BLVD 55 TAFT AVE S AN T A D R L AN A C ANYON RD N O H L V A R E A I L L R A NC H R D VILLA PARK V VILLA PARK RD I A E S C 9 O L A ANAHEIM HILLS S E R RANO AV E S ANTIAGO CANYON RD LEGEND City of Orange Water Area Roadway Sphere of Influence Adjacent Cities Railroad Freeway 8 Lane Divided 6 Lane Divided 4 Lane Divided 4 Lane Undivided Lane Undivided Smart Street Outside City Limits Miles 5 LEWIS ST M ETROPOLITAN DR GARDEN GROVE BLVD T H E C IT Y ORANGEWOOD AVE S T BRISTOL ST DR AR T R A M P FLOWER ST ECKHOFF ST STRUCK AVE DEVON RD M E 5 ALMOND AVE M LAWSON WY O Y R N L PARKER ST LEMON ST SHAFFER ST GRAND ST LA VETA AVE KATELLA AVE COLLINS AVE WALNUT AVE PALM AVE PALMYRA AVE CAMBRIDGE ST SANTA ANA TUSTIN ST 55 S A N T WANDA RD HANDY ST ORANGE I A G O CRE E K CHAPMAN AVE BOND AVE SPRING ST ESPLANADE ST PROSPECT ST YORBA ST FAIRHAVEN AVE HEWES ST RANCHO SANTIAGO BLVD CA NNO N S T C A TUSTIN ORANGE PARK BLVD A N Y O N M V I W N E A E P O W T P O R L A A V E B L V D A V E J A M B R D R E E EAST ORANGE Source File: Fig--y04-Exist-Facility-0609.map
22 The Eastern Transportation Corridor (SR-4) is a north-south toll facility on the eastern edge of the City. This facility provides direct access to the East Orange Planning Area. SR-4 has three toll lanes in each direction and provides regional access through an interchange at Santiago Canyon Road.. Arterials The arterials on the western side of SR-55 generally follow north-south and east-west orientation. On the eastern side of the freeway, the arterials are characterized by curvilinear streets due to undulating geographical surroundings. Key existing north-south arterials include Tustin Street, Glassell Street, Main Street, and The City Drive while the east-west arterials include Lincoln Avenue, Taft Avenue, Katella Avenue, Chapman Avenue, and parts of La Veta Avenue. Table. lists the existing roadway facility types in the City, along with their description and classification as specified in the Orange County Master Plan of Arterial Highways (MPAH). The MPAH generally defines a divided roadway as a facility that contains a physical barrier or a buffer between each direction of travel such as a raised median or a median that contains a continuous two-way left turn lane. A divided roadway removes vehicles making a left turn from the travel lanes so as not to impede through traffic and constrict roadway capacity. Undivided arterials refer to roadways that do not contain a sufficient buffer between each direction of travel, therefore traffic making a left turn will impede through traffic. Undivided arterials may provide turn movement pockets at intersections. Table. Roadway Facility Types Facility Type MPAH Classification Characteristics 8-Lane Divided Principal Primarily serves through traffic with limited local access 6-Lane Divided Major Serves mostly through traffic with some local access allowed 4-Lane Divided Primary Serves through and local traffic 4-Lane Undivided Secondary Serves mostly local traffic -Lane Divided/ Undivided Smart Street Source: Orange County Transportation Authority Minor Arterial/Collector/Commuter/Local/Residential Smart Street Serves local traffic 4-8 lane divided, with possible signal coordination, intersection capacity improvements and/or grade separation The description of each class is briefly described below with a daily capacity that represents the Level of Service (LOS) E capacity. While The City of Orange daily arterial LOS standard is D, the LOS E threshold is most commonly used to represent the maximum capacity available on a facility before traffic operations severely break down. Principal Arterials are 8-lane divided roadways that accommodate up to 75,000 vehicles on an average weekday. They connect directly to freeways and do not allow for on-street, curbside parking. Major Arterials are 6-lane divided roadways that accommodate up to 56,00 vehicles on an average weekday. They facilitate traffic circulation, and similar to principal arterials do not allow for on-street, curbside parking. Primary Arterials are 4-lane divided roadways that accommodate up to 7,500 vehicles on an average weekday. They provide for easy circulation and allow for limited on-street, curbside parking. Secondary Arterials are 4-lane undivided roadways that accommodate up to 4,000 vehicles on an average weekday and allow for on-street parking. 4
23 Minor Arterials, collectors, commuters, local and residential facilities are -lane divided or undivided roadways that accommodate up to,000 vehicles per average weekday. Similar to the Secondary arterials, these facilities generally allow for on-street parking. Several types of -lane facilities currently exist within the City and may serve slightly different purposes. Generally, they collect and distribute traffic to higher-capacity arterials. Minor Arterials and collectors/commuters may provide through access while serving abutting land uses. They distribute traffic from the localized system onto the citywide circulation system and typically accommodate between,000,000 vehicles per average weekday. Local facilities generally serve the immediately surrounding land uses and can accommodate up to 6,000 vehicles per average weekday. Residential facilities are the lowest classification of -lane facility and serve as access to abutting residential uses. Residential facilities serve up to,000 vehicles per average weekday. Each serve slightly different purposes and may have different capacity thresholds based on various factors. The City of Orange Standard Plans and Specifications (January 007) specifies plans for various types of lane facilities. Although there has been discussion regarding potential sub-categorization of -lane facilities, such differentiation of specific characteristics of -lane facilities is not necessary at this time. Facility specifications are determined on several factors on a case-by-case basis and include traffic volumes, adjacent land uses, etc. Since sub-categorization of -lane facilities would only be required if policy level decisions are based on facility classifications and decisions including right-of-way widths and traffic calming measures are evaluated on a case-by-case basis dependent upon several factors, the subcategories of -lane facilities is not necessary. In 00 (subsequently updated in February 006), the City of Orange adopted the Residential Neighborhood Traffic Management Program which identified specific criteria for establishing potential traffic management/calming strategies. The program specifies candidate facilities must be no more than one lane in each direction, which encompasses all Minor Arterials, and additional requirements including maximum width, daily volumes, accident rates and 85 th percentile speeds. Since the requirements are not specific to a particular characteristic of Minor Arterials it is not recommended that sub-categories be defined for -lane facilities. Smart Streets are 4- to 8-lane divided arterials with improved features such as synchronized traffic signals, bus bays, consolidated driveways, etc. Consistent with the Orange County Transportation Analysis Model (OCTAM.), Smart Street speeds and capacities are assumed to be five percent greater than those assumed for Principal or Major facilities. Figure. reflecting the existing arterial classifications, shows that a portion of The City Drive is categorized as a principal arterial which provides direct access to I-5 in the north and SR- in the south. Main Street, Tustin Street and Chapman Avenue (east of Tustin Street) are all designated as major arterials. Primary arterials include Glassell Street, La Veta Avenue, Taft Avenue, and Chapman Avenue (west of Tustin Street). Katella Avenue is designated as a 6-lane smart street.. Public Transportation Public transportation in the City is primarily provided by Orange County Transportation Authority (OCTA). A total of 8 OCTA bus routes serve various activity centers located throughout the City. In addition, the Riverside Transit Authority (RTA) provides long-distance express commuter service between The Village at Orange and the Downtown Terminal in Riverside. Table. lists the bus routes that serve the City. Table. Existing Bus Routes Route # Route Type Route Service Service Corridors Key Orange Activity Centers Served 4 Local Fullerton - Orange Malvern Ave. / The Village at Orange Chapman Ave. / Lincoln Park and Ride Tustin St. 4 Local Orange - Seal Beach Lincoln Ave. / The Village at Orange Los Alamitos Blvd. / Lincoln Park and Ride Seal Beach Blvd. 5
24 Table. Existing Bus Routes (Continued) Route # Route Type Route Service Service Corridors Key Orange Activity Centers Served 46 Local Los Alamitos - Orange Ball Rd. / The Village at Orange Taft Ave. Lincoln Park and Ride 47 Local Brea - Newport Beach Brea Blvd. / Theo Lacy Jail Anaheim Blvd. / Orangewood Children's Home Fairview St. UCI Medical Center The Block at Orange 50 Local Long Beach - Orange Katella Ave. The Village at Orange Lincoln Park and Ride 5 Local Brea - Irvine Main St. Batavia Industrial Parks Children's Hospital - CHOC St. Joseph's Hospital OCTA Offices 54 Local Garden Grove - Orange Chapman Ave. Orange Civic Center Orange Transportation Center The Plaza UCI Medical Center The Block at Orange 56 Local Garden Grove - Orange Garden Grove Blvd. Orange Transportation Center OCTA Offices Children's Hospital - CHOC St. Joseph's Hospital 57 Local Brea - Newport Beach State College Blvd. / The Block at Orange Bristol St. UCI Medical Center Theo Lacy Jail Orangewood Children's Home 59 Local Brea - Irvine Kraemer Blvd. / Orange Transportation Center Glassell St. / Chapman University Grand Ave. / Orange Plaza Von Karman Ave. 7 Local Yorba Linda - Balboa Tustin St. / The Village at Orange Red Hill Ave. / Lincoln Park and Ride Newport Blvd. Community Yorba Linda - Orange Lakeview Ave. / The Village at Orange Riverdale Ave. / Lincoln Park and Ride Tustin St. 47 Community Brea - Santa Ana Raiit St. / UCI Medical Center Greenville St. / The Block at Orange Fairview St. OCTA Offices St. Joseph's Hospital Children's Hospital - CHOC 67 Community Anaheim - Irvine Santiago Blvd. / The Village at Orange Hewes St. / Lincoln Park and Ride Bryan Ave. Intra County Brea - Irvine Express SR-55 Lincoln Park and Ride The Village at Orange 45 Station Link Orange Transportation Center Chapman Ave. / Orange Transportation Center -St. Joseph's Hospital Main St. / Children's Hospital - CHOC La Veta Ave. St. Joseph's Hospital OCTA Offices 454 Station Link Orange Transportation Center Chapman Ave. / Orange Transportation Center -The Block at Orange Metropolitan Dr. UCI Medical Center The Block at Orange Bergen Brunswig Nexus 757 Inter County Diamond Bar SR-57 UCI Medical Center - Santa Ana Express The Block at Orange RTA 49 Inter County Riverside Downtown Terminal SR-9 The Village at Orange - The Village at Orange Source: Orange County Transportation Authority, Riverside Transit Agency Figure. illustrates the existing bus routes within the City as well as peripheral routes outside the City of Orange limits. 6
25 V D Figure. - Existing Public Transportation To West Orange County & Fullerton Transportation Center ANAHEIM STATE COLLEGE BLVD 57 S A N T A A MAIN ST N A R BATAVIA ST I V L E R INCOLN AVE FLETCHER ST GLASSEL ST I V R 9 9 ORANGE OLIVE RD E R D A MEATS AVE To Brea Mall L E A V E HEIM AVE The Village at Orange TAFT AVE SAN T I AGO 55 BLVD TAFT AVE S A N T 4,4,46,50,7,,49 (RTA), 67,,A NO D R A HL L R E A A N A I L L A RA C A N Y O N NCH RD R D V VILLA PARK VILLA PARK RD I A E S C O L A M E S A D R S E R R ANAHEIM HILLS ANO To Riverside AVE S A N I T A G O C A N Y O N LEGEND City of Orange Water Area Roadway Bus Routes Adjacent Cities Sphere of Influence Railroad Miles To Disneyland 5 LEWIS ST The Block At Orange METROPOL ITAN 47,54,57,47, 454,757 THE CITY DR DR GARDEN GROVE BLVD To South Coast Metro Angel Stadium ORANGE WOOD AVE UCI Medical Center S T BRISTOL ST A R T R A M P ECKHOFF ST 5,56,47,45 To Santa Ana Civic Center STRUCK AVE Main Place Mall 5 CHOC & St.Joseph Hospital M PALM AVE ALMOND AVE LAWSON WY E M O R Y PARKER ST L N LEMON ST Orange Transportation Center GRAND ST SHAFFER ST LA VETA AVE KATELLA AVE COLLINS AVE WALNUT AVE 54,56,59, 45,454 PALMYRA AVE CAMBRIDGE ST SANTA ANA TUSTIN ST 55 S A N HANDY ST I T YORBA ST ORANGE A G O To South Coast Metro WANDA RD C R E E K CHAPMAN AVE PROSPECT ST BOND AVE SPRING ST FAIRHAVEN AVE ESPLANADE ST HEWES ST RANCHO SANTIAGO BLVD CANNON S T C A N Y O N TUSTIN A M V I E A P O L W A A V E N E W P O R T A V B D L V E R J A M B O R E E R D EAST ORANGE Source File: Fig--y04-Exist-PubTransit map
26 OCTA operates several fixed bus routes that directly serve the City. Fixed routes offered by OCTA include local bus routes, express bus routes and station link shuttles. Local bus routes provide shuttle service to various cities of Orange County, while express bus routes provide faster connections to places both within and outside the County of Orange. Station link shuttles offer service between the Orange Transportation Center and The Block at Orange, a major shopping and entertainment hub in the City, St. Joseph s Hospital and Mainplace Mall. Express bus and station link routes only operate during peak commuter periods. There are local routes serving the City. Of these routes, routes # 4, 5, 57 and 59 have route variations, thereby offering additional transit flexibility. There are two OCTA express routes serving the City one intra-county, connecting the City of Orange with the City of Irvine, and one inter-county, providing connection with the City of Diamond Bar. A Riverside Transit Agency express route connects Riverside with the Village at Orange. OCTA also offers specialized community transportation services, such as standard service (curb-to-curb service), door-to-door service, subscription service, and same-day taxi service. Some of these services cater to senior citizens and people with disabilities residing in the City..4 Railroad Operations The railroad operations in the City are categorized into three types: commuter rail, passenger rail, and freight rail. Metrolink, the commuter rail service for the City of Orange is provided by the Southern California Regional Rail Authority (SCRRA) and OCTA. The passenger rail service is offered by AMTRAK while the freight rail is provided by Union Pacific Railroad and Burlington Northern Santa Fe (BNSF). Figure. shows the rail routes traversing the City. Metrolink operates two commuter rail lines which connect the City, via the Orange Transportation Center, to other important destinations in the region. The two lines are The Orange County Line and Inland Empire-Orange County Line. The Orange County Line offers direct connections to Los Angeles Union Station to the north and Oceanside to the south. The existing number of weekday trips on the Orange County Line is as follows: Orange to Union Station (Northbound) Ten Union Station to Orange (Southbound) Nine Orange to Oceanside (Southbound) Six Oceanside to Orange (Northbound) Six The Inland Empire-Orange County Line offers direct connections to Riverside /San Bernardino to the east and Oceanside to the south. The existing number of weekday trips on this line is as follows: Orange to Riverside/San Bernardino (Eastbound) Six Riverside/San Bernardino to Orange (Westbound) Six Orange to Oceanside (Southbound) Six Oceanside to Orange (Northbound) Six AMTRAK operates the Pacific Surfliner passenger rail between San Diego and Paso Robles which also connects several coastline communities along its route. It makes one stop daily at the Orange Transportation Center with the southbound train departing Los Angeles Union Station at :00 P.M. OCTA has continued to lobby for additional access for rail service within Orange County and while Amtrak does not recognize the Orange Transportation Center as a stop, agreed to the stop to serve southbound users during the mid-day. Union Pacific Railroad and BNSF operate freight rail services through the City of Orange. The services offered include transporting containers, trailers, and chemical/oil tankers. The major inter-modal cargo loading facilities are located in ports of San Diego, Long Beach, and Los Angeles. 8
27 H D T I R Figure. - Existing Railroad ANAHEIM R R I V 9 E R D A L E A V E S ANT A AN A CANYON RD 9 LEGEND City of Orange Water Area Roadway Adjacent Cities Sphere of Influence Railroad STATE COLLEGE BLVD 57 A S N T A A N MAIN ST A R BATAVIA ST I V E LINCOLN AVE FLETCHER ST TAFT AVE GLASSELL ST ORANGE OLIVE RD HEIM AVE MEATS AVE To Riverside & San Bernardino S A N T I A GO BL V D TAFT AVE 55 R D NO H L A L V L L A R E R A NCH RD VILLA PARK VILLA PARK RD V I A S E L C O A M E S A D R S ER R A N O ANAHEIM HILLS A V E S A N T I A G O C A N Y O N Miles KATELLA AVE 5 LEWIS ST METRO POLITAN D R T E C ITY GARDEN GROVE BLVD ORANGEWOOD AVE R T S BRISTOL ST R R A M P A FLOWER ST ECKHOFF ST STRUCK AVE To Oceanside & San Diego 5 To Los Angeles M ALMOND AVE E M LAWSON WY O R Y L N PARKER ST LEMON ST GRAND ST SHAFFER ST LA VETA AVE CAMBRIDGE ST COLLINS AVE WALNUT AVE PALM AVE PALMYRA AVE SANTA ANA TUSTIN ST S I A G O A N T WANDA RD HANDY ST ORANGE C E E R CHAPMAN AVE ESPLANADE ST PROSPECT ST YORBA ST FAIRHAVEN AVE 55 K BOND AVE SPRING ST HEWES ST RANCHO SANTIAGO BLVD C A N N O N S T C A ORANGE PARK BLVD NY ON TUSTIN A V I M E A W P A A V L O E A V E NE W PORT BLVD D J A M B O R D R E E 6 EAST ORANGE 4 4 Source File: Fig--y04-Exist-Railroad map
28 .5 Bikeway System The City of Orange Bikeways Master Plan identifies miles of bikeways within the City. Bikeways are used by a wide variety of people for many purposes including children on their way to school, commuters riding to work, exercise, recreation, etc. A bikeway system is an integral part to the overall circulation system even though it may carry a relatively small part of trip activity. A comprehensive bikeway system provides enhances quality of life through additional connectivity and mobility contributing to a balanced transportation system. A safe bikeway system encourages use for commuting and recreational purposes. The Orange Bikeways Master Plan classifies bikeways into three types: Class I Bike Path Provides for bicycle travel on a right-of-way completely separated from the street Class II Bike Lane Provides a striped lane for one-way travel within the street Class III Bike Routes Provides routes which are signed but not striped The development of the Orange Bikeways Master Plan included the evaluation of the OCTA Commuter Bikeways Strategic Plan (CBSP) and incorporation of information where appropriate to ensure consistency. In 00, OCTA adopted the Commuter Bikeways Strategic Plan an prioritization of proposed bikeways was based on input from cities and the County, gap closure in the existing network and connectivity to other transportation modes. Multi-modal connections exist at all park and ride facilities. Bicycle racks and lockers are available at various locations throughout the City including multimodal connections, community facilities, hospitals and community parks. Figure.4 illustrates the existing system of bikeways in the City which includes 0.6 miles of Class I bike paths, 0.8 miles of Class II bike lanes, and. miles of Class III bike routes. The City recognizes the need for the City of Orange Bikeway Master Plan consistency with the CBSP since OCTA is the main funding conduit for bikeway funds for the City of Orange. In addition, the California Bicycle Transportation Act of 994 suggest all cities and counties adopt a bicycle master plan with specific elements such as land use, population density, existing and proposed bikeways, parking facilities, multi-modal connections, etc..6 Recreation Trails The City of Orange currently provides over 5 miles of recreation trails connecting a large number of neighborhood and community parks. The City has developed a Recreation Trail Master Plan, which presents an in depth analysis of existing and proposed trails; and recreation facilities. The Master Plan serves as a guide to the City in implementing a diverse trail system and enhancing the recreational opportunities for the community. Trail segments are designated as Type-A trails and Type-B trails. The Type-A trails are designated for use by equestrians, trail bicyclists and hikers, while Type-B trails are meant for use by trail bicyclists and hikers only. Similar to bikeways, recreational trails are a component of a balanced transportation system. The County of Orange has developed Master Plan of Regional Riding and Hiking Trails as well as developing a Recreation Element to their General Plan. The County notes that close collaboration with cities is essential in maximizing recreational uses throughout the County. The Santa Ana River trail and Santiago Oaks trails and recreational amenities are among those specified in the County s Regional Riding and Hiking Trails plan and the Master Plan of Regional Recreation Facilities and both interface directly with the City of Orange..7 Parking Parking availability can impact circulation system activity. Parking impacts arterial capacity, access to local businesses, access to multi-modal transportation centers. While building code requirements dictate the amount of parking for development projects, parking policies are often required to manage supply and 0
29 demand for key destinations such as the Orange Plaza. The Orange Transportation Center, a key component of Downtown Orange, must provide adequate parking to meet commuter parking supply needs, otherwise users may be discouraged from taking alternative modes of transportation. Currently, according to OCTA analysis, excess parking supply exists to meet daily commuter needs at the Orange Transportation Center. The current General Plan includes a goal to consider the parking needs of the community in all land use planning efforts. In support of this goal, it is noted that off-street public parking should specifically be provided in the Old Town eight block Downtown Core. Figure.5 shows the location of existing public parking lots in Downtown Orange. Some parking lots such as the Metrolink station parking located off Chapman Avenue have no time limit. The remaining parking lots have a maximum time limit of three hours with or without permit. Public lots with wheel stops that are painted yellow allow for unlimited parking for vehicles with a City parking permit..8 Truck Routes Figure.6 presents truck routes approved by the City. The routes predominantly traverse the general industrial area located in the western part of the City, as indicated in the figure as well as the higher capacity facilities that traverse the City. Truck routes are identified for purposes including safety, roadway maintenance and traffic operations, among others. The Orange Municipal Code identifies trucks as motor vehicles designed, used or maintained primarily for the transportation of property having an unladen weight of six thousand pounds or more. The truck routes include the following major arterials: Tustin Street Katella Avenue Chapman Avenue The City Drive Main Street (north of Collins Avenue and south of Chapman Avenue) Glassell Street (north of Collins Avenue) Batavia Street (between Chapman Avenue and Lincoln Avenue) Orangewood Avenue (west of Eckhoff Street) Eckhoff Street (north of Orangewood Avenue) Lincoln Avenue (west of Santiago Boulevard) Jamboree Road La Veta Avenue Town & Country Road Chapman Avenue is a limited truck route between Batavia Street and Tustin Street. Between these extents on Chapman Avenue, vehicles over twenty-six thousand pounds gross weight are prohibited..9 Emergency Response Routes All City of Orange arterials are recognized as primary emergency response routes. In addition, nonarterials can be secondary emergency response routes. The Residential Neighborhood Traffic Management Program (February 006), which identifies a tool box of traffic management and traffic calming measures, notes that emergency vehicle access should be accommodated consistent with response standards with implementation of appropriate traffic management measures. Additionally, if current emergency vehicle access does not meet existing response standards, traffic calming efforts should not further degrade the response time.
30 T H E M V A Figure.4 - Existing Bikeways ANAHEIM STATE COLLEGE BLVD L I N C O L N A V E 57 S A N T A A N A R I V E R FLETCHER ST GLASSELL ST BATAVIA ST 9 RIVERDA ORANGE OLIVE RD MEATS AVE LE AV HEIM AVE E S AN TIAGO BL V D S A N T A R D A L R E ANA N O H L I L L CANYON RD RA NCH RD V I A 9 E S C O L A M E S A DR ANAHEIM HILLS SE R RANO AVE LEGEND City of Orange Water Area Roadway Sphere of Influence Adjacent Cities Railroad Class I Class II Class III Adjacent Jurisdiction Miles TAFT AVE 55 VILLA PARK SANTIAGO TAFT AVE MAIN ST VILLA PARK RD CANYON RD 5 LEWIS ST M E T R O P O L I T GARDEN GROVE BLVD A N D R C I T ORANGEWOOD AVE Y D R S T T R BRISTOL ST R A A P FLOWER ST STRUCK AVE DEVON RD ECKHOFF ST M E M O R Y 5 ALMOND AVE L N PARKER ST LAWSON WY LEMON ST SHAFFER ST GRAND ST LA VETA AVE KATELLA AVE COLLINS AVE WALNUT AVE PALM AVE PALMYRA AVE CAMBRIDGE ST SANTA ANA TUSTIN ST 55 WANDA RD HANDY ST S A N T CHAPMAN AVE YORBA ST ORANGE I A G O C R EE K BOND AVE SPRING ST ESPLANADE ST PROSPECT ST FAIRHAVEN AVE HEWES ST RANCHO SANTIAGO BLVD CA NNO N ST C A TUSTIN ORANGE PARK BLVD NY O A N M V N E A P O I E W B L T W POR L A A V D V A V E E J A M B O R E E R D 6 EAST ORANGE 4 4 Source File: Fig-4-Exist-Bikeways map

31 Figure.5 Existing Public Parking Lots LIBRARY Public Parking Time Limit* w/o Permit Public Parking - No Time Limit Source: City of Orange *Note: Possession of City issued parking permit enables holder to exceed specified time limit
32 N D D R M A N O Figure.6 - Existing Truck Routes ANAHEIM STATE COLLEGE BLVD 57 S A T A N A N A R I V BATAVIA ST E R LINCOLN AVE FLETCHER ST R GLASSEL ST V I 9 E R D A L ORANGE OLIVE RD E A V E HEIM AVE MEATS AVE TAFT AVE SANT IAGO BLVD S A N T A R D TAFT AVE 55 A N A A L N O E C A N Y O N H L V I L L R R R D A N C H R D VILLA PARK V I A 9 E S C O L A M ES A D R S A N T I ANAHEIM HILLS A G S O E R R R C A N E E K S O A N A T V I E A G O LEGEND City of Orange Water Area Roadway Adjacent Cities Sphere of Influence Existing Truck Routes Limited Truck Routes Railroad Miles 5 LEWIS ST METROPOLITAN DR GARDEN GROVE BLVD T HE C ITY ORANGEWOOD R S T T BRISTOL ST R A A P AVE FLOWER ST ECKHOFF ST STRUCK AVE DEVON RD 5 MAIN ST ALMOND AVE M E LAWSON WY M O R Y PARKER ST L N LEMON ST SHAFFER ST GRAND ST LA VETA AVE CAMBRIDGE ST KATELLA AVE COLLINS AVE WALNUT AVE PALM AVE PALMYRA AVE SANTA ANA TUSTIN ST 55 WANDA RD HANDY ST ORANGE VILLA PARK RD BOND AVE SPRING ST CHAPMAN AVE ESPLANADE ST PROSPECT ST YORBA ST FAIRHAVEN AVE HEWES ST RANCHO SATIAGO BLVD C A N O N S T TUSTIN ORANGE PARK BLVD C A N O N A M A P O L A V I E W A V A V E E B L V N E W P O R T D C A N Y O R J A M B R D R E E 6 EAST ORANGE 4 4 Source File: Fig-6-y04-Exist-TruckRte map
33 .0 EXISTING TRAFFIC CONDITIONS This chapter presents an analysis of existing traffic conditions based on the existing arterial segment counts and peak hour (A.M. and P.M.) intersection turning movement volumes on selected City intersections. Level of Service (LOS) analysis is performed both on arterial segment volumes and intersection turning movements. Existing conditions are defined to evaluate future impacts of development on the transportation infrastructure. The chapter also includes a brief description of the LOS definitions and the assumptions made for intersection capacity utilization (ICU) calculations.. LOS Definitions Level of service is a qualitative measure that characterizes traffic congestion on a scale of A to F with LOS A representing free-flow condition and LOS F representing extreme congestion. It represents the ability of a roadway or an intersection to accommodate traffic. The LOS definition is based on a volume to capacity (V/C) ratio and provides a more quantitative description of traffic conditions. Table. presents levels of service based on traffic volumes and the design capacity of roadways or intersections. LOS D has been adopted by the City as the acceptable level of service threshold for the roadway network which includes arterial segments and intersections. The policy standard of LOS D will be maintained as the goal for acceptable circulation system performance throughout the City. Although roadway capacity is generally a function of peak hour intersection performance and the corresponding peak hour volumes, daily arterial segment capacities provide a measure of the overall LOS of the arterial system. Generally, traffic impact mitigation focuses on peak hour intersection performance since system performance, as noted, is typically a function of intersection throughput. Although mitigation generally focuses on intersections, the existing General Plan specifies the analysis of arterials through the daily V/C ratio methodology, therefore the arterial analysis as well as intersection analysis is performed throughout the City under existing and future conditions. Table. presents the adopted City thresholds for LOS D and LOS E arterial daily capacity. Table. Table. Level of Service Definitions V/C Ratio Level of Service A B C D E >.00 F Arterial Daily Capacity Threshold Assumptions Daily Capacity Facility Type LOS D LOS E Principal 8-lane divided 67,500 75,000 Major 6-lane divided 50,700 56,00 Primary 4-lane divided,750 7,500 Secondary 4- lane undivided,600 4,000 Commuter -lane undivided 0,800,000 Source: City of Orange General Plan Circulation Element Technical Report, 989. ICU Analysis ICU is a methodology to quantify LOS for intersections. The methodology calculates the ratio of the sum of the critical turning movement volumes to saturated flow rates. The ICU output is analogous to the intersection s V/C ratio and ranges presented in Table.. 5
34 The following assumptions, consistent with the countywide Congestion Management Program (CMP) assumptions, were incorporated into the ICU computations:,700 vehicles per hour of green time in through lanes,700 vehicles per hour of green time in turn lanes 5 percent of total intersection capacity lost due to the clearance interval. Existing Daily Conditions As part of the existing condition analysis, 4-hour traffic counts were collected throughout the City. Vehicle counts at these locations are reported in Table. with corresponding daily V/C ratio and LOS. Figure. presents the existing average daily traffic (ADT). Table. indicates that most of the traffic flow within the City is in an east-west direction. The most heavily traveled east-west arterials include Chapman Avenue, Katella Avenue and Taft Avenue. Northsouth arterials such as Tustin Street, Main Street and The City Drive also exhibit some of the highest traffic volumes. Figure. presents the existing arterial level of service. Table. Existing Arterial Daily Level of Service ID Arterial From To Lanes ADT LOS E Capacity V/C Ratio LOS Almond Avenue Main Street Batavia Street U 5,00, A Almond Avenue Batavia Street Glassell Street U 5,000, A Almond Avenue Glassell Street Grand Street U 5,600, A 4 Almond Avenue Grand Street Cambridge Street U,00, A 5 Batavia Street La Veta Avenue Almond Avenue U 7,600, B 6 Batavia Street Almond Avenue Chapman Avenue U 9,800, D 7 Batavia Street Chapman Avenue Walnut Avenue 4U,400 4,000 6 A 8 Batavia Street Walnut Avenue Collins Avenue 4U,500 4,000 A 9 Batavia Street Collins Avenue Katella Avenue 4U,900 4,000 4 A 0 Batavia Street Katella Avenue Taft Avenue 4U,000 4,000 0 A Batavia Street Taft Avenue Fletcher Avenue 4U,00 4,000 A Batavia Street Fletcher Avenue Lincoln Avenue 4U,600 4,000 7 A Bond Avenue Prospect Street Hewes Street 4U 6,400 4, A 4 Cambridge Street South City Limits Palmyra Avenue U 7,000,000 8 A 5 Cambridge Street Palmyra Avenue Chapman Avenue U 7,800, B 6 Cambridge Street Chapman Avenue Palm Avenue U 7,600, B 7 Cambridge Street Palm Avenue Walnut Avenue U 7,000,000 8 A 8 Cambridge Street Walnut Avenue Collins Avenue U 7,00, B 9 Cambridge Street Collins Avenue Katella Avenue U 7,600, B 0 Cambridge Street Katella Avenue Taft Avenue 4U,000 4, A Cambridge Street Taft Avenue Meats Avenue 4U 7,00 4, A Canyon View Avenue Chapman Avenue Outrider Street 4D 5,800 7, A Canyon View Avenue Outrider Street Newport Boulevard 4D 5,600 7, A 4 Canyon View Avenue Newport Boulevard Jamboree Road 4D 5,00 7,500 A 5 Chapman Avenue Haster Street Lewis Street 5D 9,600 46, B 6 Chapman Avenue Lewis Street Manchester Avenue 6D 4,500 56, B 7 Chapman Avenue Manchester Avenue The City Drive 6D 7,00 56, B 8 Chapman Avenue The City Drive Eckhoff Street 6D,000 56,00 9 A 9 Chapman Avenue Eckhoff Street Main Street 6D 8,600 56,00 A 0 Chapman Avenue Main Street Batavia Street 4D,600 7,500 8 A Deficient Segment, LOS E Deficient Segment, LOS F 6
35 Table. Existing Arterial Daily Level of Service (Continued) ID Arterial From To Lanes ADT LOS E Capacity V/C Ratio LOS Chapman Avenue Batavia Street Plaza / Glassell 4D 8,800 7,500 0 A Chapman Avenue Plaza / Glassell Cambridge Street 4D,000 7, B Chapman Avenue Cambridge Street Tustin Street 4D 7,00 7, C 4 Chapman Avenue Tustin Street SR-55 6D 44,500 56, C 5 Chapman Avenue SR-55 Yorba Street 8D 6,700 75, D 6 Chapman Avenue Yorba Street Prospect Street 6D 5,500 56, E 7 Chapman Avenue Prospect Street Esplanade Street 6D 4,600 56, C 8 Chapman Avenue Esplanade Street Hewes Street 6D 9,00 56, B 9 Chapman Avenue Hewes Street Crawford Canyon Road 6D 4,600 56, B 40 Chapman Avenue Crawford Canyon Road Canyon View Avenue 4D 6,900 7, C 4 Chapman Avenue Canyon View Avenue Orange Park Boulevard 4D 8,000 7, A 4 Chapman Avenue Orange Park Boulevard Newport Boulevard 4D 6,000 7, A 4 Chapman Avenue Newport Boulevard Jamboree Road 6D 5,00 56, A 44 Chapman Avenue Jamboree Road City Limit 4U 6,00 4, B 45 Collins Avenue Eckhoff Street Main Street 4U 7,400 4, A 46 Collins Avenue Main Street Batavia Street 4U,00 4, A 47 Collins Avenue Batavia Street Glassell Street 4U 5,600 4, B 48 Collins Avenue Glassell Street Cambridge Street 4U 5,00 4, B 49 Collins Avenue Cambridge Street Tustin Street 4U 4,800 4, B 50 Collins Avenue Tustin Street Handy Street 4U,000 4,000 4 A 5 Collins Avenue Handy Street Wanda Road 4U,00 4,000 5 A 5 Collins Avenue Wanda Road Prospect Street 4U 6,00 4, B 5 Crawford Canyon Road Barrett Avenue Chapman Avenue U 8,600, C 54 Cannon Street Chapman Avenue Creekside Avenue 4U 8,500 4,000 A 55 Cannon Street Creekside Avenue Patria Court 4U 4,700 4, A 56 Cannon Street Patria Court Santiago Canyon Road 4U 4,00 4, A 57 Cannon Street Santiago Canyon Road Taft Avenue 4D,00 7,500 9 A 58 Cannon Street Taft Avenue Via Escola 4D 9,500 7,500 A 59 Eckhoff Street Chapman Avenue Sycamore Avenue U 4,00, A 60 Eckhoff Street Orangewood Avenue Collins Avenue U 0,000, D 6 Esplanade Street Fairhaven Avenue La Veta Avenue 4U,000 4, A 6 Esplanade Street La Veta Avenue Chapman Avenue 4U 6,400 4, A 6 Fairhaven Avenue Glassell Street Cambridge Street 4U 9,00 4, A 64 Fairhaven Avenue Cambridge Street Tustin Street 4U 9,500 4, A 65 Fairhaven Avenue Tustin Street Yorba Street 4U 4,00 4,000 9 A 66 Fairhaven Avenue Yorba Street Prospect Street 4U,400 4,000 6 A 67 Fairhaven Avenue Prospect Street Esplanade Street 4U,00 4,000 A 68 Fairhaven Avenue Esplanade Street Hewes Street 4U 0,900 4, A 69 Fletcher Avenue Batavia Street Glassell Street U 4,00, A 70 Garden Grove Boulevard The City Drive Lewis Street 4D,700 7,500 8 A 7 Glassell Street SR- La Veta Avenue 4D 0,400 7, D 7 Glassell Street La Veta Avenue Almond Avenue U 6,000,000. F 74 Glassell Street Chapman Avenue Palm Avenue U,000, F 75 Glassell Street Walnut Avenue Collins Avenue U,00, E 76 Glassell Street Collins Avenue Katella Avenue 4D 7,500 7, A 77 Glassell Street Katella Avenue Orange Olive Road 4D,600 7, B 78 Glassell Street Orange Olive Road Grove Avenue 4D,700 7, A 79 Glassell Street Grove Avenue Lincoln Avenue 4D 9,700 7,500 A Deficient Segment, LOS E Deficient Segment, LOS F 7
36 Table. Existing Arterial Daily Level of Service (Continued) ID Arterial From To Lanes ADT LOS E Capacity V/C Ratio LOS 80 Glassell Street Lincoln Avenue Santa Ana River 4D,800 7,500 8 A 8 Grand Street Chapman Avenue Maple Avenue U 4,00, A 8 Hewes Street Fairhaven Avenue Washington Avenue 4U 6,00 4, A 8 Hewes Street Washington Avenue Chapman Avenue 4U 9,600 4, A 84 Hewes Street Chapman Avenue Walnut Avenue 4U 9,500 4, A 85 Hewes Street Bond Avenue Santiago Canyon Road 4U 8,500 4,000 A 86 Jamboree Road Santiago Canyon Road Chapman Avenue 6D 7,00 56,00 0. A 87 Jamboree Road Chapman Avenue Canyon View Avenue 6D 4,600 56, A 88 Jamboree Road Canyon View Avenue South City Limit 6D 7,600 56,00 0. A 89 Katella Avenue Struck Avenue Main Street 6D 6,000 59,5 0.6 B 90 Katella Avenue Main Street Batavia Street 6D 9,900 59,5 A 9 Katella Avenue Batavia Street Glassell Street 6D,500 59,5 7 A 9 Katella Avenue Glassell Street Cambridge Street 6D 4,600 59,5 9 A 9 Katella Avenue Cambridge Street Tustin Street 6D 8,000 59, B 94 Katella Avenue Tustin Street SR-55 7D 48,400 68, C 95 Katella Avenue SR-55 Handy Street 5D 6,800 46, C 96 Katella Avenue Handy Street Wanda Road 4D,600 7, D 97 Katella Avenue Wanda Road Center Drive 4D,00 7, B 98 Katella Avenue Center Drive Santiago Canyon Road 4D 0,800 7,500 5 A 99 La Veta Avenue Flower Street Devon Street 4D 7,600 7, A 00 La Veta Avenue Devon Street Main Street 4D 7,600 7, A 0 La Veta Avenue Main Street Batavia Street 6D 5,00 56, A 0 La Veta Avenue Batavia Street Glassell Street 4U 5,400 4, B 0 La Veta Avenue Glassell Street Shaffer Street U 8,700, C 04 La Veta Avenue Shaffer Street Cambridge Street U 6,00,000 A 05 La Veta Avenue Tustin Street Yorba Street 4U 8,800 4, A 06 La Veta Avenue Yorba Street Prospect Street 4U 0,00 4, A 07 La Veta Avenue Prospect Street Esplanade Street 4U 6,900, A 08 Lemon Street Chapman Avenue Maple Avenue U 5,600, A 09 Lewis Street Garden Grove Avenue Metropolitan Drive 4U,600 4,000 A 0 Lewis Street Metropolitan Drive Chapman Avenue 4U,400 4,000 6 A Lewis Street Chapman Avenue Sirius Avenue U 8,900, C Lincoln Avenue West City Limit Batavia Street 4D 4,400 7, B Lincoln Avenue Batavia Street Glassell Street 4D 0,00 7,500 4 A 4 Lincoln Avenue Glassell Street Orange Olive Road 4D 0,700 7,500 5 A 5 Lincoln Avenue Orange Olive Road Tustin Street 4D 0,400 7, D 6 Lincoln Avenue Tustin Street Santiago Boulevard 6D 4,00 56, C 7 Main Street SR- La Veta Avenue 6D 9,600 56, C 8 Main Street La Veta Avenue Chapman Avenue 4D,600 7, D 9 Main Street Chapman Avenue Sycamore Avenue 4D,000 7,500 6 A 0 Main Street Sycamore Avenue Collins Avenue 4D 7,00 7, A Main Street Collins Avenue Struck Avenue 4D 9,400 7,500 A Main Street Struck Avenue Katella Avenue 4D 6,600 7, A Main Street Katella Avenue Taft Avenue 4D,000 7,500 A 4 Meats Avenue Glassell Street Orange Olive Road 4U 8,600 4, A 5 Meats Avenue Orange Olive Road Cambridge Street 4U 0,900 4, A 6 Meats Avenue Cambridge Street Tustin Street 4U,400 4,000 6 A Deficient Segment, LOS E Deficient Segment, LOS F 8
37 Table. Existing Arterial Daily Level of Service (Continued) ID Arterial From To Lanes ADT LOS E Capacity V/C Ratio LOS 7 Meats Avenue Tustin Street Santiago Boulevard 4U 4,600 4, B 8 Meats Avenue Santiago Boulevard Featherhill Road 4U,000 4, A 9 Meats Avenue Featherhill Road Via Escola 4U 8,900 4, A 0 Metropolitan Drive Lewis Street SR- Westbound Ramps 4U 6,500 4, A Metropolitan Drive SR- Westbound Ramps The City Drive 4U,800 4, A Manchester Avenue Chapman Avenue Compton Avenue 4D 4,7 7, A Newport Boulevard South City Limits Canyon View Avenue 4D 8,00 7, A 4 Newport Boulevard Canyon View Avenue Chapman Avenue 4D 7,00 7, A 5 Newport Boulevard Chapman Avenue Santiago Canyon Road 4D 5,600 7,500 A 6 Nohl Ranch Road Santiago Boulevard East City Limit 4U 9,800 4, A 7 Orange Olive Road Glassell Street Meats Avenue 4U,00 4,000 A 8 Orange Olive Road Meats Avenue Lincoln Avenue 4U,00 4,000 0 A 9 Orange Olive Road Lincoln Avenue Santa Ana Canyon Road 4U 8,600 4, A 40 Orange Olive Road Santa Ana Canyon Road Riverdale Avenue 4U 5,900 4,000 A 4 Orangewood Avenue Eckhoff Street Main Street 4D 8,00 7, C 4 Palm Avenue Main Street Batavia Street U,500, A 4 Palm Avenue Batavia Street Cypress Street U 4,00,000 A 44 Palm Avenue Cypress Street Glassell Street U 4,000, A 45 Palm Avenue Glassell Street Cambridge Street U,600, A 46 Palm Avenue Cambridge Street Tustin Street U 4,00,000 A 47 Palmyra Avenue Batavia Street Glassell Street U,090, A 48 Palmyra Avenue Glassell Street Cambridge Street U,800,000 A 49 Palmyra Avenue Cambridge Street Tustin Street U 5,000, A 50 Parker Street La Veta Avenue Town & Country Road U,00,000. F 5 Prospect Street Fairhaven Avenue La Veta Avenue U 6,000,000 0 A 5 Prospect Street La Veta Avenue Chapman Avenue 4U 0,00 4, A 5 Prospect Street Chapman Avenue Spring Street 4U 0,900 4, D 54 Prospect Street Spring Street Walnut Avenue 4U 6,400 4, B 55 Prospect Street Walnut Avenue Bond Avenue 4U 5,00 4, B 56 Rampart Street Chapman Avenue Orangewood Avenue U,600, A 57 Rancho Santiago Boulevard Chapman Avenue Walnut Avenue U 7,400, B 58 Rancho Santiago Boulevard Hewes Street Bond Avenue U,800, A 59 Riverdale Avenue Glassell Street Orange Olive Road 4U 5,400 4, A 60 Riverdale Avenue Orange Olive Road Tustin Street 4U 7,400 4, A 6 Santiago Boulevard North City Limit Nohl Ranch Road U 0,500, D 6 Santiago Boulevard Wanda Road Taft Avenue 4U,500 4, A 6 Santiago Boulevard Taft Avenue Villa Real Drive 4U,00 4, A 64 Santiago Boulevard Villa Real Drive Lincoln Avenue 4U,600 4,000 A 65 Santiago Canyon Road Hewes Street Cannon Street 4D,700 7,500 8 A 66 Santiago Canyon Road Cannon Street Orange Park Boulevard 4D,000 7, B 67 Santiago Canyon Road Orange Park Boulevard Meads Avenue 4D 0,000 7,500 A 68 Santiago Canyon Road Meads Avenue Newport Boulevard 4D 8,700 7,500 0 A 69 Santiago Canyon Road Newport Boulevard Jamboree Road 6D 7,000 56, A 70 Santiago Canyon Road Jamboree Road SR-4 4U 6,00 4, B Santiago Canyon Road East of SR-4 U 8,000 4, B 7 Serrano Avenue Cannon Street Orange Park Boulevard 4D 6,900 7, A 7 Serrano Avenue Orange Park Boulevard Apache Creek 4D 8,00 7, A 7 Serrano Avenue Apache Creek East City Limit 4D 5,400 7, A Deficient Segment, LOS E Deficient Segment, LOS F 9
38 Table. Existing Arterial Daily Level of Service (continued) ID Arterial From To Lanes ADT LOS E Capacity V/C Ratio LOS 74 Shaffer Street Chapman Avenue Maple Avenue U 4,500, A 75 Spring Street Prospect Street Olympia Way 4U 8,000 4, A 76 Struck Avenue Katella Avenue Main Street U 8,00, B 77 Taft Avenue West City Limit Main Street 4D 5,400 7, E 78 Taft Avenue Main Street Batavia Street 4D 6,400 7, B 79 Taft Avenue Batavia Street Glassell Street 4D 6,000 7, B 80 Taft Avenue Glassell Street Cambridge Street 4D 5,800 7, A 8 Taft Avenue Cambridge Street Tustin Street 4D 4,000 7, A 8 Taft Avenue Tustin Street Santiago Boulevard 4U 0,400 4, A 8 Taft Avenue Cannon Street Yurok Street U 5,400, A 84 The City Drive Garden Grove Boulevard SR- 4D,00 7, B 85 The City Drive SR- Metropolitan 6D 4,500 56, C 86 The City Drive Metropolitan Chapman Avenue 8D 6,700 75, A 87 The City Drive Chapman Avenue North City Limits 8D 0,00 75, A 88 Town & Country Road Main Street SR- 4D 0,700 7,500 5 A 89 Town & Country Road SR- Parker Street 4D 0,000 7, A 90 Tustin Street Fairhaven Avenue La Veta Avenue 6D,800 56, A 9 Tustin Street La Veta Avenue Palmyra Avenue 6D 7,00 56, A 9 Tustin Street Palmyra Avenue Chapman Avenue 6D 8,800 56,00 A 9 Tustin Street Chapman Avenue Walnut Avenue 6D 4,900 56, C 94 Tustin Street Walnut Avenue Mayfair Avenue 6D 5,000 56, B 95 Tustin Street Mayfair Avenue Collins Avenue 6D 4,400 56, B 96 Tustin Street Collins Avenue Katella Avenue 6D 7,00 56, B 97 Tustin Street Katella Avenue Taft Avenue 6D 8,500 56, B 98 Tustin Street Taft Avenue Meats Avenue 6D 4,500 56, B 99 Tustin Street Meats Avenue Lincoln Avenue 6D,600 56, A 00 Tustin Street Lincoln Avenue Riverdale Avenue 5D 4,500 46,000 A 0 Via Escola Meats Avenue Cannon Street 4U 4,000 4, A 0 Villa Real Drive Santiago Boulevard Chapel Hill U,800,000 A 0 Walnut Avenue Main Street Batavia Street U 7,900, B 04 Walnut Avenue Batavia Street Cypress Street U 8,500, C 05 Walnut Avenue Cypress Street Glassell Street U 7,800, B 06 Walnut Avenue Glassell Street Cambridge Street U 7,500, B 07 Walnut Avenue Cambridge Street Tustin Street U 7,800, B 08 Walnut Avenue Tustin Street Handy Street U 7,800, B 09 Wanda Road Collins Avenue Katella Avenue 4U,600 4, A 0 Wanda Road Katella Avenue Santiago Boulevard (VP) 4U 9,000 4, C Yorba Street Fairhaven Avenue La Veta Avenue 4U 6,500 4, A Yorba Street La Veta Avenue Chapman Avenue 4U 0,00 4, A Deficient Segment, LOS E Deficient Segment, LOS F Source: City of Orange Arterial segments located near freeway interchanges generally attract excess volumes. For example, Chapman Avenue between Yorba Street and SR-55 attracts 6,700 daily vehicles while Katella Avenue between Tustin Street and SR-55 attracts 48,400 daily vehicles. Figure. illustrates the daily LOS results for the major study arterials. Under the existing conditions, a total of three segments exhibit LOS E and three segments exhibit LOS F (highlighted in red in the table): Chapman Avenue: Yorba Street to Prospect Street LOS E 0
39 A 40 I 6 I B Figure. - Existing Average Daily Traffic on Arterial Segments (in Thousands) ANAHEIM 0 5 LEWIS ST 5 METROPOLITAN DR 7 GA RDEN GRO 7 0 THE CITY DR 7 VE STATE COLLEGE BLVD BL VD ORANGEWOOD AVE S T 4 T R R M P A FLOWER ST BRISTOL ST 57 ECKHOFF ST S A N STRUCK AVE DEVON RD T MAIN ST A A N A 4 BATAVIA ST ALMOND AVE M E R LAWSON WY M O I V 0 R Y PARKER ST E R L N LEMON ST 5 9 GLASSELL ST R L INCOLN A V E FLE TCHER ST GRAND ST I V E R D A ORANGE OLIVE RD MEATS AVE TAFT AVE SHAFFER ST LA VETA AVE 7 L E 0 HEIM AVE KATELLA AVE WALNUT AVE 8 4 CAMBRIDGE ST A V FAIRHAVEN AVE SANTA ANA 55 E PALM AVE TUSTIN ST COLLINS AVE PALMYRA AVE TAFT AVE 7 R S A N T YORBA ST S A N T A D 4 L 54 0 E A WANDA RD HANDY ST N O H L 6 ORANGE I A G O CREE K R AN A CANYON RD V L L A 5 6 CHAPMAN AVE PROSPECT ST R A N CH VILLA PARK VILLA PARK RD 44 7 R D V A 6 BOND AVE SPRING ST 6 ESPLANADE ST E 9 S 4 C 6 O HEWES ST L A 9 5 M E S RANCHO SANTIAGO BLVD A D R TUSTIN CA NNO N S T ANAHEIM HILLS 6 ORANGE PARK BLVD 8 SE R RANO AVE C A 0 NYON VI 6 5 C SANTIAGO ANYON RD A M A P O NEW E W A V T POR L A BLV D A 7 8 V 6 E 9 E LEGEND City of Orange Water Area Roadway Sphere of Influence Adjacent Cities Railroad J 8 6 A M E RD ORE Miles EAST ORANGE Source File: Fig--y04-Exist-Artl-ADT map
40 D V I L C A NNO N Figure. - Existing Arterial Daily Level of Service ANAHEIM STATE COLLEGE BLVD 57 A S A N T A N A R BATAVIA ST I V E R L INCOLN AVE FLETCHER ST GLASSELL ST R I 9 9 V E R D A ORANGE OLIVE RD L E HEIM AVE MEATS AVE A V E S ANT IAGO BL V D S AN T A R D A L E N O H L A A N A C ANYON RD L R R A N CH RD V I A E S C O L A ME S A DR ANAHEIM HILLS S E R RANO AVE LEGEND City of Orange Water Area Roadway Sphere of Influence Adjacent Cities Railroad LOS A-D LOS E LOS F Miles MAIN ST TAFT AVE 55 TAFT AVE VILLA PARK VILLA PARK RD SANTI AGO CA NYON RD 5 LEWIS ST METROPOL ITA N GARDEN GROVE BLVD DR T H E C I TY ORANGEW R RA MPART S T OD AVE FLOWER ST BRISTOL ST ECKHOFF ST STRUCK AVE DEVON RD ALMOND AVE LAWSON WY M E M O R Y N L PARKER ST LEMON ST SHAFFER ST GRAND ST LA VETA AVE KATELLA AVE COLLINS AVE WALNUT AVE PALM AVE PALMYRA AVE CAMBRIDGE ST SANTA ANA TUSTIN ST 55 S A N T WANDA RD HANDY ST ORANGE I A G O CRE EK CHAPMAN AVE BOND AVE SPRING ST ESPLANADE ST PROSPECT ST YORBA ST FAIRHAVEN AVE HEWES ST RANCHO SANTIAGO ST S T CA TUSTIN ORANGE PARK BLVD N YO N A M POR NEW A P O L I V E W T A A BLVD A V VE E J A M B O R E E R D EAST ORANGE Source File: Fig--y04-Exist-Artl-LOS map
41 Glassell Street: La Veta Avenue to Almond Avenue LOS F Glassell Street: Chapman Avenue to Palm Avenue LOS F Glassell Street: Walnut Avenue to Collins Avenue LOS E Parker Street: La Veta Avenue to Town and Country Road LOS F Taft Avenue: West City Limit to Main Street LOS E City of Orange: Circulation Element Traffic Analysis.4 Existing Intersection Peak Hour Conditions Table.4 presents existing ICU and LOS results for turning movement volumes at the 5 critical intersections during morning (A.M.) peak hour and evening (P.M.) peak hour time periods. Traffic counts were collected from 7:00 A.M. to 9:00 A.M. and 4:00 P.M. to 6:00 P.M. Figure. illustrates peak hour intersection levels of service. Overall, most intersections operate at LOS D or better. However, there are three intersections that operate at unacceptable conditions, two in the A.M. peak and one in the P.M. peak. Tustin Street at Fairhaven Avenue and Santiago Boulevard at Meats Avenue exhibit LOS E and F, respectively, during the A.M. peak hour, while Glassell Street at Lincoln Avenue exhibits LOS E during the P.M. peak hour. Appendix A and Appendix B present existing lane geometrics and ICU worksheets for each intersection under existing conditions. Table.4 ID Existing Intersections Level of Service Intersection Location A.M. Peak Hour P.M. Peak Hour ICU LOS ICU LOS Batavia Collins Avenue 8 A 0.69 B Batavia Katella Avenue 0.48 A 0.60 A Batavia Lincoln Avenue 0.6 B 0.60 A 4 Batavia Taft Avenue 0.66 B 0.60 A 5 Batavia Walnut Avenue 0.46 A 0.44 A 6 Cambridge Katella Avenue A 0.67 B 7 Cannon Santiago Canyon Road 0.8 D 0.90 D 8 Cannon Serrano Avenue 0.69 B A 9 Cannon Street/ Crawford Chapman Avenue 0.6 B 8 A 0 Yorba Chapman Avenue 0.65 B 0.66 B Canyon View Chapman Avenue 0.47 A 0.4 A Jamboree Chapman Avenue 0.4 A 0.70 B Northbound SR-55 Chapman Avenue 0.6 B 0.60 A 4 Southbound SR-55 Chapman Avenue 0.44 A 4 A 5 Lewis Chapman Avenue 0.64 B 0.84 D 6 The City Chapman Avenue 0.60 A 0.8 D 7 The City Eastbound SR- Ramps 0.46 A 8 A 8 The City Metropolitan Drive 0.6 A 0.44 A 9 Glassell Collins Avenue 0.64 B 6 A 0 Glassell Katella Avenue 0.49 A 0.6 B Glassell La Veta Avenue 0.68 B 0.78 C Glassell Lincoln Avenue 6 A 0.98 E Glassell Taft Avenue 0.64 B 0.6 B 4 Glassell Walnut Avenue 0.75 C 0.86 D 5 Hewes Chapman Avenue 0.6 B 0.64 B 6 Northbound SR-55 Katella Avenue 0.7 C 0.78 C 7 Southbound SR-55 Katella Avenue 0.87 D 0.79 C 8 Main Chapman Avenue 0.6 B 0.8 D 9 Main Katella Avenue A 0.64 B 0 Main La Veta Avenue 5 A 0.88 D Main Orangewood Avenue 0.60 A 7 A Main Taft Avenue 0.69 B 0.7 C Main Town & Country Road 0.8 A 0.6 B 4 Newport Chapman Avenue 0. A 0.6 A 5 Santiago Nohl Ranch Road 0.69 B 0.60 A 6 Eckhoff Orangewood Avenue 6 A 0.7 C
42 Table.4 Existing Intersections Level of Service (continued) City of Orange: Circulation Element Traffic Analysis A.M. Peak Hour P.M. Peak Hour ID Intersection Location ICU LOS ICU LOS 7 State College Orangewood Avenue 0.47 A 9 A 8 Prospect Chapman Avenue 0.87 D 0.8 D 9 Prospect Walnut Avenue 0.4 A 0.7 A 40 Santiago Meats Avenue.0 F 0.75 C 4 Wanda Villa Park Road 0.8 D 0.84 D 4 Tustin Chapman Avenue 0.79 C 0.84 D 4 Tustin Collins Avenue A 0.67 B 44 Tustin Fairhaven Avenue 0.99 E 0.76 C 45 Tustin Heim Avenue 0.45 A 0.70 B 46 Tustin Katella Avenue A 0.70 B 47 Tustin La Veta Avenue 5 A 0.49 A 48 Tustin Lincoln Avenue 0.6 B 0.88 D 49 Tustin Meats Avenue 0.44 A 0.74 C 50 Tustin Taft Avenue (North) 0.49 A 0.69 B 5 Tustin Taft Avenue (South) 0.6 B 0.75 C 5 Tustin Walnut Avenue 4 A 9 A 55 Struck Katella Avenue 0.8 A 0.4 A 56 Main Struck Avenue 0.79 C 0.48 A 57 Main Collins Avenue 0.44 A 7 A 58 Southbound SR-57 Orangewood Avenue A 0.6 B 59 Northbound SR-57 Orangewood Avenue 0.49 A A 60 State College NB I-5 Ramps/Anaheim Way 0.6 A 0.9 A 6 State College Southbound I-5 Ramps 0.6 A 0.8 A 6 Southbound I-5 Chapman Avenue 0.47 A A 6 Rampart Chapman Ave./ Northbound I-5 Ramps 0. A A 64 Southbound SR-57 Chapman Avenue A 0.6 B 65 Northbound SR-57 Chapman Avenue 0.40 A 0.4 A Deficient Intersection, LOS E Deficient Intersection, LOS F Source: City of Orange 4

43
44 4.0 FUTURE CONDITIONS This chapter presents an analysis of future traffic conditions based on forecast year 00 post-model adjusted arterial segment volumes and peak hour (A.M. and P.M.) intersection turning movement volumes for selected City intersections. The Orange Traffic Analysis Model (OTAM) was updated for this General Plan Update traffic analysis by incorporating the most recent adopted demographic forecast data external to the City of Orange and recertified as consistent with the Orange County Transportation Analysis Model (OCTAM.). Land Use and Trip Generation The 00 traffic conditions are based on the City s Proposed General Plan Buildout land use assumptions. No Project conditions, however, are based on the current General Plan Buildout land use assumptions. Additionally, as noted above, the external City of Orange demographic data was updated to reflect the adopted Orange County Projections 004 data. Table 4. identifies the future alternative trip generation in comparison to the existing trip generation within the City. The Project Scenario generates approximately 50% more trips than are currently generated within the City. Alternative generates approximately 5% fewer trips than the Project Scenario. Table 4. Scenario Trip Generation Summary Daily Trips Generated Existing 995,000 No Project,87,00 Project,456,700 Alternative,456,700 Alternative,76,00 Source: OTAM Public Transportation Public transportation plays a key role in future land use development and mobility. As the roadway system reaches capacity, alternative modes of transportation provide additional capacity as well as an enhanced degree of mobility for residents, workers, and visitors. As noted, OCTA and RTA provide bus service to the City while Metrolink and Amtrak provide rail service. Existing services are expected to continue while enhancements, many of them currently in the planning stages, will increase the viability of alternative modes of travel. The integration of alternative modes of transportation such as bus, rail, bicycle and pedestrian into the roadway system are essential to maximizing mobility opportunities for residents, workers and visitors. OCTA has forecast bus ridership to increase by approximately 75 percent by 00. While much of this ridership increase is the result of enhanced services including express bus routes and introduction of bus rapid transit service, increased arterial and freeway congestion levels in conjunction with improved local bus service is expected to continue to attract new riders. OCTA is planning to introduce bus rapid transit services by 0 on the Harbor Boulevard, Westminster Avenue and State College Boulevard/Bristol Street corridors with planned stops in Orange on The City Drive and State College Boulevard. With the projected success of this service, similar to the Los Angeles Metro Rapid service, it is likely that bus rapid transit will be implemented on other key corridors. In addition to bus rapid transit service, OCTA has focused on improving connection between all modes of transportation. Many cities have already begun development intensification surrounding Metrolink stations, notably Fullerton, while other cities have begun planning for increasing densities surrounding Future Transportation Analysis 6
45 Metrolink stations, including Anaheim, Irvine, and Santa Ana. Density intensification around alternative transportation facilities provide people with enhanced commuting opportunities. As the suburban landscape of Orange County matures, it is expected that the trend of development intensification surrounding alternative transportation facilities such as existing Metrolink stations will continue. Another alternative transportation improvement expected to occur by 0 is 0-minute intra-county rail service through the core transit corridor through Orange County. This service, which will be provided by Metrolink on behalf of OCTA, is an attempt to serve intra-county trips with a high degree of reliability. This 0-minute service is planned to operate between the Irvine Transportation Center (and possibly Laguna Niguel) and the Fullerton Transportation Center. The service will shift the existing markets served by Metrolink. Metrolink is currently a peak period commuter service, however, the improved service will be reliable rail service throughout the day serving travel markets not previously served by Metrolink. Recent analysis of ridership activity at each of the intra-county stations forecast approximately,000 daily trips expected to use the Orange Transportation Center as part of this intra-county service. As noted, the Go Local program is specifically targeted at improving local access to the regional local bus, express bus, bus rapid transit, and rail networks. As the 0-minute service is implemented and matures, it is likely that increased development intensities will be realized surrounding the county s rail stations and transit corridors. Bicycle/Trail Network The City of Orange developed an update to their Bikeways Master Plan in 00. The Recreational Trails Master Plan, developed in 99, is a comprehensive long range planning document that guides the identification of recreational trails and their implementation. As noted above, recreational trails serve an important function in the overall transportation system. Quality trail systems enhance the quality of life and provide additional accessibility, connectivity, and mobility. The objective of the Bicycle Master Plan is to encourage the development of a unified bicycle system throughout the City of Orange with connections to other regional bike and pedestrian system. As a part of the development of the Bicycle Master Plan Update in 00, it was determined that deficiencies exist in system continuity, linkage to regional destinations and safety concerns exist. The update recommended the development of an integrated and comprehensive network of bicycle facilities and bicycle programs. The system is expected to serve all Orange neighborhoods and provide linkages to schools, parks, shopping areas, work centers, and other destinations. Bicycle related amenities include bicycle lockers and racks to encourage bicycle commuters. Safety of bicycle paths is also a key factor in encouraging use of bicycles as a viable alternative to the automobile. Detailed analysis during the development of the plan revealed that more people would commute by bike if safe bicycle-friendly transportation systems existed. As development intensifies and congestion increases, bicycles could become a realistic alternative to the automobile, hence the integration of safe and efficient bicycle facilities into the transportation system infrastructure cannot be ignored. Figure 4. presents the proposed routes identified in the OCTA Commuter Bikeway Strategic Plan. Roadway Network A key assumption in the development of future traffic conditions is the underlying roadway network, which assumes buildout of the existing City Master Plan of Arterial Highways (MPAH) and includes the following roadway improvements: Cambridge Street, Katella Avenue to South City Limits improve to 4-lane secondary facility Cannon Avenue, Serrano Avenue to Santiago Canyon Road improve to 6-lane major facility Chapman Avenue, Lemon Street to Grand Street improve to 4-lane primary facility Crawford Canyon Road, Chapman Avenue to Newport Avenue improve to 4-lane secondary facility Eckhoff Street, Sycamore Avenue to Collins Avenue improve to 4-lane secondary facility Future Transportation Analysis 7
46 Glassell Street, La Veta Avenue to Collins Avenue improve to 4-lane secondary facility La Veta Avenue, Flower Street to Parker Street improve to 6-lane major facility La Veta Avenue, Glassell Street to Cambridge Street improve to 4-lane secondary facility Lewis Street, Metropolitan Drive to Chapman Avenue improve to 4-lane primary facility Lincoln Avenue, west City Limits to Nohl Ranch Road - improve to 6-lane major facility Main Street, La Veta Avenue to Collins Avenue improve to 6-lane major facility Metropolitan Drive, The City Drive to Chapman Avenue add 4-lane secondary facility Orangewood Avenue, Eckhoff Street to Main Street improve to 6-lane major facility Parker Street, South City Limit to La Veta Avenue improve to 4-lane secondary facility Prospect Street, Fairhaven Avenue to La Veta Avenue improve to 4-lane secondary facility Rampart Street, Chapman Avenue to Orangewood Avenue improve to 4-lane secondary facility Santiago Boulevard, north of Lincoln Avenue/Nohl Ranch Road improve to 6-lane major facility Santiago Canyon Road/Villa Park Road, Handy Street to Newport Avenue improve to 6-lane major facility Taft Avenue, west City limits to Tustin Street improve to 6-lane major facility The City Drive, Garden Grove Boulevard to SR- improve to 6-lane major facility Walnut Avenue, Main Street to Prospect Street improve to/add 4-lane secondary facility While the No Project Alternative assumes the Existing MPAH as the background roadway system, the remaining alternatives refine the Existing MPAH with minor improvements which define the Proposed MPAH. The Proposed MPAH represents a more realistic future base network and accounts for the following deviations from the Existing MPAH: Cambridge Street, Katella Avenue to South City Limits maintain existing -lane configuration Chapman Avenue, Lemon Street to Grand Street maintain existing -lane configuration Walnut Avenue, Main Street to Prospect Street maintain existing -lane configuration Glassell Street, Almond Avenue to Palm Avenue maintain existing -lane configuration Implementation of a full-diamond interchange at Meats Avenue/SR-55 These arterial facilities are residential collectors or located in the Orange Plaza; hence, improvements to them are unlikely due to political, historical, residential, right-of-way, and environmental issues, among others. As there are no plans to widen these arterials to four-lane facilities as specified in the Existing City MPAH and the City desires to retain the existing configurations on these facilities, these deviations define the Proposed MPAH. A full diamond interchange at SR-55 and Meats Avenue was also incorporated into the Project Scenario and Alternative. The Meats Avenue interchange with SR-55 has the potential to relieve the congestion experienced at the SR-55 and Lincoln Avenue/Nohl Ranch Road and Katella Avenue interchanges. Level of service analysis is performed on arterial segments and at intersections using turning movement volumes forecast by OTAM. The level of service analysis for both arterial segments and intersections assumes full buildout of the City Master Plan of Arterial Highways, therefore intersection lane improvements have been incorporated into the intersection analysis. Table 4. identifies the four future alternative scenarios that are evaluated under future traffic conditions. Table 4. Future Scenarios Scenario Land Use Assumption Circulation Assumption No Project 00 Buildout of Existing General Plan 00 Buildout of Existing MPAH Project Alternative Alternative 00 Buildout of Proposed General Plan 00 Buildout of Proposed General Plan 00 Reduced Intensity General Plan 00 Buildout of Proposed MPAH with the Meats Avenue/SR-55 Interchange 00 Buildout of Proposed MPAH without the Meats Avenue/SR-55 Interchange 00 Buildout of Proposed MPAH with the Meats Avenue/SR-55 Interchange Future Transportation Analysis 8
47 V R I Figure 4. - Proposed Bikeways ANAHEIM STATE COLLEGE BLVD 57 S A N T A N A A R I BATAVIA ST V E R GLASSELL ST R ORANGE OLIVE RD 9 9 I V E R D A L E A HEIM AVE ORANGE V E S ANT IAGO BLV D MEATS AVE 55 TAFT AVE SANT A ANA D R L A N O H L I L L A E CANYON RD R D R A N C H VILLA PARK V A E S C O L A M E S A D R S ERRANO ANAHEIM HILLS AV E S A N T I AGO SANTIAGO CANYON RD CREEK LEGEND City of Orange Water Area Roadway Sphere of Influence Adjacent Cities Railroad Class I Class II Class III Adjacent Jurisdiction Miles TAFT AVE VILLA PARK RD KATELLA AVE E T R O P 5 THE CI LEWIS ST O GARDEN GROVE BLVD L I T A N R D TY DR ORANGEWOOD AVE S T T R BRISTOL ST R A A M P FLOWER ST STRUCK AVE MAIN ST ECKHOFF ST 5 ALMOND AVE LAWSON WY DEVON RD M E M O R Y L N PARKER ST GRAND ST LEMON ST LA VETA AVE CAMBRIDGE ST SHAFFER ST COLLINS AVE WALNUT AVE PALM AVE PALMYRA AVE SANTA ANA TUSTIN ST 55 HANDY ST YORBA ST WANDA RD BOND AVE SPRING ST CHAPMAN AVE ESPLANADE ST PROSPECT ST FAIRHAVEN AVE HEWES ST RANCHO SANTIAGO BLVD C A N NO N S T C A ORANGE PARK BLVD NY O TUSTIN A M A N V I P O L T N E W P OR A EW A B L V A V E D V E J A M B O R E E R D EAST ORANGE S T R E E T D Source File: Fig4--y0-Prop-Bikeways map
48 4. Future Traffic Volume Post-Processing Methodology A post-processing methodology, consistent with OCTAM methodology, is applied to model outputs to achieve future forecasts which reflect appropriate growth in comparison to existing traffic volumes. Postprocessing is common among traffic models since the procedure pivots off of a known value, i.e. a traffic count volume, to generate future forecast volumes. The post-processor applies the model s projected growth to existing daily arterial and A.M. and P.M. peak hour turning movement count data to develop forecast future turning movement volumes. The arterial post-model adjustment methodology uses a growth ratio, i.e. applying the model forecast ADT growth between 000 and 00 to the base year count volume, or an incremental growth method, i.e. applying the model forecast ADT ratio between 000 and 00 to the base year count volume, dependent upon whether the base year model volume is greater or less than the existing count volume. For intersections, the post-processing methodology is similar to the arterial segment post-processor and applies a ratio or increment growth. This methodology is based on procedures developed by the Federal Highway Administration. 4. No Project Future Daily Conditions The No Project scenario represents buildout of the existing MPAH and assumes buildout of the existing General Plan land use. Future No Project post-processed 00 forecast volumes with corresponding daily V/C ratio and LOS are presented in Table 4.. Table 4. indicates that traffic worsens throughout the City, with several arterial segments operating below the acceptable LOS D threshold. Though the traffic model assumes buildout of the existing MPAH for the forecast year, the deficient segments listed below maintain their existing lane configuration and classification. Listed below are specific locations that will operate at an unacceptable LOS in 00 under No Project Conditions: Chapman Avenue o SR-55 to Yorba Street o Yorba Street to Prospect Street (LOS E under existing conditions) o Prospect Street to Esplanade Street o Crawford Canyon Road to Canyon View Road Lincoln Avenue o Tustin Street to Santiago Boulevard Prospect Street o Chapman Avenue to Spring Street o Spring Street to Walnut Avenue Wanda Road o Katella Avenue to Santiago Boulevard Close scrutiny of Table 4. will also show that there are a few arterial segments that are forecast to improve to acceptable levels of service from existing conditions: Glassell Avenue o La Veta Avenue to Almond Avenue o Chapman Avenue to Palm Avenue o Palm Avenue to Collins Avenue Parker Street o La Veta Street to Town & Country Road The improvements are the result of capacity increases that are assumed under MPAH buildout conditions. Glassell Street is assumed to be improved from a two-lane undivided to a four-lane divided arterial through the Orange Plaza. Likewise, Parker Street has been assumed at MPAH buildout as a four-lane undivided facility, improved from a two-lane undivided facility. Traffic on these segments has been forecast to increase considerably, and should the existing MPAH buildout be not achieved by the forecast year, these segments will experience traffic congestion in 00. Future Transportation Analysis 0
49 Table 4. No Project Existing MPAH Arterial Daily Level of Service ID Arterial From To MPAH Lanes 00 ADT LOS E Capacity V/C Ratio LOS Almond Avenue Main Street Batavia Street U 5,700, A Almond Avenue Batavia Street Glassell Street U 5,500, A Almond Avenue Glassell Street Grand Street U 6,00,000 A 4 Almond Avenue Grand Street Cambridge Street U,400, A 5 Batavia Street La Veta Avenue Almond Avenue 4U 0,600 4, A 6 Batavia Street Almond Avenue Chapman Avenue 4U 4,00 4, A 7 Batavia Street Chapman Avenue Walnut Avenue 4U 9,900 4, D 8 Batavia Street Walnut Avenue Collins Avenue 4U 6,900 4, B 9 Batavia Street Collins Avenue Katella Avenue 4U 8,00 4, C 0 Batavia Street Katella Avenue Taft Avenue 4U 5,800 4, B Batavia Street Taft Avenue Fletcher Avenue 4U 7,500 4, C Batavia Street Fletcher Avenue Lincoln Avenue 4U 7,700 4, C Bond Avenue Prospect Street Hewes Street 4U 8,00 4, A 4 Cambridge Street South City Limits Palmyra Avenue 4U 7,700 4, A 5 Cambridge Street Palmyra Avenue Chapman Avenue 4U 8,600 4, A 6 Cambridge Street Chapman Avenue Palm Avenue 4U 7,700 4, A 7 Cambridge Street Palm Avenue Walnut Avenue 4U 7,700 4, A 8 Cambridge Street Walnut Avenue Collins Avenue 4U 8,000 4, A 9 Cambridge Street Collins Avenue Katella Avenue 4U 8,400 4,000 A 0 Cambridge Street Katella Avenue Taft Avenue 4U,800 4, A Cambridge Street Taft Avenue Meats Avenue 4U 8,400 4,000 A Canyon View Avenue Chapman Avenue Outrider Street 4D 6,400 7, A Canyon View Avenue Outrider Street Newport Boulevard 4D 6,00 7, A 4 Canyon View Avenue Newport Boulevard Jamboree Road 4D 5,700 7,500 A 5 Chapman Avenue Haster Street Lewis Street 5D,600 46, C 6 Chapman Avenue Lewis Street Manchester Avenue 6D 8,000 56, B 7 Chapman Avenue Manchester Avenue The City Drive 6D 40,900 56, C 8 Chapman Avenue The City Drive Eckhoff Street 6D 5,500 56, B 9 Chapman Avenue Eckhoff Street Main Street 6D,500 56,00 6 A 0 Chapman Avenue Main Street Batavia Street 4D,500 7, A Chapman Avenue Batavia Street Lemon Street 4D,600 7,500 8 A Chapman Avenue Lemon Street Glassell Street 4D,00 7, B Chapman Avenue Glassell Street Grand Street 4D 4,700 7, B Chapman Avenue Grand Street Cambridge Street 4D 6,00 7, B Chapman Avenue Cambridge Street Tustin Street 4D 0,500 7, D 4 Chapman Avenue Tustin Street SR-55 6D 49,800 56, D 5 Chapman Avenue SR-55 Yorba Street 8D 78,700 75, F 6 Chapman Avenue Yorba Street Prospect Street 6D 65,00 56,00.6 F 7 Chapman Avenue Prospect Street Esplanade Street 6D 5,00 56, E 8 Chapman Avenue Esplanade Street Hewes Street 6D 48,00 56, D 9 Chapman Avenue Hewes Street Crawford Canyon Road 6D 4,000 56, C 40 Chapman Avenue Crawford Canyon Road Canyon View Avenue 4D 8,00 7,500.0 F 4 Chapman Avenue Canyon View Avenue Orange Park Boulevard 4D 8,900 7, C 4 Chapman Avenue Orange Park Boulevard Newport Boulevard 4D,600 7, B 4 Chapman Avenue Newport Boulevard Jamboree Road 6D 4,800 56, C 44 Chapman Avenue Jamboree Road City Limit 6D 8,600 56, B 45 Collins Avenue Eckhoff Street Main Street 4U 7,800 4, A 46 Collins Avenue Main Street Batavia Street 4U,00 4,000 5 A 47 Collins Avenue Batavia Street Glassell Street 4U 6,000 4, B 48 Collins Avenue Glassell Street Cambridge Street 4U 6,600 4, B 49 Collins Avenue Cambridge Street Tustin Street 4U 6,00 4, B 50 Collins Avenue Tustin Street Handy Street 4U 5,00 4, B Deficient Segment, LOS E Deficient Segment, LOS F Future Transportation Analysis
50 Table 4. No Project Existing MPAH Arterial Daily Level of Service (continued) ID Arterial From To MPAH Lanes 00 ADT LOS E Capacity V/C Ratio LOS 5 Collins Avenue Handy Street Wanda Road 4U 4,600 4, B 5 Collins Avenue Wanda Road Prospect Street 4U 8,800 4, C 5 Crawford Canyon Road Barrett Avenue Chapman Avenue 4U 7,400 4, C 54 Cannon Street Chapman Avenue Creekside Avenue 4U 4,00 4,000 9 A 55 Cannon Street Creekside Avenue Patria Court 4U 9,500 4, A 56 Cannon Street Patria Court Santiago Canyon Road 4U 9,00 4, A 57 Cannon Street Santiago Canyon Road Taft Avenue 6D 48,900 56, D 58 Cannon Street Taft Avenue Via Escola 6D 4,900 56, B 59 Eckhoff Street Chapman Avenue Sycamore Avenue U 7,700, B 60 Eckhoff Street Orangewood Avenue Collins Avenue 4U 0,500 4, A 6 Esplanade Street Fairhaven Avenue La Veta Avenue 4U,400 4, A 6 Esplanade Street La Veta Avenue Chapman Avenue 4U 7,00 4, A 6 Fairhaven Avenue Glassell Street Cambridge Street 4U 0,00 4, A 64 Fairhaven Avenue Cambridge Street Tustin Street 4U 0,00 4, A 65 Fairhaven Avenue Tustin Street Yorba Street 4U 4,00 4, A 66 Fairhaven Avenue Yorba Street Prospect Street 4U 4,700 4, B 67 Fairhaven Avenue Prospect Street Esplanade Street 4U,500 4,000 6 A 68 Fairhaven Avenue Esplanade Street Hewes Street 4U 0,900 4, A 69 Fletcher Avenue Batavia Street Glassell Street 4U 4,500 4, A 70 Garden Grove Boulevard The City Drive Lewis Street 4D,900 7, B 7 Glassell Street SR- La Veta Avenue 4D,00 7, D 7 Glassell Street La Veta Avenue Almond Avenue 4D 7,600 7, A 7 Glassell Street Almond Avenue Chapman Avenue 4D 5,800 7, A 74 Glassell Street Chapman Avenue Palm Avenue 4D,600 7, A 75 Glassell Street Palm Avenue Collins Avenue 4D 4,00 7, A 76 Glassell Street Collins Avenue Katella Avenue 4D,600 7, A 77 Glassell Street Katella Avenue Orange Olive Road 4D 0,00 7, D 78 Glassell Street Orange Olive Road Grove Avenue 4D 4,700 7, A 79 Glassell Street Grove Avenue Lincoln Avenue 4D,700 7, B 80 Glassell Street Lincoln Avenue Santa Ana River 4D 8,700 7, C 8 Grand Street La Veta Avenue Palmyra Avenue U,500, A 8 Grand Street Almond Avenue Chapman Avenue U,700, A 8 Grand Street Chapman Avenue Maple Avenue 4D 4,800 7, A 8 Hewes Street Fairhaven Avenue Washington Avenue U 7,400, A 8 Hewes Street Washington Avenue Chapman Avenue 4U 0,800 4, A 84 Hewes Street Chapman Avenue Walnut Avenue 4U,700 4,000 A 85 Hewes Street Walnut Avenue Santiago Canyon Road 4U,500 4,000 A 86 Jamboree Road Santiago Canyon Road Chapman Avenue 4U 8,600 4,000 A 87 Jamboree Road Chapman Avenue Canyon View Avenue 6D 6,400 56, A 88 Jamboree Road Canyon View Avenue SR-4 6D 0,00 56,00 A 89 Katella Avenue* Struck Avenue Main Street 6D SS 46,700 59, C 90 Katella Avenue* Main Street Batavia Street 6D SS 4,900 59, C 9 Katella Avenue* Batavia Street Glassell Street 6D SS 45,600 59, C 9 Katella Avenue* Glassell Street Cambridge Street 6D SS 46,00 59, C 9 Katella Avenue* Cambridge Street Tustin Street 6D SS 45,800 59, C 94 Katella Avenue* Tustin Street SR-55 7D SS 54,00 68, C 95 Katella Avenue SR-55 Handy Street 6D 50,500 56, D 96 Katella Avenue Handy Street Wanda Road 6D 48,00 56, D 97 Katella Avenue Wanda Road Center Drive 6D 40,00 56, C 98 Katella Avenue Center Drive Santiago Canyon Road 6D 8,000 56, B 99 La Veta Avenue Flower Street Devon Street 6D 4,500 56, A Deficient Segment, LOS E Deficient Segment, LOS F Future Transportation Analysis
51 Table 4. No Project Existing MPAH Arterial Daily Level of Service (continued) ID Arterial From To MPAH Lanes 00 ADT LOS E Capacity V/C Ratio LOS 00 La Veta Avenue Devon Street Main Street 6D 9,400 56, A 0 La Veta Avenue Main Street Batavia Street 6D 0,00 56,00 4 A 0 La Veta Avenue Batavia Street Glassell Street 4D 6,400 7, A 0 La Veta Avenue Glassell Street Shaffer Street 4U 0,00 4, A 04 La Veta Avenue Shaffer Street Cambridge Street 4U 7,600 4, A 05 La Veta Avenue Tustin Street Yorba Street 4U,900 4,000 0 A 06 La Veta Avenue Yorba Street Prospect Street 4U,00 4, A 07 La Veta Avenue Prospect Street Esplanade Street 4U 9,00 4, A 08 Lemon Street La Veta Avenue Palmyra Avenue U 8,500, C 08 Lemon Street Chapman Avenue Maple Avenue U 7,800, B 08 Lemon Street Maple Avenue Walnut Avenue U,00, A 09 Lewis Street Garden Grove Avenue Metropolitan Drive 4U 4,00 4, A 0 Lewis Street Metropolitan Drive Chapman Avenue 4U 8,400 4, C Lewis Street Chapman Avenue Sirius Avenue 4U 0,800 4, A Lincoln Avenue West City Limit Batavia Street 6D 4,800 56, B Lincoln Avenue Batavia Street Glassell Street 6D,700 56,00 6 A 4 Lincoln Avenue Glassell Street Orange Olive Road 6D 4,00 56, B 5 Lincoln Avenue Orange Olive Road Tustin Street 6D 47,00 56, D 6 Lincoln Avenue Tustin Street Santiago Boulevard 6D 5,500 56, E 7 Main Street Town & Country Road La Veta Avenue 6D 48,00 56, D 8 Main Street La Veta Avenue Chapman Avenue 6D 4,800 56, C 9 Main Street Chapman Avenue Sycamore Avenue 6D,00 56,00 6 A 0 Main Street Sycamore Avenue Collins Avenue 6D 5,00 56, A Main Street Collins Avenue Struck Avenue 4D,00 7,500 7 A Main Street Struck Avenue Katella Avenue 4D 8,500 7, A Main Street Katella Avenue Taft Avenue 4D 0,700 7,500 5 A 4 Meats Avenue Glassell Street Orange Olive Road 4U 9,500 4, A 5 Meats Avenue Orange Olive Road Cambridge Street 4U,000 4,000 0 A 6 Meats Avenue Cambridge Street Tustin Street 4U 4,700 4, B 7 Meats Avenue Tustin Street Santiago Boulevard 4U 6,700 4, B 8 Meats Avenue Santiago Boulevard Featherhill Road 4U,00 4,000 5 A 9 Meats Avenue Featherhill Road Via Escola 4U 6,800 4, A 0 Metropolitan Drive Lewis Street SR- Westbound Ramps 4U 6,500 4, A Metropolitan Drive SR- Westbound Ramps The City Drive 4U 4,000 4,000 8 A Metropolitan Drive The City Drive Chapman Avenue 4U,800 4,000 8 A Manchester Avenue Chapman Avenue Compton Avenue 4D 7,800 7, A Newport Boulevard South City Limits Canyon View Avenue 4D 9,000 7, A 4 Newport Boulevard Canyon View Avenue Chapman Avenue 4D 7,800 7, A 5 Newport Boulevard Chapman Avenue Santiago Canyon Road 4D,00 7,500 A 6 Nohl Ranch Road Santiago Boulevard East City Limit 4U 4,00 7,500 9 A 7 Orange Olive Road Glassell Street Meats Avenue 4U 7,800 4, C 8 Orange Olive Road Meats Avenue Lincoln Avenue 4U 7,000 4, C 9 Orange Olive Road Lincoln Avenue Santa Ana Canyon Road 4U 4,700 4, B 40 Orange Olive Road Santa Ana Canyon Road Riverdale Avenue 4U 9,800 4, A 4 Orangewood Avenue Eckhoff Street Main Street 6D,900 4, A 4 Palm Avenue Main Street Batavia Street U,900 56,00 0. A 4 Palm Avenue Batavia Street Cypress Street U 4,600, A 44 Palm Avenue Cypress Street Glassell Street U 4,400, A 45 Palm Avenue Glassell Street Cambridge Street U 4,000, A 46 Palm Avenue Cambridge Street Tustin Street U 7,00, A 47 Palmyra Avenue Batavia Street Glassell Street U,600, A Deficient Segment, LOS E Deficient Segment, LOS F Future Transportation Analysis
52 Table 4. No Project Existing MPAH Arterial Daily Level of Service (continued) ID Arterial From To MPAH Lanes 00 ADT LOS E Capacity V/C Ratio LOS 48 Palmyra Avenue Glassell Street Cambridge Street U,000, A 49 Palmyra Avenue Cambridge Street Tustin Street U 5,00, A 50 Parker Street La Veta Avenue Town & Country Road 4U 5,700 4, B 5 Prospect Street Fairhaven Avenue La Veta Avenue 4U 0,000 4, A 5 Prospect Street La Veta Avenue Chapman Avenue 4U,400 4,000 6 A 5 Prospect Street Chapman Avenue Spring Street 4U 4,400 4,000.0 F 54 Prospect Street Spring Street Walnut Avenue 4U,400 4, E 55 Prospect Street Walnut Avenue Bond Avenue 4U 7,500 4, C 56 Rampart Street Chapman Avenue Orangewood Avenue 4U 8,00 4,000 A 57 Rancho Santiago Boulevard Chapman Avenue Walnut Avenue U 8,00, B 58 Rancho Santiago Boulevard Hewes Street Bond Avenue U,00, A 59 Riverdale Avenue Glassell Street Orange Olive Road 4U 6,000 4,000 A 60 Riverdale Avenue Orange Olive Road Tustin Street 4U 8,00 4,000 A 6 Santa Ana Canyon Road Lincoln Avenue Nohl Ranch Road 6D 6,600 56, A 6 Santiago Boulevard Wanda Road Taft Avenue 4U 6,000 4, B 6 Santiago Boulevard Taft Avenue Villa Real Drive 4U 6,00 4, B 64 Santiago Boulevard Villa Real Drive Lincoln Avenue 4U 8,400 4, C 65 Santiago Canyon Road Hewes Street Cannon Street 6D 4,00 56, C 66 Santiago Canyon Road Cannon Street Orange Park Boulevard 6D 47,900 56, D 67 Santiago Canyon Road Orange Park Boulevard Meads Avenue 6D 8,900 56, B 68 Santiago Canyon Road Meads Avenue Newport Boulevard 6D 7,700 56, B 69 Santiago Canyon Road Newport Boulevard Jamboree Road 6D 8,600 56,00 A 70 Santiago Canyon Road Jamboree Road Street D 6D 8,600 56, B 4 Santiago Canyon Road Street D SR-4 6D 6,000 56, A Santiago Canyon Road East of SR-4 4D 4,000 7, B 7 Serrano Avenue Cannon Street Orange Park Boulevard 4D,600 7, B 7 Serrano Avenue Orange Park Boulevard Apache Creek 4D 0,500 7,500 5 A 7 Serrano Avenue Apache Creek East City Limit 4D,00 7, A 74 Shaffer Street La Veta Avenue Palmyra Avenue U,900, A 74 Shaffer Street Chapman Avenue Maple Avenue U 5,000, A 74 Shaffer Street Palm Avenue Walnut Avenue U 4,900, A 74 Shaffer Street Walnut Avenue Collins Avenue U 0,00, D 744 Shaffer Street Collins Avenue Katella Avenue U 5,900, A 75 Spring Street Prospect Street Olympia Way 4U 7,00 4, C 76 Struck Avenue Katella Avenue Main Street U 9,00, C 77 Taft Avenue West City Limit Main Street 6D 49,00 56, D 78 Taft Avenue Main Street Batavia Street 6D 8,900 56,00 A 79 Taft Avenue Batavia Street Glassell Street 6D,000 56,00 9 A 80 Taft Avenue Glassell Street Cambridge Street 6D,00 56, A 8 Taft Avenue Cambridge Street Tustin Street 6D 8,00 56,00 0. A 8 Taft Avenue Tustin Street Santiago Boulevard 4U 4,00 4,000 9 A 8 Taft Avenue Cannon Street Yurok Street U 8,800, C 84 The City Drive Garden Grove Boulevard SR- 6D 6,400 56, A 85 The City Drive SR- Metropolitan 6D 45,700 56, D 86 The City Drive Metropolitan Chapman Avenue 8D 6,800 75, A 87 The City Drive Chapman Avenue North City Limits 8D,00 75, A 88 Town & Country Road Main Street SR- 4D 5,000 7, B 89 Town & Country Road SR- Parker Street 4D 0,900 7, A 90 Tustin Street Fairhaven Avenue La Veta Avenue 6D 7,800 56, B 9 Tustin Street La Veta Avenue Palmyra Avenue 6D 0,900 56,00 5 A 9 Tustin Street Palmyra Avenue Chapman Avenue 6D,00 56,00 7 A 9 Tustin Street Chapman Avenue Walnut Avenue 6D 48,500 56, D 94 Tustin Street Walnut Avenue Mayfair Avenue 6D 44,600 56, C Deficient Segment, LOS E Deficient Segment, LOS F Future Transportation Analysis 4
53 Table 4. No Project Existing MPAH Arterial Daily Level of Service (continued) ID Arterial From To MPAH Lanes 00 ADT LOS E Capacity V/C Ratio LOS 95 Tustin Street Mayfair Avenue Collins Avenue 6D 4,00 56, C 96 Tustin Street Collins Avenue Katella Avenue 6D 48,400 56, D 97 Tustin Street Katella Avenue Taft Avenue 6D 47,00 56, D 98 Tustin Street Taft Avenue Meats Avenue 6D 9,800 56, C 99 Tustin Street Meats Avenue Lincoln Avenue 6D 6,00 56, B 00 Tustin Street Lincoln Avenue Santa Ana Canyon Road 6D 9,00 56,00 A 0 Via Escola Meats Avenue Cannon Street 4U 5,00 4, A 0 Villa Real Drive Santiago Boulevard Chapel Hill U,700, A 0 Walnut Avenue Main Street Batavia Street 4U,00 4, A 04 Walnut Avenue Batavia Street Cypress Street 4U,00 4, A 05 Walnut Avenue Cypress Street Glassell Street 4U 0,600 4, A 06 Walnut Avenue Glassell Street Cambridge Street 4U 8,00 4,000 A 07 Walnut Avenue Cambridge Street Tustin Street 4U 8,00 4, A 08 Walnut Avenue Tustin Street Handy Street 4U,800 4, A 09 Wanda Road Collins Avenue Katella Avenue 4U 4,800 4, B 0 Wanda Road Katella Avenue Santiago Boulevard (VP) 4U 5,800 4, F Yorba Street Fairhaven Avenue La Veta Avenue 4U 8,00 4, A Yorba Street La Veta Avenue Chapman Avenue 4U,400 4,000 A Deficient Segment, LOS E Deficient Segment, LOS F Note: * Katella Avenue capacity has been increased by 5% due to classification as a Smart Street. Source: Orange Traffic Analysis Model (OTAM 004) Figure 4. presents the No Project forecast average daily traffic (ADT) volumes for arterial segments and the forecast year 00 arterial level of service is presented in Figure 4.. Future Transportation Analysis 5
54 A I L L R Figure 4. - No Project Future Average Daily Traffic on Arterial Segments (in Thousands) ANAHEIM LEWIS ST ETROPOLITAN DR 7 4 THE CI GA RDEN GROV TY DR 6 4 E STATE COLLEGE BLVD 4 BL VD ORANGEWOOD AVE T 7 S 6 T BRISTOL ST R R M P A FLOWER ST 57 ECKHOFF ST STRUCK AVE DEVON RD 9 S A N T A MAIN ST A N A 4 8 BATAVIA ST 8 7 ALMOND AVE LAWSON WY M E M R O I V E R 5 R Y FLE TCHE R PARKER ST L N LEMON ST GLASSELL ST GRAND ST 0 R L INCOLN A V E ST IVERD ORANGE OLIVE RD MEATS AVE TAFT AVE SHAFFER ST LA VETA AVE A L E 47 HEIM AVE FAIRHAVEN AVE KATELLA AVE CAMBRIDGE ST A V WALNUT AVE SANTA ANA E COLLINS AVE PALM AVE PALMYRA AVE TUSTIN ST TAFT AVE HANDY ST R S A N T YORBA ST N O H L 8 9 ORANGE I A G O S ANTA ANA CANYON RD D L E A R WANDA RD CREE K V A R A NCH CHAPMAN AVE PROSPECT ST VILLA PARK VILLA PARK RD R D V I A 8 BOND AVE SPRING ST ESPLANADE ST E S C 7 O HEWES ST L A 4 M E S A RANCHO SANTIAGO BLVD D R C A NNO N S T ANAHEIM HILLS 6 TUSTIN ORANGE PARK BLVD S E R RANO AVE C A NY O 9 A SANT IAGO CANYON RD M A O N VIEW A V P B T N E WPOR L A L V D A 6 V E 8 E 4 6 LEGEND City of Orange Water Area Roadway Sphere of Influence Adjacent Cities Railroad J 0 9 A M B OR EE RD 6 6 Miles EAST ORANGE S T E E T 4 D Source File: Fig4--y0-NoProj-Artl-ADT map
55 D V S Figure 4. - No Project Future Arterial Daily Level of Service ANAHEIM STATE COLLEGE BLVD 57 A S A N T A N A R I V E R L INCOLN A VE FLETCHER ST GLASSELL ST BATAVIA ST 9 R I V E R D A L ORANGE OLIVE RD E A V E HEIM AVE MEATS AVE S ANTI AGO BL V D S A N T A AN A R D A L E N O H L I L L A R C ANYON RD R A NCH RD V I A 9 A E S C O L ME S A D R ANAHEIM HILLS S E R RANO AVE LEGEND City of Orange Water Area Roadway Sphere of Influence Adjacent Cities Railroad LOS A-D LOS E LOS F Miles MAIN ST TAFT AVE 55 TAFT AVE VILLA PARK VILLA PARK RD SANTIAGO CA NYON RD M E 5 LEWIS ST TROPOL ITAN GARDEN GROVE BLVD DR T H E C I T Y ORANGEWOOD AVE R RA MPART ST FLOWER ST BRISTOL ST ECKHOFF ST STRUCK AVE DEVON RD ALMOND AVE LAWSON WY M E M O R Y N L PARKER ST LEMON ST SHAFFER ST GRAND ST LA VETA AVE KATELLA AVE COLLINS AVE WALNUT AVE PALM AVE PALMYRA AVE CAMBRIDGE ST SANTA ANA TUSTIN ST 55 WANDA RD HANDY ST S A N T I A GO ORANGE CRE EK CHAPMAN AVE BOND AVE SPRING ST ESPLANADE ST PROSPECT ST YORBA ST FAIRHAVEN AVE HEWES ST RANCHO SANTIAGO ST CA NNO N S T C A TUSTIN ORANGE PARK BLVD N Y O N A M N A P O L I V E W E W P O R T A A B L V D V A V E E J A M B O R E E R D 6 EAST ORANGE T R E E T 4 D 4 5 Source File: Fig4--y0-NoProj-Artl-LOS map
56 4. No Project Future Intersection Peak Hour Conditions Table 4.4 presents No Project 00 forecast ICU and LOS results for turning movement volumes at the critical intersections during the morning (A.M.) and evening (P.M.) peak hours. Similar to the arterial segment volume forecast, turning movements for the intersections were post-processed from OTAM forecast volumes. Figure 4.4 illustrates No Project peak hour levels of service. The incorporation of existing MPAH improvement assumptions at arterials and ultimate intersection configurations at the critical intersections results in five study intersections forecast to operate at an unacceptable LOS in either the A.M. or the P.M. peak hour under No Project conditions. Of these, two intersections fail in both the A.M. as well as the P.M. peak hour: Cannon Street at Santiago Canyon Road Wanda Road at Villa Park Road Among the above listed intersections that are deficient, neither were deficient under existing conditions. Four of the five intersections that are deficient in either the A.M. or P.M. peak hour under No Project conditions operated at LOS D under existing conditions and hence had the potential of deteriorating to a deficient intersection in the future: Cannon Street at Santiago Canyon Road (LOS E in A.M. and P.M. peak hour) Southbound SR-55 Ramps at Katella Avenue (LOS E in A.M. peak hour) Wanda Road at Villa Park Road (LOS F in A.M. and LOS E in P.M. peak hour) Tustin Street at Lincoln Avenue (LOS F in P.M. peak hour) Appendix A and Appendix B present future lane geometrics and Existing and No Project ICU worksheets for the study intersections. 4.4 No Project Future Baseline Improvements This section presents No Project baseline improvement measures for the arterial segments that operate at an unacceptable LOS under daily conditions, and intersections that operate at an unacceptable LOS during either A.M. or P.M. peak hours. Generally, arterial segment performance is dictated by upstream and downstream intersection performance because the capacity of arterial segments is often constricted to what can filter through the intersections during the peak hours, therefore, mitigation is not necessarily proposed for each deficient arterial segment. Since arterial segment mitigation may not be warranted based on peak hour intersection operations, mitigation measures are generally applied to intersections to facilitate traffic flow throughout the roadway network during peak periods. An arterial that experiences LOS F likely warrants arterial capacity enhancement to ensure acceptable operations, however an arterial at LOS E is likely to operate at an acceptable LOS with acceptable operations of the upstream and downstream intersections. Therefore, for segments at the threshold of deficient operations, continued monitoring of the segment and adjacent intersections is recommended to identify if arterial capacity enhancements are required and immediate improvement measures are not proposed that result in a LOS that meets the LOS D threshold. A monitoring program would require evaluation at regular intervals, generally 5 years. The monitoring program would include collecting traffic count data for the arterial segment that has been identified as deficient under daily LOS conditions as well as peak hour intersection turning movement data at the major intersections at the endpoints and along the segment. Intersection ICU analysis must be performed to evaluate traffic performance in relation to the adopted LOS D threshold. Segment LOS should continue to be evaluated on a daily basis, but if intersection peak hour LOS is determined to meet City thresholds, arterial improvement is not recommended. If intersections are found to be deficient during peak hour conditions, intersection and/or segment improvement is warranted. Future Transportation Analysis 8
57 Table 4.4 No Project Intersection Level of Service City of Orange: Circulation Element Traffic Analysis A.M. Peak Hour P.M. Peak Hour ID Intersection Location ICU LOS ICU LOS Batavia Collins Avenue 6 A 0.76 C Batavia Katella Avenue 0.65 B 0.7 C Batavia Lincoln Avenue 9 A 0.7 C 4 Batavia Taft Avenue 0.68 B 0.7 C 5 Batavia Walnut Avenue 0.6 B 5 A 6 Cambridge Katella Avenue 9 A 0.7 C 7 Cannon Santiago Canyon Road 0.9 E 0.96 E 8 Cannon Serrano Avenue 0.97 E 0.89 D 9 Cannon Street/ Crawford Chapman Avenue 0.75 C 0.70 B 0 Yorba Chapman Avenue 0.76 C 0.67 B Canyon View Chapman Avenue 0.6 B 0.46 A Jamboree Chapman Avenue 0.85 D 0.87 D Northbound SR-55 Chapman Avenue 0.74 C 0.67 B 4 Southbound SR-55 Chapman Avenue 0.66 B 0.6 B 5 Lewis Chapman Avenue 9 A 0.65 B 6 The City Chapman Avenue 0.65 B 0.80 C 7 The City Eastbound SR- Ramps 0.6 B 0.70 B 8 The City Westbound SR- Ramps A 0. A 9 Glassell Collins Avenue 0.6 B 0.68 B 0 Glassell Katella Avenue 9 A 0.77 C Glassell La Veta Avenue 0.78 C 0.75 C Glassell Lincoln Avenue 9 A 0.86 D Glassell Taft Avenue 0.68 B 0.7 C 4 Glassell Walnut Avenue 0.4 A A 5 Hewes Chapman Avenue 0.77 C 0.70 B 6 Northbound SR-55 Katella Avenue 0.75 C 0.86 D 7 Southbound SR-55 Katella Avenue 0.96 E 0.89 D 8 Main Chapman Avenue 9 A 0.7 C 9 Main Katella Avenue 5 A 0.67 B 0 Main La Veta Avenue 0.60 A 0.78 C Main Orangewood Avenue 8 A A Main Taft Avenue 5 A 0.70 B Main Town & Country Road 0.45 A 0.80 C 4 Newport Chapman Avenue 0.74 C 0.90 D 5 Santiago Nohl Ranch Road 0.70 B 0.75 C 6 Eckhoff Orangewood Avenue 0.44 A A 7 State College Orangewood Avenue A 0.6 B 8 Prospect Chapman Avenue 0.88 D 0.85 D 9 Prospect Walnut Avenue 0.85 D 0.85 D 40 Santiago Meats Avenue 0.85 D 0.70 B 4 Wanda Villa Park Road. F 0.9 E 4 Tustin Chapman Avenue 0.7 C 0.89 D 4 Tustin Collins Avenue A 0.60 A 44 Tustin Fairhaven Avenue 0.85 D 0.7 C 45 Tustin Heim Avenue 6 A 0.84 D 46 Tustin Katella Avenue 0.65 B 0.87 D 47 Tustin La Veta Avenue 0.70 B 7 A 48 Tustin Lincoln Avenue 0.89 D.04 F 49 Tustin Meats Avenue 0.45 A 0.68 B 50 Tustin Taft Avenue (North) 7 A 0.76 C 5 Tustin Taft Avenue (South) 0.69 B 0.79 C 5 Tustin Walnut Avenue 0.67 B 0.74 C 55 Struck Katella Avenue 0.0 A 0.7 A 56 Main Struck Avenue 0.87 D A 57 Main Collins Avenue 0.6 B 0.88 D Future Transportation Analysis 9

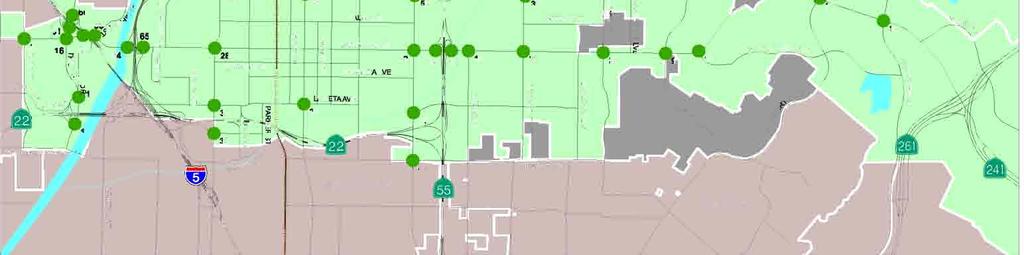
58
59 Table 4.4 ID Intersection Location No Project Intersection Level of Service (continued) City of Orange: Circulation Element Traffic Analysis A.M. Peak Hour P.M. Peak Hour ICU LOS ICU LOS 58 Southbound SR-57 Orangewood Avenue 0.70 B 0.74 C 59 Northbound SR-57 Orangewood Avenue 0.4 A 0.7 A 60 State College NB I-5 Ramps/Anaheim Way 0.4 A 0.4 A 6 State College Southbound I-5 Ramps 0.44 A 0.0 A 6 Southbound I-5 Chapman Avenue 0.49 A A 6 Rampart Chapman Ave./ NB I-5 Ramps A 0 A 64 Southbound SR-57 Chapman Avenue 7 A 0.7 C 65 Northbound SR-57 Chapman Avenue 0.4 A 0.46 A Deficient Intersection, LOS E Deficient Intersection, LOS F Source: Orange Traffic Analysis Model (OTAM 004) Improvement measures are intended to ensure acceptable operations of deficient segments or intersections. Typical improvement measures for arterial segments include widening or lane/median restriping to allow for additional capacity to serve future traffic demands. Removal of on-street parking may be another strategy to increase capacity, although this particular strategy often may not be feasible for policy-related reasons. Typical intersection improvement measures include intersection widening to add capacity through additional turn or through lanes. Additional improvement measures for intersections include re-striping existing turning movement configurations to allow for more capacity for critical movements. Critical movements are the movements on the intersection approaches that generally have high volumes and result in deficient intersection operations. Advanced Transportation Management Systems (ATMS) are components that are implemented to maximize intersection capacity without physical capacity to intersections. ATMS strategies typically include revised signalization and signal coordination to increase throughput through a corridor. ATMS strategies generally increase capacity by five percent, therefore, a 0.05 V/C ratio credit will be applied to intersections where these strategies may be recommended. Application of the arterial and intersection improvement measures can potentially result in the following adverse impacts to the local community: Right-of-way acquisition requirements Right-of-way impacts Structure impacts Residential impacts and potential displacement Commercial impacts and potential displacement Local circulation access impacts Construction-related impacts Bridge and structure widening Historic feature disturbance Pedestrian and bicycle path displacement Transit operations impacts Earthwork requirements Specific evaluation of each proposed improvement measure is required prior to implementation to ensure the improvement is appropriate and commensurate with the expected adverse community impacts associated with implementation. Table 4.5 presents recommended arterial improvement measures for the deficient segments within Orange under No Project MPAH 00 Buildout conditions. Many of the arterial deficiencies occur at freeway interchanges as traffic filters through the City and onto the regional transportation system. Chapman Avenue through the SR-55 interchange is forecast to exceed daily capacity thresholds. Advance Traffic Management System strategies, such as signal coordination, is also recommended for the Chapman Avenue corridor. Future Transportation Analysis 4
60 Chapman Avenue between SR-55 and Yorba Street is recommended to be improved to a 0-lane facility based on forecast future traffic volumes. This is a very short segment and from an operational perspective currently has a 9-lane cross-section. From a planning perspective, the eastbound auxiliary lane is not considered as a through lane, hence the 8-lane segment is forecast to operate at LOS F. Widening this segment may impact the school property along the southern portion of this short segment and the hospital parking along the northern portion of this segment. Intersection improvements at Chapman Avenue and Yorba Street would also likely be required for this improvement. Between Yorba Street and Prospect Street, future forecast volumes specify an 8-lane facility is required. This improvement would be very costly and have significant retail, office, medical facility, and residential rightof-way impacts. Accessibility to fronting retail could also be impacted by implementation of this improvement measure. Between Prospect Street and Esplanade Street, a geometric improvement is not recommended. The future forecast LOS is right at the deficient threshold and, as noted previously, improved intersection operations along this segment would likely lead to acceptable performance levels along the segment. Chapman Avenue east of SR-55 should continually be monitored and operational improvements incorporated as appropriate to maintain mobility through this key corridor. The segment of Chapman Avenue to Canyon View Avenue operates at LOS F and improvement to a 6-lane facility would improve the LOS to acceptable levels. Widening this short segment may require earthwork but it is likely that property impacts would be minimal. Lincoln Avenue between Tustin Street and Santiago Boulevard is forecast to operate just over the deficient threshold. As a result of the LOS and the significant cost to add capacity under SR-55, it is not recommended to implement mitigation measures for this arterial segment. Although Prospect Street between Chapman Avenue and Walnut Avenue and Wanda Road between Katella Avenue and Santiago Boulevard are labeled as 4-lane undivided secondary facilities, they operate as a 4-lane divided primary facility since the entirety of the segments either include a two-way left turn lane or a raised median. The classification for these segments could be correctly revised to identify as primary facilities. Table 4.5 No Project Future Arterial Baseline Improvement Recommendations ID Arterial From To MPAH Lanes 00 ADT LOS E Capacity V/C Ratio LOS Improvement Measure 5 Chapman Avenue SR-55 Yorba Street 8D 78,700 75, F Widen to 0-lane facility 6 Chapman Avenue Yorba Street Prospect Street 6D 65,00 56,00.6 F Widen to 8-lane facility 7 Chapman Avenue Prospect Street Esplanade Street 6D 5,00 56, E Monitor upstream and downstream intersections to evaluate need for widening segment 40 Chapman Avenue Crawford Cyn Rd. Canyon View Avenue 4D 8,00 7,500.0 F Widen to 6-lane facility 6 Lincoln Avenue Tustin Street Santiago Boulevard 6D 5,500 56, E Monitor upstream and downstream intersections to evaluate need for widening segment 5 Prospect Street Chapman Avenue Spring Street 4U 4,400 4,000.0 F Classify as 4-lane divided facility 54 Prospect Street Spring Street Walnut Avenue 4U,400 4, E Classify as 4-lane divided facility 0 Wanda Road Katella Avenue Santiago Boulevard 4U 5,800 4, F Classify as 4-lane divided facility Deficient Segment, LOS E Deficient Segment, LOS F Arterial Segment Level of Service With Improvement Measure Implementation 5 Chapman Avenue SR-55 Yorba Street 0D 78,700 94, D 6 Chapman Avenue Yorba Street Prospect Street 8D 65,00 75, D 7 Chapman Avenue Prospect Street Esplanade Street 6D 5,00 56, E 40 Chapman Avenue Crawford Cyn Rd. Canyon View Avenue 6D 8,00 56, B 6 Lincoln Avenue Tustin Street Santiago Boulevard 6D 5,500 56, E 5 Prospect Street Chapman Avenue Spring Street 4D 4,400 7, B 54 Prospect Street Spring Street Walnut Avenue 4D,400 7, B 0 Wanda Road Katella Avenue Santiago Boulevard 4D 5,800 7, B Recommended improvement measures for deficient intersections within Orange are presented in Table 4.6. Five intersections are forecast to operate at a deficient level of service under Future No Project conditions. Generally, intersection improvement measures proposed include capacity enhancements and Future Transportation Analysis 4
61 P Westbound P Westbound ID City of Orange: Circulation Element Traffic Analysis application of ATMS measures to allow traffic to flow through the intersection more efficiently. ICU worksheets for the recommended No Project improvement measures are included in Appendix C. Since the Cannon Santiago Canyon Road intersection operates just above the allowable threshold, it is recommended to apply ATMS strategies at this location to maximize operational capacity and throughput of the intersection. The recommended improvement for the Cannon Serrano Avenue intersection requires minimal work on the westbound approach of Serrano Avenue but requires Cannon Street to be widened in the southbound direction to accommodate a triple left turn lane. Impacts to residences would be required to implement this improvement measure. The recommended improvement to add a second westbound left turn lane for the Katella SR- 55 southbound ramps intersection may result in impacts and potential bridge reconstruction to provide an additional turn lane onto southbound SR-55 under the existing freeway. The cost and construction impacts may be prohibitive to implementation of this improvement measure. The Wanda Villa Park Road requires additional capacity for the westbound and northbound movements. This is currently a very tight intersection with little room for future expansion. The northbound right turn lane could potentially be implemented, although right-of-way acquisition and significant earthwork may be required. Increased capacity in the westbound direction would likely impact fronting single and multi-family residences located adjacent to the right-of-way. The Tustin Lincoln Avenue intersection is constrained by restaurant and gas station/retail uses fronting on the western side of the intersection and the SR-55 under-crossing on the eastern side of the intersection. This improvement would potentially require significant right-of-way acquisition and bridge replacement/construction costs and, as a result, may be considered infeasible. Table 4.6 No Project Future Intersection Baseline Improvement Recommendations Intersection Location A.M. Peak Hour P.M. Peak Hour ICU LOS ICU LOS Improvement Measure 7 Cannon Santiago Canyon Road 0.9 E 0.96 E Apply ATMS to enhance capacity 0.97 E 0.89 D Restripe Westbound Approach to Left Turn Lanes and 8 Cannon Serrano Avenue shared Left-Right Lane 7 Southbound SR-55 Katella Avenue 0.96 E 0.89 D Add P Left Turn Lane rd. F 0.9 E Add P Through Lane, Add Northbound 4 Wanda Villa Park Road Right Turn Lane, Apply ATMS to enhance capacity 0.89 D.04 F Add rd Eastbound and Westbound Through Lane, Add 48 Tustin Lincoln Avenue nd Eastbound Right Turn Lane Deficient Intersection, LOS E Deficient Intersection, LOS F Intersection Level of Service with Improvement Measure Implementation A.M. Peak ID Intersection Location Hour P.M. Peak Hour ICU LOS ICU LOS 7 Cannon Santiago Canyon Road 0.87 D 0.90 D 8 Cannon Serrano Avenue 0.90 D 0.89 D 7 Southbound SR-55 Katella Avenue 0.74 C 0.77 C 4 Wanda Villa Park Road 0.88 D 0.80 C 48 Tustin Lincoln Avenue 0.67 B 0.84 D nd Future Transportation Analysis 4
62 4.5 Project Future Daily Conditions Sections 4.5 and 4.6 present 00 traffic conditions under buildout of the existing City MPAH with minor circulation system improvements assuming buildout of the proposed General Plan land uses. This scenario, referred to as the Project Scenario, represents a more realistic future base network as it incorporates the following deviations from the Existing MPAH: Cambridge Street, Katella Avenue to South City Limits maintain existing -lane configuration Chapman Avenue, Lemon Street to Grand Street maintain existing -lane configuration Walnut Avenue, Main Street to Prospect Street maintain existing -lane configuration Glassell Street, Almond Avenue to Palm Avenue maintain existing -lane configuration Implementation of a full-diamond interchange at Meats Avenue/SR-55 These arterial facilities are residential collectors or located in the Orange Plaza; hence, improvements to them are unlikely due to political, historical, residential, right-of-way, and environmental issues, among others. As there are no plans to widen these arterials to four-lane facilities as specified in the current City MPAH and the City desires to retain the existing configurations on these facilities, the Project Scenario incorporates these network revisions. One caveat to the future roadway network is that even though the analysis shows the current two-lane configuration for Chapman Avenue and Glassell Street through the Orange Plaza the City and County MPAH will continue to maintain the four-lane classification for these segments. A full diamond interchange at SR-55 and Meats Avenue was also incorporated into the Project Scenario and Alternative. The Meats Avenue interchange with SR-55 has the potential to relieve the congestion experienced at the SR-55 and Lincoln Avenue/Nohl Ranch Road and Katella Avenue interchanges. Post-processed year 00 forecast daily arterial volumes for the Project are reported in Table 4.7 with corresponding daily V/C ratio and LOS. Listed below are arterial segments that are forecast to operate at an unacceptable LOS in 00 under Project conditions: Batavia Street o Walnut Avenue to Collins Avenue o Collins Avenue to Katella Avenue o Taft Avenue to Fletcher Avenue o Fletcher Avenue to Lincoln Avenue Chapman Avenue o Lemon Street to Glassell Street o Glassell Street to Grand Street o SR-55 to Yorba Street o Yorba Street to Prospect Street (LOS E under existing conditions) o Crawford Canyon Road/Cannon Street to Canyon View Avenue Collins Avenue o Batavia Street to Glassell Street o Cambridge Street to Tustin Street Glassell Street o SR- to La Veta Avenue o Chapman Avenue to Palm Avenue (LOS F under existing conditions) o Katella Avenue to Orange Olive Road Katella Avenue o Struck Avenue to Main Street o Main Street to Batavia Street o Batavia Street to Glassell Street o Glassell Street to Cambridge Street Main Street o Town & Country Road to La Veta Avenue Meats Avenue Future Transportation Analysis 44
63 o Tustin Street to SR-55 o SR-55 to Santiago Boulevard Prospect Street o Chapman Avenue to Spring Street o Spring Street to Walnut Avenue Taft Avenue o West City Limit to Main Street (LOS E under existing conditions) Wanda Road o Katella Avenue to Santiago Boulevard City of Orange: Circulation Element Traffic Analysis The evaluation of Chapman Avenue and Glassell Street at their existing classifications as two-lane undivided facilities rather than the existing MPAH buildout conditions of four-lane divided facilities through the Orange Plaza results in these segments operating at unacceptable daily LOS. However, the reduction of Walnut Avenue and Cambridge Street to two-lane facilities does not result in any deterioration of the level of service as traffic demands have shifted to parallel facilities with excess capacity. Figure 4.5 presents 00 Project post-processed forecast average daily traffic (ADT) volumes for arterial segments and the 00 Project arterial level of service is presented in Figure 4.6. Table 4.7 indicates that the Meats Avenue interchange increases forecast traffic activity along Meats Avenue, resulting in an unacceptable daily LOS. Meats Avenue is currently classified as a four-lane undivided facility and improving Meats Avenue would be required to ensure acceptable operations. Implementation of the Meats Avenue interchange improves operations at the Chapman Avenue/SR-55 interchange and the surrounding arterial segments and intersections. Specifically, the southbound left turn volume and corresponding westbound right turn volumes at Tustin Street/Katella Avenue experience a reduction with the implementation of the Meats Avenue interchange. Future Transportation Analysis 45
64 Table 4.7 Project Future Arterial Daily Level of Service ID Arterial From To MPAH Lanes 00 ADT LOS E Capacity Almond Avenue Main Street Batavia Street U 7,00, A Almond Avenue Batavia Street Glassell Street U 5,500, A Almond Avenue Glassell Street Grand Street U 6,00,000 A 4 Almond Avenue Grand Street Cambridge Street U,400, A 5 Batavia Street La Veta Avenue Almond Avenue 4U,00 4,000 A 6 Batavia Street Almond Avenue Chapman Avenue 4U 5,500 4, B 7 Batavia Street Chapman Avenue Walnut Avenue 4U 0,00 4, D 8 Batavia Street Walnut Avenue Collins Avenue 4U,00 4, E 9 Batavia Street Collins Avenue Katella Avenue 4U,00 4, E 0 Batavia Street Katella Avenue Taft Avenue 4U,500 4, D Batavia Street Taft Avenue Fletcher Avenue 4U,800 4, E Batavia Street Fletcher Avenue Lincoln Avenue 4U,900 4, E Bond Avenue Prospect Street Hewes Street 4U 8,00 4, A 4 Cambridge Street South City Limits Palmyra Avenue U 7,700, B 5 Cambridge Street Palmyra Avenue Chapman Avenue U 8,600, C 6 Cambridge Street Chapman Avenue Palm Avenue U 8,400, B 7 Cambridge Street Palm Avenue Walnut Avenue U 7,700, B 8 Cambridge Street Walnut Avenue Collins Avenue U 8,000, B 9 Cambridge Street Collins Avenue Katella Avenue U 8,400, B 0 Cambridge Street Katella Avenue Taft Avenue 4U,800 4, A Cambridge Street Taft Avenue Meats Avenue 4U 7,00 4, A Canyon View Avenue Chapman Avenue Outrider Street 4D 6,400 7, A Canyon View Avenue Outrider Street Newport Boulevard 4D 6,00 7, A 4 Canyon View Avenue Newport Boulevard Jamboree Road 4D 5,700 7, A 5 Chapman Avenue Haster Street Lewis Street 5D,600 46, C 6 Chapman Avenue Lewis Street Manchester Avenue 6D 5,700 56, B 7 Chapman Avenue Manchester Avenue The City Drive 6D 40,00 56, C 8 Chapman Avenue The City Drive Eckhoff Street 6D 4,600 56, C 9 Chapman Avenue Eckhoff Street Main Street 6D 4,700 56, B 0 Chapman Avenue Main Street Batavia Street 4D,800 7, B Chapman Avenue Batavia Street Lemon Street 4D 0,700 7,500 5 A Chapman Avenue Lemon Street Glassell Street U,500, F Chapman Avenue Glassell Street Grand Street U,600, F Chapman Avenue Grand Street Cambridge Street 4D 5,00 7, B Chapman Avenue Cambridge Street Tustin Street 4D 8,400 7, C 4 Chapman Avenue Tustin Street SR-55 6D 50,00 56, D 5 Chapman Avenue SR-55 Yorba Street 8D 75,00 75, F 6 Chapman Avenue Yorba Street Prospect Street 6D 6,600 56,00. F 7 Chapman Avenue Prospect Street Esplanade Street 6D 50,900 56, D 8 Chapman Avenue Esplanade Street Hewes Street 6D 47,00 56, D 9 Chapman Avenue Hewes Street Crawford Canyon Road 6D 4,00 56, C 40 Chapman Avenue Crawford Canyon Road Canyon View Avenue 4D 9,700 7, F 4 Chapman Avenue Canyon View Avenue Orange Park Boulevard 4D,400 7, D 4 Chapman Avenue Orange Park Boulevard Newport Boulevard 4D 7,600 7, C 4 Chapman Avenue Newport Boulevard Jamboree Road 6D 48,00 56, D 44 Chapman Avenue Jamboree Road City Limit 6D 4,600 56, C 45 Collins Avenue Eckhoff Street Main Street 4U 4,900 4, B 46 Collins Avenue Main Street Batavia Street 4U 8,00 4, C 47 Collins Avenue Batavia Street Glassell Street 4U,000 4, E 48 Collins Avenue Glassell Street Cambridge Street 4U 7,800 4, C Deficient Segment, LOS E Deficient Segment, LOS F V/C Ratio LOS Future Transportation Analysis 46
65 Table 4.7 Project Future Arterial Daily Level of Service (continued) ID Arterial From To MPAH Lanes 00 ADT LOS E Capacity 49 Collins Avenue Cambridge Street Tustin Street 4U,900 4, E 50 Collins Avenue Tustin Street Handy Street 4U 6,000 4, B 5 Collins Avenue Handy Street Wanda Road 4U 5,00 4, B 5 Collins Avenue Wanda Road Prospect Street 4U 0,00 4, D 5 Crawford Canyon Road Barrett Avenue Chapman Avenue 4U 7,00 4, C 54 Cannon Street Chapman Avenue Creekside Avenue 4U,000 4,000 4 A 55 Cannon Street Creekside Avenue Patria Court 4U 8,700 4, A 56 Cannon Street Patria Court Santiago Canyon Road 4U 8,500 4,000 A 57 Cannon Street Santiago Canyon Road Taft Avenue 6D 46,600 56, D 58 Cannon Street Taft Avenue Via Escola 6D,000 56,00 9 A 59 Eckhoff Street Chapman Avenue Sycamore Avenue U 5,500, A 60 Eckhoff Street Orangewood Avenue Collins Avenue 4U 9,500 4, D 6 Esplanade Street Fairhaven Avenue La Veta Avenue 4U,500 4,000 A 6 Esplanade Street La Veta Avenue Chapman Avenue 4U 7,500 4, A 6 Fairhaven Avenue Glassell Street Cambridge Street 4U 0,00 4, A 64 Fairhaven Avenue Cambridge Street Tustin Street 4U 0,000 4, A 65 Fairhaven Avenue Tustin Street Yorba Street 4U 5,600 4, B 66 Fairhaven Avenue Yorba Street Prospect Street 4U 4,700 4, B 67 Fairhaven Avenue Prospect Street Esplanade Street 4U,500 4,000 6 A 68 Fairhaven Avenue Esplanade Street Hewes Street 4U,000 4,000 0 A 69 Fletcher Avenue Batavia Street Glassell Street 4U 7,600 4, A 70 Garden Grove Boulevard The City Drive Lewis Street 4D,000 7,500 9 A 7 Glassell Street SR- La Veta Avenue 4D 4,600 7, E 7 Glassell Street La Veta Avenue Almond Avenue 4D 7,600 7, A 7 Glassell Street Almond Avenue Chapman Avenue U 0,000, D 74 Glassell Street Chapman Avenue Palm Avenue U,900, E 75 Glassell Street Palm Avenue Collins Avenue 4D 6,700 7, A 76 Glassell Street Collins Avenue Katella Avenue 4D 5,000 7, B 77 Glassell Street Katella Avenue Orange Olive Road 4D 7,700 7,500.0 F 78 Glassell Street Orange Olive Road Grove Avenue 4D,500 7,500 7 A 79 Glassell Street Grove Avenue Lincoln Avenue 4D 9,600 7, C 80 Glassell Street Lincoln Avenue Santa Ana River 4D 9,500 7, C 8 Grand Street La Veta Avenue Palmyra Avenue U 9,000, C 8 Grand Street Almond Avenue Chapman Avenue U 0,000, D 8 Grand Street Chapman Avenue Maple Avenue U 5,700, A 8 Hewes Street Fairhaven Avenue Washington Avenue 4U 7,500 4, A 8 Hewes Street Washington Avenue Chapman Avenue 4U,000 4, A 84 Hewes Street Chapman Avenue Walnut Avenue 4U,600 4,000 A 85 Hewes Street Bond Avenue Santiago Canyon Road 4U 0,00 4, A 86 Jamboree Road Santiago Canyon Road Chapman Avenue 6D 0,500 56,00 4 A 87 Jamboree Road Chapman Avenue Canyon View Avenue 6D 0,500 56,00 4 A 88 Jamboree Road Canyon View Avenue South City Limit 6D 4,00 56, B 89 Katella Avenue* Struck Avenue Main Street 6D SS 56,500 59, E 90 Katella Avenue* Main Street Batavia Street 6D SS 55,00 59,5 0.9 E 9 Katella Avenue* Batavia Street Glassell Street 6D SS 5,700 59,5 0.9 E 9 Katella Avenue* Glassell Street Cambridge Street 6D SS 54,500 59,5 0.9 E 9 Katella Avenue* Cambridge Street Tustin Street 6D SS 49,900 59, D 94 Katella Avenue* Tustin Street SR-55 7D SS 54,600 68, C 95 Katella Avenue SR-55 Handy Street 6D 47,00 56, D 96 Katella Avenue Handy Street Wanda Road 6D 4,900 56, C Deficient Segment, LOS E Deficient Segment, LOS F V/C Ratio LOS Future Transportation Analysis 47
66 Table 4.7 Project Future Arterial Daily Level of Service (continued) ID Arterial From To City of Orange: Circulation Element Traffic Analysis MPAH Lanes 00 ADT LOS E Capacity 97 Katella Avenue Wanda Road Center Drive 6D 40,00 56, C 98 Katella Avenue Center Drive Santiago Canyon Road 6D 8,00 56, B 99 La Veta Avenue Flower Street Devon Street 6D,000 56,00 9 A 00 La Veta Avenue Devon Street Main Street 6D 9,600 56,00 A 0 La Veta Avenue Main Street Batavia Street 6D 7,700 56, B 0 La Veta Avenue Batavia Street Glassell Street 4D 0,600 7,500 5 A 0 La Veta Avenue Glassell Street Shaffer Street 4U,00 4, A 04 La Veta Avenue Shaffer Street Cambridge Street 4U 8,400 4,000 A 05 La Veta Avenue Tustin Street Yorba Street 4U,000 4, A 06 La Veta Avenue Yorba Street Prospect Street 4U 0,400 4, A 07 La Veta Avenue Prospect Street Esplanade Street 4U 8,500 4,000 A 08 Lemon Street La Veta Avenue Palmyra Avenue U 8,000, B 08 Lemon Street Chapman Avenue Maple Avenue U 8,400, B 08 Lemon Street Maple Avenue Walnut Avenue U,000, A 09 Lewis Street Garden Grove Avenue Metropolitan Drive 4U 7,00 4, C 0 Lewis Street Metropolitan Drive Chapman Avenue 4U 8,600 4, C Lewis Street Chapman Avenue Sirius Avenue 4U,400 4,000 A Lincoln Avenue West City Limit Batavia Street 6D 40,00 56, C Lincoln Avenue Batavia Street Glassell Street 6D,000 56,00 7 A 4 Lincoln Avenue Glassell Street Orange Olive Road 6D,500 56,00 8 A 5 Lincoln Avenue Orange Olive Road Tustin Street 6D 45,000 56, C 6 Lincoln Avenue Tustin Street Santiago Boulevard 6D 4,900 56, C 7 Main Street Town & Country Road La Veta Avenue 6D 55,500 56, E 8 Main Street La Veta Avenue Chapman Avenue 6D 48,500 56, D 9 Main Street Chapman Avenue Sycamore Avenue 6D 6,400 56, B 0 Main Street Sycamore Avenue Collins Avenue 6D 9,900 56, C Main Street Collins Avenue Struck Avenue 4D 5,00 7, B Main Street Struck Avenue Katella Avenue 4D 6,800 7, C Main Street Katella Avenue Taft Avenue 4D,500 7, A 4 Meats Avenue Glassell Street Orange Olive Road 4U,800 4,000 A 5 Meats Avenue Orange Olive Road Cambridge Street 4U 8,00 4, C 6 Meats Avenue Cambridge Street Tustin Street 4U,500 4, D 7 Meats Avenue Tustin Street SR-55 SB Ramps 4U 5,00 4,000. F 7 Meats Avenue SR-55 SB Ramps SR-55 NB Ramps 4U 45,500 4, F 7 Meats Avenue SR-55 NB Ramps Santiago Boulevard 4U,900 4,000.7 F 8 Meats Avenue Santiago Boulevard Featherhill Road 4U 5,700 4, B 9 Meats Avenue Featherhill Road Via Escola 4U 8,00 4, A 0 Metropolitan Drive Lewis Street SR- Westbound Ramps 4U 9,400 4, A Metropolitan Drive SR- Westbound Ramps The City Drive 4U 9,00 4, C Metropolitan Drive The City Drive Chapman Avenue 4U,00 4, D Manchester Avenue Chapman Avenue Compton Avenue 4D 0,900 7, A Newport Boulevard South City Limits Canyon View Avenue 4D 9,000 7, A 4 Newport Boulevard Canyon View Avenue Chapman Avenue 4D 7,800 7, A 5 Newport Boulevard Chapman Avenue Santiago Canyon Road 4D 4,700 7, A 6 Nohl Ranch Road Santiago Boulevard East City Limit 4U,00 4, A 7 Orange Olive Road Glassell Street Meats Avenue 4U 9,500 4, D 8 Orange Olive Road Meats Avenue Lincoln Avenue 4U 7,000 4, C 9 Orange Olive Road Lincoln Avenue Santa Ana Canyon Road 4U 5,00 4, B 40 Orange Olive Road Santa Ana Canyon Road Riverdale Avenue 4U,000 4, A 4 Orangewood Avenue Eckhoff Street Main Street 6D 40,500 56, C 4 Palm Avenue Main Street Batavia Street U 4,600, A 4 Palm Avenue Batavia Street Cypress Street U 7,800, B 44 Palm Avenue Cypress Street Glassell Street U 7,400, B Deficient Segment, LOS E Deficient Segment, LOS F V/C Ratio LOS Future Transportation Analysis 48
67 Table 4.7 Project Future Arterial Daily Level of Service (continued) ID Arterial From To MPAH Lanes Future Transportation Analysis ADT LOS E Capacity 45 Palm Avenue Glassell Street Cambridge Street U 5,00, A 46 Palm Avenue Cambridge Street Tustin Street U 7,800, B 47 Palmyra Avenue Batavia Street Glassell Street U,000,000 A 48 Palmyra Avenue Glassell Street Cambridge Street U,900, A 49 Palmyra Avenue Cambridge Street Tustin Street U 5,400, A 50 Parker Street La Veta Avenue Town & Country Road 4U 9,500 4, D 5 Prospect Street Fairhaven Avenue La Veta Avenue 4U 0,700 4, A 5 Prospect Street La Veta Avenue Chapman Avenue 4U,400 4,000 6 A 5 Prospect Street Chapman Avenue Spring Street 4U,000 4, E 54 Prospect Street Spring Street Walnut Avenue 4U,00 4, E 55 Prospect Street Walnut Avenue Bond Avenue 4U 7,400 4, C 56 Rampart Street Chapman Avenue Orangewood Avenue 4U 9,00 4, C 57 Rancho Santiago Boulevard Chapman Avenue Walnut Avenue U 8,00, B 58 Rancho Santiago Boulevard Hewes Street Bond Avenue U,00, A 59 Riverdale Avenue Glassell Street Orange Olive Road 4U 6,000 4,000 A 60 Riverdale Avenue Orange Olive Road Tustin Street 4U 8,900 4, A 6 Santiago Boulevard North City Limit Nohl Ranch Road 6D 7,600 56,00 0. A 6 Santiago Boulevard Wanda Road Taft Avenue 4U 7,00 4, C 6 Santiago Boulevard Taft Avenue Villa Real Drive 4U,00 4,000 A 64 Santiago Boulevard Villa Real Drive Lincoln Avenue 4U,900 4,000 8 A 65 Santiago Canyon Road Hewes Street Cannon Street 6D 40,500 56, C 66 Santiago Canyon Road Cannon Street Orange Park Boulevard 6D 48,600 56, D 67 Santiago Canyon Road Orange Park Boulevard Meads Avenue 6D 4,000 56, C 68 Santiago Canyon Road Meads Avenue Newport Boulevard 6D 4,00 56, C 69 Santiago Canyon Road Newport Boulevard Jamboree Road 6D 0,00 56,00 4 A 70 Santiago Canyon Road Jamboree Road Street D 6D 4,600 56, C 4 Santiago Canyon Road Street D SR-4 6D 7,000 56, A Santiago Canyon Road East of SR-4 4D 4,000 7, B 7 Serrano Avenue Cannon Street Orange Park Boulevard 4D,00 7, B 7 Serrano Avenue Orange Park Boulevard Apache Creek 4D 0,000 7,500 A 7 Serrano Avenue Apache Creek East City Limit 4D,800 7, A 74 Shaffer Street La Veta Avenue Palmyra Avenue U,000, A 74 Shaffer Street Chapman Avenue Maple Avenue U 5,700, A 74 Shaffer Street Palm Avenue Walnut Avenue U 7,000,000 8 A 74 Shaffer Street Walnut Avenue Collins Avenue U 0,600, D 744 Shaffer Street Collins Avenue Katella Avenue U 7,000,000 8 A 75 Spring Street Prospect Street Olympia Way 4U 4,000 4,000 8 A 76 Struck Avenue Katella Avenue Main Street U 9,00, C 77 Taft Avenue West City Limit Main Street 6D 56,400 56,00.00 F 78 Taft Avenue Main Street Batavia Street 6D 6,700 56, B 79 Taft Avenue Batavia Street Glassell Street 6D 4,00 56, B 80 Taft Avenue Glassell Street Cambridge Street 6D 5,00 56, A 8 Taft Avenue Cambridge Street Tustin Street 6D,600 56, A 8 Taft Avenue Tustin Street Santiago Boulevard 4U 5,000 4, B 8 Taft Avenue Cannon Street Yurok Street U 8,00, B 84 The City Drive Garden Grove Boulevard SR- 6D 6,000 56, B 85 The City Drive SR- Metropolitan 6D 46,400 56, D 86 The City Drive Metropolitan Chapman Avenue 8D 5,600 75, A 87 The City Drive Chapman Avenue North City Limits 8D 5,500 75, A 88 Town & Country Road Main Street SR- 4D 7,700 7, C 89 Town & Country Road SR- Parker Street 4D 5,00 7, A 90 Tustin Street Fairhaven Avenue La Veta Avenue 6D 8,400 56, B 9 Tustin Street La Veta Avenue Palmyra Avenue 6D,500 56,00 8 A 9 Tustin Street Palmyra Avenue Chapman Avenue 6D 4,000 56, A Deficient Segment, LOS E Deficient Segment, LOS F V/C Ratio LOS
68 Table 4.7 Project Future Arterial Daily Level of Service (continued) ID Arterial From To MPAH Lanes 00 ADT LOS E Capacity V/C Ratio LOS 9 Tustin Street Chapman Avenue Walnut Avenue 6D 49,00 56, D 94 Tustin Street Walnut Avenue Mayfair Avenue 6D 4,700 56, C 95 Tustin Street Mayfair Avenue Collins Avenue 6D 40,00 56, C 96 Tustin Street Collins Avenue Katella Avenue 6D 50,900 56, D 97 Tustin Street Katella Avenue Taft Avenue 6D 4,000 56, C 98 Tustin Street Taft Avenue Meats Avenue 6D 9,900 56, C 99 Tustin Street Meats Avenue Lincoln Avenue 6D 7,000 56, B 00 Tustin Street Lincoln Avenue Santa Ana Canyon Road 6D 8,400 56,00 0 A 0 Via Escola Meats Avenue Cannon Street 4U 4,00 4, A 0 Villa Real Drive Santiago Boulevard Chapel Hill U,800,000 A 0 Walnut Avenue Main Street Batavia Street U 8,700, C 04 Walnut Avenue Batavia Street Cypress Street U 9,400, C 05 Walnut Avenue Cypress Street Glassell Street U 9,600, C 06 Walnut Avenue Glassell Street Cambridge Street U 8,00, B 07 Walnut Avenue Cambridge Street Tustin Street U 9,00, C 08 Walnut Avenue Tustin Street Handy Street U 0,500, D 09 Wanda Road Collins Avenue Katella Avenue 4U 5,00 4, B 0 Wanda Road Katella Avenue Santiago Boulevard (VP) 4U 7,800 4,000.6 F Yorba Street Fairhaven Avenue La Veta Avenue 4U 7,800 4, A Yorba Street La Veta Avenue Chapman Avenue 4U,900 4,000 0 A Deficient Segment, LOS E Deficient Segment, LOS F Note: * Katella Avenue capacity has been increased by 5% due to classification as a Smart Street. Source: Orange Traffic Analysis Model (OTAM 004) Future Transportation Analysis 50
69 T A I S Figure Project Future Average Daily Traffic on Arterial Segments (in Thousands) ANAHEIM LEWIS ST ETROPOLIT AN DR 9 GA RDEN GRO 6 THE CI TY STATE COLLEGE BLVD DR 9 V E BL VD ORANGEWOOD AVE S T 4 9 BRISTOL ST R R M P A FLOWER ST 57 ECKHOFF ST S A N T STRUCK AVE DEVON RD 6 MAIN ST 5 40 A A N A BATAVIA ST 8 ALMOND AVE M E R I LAWSON WY M 5 O R Y V E R FLE TCHE R PARKER ST L N LEMON ST GLASSELL ST GRAND ST 8 R L INCOLN A V E ST IVERD ORANGE OLIVE RD MEATS AVE TAFT AVE SHAFFER ST LA VETA AVE AL 8 9 E 45 HEIM AVE FAIRHAVEN AVE KATELLA AVE CAMBRIDGE ST A V SANTA ANA E WALNUT AVE PALM AVE PALMYRA AVE TUSTIN ST COLLINS AVE TAFT AVE HANDY ST R N O H L R A N C H R D 8 0 ORANGE S A N T I A GO CRE E K YORBA ST D S AN T A L E A WANDA RD R A N A V L L A CANYON RD CHAPMAN AVE PROSPECT ST VILLA PARK VILLA PARK RD V I A 8 BOND AVE SPRING ST 8 ESPLANADE ST E S 4 C 8 O HEWES ST L A 8 M 4 E 0 S RANCHO SANTIAGO BLVD A D R C A NNO N ST 49 ANAHEIM HILLS 6 0 SE R RANO AVE C A ORANGE PARK BLVD N Y O TUSTIN N N SANT IAGO CANYON RD A M A I V P O E W T E W P O R L A A B L V D A V 6 V E 4 E LEGEND City of Orange Water Area Roadway Sphere of Influence Adjacent Cities Railroad J 4 4 A M B OREE RD 7 Miles EAST ORANGE 6 4 T R E E T 4 D 4 5 Source File: Fig4-5-y0-Proj-Artl-ADT map
70 A V S R Figure Project Future Arterial Daily Level of Service ANAHEIM STATE COLLEGE BLVD 57 A S A N T A N A R I V E R R L I N COLN A VE FLETCHER ST GLASSELL ST BATAVIA ST 9 I V E R D A L E ORANGE OLIVE RD A V E HEIM AVE MEATS AVE S ANTIAGO BL V D SANTA R D A L E ANA CANYON RD N O H L I L L R R A NCH RD V I A 9 E S C O L A ME S A DR ANAHEIM HILLS S E R RANO AVE LEGEND City of Orange Water Area Roadway Sphere of Influence Adjacent Cities Railroad LOS A-D LOS E LOS F Miles TAFT AVE 55 TAFT AVE VILLA PARK MAIN ST VILLA PARK RD SANTIAGO C A NYON RD 5 LEWIS ST M ETROPOL ITAN DR GARDEN GROVE BLVD T H E C I T Y ORANGEWOOD AVE D R RA MPART ST BRISTOL ST FLOWER ST ECKHOFF ST STRUCK AVE DEVON RD ALMOND AVE LAWSON WY M E M O R Y N L PARKER ST LEMON ST SHAFFER ST GRAND ST LA VETA AVE KATELLA AVE COLLINS AVE WALNUT AVE PALM AVE PALMYRA AVE CAMBRIDGE ST SANTA ANA TUSTIN ST 55 WANDA RD HANDY ST S ANTIAGO ORANGE CREEK CHAPMAN AVE BOND AVE SPRING ST ESPLANADE ST PROSPECT ST YORBA ST FAIRHAVEN AVE HEWES ST RANCHO SANTIAGO ST C A NNO N S T CA TUSTIN ORANGE PARK BLVD NY O N A M V I A NEW P O L E W T POR A A BLVD V A V E E J A M B O R E E R D 6 EAST ORANGE T E E T 4 D 4 5 Source File: Fig4-6-y0-Proj-Artl-LOS map
71 4.6 Project Future Intersection Peak Hour Conditions Table 4.8 presents Project forecast year 00 ICU and LOS results for turning movement volumes at the critical analysis intersections during the morning (A.M.) and evening (P.M.) peak hours. Similar to the arterial segment volume forecast, turning movements for the intersections were post-processed from OTAM forecast volumes. Figure 4.7 illustrates peak hour levels of service. The addition of the Meats Avenue interchange with SR-55 reduces volumes through the intersections of Santiago Boulevard at Nohl Ranch Road and Tustin Street at Lincoln Avenue, although Tustin Street at Lincoln Avenue experiences an unacceptable level of service. The intersection of Santiago Boulevard at Meats Avenue deteriorates to unacceptable A.M. peak hour performance. Intersection improvements would be required to ensure efficient operation of this intersection with the addition of an interchange at Meats Avenue. It should be noted that this intersection operates at an unacceptable LOS F under existing conditions for the A.M. peak hour and buildout geometrics improve the level of service at this intersection. The ramp intersections of Meats Avenue with SR-55 were evaluated under peak hour conditions to identify potential deficiencies associated with the proposed interchange. In order to obtain acceptable peak hour operations at the southbound SR-55 intersection with Meats Avenue, the southbound off-ramp should include an exclusive left turn lane, an exclusive right turn lane and a shared left turn-right turn lane. Although the intersection operates at LOS C during the peak hours, the westbound left turn volume of approximately 500 vehicles during the A.M. peak hour suggests a second westbound left turn lane might be necessary to ensure there are no queuing issues with the west turn traffic onto southbound SR- 55 on the Meats Avenue overcrossing bridge. Both intersections assume through lanes in each direction and an exclusive right turn lane to access the SR-55 ramps. For the northbound SR-55 ramps intersection with Meats Avenue, dual northbound left turn lanes are required to satisfy forecast demands. In addition, dual eastbound left turn lanes are required on the overcrossing bridge to support the high P.M. peak hour volumes accessing SR-55 northbound. Even with the Project roadway network improvement assumptions including buildout intersection geometrics for critical intersections, twelve study intersections are forecast to operate at an unacceptable LOS in either the A.M. or the P.M. peak hour: Cannon Street at Santiago Canyon Road (LOS E in A.M. peak hour, LOS E in P.M. peak hour) Cannon Street at Serrano Avenue (LOS E in A.M. peak hour) Jamboree Road at Chapman Avenue (LOS E in A.M. peak hour) Southbound SR-55 Ramps at Katella Avenue (LOS E in A.M. peak hour) Main Street at La Veta Avenue (LOS E in P.M. peak hour) Santiago Boulevard at Meats Avenue (LOS E in A.M. peak hour) Wanda Road at Villa Park Road (LOS F in A.M. peak hour, LOS E in P.M. peak hour) Tustin Street at Lincoln Avenue (LOS E in A.M. peak hour, LOS F in P.M. peak hour) Main Street at Struck Avenue (LOS F in A.M. peak hour) Main Street at Collins Avenue (LOS E in A.M. peak hour, LOS F in P.M. peak hour) Southbound SR-57 Ramps at Orangewood Avenue (LOS E in both A.M. and P.M. peak hour) Southbound SR-57 Ramps at Chapman Avenue (LOS E in P.M. peak hour) Three of the eight intersections that are deficient in either the A.M. or P.M. peak hour under Project conditions operated at LOS D under existing conditions and hence had the potential of deteriorating to deficient conditions in the future: Cannon Street at Santiago Canyon Road (LOS E in A.M. peak hour, LOS E in P.M. peak hour) Southbound SR-55 Ramps at Katella Avenue (LOS E in A.M. peak hour) Wanda Road at Villa Park Road (LOS F in A.M. peak hour, LOS E in P.M. peak hour) Santiago Boulevard at Meats Avenue operated at LOS F under existing conditions. Future Transportation Analysis 5
72 Appendix D presents the future No Project and Project lane geometrics and Appendix E presents Project ICU worksheets for each intersection. Table 4.8 Project Future Intersection Level of Service ID Intersection Location A.M. Peak Hour P.M. Peak Hour ICU LOS ICU LOS Batavia Collins Avenue 0.79 C 0.90 D Batavia Katella Avenue 0.8 D 0.79 C Batavia Lincoln Avenue 0.77 C 0.7 C 4 Batavia Taft Avenue 0.80 C 0.74 C 5 Batavia Walnut Avenue 0.66 B 0.7 C 6 Cambridge Katella Avenue 0.7 C 0.86 D 7 Cannon Santiago Canyon Road 0.94 E 0.9 E 8 Cannon Serrano Avenue 0.99 E 0.88 D 9 Cannon Street/ Crawford Chapman Avenue 0.75 C 0.69 B 0 Yorba Chapman Avenue 0.7 C 0.6 B Canyon View Chapman Avenue 0.6 B 0.46 A Jamboree Chapman Avenue 0.94 E 0.90 D Northbound SR-55 Chapman Avenue 0.7 C 0.67 B 4 Southbound SR-55 Chapman Avenue 6 A 7 A 5 Lewis Chapman Avenue 0.6 B 0.68 B 6 The City Chapman Avenue 0.69 B 0.86 D 7 The City Eastbound SR- Ramps 0.76 C 0.8 D 8 The City Westbound SR- Ramps 0. A 0.4 A 9 Glassell Collins Avenue 0.79 C 0.75 C 0 Glassell Katella Avenue 0.65 B 0.89 D Glassell La Veta Avenue 0.90 D 0.76 C Glassell Lincoln Avenue 0.7 C 0.87 D Glassell Taft Avenue 0.8 D 0.78 C 4 Glassell Walnut Avenue 0.6 B 0.69 B 5 Hewes Chapman Avenue 0.79 C 0.69 B 6 Northbound SR-55 Katella Avenue 0.75 C 0.86 D 7 Southbound SR-55 Katella Avenue 0.97 E 0.87 D 8 Main Chapman Avenue 0.8 D 0.90 D 9 Main Katella Avenue 0.74 C 0.85 D 0 Main La Veta Avenue 0.8 D 0.95 E Main Orangewood Avenue 0.70 B 0.6 B Main Taft Avenue 0.64 B 0.89 D Main Town & Country Road A 0.84 D 4 Newport Chapman Avenue 0.76 C 0.8 D 5 Santiago Nohl Ranch Road 0.6 B 0.66 B 6 Eckhoff Orangewood Avenue 0.60 A 0.69 B 7 State College Orangewood Avenue 0.70 B 0.68 B 8 Prospect Chapman Avenue 0.8 D 0.86 D 9 Prospect Walnut Avenue 0.79 C 0.77 C 40 Santiago Meats Avenue 0.9 E 0.77 C 4 Wanda Villa Park Road.8 F 0.97 E 4 Tustin Chapman Avenue 0.76 C 0.87 D 4 Tustin Collins Avenue 8 A 0.65 B 44 Tustin Fairhaven Avenue 0.85 D 0.74 C 45 Tustin Heim Avenue 7 A 0.76 C 46 Tustin Katella Avenue 0.68 B 0.85 D 47 Tustin La Veta Avenue 0.69 B 8 A 48 Tustin Lincoln Avenue 0.9 E.0 F 49 Tustin Meats Avenue 9 A 0.8 D 50 Tustin Taft Avenue (North) 0.64 B 0.78 C 5 Tustin Taft Avenue (South) 0.70 B 0.86 D 5 Tustin Walnut Avenue 0.64 B 0.76 C 5 Southbound SR-55 Meats Avenue 0.76 C 0.7 C 54 Northbound SR-55 Meats Avenue 8 A 0.74 C 55 Struck Katella Avenue 0.40 A 0.45 A Future Transportation Analysis 54
73 Table 4.8 Project Future Intersection Level of Service (continued) ID Intersection Location City of Orange: Circulation Element Traffic Analysis A.M. Peak Hour P.M. Peak Hour ICU LOS ICU LOS 56 Main Struck Avenue.08 F 0.70 B 57 Main Collins Avenue 0.9 E.8 F 58 Southbound SR-57 Orangewood Avenue 0.97 E 0.94 E 59 Northbound SR-57 Orangewood Avenue 0.60 A 0.48 A 60 State College NB I-5 Ramps/Anaheim Way 0 A 0.4 A 6 State College Southbound I-5 Ramps A 0.4 A 6 Southbound I-5 Chapman Avenue 0 A 5 A 6 Rampart Chapman Ave./Northbound I-5 Ramps 0.84 D 0.87 D 64 Southbound SR-57 Chapman Avenue 0.76 C 0.9 E 65 Northbound SR-57 Chapman Avenue 0.46 A 5 A Deficient Intersection, LOS E Deficient Intersection, LOS F Source: Orange Traffic Analysis Model (OTAM 004) Future Transportation Analysis 55
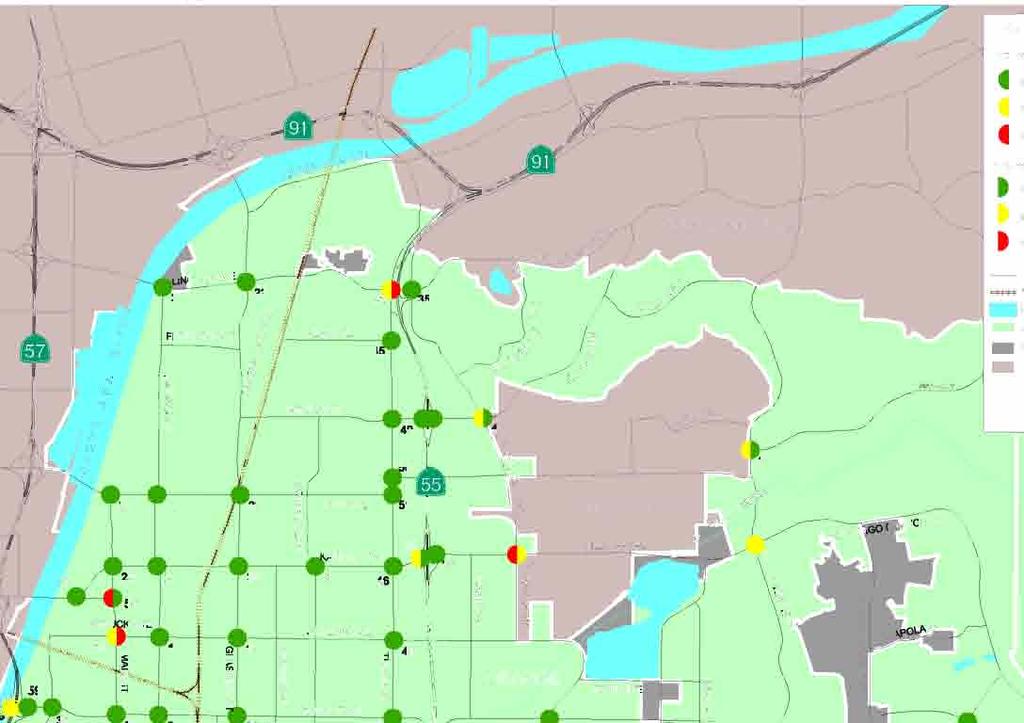

74
75 4.7 Project Future Mitigation This section presents Project mitigation measures for the arterial segments that operate at an unacceptable LOS under daily conditions and intersections that operate at an unacceptable LOS during either A.M. or P.M. peak hours. Generally, arterial segment performance is dictated by upstream and downstream intersection performance because the capacity of arterial segments is often constricted to what can filter through the intersections during the peak hours. Since arterial segment mitigation may not be warranted based on peak hour intersection performance, mitigation measures are generally applied to intersections to facilitate peak period traffic flow throughout the roadway network. Although mitigation measures are often tied to intersections, mitigation measures based on the daily performance of arterial segments throughout the City have been recommended. Table 4.9 presents recommended arterial mitigation measures for the deficient segments within Orange under Project MPAH 00 Buildout conditions. Mitigation is not recommended for Chapman Avenue and Glassell Street through the historic Orange Plaza as capacity enhancements, i.e. widening, to these facilities would be detrimental to preserving the heritage of the historical Orange Plaza. The significant unavoidable traffic impacts to the arterials through the Orange Plaza are outweighed and found to be acceptable due to the following specific economic, social and historical benefits: The Plaza Historic District achieved California Historic Landmark significance in 98 and the Plaza Historic District was placed on the National Register of Historic Places on March 9, 98; Old Town Orange became a national historic district and was placed in the National Registry of Historic Places in 997; The Orange Plaza traffic circle is the focal point of the Historic District; The City has developed a Historic Preservation Element of the General Plan; The mission of the Old Towne Preservation Association is to preserve and enhance the unique Old Towne Orange Area through education, communication and community development; In order to enhance and preserve its heritage, the City established design and development standards for the Old Towne District; The character, ambiance and historical nature of the district could be compromised by four-lane divided facilities through the Orange Plaza; and In order to maintain the integrity of the traffic circle, it would be difficult to improve Glassell Street and Chapman Avenue to four-lane divided standards and maintain the capacity of a facility through the circle. In addition, the circulation system around the Orange Plaza is a dense grid, therefore, it has the capability of providing relief to potential future traffic demands on Glassell Street or Chapman Avenue through additional available capacity on parallel facilities. Many of the arterial deficiencies occur at freeway interchanges as traffic filters through the City and onto the regional transportation system. Taft Avenue at the west City Limit, east of SR-57, is forecast to operate at LOS E. Coordination of intersections through the Taft Avenue corridor is recommended to accommodate heavy daily traffic demands. Taft Avenue at the west City Limit is not recommended for improvement without detailed peak hour analysis to warrant physical arterial segment widening. In addition, evaluation of this segment must be coordinated with the City of Anaheim as widening of this segment in Orange will necessitate widening in the City of Anaheim to maintain consistency across jurisdictional boundaries. Widening of this segment of Taft Avenue requires widening the bridge over the Santa Ana River and minor impacts to fronting retail/industrial uses. Chapman Avenue through the SR-55 interchange is also forecast to exceed daily capacity thresholds. Advance Traffic Management System strategies, such as signal coordination, is also recommended for the Chapman Avenue corridor. Chapman Avenue between SR-55 and Yorba Street operates just above the LOS E/F threshold. Due to the issues identified with the baseline improvement identified under No Project conditions, it is not recommended to improve this segment beyond its current configuration. Between Yorba Street and Prospect Street, future forecast volumes specify an 8-lane facility is required. Future Transportation Analysis 57
76 This improvement would be costly and have significant retail, office, medical facility, and residential rightof-way impacts. Accessibility to fronting retail could be impacted by implementation of this improvement measure. Chapman Avenue east of SR-55 should continually be monitored and operational improvements incorporated as appropriate to maintain mobility through this key corridor. The segment of Chapman Avenue to Canyon View Avenue operates at LOS F and improvement to a 6-lane facility would improve the LOS to acceptable levels. Widening this short segment may require earthwork but it is likely that property impacts would be minimal. No arterial widening improvements are recommended for Glassell Street through the SR- interchange to La Veta Avenue. Implementation of widening along this segment would impact the historically designated Hart Park and the historic Morton Bay Fig tree in front of Holy Family Catholic Church that is protected by the City s tree preservation program. In addition, fronting residential properties would be significantly impacted by any widening along this segment and on-street parking would likely need to be eliminated. Batavia Street is recommended to be improved to a 4-lane divided facility for multiple segments between Walnut Avenue and Lincoln Avenue. The segment between Walnut and Collins Avenue could be widened by removal of on-street parking with minimal, if any, right-of-way impacts. On-street parking along this segment is heavily utilized by the fronting industrial uses on a daily basis. The segments between Taft Avenue and Lincoln Avenue, while classified as a 4-lane undivided secondary, actually operates more like a 4-lane divided primary facility because the entire stretch has a two-way left turn lane. The mitigation for this segment would be to reclassify as a primary facility. Collins Avenue, similar to Batavia Street, is classified as a 4-lane undivided facility. Upgrading to a 4-lane divided configuration would provide for an acceptable LOS. Improvement to a divided facility would require widening, which may impact fronting residential and industrial properties. Glassell Street between Katella Avenue and Orange Olive Road is recommended to be improved to a 6- lane facility to serve future forecast traffic demands. While this improvement can potentially be implemented with minimal right-of-way acquisition required, on-street parking would be eliminated for fronting business and residential uses. Several segments of Katella Avenue are forecast to operate at LOS E under future conditions. As many of these segments are on the threshold of deficient operations, widening of Katella Avenue is not recommended. Widening of Katella Avenue could have significant adverse impacts to fronting retail, office, and industrial uses. Removal of on-street parking, where currently available, would be required under a widening scenario. The intersections along Katella Avenue should be continually monitored to ensure acceptable performance during the peak hours. Utilizing the full capacity of the system may result in acceptable operations through the corridor. Main Street between Town & County Road and La Veta Avenue is forecast to operate at LOS E. Widening this segment to an 8-lane facility is recommended. This improvement would likely require bridge widening over SR- and could potentially impact fronting commercial uses, specifically at the northeast corner of Town & County Road and Main Street. The implementation of the Meats Avenue interchange with SR-55 requires upgrading Meats Avenue between Tustin Street and the SR-55 Southbound Ramps to a 6-lane facility and the segment between the northbound and southbound ramps to a 6-lane facility. The segment between the northbound ramps and Santiago Boulevard would require an upgrade to a 4-lane divided facility. Even with the improvement of the segment west of the southbound ramps, this segment is forecast to operate at LOS E. Widening to an 8-lane segment is not recommended. Implementation of the interchange would have right-of-way impacts to residential uses on all four quadrants of the interchange, likely displacing several residential units, including trailer park units north of Meats Avenue west of SR-55 in the Orange Mobile Home Park. In addition, the bridge over SR-55 would require widening to ensure appropriate intersection geometry is provided to support the ramp intersections. Future Transportation Analysis 58
77 Table 4.9 Project Future Arterial Mitigation Recommendations ID Arterial From To MPAH Lanes 00 ADT City of Orange: Circulation Element Traffic Analysis LOS E Capacity V/C Ratio 8 Batavia Street Walnut Avenue Collins Avenue 4U,00 4, E 9 Batavia Street Collins Avenue Katella Avenue 4U,00 4, E Batavia Street Taft Avenue Fletcher Avenue 4U,800 4, E Batavia Street Fletcher Avenue Lincoln Avenue 4U,900 4, E Chapman Avenue Lemon Street Glassell Street U,500, F Chapman Avenue Glassell Street Grand Street U,600, F 5 Chapman Avenue SR-55 Yorba Street 8D 75,00 75, F LOS Mitigation Measure Improve to 4-lane divided facility No mitigation recommended through Historic Orange Plaza Monitor segment and evaluate intersections along Chapman Avenue between Tustin Street and Prospect Street to maximize throughput. 6 Chapman Avenue Yorba Street Prospect Street 6D 6,600 56,00. F Widen to 8-lane facility 40 Chapman Avenue Crawford Cyn Rd. Canyon View Avenue 4D 9,700 7, F Widen to 6-lane facility 47 Collins Avenue Batavia Street Glassell Street 4U,000 4, E Improve to 4-lane divided facility 49 Collins Avenue Cambridge Street Tustin Street 4U,900 4, E Improve to 4-lane divided facility 7 Glassell Street SR- La Veta Avenue 4D 4,600 7, E No mitigation recommended 74 Glassell Street Chapman Avenue Palm Avenue U,900, E No mitigation recommended through Historic Orange Plaza 77 Glassell Street Katella Avenue Orange Olive Road 4D 7,700 7,500.0 F Improve to 6-lane divided facility 89 Katella Avenue Struck Avenue Main Street 6D 56,500 59, E 90 Katella Avenue Main Street Batavia Street 6D 55,00 59,5 0.9 E 9 Katella Avenue Batavia Street Glassell Street 6D 5,700 59,5 0.9 E 9 Katella Avenue Glassell Street Cambridge Street 6D 54,500 59,5 0.9 E Monitor upstream and downstream intersections to evaluate need for widening segment. 7 Main Street Town & Country Road La Veta Avenue 6D 55,500 56, E Widen to 8-lane facility 7 Meats Avenue Tustin Street SR-55 SB Ramps 4U 5,00 4,000. F Improve to 6-lane divided facility 7 Meats Avenue SR-55 SB Ramps SR-55 NB Ramps 4U 45,500 4, F Improve to 6-lane divided facility 7 Meats Avenue SR-55 NB Ramps Santiago Boulevard 4U,900 4,000.7 F Improve to 4-lane divided facility 5 Prospect Street Chapman Avenue Spring Street 4U,000 4, E Improve to 4-lane divided facility 54 Prospect Street Spring Street Walnut Avenue 4U,00 4, E Improve to 4-lane divided facility 77 Taft Avenue West City Limit Main Street 6D 56,400 56,00.00 F Monitor upstream and downstream intersections to evaluate need for widening segment. 0 Wanda Road Katella Avenue Santiago Boulevard (VP) 4U 7,800 4,000.6 F Improve to 4-lane divided facility Deficient Segment, LOS E Deficient Segment, LOS F Arterial Segment Level of Service With Mitigation Measure Implementation 8 Batavia Street Walnut Avenue Collins Avenue 4D,00 7,500 9 A 9 Batavia Street Collins Avenue Katella Avenue 4D,00 7, B Batavia Street Taft Avenue Fletcher Avenue 4D,800 7,500 8 A Batavia Street Fletcher Avenue Lincoln Avenue 4D,900 7, B Chapman Avenue Lemon Street Glassell Street U,500, F Chapman Avenue Glassell Street Grand Street U,600, F 5 Chapman Avenue SR-55 Yorba Street 8D 75,00 75, F 6 Chapman Avenue Yorba Street Prospect Street 8D 6,600 75, D 40 Chapman Avenue Crawford Cyn Rd. Canyon View Avenue 6D 9,700 56, C 47 Collins Avenue Batavia Street Glassell Street 4D,000 7, B 49 Collins Avenue Cambridge Street Tustin Street 4D,900 7, B 7 Glassell Street SR- La Veta Avenue 6D 4,600 56, B 74 Glassell Street Chapman Avenue Palm Avenue U,900, E 77 Glassell Street Katella Avenue Orange Olive Road 6D 7,700 56, B 89 Katella Avenue Struck Avenue Main Street 6D 56,500 59, E 90 Katella Avenue Main Street Batavia Street 6D 55,00 59,5 0.9 E 9 Katella Avenue Batavia Street Glassell Street 6D 5,700 59,5 0.9 E 9 Katella Avenue Glassell Street Cambridge Street 6D 54,500 59,5 0.9 E 7 Main Street Town & Country Road La Veta Avenue 8D 55,500 75, C 7 Meats Avenue Tustin Street SR-55 SB Ramps 6D 5,00 56, E 7 Meats Avenue SR-55 SB Ramps SR-55 NB Ramps 6D 45,500 56, D 7 Meats Avenue SR-55 NB Ramps Santiago Boulevard 4D,900 7, D 5 Prospect Street Chapman Avenue Spring Street 4D,000 7,500 9 A 54 Prospect Street Spring Street Walnut Avenue 4D,00 7, B 77 Taft Avenue West City Limit Main Street 6D 56,400 56,00.00 F 0 Wanda Road Katella Avenue Santiago Boulevard (VP) 4D 7,800 7, C Future Transportation Analysis 59
78 Although Prospect Street between Chapman Avenue and Walnut Avenue and Wanda Road between Katella Avenue and Santiago Boulevard are labeled as 4-lane undivided secondary facilities, they operate as a 4-lane divided primary facility since the entirety of the segments either include a two-way left turn lane or a raised median. Typically, improving a facility from a 4-lane undivided configuration to a 4-lane divided configuration involves removal of on-street parking, construction of a raised median, or restriping to account for a two-way left turn lane and potential widening to achieve a divided configuration. The classification for these segments could be correctly revised to identify as primary facilities. Recommended mitigation measures for deficient intersections under Project conditions are presented in Table 4.0. Twelve intersections are forecast to operate at a deficient level of service under Future Project conditions. Generally, intersection mitigation measures proposed include the provision of additional turning lane capacity. ICU worksheets for the recommended mitigation measures are included in Appendix F. Under Project conditions, the implementation of the Meats Avenue/SR-55 interchange requires mitigation resulting from increased demand through the intersection as a result of the new interchange. Typical intersection mitigation measures include intersection widening to add capacity through additional turn or through lanes. Additional mitigation measures for intersections include re-striping the existing turn movement configuration to allow for more capacity for critical movements. Critical movements are the movements on the intersection approaches that generally have high volumes and result in deficient intersection operations. Advanced Transportation Management Systems (ATMS) are components that are implemented to maximize intersection capacity without physical capacity to intersections. ATMS strategies typically include revised signalization and signal coordination to increase throughput through a corridor. ATMS strategies generally increase capacity by five percent, therefore, a 0.05 V/C ratio credit will be applied to intersections where these strategies may be recommended. Since the Cannon Santiago Canyon Road intersection operates just above the allowable threshold, it is recommended to apply ATMS strategies at this location to maximize operational capacity and throughput of the intersection. The recommended improvement for the Cannon Serrano Avenue intersection requires reconstruction of the westbound approach of Serrano Avenue to provide for triple westbound left turns. However, this improvement requires Cannon Street to be widened in the southbound direction to accommodate a triple left turn lane. Impacts to residences would be required to implement this improvement measure. Forecast volumes at Jamboree Chapman Avenue require a rd northbound left turn lane. Based on the current configuration and the vacant property in the southeast corner of this intersection, this improvement appears feasible. The recommended improvement to add a second westbound left turn lane for the Katella SR- 55 southbound ramps intersection may result in impacts and potential bridge reconstruction to provide an additional turn lane onto southbound SR-55 under the existing freeway. The cost and construction impacts may be prohibitive to implementation of this improvement measure. The intersection of Main La Veta Avenue is forecast to operate at LOS E. Application of ATMS strategies at this location are recommended to achieve acceptable operations. Widening this intersection beyond its buildout configuration may result in significant right-of-way impacts due to directly adjacent major office building structures. The intersection of Santiago Meats Avenue operates at LOS E under Project conditions during the A.M. peak hour. Due to the implementation of the Meats Avenue/SR-55 interchange, additional capacity is required at this intersection. An exclusive right turn lane could be implemented, although right-of-way and potential residential property impacts may result. Another alternative is to incorporate ATMS strategies at this location, although capacity enhancements to account for the new interchange would likely result in more efficient operations. Future Transportation Analysis 60
79 The Wanda Villa Park Road requires additional capacity for the westbound and northbound movements. This is currently a very tight intersection with little room for future expansion. Increased capacity in the westbound direction would likely impact fronting single and multi-family residences located adjacent to the right-of-way. The Tustin Lincoln Avenue intersection is constrained by restaurant and gas station/retail uses fronting on the western side of the intersection and the SR-55 under-crossing on the eastern side of the intersection. Even with implementation of the Meats Avenue interchange, this intersection is forecast to operate at unacceptable levels of service. This improvement would potentially require significant right-ofway acquisition and bridge replacement/construction costs and, as a result, may be considered infeasible. The intersection of Main Struck Avenue operates at LOS F under Project conditions during the A.M. peak hour. Addition of a second eastbound and westbound through lane along Struck Avenue is required to bring this intersection to perform with acceptable LOS. Located within an existing commercial and industrial area, it is feasible that these improvements can be implemented although the through lane needs to be carried through the intersection prior to transitioning back to lanes. The intersection of Main Collins Avenue operates at LOS E and LOS F under Project conditions during the A.M. and P.M. peak hour, respectively. Addition of a northbound and an eastbound right-turn lanes as well as restriping the westbound approach from one left-turn, two through lanes to two left-turn lanes and one through lane are recommended to bring the intersection within the acceptable LOS D threshold. The addition of the northbound right-turn lane has been recommended as part of the City of Anaheim Platinum Triangle Trafic Study. Similar to the intersection of Main Struck Avenue, this intersection is located in a predominantly industrial area although implementation of these improvements will potentially require right-of-way. The intersection of Southbound SR-57 Orangewood Avenue operates at LOS E under Project conditions for both peak hours. Improvements recommended at this location in the City of Anaheim Platinum Triangle Traffic Study include the conversion of the eastbound right-turn lane to a third eastbound through lane and the addition of a second westbound left-turn lane. These improvements bring the intersection within the acceptable LOS threshold. The intersection of Southbound SR-57 Chapman Avenue operates at LOS E under Project conditions for P.M. peak hour. Conversion of the north and south right-turn lane into a through lane and the conversion of the shared northbound and southbound left and through lane to a left-turn only lane are adequate to improve the intersection to perform within acceptable LOS D. Since this intersection is forecast to perform marginally above the recommended threshold, an alternative mitigation measure is to apply ATMS strategies at this location to improve traffic flow. Table 4.0 ID Project Future Intersection Mitigation Recommendations Intersection Location A.M. Peak Hour P.M. Peak Hour ICU LOS ICU LOS Mitigation Measure 7 Cannon Santiago Canyon Road 0.94 E 0.9 E Apply ATMS to enhance capacity 8 Cannon Serrano Avenue 0.99 E 0.88 D Add rd Westbound Left Turn Lane Jamboree Chapman Avenue 0.94 E 0.90 D Add rd Northbound Left Turn Lane 7 Southbound SR-55 Katella Avenue 0.97 E 0.87 D Add nd Westbound Left Turn Lane 0 Main La Veta Avenue 0.8 D 0.95 E Apply ATMS applications to enhance capacity 40 Santiago Meats Avenue 0.9 E 0.77 C Restripe shared Westbound Through Right Lane to nd Through Lane, Add Westbound Right Turn Lane 4 Wanda Villa Park Road.8 F 0.97 E Add rd Westbound Through Lane, Add nd Southbound Left Turn Lane 48 Tustin Lincoln Avenue 0.9 E.0 F Add rd Eastbound Through Lane and nd Eastbound Right Turn Lane 56 Main Struck Avenue.08 F 0.70 B Add nd Eastbound and nd Westbound Through lanes Future Transportation Analysis 6
80 Table 4.0 ID Intersection Location Project Future Intersection Mitigation Recommendations (continued) A.M. Peak Hour P.M. Peak Hour ICU LOS ICU LOS 57 Main Collins Avenue 0.9 E.8 F Southbound SR-57 Orangewood Avenue Southbound SR-57 Chapman Avenue Deficient Intersection, LOS E Deficient Intersection, LOS F Intersection Level of Service with Mitigation Measure Implementation ID Intersection Location 0.97 E 0.94 E 0.76 C 0.9 E A.M. Peak Hour P.M. Peak Hour ICU LOS ICU LOS 7 Cannon Santiago Canyon Road 0.89 D 0.88 D 8 Cannon Serrano Avenue 0.86 D 0.88 D Jamboree Chapman Avenue 0.88 D 0.90 D 7 Southbound SR-55 Katella Avenue 0.74 C 0.76 C 0 Main La Veta Avenue 0.77 C 0.90 D 40 Santiago Meats Avenue 0.87 D 0.77 C 4 Wanda Villa Park Road 0.88 D 0.86 D 48 Tustin Lincoln Avenue 0.74 C 0.90 D 56 Main Struck Avenue 0.79 C 0.6 B 57 Main Collins Avenue 0.8 D 0.86 D Southbound SR-57 Orangewood Avenue 0.74 C 0.7 C Southbound SR-57 Chapman 0.80 C 0.89 D Avenue 0.7 C 0.87 D Mitigation Measure Add one Northbound and Eastbound Right Turn Lane, Restripe Westbound approach to Left Turn Lanes and Though Lane Convert Eastbound Right Turn Lane to rd Through Lane, Add nd Westbound Left Turn Lane Convert Northbound and Southbound Right Turn Lane to Through Lane, Convert Northbound and Southbound shared Left and Through lane to Left-Turn only lane; Alternate mitigation Apply ATMS 4.8 Alternative Future Daily Conditions Alternative assumes buildout of the proposed General Plan land use and buildout of the proposed MPAH as defined under the Project Scenario without incorporation of the Meats Avenue/SR-55 interchange. Post-processed OTAM year 00 forecast daily arterial volumes representing the Alternative conditions are reported in Table 4. with corresponding daily V/C ratio and LOS. Future Transportation Analysis 6
81 Table 4. Alternative Future Arterial Daily Level of Service ID Arterial From To MPAH Lanes 00 ADT LOS E Capacity V/C Ratio LOS Almond Avenue Main Street Batavia Street U 7,00, B Almond Avenue Batavia Street Glassell Street U 5,500, A Almond Avenue Glassell Street Grand Street U 6,00,000 A 4 Almond Avenue Grand Street Cambridge Street U,400, A 5 Batavia Street La Veta Avenue Almond Avenue 4U,500 4,000 A 6 Batavia Street Almond Avenue Chapman Avenue 4U 5,900 4, B 7 Batavia Street Chapman Avenue Walnut Avenue 4U,00 4, D 8 Batavia Street Walnut Avenue Collins Avenue 4U,700 4, E 9 Batavia Street Collins Avenue Katella Avenue 4U,600 4, E 0 Batavia Street Katella Avenue Taft Avenue 4U,00 4, D Batavia Street Taft Avenue Fletcher Avenue 4U,000 4, E Batavia Street Fletcher Avenue Lincoln Avenue 4U,00 4, E Bond Avenue Prospect Street Hewes Street 4U 8,400 4,000 A 4 Cambridge Street South City Limits Palmyra Avenue U 7,00,000 9 A 5 Cambridge Street Palmyra Avenue Chapman Avenue U 8,600, C 6 Cambridge Street Chapman Avenue Palm Avenue U 8,400, B 7 Cambridge Street Palm Avenue Walnut Avenue U 7,700, B 8 Cambridge Street Walnut Avenue Collins Avenue U 8,000, B 9 Cambridge Street Collins Avenue Katella Avenue U 8,400, B 0 Cambridge Street Katella Avenue Taft Avenue 4U,800 4, A Cambridge Street Taft Avenue Meats Avenue 4U 9,700 4, A Canyon View Avenue Chapman Avenue Outrider Street 4D 6,400 7, A Canyon View Avenue Outrider Street Newport Boulevard 4D 6,00 7, A 4 Canyon View Avenue Newport Boulevard Jamboree Road 4D 5,00 7, A 5 Chapman Avenue Haster Street Lewis Street 5D,600 46, C 6 Chapman Avenue Lewis Street Manchester Avenue 6D 5,700 56, B 7 Chapman Avenue Manchester Avenue The City Drive 6D 40,00 56, C 8 Chapman Avenue The City Drive Eckhoff Street 6D 4,800 56, C 9 Chapman Avenue Eckhoff Street Main Street 6D 4,600 56, B 0 Chapman Avenue Main Street Batavia Street 4D,800 7, B Chapman Avenue Batavia Street Lemon Street 4D 0,700 7,500 5 A Chapman Avenue Lemon Street Glassell Street U,00,000.0 F Chapman Avenue Glassell Street Grand Street U,500, F Chapman Avenue Grand Street Cambridge Street 4D 5,00 7, B Chapman Avenue Cambridge Street Tustin Street 4D 8,00 7, C 4 Chapman Avenue Tustin Street SR-55 6D 5,800 56, E 5 Chapman Avenue SR-55 Yorba Street 8D 76,700 75,000.0 F 6 Chapman Avenue Yorba Street Prospect Street 6D 65,00 56,00.6 F 7 Chapman Avenue Prospect Street Esplanade Street 6D 5,500 56, E 8 Chapman Avenue Esplanade Street Hewes Street 6D 47,900 56, D 9 Chapman Avenue Hewes Street Crawford Canyon Road 6D 4,900 56, C 40 Chapman Avenue Crawford Canyon Road Canyon View Avenue 4D 40,700 7, F 4 Chapman Avenue Canyon View Avenue Orange Park Boulevard 4D,00 7, D 4 Chapman Avenue Orange Park Boulevard Newport Boulevard 4D 8,400 7, C 4 Chapman Avenue Newport Boulevard Jamboree Road 6D 48,800 56, D 44 Chapman Avenue Jamboree Road City Limit 6D 4,600 56, C 45 Collins Avenue Eckhoff Street Main Street 4U 5,000 4, B 46 Collins Avenue Main Street Batavia Street 4U 8,700 4, C 47 Collins Avenue Batavia Street Glassell Street 4U,900 4, E 48 Collins Avenue Glassell Street Cambridge Street 4U 7,800 4, C Deficient Segment, LOS E Deficient Segment, LOS F Future Transportation Analysis 6
82 Table 4. Alternative Future Arterial Daily Level of Service (continued) ID Arterial From To MPAH Lanes 00 ADT LOS E Capacity V/C Ratio LOS 49 Collins Avenue Cambridge Street Tustin Street 4U,700 4, E 50 Collins Avenue Tustin Street Handy Street 4U 6,500 4, B 5 Collins Avenue Handy Street Wanda Road 4U 5,500 4, B 5 Collins Avenue Wanda Road Prospect Street 4U 0,900 4, D 5 Crawford Canyon Road Barrett Avenue Chapman Avenue 4U 7,500 4, C 54 Cannon Street Chapman Avenue Creekside Avenue 4U,00 4,000 5 A 55 Cannon Street Creekside Avenue Patria Court 4U 8,700 4, A 56 Cannon Street Patria Court Santiago Canyon Road 4U 8,400 4,000 A 57 Cannon Street Santiago Canyon Road Taft Avenue 6D 46,700 56, D 58 Cannon Street Taft Avenue Via Escola 6D,500 56, A 59 Eckhoff Street Chapman Avenue Sycamore Avenue U 5,500, A 60 Eckhoff Street Orangewood Avenue Collins Avenue 4U 9,700 4, D 6 Esplanade Street Fairhaven Avenue La Veta Avenue 4U,500 4,000 A 6 Esplanade Street La Veta Avenue Chapman Avenue 4U 7,500 4, A 6 Fairhaven Avenue Glassell Street Cambridge Street 4U 0,00 4, A 64 Fairhaven Avenue Cambridge Street Tustin Street 4U 9,900 4, A 65 Fairhaven Avenue Tustin Street Yorba Street 4U 5,600 4, B 66 Fairhaven Avenue Yorba Street Prospect Street 4U 4,700 4, B 67 Fairhaven Avenue Prospect Street Esplanade Street 4U,500 4,000 6 A 68 Fairhaven Avenue Esplanade Street Hewes Street 4U,000 4, A 69 Fletcher Avenue Batavia Street Glassell Street 4U 7,600 4, A 70 Garden Grove Boulevard The City Drive Lewis Street 4D,00 7,500 9 A 7 Glassell Street SR- La Veta Avenue 4D 5,00 7, E 7 Glassell Street La Veta Avenue Almond Avenue 4D 7,600 7, A 7 Glassell Street Almond Avenue Chapman Avenue U 0,700, D 74 Glassell Street Chapman Avenue Palm Avenue U,600, F 75 Glassell Street Palm Avenue Collins Avenue 4D 7,400 7, A 76 Glassell Street Collins Avenue Katella Avenue 4D 6,00 7, B 77 Glassell Street Katella Avenue Orange Olive Road 4D 40,00 7, F 78 Glassell Street Orange Olive Road Grove Avenue 4D,00 7,500 9 A 79 Glassell Street Grove Avenue Lincoln Avenue 4D,00 7, D 80 Glassell Street Lincoln Avenue Santa Ana River 4D,00 7, D 8 Grand Street La Veta Avenue Palmyra Avenue U 9,000, C 8 Grand Street Almond Avenue Chapman Avenue U 0,000, D 8 Grand Street Chapman Avenue Maple Avenue U 5,500, A 8 Hewes Street Fairhaven Avenue Washington Avenue 4U 7,600 4, A 8 Hewes Street Washington Avenue Chapman Avenue 4U,00 4, A 84 Hewes Street Chapman Avenue Walnut Avenue 4U,00 4,000 5 A 85 Hewes Street Walnut Avenue Santiago Canyon Road 4U,00 4, A 86 Jamboree Road Santiago Canyon Road Chapman Avenue 6D 0,00 56,00 A 87 Jamboree Road Chapman Avenue Canyon View Avenue 6D 0,500 56,00 4 A 88 Jamboree Road Canyon View Avenue SR-4 6D 4,00 56, B 89 Katella Avenue* Struck Avenue Main Street 6D SS 59,5 56, E 90 Katella Avenue* Main Street Batavia Street 6D SS 59,5 56, E 9 Katella Avenue* Batavia Street Glassell Street 6D SS 59,5 56, E 9 Katella Avenue* Glassell Street Cambridge Street 6D SS 59,5 56, E 9 Katella Avenue* Cambridge Street Tustin Street 6D SS 59,5 56, D 94 Katella Avenue* Tustin Street SR-55 7D SS 68,50 65, D 95 Katella Avenue SR-55 Handy Street 6D 49,00 56, D 96 Katella Avenue Handy Street Wanda Road 6D 46,00 56, D 97 Katella Avenue Wanda Road Center Drive 6D 8,500 56, B Deficient Segment, LOS E Deficient Segment, LOS F Future Transportation Analysis 64
83 Table 4. Alternative Future Arterial Daily Level of Service (continued) ID Arterial From To MPAH Lanes 00 ADT LOS E Capacity V/C Ratio LOS 98 Katella Avenue Center Drive Santiago Canyon Road 6D 6,400 56, B 99 La Veta Avenue Flower Street Devon Street 6D,00 56,00 9 A 00 La Veta Avenue Devon Street Main Street 6D 9,700 56,00 A 0 La Veta Avenue Main Street Batavia Street 6D 7,00 56, B 0 La Veta Avenue Batavia Street Glassell Street 4D 0,600 7,500 5 A 0 La Veta Avenue Glassell Street Shaffer Street 4U,00 4, A 04 La Veta Avenue Shaffer Street Cambridge Street 4U 8,400 4,000 A 05 La Veta Avenue Tustin Street Yorba Street 4U,500 4, A 06 La Veta Avenue Yorba Street Prospect Street 4U 0,500 4, A 07 La Veta Avenue Prospect Street Esplanade Street 4U 8,600 4, A 08 Lemon Street La Veta Avenue Palmyra Avenue U 8,000, B 08 Lemon Street Chapman Avenue Maple Avenue U 8,400, B 08 Lemon Street Maple Avenue Walnut Avenue U,000, A 09 Lewis Street Garden Grove Avenue Metropolitan Drive 4U 7,00 4, C 0 Lewis Street Metropolitan Drive Chapman Avenue 4U 8,00 4, C Lewis Street Chapman Avenue Sirius Avenue 4U,00 4,000 A Lincoln Avenue West City Limit Batavia Street 6D 40,800 56, C Lincoln Avenue Batavia Street Glassell Street 6D,800 56,00 8 A 4 Lincoln Avenue Glassell Street Orange Olive Road 6D 5,00 56, B 5 Lincoln Avenue Orange Olive Road Tustin Street 6D 49,00 56, D 6 Lincoln Avenue Tustin Street Santiago Boulevard 6D 50,600 56, D 7 Main Street Town & Country Road La Veta Avenue 6D 55,400 56, E 8 Main Street La Veta Avenue Chapman Avenue 6D 48,700 56, D 9 Main Street Chapman Avenue Sycamore Avenue 6D 7,00 56, B 0 Main Street Sycamore Avenue Collins Avenue 6D 40,700 56, C Main Street Collins Avenue Struck Avenue 4D 5,00 7, B Main Street Struck Avenue Katella Avenue 4D 6,600 7, C Main Street Katella Avenue Taft Avenue 4D,900 7, B 4 Meats Avenue Glassell Street Orange Olive Road 4U,00 4, A 5 Meats Avenue Orange Olive Road Cambridge Street 4U,500 4,000 6 A 6 Meats Avenue Cambridge Street Tustin Street 4U 6,600 4, B 7 Meats Avenue Tustin Street Santiago Boulevard 4U 7,500 4, C 8 Meats Avenue Santiago Boulevard Featherhill Road 4U,00 4,000 A 9 Meats Avenue Featherhill Road Via Escola 4U 6,500 4, A 0 Metropolitan Drive Lewis Street SR- Westbound Ramps 4U 9,400 4, A Metropolitan Drive SR- Westbound Ramps The City Drive 4U 9,00 4, C Metropolitan Drive The City Drive Chapman Avenue 4U 0,800 4, D Manchester Avenue Chapman Avenue Compton Avenue 4D 0,900 7, A Newport Boulevard South City Limits Canyon View Avenue 4D 9,000 7, A 4 Newport Boulevard Canyon View Avenue Chapman Avenue 4D 7,800 7, A 5 Newport Boulevard Chapman Avenue Santiago Canyon Road 4D 4,00 7, A 6 Nohl Ranch Road Santiago Boulevard East City Limit 4U,000 4,000 4 A 7 Orange Olive Road Glassell Street Meats Avenue 4U 0,800 4, D 8 Orange Olive Road Meats Avenue Lincoln Avenue 4U 0,000 4, D 9 Orange Olive Road Lincoln Avenue Santa Ana Canyon Road 4U 6,00 4, B 40 Orange Olive Road Santa Ana Canyon Road Riverdale Avenue 4U,800 4, A 4 Orangewood Avenue Eckhoff Street Main Street 6D 40,900 56, C 4 Palm Avenue Main Street Batavia Street U 4,600, A 4 Palm Avenue Batavia Street Cypress Street U 8,00, B 44 Palm Avenue Cypress Street Glassell Street U 7,500, B Deficient Segment, LOS E Deficient Segment, LOS F Future Transportation Analysis 65
84 Table 4. Alternative Future Arterial Daily Level of Service (continued) ID Arterial From To MPAH Lanes 00 ADT LOS E Capacity V/C Ratio LOS 45 Palm Avenue Glassell Street Cambridge Street U 5,00, A 46 Palm Avenue Cambridge Street Tustin Street U 8,000, B 47 Palmyra Avenue Batavia Street Glassell Street U,000,000 A 48 Palmyra Avenue Glassell Street Cambridge Street U,000, A 49 Palmyra Avenue Cambridge Street Tustin Street U 5,400, A 50 Parker Street La Veta Avenue Town & Country Road 4U 9,600 4, D 5 Prospect Street Fairhaven Avenue La Veta Avenue 4U 0,800 4, A 5 Prospect Street La Veta Avenue Chapman Avenue 4U,600 4,000 7 A 5 Prospect Street Chapman Avenue Spring Street 4U 4,00 4,000.0 F 54 Prospect Street Spring Street Walnut Avenue 4U,700 4, E 55 Prospect Street Walnut Avenue Bond Avenue 4U 8,00 4, C 56 Rampart Street Chapman Avenue Orangewood Avenue 4U 9,00 4, C 57 Rancho Santiago Boulevard Chapman Avenue Walnut Avenue U 8,00, B 58 Rancho Santiago Boulevard Hewes Street Bond Avenue U,00, A 59 Riverdale Avenue Glassell Street Orange Olive Road 4U 6,000 4,000 A 60 Riverdale Avenue Orange Olive Road Tustin Street 4U 9,600 4, A 6 Santa Ana Canyon Road Lincoln Avenue Nohl Ranch Road 6D 7,00 56,00 0. A 6 Santiago Boulevard Wanda Road Taft Avenue 4U 6,700 4, B 6 Santiago Boulevard Taft Avenue Villa Real Drive 4U 5,700 4, B 64 Santiago Boulevard Villa Real Drive Lincoln Avenue 4U 7,600 4, C 65 Santiago Canyon Road Hewes Street Cannon Street 6D 9,500 56, B 66 Santiago Canyon Road Cannon Street Orange Park Boulevard 6D 47,700 56, D 67 Santiago Canyon Road Orange Park Boulevard Meads Avenue 6D 4,400 56, C 68 Santiago Canyon Road Meads Avenue Newport Boulevard 6D 40,400 56, C 69 Santiago Canyon Road Newport Boulevard Jamboree Road 6D 9,700 56,00 A 70 Santiago Canyon Road Jamboree Road Street D 6D 4,600 56, C 4 Santiago Canyon Road Street D SR-4 6D 6,000 56, A Santiago Canyon Road East of SR-4 4D 4,000 7, B 7 Serrano Avenue Cannon Street Orange Park Boulevard 4D,900 7, B 7 Serrano Avenue Orange Park Boulevard Apache Creek 4D 9,700 7,500 A 7 Serrano Avenue Apache Creek East City Limit 4D,900 7, A 74 Shaffer Street La Veta Avenue Palmyra Avenue U,000, A 74 Shaffer Street Chapman Avenue Maple Avenue U 6,00,000 A 74 Shaffer Street Palm Avenue Walnut Avenue U 7,000,000 8 A 74 Shaffer Street Walnut Avenue Collins Avenue U 0,600, D 744 Shaffer Street Collins Avenue Katella Avenue U 7,000,000 8 A 75 Spring Street Prospect Street Olympia Way 4U 4,800 4, B 76 Struck Avenue Katella Avenue Main Street U 9,00, C 77 Taft Avenue West City Limit Main Street 6D 57,800 56,00.0 F 78 Taft Avenue Main Street Batavia Street 6D 7,400 56, B 79 Taft Avenue Batavia Street Glassell Street 6D 5,000 56, B 80 Taft Avenue Glassell Street Cambridge Street 6D 5,900 56, A 8 Taft Avenue Cambridge Street Tustin Street 6D,00 56, A 8 Taft Avenue Tustin Street Santiago Boulevard 4U 4,600 4, B 8 Taft Avenue Cannon Street Yurok Street U 8,00, B 84 The City Drive Garden Grove Boulevard SR- 6D 5,900 56, B 85 The City Drive SR- Metropolitan 6D 46,00 56, D 86 The City Drive Metropolitan Chapman Avenue 8D 5,600 75, A 87 The City Drive Chapman Avenue North City Limits 8D 5,700 75, A 88 Town & Country Road Main Street SR- 4D 7,700 7, C 89 Town & Country Road SR- Parker Street 4D 5,00 7, A 90 Tustin Street Fairhaven Avenue La Veta Avenue 6D 9,700 56, C 9 Tustin Street La Veta Avenue Palmyra Avenue 6D 5,000 56, B Deficient Segment, LOS E Deficient Segment, LOS F Future Transportation Analysis 66
85 Table 4. Alternative Future Arterial Daily Level of Service (continued) ID Arterial From To MPAH Lanes 00 ADT LOS E Capacity V/C Ratio LOS 9 Tustin Street Palmyra Avenue Chapman Avenue 6D 6,500 56, B 9 Tustin Street Chapman Avenue Walnut Avenue 6D 54,800 56, E 94 Tustin Street Walnut Avenue Mayfair Avenue 6D 47,600 56, D 95 Tustin Street Mayfair Avenue Collins Avenue 6D 45,900 56, D 96 Tustin Street Collins Avenue Katella Avenue 6D 5,600 56, E 97 Tustin Street Katella Avenue Taft Avenue 6D 5,00 56, E 98 Tustin Street Taft Avenue Meats Avenue 6D 4,00 56, C 99 Tustin Street Meats Avenue Lincoln Avenue 6D 8,000 56, B 00 Tustin Street Lincoln Avenue Santa Ana Canyon Road 6D 9,700 56,00 A 0 Via Escola Meats Avenue Cannon Street 4U 4,700 4, A 0 Villa Real Drive Santiago Boulevard Chapel Hill U,800,000 A 0 Walnut Avenue Main Street Batavia Street U 8,700, C 04 Walnut Avenue Batavia Street Cypress Street U 9,600, C 05 Walnut Avenue Cypress Street Glassell Street U 9,900, D 06 Walnut Avenue Glassell Street Cambridge Street U 8,00, B 07 Walnut Avenue Cambridge Street Tustin Street U 8,900, C 08 Walnut Avenue Tustin Street Handy Street U 0,700, D 09 Wanda Road Collins Avenue Katella Avenue 4U 6,500 4, B 0 Wanda Road Katella Avenue Santiago Boulevard (VP) 4U 7,000 4,000. F Yorba Street Fairhaven Avenue La Veta Avenue 4U 8,00 4, A Yorba Street La Veta Avenue Chapman Avenue 4U,900 4,000 0 A Deficient Segment, LOS E Deficient Segment, LOS F Note: * Katella Avenue capacity has been increased by 5% due to classification as a Smart Street. Source: Orange Traffic Analysis Model (OTAM 004) The improvements are due to minor reductions in the daily forecast volumes and the shifting of volumes to parallel facilities with available capacity. Figure 4.8 presents the Alternative forecast average daily traffic (ADT) volumes for arterial segments and the forecast year 00 arterial level of service is presented in Figure 4.9. Future Transportation Analysis 67
86 A I S T Figure Alternative Future Average Daily Traffic on Arterial Segments (in Thousands) ANAHEIM LEWIS ST TROPOLITAN DR 9 GA RDEN GRO 40 THE CI TY 6 6 DR 9 6 VE STATE COLLEGE BLVD B ORANGEWOOD L VD T 9 S 4 BRISTOL ST T R AVE R P A M 57 FLOWER ST ECKHOFF ST STRUCK AVE DEVON RD 0 S A N T A 7 MAIN ST 5 N A A BATAVIA ST 4 ALMOND AVE M E LAWSON WY R M I O 5 R Y V E R FLE TCHE R PARKER ST L N LEMON ST 8 GLASSELL ST GRAND ST 8 R L INCOLN A V E ST IVERD 4 6 ORANGE OLIVE RD MEATS AVE TAFT AVE SHAFFER ST LA VETA AVE A 8 8 L E 49 HEIM AVE FAIRHAVEN AVE KATELLA AVE CAMBRIDGE ST A V WALNUT AVE SANTA ANA E COLLINS AVE PALM AVE PALMYRA AVE TUSTIN ST TAFT AVE HANDY ST 8 R S A N T N O H L 9 ORANGE YORBA ST I A G O SANTA D L E A WANDA RD R CRE EK ANA CANYON RD V L L A CHAPMAN AVE PROSPECT ST R A NCH VILLA PARK VILLA PARK RD RD V I A 8 BOND AVE SPRING ST 4 ESPLANADE ST E 9 48 S 5 C 8 O L A HEWES ST 8 4 M E S RANCHO SANTIAGO BLVD A D R C A NNO N S T 48 ANAHEIM HILLS 6 TUSTIN 0 S E R RANO AVE C A ORANGE PARK BLVD N YO N SANT I AGO C A NYON RD A N E M A I V P O T WPOR L A E W A B LV D A V 6 V E 4 E LEGEND City of Orange Water Area Roadway Sphere of Influence Adjacent Cities Railroad J 4 4 A M B ORE E RD 6 Miles EAST ORANGE R E E 6 4 T 4 D 4 5 Source File: Fig4-8-y0-Alt-Artl-ADT map
87 D S Figure Alternative Future Arterial Daily Level of Service ANAHEIM STATE COLLEGE BLVD 57 A S A N T A N A R I V E R LINCOLN AVE FLETCHER ST GLASSELL ST BATAVIA ST R IV 9 ERDALE ORANGE OLIVE RD A VE HEIM AVE MEATS AVE S ANT I AGO BLV D SANT A ANA R D A L E N O H L V I L L A R CANYON RD R A N C H R D V I A E 9 A S C O L M ES A D R ANAHEIM HILLS SE R RANO AVE LEGEND City of Orange Water Area Roadway Sphere of Influence Adjacent Cities LOS A-D LOS E LOS F Railroad Miles MAIN ST TAFT AVE 55 TAFT AVE VILLA PARK VILLA PARK RD SANTIAGO CA N YON RD 5 LEWIS ST M E TROPOLITAN DR GARDEN GROVE BLVD T H E C IT Y ORANGEW R RA MPART ST BRISTOL ST OD AVE FLOWER ST ECKHOFF ST STRUCK AVE DEVON RD ALMOND AVE LAWSON WY M E M O R Y L PARKER ST N LEMON ST SHAFFER ST GRAND ST LA VETA AVE KATELLA AVE COLLINS AVE WALNUT AVE PALM AVE PALMYRA AVE CAMBRIDGE ST SANTA ANA TUSTIN ST 55 WANDA RD HANDY ST S A N T I A GO ORANGE CREEK CHAPMAN AVE BOND AVE SPRING ST ESPLANADE ST PROSPECT ST YORBA ST FAIRHAVEN AVE HEWES ST RANCHO SANTIAGO ST C A NNO N S T C A TUSTIN ORANGE PARK BLVD N Y O N A M V I A N E W E P O L W D V L T B PO R A A V A V E E J A M B O R E E R D EAST ORANGE T 6 4 R E E T 4 D 5 Source File: Fig4-9-y0-Alt-Artl-LOS map
88 4.9 Alternative Future Intersection Peak Hour Conditions Table 4. presents forecast year 00 ICU and LOS results for turning movement volumes at the critical intersections during the morning (A.M.) and evening (P.M.) peak hours for Alternative. The intersection geometrics are consistent with the Project Scenario assumptions presented in Appendix D. Consistent with the arterial segment volume forecasts, turning movements for the intersections were post-processed. Figure 4.0 illustrates peak hour intersection levels of service. Alternative results in twelve study intersections forecast to operate at an unacceptable LOS in either the A.M. or P.M. peak hour: Cannon Street at Santiago Canyon Road (LOS E in both A.M. and P.M. peak hour) Cannon Street at Serrano Avenue (LOS E in A.M. peak hour) Jamboree Road at Chapman Avenue (LOS E in A.M. peak hour) Southbound SR-55 Ramps at Katella Avenue (LOS E in A.M. peak hour) Main Street at La Veta Avenue (LOS E in P.M. peak hour) Wanda Road at Villa Park Road (LOS F in A.M. peak hour, LOS E in P.M. peak hour) Tustin Street at Katella Avenue (LOS E in P.M. peak hour) Tustin Street at Lincoln Avenue (LOS E in A.M. peak hour, LOS F in P.M. peak hour) Main Street at Struck Avenue (LOS F in A.M. peak hour) Main Street at Collins Avenue (LOS E in A.M. peak hour, LOS F in P.M. peak hour) Southbound SR-57 Ramps at Orangewood Avenue (LOS E in both A.M. and P.M. peak hour) Southbound SR-57 Ramps at Chapman Avenue (LOS E in P.M. peak hour) The remaining intersections operate consistently with Project Scenario conditions. Appendix E presents future Alternative ICU worksheets for each intersection. 4.0 Alternative Future Mitigation Specific arterial mitigation measures for Alternative are consistent with those developed for the Project Scenario (refer to Section 4.7), with the exception of improving Meats Avenue as a result of the implementation of an interchange at Meats Avenue at SR-55 in the Project Alternative. Table 4. presents Alternative arterial mitigation. Recommended mitigation measures for deficient Alternative intersections are presented in Table 4.4. Twelve intersections are forecast to operate at a deficient level of service under Future Alternative conditions. Generally, intersection mitigation measures proposed include the provision of additional turning lane capacity. Specific intersection mitigation measures are generally consistent with those developed for the Project Scenario and documented in Section 4.7. The intersection of Tustin Katella Avenue operates at an unacceptable LOS under Alternative conditions, partly due to the fact that the Meats Avenue interchange is not incorporated into this alternative. Application of ATMS strategies at this location will bring this intersection to within acceptable performance levels. ICU worksheets for the recommended mitigation measures are included in Appendix G. Under Alternative conditions, no mitigation is required from ultimate geometric configurations at Santiago Boulevard at Meats Avenue. Table 4. ID Alternative Future Intersection Level of Service Intersection Location A.M. Peak Hour P.M. Peak Hour ICU LOS ICU LOS Batavia Collins Avenue 0.8 C 0.90 D Batavia Katella Avenue 0.84 D 0.79 C Batavia Lincoln Avenue 0.76 C 0.7 C 4 Batavia Taft Avenue 0.79 C 0.75 C 5 Batavia Walnut Avenue 0.67 B 0.75 C 6 Cambridge Katella Avenue 0.7 C 0.85 D 7 Cannon Santiago Canyon Road 0.9 E 0.9 E Future Transportation Analysis 70
89 Table 4. ID City of Orange: Circulation Element Traffic Analysis Alternative Future Intersection Level of Service (continued) Intersection Location A.M. Peak Hour P.M. Peak Hour ICU LOS ICU LOS 8 Cannon Serrano Avenue 0.98 E 0.87 D 9 Cannon Street/ Crawford Chapman Avenue 0.74 C 0.70 B 0 Yorba Chapman Avenue 0.74 C 0.6 B Canyon View Chapman Avenue 0.6 B 0.47 A Jamboree Chapman Avenue 0.95 E 0.90 D Northbound SR-55 Chapman Avenue 0.74 C 0.70 B 4 Southbound SR-55 Chapman Avenue 0.64 B 8 A 5 Lewis Chapman Avenue 0.6 B 0.68 B 6 The City Chapman Avenue 0.70 B 0.84 D 7 The City Eastbound SR- Ramps 0.76 C 0.8 D 8 The City Westbound SR- Ramps 0. A 0.4 A 9 Glassell Collins Avenue 0.84 D 0.78 C 0 Glassell Katella Avenue 0.66 B 0.90 D Glassell La Veta Avenue 0.89 D 0.79 C Glassell Lincoln Avenue 0.74 C 0.89 D Glassell Taft Avenue 0.78 C 0.80 C 4 Glassell Walnut Avenue 0.64 B 0.7 C 5 Hewes Chapman Avenue 0.8 D 0.70 B 6 Northbound SR-55 Katella Avenue 0.76 C 0.85 D 7 Southbound SR-55 Katella Avenue 0.97 E 0.90 D 8 Main Chapman Avenue 0.80 C 0.90 D 9 Main Katella Avenue 0.75 C 0.85 D 0 Main La Veta Avenue 0.8 D 0.95 E Main Orangewood Avenue 0.7 C 0.6 B Main Taft Avenue 0.65 B 0.90 D Main Town & Country Road A 0.8 D 4 Newport Chapman Avenue 0.75 C 0.84 D 5 Santiago Nohl Ranch Road 0.69 B 0.76 C 6 Eckhoff Orangewood Avenue 0.60 A 0.69 B 7 State College Orangewood Avenue 0.70 B 0.69 B 8 Prospect Chapman Avenue 0.8 D 0.89 D 9 Prospect Walnut Avenue 0.8 D 0.80 C 40 Santiago Meats Avenue 0.8 D 0.70 B 4 Wanda Villa Park Road.5 F 0.9 E 4 Tustin Chapman Avenue 0.79 C 0.89 D 4 Tustin Collins Avenue 0.60 A 0.69 B 44 Tustin Fairhaven Avenue 0.86 D 0.7 C 45 Tustin Heim Avenue 0.60 A 0.85 D 46 Tustin Katella Avenue 0.70 B 0.9 E 47 Tustin La Veta Avenue 0.70 B 0.6 B 48 Tustin Lincoln Avenue 0.9 E.06 F 49 Tustin Meats Avenue A 0.7 C 50 Tustin Taft Avenue (North) 0.6 B 0.79 C 5 Tustin Taft Avenue (South) 0.7 C 0.90 D 5 Tustin Walnut Avenue 0.67 B 0.79 C 55 Struck Katella Avenue 0.4 A 0.46 A 56 Main Struck Avenue.0 F 0.70 B 57 Main Collins Avenue 0.96 E.9 F 58 Southbound SR-57 Orangewood Avenue 0.97 E 0.96 E 59 Northbound SR-57 Orangewood Avenue 0.60 A 0.49 A 60 State College NB I-5 Ramps/Anaheim Way 0 A 0.40 A 6 State College Southbound I-5 Ramps A 0.4 A 6 Southbound I-5 Chapman Avenue 0 A 7 A 6 Rampart Chapman Ave./Northbound I-5 Ramps 0.85 D 0.85 D 64 Southbound SR-57 Chapman Avenue 0.75 C 0.9 E 65 Northbound SR-57 Chapman Avenue 0.47 A 5 A Deficient Intersection, LOS E Deficient Intersection, LOS F Source: Orange Traffic Analysis Model (OTAM 004) Future Transportation Analysis 7
90
91 Table 4. Alternative Future Arterial Mitigation Recommendations ID Arterial From To MPAH Lanes 00 ADT LOS E Capacity V/C Ratio 8 Batavia Street Walnut Avenue Collins Avenue 4U,700 4, E 9 Batavia Street Collins Avenue Katella Avenue 4U,600 4, E Batavia Street Taft Avenue Fletcher Avenue 4U,000 4, E Batavia Street Fletcher Avenue Lincoln Avenue 4U,00 4, E Chapman Avenue Lemon Street Glassell Street U,00,000.0 F Chapman Avenue Glassell Street Grand Street U,500, F 4 Chapman Avenue Tustin Street SR-55 6D 5,800 56, E 5 Chapman Avenue SR-55 Yorba Street 8D 76,700 75,000.0 F LOS Mitigation Measure Improve to 4-lane divided facility No mitigation recommended through Historic Orange Plaza Monitor segment and evaluate intersections along Chapman Avenue between Tustin Street and Prospect Street to maximize throughput. 6 Chapman Avenue Yorba Street Prospect Street 6D 65,00 56,00.6 F Widen to 8-lane facility 7 Chapman Avenue Prospect Street Esplanade Street 6D 5,500 56, E Monitor segment and evaluate intersections along Chapman Avenue to maximize throughput. 40 Chapman Avenue Crawford Canyon Road Canyon View Avenue 4D 40,700 7, F Widen to 6-lane facility 47 Collins Avenue Batavia Street Glassell Street 4U,900 4, E Improve to 4-lane divided facility 49 Collins Avenue Cambridge Street Tustin Street 4U,700 4, E Improve to 4-lane divided facility 7 Glassell Street SR- La Veta Avenue 4D 5,00 7, E Widen to 6-lane facility 74 Glassell Street Chapman Avenue Palm Avenue U,600, F No mitigation recommended through Historic Orange Plaza 77 Glassell Street Katella Avenue Orange Olive Road 4D 40,00 7, F Improve to 6-lane divided facility 89 Katella Avenue Struck Avenue Main Street 6D 59,5 56, E 90 Katella Avenue Main Street Batavia Street 6D 59,5 56, E 9 Katella Avenue Batavia Street Glassell Street 6D 59,5 56, E 9 Katella Avenue Glassell Street Cambridge Street 6D 59,5 56, E Monitor upstream and downstream intersections to evaluate need for widening segment. 7 Main Street Town & Country Road La Veta Avenue 6D 55,400 56, E Widen to 8-lane facility 5 Prospect Street Chapman Avenue Spring Street 4U 4,00 4,000.0 F Improve to 4-lane divided facility 54 Prospect Street Spring Street Walnut Avenue 4U,700 4, E Improve to 4-lane divided facility 77 Taft Avenue West City Limit Main Street 6D 57,800 56,00.0 F 9 Tustin Street Chapman Avenue Walnut Avenue 6D 54,800 56, E 96 Tustin Street Collins Avenue Katella Avenue 6D 5,600 56, E 97 Tustin Street Katella Avenue Taft Avenue 6D 5,00 56, E Monitor upstream and downstream intersections to evaluate need for widening segment. Monitor upstream and downstream intersections to evaluate need for widening segment. 0 Wanda Road Katella Avenue Santiago Boulevard (VP) 4U 7,000 4,000. F Improve to 4-lane divided facility Deficient Segment, LOS E Deficient Segment, LOS F Future Transportation Analysis 7
92 P Westbound City of Orange: Circulation Element Traffic Analysis Table 4. Alternative Future Arterial Mitigation Recommendations (continued) Arterial Segment Level of Service With Mitigation Measure Implementation 8 Batavia Street Walnut Avenue Collins Avenue 4D,700 7,500 7 A 9 Batavia Street Collins Avenue Katella Avenue 4D,600 7, B Batavia Street Taft Avenue Fletcher Avenue 4D,000 7, B Batavia Street Fletcher Avenue Lincoln Avenue 4D,00 7,500 9 A Chapman Avenue Lemon Street Glassell Street U,00,000.0 F Chapman Avenue Glassell Street Grand Street U,500, F 4 Chapman Avenue Tustin Street SR-55 6D 5,800 56, E 5 Chapman Avenue SR-55 Yorba Street 8D 76,700 75,000.0 F 6 Chapman Avenue Yorba Street Prospect Street 8D 65,00 75, D 7 Chapman Avenue Prospect Street Esplanade Street 6D 5,500 56, E 40 Chapman Avenue Crawford Canyon Road Canyon View Avenue 4D 40,700 7, C 47 Collins Avenue Batavia Street Glassell Street 4D,900 7, B 49 Collins Avenue Cambridge Street Tustin Street 4D,700 7, B 7 Glassell Street SR- La Veta Avenue 6D 5,00 56, B 74 Glassell Street Chapman Avenue Palm Avenue U,600, F 77 Glassell Street Katella Avenue Orange Olive Road 6D 40,00 56, C 89 Katella Avenue Struck Avenue Main Street 6D 59,5 56, E 90 Katella Avenue Main Street Batavia Street 6D 59,5 56, E 9 Katella Avenue Batavia Street Glassell Street 6D 59,5 56, E 9 Katella Avenue Glassell Street Cambridge Street 6D 59,5 56, E 7 Main Street Town & Country Road La Veta Avenue 8D 55,400 75, C 5 Prospect Street Chapman Avenue Spring Street 4D 4,00 7, B 54 Prospect Street Spring Street Walnut Avenue 4D,700 7, B 77 Taft Avenue West City Limit Main Street 6D 57,800 56,00.0 F 9 Tustin Street Chapman Avenue Walnut Avenue 6D 54,800 56, E 96 Tustin Street Collins Avenue Katella Avenue 6D 5,600 56, E 97 Tustin Street Katella Avenue Taft Avenue 6D 5,00 56, E 0 Wanda Road Katella Avenue Santiago Boulevard (VP) 4D 7,000 7, C Table 4.4 ID Alternative Future Intersection Mitigation Recommendations Intersection Location A.M. Peak Hour P.M. Peak Hour ICU LOS ICU LOS Mitigation Measure 7 Cannon Santiago Canyon Road 0.9 E 0.9 E Apply ATMS to enhance capacity 8 Cannon Serrano Avenue 0.98 E 0.87 D Restripe Westbound Approach to Left Turn Lanes and shared Left-Right Lane Jamboree Chapman Avenue 0.95 E 0.90 D Add rd Northbound Left Turn Lane 7 Southbound SR-55 Katella Avenue 0.97 E 0.90 D Add nd Westbound Left Turn Lane 0 Main La Veta Avenue 0.8 D 0.95 E Apply ATMS applications to enhance capacity Add P Through Lane, Re-stripe Southbound Approach to.5 Through,.5 Right, 4 Wanda Villa Park Road.5 F 0.9 E Add nd Southbound Left Turn Lane 46 Tustin Katella Avenue 0.70 B 0.9 E Apply ATMS applications to enhance capacity Add rd Eastbound and Westbound Through Lane, 48 Tustin Lincoln Avenue 0.9 E.06 F Add nd Eastbound Right Turn Lane 56 Main Struck Avenue.0 F 0.70 B Add nd Eastbound and nd Westbound Through lanes Add one Northbound and Eastbound Right Turn 57 Main Collins Avenue 0.96 E.9 F Lane, Restripe Westbound approach to Left Turn Lanes and Though Lane 58 Southbound SR-57 Orangewood Avenue 0.97 E 0.96 E rd Convert Eastbound Right Turn Lane to rd Through Lane, Add nd Westbound Left Turn Lane 64 Southbound SR-57 Chapman Avenue 0.75 C 0.9 E Convert Northbound and Southbound Right Turn Lane to Through Lane, Convert Northbound and Southbound shared Left and Through lane to Left- Turn only lane; Alternate mitigation Apply ATMS Deficient Intersection, LOS E Deficient Intersection, LOS F Future Transportation Analysis 74
93 Table 4.4 City of Orange: Circulation Element Traffic Analysis Alternative Future Intersection Mitigation Recommendations (continued) Intersection Level of Service with Mitigation Measure Implementation ID Intersection Location A.M. Peak Hour P.M. Peak Hour ICU LOS ICU LOS 7 Cannon Santiago Canyon Road 0.87 D 0.88 D 8 Cannon Serrano Avenue 0.90 D 0.87 D Jamboree Chapman Avenue 0.88 D 0.89 D 7 Southbound SR-55 Katella Avenue 0.75 C 0.80 C 0 Main La Veta Avenue 0.78 C 0.90 D 4 Wanda Villa Park Road 0.85 D 0.84 D 46 Tustin Katella Avenue 0.65 B 0.87 D 48 Tustin Lincoln Avenue 0.70 B 0.85 D 56 Main Struck Avenue 0.80 C 0.6 B 57 Main Collins Avenue 0.85 D 0.86 D Southbound SR-57 Orangewood 0.74 C 0.7 C 58 Avenue Southbound SR-57 Chapman 0.79 C 0.90 D 64 Avenue 0.70 B 0.88 D 4. Alternative Future Daily Conditions A reduced intensity land use scenario was developed from the Project Alternative to evaluate potential reductions in traffic impacts associated with a lesser intensity of proposed buildout development. A full diamond interchange at SR-55 and Meats Avenue, incorporated into the Project Scenario, was also incorporated into the reduced intensity scenario to ensure consistency in the network assumptions between the two alternatives. Alternative assumes buildout of the proposed General Plan land use and buildout of the proposed MPAH as defined under the Project Scenario. The Meats Avenue interchange with SR-55 has the potential to relieve the congestion experienced at the SR-55 and Lincoln Avenue/Nohl Ranch Road and Katella Avenue interchanges. Post-processed OTAM year 00 forecast arterial volumes representing the Alternative conditions are reported in Table 4.5 with corresponding daily V/C ratio and LOS. Table 4.5 indicates that the Meats Avenue interchange slightly reduces traffic at the Lincoln Avenue/Nohl Ranch Road interchange but increases traffic activity along Meats Avenue, resulting in an unacceptable daily LOS. Meats Avenue is currently classified as a four-lane undivided facility. Improving Meats to a four-lane divided facility results in acceptable levels of service along Meats with an interchange at SR-55. Implementation of the Meats Avenue interchange also improves operations at the Chapman Avenue/SR-55 interchange and the surrounding arterial segments and intersections. Specifically, the southbound left turn volume and corresponding westbound right turn volumes at Tustin Street/Katella Avenue experience a reduction with the implementation of the Meats Avenue interchange. Close scrutiny of Table 4.5 will also show that there are many arterial segments that improve from the Project base scenario LOS. Figure 4. presents the Alternative forecast average daily traffic (ADT) volumes for arterial segments and the forecast year 00 arterial level of service is presented in Figure 4.. Future Transportation Analysis 75
94 Table 4.5 Alternative Future Arterial Daily Level of Service ID Arterial From To City of Orange: Circulation Element Traffic Analysis MPAH Lanes 00 ADT LOS E Capacity Almond Avenue Main Street Batavia Street U 7,00, B Almond Avenue Batavia Street Glassell Street U 6,800,000 7 A Almond Avenue Glassell Street Grand Street U 6,900,000 8 A 4 Almond Avenue Grand Street Cambridge Street U,700, A 5 Batavia Street La Veta Avenue Almond Avenue 4U,500 4,000 A 6 Batavia Street Almond Avenue Chapman Avenue 4U 4,800 4, B 7 Batavia Street Chapman Avenue Walnut Avenue 4U 9,00 4, C 8 Batavia Street Walnut Avenue Collins Avenue 4U 9,00 4, C 9 Batavia Street Collins Avenue Katella Avenue 4U 9,800 4, D 0 Batavia Street Katella Avenue Taft Avenue 4U 0,00 4, D Batavia Street Taft Avenue Fletcher Avenue 4U 9,800 4, D Batavia Street Fletcher Avenue Lincoln Avenue 4U 0,00 4, D Bond Avenue Prospect Street Hewes Street 4U 7,00 4, A 4 Cambridge Street South City Limits Palmyra Avenue U 7,700, B 5 Cambridge Street Palmyra Avenue Chapman Avenue U 8,600, C 6 Cambridge Street Chapman Avenue Palm Avenue U 8,400, B 7 Cambridge Street Palm Avenue Walnut Avenue U 7,700, B 8 Cambridge Street Walnut Avenue Collins Avenue U 8,000, B 9 Cambridge Street Collins Avenue Katella Avenue U 8,400, B 0 Cambridge Street Katella Avenue Taft Avenue 4U,800 4, A Cambridge Street Taft Avenue Meats Avenue 4U 7,900 4, A Canyon View Avenue Chapman Avenue Outrider Street 4D 6,400 7, A Canyon View Avenue Outrider Street Newport Boulevard 4D 6,00 7, A 4 Canyon View Avenue Newport Boulevard Jamboree Road 4D 5,700 7, A 5 Chapman Avenue Haster Street Lewis Street 5D,600 46, C 6 Chapman Avenue Lewis Street Manchester Avenue 6D 5,500 56, B 7 Chapman Avenue Manchester Avenue The City Drive 6D 9,900 56, C 8 Chapman Avenue The City Drive Eckhoff Street 6D 4,800 56, C 9 Chapman Avenue Eckhoff Street Main Street 6D 4,00 56, B 0 Chapman Avenue Main Street Batavia Street 4D,00 7,500 9 A Chapman Avenue Batavia Street Lemon Street 4D 0,700 7,500 5 A Chapman Avenue Lemon Street Glassell Street U 4,900,000.4 F Chapman Avenue Glassell Street Grand Street U 5,00,000.8 F Chapman Avenue Grand Street Cambridge Street 4D 4,400 7, B Chapman Avenue Cambridge Street Tustin Street 4D,500 7, D 4 Chapman Avenue Tustin Street SR-55 6D 50,00 56, D 5 Chapman Avenue SR-55 Yorba Street 8D 7,700 75, E 6 Chapman Avenue Yorba Street Prospect Street 6D 60,500 56,00.07 F 7 Chapman Avenue Prospect Street Esplanade Street 6D 47,700 56, D 8 Chapman Avenue Esplanade Street Hewes Street 6D 4,800 56, C 9 Chapman Avenue Hewes Street Crawford Canyon Road 6D 8,00 56, B 40 Chapman Avenue Crawford Canyon Road Canyon View Avenue 4D 5,800 7, E 4 Chapman Avenue Canyon View Avenue Orange Park Boulevard 4D 7,700 7, C 4 Chapman Avenue Orange Park Boulevard Newport Boulevard 4D 4,900 7, B 4 Chapman Avenue Newport Boulevard Jamboree Road 6D 44,00 56, C 44 Chapman Avenue Jamboree Road City Limit 6D 9,400 56, B 45 Collins Avenue Eckhoff Street Main Street 4U 5,00 4, B 46 Collins Avenue Main Street Batavia Street 4U 6,00 4, B 47 Collins Avenue Batavia Street Glassell Street 4U 0,00 4, D 48 Collins Avenue Glassell Street Cambridge Street 4U 7,000 4, C Deficient Segment, LOS E Deficient Segment, LOS F V/C Ratio LOS Future Transportation Analysis 76
95 Table 4.5 Alternative Future Arterial Daily Level of Service (continued) ID Arterial From To MPAH Lanes 00 ADT LOS E Capacity 49 Collins Avenue Cambridge Street Tustin Street 4U,400 4, D 50 Collins Avenue Tustin Street Handy Street 4U 4,500 4, A 5 Collins Avenue Handy Street Wanda Road 4U 4,000 4,000 8 A 5 Collins Avenue Wanda Road Prospect Street 4U 8,700 4, C 5 Crawford Canyon Road Barrett Avenue Chapman Avenue 4U 6,600 4, B 54 Cannon Street Chapman Avenue Creekside Avenue 4U,600 4,000 A 55 Cannon Street Creekside Avenue Patria Court 4U 8,400 4,000 A 56 Cannon Street Patria Court Santiago Canyon Road 4U 8,00 4, A 57 Cannon Street Santiago Canyon Road Taft Avenue 6D 45,00 56, C 58 Cannon Street Taft Avenue Via Escola 6D,00 56,00 7 A 59 Eckhoff Street Chapman Avenue Sycamore Avenue U 5,000, A 60 Eckhoff Street Orangewood Avenue Collins Avenue 4U 0,000 4, D 6 Esplanade Street Fairhaven Avenue La Veta Avenue 4U,00 4, A 6 Esplanade Street La Veta Avenue Chapman Avenue 4U 6,900 4, A 6 Fairhaven Avenue Glassell Street Cambridge Street 4U 0,00 4, A 64 Fairhaven Avenue Cambridge Street Tustin Street 4U 9,600 4, A 65 Fairhaven Avenue Tustin Street Yorba Street 4U 5,600 4, B 66 Fairhaven Avenue Yorba Street Prospect Street 4U 4,700 4, B 67 Fairhaven Avenue Prospect Street Esplanade Street 4U,500 4,000 6 A 68 Fairhaven Avenue Esplanade Street Hewes Street 4U,000 4,000 0 A 69 Fletcher Avenue Batavia Street Glassell Street 4U 5,600 4, A 70 Garden Grove Boulevard The City Drive Lewis Street 4D,000 7,500 9 A 7 Glassell Street SR- La Veta Avenue 4D 8,500 7,500.0 F 7 Glassell Street La Veta Avenue Almond Avenue 4D 7,00 7, A 7 Glassell Street Almond Avenue Chapman Avenue U 0,900, E 74 Glassell Street Chapman Avenue Palm Avenue U,500, E 75 Glassell Street Palm Avenue Collins Avenue 4D 7,00 7, A 76 Glassell Street Collins Avenue Katella Avenue 4D 4,000 7, B 77 Glassell Street Katella Avenue Orange Olive Road 4D,400 7, D 78 Glassell Street Orange Olive Road Grove Avenue 4D 9,00 7,500 A 79 Glassell Street Grove Avenue Lincoln Avenue 4D 5,700 7, B 80 Glassell Street Lincoln Avenue Santa Ana River 4D 6,800 7, C 8 Grand Street La Veta Avenue Palmyra Avenue U 9,000, C 8 Grand Street Almond Avenue Chapman Avenue U 0,000, D 8 Grand Street Chapman Avenue Maple Avenue U 6,900,000 8 A 8 Hewes Street Fairhaven Avenue Washington Avenue 4U 6,900 4, A 8 Hewes Street Washington Avenue Chapman Avenue 4U 0,00 4, A 84 Hewes Street Chapman Avenue Walnut Avenue 4U,00 4, A 85 Hewes Street Walnut Avenue Santiago Canyon Road 4U 9,00 4, A 86 Jamboree Road Santiago Canyon Road Chapman Avenue 6D 8,500 56,00 A 87 Jamboree Road Chapman Avenue Canyon View Avenue 6D 7,900 56,00 0 A 88 Jamboree Road Canyon View Avenue SR-4 6D,500 56,00 6 A 89 Katella Avenue* Struck Avenue Main Street 6D SS 49,900 59, D 90 Katella Avenue* Main Street Batavia Street 6D SS 5,00 59, D 9 Katella Avenue* Batavia Street Glassell Street 6D SS 49,800 59, D 9 Katella Avenue* Glassell Street Cambridge Street 6D SS 5,00 59, D 9 Katella Avenue* Cambridge Street Tustin Street 6D SS 46,00 59, C 94 Katella Avenue* Tustin Street SR-55 7D SS 50,000 68, C 95 Katella Avenue SR-55 Handy Street 6D 47,000 56, D 96 Katella Avenue Handy Street Wanda Road 6D 4,00 56, C 97 Katella Avenue Wanda Road Center Drive 6D 7,800 56, B Deficient Segment, LOS E Deficient Segment, LOS F V/C Ratio LOS Future Transportation Analysis 77
96 Table 4.5 Alternative Future Arterial Daily Level of Service (continued) ID Arterial From To City of Orange: Circulation Element Traffic Analysis MPAH Lanes 00 ADT LOS E Capacity 98 Katella Avenue Center Drive Santiago Canyon Road 6D 5,00 56, B 99 La Veta Avenue Flower Street Devon Street 6D,900 56,00 8 A 00 La Veta Avenue Devon Street Main Street 6D 9,400 56,00 A 0 La Veta Avenue Main Street Batavia Street 6D 8,00 56, B 0 La Veta Avenue Batavia Street Glassell Street 4D,600 7,500 8 A 0 La Veta Avenue Glassell Street Shaffer Street 4U,700 4, A 04 La Veta Avenue Shaffer Street Cambridge Street 4U 8,900 4, A 05 La Veta Avenue Tustin Street Yorba Street 4U 0,500 4, A 06 La Veta Avenue Yorba Street Prospect Street 4U,00 4, A 07 La Veta Avenue Prospect Street Esplanade Street 4U 8,00 4, A 08 Lemon Street La Veta Avenue Palmyra Avenue U 8,000, B 08 Lemon Street Chapman Avenue Maple Avenue U 8,400, B 08 Lemon Street Maple Avenue Walnut Avenue U,000, A 09 Lewis Street Garden Grove Avenue Metropolitan Drive 4U 6,800 4, B 0 Lewis Street Metropolitan Drive Chapman Avenue 4U 8,00 4, C Lewis Street Chapman Avenue Sirius Avenue 4U,700 4, A Lincoln Avenue West City Limit Batavia Street 6D 5,900 56, B Lincoln Avenue Batavia Street Glassell Street 6D 9,900 56,00 A 4 Lincoln Avenue Glassell Street Orange Olive Road 6D 9,700 56,00 A 5 Lincoln Avenue Orange Olive Road Tustin Street 6D 4,500 56, C 6 Lincoln Avenue Tustin Street Santiago Boulevard 6D 45,00 56, C 7 Main Street Town & Country Road La Veta Avenue 6D 54,600 56, E 8 Main Street La Veta Avenue Chapman Avenue 6D 46,400 56, D 9 Main Street Chapman Avenue Sycamore Avenue 6D 5,600 56, B 0 Main Street Sycamore Avenue Collins Avenue 6D 6,700 56, B Main Street Collins Avenue Struck Avenue 4D,900 7, D Main Street Struck Avenue Katella Avenue 4D,800 7, D Main Street Katella Avenue Taft Avenue 4D 4,600 7, B 4 Meats Avenue Glassell Street Orange Olive Road 4U 0,800 4, A 5 Meats Avenue Orange Olive Road Cambridge Street 4U 5,00 4, B 6 Meats Avenue Cambridge Street Tustin Street 4U 8,400 4, C 7 Meats Avenue Tustin Street SR-55 SB Ramps 4U 5,800 4,000.6 F 7 Meats Avenue SR-55 SB Ramps SR-55 NB Ramps 4U 4,00 4, F 7 Meats Avenue SR-55 NB Ramps Santiago Boulevard 4U 9,600 4,000. F 8 Meats Avenue Santiago Boulevard Featherhill Road 4U 5,00 4, B 9 Meats Avenue Featherhill Road Via Escola 4U 7,900 4, A 0 Metropolitan Drive Lewis Street SR- Westbound Ramps 4U 9,00 4, A Metropolitan Drive SR- Westbound Ramps The City Drive 4U 8,800 4, C Metropolitan Drive The City Drive Chapman Avenue 4U 0,00 4, D Manchester Avenue Chapman Avenue Compton Avenue 4D,000 7, A Newport Boulevard South City Limits Canyon View Avenue 4D 9,000 7, A 4 Newport Boulevard Canyon View Avenue Chapman Avenue 4D 7,800 7, A 5 Newport Boulevard Chapman Avenue Santiago Canyon Road 4D 4,00 7, A 6 Nohl Ranch Road Santiago Boulevard East City Limit 4U,00 4,000 0 A 7 Orange Olive Road Glassell Street Meats Avenue 4U 7,600 4, C 8 Orange Olive Road Meats Avenue Lincoln Avenue 4U 5,900 4, B 9 Orange Olive Road Lincoln Avenue Santa Ana Canyon Road 4U,700 4,000 7 A 40 Orange Olive Road Santa Ana Canyon Road Riverdale Avenue 4U 0,000 4, A 4 Orangewood Avenue Eckhoff Street Main Street 6D 5,800 56, B 4 Palm Avenue Main Street Batavia Street U 5,00, A 4 Palm Avenue Batavia Street Cypress Street U 0,00, D 44 Palm Avenue Cypress Street Glassell Street U 8,700, C Deficient Segment, LOS E Deficient Segment, LOS F V/C Ratio LOS Future Transportation Analysis 78
97 Table 4.5 Alternative Future Arterial Daily Level of Service (continued) ID Arterial From To MPAH Lanes 00 ADT LOS E Capacity 45 Palm Avenue Glassell Street Cambridge Street U 6,00,000 A 46 Palm Avenue Cambridge Street Tustin Street U 8,00, B 47 Palmyra Avenue Batavia Street Glassell Street U,500, A 48 Palmyra Avenue Glassell Street Cambridge Street U,700, A 49 Palmyra Avenue Cambridge Street Tustin Street U 5,500, A 50 Parker Street La Veta Avenue Town & Country Road 4U 0,00 4, D 5 Prospect Street Fairhaven Avenue La Veta Avenue 4U 9,700 4, A 5 Prospect Street La Veta Avenue Chapman Avenue 4U,400 4,000 A 5 Prospect Street Chapman Avenue Spring Street 4U,700 4, D 54 Prospect Street Spring Street Walnut Avenue 4U,00 4, D 55 Prospect Street Walnut Avenue Bond Avenue 4U 6,500 4, B 56 Rampart Street Chapman Avenue Orangewood Avenue 4U 8,900 4, C 57 Rancho Santiago Boulevard Chapman Avenue Walnut Avenue U 8,00, B 58 Rancho Santiago Boulevard Hewes Street Bond Avenue U,00, A 59 Riverdale Avenue Glassell Street Orange Olive Road 4U 6,000 4,000 A 60 Riverdale Avenue Orange Olive Road Tustin Street 4U 8,00 4, A 6 Santa Ana Canyon Road Lincoln Avenue Nohl Ranch Road 6D 5,700 56, A 6 Santiago Boulevard Wanda Road Taft Avenue 4U 5,00 4, B 6 Santiago Boulevard Taft Avenue Villa Real Drive 4U,00 4,000 A 64 Santiago Boulevard Villa Real Drive Lincoln Avenue 4U,900 4,000 8 A 65 Santiago Canyon Road Hewes Street Cannon Street 6D 7,000 56, B 66 Santiago Canyon Road Cannon Street Orange Park Boulevard 6D 44,500 56, C 67 Santiago Canyon Road Orange Park Boulevard Meads Avenue 6D 40,500 56, C 68 Santiago Canyon Road Meads Avenue Newport Boulevard 6D 8,800 56, B 69 Santiago Canyon Road Newport Boulevard Jamboree Road 6D 8,00 56,00 0 A 70 Santiago Canyon Road Jamboree Road Street D 6D 9,400 56, B 4 Santiago Canyon Road Street D SR-4 6D 7,000 56, A Santiago Canyon Road East of SR-4 4D 4,000 7, B 7 Serrano Avenue Cannon Street Orange Park Boulevard 4D,900 7, B 7 Serrano Avenue Orange Park Boulevard Apache Creek 4D 9,800 7,500 A 7 Serrano Avenue Apache Creek East City Limit 4D,000 7, A 74 Shaffer Street La Veta Avenue Palmyra Avenue U,000, A 74 Shaffer Street Chapman Avenue Maple Avenue U 5,400, A 74 Shaffer Street Palm Avenue Walnut Avenue U 7,000,000 8 A 74 Shaffer Street Walnut Avenue Collins Avenue U 0,600, D 744 Shaffer Street Collins Avenue Katella Avenue U 7,000,000 8 A 75 Spring Street Prospect Street Olympia Way 4U,500 4,000 6 A 76 Struck Avenue Katella Avenue Main Street U 9,400, C 77 Taft Avenue West City Limit Main Street 6D 54,00 56, E 78 Taft Avenue Main Street Batavia Street 6D 5,400 56, B 79 Taft Avenue Batavia Street Glassell Street 6D,500 56,00 8 A 80 Taft Avenue Glassell Street Cambridge Street 6D,00 56, A 8 Taft Avenue Cambridge Street Tustin Street 6D 9,600 56,00 A 8 Taft Avenue Tustin Street Santiago Boulevard 4U,00 4,000 5 A 8 Taft Avenue Cannon Street Yurok Street U 8,000, B 84 The City Drive Garden Grove Boulevard SR- 6D 5,800 56, B 85 The City Drive SR- Metropolitan 6D 45,900 56, D 86 The City Drive Metropolitan Chapman Avenue 8D 5,00 75, A 87 The City Drive Chapman Avenue North City Limits 8D 4,00 75, A 88 Town & Country Road Main Street SR- 4D 7,500 7, C 89 Town & Country Road SR- Parker Street 4D 5,00 7, A 90 Tustin Street Fairhaven Avenue La Veta Avenue 6D 6,800 56, B 9 Tustin Street La Veta Avenue Palmyra Avenue 6D 9,400 56,00 A Deficient Segment, LOS E Deficient Segment, LOS F V/C Ratio LOS Future Transportation Analysis 79
98 Table 4.5 Alternative Future Arterial Daily Level of Service (continued) ID Arterial From To MPAH Lanes 00 ADT LOS E Capacity V/C Ratio LOS 9 Tustin Street Palmyra Avenue Chapman Avenue 6D 0,800 56,00 5 A 9 Tustin Street Chapman Avenue Walnut Avenue 6D 44,600 56, C 94 Tustin Street Walnut Avenue Mayfair Avenue 6D 6,400 56, B 95 Tustin Street Mayfair Avenue Collins Avenue 6D 5,700 56, B 96 Tustin Street Collins Avenue Katella Avenue 6D 4,700 56, C 97 Tustin Street Katella Avenue Taft Avenue 6D 4,400 56, C 98 Tustin Street Taft Avenue Meats Avenue 6D 6,000 56, B 99 Tustin Street Meats Avenue Lincoln Avenue 6D 7,000 56, B 00 Tustin Street Lincoln Avenue Santa Ana Canyon Road 6D 7,700 56, A 0 Via Escola Meats Avenue Cannon Street 4U 4,00 4, A 0 Villa Real Drive Santiago Boulevard Chapel Hill U,700, A 0 Walnut Avenue Main Street Batavia Street U 8,700, C 04 Walnut Avenue Batavia Street Cypress Street U 9,00, C 05 Walnut Avenue Cypress Street Glassell Street U 9,700, D 06 Walnut Avenue Glassell Street Cambridge Street U 8,500, C 07 Walnut Avenue Cambridge Street Tustin Street U 9,500, C 08 Walnut Avenue Tustin Street Handy Street U 0,400, D 09 Wanda Road Collins Avenue Katella Avenue 4U 4,00 4,000 9 A 0 Wanda Road Katella Avenue Santiago Boulevard (VP) 4U 4,800 4,000.0 F Yorba Street Fairhaven Avenue La Veta Avenue 4U 7,700 4, A Yorba Street La Veta Avenue Chapman Avenue 4U,00 4, A Deficient Segment, LOS E Deficient Segment, LOS F Note: * Katella Avenue capacity has been increased by 5% due to classification as a Smart Street. Source: Orange Traffic Analysis Model (OTAM 004) Future Transportation Analysis 80
99 A I 0 E Figure 4. - Alternative Future Average Daily Traffic on Arterial Segments (in Thousands) 6 40 ANAHEIM LEWIS ST 5 ETROPOLIT AN DR 7 9 GA RDEN GRO 4 THE CI TY 5 0 DR 6 V E STATE COLLEGE BLVD 9 BL VD ORANGEW S T 4 9 BRISTOL ST T OD AVE R R M P A 57 FLOWER ST ECKHOFF ST S A N T STRUCK AVE DEVON RD 6 MAIN ST A N A A BATAVIA ST ALMOND AVE LAWSON WY R M E M O I V 5 R Y E R FLE TCHE R PARKER ST L N LEMON ST 7 9 GLASSELL ST GRAND ST R L INCOLN A V E ST IVERD ORANGE OLIVE RD MEATS AVE TAFT AVE SHAFFER ST LA VETA AVE A L E HEIM AVE FAIRHAVEN AVE KATELLA AVE CAMBRIDGE ST A V WALNUT AVE SANTA ANA E PALM AVE TUSTIN ST COLLINS AVE PALMYRA AVE TAFT AVE HANDY ST 8 R N O H L 8 9 ORANGE S A N T I A GO CREEK YORBA ST SANTA ANA CANYON RD D L E A WANDA RD R V L L A CHAPMAN AVE PROSPECT ST R A N C H VILLA PARK VILLA PARK RD R D V I A 7 BOND AVE SPRING ST ESPLANADE ST E 5 44 S 4 7 C O HEWES ST L A M E S A RANCHO SANTIAGO BLVD D R C A NNO N ST 45 8 ANAHEIM HILLS 6 TUSTIN ORANGE PARK BLVD 0 SE R RANO AVE C A NY O 4 N SANTIAGO CANYON RD A V M A P N E W O IE W T POR L A A BL V D A V 6 V E 9 E LEGEND City of Orange Water Area Roadway Sphere of Influence Adjacent Cities Railroad J 9 A M B OR EE RD EAST ORANGE 7 Miles 6 4 S T R E T 4 D 4 5 Source File: Fig4--y0-Alt-Artl-ADT map
100 V C A NNO N T Figure 4. - Alternative Future Arterial Daily Level of Service ANAHEIM STATE COLLEGE BLVD 57 A S A N T N A A R I V E R L INCOLN AVE FLETCHER ST GLASSELL ST BATAVIA ST R 9 9 I V E R D A ORANGE OLIVE RD L E A V E HEIM AVE MEATS AVE S ANT IAGO BL V D SANTA R D L A E ANA CANYON RD N O H L I L L A R R A NCH RD V I A E S C O L A ME S A DR ANAHEIM HILLS SERRANO AVE LEGEND City of Orange Water Area Roadway Sphere of Influence Adjacent Cities Railroad LOS A-D LOS E LOS F Miles TAFT AVE 55 TAFT AVE VILLA PARK MAIN ST VILLA PARK RD SANTIAGO CANYON RD M E 5 TROPOL E T H LEWIS ST ITAN GARDEN GROVE BLVD DR C ITY ORANGEWOOD AVE D R RA MPART ST FLOWER ST BRISTOL ST ECKHOFF ST STRUCK AVE DEVON RD ALMOND AVE LAWSON WY M Y E M O R L PARKER ST N LEMON ST SHAFFER ST GRAND ST LA VETA AVE KATELLA AVE COLLINS AVE WALNUT AVE PALM AVE PALMYRA AVE CAMBRIDGE ST SANTA ANA TUSTIN ST 55 WANDA RD HANDY ST S ANTIAGO ORANGE CREEK CHAPMAN AVE BOND AVE SPRING ST ESPLANADE ST PROSPECT ST YORBA ST FAIRHAVEN AVE HEWES ST RANCHO SANTIAGO ST S T C A TUSTIN ORANGE PARK BLVD NY O N A M V I A P O L E W T N E W POR A A B L V D V A V E E J A M B O R E E R D 6 EAST ORANGE S R E E T D Source File: Fig4--y0-Alt-Artl-LOS map
101 4. Alternative Future Intersection Peak Hour Conditions Table 4.6 presents forecast year 00 ICU and LOS results for turning movement volumes at the critical intersections during the morning (A.M.) and evening (P.M.) peak hours for Alternative. The intersection geometrics are consistent with the Project Scenario assumptions presented in Appendix D. Consistent with the arterial segment volume forecasts, turning movements for the intersections were post-processed. Figure 4. illustrates peak hour levels of service. Alternative results in ten study intersections forecast to operate at an unacceptable LOS in either the A.M. or the P.M. peak hour: Cannon Street at Serrano Avenue (LOS E in A.M. peak hour) Southbound SR-55 Ramps at Katella Avenue (LOS E in A.M. peak hour) Main Street at La Veta Avenue (LOS E in P.M. peak hour) Santiago Boulevard at Meats Avenue (LOS E in A.M. peak hour) Wanda Road at Villa Park Road (LOS F in A.M. peak hour, LOS E in P.M. peak hour) Tustin Street at Lincoln Avenue (LOS E in P.M. peak hour) Main Street at Struck Avenue (LOS F in A.M. peak hour) Main Street at Collins Avenue (LOS E in A.M. peak hour, LOS F in P.M. peak hour) Southbound SR-57 Ramps at Orangewood Avenue (LOS E in both A.M. and P.M. peak hour) Southbound SR-57 Ramps at Chapman Avenue (LOS E in P.M. peak hour) The addition of the Meats Avenue interchange with SR-55 reduces volumes through the intersections of Santiago Boulevard at Nohl Ranch Road and Tustin Street at Lincoln Avenue, although Tustin Street at Lincoln Avenue continues to experiences an unacceptable level of service. The intersection of Santiago Boulevard at Meats Avenue deteriorates to unacceptable A.M. peak hour performance. Intersection improvements would be required to ensure efficient operation of this intersection with the addition of an interchange at Meats Avenue. It should be noted that this intersection operates at an unacceptable LOS F under existing conditions for the A.M. peak hour and buildout geometrics improve the level of service at this intersection. Appendix E presents future Alternative ICU worksheets for each intersection. 4. Alternative Future Mitigation Specific arterial mitigation measures for Alternative are generally consistent with those developed for the Project (refer to Section 4.7). Table 4.7 presents Alternative arterial mitigation. While fewer segments operate at deficient levels of service under Alternative conditions than Project conditions, the segments that fail under Alternative conditions also fail under Project conditions. Recommended mitigation measures for deficient Alternative intersections are presented in Table 4.8. Six intersections are forecast to operate at a deficient level of service under Future Alternative conditions. Generally, intersection mitigation measures proposed include the provision of additional turning lane capacity. The recommended mitigation measures are generally consistent with those developed under Project conditions and can be referenced in Section 4.7. ICU worksheets for the recommended mitigation measures are included in Appendix H. Under Alternative conditions, improvements are not required from ultimate configurations at the Santiago Meats Avenue interchange, even with implementation of the Meats Avenue/SR-55 interchange. The ramp intersections of Meats Avenue with SR-55 were evaluated under peak hour conditions to identify potential deficiencies associated with the proposed interchange. In order to obtain acceptable peak hour operations at the southbound SR-55 intersection with Meats Avenue, the southbound off-ramp should include an exclusive left turn lane, an exclusive right turn lane, and a shared left turn-right turn lane. Although the intersection operates at LOS C during the peak hours, the westbound left turn volume of approximately 500 vehicles during the A.M. peak hour suggests a second westbound left turn lane might be necessary to ensure there are no queuing issues with the west turn traffic onto southbound SR- Future Transportation Analysis 8
102 55 on the Meats Avenue overcrossing bridge. Both intersections assume through lanes in each direction and an exclusive right turn lane to access the SR-55 ramps. For the northbound SR-55 intersection with Meats Avenue, dual northbound left turn lanes are required to satisfy forecast demands. In addition, dual eastbound left turn lanes are required on the overcrossing bridge to support the high P.M. peak hour volumes accessing SR-55 northbound. Table 4.6 ID Alternative Future Intersection Level of Service Intersection Location A.M. Peak Hour P.M. Peak Hour ICU LOS ICU LOS Batavia Collins Avenue 0.68 B 0.88 D Batavia Katella Avenue 0.65 B 0.80 C Batavia Lincoln Avenue 0.69 B 0.68 B 4 Batavia Taft Avenue 0.80 C 0.7 C 5 Batavia Walnut Avenue 0.70 B 0.64 B 6 Cambridge Katella Avenue 0.68 B 0.8 D 7 Cannon Santiago Canyon Road 0.9 E 0.90 D 8 Cannon Serrano Avenue 0.97 E 0.87 D 9 Cannon Street/ Crawford Chapman Avenue 0.70 B 0.65 B 0 Yorba Chapman Avenue 0.7 C 0.77 C Canyon View Chapman Avenue 6 A 0.4 A Jamboree Chapman Avenue 0.88 D 0.90 D Northbound SR-55 Chapman Avenue 0.7 C 0.67 B 4 Southbound SR-55 Chapman Avenue 8 A 0.6 B 5 Lewis Chapman Avenue 0.6 B 0.67 B 6 The City Chapman Avenue 0.7 C 0.8 D 7 The City Eastbound SR- Ramps 0.76 C 0.8 D 8 The City Westbound SR- Ramps 0. A 0.46 A 9 Glassell Collins Avenue 0.75 C 0.70 B 0 Glassell Katella Avenue 0.65 B 0.84 D Glassell La Veta Avenue 0.90 D 0.79 C Glassell Lincoln Avenue 0.69 B 0.84 D Glassell Taft Avenue 0.77 C 0.75 C 4 Glassell Walnut Avenue 0.77 C 0.77 C 5 Hewes Chapman Avenue 0.7 C 0.64 B 6 Northbound SR-55 Katella Avenue 0.76 C 0.84 D 7 Southbound SR-55 Katella Avenue 0.98 E 0.8 D 8 Main Chapman Avenue 0.79 C 0.90 D 9 Main Katella Avenue 0.7 C 0.86 D 0 Main La Veta Avenue 0.79 C 0.9 E Main Orangewood Avenue 0.64 B 8 A Main Taft Avenue 0.68 B 0.80 C Main Town & Country Road A 0.84 D 4 Newport Chapman Avenue 0.74 C 0.85 D 5 Santiago Nohl Ranch Road 0.60 A 0.6 B 6 Eckhoff Orangewood Avenue 8 A 0.6 B 7 State College Orangewood Avenue 0.69 B 0.67 B 8 Prospect Chapman Avenue 0.8 D 0.80 C 9 Prospect Walnut Avenue 0.74 C 0.7 C 40 Santiago Meats Avenue 0.88 D 0.76 C 4 Wanda Villa Park Road.7 F 0.9 E 4 Tustin Chapman Avenue 0.7 C 0.88 D 4 Tustin Collins Avenue 5 A 0.60 A 44 Tustin Fairhaven Avenue 0.84 D 0.74 C 45 Tustin Heim Avenue 7 A 0.69 B 46 Tustin Katella Avenue 0.64 B 0.79 C 47 Tustin La Veta Avenue 0.69 B 6 A 48 Tustin Lincoln Avenue 0.87 D 0.95 E 49 Tustin Meats Avenue 4 A 0.78 C 50 Tustin Taft Avenue (North) 0.6 B 0.7 C 5 Tustin Taft Avenue (South) 0.68 B 0.77 C 5 Tustin Walnut Avenue 0.64 B 0.7 C Future Transportation Analysis 84
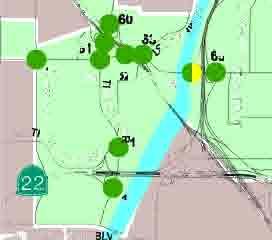
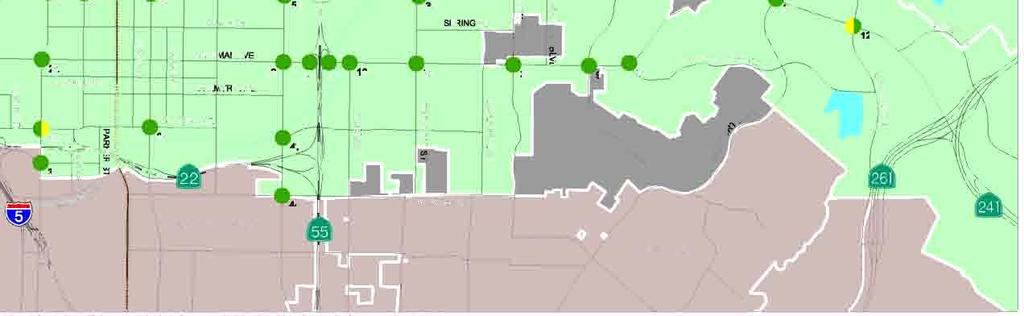
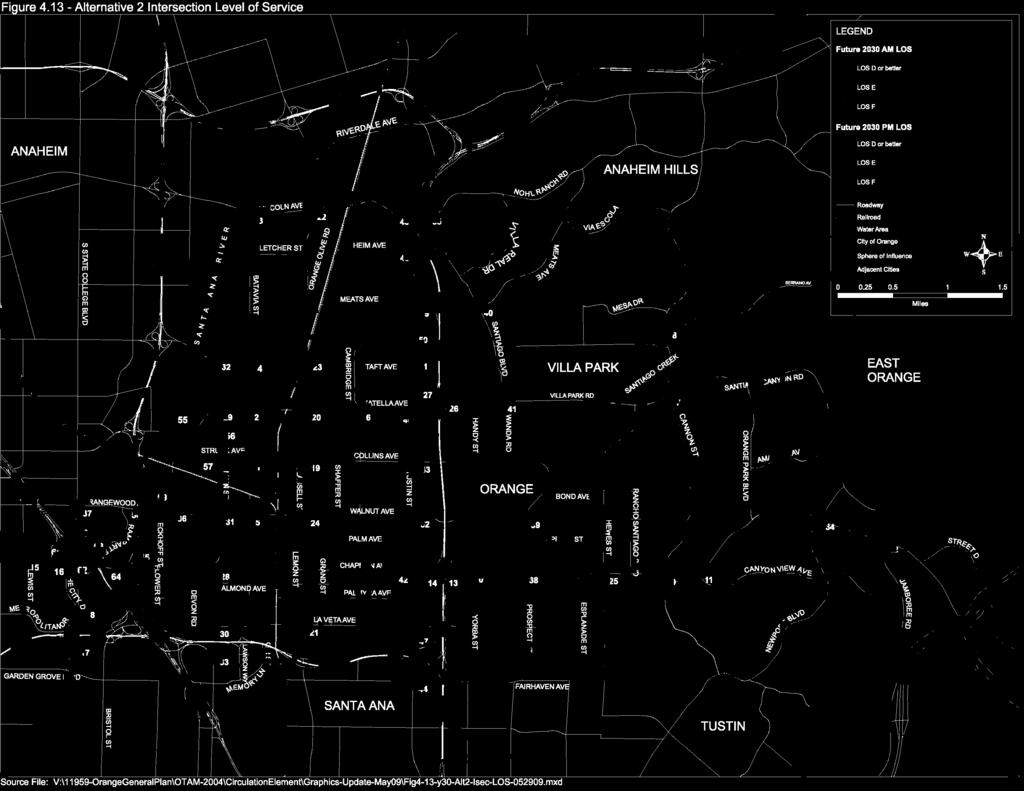
103
TABLE OF CONTENTS SECTION PAGE. Executive Summary... xii
 TABLE OF CONTENTS SECTION PAGE Executive Summary... xii 1.0 Introduction... 1 1.1 Study Area... 2 1.2 Traffic Impact Analysis Scenarios... 4 1.3 Study Area - City of Orange... 4 2.0 Project Description
Traffic Impact Analysis 5742 BEACH BOULEVARD MIXED USE PROJECT
 Traffic Impact Analysis 5742 BEACH BOULEVARD MIXED USE PROJECT CITY OF BUENA PARK Prepared by Project No. 14139 000 April 17 th, 2015 DKS Associates Jeffrey Heald, P.E. Rohit Itadkar, T.E. 2677 North Main
APPENDIX H. Transportation Impact Study
 APPENDIX H Transportation Impact Study BUENA VISTA LAGOON ENHANCEMENT PROJECT TRANSPORTATION IMPACT STUDY Prepared for: San Diego Association of Governments Prepared by: VRPA Technologies, Inc. 9520 Padgett
Table Existing Traffic Conditions for Arterial Segments along Construction Access Route. Daily
 5.8 TRAFFIC, ACCESS, AND CIRCULATION This section describes existing traffic conditions in the project area; summarizes applicable regulations; and analyzes the potential traffic, access, and circulation
Oakbrook Village Plaza City of Laguna Hills
 Oakbrook Village Plaza City of Laguna Hills Traffic Impact Analysis Prepared by: HDR Engineering 3230 El Camino Real, Suite 200 Irvine, CA 92602 October 2012 Revision 3 D-1 Oakbrook Village Plaza Laguna
Escondido Marriott Hotel and Mixed-Use Condominium Project TRAFFIC IMPACT ANALYSIS REPORT
 Escondido Marriott Hotel and Mixed-Use Condominium Project TRAFFIC IMPACT ANALYSIS REPORT Prepared for Phelps Program Management 420 Sixth Avenue, Greeley, CO 80632 Prepared by 5050 Avenida Encinas, Suite
2. Valley Circle Boulevard/Andora Avenue/Baden Avenue and Lassen Street
 IV.J TRANSPORTATION 1. INTRODUCTION This section presents an overview of the existing traffic and circulation system in and surrounding the project site. This section also discusses the potential impacts
LAWRENCE TRANSIT CENTER LOCATION ANALYSIS 9 TH STREET & ROCKLEDGE ROAD / 21 ST STREET & IOWA STREET LAWRENCE, KANSAS
 LAWRENCE TRANSIT CENTER LOCATION ANALYSIS 9 TH STREET & ROCKLEDGE ROAD / 21 ST STREET & IOWA STREET LAWRENCE, KANSAS TRAFFIC IMPACT STUDY FEBRUARY 214 OA Project No. 213-542 TABLE OF CONTENTS 1. INTRODUCTION...
The major roadways in the study area are State Route 166 and State Route 33, which are shown on Figure 1-1 and described below:
 3.5 TRAFFIC AND CIRCULATION 3.5.1 Existing Conditions 3.5.1.1 Street Network DRAFT ENVIRONMENTAL IMPACT REPORT The major roadways in the study area are State Route 166 and State Route 33, which are shown
TIMBERVINE TRANSPORTATION IMPACT STUDY FORT COLLINS, COLORADO JANUARY Prepared for:
 TIMBERVINE TRANSPORTATION IMPACT STUDY FORT COLLINS, COLORADO JANUARY 2014 Prepared for: Hartford Companies 1218 W. Ash Street Suite A Windsor, Co 80550 Prepared by: DELICH ASSOCIATES 2272 Glen Haven Drive
Appendix Q Traffic Study
 Appendices Appendix Q Traffic Study Crummer Site Subdivision Draft EIR City of Malibu Appendices This page intentionally left blank. The Planning Center April 2013 TRAFFIC IMPACT ANALYSIS Photo z here
Craig Scheffler, P.E., PTOE HNTB North Carolina, P.C. HNTB Project File: Subject
 TECHNICAL MEMORANDUM To Kumar Neppalli Traffic Engineering Manager Town of Chapel Hill From Craig Scheffler, P.E., PTOE HNTB North Carolina, P.C. Cc HNTB Project File: 38435 Subject Obey Creek TIS 2022
Chapter 9 Recommended Locally Preferred Alternative and Alternatives for Evaluation in Draft SEIS/SEIR
 Chapter 9 Recommended Locally Preferred Alternative and Alternatives for Evaluation in Draft SEIS/SEIR 9.0 RECOMMENDED LOCALLY PREFERRED ALTERNATIVE AND ALTERNATIVES FOR EVALUATION IN DRAFT SEIS/SEIR
APPENDIX B Traffic Analysis
 APPENDIX B Traffic Analysis Rim of the World Unified School District Reconfiguration Prepared for: Rim of the World School District 27315 North Bay Road, Blue Jay, CA 92317 Prepared by: 400 Oceangate,
King County Metro. Columbia Street Transit Priority Improvements Alternative Analysis. Downtown Southend Transit Study. May 2014.
 King County Metro Columbia Street Transit Priority Improvements Alternative Analysis Downtown Southend Transit Study May 2014 Parametrix Table of Contents Introduction... 1 Methodology... 1 Study Area...
APPENDIX C1 TRAFFIC ANALYSIS DESIGN YEAR TRAFFIC ANALYSIS
 APPENDIX C1 TRAFFIC ANALYSIS DESIGN YEAR TRAFFIC ANALYSIS DESIGN YEAR TRAFFIC ANALYSIS February 2018 Highway & Bridge Project PIN 6754.12 Route 13 Connector Road Chemung County February 2018 Appendix
Volume 1 Traffic Impact Analysis Turtle Creek Boulevard Dallas, Texas. Kimley-Horn and Associates, Inc. Dallas, Texas.
 Volume 1 Traffic Impact Analysis 2727 Dallas, Texas June 18, 2018 Kimley-Horn and Associates, Inc. Dallas, Texas Project #064523000 Registered Firm F-928 Traffic Impact Analysis 2727 Dallas, Texas Prepared
TRAFFIC IMPACT STUDY FOR SONIC DRIVE-IN RESTAURANT. Vallejo, CA. Prepared For:
 TRAFFIC IMPACT STUDY FOR SONIC DRIVE-IN RESTAURANT Vallejo, CA Prepared For: ELITE DRIVE-INS, INC. 2190 Meridian Park Blvd, Suite G Concord, CA 94520 Prepared By: KD Anderson & Associates 3853 Taylor Road,
Key Project Elements Status Report
 Los Angeles County Metropolitan Transportation Authority Key Project Elements Status Report presented to the Corridor Advisory Committee August 18, 2016 Background Motion 22.1 elements are grouped into
Section 5.8 Transportation and Traffic
 Section 5.8 Transportation and Traffic 5.8 TRANSPORTATION AND TRAFFIC Generous This Section is based on the Topgolf Specific Plan Traffic Impact Analysis (RK Engineering Group, Inc., October 31, 2016);
I-820 (East) Project Description. Fort Worth District. Reconstruct Southern I-820/SH 121 Interchange
 Project Description. Fort Worth District. Reconstruct Southern I-820/SH 121 Interchange") I-820 (East) Project Description Fort Worth District Reconstruct Southern I-820/SH 121 Interchange I-820 from approximately 2,000 feet north of Pipeline Road/Glenview Drive to approximately 3,200 feet
I-820 (East) Project Description Fort Worth District Reconstruct Southern I-820/SH 121 Interchange I-820 from approximately 2,000 feet north of Pipeline Road/Glenview Drive to approximately 3,200 feet
King Soopers #116 Thornton, Colorado
 Traffic Impact Study King Soopers #116 Thornton, Colorado Prepared for: Galloway & Company, Inc. T R A F F I C I M P A C T S T U D Y King Soopers #116 Thornton, Colorado Prepared for Galloway & Company
EXECUTIVE SUMMARY. The following is an outline of the traffic analysis performed by Hales Engineering for the traffic conditions of this project.
 EXECUTIVE SUMMARY This study addresses the traffic impacts associated with the proposed Shopko redevelopment located in Sugarhouse, Utah. The Shopko redevelopment project is located between 1300 East and
TRAFFIC IMPACT ANALYSIS FOR. McDONALD S RESTAURANT IN CARMICAEL Sacramento County, CA. Prepared For:
 TRAFFIC IMPACT ANALYSIS FOR McDONALD S RESTAURANT IN CARMICAEL Sacramento County, CA Prepared For: McDonald s USA, LLC Pacific Sierra Region 2999 Oak Road, Suite 900 Walnut Creek, CA 94597 Prepared By:
INDUSTRIAL DEVELOPMENT
 INDUSTRIAL DEVELOPMENT Traffic Impact Study Plainfield, Illinois August 2018 Prepared for: Seefried Industrial Properties, Inc. TABLE OF CONTENTS Executive Summary 2 Introduction 3 Existing Conditions
Date: February 7, 2017 John Doyle, Z-Best Products Robert Del Rio. T.E. Z-Best Traffic Operations and Site Access Analysis
 Memorandum Date: February 7, 07 To: From: Subject: John Doyle, Z-Best Products Robert Del Rio. T.E. Z-Best Traffic Operations and Site Access Analysis Introduction Hexagon Transportation Consultants, Inc.
2.0 Development Driveways. Movin Out June 2017
 Movin Out June 2017 1.0 Introduction The proposed Movin Out development is a mixed use development in the northeast quadrant of the intersection of West Broadway and Fayette Avenue in the City of Madison.
Proposed location of Camp Parkway Commerce Center. Vicinity map of Camp Parkway Commerce Center Southampton County, VA
 Proposed location of Camp Parkway Commerce Center Vicinity map of Camp Parkway Commerce Center Southampton County, VA Camp Parkway Commerce Center is a proposed distribution and industrial center to be
Appendix G: Transportation/Traffic
 City of Irvine - William Lyon Homes: Vista Verde Draft EIR Appendix G: Transportation/Traffic Michael Brandman Associates H:\Client (PN-JN)\0006\00060034\EIR\3 - DEIR\00060034 Sec99-00 Appendix Dividers
Lacey Gateway Residential Phase 1
 Lacey Gateway Residential Phase Transportation Impact Study April 23, 203 Prepared for: Gateway 850 LLC 5 Lake Bellevue Drive Suite 02 Bellevue, WA 98005 Prepared by: TENW Transportation Engineering West
APPENDIX E. Traffic Analysis Report
 APPENDIX E Traffic Analysis Report THIS PAGE INTENTIONALLY BLANK EAGLE RIVER TRAFFIC MITIGATION PHASE I OLD GLENN HIGHWAY/EAGLE RIVER ROAD INTERSECTION IMPROVEMENTS TRAFFIC ANALYSIS Eagle River, Alaska
TALMONT TOWNHOMES MADISON KENNETH SPA TRAFFIC IMPACT STUDY. Sacramento, CA. Prepared For: MBK Homes. Prepared By:
 TALMONT TOWNHOMES MADISON KENNETH SPA TRAFFIC IMPACT STUDY Sacramento, CA Prepared For: MBK Homes Prepared By: KD Anderson & Associates 3853 Taylor Road, Suite G Loomis, California 95650 (916) 660-1555
MEMORANDUM. Figure 1. Roundabout Interchange under Alternative D
 MEMORANDUM Date: To: Liz Diamond, Dokken Engineering From: Subject: Dave Stanek, Fehr & Peers Western Placerville Interchanges 2045 Analysis RS08-2639 Fehr & Peers has completed a transportation analysis
Traffic Engineering Study
 Traffic Engineering Study Bellaire Boulevard Prepared For: International Management District Technical Services, Inc. Texas Registered Engineering Firm F-3580 November 2009 Executive Summary has been requested
Task 5.1: Existing Conditions Review and Analysis
 City of Oceanside Coast Highway Corridor Task 5.1: Existing Conditions Review and Analysis Technical Memorandum August 2014 DOCUMENT CONTROL Client: Project Name: Report Title: City of Oceanside City of
BERKELEY DOWNTOWN AREA PLAN PROGRAM ENVIRONMENTAL IMPACT REPORT TRAFFIC IMPACT ANALYSIS
 BERKELEY DOWNTOWN AREA PLAN PROGRAM ENVIRONMENTAL IMPACT REPORT TRAFFIC IMPACT ANALYSIS Prepared for: City of Berkeley Prepared by: REVISED JANUARY 9, 2009 Berkeley Downtown Area Plan Program EIR Traffic
STH 60 Northern Reliever Route Feasibility Study Report
 #233087 v3 STH 60 Northern Reliever Route Feasibility Study Report Washington County Public Works Committee Meeting September 28, 2016 1 STH 60 Northern Reliever Route Feasibility Study Hartford Area Development
Develop ground transportation improvements to make the Airport a multi-modal regional
 Project Overview TRANSPORTATION IMPROVEMENTS WHAT ARE THE PROJECT GOALS? Transportation transportation hub. Develop ground transportation improvements to make the Airport a multi-modal regional Land Use
APPENDIX I TRAFFIC IMPACT ANALYSIS
 I NITIAL S TUDY/MITIGATED NEGATIVE D ECLARATION NO. 1844 15 M ARCH 2018 K ILLEFER SQUARE A PARTMENTS C ITY OF ORANGE, COUNTY OF ORANGE, CALIFORNIA APPENDIX I TRAFFIC IMPACT ANALYSIS P:\WSH1601\March 2018\Killefer
4.14 TRANSPORTATION AND CIRCULATION
 4.14 TRANSPORTATION AND CIRCULATION 4.14.1 Summary Table 4.14-1 summarizes the identified environmental impacts, proposed mitigation measures, and residual impacts of the proposed project with regard to
Executive Summary. Draft Environmental Impact Statement/Environmental Impact Report ES-1
 Executive Summary Introduction The Eastside Transit Corridor Phase 2 Project is a vital public transit infrastructure investment that would provide a transit connection to the existing Metro Gold Line
RICHMOND OAKS HEALTH CENTRE 6265 PERTH STREET OTTAWA, ONTARIO TRANSPORTATION BRIEF. Prepared for: Guycoki (Eastern) Limited.
 Limited.") RICHMOND OAKS HEALTH CENTRE 6265 PERTH STREET OTTAWA, ONTARIO TRANSPORTATION BRIEF Prepared for: Guycoki (Eastern) Limited June 16, 2016 116-638 Brief_1.doc D. J. Halpenny & Associates Ltd. Consulting
RICHMOND OAKS HEALTH CENTRE 6265 PERTH STREET OTTAWA, ONTARIO TRANSPORTATION BRIEF Prepared for: Guycoki (Eastern) Limited June 16, 2016 116-638 Brief_1.doc D. J. Halpenny & Associates Ltd. Consulting
Interstate Operations Study: Fargo-Moorhead Metropolitan Area Simulation Output
 NDSU Dept #2880 PO Box 6050 Fargo, ND 58108-6050 Tel 701-231-8058 Fax 701-231-6265 www.ugpti.org www.atacenter.org Interstate Operations Study: Fargo-Moorhead Metropolitan Area 2015 Simulation Output Technical
TRAFFIC IMPACT ANALYSIS
 TRAFFIC IMPACT ANALYSIS Emerald Isle Commercial Development Prepared by SEPI Engineering & Construction Prepared for Ark Consulting Group, PLLC March 2016 I. Executive Summary A. Site Location The Emerald
Traffic Impact Statement (TIS)
") Traffic Impact Statement (TIS) Vincentian PUDA Collier County, FL 10/18/2013 Prepared for: Global Properties of Naples Prepared by: Trebilcock Consulting Solutions, PA 2614 Tamiami Trail N, Suite 615 1205
Traffic Impact Statement (TIS) Vincentian PUDA Collier County, FL 10/18/2013 Prepared for: Global Properties of Naples Prepared by: Trebilcock Consulting Solutions, PA 2614 Tamiami Trail N, Suite 615 1205
RTID Travel Demand Modeling: Assumptions and Method of Analysis
 RTID Travel Demand Modeling: Assumptions and Method of Analysis Overall Model and Scenario Assumptions The Puget Sound Regional Council s (PSRC) regional travel demand model was used to forecast travel
LOTUS RANCH TRAFFIC IMPACT ANALYSIS. LLG Ref Senior Transportation Engineer & Charlene Sadiarin Transportation Engineer II
 TRAFFIC IMPACT ANALYSIS LOTUS RANCH El Centro, California July 31, 2015February 12, 2016 LLG Ref. 3-14-2392 Prepared by: KC Yellapu, P.E Senior Transportation Engineer & Charlene Sadiarin Transportation
Sepulveda Pass Corridor Systems Planning Study
 Los Angeles County Metropolitan Transportation Authority Sepulveda Pass Corridor Systems Planning Study Streets and Freeways Subcommittee January 17, 2013 1 Sepulveda Pass Study Corridor Extends for 30
The key roadways in the project vicinity are described below. Exhibit displays the existing number of lanes on the study roadways.
 4.2 TRAFFIC AND CIRCULATION This section presents the key assumptions, methods, and results of analysis for the transportation and circulation impacts of the proposed project. This section is based on
Transit City Etobicoke - Finch West LRT
 Delcan Corporation Transit City Etobicoke - Finch West LRT APPENDIX D Microsimulation Traffic Modeling Report March 2010 March 2010 Appendix D CONTENTS 1.0 STUDY CONTEXT... 2 Figure 1 Study Limits... 2
TRANSPORTATION STUDY FOR THE 8899 BEVERLY BOULEVARD PROJECT
 DRAFT TRANSPORTATION STUDY FOR THE 8899 BEVERLY BOULEVARD PROJECT WEST HOLLYWOOD, CALIFORNIA NOVEMBER 2013 PREPARED FOR BEVERLY BOULEVARD ASSOCIATION PREPARED BY DRAFT TRANSPORTATION STUDY FOR THE 8899
Town of Londonderry, New Hampshire NH Route 28 Western Segment Traffic Impact Fee Methodology
 Town of Londonderry, New Hampshire NH Route 28 Western Segment Traffic Impact Fee Methodology Prepared by the Londonderry Community Development Department Planning & Economic Development Division Based
MONTEREY BAY AQUARIUM RESEARCH INSTITUTE (MBARI) MASTER PLAN UPDATE MOSS LANDING, CALIFORNIA
 MASTER PLAN UPDATE MOSS LANDING, CALIFORNIA") MONTEREY BAY AQUARIUM RESEARCH INSTITUTE (MBARI) MASTER PLAN UPDATE MOSS LANDING, CALIFORNIA TRAFFIC IMPACT ANALYSIS Administrative Draft Report Prepared For Monterey Bay Aquarium Research Institute Moss
MONTEREY BAY AQUARIUM RESEARCH INSTITUTE (MBARI) MASTER PLAN UPDATE MOSS LANDING, CALIFORNIA TRAFFIC IMPACT ANALYSIS Administrative Draft Report Prepared For Monterey Bay Aquarium Research Institute Moss
Traffic Study for Barstow 2014 General Plan Amendment. Prepared for: The City of Barstow. Prepared by: ADVANTEC Consulting Engineers
 Traffic Study for Barstow 2014 General Plan Amendment Prepared for: The City of Barstow Prepared by: June 20, 2014 TABLE OF CONTENTS 1. Executive Summary... 1 2. Project Background & Description... 3 2.1
ORANGE COUNTY TRANSPORTATION AUTHORITY. MuniServices - Sales Tax Update. PowerPoint
 ORANGE COUNTY TRANSPORTATION AUTHORITY MuniServices - Sales Tax Update PowerPoint Orange County Transportation Authority Sales Tax Update 3 rd Quarter 2011 February 22, 2012 www.muniservices.com 800.800.8181
Appendix C. Traffic Study
 Appendix C Traffic Study TABLE OF CONTENTS SECTION Executive Summary PAGE 1.0 Introduction... 1 1.1 Scope of Work... 1 1.2 Study Area... 2 2.0 Project Description... 3 2.1 Site Access... 4 2.2 Pedestrian
Subarea Study. Manning Avenue (CSAH 15) Corridor Management and Safety Improvement Project. Final Version 1. Washington County.
 Corridor Management and Safety Improvement Project. Final Version 1. Washington County.") Subarea Study Manning Avenue (CSAH 15) Corridor Management and Safety Improvement Project Final Version 1 Washington County June 12, 214 SRF No. 138141 Table of Contents Introduction... 1 Forecast Methodology
Subarea Study Manning Avenue (CSAH 15) Corridor Management and Safety Improvement Project Final Version 1 Washington County June 12, 214 SRF No. 138141 Table of Contents Introduction... 1 Forecast Methodology
Interstate Operations Study: Fargo-Moorhead Metropolitan Area Simulation Results
 NDSU Dept #2880 PO Box 6050 Fargo, ND 58108-6050 Tel 701-231-8058 Fax 701-231-6265 www.ugpti.org www.atacenter.org Interstate Operations Study: Fargo-Moorhead Metropolitan Area 2025 Simulation Results
L1TILE BEARS DAY CARE TRANSPORTATION IMPACT STUDY FORT COLLINS, COLORADO MAY Prepared for:
 L1TILE BEARS DAY CARE TRANSPORTATION IMPACT STUDY FORT COLLINS, COLORADO MAY 2012 Prepared for: Hillside Construction, Inc. 216 Hemlock Street, Suite B Fort Collins, CO 80534 Prepared by: DELICH ASSOCIATES
To: File From: Adrian Soo, P. Eng. Markham, ON File: Date: August 18, 2015
 Memo To: From: Adrian Soo, P. Eng. Markham, ON : 165620021 Date: Reference: E.C. Row Expressway, Dominion Boulevard Interchange, Dougall Avenue Interchange, and Howard 1. Review of Interchange Geometry
Traffic Impact Study Speedway Gas Station Redevelopment
 Traffic Impact Study Speedway Gas Station Redevelopment Warrenville, Illinois Prepared For: Prepared By: April 11, 2018 Table of Contents 1. Introduction... 1 2. Existing Conditions... 4 Site Location...
Unified Corridor Investment Study DRAFT Step 2 Scenario Analysis Report
 Unified Corridor Investment Study DRAFT Step 2 Scenario Analysis Report REVISIONS 1. Table 39: New Public Investments for Operation and Maintenance Costs 2. Appendix A-10: Passenger Rail Service - Operations
Orange County Transportation Authority
 Orange County Transportation Authority Sales Tax Review Meeting 2 nd Quarter 2011 December 14, 2011 www.muniservices.com 800.800.8181 Transportation Authorities Sales Tax Net Cash Receipts: Three Advances
TABLE OF CONTENTS 1.0 INTRODUCTION AND SUMMARY Purpose of Report and Study Objectives... 2
 TABLE OF CONTENTS 1.0 INTRODUCTION AND SUMMARY 1 1.1 Purpose of Report and Study Objectives... 2 1.2 Executive Summary... 3 1.2.1 Site Location and Study Area... 3 1.2.2 Development Description... 3 1.2.3
Welcome. Please Sign In
 Welcome South Bay Bus Rapid Transit (BRT) Draft Environmental Impact Report (DEIR) Public Meeting Please Sign In Please comment in any of the following manners: 1. Submit a comment form 2. Provide verbal
APPENDIX C-2. Traffic Study Supplemental Analysis Memo
 APPENDIX C-2 Traffic Study Supplemental Analysis Memo The Mobility Group Transportation Strategies & Solutions Memorandum To: From: Subject: Tomas Carranza, LADOT Matthew Simons Traffic Review - Revised
Traffic Impact Analysis. Alliance Cole Avenue Residential Site Dallas, Texas. Kimley-Horn and Associates, Inc. Dallas, Texas.
 Traffic Impact Analysis Alliance Cole Avenue Residential Site Dallas, Texas February 15, 2018 Kimley-Horn and Associates, Inc. Dallas, Texas Project #064524900 Registered Firm F-928 Traffic Impact Analysis
MADERAS HOTEL TRANSPORTATION IMPACT ANALYSIS. LLG Ref Transportation Planner III & Jorge Cuyuch Transportation Engineer I
 TRANSPORTATION IMPACT ANALYSIS MADERAS HOTEL Poway, California June 21, 2016 LLG Ref. 3-16-2602 Prepared by: Amelia Giacalone Transportation Planner III & Jorge Cuyuch Transportation Engineer I Under the
MINERVA PARK SITE TRAFFIC IMPACT STUDY M/I HOMES. September 2, 2015
 5500 New Albany Road Columbus, Ohio 43054 Phone: 614.775.4500 Fax: 614.775.4800 Toll Free: 1-888-775-EMHT emht.com 2015-1008 MINERVA PARK SITE TRAFFIC IMPACT STUDY M/I HOMES September 2, 2015 Engineers
IV. ENVIRONMENTAL IMPACT ANALYSIS B. TRAFFIC AND CIRCULATION
 IV. ENVIRONMENTAL IMPACT ANALYSIS B. TRAFFIC AND CIRCULATION 1. INTRODUCTION This section is based on the technical report, Traffic Study for 10131 Constellation Boulevard Residential Project, prepared
BROWARD BOULEVARD CORRIDOR TRANSIT STUDY
 BROWARD BOULEVARD CORRIDOR TRANSIT STUDY FM # 42802411201 EXECUTIVE SUMMARY July 2012 GOBROWARD Broward Boulevard Corridor Transit Study FM # 42802411201 Executive Summary Prepared For: Ms. Khalilah Ffrench,
Energy Technical Memorandum
 Southeast Extension Project Lincoln Station to RidgeGate Parkway Prepared for: Federal Transit Administration Prepared by: Denver Regional Transportation District May 2014 Table of Contents Page No. Chapter
Table of Contents INTRODUCTION... 3 PROJECT STUDY AREA Figure 1 Vicinity Map Study Area... 4 EXISTING CONDITIONS... 5 TRAFFIC OPERATIONS...
 Crosshaven Drive Corridor Study City of Vestavia Hills, Alabama Table of Contents INTRODUCTION... 3 PROJECT STUDY AREA... 3 Figure 1 Vicinity Map Study Area... 4 EXISTING CONDITIONS... 5 TRAFFIC OPERATIONS...
DRAFT TRANSPORTATION IMPACT STUDY CASTILIAN REDEVELOPMENT PROJECT
 DRAFT TRANSPORTATION IMPACT STUDY CASTILIAN REDEVELOPMENT PROJECT Prepared for: Submitted by: 299 Lava Ridge Ct. Suite 2 Roseville, CA. 95661 June 212 TABLE OF CONTENTS 1. Introduction... 1 Project Location
IV. REVISIONS TO THE DRAFT IS/MND
 IV. REVISIONS TO THE DRAFT IS/MND 1. REVISIONS TO THE DRAFT IS/MND This section presents corrections and clarifications that have been made to the text of the Draft IS/MND. These changes include revisions
Note: The October 2007 version of this report has been updated in this December 2008 report to present costs in year 2007 dollars.
 Sound Transit Phase 2 South Corridor LRT Design Report: SR 99 and I-5 Alignment Scenarios (S 200 th Street to Tacoma Dome Station) Tacoma Link Extension to West Tacoma Prepared for: Sound Transit Prepared
BARRHAVEN FELLOWSHIP CRC 3058 JOCKVALE ROAD OTTAWA, ONTARIO TRANSPORTATION BRIEF. Prepared for:
 BARRHAVEN FELLOWSHIP CRC 3058 JOCKVALE ROAD OTTAWA, ONTARIO TRANSPORTATION BRIEF Prepared for: Barrhaven Fellowship CRC 3058 Jockvale Road Ottawa, ON K2J 2W7 December 7, 2016 116-649 Report_1.doc D. J.
TRAFFIC IMPACT STUDY DERRY GREEN CORPORATE BUSINESS PARK MILTON SECONDARY PLAN MODIFICATION
 TRAFFIC IMPACT STUDY DERRY GREEN CORPORATE BUSINESS PARK MILTON SECONDARY PLAN MODIFICATION TRAFFIC IMPACT STUDY DERRY GREEN CORPORATE BUSINESS PARK MILTON SECONDARY PLAN MODIFICATION DECEMBER 24 UPDATED
Alternatives Analysis Findings Report
 6.0 This chapter presents estimates of the potential capital, operations and maintenance costs associated with the alternatives carried forward for detailed evaluation. The methodology used to develop
4.0 TIER 2 ALTERNATIVES
 4.0 TIER 2 ALTERNATIVES The Tier 2 Alternatives represent the highest performing Tier 1 Alternatives. The purpose of the Tier 2 Screening was to identify the LPA utilizing a more robust list of evaluation
LINCOLN AVENUE TRAFFIC SIGNAL SYNCHRONIZATION (TSS) PROJECT TASK 6: FINAL TIMINGS AND EVALUATION TECHNICAL REPORT
 PROJECT TASK 6: FINAL TIMINGS AND EVALUATION TECHNICAL REPORT") FINAL LINCOLN AVENUE TRAFFIC SIGNAL SYNCHRONIZATION (TSS) PROJECT TASK 6: FINAL TIMINGS AND EVALUATION TECHNICAL REPORT Submitted by: Submitted to: 201 South Anaheim Boulevard Suite 502 Anaheim, California
FINAL LINCOLN AVENUE TRAFFIC SIGNAL SYNCHRONIZATION (TSS) PROJECT TASK 6: FINAL TIMINGS AND EVALUATION TECHNICAL REPORT Submitted by: Submitted to: 201 South Anaheim Boulevard Suite 502 Anaheim, California
Perris Apartments Traffic Impact Analysis City of Perris, California
 Perris Apartments Traffic Impact Analysis City of Perris, California Prepared for: JD Pierce Company, Inc. 2222 Martin St., Suite 100 Irvine, CA 92612 Prepared by: TJW ENGINEERING, INC. 540 N. Golden Circle
West Hills Shopping Centre Lowe s Expansion Traffic Impact Study
 West Hills Shopping Centre Lowe s Expansion Traffic Impact Study Prepared for: Armel Corporation January 2015 Paradigm Transportation Solutions Ltd. 22 King Street South, Suite 300 Waterloo ON N2J 1N8
Countdown to the Closure Extended 53-Hour Closure of I-405 Freeway Between U.S. 101 and I-10 Planned in Mid-July for Mulholland Bridge Demolition
 Countdown to the Closure Extended 3-Hour Closure of I-40 Freeway Between U.S. 0 and I-0 Planned in Mid-July for Mulholland Bridge Demolition Work Los Angeles, Calif. Plan Ahead, Avoid The Area, Or Stay
IV. ENVIRONMENTAL IMPACT ANALYSIS N. TRANSPORTATION AND TRAFFIC
 IV. ENVIRONMENTAL IMPACT ANALYSIS N. TRANSPORTATION AND TRAFFIC The following section summarizes the information provided in the traffic report entitled Traffic Impact Analysis for a Proposed Residential
APPENDIX VMT Evaluation
 APPENDIX 2.7-2 VMT Evaluation MEMORANDUM To: From: Mr. Jonathan Frankel New Urban West, Incorporated Chris Mendiara LLG, Engineers Date: May 19, 2017 LLG Ref: 3-16-2614 Subject: Villages VMT Evaluation
Parks and Transportation System Development Charge Methodology
 City of Sandy Parks and Transportation System Development Charge Methodology March, 2016 Background In order to implement a City Council goal the City of Sandy engaged FCS Group in January of 2015 to update
Los Angeles Mission College Facilities Master Plan Draft Program Environmental Impact Report 3.13 TRANSPORTATION / TRAFFIC
 3.13 TRANSPORTATION / TRAFFIC As a result of the analysis undertaken in the Initial Study for the Los Angeles Mission College Facilities Master Plan, the (LACCD) determined that the proposed project may
5.9 TRANSPORTATION AND TRAFFIC
 5.9 TRANSPORTATION AND TRAFFIC This section evaluates transportation- and traffic-related impacts that have the potential to result from the construction and operation of the Project. Information and analysis
Section 3.12 Traffic and Transportation
 Section. Traffic and Transportation SECTION SUMMARY This section describes existing ground transportation within the Port and surrounding area associated with implementation of the proposed Project. An
Appendix 3 Traffic Technical Memorandum
 Appendix 3 Traffic Technical Memorandum DRAFT TECHNICAL MEMORANDUM Southport Connector Project Traffic Development Comparison of Future Year Model Results Date: September 10, 2015 Project #:11730.030 To:
I-405 Corridor Master Plan
 Southern California Association of Governments I-405 Corridor Master Plan Presentation to Streets and Freeways Subcommittee October 13, 2015 1 Presentation Overview Expectations and Approach Corridor Performance
4.1 Traffic, Circulation, and Parking
 4.1 Traffic, This section describes the existing transportation and parking conditions within and adjacent to the project area. A traffic report describing the potential impacts of the proposed project
Table of Contents SR-91 IMPLEMENTATION PLAN i
 Table of Contents TABLE OF CONTENTS...I SECTION 1: 2009 STATUS REPORT AND UPDATE...1 SECTION 2: IMPLEMENTATION PLAN...7 BY YEAR 2011...8 BY YEAR 2015...13 BY YEAR 2022...19 BY YEAR POST-2025/2030...23
TRAFFIC IMPACT ANALYSIS WESTMINSTER SEMINARY. Escondido, California June 25, LLG Ref Transportation Engineer II
 TRAFFIC IMPACT ANALYSIS WESTMINSTER SEMINARY Escondido, California June 25, 2015 LLG Ref. 3-15-2420 Prepared by: Pedram Massoudi Transportation Engineer II Under the Supervision of: John Boarman, P.E.
TRAFFIC SIGNAL DESIGN REPORT KING OF PRUSSIA ROAD & RAIDER ROAD RADNOR TOWNSHIP PENNSYLVANIA
 TRAFFIC SIGNAL DESIGN REPORT KING OF PRUSSIA ROAD & RAIDER ROAD RADNOR TOWNSHIP PENNSYLVANIA PREPARED FOR: UNIVERSITY OF PENNSYLVANIA HEALTH SYSTEM 34 CIVIC CENTER BOULEVARD PHILADELPHIA, PA 1987 (61)
IMPROVEMENT CONCEPTS
 IMPROVEMENT CONCEPTS for the South Novato Transit Hub Study Prepared by: January 11, 2010 DKS Associates With Wilbur Smith Associates IMPROVEMENT CONCEPTS Chapter 1: Introduction 1. INTRODUCTION The strategic
TRAFFIC IMPACT ANALYSIS SAFARI HIGHLANDS RANCH
 TRAFFIC IMPACT ANALYSIS SAFARI HIGHLANDS RANCH, California November 11, 2016 LLG Ref. 3-14-2334 EXECUTIVE SUMMARY The Project proposes the development of 550 luxury residential dwelling units, public trails,
3.15 SAFETY AND SECURITY
 3.15 SAFETY AND SECURITY Introduction This section describes the environmental setting and potential effects of the alternatives analyzed in this EIR with regard to safety and security in the SantaClara-Alum
ANDERSON PROPERTY SITE ANALYSIS
 ANDERSON PROPERTY SITE ANALYSIS Introduction The Montgomery County Department of Transportation (MCDOT) initiated a feasibility study in the fall of 2012 to evaluate the need for transit service expansion