Interchange Operations Study MOT (I-75 & Austin Boulevard) ODOT District 7 PID 99213
|
|
|
- Hugh Watts
- 5 years ago
- Views:
Transcription


 ODOT")
1 Interchange Operations Study MOT (I-75 & Austin Boulevard) ODOT District 7 PID 99213


2
3 Table of Contents MOT Interchange Operations Study (IOS) 1.0 Project Summary Study Area Problem Description Traffic Analyses Freeway Segment Analyses Ramp Junction Analysis Weave Segment Analysis Intersection Analyses Synchro Intersection Analyses Turn Lane Storage Lengths Conclusion and Recommendations... 7 List of Tables Table 1. Design Designations of Roadways within the Study Area... 3 Table 2. Freeway Segment Analyses... 4 Table 3. Ramp Junction Analysis... 4 Table 4. Weave Segment Analysis... 4 Table 5. HCS Intersection Analyses... 5 Table 6. Synchro Intersection Analyses... 6 Table 7. Turn Lane Storage Lengths... 6 List of Exhibits Exhibit 1 I-75 & Austin Boulevard Study Area Exhibit 2 Austin Boulevard Projects List of Appendices Appendix A Certified Traffic Appendix B HCS Analyses Appendix C Synchro Analyses Appendix D Turn Lane Calculations December 2015 Page i
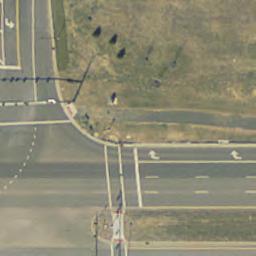
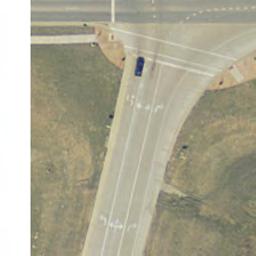
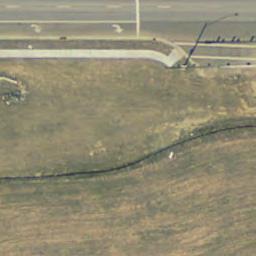
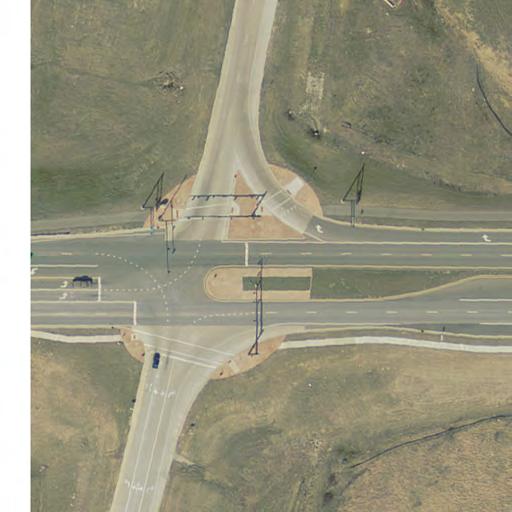
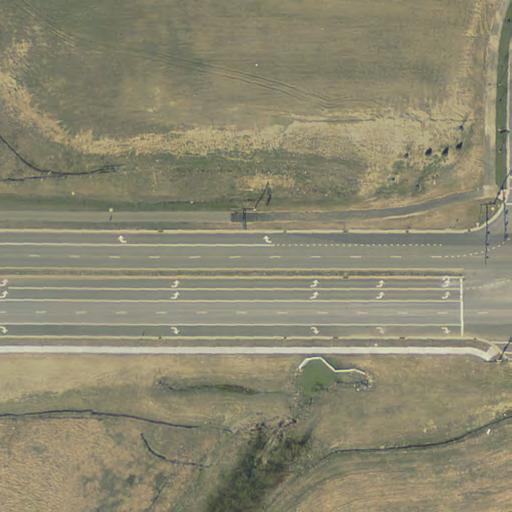
4 MOT Interchange Operations Study (IOS) 1.0 Project Summary The Ohio Department of Transportation (ODOT) District 7 is improving the safety and mobility along Austin Boulevard in Montgomery County from State Route 741 to the I-75 NB Ramps. ODOT District 7 commissioned Parsons Brinckerhoff to justify the modifications proposed on Austin Boulevard and determine the effects, if any, on I-75. The Build condition will add a second right turn lane on the westbound approach of Austin Boulevard at the I-75 NB entrance ramp, and will require the right turns to be included in the signal phasing. Additional work at the Continuous Flow Intersection (CFI) at Austin Boulevard and SR 741 are being addressed under a separate, companion project: PID Study Area The project is located along Austin Boulevard extends from the I-75 NB ramps to the intersection with SR 741. Austin Boulevard is an urban collector which runs east-west just south of Dayton, Ohio. The study area is presented in Exhibit Problem Description Austin Boulevard is an urban collector on the southern end of Montgomery County. Due to intense growth in this area during the past decade, and due to its proximity to I-75, this section of Austin Boulevard has become a primary collector. The existing CFI at Austin Boulevard and SR 741 opened in May In 2011 the PM Peak Hour traffic count exceeded the 2035 design hour volumes by 20%, and the eastbound right and northbound left turn movements were approximately double the predicted 2035 design hour volumes. In 2012, ODOT commissioned a Traffic Engineering Report (TER). The report recommended improvements to the eastbound right turn and northbound left turn movements of the CFI. Specifically, the study recommended the provision of dual left turn lanes on the northbound approach to SR 741 at Austin Boulevard. However, the study recommended delaying these northbound improvements pending this evaluation of the traffic impacts of the dual northbound left turn lanes. In 2013, an Alternatives Evaluation Report (AER) was undertaken to consider improvements as proposed in the TER. As noted in the AER: The CFI has experienced significant congestion since it has opened which has been attributed to rapid development surrounding the newly constructed Austin Boulevard interchange at Interstate 75 which also opened The 2012 TER and associated 2011 traffic counts show that existing storage capacity for both the northbound left turn lane and eastbound right turn lane are under-designed for the current AM and PM peaks. The 2011 intersection peak hour volume is approximately 20% higher than December 2015 Page 2
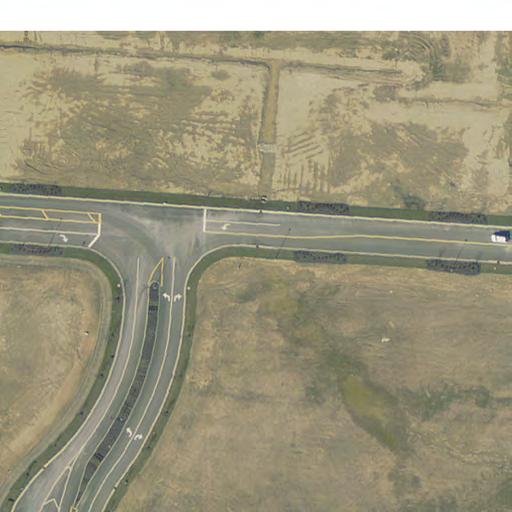
5 MOT Interchange Operations Study (IOS) original 2035 intersection design hour volume. The 2011 counted EB right turn volume (PM) and NB left turn volume (AM) are approximately double the original 2035 peak design hour volumes. Given the planned development in the Austin Landing and Springboro Ascent areas, there is concern that these two movements will be overwhelmed with additional traffic unless improvements are made. To accommodate traffic from the two northbound left turn lanes currently in the design stages at the CFI, a second westbound right turn lane from Austin Boulevard onto the I-75 NB entrance ramp is needed. This roadway modification will provide the additional capacity needed along Austin Boulevard to improve the intersection of SR 741 and Austin Boulevard, and the resulting need to improve the intersection at the I-75 NB ramps and Austin Boulevard. The additional right turn lane added on Austin Boulevard at the northbound I-75 entrance ramp will add this movement to the signal phasing replacing the free-flow right turn movement which currently exists. To help line traffic up in the correct lane, westbound Austin Boulevard tapers to open up an additional through lane on the inside. Exhibit 2 shows how the improvements on Austin Boulevard allow for the dual northbound left turn movement. 4.0 Traffic Analyses The Modeling and Forecasting Section of ODOT provided mainline certified traffic volumes and certified traffic volume forecasts for the ramps and side road. This was done for Opening Year (2018) and Design Year (2038) as presented in Appendix A. The certified traffic was used to complete the evaluation of the No Build and Preferred alternatives using the Highway Capacity Software 2010 (HCS 2010). Table 1 summarizes the existing number of lanes, functional classification, legal speeds and design speeds of the roadways within the study area that may be affected by the Build Alternative. Table 1. Design Designations of Roadways within the Study Area Route Existing Number of Lanes Functional Classification Posted Legal Speed (mph) Proposed Design Speed (mph) I-75 4 Urban Interstate Austin Blvd. 5 Urban Collector Capacity analyses were preformed to estimate the maximum amount of traffic that can be accommodated by a roadway while maintaining prescribed operational qualities. Levels of service were determined for freeway segments, ramp junctions, weave segments, and intersections for both the No Build and Build. Tables containing level of service information are presented in the following sections. The operating goal is to maintain LOS D for all roadway segments. As a result, degradation from the No Build Alternative to the Build Alternative only occurs when the level of service for the Build Alternative has a lower level of service than the No December 2015 Page 3
6 MOT Interchange Operations Study (IOS) Build Alternative and LOS E or LOS F. The individual HCS analyses for both the No Build and Build are also provided in Appendix B. 4.1 Freeway Segment Analyses Two freeway segments were analyzed along I-75 Northbound for both the No Build and Build Alternatives and are presented in Table 2. Table 2. Freeway Segment Analyses No Build Build Location AM Peak PM Peak AM Peak PM Peak LOS Density LOS Density LOS Density LOS Density SR 73 to Austin Blvd. E 43.5 E 44.3 E 43.5 E 44.3 Austin Blvd. Interchange D 30.7 D 33.0 D 30.7 D 33.0 In both the No Build and Build Alternative analyses, it was assumed that no traffic was constrained and prevented from making it to the freeway segment. The freeway segments for the Build Alternative operate at the same level of service as the No Build Alternative 4.2 Ramp Junction Analysis The ramp junction for I-75 northbound was analyzed for both the No Build and Build Alternatives and is presented in Table 3. Table 3. Ramp Junction Analysis No Build Build Location AM Peak PM Peak AM Peak PM Peak LOS Density LOS Density LOS Density LOS Density Austin Blvd. Exit Ramp F 36.6 F 37.1 F 36.6 F 37.1 The ramp junction for the Build Alternative operates at the same level of service as the No Build Alternative. 4.3 Weave Segment Analysis The weaving segment on I-75 northbound between the Austin Boulevard entrance ramp and the I-675 exit ramp was analyzed for both the No Build and Build Alternative and is presented in Table 4. Table 4. Weave Segment Analysis No Build Build Location AM Peak PM Peak AM Peak PM Peak LOS V/C LOS V/C LOS V/C LOS V/C Austin Blvd. to I-675 F 1.78 F 1.51 F 1.65 F 1.51 In both the No Build Alternative and the PM Build Alternative analyses, it was assumed that no traffic was constrained and prevented from making it to the weave segment. The AM Build Alternative analysis shows 273 vehicles being constrained and not able to make it to the I-75 December 2015 Page 4
7 MOT Interchange Operations Study (IOS) northbound weaving segment. Since no weaving data was provide in the certified traffic, it was assumed that every vehicle exiting to I-675 is coming from the I-75 mainline and every vehicle entering from Austin Boulevard is going to I-75 north. This would represent a worst case scenario for the weave. The Build Alternative weaving section operates at the same level of service as the No Build condition. 4.4 Intersection Analyses Six intersections were analyzed along Austin Boulevard for both the No Build and Build alternatives. The HCS intersection analyses for both the No Build Alternative and Build Alternative are presented in Table 5. Table 5. HCS Intersection Analyses No Build Build Intersection AM Peak PM Peak AM Peak PM Peak LOS Delay LOS Delay LOS Delay LOS Delay I-75 SB Ramps & Austin Blvd. D 45.3 F D 45.3 F I-75 NB Ramps & Austin Blvd. D 39.9 E 58.2 E 68.1 D 54.7 Austin Landing & Austin Blvd. D 46.8 F D 43.7 F 91.9 Austin Blvd. CFI West D 49.0 F D 49.0 F CFI Main & SR 741 F 84.9 F E 55.9 F 88.5 Austin Blvd. CFI East C 27.4 C 32.6 C 27.4 C 32.6 The intersection with the I-75 northbound ramps and Austin Boulevard shows degradation in the AM peak hour. The methodology used in HCS for a free-flow (slip) right turn lane is to simply remove the volume from the intersection. Adding this traffic to the intersection for the traffic signal and then balancing the delay in HCS resulted in a drop from LOS D to LOS E. The intersection of Austin Boulevard and Austin Landing is analyzed with a southbound right turn overlap to accommodate the high volumes. The addition of the right turn overlap decreases the delay for the intersection. This intersection is under the purview of the Montgomery County Engineer s office so would have to be agreeable to this recommendation. HCS files for both scenarios can be found in the appendix. The continuous flow intersection at Austin Boulevard and SR 741 was analyzed using the method from Michael Armstrong s paper, Integrating Alternative Intersections and Interchanges into Highway Capacity Software. In this method, the displaced left turns at the main intersection are coded as right turns in order to allow the through and protected left turn movements to travel simultaneously. In order to analyze the true eastbound and westbound right turns, they are coded as Right Turn on Red Synchro Intersection Analyses Supplemental intersection analyses were completed using Synchro to model Austin Boulevard as a corridor, since methodology used with HCS does not analyze free-flow right turn. As a result, the No Build Alternative would appear better than the Build Alternative in Table 5. The December 2015 Page 5
8 MOT Interchange Operations Study (IOS) Synchro intersection analyses for the No Build and Build are presented in Table 6. The individual Synchro analyses for both the No Build and Build are also provided in Appendix B. Table 6. Synchro Intersection Analyses No Build Build Intersection AM Peak PM Peak AM Peak PM Peak LOS Delay LOS Delay LOS Delay LOS Delay I-75 SB Ramps & Austin Blvd. D 50.2 F D 50.9 F I-75 NB Ramps & Austin Blvd. E 76.2 D 54.3 C 21.9 D 52.5 Austin Landing & Austin Blvd. C 31.2 F 90.6 C 27.9 E 72.4 Austin Blvd. CFI East D 43.0 C 33.6 D 43.4 B 17.9 CFI Main & SR 741 E 68.6 F D 49.0 F Austin Blvd. CFI West C 29.6 D 48.4 B 19.6 D 47.4 The Build condition Synchro intersections operate the same or better than the No Build condition. 4.5 Turn Lane Storage Lengths The ODOT Location and Design Manual section along with figures 401-9E and E were used to determine the required turn lane storage lengths for the westbound right turn lanes at the intersection of Austin Boulevard and the I-75 northbound Ramps. The reported turn lane storage lengths include required deceleration and a 50-foot diverging taper. The results of this analysis are summarized in Table 7. The turn lane calculations are provided in Appendix D. Table 7. Turn Lane Storage Lengths Austin Boulevard and the I-75 NB ramps Westbound Right AM Peak Hour PM Peak Hour Turn Lanes (#) 2 2 Thru Lanes (#) 2 2 Turn Volume 1, Thru Volume 930 1,990 Cycle Length (in seconds) Turn Vehicles per Cycle Turn Volume Storage Length (incl. Taper) 1, Storage per Turn Lane Thru Vehicles per Cycle per Lane Queue per Thru Lane Final Turn Lane Length Storage Length Provided Adequate Storage Provided? Yes No The two proposed westbound right turn lanes at the intersection of Austin Boulevard and the I- 75 northbound ramps provides 700 feet of storage to the Austin Landing intersection. This is 315 feet short of the required length due to thru backup. Spacing between intersections is too short to provide the additional length needed. In order to provide additional storage and assist December 2015 Page 6
9 MOT Interchange Operations Study (IOS) with lane balancing both right turn lanes are extended beyond the Austin Landing intersection an additional 300 feet. 5.0 Conclusion and Recommendations The MOT study was initiated due to the increased congestion and safety concerns at the intersection of Austin Boulevard and SR 741. The proposed project on Austin Boulevard recommends a second northbound left turn lane at the intersection of SR 741 and a second westbound right turn lane at the intersection of the I-75 northbound entrance ramp. The dual right turn lanes at the I-75 NB entrance ramp will be signalized, converting this movement from free-flow to signal controlled. The IOS verifies that the level of service along I-75 is not degraded in the design year for the Build Alternative when compared to the No Build Alternative. The Study meets the requirements of the Ohio Department of Transportation. December 2015 Page 7
10 Exhibits


11


12 ST DEPARTMENT A TE OF OF TRANSPORTATION OHIO EXHIBIT 2 - AUSTIN BOULEVARD PROJECTS RA M P TO NB I-75 A USTIN LA NDING BLV D. SPRING BO RO PIKE AUSTIN BLVD. 730 WORK BY OTHERS (PID 92035)
13 Appendix A Certified Traffic
14 INTER-OFFICE COMMUNICATION TO: Mary Hoy, P.E., District 7 FROM: SUBJECT: Becky Salak, Transportation Planner, Office of Statewide Planning and Research MOT (Austin Blvd IMS), No PID DATE: April 29, 2014 In reply to a request dated received January 29, 2014, plates are attached showing 2018/2038 ADT, A.M. DHV and P.M. DHV forecasts for the subject project. Trips based on the development information provided have been added to the 2038 forecast. K&D factors can be calculated from the plates as needed. Truck factors are shown on a separate plate. If you have any questions, please contact me at (614) c: M. Byram, OSPR File
15
16
17
18
19
20
21
22
23
24
25
26
27
28
29 Appendix B HCS Analyses
30 Freeway HCS Analysis No Build/Build
31 HCS 2010: Basic Freeway Segments Release 6.65 Phone: Fax: Operational Analysis Analyst: NRW Agency or Company: Parsons Brinckerhoff Date Performed: 12/16/2015 Analysis Time Period: AM DHV Freeway/Direction: NB From/To: between SR 73 and Austin Blvd Jurisdiction: Analysis Year: 2038 Description: MOT (Austin Blvd IMS) Flow Inputs and Adjustments Volume, V 6320 veh/h Peak-hour factor, PHF 0.94 Peak 15-min volume, v v Trucks and buses 11 % Recreational vehicles 0 % Terrain type: Level Grade - % Segment length - mi Trucks and buses PCE, ET 1.5 Recreational vehicle PCE, ER 1.2 Heavy vehicle adjustment, fhv Driver population factor, fp 1.00 Flow rate, vp 2364 pc/h/ln Speed Inputs and Adjustments Lane width - ft Right-side lateral clearance - ft Total ramp density, TRD - ramps/mi Number of lanes, N 3 Free-flow speed: Measured FFS or BFFS 70.0 mi/h Lane width adjustment, flw - mi/h Lateral clearance adjustment, flc - mi/h TRD adjustment - mi/h Free-flow speed, FFS 70.0 mi/h LOS and Performance Measures Flow rate, vp 2364 pc/h/ln Free-flow speed, FFS 70.0 mi/h Average passenger-car speed, S 54.3 mi/h Number of lanes, N 3 Density, D 43.5 pc/mi/ln Level of service, LOS E
32 Overall results are not computed when free-flow speed is less than 55 mph.
33 HCS 2010: Basic Freeway Segments Release 6.65 Phone: Fax: Operational Analysis Analyst: NRW Agency or Company: Parsons Brinckerhoff Date Performed: 12/16/2015 Analysis Time Period: PM DHV Freeway/Direction: NB From/To: between SR 73 and Austin Blvd Jurisdiction: Analysis Year: 2038 Description: MOT (Austin Blvd IMS) Flow Inputs and Adjustments Volume, V 6370 veh/h Peak-hour factor, PHF 0.94 Peak 15-min volume, v v Trucks and buses 11 % Recreational vehicles 0 % Terrain type: Level Grade - % Segment length - mi Trucks and buses PCE, ET 1.5 Recreational vehicle PCE, ER 1.2 Heavy vehicle adjustment, fhv Driver population factor, fp 1.00 Flow rate, vp 2383 pc/h/ln Speed Inputs and Adjustments Lane width - ft Right-side lateral clearance - ft Total ramp density, TRD - ramps/mi Number of lanes, N 3 Free-flow speed: Measured FFS or BFFS 70.0 mi/h Lane width adjustment, flw - mi/h Lateral clearance adjustment, flc - mi/h TRD adjustment - mi/h Free-flow speed, FFS 70.0 mi/h LOS and Performance Measures Flow rate, vp 2383 pc/h/ln Free-flow speed, FFS 70.0 mi/h Average passenger-car speed, S 53.8 mi/h Number of lanes, N 3 Density, D 44.3 pc/mi/ln Level of service, LOS E
34 Overall results are not computed when free-flow speed is less than 55 mph.
35 HCS 2010: Basic Freeway Segments Release 6.65 Phone: Fax: Operational Analysis Analyst: NRW Agency or Company: Parsons Brinckerhoff Date Performed: 12/16/2015 Analysis Time Period: AM DHV Freeway/Direction: NB From/To: within Austin interchange Jurisdiction: Analysis Year: 2038 Description: MOT (Austin Blvd IMS) Flow Inputs and Adjustments Volume, V 5210 veh/h Peak-hour factor, PHF 0.94 Peak 15-min volume, v v Trucks and buses 11 % Recreational vehicles 0 % Terrain type: Level Grade - % Segment length - mi Trucks and buses PCE, ET 1.5 Recreational vehicle PCE, ER 1.2 Heavy vehicle adjustment, fhv Driver population factor, fp 1.00 Flow rate, vp 1949 pc/h/ln Speed Inputs and Adjustments Lane width - ft Right-side lateral clearance - ft Total ramp density, TRD - ramps/mi Number of lanes, N 3 Free-flow speed: Measured FFS or BFFS 70.0 mi/h Lane width adjustment, flw - mi/h Lateral clearance adjustment, flc - mi/h TRD adjustment - mi/h Free-flow speed, FFS 70.0 mi/h LOS and Performance Measures Flow rate, vp 1949 pc/h/ln Free-flow speed, FFS 70.0 mi/h Average passenger-car speed, S 63.5 mi/h Number of lanes, N 3 Density, D 30.7 pc/mi/ln Level of service, LOS D
36 Overall results are not computed when free-flow speed is less than 55 mph.
37 HCS 2010: Basic Freeway Segments Release 6.65 Phone: Fax: Operational Analysis Analyst: NRW Agency or Company: Parsons Brinckerhoff Date Performed: 12/16/2015 Analysis Time Period: PM DHV Freeway/Direction: NB From/To: within Austin interchange Jurisdiction: Analysis Year: 2038 Description: MOT (Austin Blvd IMS) Flow Inputs and Adjustments Volume, V 5450 veh/h Peak-hour factor, PHF 0.94 Peak 15-min volume, v v Trucks and buses 11 % Recreational vehicles 0 % Terrain type: Level Grade - % Segment length - mi Trucks and buses PCE, ET 1.5 Recreational vehicle PCE, ER 1.2 Heavy vehicle adjustment, fhv Driver population factor, fp 1.00 Flow rate, vp 2039 pc/h/ln Speed Inputs and Adjustments Lane width - ft Right-side lateral clearance - ft Total ramp density, TRD - ramps/mi Number of lanes, N 3 Free-flow speed: Measured FFS or BFFS 70.0 mi/h Lane width adjustment, flw - mi/h Lateral clearance adjustment, flc - mi/h TRD adjustment - mi/h Free-flow speed, FFS 70.0 mi/h LOS and Performance Measures Flow rate, vp 2039 pc/h/ln Free-flow speed, FFS 70.0 mi/h Average passenger-car speed, S 61.8 mi/h Number of lanes, N 3 Density, D 33.0 pc/mi/ln Level of service, LOS D
38 Overall results are not computed when free-flow speed is less than 55 mph.
39 Ramp Junction HCS Analysis No Build/Build
40 HCS 2010: Freeway Merge and Diverge Segments Release 6.65 Phone: Fax: Diverge Analysis Analyst: NRW Agency/Co.: Parsons Brinckerhoff Date performed: 12/16/2015 Analysis time period: AM DHV Freeway/Dir of Travel: IR 75 NB Junction: Austin Blvd Jurisdiction: Analysis Year: 2038 Description: MOT (Austin Blvd IMS) Freeway Data Type of analysis Diverge Number of lanes in freeway 3 Free-flow speed on freeway 70.0 mph Volume on freeway 6320 vph Off Ramp Data Side of freeway Right Number of lanes in ramp 1 Free-Flow speed on ramp 55.0 mph Volume on ramp 1110 vph Length of first accel/decel lane 600 ft Length of second accel/decel lane ft Adjacent Ramp Data (if one exists) Does adjacent ramp exist? Yes Volume on adjacent ramp 1680 vph Position of adjacent ramp Downstream Type of adjacent ramp On Distance to adjacent ramp 2845 ft Conversion to pc/h Under Base Conditions Junction Components Freeway Ramp Adjacent Ramp Volume, V (vph) vph Peak-hour factor, PHF Peak 15-min volume, v v Trucks and buses % Recreational vehicles % Terrain type: Level Level Level Grade 0.00 % 0.00 % 0.00 % Length 0.00 mi 0.00 mi 0.00 mi Trucks and buses PCE, ET Recreational vehicle PCE, ER
41 Heavy vehicle adjustment, fhv Driver population factor, fp Flow rate, vp pcph Estimation of V12 Diverge Areas L = (Equation or 13-13) EQ P = Using Equation 9 FD v = v + (v - v ) P = 4307 pc/h 12 R F R FD Capacity Checks Actual Maximum LOS F? v = v No Fi F v = v - v No FO F R v No R v or v 2786 pc/h (Equation or 13-17) 3 av34 Is v or v > 2700 pc/h? Yes 3 av34 Is v or v > 1.5 v /2 No 3 av34 12 If yes, v = 4393 (Equation 13-15, 13-16, 13-18, or 13-19) 12A Flow Entering Diverge Influence Area Actual Max Desirable Violation? v No 12A Level of Service Determination (if not F) Density, D = v L = 36.6 pc/mi/ln R 12 D Level of service for ramp-freeway junction areas of influence F Speed Estimation Intermediate speed variable, D = S Space mean speed in ramp influence area, S = 62.3 mph R Space mean speed in outer lanes, S = 70.2 mph 0 Space mean speed for all vehicles, S = 65.1 mph
42 HCS 2010: Freeway Merge and Diverge Segments Release 6.65 Phone: Fax: Diverge Analysis Analyst: NRW Agency/Co.: Parsons Brinckerhoff Date performed: 12/16/2015 Analysis time period: PM DHV Freeway/Dir of Travel: IR 75 NB Junction: Austin Blvd Jurisdiction: Analysis Year: 2038 Description: MOT (Austin Blvd IMS) Freeway Data Type of analysis Diverge Number of lanes in freeway 3 Free-flow speed on freeway 70.0 mph Volume on freeway 6370 vph Off Ramp Data Side of freeway Right Number of lanes in ramp 1 Free-Flow speed on ramp 55.0 mph Volume on ramp 920 vph Length of first accel/decel lane 600 ft Length of second accel/decel lane ft Adjacent Ramp Data (if one exists) Does adjacent ramp exist? Yes Volume on adjacent ramp 1150 vph Position of adjacent ramp Downstream Type of adjacent ramp On Distance to adjacent ramp 2845 ft Conversion to pc/h Under Base Conditions Junction Components Freeway Ramp Adjacent Ramp Volume, V (vph) vph Peak-hour factor, PHF Peak 15-min volume, v v Trucks and buses % Recreational vehicles % Terrain type: Level Level Level Grade 0.00 % 0.00 % 0.00 % Length 0.00 mi 0.00 mi 0.00 mi Trucks and buses PCE, ET Recreational vehicle PCE, ER
43 Heavy vehicle adjustment, fhv Driver population factor, fp Flow rate, vp pcph Estimation of V12 Diverge Areas L = (Equation or 13-13) EQ P = Using Equation 9 FD v = v + (v - v ) P = 4289 pc/h 12 R F R FD Capacity Checks Actual Maximum LOS F? v = v No Fi F v = v - v No FO F R v No R v or v 2860 pc/h (Equation or 13-17) 3 av34 Is v or v > 2700 pc/h? Yes 3 av34 Is v or v > 1.5 v /2 No 3 av34 12 If yes, v = 4449 (Equation 13-15, 13-16, 13-18, or 13-19) 12A Flow Entering Diverge Influence Area Actual Max Desirable Violation? v No 12A Level of Service Determination (if not F) Density, D = v L = 37.1 pc/mi/ln R 12 D Level of service for ramp-freeway junction areas of influence F Speed Estimation Intermediate speed variable, D = S Space mean speed in ramp influence area, S = 62.8 mph R Space mean speed in outer lanes, S = 70.2 mph 0 Space mean speed for all vehicles, S = 65.4 mph
44 Weave Segment HCS Analysis No Build/Build
45 MOT , PID Created I-675 NB Ramps & Austin Blvd Intersection 2038 AM, 100-second cycle Eastbound Westbound Northbound Southbound L T R L T R L T R L T R Design-Year Volume (veh/h) v/c for No-Build v/c for Build Ramp Volume, No-Build 350 1, ,680 Ramp Volume, Build 331 1, ,407 Constrained No-Build Ramp Volume Constrained Build Ramp Volume 5,210 Mainline Volume Prior to Merge/Weave % Additional Vehicles Entering the Freeway in the Build No Degradation Occurs, <2% Increase 2.00% 137 1,680 Demand Volume 1,817 1,680 5,210 1,407 Constrained No-Build Ramp Volume Constrained Build Ramp Volume Increase in Traffic Additional Vehicles Entering Allowable Constrained Build Ramp Volume R T L R L 350 AM Peak T 1580 R L T R 930 T 0 L Austin Blvd I-675
46 MOT , PID Created I-675 NB Ramps & Austin Blvd Intersection 2038 PM, 95-second cycle Eastbound Westbound Northbound Southbound L T R L T R L T R L T R Design-Year Volume (veh/h) v/c for No-Build v/c for Build Ramp Volume, No-Build ,150 Ramp Volume, Build ,150 Constrained No-Build Ramp Volume Constrained Build Ramp Volume 5,450 Mainline Volume Prior to Merge/Weave % Additional Vehicles Entering the Freeway in the Build No Degradation Occurs, <2% Increase 2.00% 132 1,150 Demand Volume 1,282 1,150 5,450 1,150 Constrained No-Build Ramp Volume Constrained Build Ramp Volume Increase in Traffic Additional Vehicles Entering Allowable Constrained Build Ramp Volume R T L R L 200 PM Peak T 2060 R L T R 1990 T 0 L Austin Blvd I-675
47 Phone: HCS 2010: Freeway Weaving Release 6.65 Fax: Operational Analysis Analyst: NRW Agency/Co.: Parsons Brinckerhoff Date Performed: 12/16/2015 Analysis Time Period: AM DHV Freeway/Dir of Travel: IR 75 NB Weaving Location: Austin to IR 675 Analysis Year: 2038 Description: MOT (Austin Blvd IMS) Inputs Segment Type Freeway Weaving configuration One-Sided Number of lanes, N 4 ln Weaving segment length, LS 4425 ft Freeway free-flow speed, FFS 70 mi/h Minimum segment speed, SMIN 15 mi/h Freeway maximum capacity, cifl 2400 pc/h/ln Terrain type Level Grade 0.00 % Length 0.00 mi Conversion to pc/h Under Base Conditions Volume Components VFF VRF VFR VRR Volume, V veh/h Peak hour factor, PHF Peak 15-min volume, v Trucks and buses % Recreational vehicles % Trucks and buses PCE, ET Recreational vehicle PCE, ER Heavy vehicle adjustment, fhv Driver population adjustment, fp Flow rate, v pc/h Volume ratio, VR Configuration Characteristics Number of maneuver lanes, NWL 2 ln Interchange density, ID 0.5 int/mi Minimum RF lane changes, LCRF 1 lc/pc Minimum FR lane changes, LCFR 0 lc/pc Minimum RR lane changes, LCRR lc/pc Minimum weaving lane changes, LCMIN Weaving lane changes, LCW Non-weaving vehicle index, INW Non-weaving lane change, LCNW Total lane changes, LCALL lc/h lc/h lc/h lc/h Weaving and Non-Weaving Speeds Weaving intensity factor, W
48 Average weaving speed, SW Average non-weaving speed, SNW mi/h mi/h Weaving Segment Speed, Density, Level of Service and Capacity Weaving segment speed, S mi/h Weaving segment density, D pc/mi/ln Level of service, LOS F Weaving segment v/c ratio Weaving segment flow rate, v 9118 veh/h Weaving segment capacity, cw 5112 veh/h Limitations on Weaving Segments If limit reached, see note. Minimum Maximum Actual Note Weaving length (ft) a,b Maximum Analyzed Density-based capacty, c ciwl (pc/h/ln) Maximum Analyzed v/c ratio d Notes: a. In weaving segments shorter than 300 ft, weaving vehicles are assumed to make only necessary lane changes. b. Weaving segments longer than the calculated maximum length should be treated as isolated merge and diverge areas using the procedures of Chapter 13, "Freeway Merge and Diverge Segments." c. The density-based capacity exceeds the capacity of a basic freeway segment, under equivalent ideal conditions. d. Volumes exceed the weaving segment capacity. The level of service is F.
49 Phone: HCS 2010: Freeway Weaving Release 6.65 Fax: Operational Analysis Analyst: NRW Agency/Co.: Parsons Brinckerhoff Date Performed: 12/16/2015 Analysis Time Period: PM DHV Freeway/Dir of Travel: IR 75 NB Weaving Location: Austin to IR 675 Analysis Year: 2038 Description: MOT (Austin Blvd IMS) Inputs Segment Type Freeway Weaving configuration One-Sided Number of lanes, N 4 ln Weaving segment length, LS 4425 ft Freeway free-flow speed, FFS 70 mi/h Minimum segment speed, SMIN 15 mi/h Freeway maximum capacity, cifl 2400 pc/h/ln Terrain type Level Grade 0.00 % Length 0.00 mi Conversion to pc/h Under Base Conditions Volume Components VFF VRF VFR VRR Volume, V veh/h Peak hour factor, PHF Peak 15-min volume, v Trucks and buses % Recreational vehicles % Trucks and buses PCE, ET Recreational vehicle PCE, ER Heavy vehicle adjustment, fhv Driver population adjustment, fp Flow rate, v pc/h Volume ratio, VR Configuration Characteristics Number of maneuver lanes, NWL 2 ln Interchange density, ID 0.5 int/mi Minimum RF lane changes, LCRF 1 lc/pc Minimum FR lane changes, LCFR 0 lc/pc Minimum RR lane changes, LCRR lc/pc Minimum weaving lane changes, LCMIN Weaving lane changes, LCW Non-weaving vehicle index, INW Non-weaving lane change, LCNW Total lane changes, LCALL lc/h lc/h lc/h lc/h Weaving and Non-Weaving Speeds Weaving intensity factor, W
50 Average weaving speed, SW Average non-weaving speed, SNW mi/h mi/h Weaving Segment Speed, Density, Level of Service and Capacity Weaving segment speed, S mi/h Weaving segment density, D pc/mi/ln Level of service, LOS F Weaving segment v/c ratio Weaving segment flow rate, v 8245 veh/h Weaving segment capacity, cw 5465 veh/h Limitations on Weaving Segments If limit reached, see note. Minimum Maximum Actual Note Weaving length (ft) a,b Maximum Analyzed Density-based capacty, c ciwl (pc/h/ln) Maximum Analyzed v/c ratio d Notes: a. In weaving segments shorter than 300 ft, weaving vehicles are assumed to make only necessary lane changes. b. Weaving segments longer than the calculated maximum length should be treated as isolated merge and diverge areas using the procedures of Chapter 13, "Freeway Merge and Diverge Segments." c. The density-based capacity exceeds the capacity of a basic freeway segment, under equivalent ideal conditions. d. Volumes exceed the weaving segment capacity. The level of service is F.
51 Phone: HCS 2010: Freeway Weaving Release 6.70 Fax: Operational Analysis Analyst: NRW Agency/Co.: Parsons Brinckerhoff Date Performed: 12/16/2015 Analysis Time Period: AM DHV Build Freeway/Dir of Travel: IR 75 NB Weaving Location: Austin to IR 675 Analysis Year: 2038 Description: MOT (Austin Blvd IMS) Constrained Inputs Segment Type Freeway Weaving configuration One-Sided Number of lanes, N 4 ln Weaving segment length, LS 4425 ft Freeway free-flow speed, FFS 70 mi/h Minimum segment speed, SMIN 15 mi/h Freeway maximum capacity, cifl 2400 pc/h/ln Terrain type Level Grade 0.00 % Length 0.00 mi Conversion to pc/h Under Base Conditions Volume Components VFF VRF VFR VRR Volume, V veh/h Peak hour factor, PHF Peak 15-min volume, v Trucks and buses % Recreational vehicles % Trucks and buses PCE, ET Recreational vehicle PCE, ER Heavy vehicle adjustment, fhv Driver population adjustment, fp Flow rate, v pc/h Volume ratio, VR Configuration Characteristics Number of maneuver lanes, NWL 2 ln Interchange density, ID 0.5 int/mi Minimum RF lane changes, LCRF 1 lc/pc Minimum FR lane changes, LCFR 0 lc/pc Minimum RR lane changes, LCRR lc/pc Minimum weaving lane changes, LCMIN Weaving lane changes, LCW Non-weaving vehicle index, INW Non-weaving lane change, LCNW Total lane changes, LCALL lc/h lc/h lc/h lc/h Weaving and Non-Weaving Speeds Weaving intensity factor, W
52 Average weaving speed, SW Average non-weaving speed, SNW mi/h mi/h Weaving Segment Speed, Density, Level of Service and Capacity Weaving segment speed, S mi/h Weaving segment density, D pc/mi/ln Level of service, LOS F Weaving segment v/c ratio Weaving segment flow rate, v 8827 veh/h Weaving segment capacity, cw 5321 veh/h Limitations on Weaving Segments If limit reached, see note. Minimum Maximum Actual Note Weaving length (ft) a,b Maximum Analyzed Density-based capacty, c ciwl (pc/h/ln) Maximum Analyzed v/c ratio d Notes: a. In weaving segments shorter than 300 ft, weaving vehicles are assumed to make only necessary lane changes. b. Weaving segments longer than the calculated maximum length should be treated as isolated merge and diverge areas using the procedures of Chapter 13, "Freeway Merge and Diverge Segments." c. The density-based capacity exceeds the capacity of a basic freeway segment, under equivalent ideal conditions. d. Volumes exceed the weaving segment capacity. The level of service is F.
53 Intersection HCS Analysis
54 Austin Boulevard & I-75 SB Ramps - No Build/Build
55 HCS 2010 Signalized Intersection Results Summary General Information Intersection Information Agency PB Duration, h 0.25 Analyst NRW Analysis Date Aug 31, 2015 Area Type Other Jurisdiction Time Period AM DHV PHF 0.92 Intersection Austin Blvd & IR 75 SB RamAnalysis Year 2038 Analysis Period 1> 7:00 File Name Project Description SB75Ramps_AM_Existing.xus Existing/Build Demand Information EB WB NB SB Approach Movement L T R L T R L T R L T R Demand (v), veh/h Signal Information Cycle, s Reference Phase 2 Offset, s 0 Reference Point End Uncoordinated No Simult. Gap E/W On Force Mode Fixed Simult. Gap N/S On Green Yellow Red Timer Results EBL EBT WBL WBT NBL NBT SBL SBT Assigned Phase Case Number Phase Duration, s Change Period, (Y+Rc), s Max Allow Headway (MAH), s Queue Clearance Time (gs), s Green Extension Time (ge), s Phase Call Probability Max Out Probability Movement Group Results EB WB NB SB Approach Movement L T R L T R L T R L T R Assigned Movement Adjusted Flow Rate (v), veh/h Adjusted Saturation Flow Rate (s), veh/h/ln Queue Service Time (gs), s Cycle Queue Clearance Time (gc), s Green Ratio (g/c) Capacity (c), veh/h Volume-to-Capacity Ratio (X) Available Capacity (ca), veh/h Back of Queue (Q), veh/ln (50th percentile) Queue Storage Ratio (RQ) (50th percentile) Uniform Delay (d1), s/veh Incremental Delay (d2), s/veh Initial Queue Delay (d3), s/veh Control Delay (d), s/veh Level of Service (LOS) D F B D D D Approach Delay, s/veh / LOS 45.4 D 45.0 D D Intersection Delay, s/veh / LOS 45.3 D Multimodal Results EB WB NB SB Pedestrian LOS Score / LOS 2.4 B 1.9 A 3.0 C 2.8 C Bicycle LOS Score / LOS 1.4 A 1.5 A 2.7 B Copyright 2015 University of Florida, All Rights Reserved. HCS 2010 Streets Version 6.65 Generated: 8/31/ :34:31 AM

, veh/h 770 1120 1160 1490 1 580 Signal Information Cycle, s 120.")
56 HCS 2010 Signalized Intersection Results Summary General Information Intersection Information Agency PB Duration, h 0.25 Analyst NRW Analysis Date Dec 17, 2015 Area Type Other Jurisdiction Time Period PM DHV PHF 0.92 Intersection Austin Blvd & IR 75 SB RamAnalysis Year 2038 Analysis Period 1> 7:00 File Name Project Description SB75Ramps_PM_Existing.xus Existing/Build Demand Information EB WB NB SB Approach Movement L T R L T R L T R L T R Demand (v), veh/h Signal Information Cycle, s Reference Phase 2 Offset, s 0 Reference Point End Uncoordinated Yes Simult. Gap E/W On Force Mode Fixed Simult. Gap N/S On Green Yellow Red Timer Results EBL EBT WBL WBT NBL NBT SBL SBT Assigned Phase Case Number Phase Duration, s Change Period, (Y+Rc), s Max Allow Headway (MAH), s Queue Clearance Time (gs), s Green Extension Time (ge), s Phase Call Probability Max Out Probability Movement Group Results EB WB NB SB Approach Movement L T R L T R L T R L T R Assigned Movement Adjusted Flow Rate (v), veh/h Adjusted Saturation Flow Rate (s), veh/h/ln Queue Service Time (gs), s Cycle Queue Clearance Time (gc), s Green Ratio (g/c) Capacity (c), veh/h Volume-to-Capacity Ratio (X) Available Capacity (ca), veh/h Back of Queue (Q), veh/ln (50th percentile) Queue Storage Ratio (RQ) (50th percentile) Uniform Delay (d1), s/veh Incremental Delay (d2), s/veh Initial Queue Delay (d3), s/veh Control Delay (d), s/veh Level of Service (LOS) F F C F F F Approach Delay, s/veh / LOS F F F Intersection Delay, s/veh / LOS F Multimodal Results EB WB NB SB Pedestrian LOS Score / LOS 2.5 B 1.9 A 3.0 C 2.8 C Bicycle LOS Score / LOS 1.2 A 2.5 B 4.2 D Copyright 2015 University of Florida, All Rights Reserved. HCS 2010 Streets Version 6.65 Generated: 12/22/2015 1:18:01 PM
57 Austin Boulevard & I-75 NB Ramps No Build

58 HCS 2010 Signalized Intersection Results Summary General Information Intersection Information Agency PB Duration, h 0.25 Analyst NRW Analysis Date Aug 31, 2015 Area Type Other Jurisdiction Time Period AM DHV PHF 0.92 Intersection Austin Blvd & IR 75 NB RamAnalysis Year 2038 Analysis Period 1> 7:00 File Name NB75Ramps_AM_Existing.xus Project Description Existing Demand Information EB WB NB SB Approach Movement L T R L T R L T R L T R Demand (v), veh/h Signal Information Cycle, s Reference Phase 2 Offset, s 0 Reference Point End Uncoordinated Yes Simult. Gap E/W On Force Mode Fixed Simult. Gap N/S On Green Yellow Red Timer Results EBL EBT WBL WBT NBL NBT SBL SBT Assigned Phase Case Number Phase Duration, s Change Period, (Y+Rc), s Max Allow Headway (MAH), s Queue Clearance Time (gs), s Green Extension Time (ge), s Phase Call Probability Max Out Probability Movement Group Results EB WB NB SB Approach Movement L T R L T R L T R L T R Assigned Movement Adjusted Flow Rate (v), veh/h Adjusted Saturation Flow Rate (s), veh/h/ln Queue Service Time (gs), s Cycle Queue Clearance Time (gc), s Green Ratio (g/c) Capacity (c), veh/h Volume-to-Capacity Ratio (X) Available Capacity (ca), veh/h Back of Queue (Q), veh/ln (50th percentile) Queue Storage Ratio (RQ) (50th percentile) Uniform Delay (d1), s/veh Incremental Delay (d2), s/veh Initial Queue Delay (d3), s/veh Control Delay (d), s/veh Level of Service (LOS) E D D C D D Approach Delay, s/veh / LOS 39.9 D 39.8 D 39.9 D 0.0 Intersection Delay, s/veh / LOS 39.9 D Multimodal Results EB WB NB SB Pedestrian LOS Score / LOS 1.9 A 2.4 B 2.8 C 3.0 C Bicycle LOS Score / LOS 2.2 B 1.3 A 2.5 B Copyright 2015 University of Florida, All Rights Reserved. HCS 2010 Streets Version 6.65 Generated: 12/17/2015 8:34:11 AM
59 HCS 2010 Signalized Intersection Results Summary General Information Intersection Information Agency PB Duration, h 0.25 Analyst NRW Analysis Date Aug 31, 2015 Area Type Other Jurisdiction Time Period PM DHV PHF 0.92 Intersection Austin Blvd & IR 75 NB RamAnalysis Year 2038 Analysis Period 1> 7:00 File Name NB75Ramps_PM_Existing.xus Project Description Existing Demand Information EB WB NB SB Approach Movement L T R L T R L T R L T R Demand (v), veh/h Signal Information Cycle, s Reference Phase 2 Offset, s 0 Reference Point End Uncoordinated Yes Simult. Gap E/W On Force Mode Fixed Simult. Gap N/S On Green Yellow Red Timer Results EBL EBT WBL WBT NBL NBT SBL SBT Assigned Phase Case Number Phase Duration, s Change Period, (Y+Rc), s Max Allow Headway (MAH), s Queue Clearance Time (gs), s Green Extension Time (ge), s Phase Call Probability Max Out Probability Movement Group Results EB WB NB SB Approach Movement L T R L T R L T R L T R Assigned Movement Adjusted Flow Rate (v), veh/h Adjusted Saturation Flow Rate (s), veh/h/ln Queue Service Time (gs), s Cycle Queue Clearance Time (gc), s Green Ratio (g/c) Capacity (c), veh/h Volume-to-Capacity Ratio (X) Available Capacity (ca), veh/h Back of Queue (Q), veh/ln (50th percentile) Queue Storage Ratio (RQ) (50th percentile) Uniform Delay (d1), s/veh Incremental Delay (d2), s/veh Initial Queue Delay (d3), s/veh Control Delay (d), s/veh Level of Service (LOS) E C F E F F Approach Delay, s/veh / LOS 28.7 C 81.2 F 81.0 F 0.0 Intersection Delay, s/veh / LOS 58.2 E Multimodal Results EB WB NB SB Pedestrian LOS Score / LOS 1.9 A 2.4 B 2.8 C 3.0 C Bicycle LOS Score / LOS 2.5 B 2.3 B 2.1 B Copyright 2015 University of Florida, All Rights Reserved. HCS 2010 Streets Version 6.65 Generated: 12/17/ :42:59 PM
60 Austin Boulevard & I-75 NB Ramps Build

61 HCS 2010 Signalized Intersection Results Summary General Information Intersection Information Agency PB Duration, h 0.25 Analyst NRW Analysis Date Dec 17, 2015 Area Type Other Jurisdiction Time Period AM DHV PHF 0.92 Intersection Austin Blvd & IR 75 NB RamAnalysis Year 2038 Analysis Period 1> 7:00 File Name NB75Ramps_AM_Build.xus Project Description Build Demand Information EB WB NB SB Approach Movement L T R L T R L T R L T R Demand (v), veh/h Signal Information Cycle, s Reference Phase 2 Offset, s 0 Reference Point End Uncoordinated Yes Simult. Gap E/W On Force Mode Fixed Simult. Gap N/S On Green Yellow Red Timer Results EBL EBT WBL WBT NBL NBT SBL SBT Assigned Phase Case Number Phase Duration, s Change Period, (Y+Rc), s Max Allow Headway (MAH), s Queue Clearance Time (gs), s Green Extension Time (ge), s Phase Call Probability Max Out Probability Movement Group Results EB WB NB SB Approach Movement L T R L T R L T R L T R Assigned Movement Adjusted Flow Rate (v), veh/h Adjusted Saturation Flow Rate (s), veh/h/ln Queue Service Time (gs), s Cycle Queue Clearance Time (gc), s Green Ratio (g/c) Capacity (c), veh/h Volume-to-Capacity Ratio (X) Available Capacity (ca), veh/h Back of Queue (Q), veh/ln (50th percentile) Queue Storage Ratio (RQ) (50th percentile) Uniform Delay (d1), s/veh Incremental Delay (d2), s/veh Initial Queue Delay (d3), s/veh Control Delay (d), s/veh Level of Service (LOS) F C C F C F Approach Delay, s/veh / LOS 45.1 D 81.3 F 81.3 F 0.0 Intersection Delay, s/veh / LOS 68.1 E Multimodal Results EB WB NB SB Pedestrian LOS Score / LOS 1.9 A 2.4 B 3.0 C 3.0 C Bicycle LOS Score / LOS 2.2 B 2.5 B F Copyright 2015 University of Florida, All Rights Reserved. HCS 2010 Streets Version 6.65 Generated: 12/17/2015 8:40:33 AM
62 HCS 2010 Signalized Intersection Results Summary General Information Intersection Information Agency PB Duration, h 0.25 Analyst NRW Analysis Date Aug 31, 2015 Area Type Other Jurisdiction Time Period PM DHV PHF 0.92 Intersection Austin Blvd & IR 75 NB RamAnalysis Year 2038 Analysis Period 1> 7:00 File Name NB75Ramps_PM_Build.xus Project Description Build Alternative Demand Information EB WB NB SB Approach Movement L T R L T R L T R L T R Demand (v), veh/h Signal Information Cycle, s Reference Phase 2 Offset, s 0 Reference Point End Uncoordinated Yes Simult. Gap E/W On Force Mode Fixed Simult. Gap N/S On Green Yellow Red Timer Results EBL EBT WBL WBT NBL NBT SBL SBT Assigned Phase Case Number Phase Duration, s Change Period, (Y+Rc), s Max Allow Headway (MAH), s Queue Clearance Time (gs), s Green Extension Time (ge), s Phase Call Probability Max Out Probability Movement Group Results EB WB NB SB Approach Movement L T R L T R L T R L T R Assigned Movement Adjusted Flow Rate (v), veh/h Adjusted Saturation Flow Rate (s), veh/h/ln Queue Service Time (gs), s Cycle Queue Clearance Time (gc), s Green Ratio (g/c) Capacity (c), veh/h Volume-to-Capacity Ratio (X) Available Capacity (ca), veh/h Back of Queue (Q), veh/ln (50th percentile) Queue Storage Ratio (RQ) (50th percentile) Uniform Delay (d1), s/veh Incremental Delay (d2), s/veh Initial Queue Delay (d3), s/veh Control Delay (d), s/veh Level of Service (LOS) F C F C D E Approach Delay, s/veh / LOS 41.4 D 62.5 E 62.3 E 0.0 Intersection Delay, s/veh / LOS 54.7 D Multimodal Results EB WB NB SB Pedestrian LOS Score / LOS 1.9 A 2.4 B 3.0 C 3.0 C Bicycle LOS Score / LOS 2.5 B 3.1 C F Copyright 2015 University of Florida, All Rights Reserved. HCS 2010 Streets Version 6.65 Generated: 12/17/ :17:18 AM
63 Austin Boulevard & Austin Landing No Build

64 HCS 2010 Signalized Intersection Results Summary General Information Intersection Information Agency PB Duration, h 0.25 Analyst NRW Analysis Date Aug 31, 2015 Area Type Other Jurisdiction Time Period AM DHV PHF 0.92 Intersection Austin Blvd & Austin Landin Analysis Year 2038 Analysis Period 1> 7:00 File Name AustinLanding_AM_Existing.xus Project Description Existing Demand Information EB WB NB SB Approach Movement L T R L T R L T R L T R Demand (v), veh/h Signal Information Cycle, s Reference Phase 2 Offset, s 0 Reference Point End Uncoordinated Yes Simult. Gap E/W On Force Mode Fixed Simult. Gap N/S On Green Yellow Red Timer Results EBL EBT WBL WBT NBL NBT SBL SBT Assigned Phase Case Number Phase Duration, s Change Period, (Y+Rc), s Max Allow Headway (MAH), s Queue Clearance Time (gs), s Green Extension Time (ge), s Phase Call Probability Max Out Probability Movement Group Results EB WB NB SB Approach Movement L T R L T R L T R L T R Assigned Movement Adjusted Flow Rate (v), veh/h Adjusted Saturation Flow Rate (s), veh/h/ln Queue Service Time (gs), s Cycle Queue Clearance Time (gc), s Green Ratio (g/c) Capacity (c), veh/h Volume-to-Capacity Ratio (X) Available Capacity (ca), veh/h Back of Queue (Q), veh/ln (50th percentile) Queue Storage Ratio (RQ) (50th percentile) Uniform Delay (d1), s/veh Incremental Delay (d2), s/veh Initial Queue Delay (d3), s/veh Control Delay (d), s/veh Level of Service (LOS) F C B D B E D C D D Approach Delay, s/veh / LOS 45.3 D 49.5 D 49.3 D 41.7 D Intersection Delay, s/veh / LOS 47.1 D Multimodal Results EB WB NB SB Pedestrian LOS Score / LOS 2.4 B 2.9 C 3.0 C 3.4 C Bicycle LOS Score / LOS 2.7 B 1.7 A 0.9 A 0.8 A Copyright 2015 University of Florida, All Rights Reserved. HCS 2010 Streets Version 6.65 Generated: 12/17/ :27:47 AM
65 HCS 2010 Signalized Intersection Results Summary General Information Intersection Information Agency PB Duration, h 0.25 Analyst NRW Analysis Date Aug 31, 2015 Area Type Other Jurisdiction Time Period AM DHV PHF 0.92 Intersection Austin Blvd & Austin Landin Analysis Year 2038 Analysis Period 1> 7:00 File Name AustinLanding_AM_Existing_RTOL.xus Project Description Existing with Right Turn Overlap Demand Information EB WB NB SB Approach Movement L T R L T R L T R L T R Demand (v), veh/h Signal Information Cycle, s Reference Phase 2 Offset, s 0 Reference Point End Uncoordinated Yes Simult. Gap E/W On Force Mode Fixed Simult. Gap N/S On Green Yellow Red Timer Results EBL EBT WBL WBT NBL NBT SBL SBT Assigned Phase Case Number Phase Duration, s Change Period, (Y+Rc), s Max Allow Headway (MAH), s Queue Clearance Time (gs), s Green Extension Time (ge), s Phase Call Probability Max Out Probability Movement Group Results EB WB NB SB Approach Movement L T R L T R L T R L T R Assigned Movement Adjusted Flow Rate (v), veh/h Adjusted Saturation Flow Rate (s), veh/h/ln Queue Service Time (gs), s Cycle Queue Clearance Time (gc), s Green Ratio (g/c) Capacity (c), veh/h Volume-to-Capacity Ratio (X) Available Capacity (ca), veh/h Back of Queue (Q), veh/ln (50th percentile) Queue Storage Ratio (RQ) (50th percentile) Uniform Delay (d1), s/veh Incremental Delay (d2), s/veh Initial Queue Delay (d3), s/veh Control Delay (d), s/veh Level of Service (LOS) F C B D B E D C D C Approach Delay, s/veh / LOS 45.3 D 49.5 D 49.3 D 35.0 C Intersection Delay, s/veh / LOS 46.8 D Multimodal Results EB WB NB SB Pedestrian LOS Score / LOS 2.4 B 2.9 C 3.0 C 3.4 C Bicycle LOS Score / LOS 2.7 B 1.7 A 0.9 A 0.8 A Copyright 2015 University of Florida, All Rights Reserved. HCS 2010 Streets Version 6.65 Generated: 12/17/ :06:06 AM
66 HCS 2010 Signalized Intersection Results Summary General Information Intersection Information Agency PB Duration, h 0.25 Analyst NRW Analysis Date Jul 24, 2014 Area Type Other Jurisdiction Time Period PM DHV PHF 0.92 Intersection Austin Blvd & Austin Landin Analysis Year 2038 Analysis Period 1> 7:00 File Name AustinLanding_PM_Existing.xus Project Description Existing Demand Information EB WB NB SB Approach Movement L T R L T R L T R L T R Demand (v), veh/h Signal Information Cycle, s Reference Phase 2 Offset, s 0 Reference Point End Uncoordinated Yes Simult. Gap E/W On Force Mode Fixed Simult. Gap N/S On Green Yellow Red Timer Results EBL EBT WBL WBT NBL NBT SBL SBT Assigned Phase Case Number Phase Duration, s Change Period, (Y+Rc), s Max Allow Headway (MAH), s Queue Clearance Time (gs), s Green Extension Time (ge), s Phase Call Probability Max Out Probability Movement Group Results EB WB NB SB Approach Movement L T R L T R L T R L T R Assigned Movement Adjusted Flow Rate (v), veh/h Adjusted Saturation Flow Rate (s), veh/h/ln Queue Service Time (gs), s Cycle Queue Clearance Time (gc), s Green Ratio (g/c) Capacity (c), veh/h Volume-to-Capacity Ratio (X) Available Capacity (ca), veh/h Back of Queue (Q), veh/ln (50th percentile) Queue Storage Ratio (RQ) (50th percentile) Uniform Delay (d1), s/veh Incremental Delay (d2), s/veh Initial Queue Delay (d3), s/veh Control Delay (d), s/veh Level of Service (LOS) F F B F C F F C D F Approach Delay, s/veh / LOS F F F 72.1 E Intersection Delay, s/veh / LOS F Multimodal Results EB WB NB SB Pedestrian LOS Score / LOS 2.4 B 3.0 C 3.0 C 3.4 C Bicycle LOS Score / LOS 2.9 C 1.7 A 1.8 A 1.8 A Copyright 2015 University of Florida, All Rights Reserved. HCS 2010 Streets Version 6.65 Generated: 12/17/ :11:08 AM
67 HCS 2010 Signalized Intersection Results Summary General Information Intersection Information Agency PB Duration, h 0.25 Analyst NRW Analysis Date Jul 24, 2014 Area Type Other Jurisdiction Time Period PM DHV PHF 0.92 Intersection Austin Blvd & Austin Landin Analysis Year 2038 Analysis Period 1> 7:00 File Name AustinLanding_PM_Existing_RTOL.xus Project Description Existing with Right Turn Overlap Demand Information EB WB NB SB Approach Movement L T R L T R L T R L T R Demand (v), veh/h Signal Information Cycle, s Reference Phase 2 Offset, s 0 Reference Point End Uncoordinated Yes Simult. Gap E/W On Force Mode Fixed Simult. Gap N/S On Green Yellow Red Timer Results EBL EBT WBL WBT NBL NBT SBL SBT Assigned Phase Case Number Phase Duration, s Change Period, (Y+Rc), s Max Allow Headway (MAH), s Queue Clearance Time (gs), s Green Extension Time (ge), s Phase Call Probability Max Out Probability Movement Group Results EB WB NB SB Approach Movement L T R L T R L T R L T R Assigned Movement Adjusted Flow Rate (v), veh/h Adjusted Saturation Flow Rate (s), veh/h/ln Queue Service Time (gs), s Cycle Queue Clearance Time (gc), s Green Ratio (g/c) Capacity (c), veh/h Volume-to-Capacity Ratio (X) Available Capacity (ca), veh/h Back of Queue (Q), veh/ln (50th percentile) Queue Storage Ratio (RQ) (50th percentile) Uniform Delay (d1), s/veh Incremental Delay (d2), s/veh Initial Queue Delay (d3), s/veh Control Delay (d), s/veh Level of Service (LOS) F F B F C F F C D D Approach Delay, s/veh / LOS F F F 35.3 D Intersection Delay, s/veh / LOS F Multimodal Results EB WB NB SB Pedestrian LOS Score / LOS 2.4 B 3.0 C 3.0 C 3.4 C Bicycle LOS Score / LOS 2.9 C 1.7 A 1.8 A 1.8 A Copyright 2015 University of Florida, All Rights Reserved. HCS 2010 Streets Version 6.65 Generated: 12/17/ :11:08 AM
68 Austin Boulevard & Austin Landing Build

69 HCS 2010 Signalized Intersection Results Summary General Information Intersection Information Agency PB Duration, h 0.25 Analyst NRW Analysis Date Aug 31, 2015 Area Type Other Jurisdiction Time Period AM DHV PHF 0.92 Intersection Austin Blvd & Austin Landin Analysis Year 2038 Analysis Period 1> 7:00 File Name AustinLanding_AM_Build.xus Project Description Build Demand Information EB WB NB SB Approach Movement L T R L T R L T R L T R Demand (v), veh/h Signal Information Cycle, s Reference Phase 2 Offset, s 0 Reference Point End Uncoordinated Yes Simult. Gap E/W On Force Mode Fixed Simult. Gap N/S On Green Yellow Red Timer Results EBL EBT WBL WBT NBL NBT SBL SBT Assigned Phase Case Number Phase Duration, s Change Period, (Y+Rc), s Max Allow Headway (MAH), s Queue Clearance Time (gs), s Green Extension Time (ge), s Phase Call Probability Max Out Probability Movement Group Results EB WB NB SB Approach Movement L T R L T R L T R L T R Assigned Movement Adjusted Flow Rate (v), veh/h Adjusted Saturation Flow Rate (s), veh/h/ln Queue Service Time (gs), s Cycle Queue Clearance Time (gc), s Green Ratio (g/c) Capacity (c), veh/h Volume-to-Capacity Ratio (X) Available Capacity (ca), veh/h Back of Queue (Q), veh/ln (50th percentile) Queue Storage Ratio (RQ) (50th percentile) Uniform Delay (d1), s/veh Incremental Delay (d2), s/veh Initial Queue Delay (d3), s/veh Control Delay (d), s/veh Level of Service (LOS) F D B D D D D C D D Approach Delay, s/veh / LOS 43.7 D 44.8 D 44.9 D 37.6 D Intersection Delay, s/veh / LOS 44.0 D Multimodal Results EB WB NB SB Pedestrian LOS Score / LOS 2.4 B 3.0 C 3.0 C 3.7 D Bicycle LOS Score / LOS 2.7 B 1.4 A 0.9 A 0.8 A Copyright 2015 University of Florida, All Rights Reserved. HCS 2010 Streets Version 6.65 Generated: 12/17/ :35:28 AM
70 HCS 2010 Signalized Intersection Results Summary General Information Intersection Information Agency PB Duration, h 0.25 Analyst NRW Analysis Date Aug 31, 2015 Area Type Other Jurisdiction Time Period AM DHV PHF 0.92 Intersection Austin Blvd & Austin Landin Analysis Year 2038 Analysis Period 1> 7:00 File Name AustinLanding_AM_Build_RTOL.xus Project Description Build with Right Turn Overlap Demand Information EB WB NB SB Approach Movement L T R L T R L T R L T R Demand (v), veh/h Signal Information Cycle, s Reference Phase 2 Offset, s 0 Reference Point End Uncoordinated Yes Simult. Gap E/W On Force Mode Fixed Simult. Gap N/S On Green Yellow Red Timer Results EBL EBT WBL WBT NBL NBT SBL SBT Assigned Phase Case Number Phase Duration, s Change Period, (Y+Rc), s Max Allow Headway (MAH), s Queue Clearance Time (gs), s Green Extension Time (ge), s Phase Call Probability Max Out Probability Movement Group Results EB WB NB SB Approach Movement L T R L T R L T R L T R Assigned Movement Adjusted Flow Rate (v), veh/h Adjusted Saturation Flow Rate (s), veh/h/ln Queue Service Time (gs), s Cycle Queue Clearance Time (gc), s Green Ratio (g/c) Capacity (c), veh/h Volume-to-Capacity Ratio (X) Available Capacity (ca), veh/h Back of Queue (Q), veh/ln (50th percentile) Queue Storage Ratio (RQ) (50th percentile) Uniform Delay (d1), s/veh Incremental Delay (d2), s/veh Initial Queue Delay (d3), s/veh Control Delay (d), s/veh Level of Service (LOS) F D B D D D D C D C Approach Delay, s/veh / LOS 43.7 D 44.8 D 44.9 D 30.0 C Intersection Delay, s/veh / LOS 43.7 D Multimodal Results EB WB NB SB Pedestrian LOS Score / LOS 2.4 B 3.0 C 3.0 C 3.7 D Bicycle LOS Score / LOS 2.7 B 1.4 A 0.9 A 0.8 A Copyright 2015 University of Florida, All Rights Reserved. HCS 2010 Streets Version 6.65 Generated: 12/17/ :57:20 AM
71 HCS 2010 Signalized Intersection Results Summary General Information Intersection Information Agency PB Duration, h 0.25 Analyst NRW Analysis Date Aug 31, 2015 Area Type Other Jurisdiction Time Period PM DHV PHF 0.92 Intersection Austin Blvd & Austin Landin Analysis Year 2038 Analysis Period 1> 7:00 File Name AustinLanding_PM_Build.xus Project Description Build Demand Information EB WB NB SB Approach Movement L T R L T R L T R L T R Demand (v), veh/h Signal Information Cycle, s Reference Phase 2 Offset, s 0 Reference Point End Uncoordinated Yes Simult. Gap E/W On Force Mode Fixed Simult. Gap N/S On Green Yellow Red Timer Results EBL EBT WBL WBT NBL NBT SBL SBT Assigned Phase Case Number Phase Duration, s Change Period, (Y+Rc), s Max Allow Headway (MAH), s Queue Clearance Time (gs), s Green Extension Time (ge), s Phase Call Probability Max Out Probability Movement Group Results EB WB NB SB Approach Movement L T R L T R L T R L T R Assigned Movement Adjusted Flow Rate (v), veh/h Adjusted Saturation Flow Rate (s), veh/h/ln Queue Service Time (gs), s Cycle Queue Clearance Time (gc), s Green Ratio (g/c) Capacity (c), veh/h Volume-to-Capacity Ratio (X) Available Capacity (ca), veh/h Back of Queue (Q), veh/ln (50th percentile) Queue Storage Ratio (RQ) (50th percentile) Uniform Delay (d1), s/veh Incremental Delay (d2), s/veh Initial Queue Delay (d3), s/veh Control Delay (d), s/veh Level of Service (LOS) D F B F F E F C D F Approach Delay, s/veh / LOS F 92.6 F F F Intersection Delay, s/veh / LOS F Multimodal Results EB WB NB SB Pedestrian LOS Score / LOS 2.4 B 3.0 C 3.0 C 3.7 D Bicycle LOS Score / LOS 2.9 C 1.4 A 1.8 A 1.8 A Copyright 2015 University of Florida, All Rights Reserved. HCS 2010 Streets Version 6.65 Generated: 12/28/2015 9:42:04 AM
72 HCS 2010 Signalized Intersection Results Summary General Information Intersection Information Agency PB Duration, h 0.25 Analyst NRW Analysis Date Aug 31, 2015 Area Type Other Jurisdiction Time Period PM DHV PHF 0.92 Intersection Austin Blvd & Austin Landin Analysis Year 2038 Analysis Period 1> 7:00 File Name AustinLanding_PM_Build_RTOL.xus Project Description Build with Right Turn Overlap Demand Information EB WB NB SB Approach Movement L T R L T R L T R L T R Demand (v), veh/h Signal Information Cycle, s Reference Phase 2 Offset, s 0 Reference Point End Uncoordinated Yes Simult. Gap E/W On Force Mode Fixed Simult. Gap N/S On Green Yellow Red Timer Results EBL EBT WBL WBT NBL NBT SBL SBT Assigned Phase Case Number Phase Duration, s Change Period, (Y+Rc), s Max Allow Headway (MAH), s Queue Clearance Time (gs), s Green Extension Time (ge), s Phase Call Probability Max Out Probability Movement Group Results EB WB NB SB Approach Movement L T R L T R L T R L T R Assigned Movement Adjusted Flow Rate (v), veh/h Adjusted Saturation Flow Rate (s), veh/h/ln Queue Service Time (gs), s Cycle Queue Clearance Time (gc), s Green Ratio (g/c) Capacity (c), veh/h Volume-to-Capacity Ratio (X) Available Capacity (ca), veh/h Back of Queue (Q), veh/ln (50th percentile) Queue Storage Ratio (RQ) (50th percentile) Uniform Delay (d1), s/veh Incremental Delay (d2), s/veh Initial Queue Delay (d3), s/veh Control Delay (d), s/veh Level of Service (LOS) D F B F F E F C D C Approach Delay, s/veh / LOS F 92.6 F F 30.3 C Intersection Delay, s/veh / LOS 92.3 F Multimodal Results EB WB NB SB Pedestrian LOS Score / LOS 2.4 B 3.0 C 3.0 C 3.7 D Bicycle LOS Score / LOS 2.9 C 1.4 A 1.8 A 1.8 A Copyright 2015 University of Florida, All Rights Reserved. HCS 2010 Streets Version 6.65 Generated: 12/28/2015 9:42:48 AM
73 Austin Boulevard & SR 741 West No Build/Build
74 HCS 2010 Signalized Intersection Results Summary General Information Intersection Information Agency PB Duration, h 0.25 Analyst NRW Analysis Date Dec 17, 2015 Area Type Other Jurisdiction Time Period AM DHV PHF 0.92 Intersection DLT west intersection Analysis Year 2038 Analysis Period 1> 7:00 File Name Project Description DLTwest_AM.xus Existing/Build Demand Information EB WB NB SB Approach Movement L T R L T R L T R L T R Demand (v), veh/h Signal Information Cycle, s Reference Phase 2 Offset, s 0 Reference Point End Uncoordinated Yes Simult. Gap E/W On Force Mode Fixed Simult. Gap N/S Off Green Yellow Red Timer Results EBL EBT WBL WBT NBL NBT SBL SBT Assigned Phase Case Number Phase Duration, s Change Period, (Y+Rc), s Max Allow Headway (MAH), s Queue Clearance Time (gs), s Green Extension Time (ge), s Phase Call Probability Max Out Probability Movement Group Results EB WB NB SB Approach Movement L T R L T R L T R L T R Assigned Movement Adjusted Flow Rate (v), veh/h Adjusted Saturation Flow Rate (s), veh/h/ln Queue Service Time (gs), s Cycle Queue Clearance Time (gc), s Green Ratio (g/c) Capacity (c), veh/h Volume-to-Capacity Ratio (X) Available Capacity (ca), veh/h Back of Queue (Q), veh/ln (50th percentile) Queue Storage Ratio (RQ) (50th percentile) Uniform Delay (d1), s/veh Incremental Delay (d2), s/veh Initial Queue Delay (d3), s/veh Control Delay (d), s/veh Level of Service (LOS) D D D Approach Delay, s/veh / LOS D 49.5 D 44.9 D Intersection Delay, s/veh / LOS 49.0 D Multimodal Results EB WB NB SB Pedestrian LOS Score / LOS 4.2 D 2.3 B 2.7 B 2.5 B Bicycle LOS Score / LOS 2.1 B 1.5 A 0.9 A Copyright 2015 University of Florida, All Rights Reserved. HCS 2010 Streets Version 6.65 Generated: 12/22/2015 1:44:00 PM

75 HCS 2010 Signalized Intersection Results Summary General Information Intersection Information Agency PB Duration, h 0.25 Analyst NRW Analysis Date Dec 17, 2015 Area Type Other Jurisdiction Time Period PM DHV PHF 0.92 Intersection DLT west intersection Analysis Year 2038 Analysis Period 1> 7:00 File Name Project Description DLTwest_PM.xus Existing/Build Demand Information EB WB NB SB Approach Movement L T R L T R L T R L T R Demand (v), veh/h Signal Information Cycle, s Reference Phase 2 Offset, s 0 Reference Point End Uncoordinated Yes Simult. Gap E/W On Force Mode Fixed Simult. Gap N/S Off Green Yellow Red Timer Results EBL EBT WBL WBT NBL NBT SBL SBT Assigned Phase Case Number Phase Duration, s Change Period, (Y+Rc), s Max Allow Headway (MAH), s Queue Clearance Time (gs), s Green Extension Time (ge), s Phase Call Probability Max Out Probability Movement Group Results EB WB NB SB Approach Movement L T R L T R L T R L T R Assigned Movement Adjusted Flow Rate (v), veh/h Adjusted Saturation Flow Rate (s), veh/h/ln Queue Service Time (gs), s Cycle Queue Clearance Time (gc), s Green Ratio (g/c) Capacity (c), veh/h Volume-to-Capacity Ratio (X) Available Capacity (ca), veh/h Back of Queue (Q), veh/ln (50th percentile) Queue Storage Ratio (RQ) (50th percentile) Uniform Delay (d1), s/veh Incremental Delay (d2), s/veh Initial Queue Delay (d3), s/veh Control Delay (d), s/veh Level of Service (LOS) F C F Approach Delay, s/veh / LOS F 31.6 C F Intersection Delay, s/veh / LOS F Multimodal Results EB WB NB SB Pedestrian LOS Score / LOS 5.6 F 2.3 B 2.7 B 2.4 B Bicycle LOS Score / LOS 1.8 A 1.0 A 1.7 A Copyright 2015 University of Florida, All Rights Reserved. HCS 2010 Streets Version 6.65 Generated: 12/22/2015 1:44:59 PM
76 Austin Boulevard & SR 741 Main No Build

77 HCS 2010 Signalized Intersection Results Summary General Information Intersection Information Agency PB Duration, h 0.25 Analyst NRW Analysis Date Dec 17, 2015 Area Type Other Jurisdiction Time Period AM DHV PHF 0.92 Intersection DLT Main Intersection Analysis Year 2038 Analysis Period 1> 7:00 File Name DLTmain_AM_Existing_Revised.xus Project Description Existing Demand Information EB WB NB SB Approach Movement L T R L T R L T R L T R Demand (v), veh/h Signal Information Cycle, s Reference Phase 2 Offset, s 0 Reference Point End Uncoordinated Yes Simult. Gap E/W On Force Mode Fixed Simult. Gap N/S Off Green Yellow Red Timer Results EBL EBT WBL WBT NBL NBT SBL SBT Assigned Phase Case Number Phase Duration, s Change Period, (Y+Rc), s Max Allow Headway (MAH), s Queue Clearance Time (gs), s Green Extension Time (ge), s Phase Call Probability Max Out Probability Movement Group Results EB WB NB SB Approach Movement L T R L T R L T R L T R Assigned Movement Adjusted Flow Rate (v), veh/h Adjusted Saturation Flow Rate (s), veh/h/ln Queue Service Time (gs), s Cycle Queue Clearance Time (gc), s Green Ratio (g/c) Capacity (c), veh/h Volume-to-Capacity Ratio (X) Available Capacity (ca), veh/h Back of Queue (Q), veh/ln (50th percentile) Queue Storage Ratio (RQ) (50th percentile) Uniform Delay (d1), s/veh Incremental Delay (d2), s/veh Initial Queue Delay (d3), s/veh Control Delay (d), s/veh Level of Service (LOS) D E F D F C B D F F Approach Delay, s/veh / LOS 54.1 D F 67.9 E F Intersection Delay, s/veh / LOS 84.9 F Multimodal Results EB WB NB SB Pedestrian LOS Score / LOS 3.0 C 3.0 C 3.3 C 4.0 D Bicycle LOS Score / LOS 1.4 A 1.6 A 2.1 B 1.2 A Copyright 2016 University of Florida, All Rights Reserved. HCS 2010 Streets Version 6.65 Generated: 1/14/2016 7:43:26 AM
78 HCS 2010 Signalized Intersection Results Summary General Information Intersection Information Agency PB Duration, h 0.25 Analyst NRW Analysis Date Dec 17, 2015 Area Type Other Jurisdiction Time Period PM DHV PHF 0.92 Intersection DLT Main Intersection Analysis Year 2038 Analysis Period 1> 7:00 File Name DLTmain_PM_Existing_Revised.xus Project Description Build Demand Information EB WB NB SB Approach Movement L T R L T R L T R L T R Demand (v), veh/h Signal Information Cycle, s Reference Phase 2 Offset, s 0 Reference Point End Uncoordinated Yes Simult. Gap E/W On Force Mode Fixed Simult. Gap N/S Off Green Yellow Red Timer Results EBL EBT WBL WBT NBL NBT SBL SBT Assigned Phase Case Number Phase Duration, s Change Period, (Y+Rc), s Max Allow Headway (MAH), s Queue Clearance Time (gs), s Green Extension Time (ge), s Phase Call Probability Max Out Probability Movement Group Results EB WB NB SB Approach Movement L T R L T R L T R L T R Assigned Movement Adjusted Flow Rate (v), veh/h Adjusted Saturation Flow Rate (s), veh/h/ln Queue Service Time (gs), s Cycle Queue Clearance Time (gc), s Green Ratio (g/c) Capacity (c), veh/h Volume-to-Capacity Ratio (X) Available Capacity (ca), veh/h Back of Queue (Q), veh/ln (50th percentile) Queue Storage Ratio (RQ) (50th percentile) Uniform Delay (d1), s/veh Incremental Delay (d2), s/veh Initial Queue Delay (d3), s/veh Control Delay (d), s/veh Level of Service (LOS) F D E D F C B F F F Approach Delay, s/veh / LOS F 56.8 E F F Intersection Delay, s/veh / LOS F Multimodal Results EB WB NB SB Pedestrian LOS Score / LOS 3.0 C 3.0 C 3.1 C 4.5 E Bicycle LOS Score / LOS 1.7 A 1.2 A 2.4 B 2.5 B Copyright 2016 University of Florida, All Rights Reserved. HCS 2010 Streets Version 6.65 Generated: 1/14/2016 8:01:15 AM
79 Austin Boulevard & SR 741 Main Build

80 HCS 2010 Signalized Intersection Results Summary General Information Intersection Information Agency PB Duration, h 0.25 Analyst NRW Analysis Date Dec 17, 2015 Area Type Other Jurisdiction Time Period AM DHV PHF 0.92 Intersection DLT Main Intersection Analysis Year 2038 Analysis Period 1> 7:00 File Name DLTmain_AM_Build_Revised.xus Project Description Build Demand Information EB WB NB SB Approach Movement L T R L T R L T R L T R Demand (v), veh/h Signal Information Cycle, s Reference Phase 2 Offset, s 0 Reference Point End Uncoordinated Yes Simult. Gap E/W On Force Mode Fixed Simult. Gap N/S Off Green Yellow Red Timer Results EBL EBT WBL WBT NBL NBT SBL SBT Assigned Phase Case Number Phase Duration, s Change Period, (Y+Rc), s Max Allow Headway (MAH), s Queue Clearance Time (gs), s Green Extension Time (ge), s Phase Call Probability Max Out Probability Movement Group Results EB WB NB SB Approach Movement L T R L T R L T R L T R Assigned Movement Adjusted Flow Rate (v), veh/h Adjusted Saturation Flow Rate (s), veh/h/ln Queue Service Time (gs), s Cycle Queue Clearance Time (gc), s Green Ratio (g/c) Capacity (c), veh/h Volume-to-Capacity Ratio (X) Available Capacity (ca), veh/h Back of Queue (Q), veh/ln (50th percentile) Queue Storage Ratio (RQ) (50th percentile) Uniform Delay (d1), s/veh Incremental Delay (d2), s/veh Initial Queue Delay (d3), s/veh Control Delay (d), s/veh Level of Service (LOS) D D F D C C B D F F Approach Delay, s/veh / LOS 49.3 D 84.4 F 26.3 C 84.5 F Intersection Delay, s/veh / LOS 55.9 E Multimodal Results EB WB NB SB Pedestrian LOS Score / LOS 3.1 C 3.0 C 3.3 C 4.0 D Bicycle LOS Score / LOS 1.4 A 1.6 A 2.1 B 1.2 A Copyright 2016 University of Florida, All Rights Reserved. HCS 2010 Streets Version 6.65 Generated: 1/13/2016 3:17:17 PM
81 HCS 2010 Signalized Intersection Results Summary General Information Intersection Information Agency PB Duration, h 0.25 Analyst NRW Analysis Date Dec 17, 2015 Area Type Other Jurisdiction Time Period PM DHV PHF 0.92 Intersection DLT Main Intersection Analysis Year 2038 Analysis Period 1> 7:00 File Name DLTmain_PM_Build_Revised.xus Project Description Build Demand Information EB WB NB SB Approach Movement L T R L T R L T R L T R Demand (v), veh/h Signal Information Cycle, s Reference Phase 2 Offset, s 0 Reference Point End Uncoordinated Yes Simult. Gap E/W On Force Mode Fixed Simult. Gap N/S Off Green Yellow Red Timer Results EBL EBT WBL WBT NBL NBT SBL SBT Assigned Phase Case Number Phase Duration, s Change Period, (Y+Rc), s Max Allow Headway (MAH), s Queue Clearance Time (gs), s Green Extension Time (ge), s Phase Call Probability Max Out Probability Movement Group Results EB WB NB SB Approach Movement L T R L T R L T R L T R Assigned Movement Adjusted Flow Rate (v), veh/h Adjusted Saturation Flow Rate (s), veh/h/ln Queue Service Time (gs), s Cycle Queue Clearance Time (gc), s Green Ratio (g/c) Capacity (c), veh/h Volume-to-Capacity Ratio (X) Available Capacity (ca), veh/h Back of Queue (Q), veh/ln (50th percentile) Queue Storage Ratio (RQ) (50th percentile) Uniform Delay (d1), s/veh Incremental Delay (d2), s/veh Initial Queue Delay (d3), s/veh Control Delay (d), s/veh Level of Service (LOS) F D D D F C C F F F Approach Delay, s/veh / LOS F 46.6 D 83.6 F F Intersection Delay, s/veh / LOS 88.5 F Multimodal Results EB WB NB SB Pedestrian LOS Score / LOS 3.1 C 3.0 C 3.1 C 4.5 E Bicycle LOS Score / LOS 1.7 A 1.2 A 2.4 B 2.5 B Copyright 2016 University of Florida, All Rights Reserved. HCS 2010 Streets Version 6.65 Generated: 1/14/2016 7:45:06 AM
82 Austin Boulevard & SR 741 East No Build/Build
83 HCS 2010 Signalized Intersection Results Summary General Information Intersection Information Agency PB Duration, h 0.25 Analyst NRW Analysis Date Dec 17, 2015 Area Type Other Jurisdiction Time Period AM DHV PHF 0.92 Intersection DLT east intersection Analysis Year 2038 Analysis Period 1> 7:00 File Name Project Description DLTeast_AM.xus Existing/Build Demand Information EB WB NB SB Approach Movement L T R L T R L T R L T R Demand (v), veh/h Signal Information Cycle, s Reference Phase 2 Offset, s 0 Reference Point End Uncoordinated Yes Simult. Gap E/W On Force Mode Fixed Simult. Gap N/S Off Green Yellow Red Timer Results EBL EBT WBL WBT NBL NBT SBL SBT Assigned Phase Case Number Phase Duration, s Change Period, (Y+Rc), s Max Allow Headway (MAH), s Queue Clearance Time (gs), s Green Extension Time (ge), s Phase Call Probability Max Out Probability Movement Group Results EB WB NB SB Approach Movement L T R L T R L T R L T R Assigned Movement Adjusted Flow Rate (v), veh/h Adjusted Saturation Flow Rate (s), veh/h/ln Queue Service Time (gs), s Cycle Queue Clearance Time (gc), s Green Ratio (g/c) Capacity (c), veh/h Volume-to-Capacity Ratio (X) Available Capacity (ca), veh/h Back of Queue (Q), veh/ln (50th percentile) Queue Storage Ratio (RQ) (50th percentile) Uniform Delay (d1), s/veh Incremental Delay (d2), s/veh Initial Queue Delay (d3), s/veh Control Delay (d), s/veh Level of Service (LOS) C C C Approach Delay, s/veh / LOS 27.5 C C 27.6 C Intersection Delay, s/veh / LOS 27.4 C Multimodal Results EB WB NB SB Pedestrian LOS Score / LOS 2.3 B 4.2 D 2.4 B 2.7 B Bicycle LOS Score / LOS 1.0 A 0.7 A 1.0 A Copyright 2015 University of Florida, All Rights Reserved. HCS 2010 Streets Version 6.65 Generated: 12/22/2015 1:46:20 PM
84 HCS 2010 Signalized Intersection Results Summary General Information Intersection Information Agency PB Duration, h 0.25 Analyst NRW Analysis Date Dec 17, 2015 Area Type Other Jurisdiction Time Period PM DHV PHF 0.92 Intersection DLT east intersection Analysis Year 2038 Analysis Period 1> 7:00 File Name Project Description DLTeast_PM.xus Existing/Build Demand Information EB WB NB SB Approach Movement L T R L T R L T R L T R Demand (v), veh/h Signal Information Cycle, s Reference Phase 2 Offset, s 0 Reference Point End Uncoordinated Yes Simult. Gap E/W On Force Mode Fixed Simult. Gap N/S Off Green Yellow Red Timer Results EBL EBT WBL WBT NBL NBT SBL SBT Assigned Phase Case Number Phase Duration, s Change Period, (Y+Rc), s Max Allow Headway (MAH), s Queue Clearance Time (gs), s Green Extension Time (ge), s Phase Call Probability Max Out Probability Movement Group Results EB WB NB SB Approach Movement L T R L T R L T R L T R Assigned Movement Adjusted Flow Rate (v), veh/h Adjusted Saturation Flow Rate (s), veh/h/ln Queue Service Time (gs), s Cycle Queue Clearance Time (gc), s Green Ratio (g/c) Capacity (c), veh/h Volume-to-Capacity Ratio (X) Available Capacity (ca), veh/h Back of Queue (Q), veh/ln (50th percentile) Queue Storage Ratio (RQ) (50th percentile) Uniform Delay (d1), s/veh Incremental Delay (d2), s/veh Initial Queue Delay (d3), s/veh Control Delay (d), s/veh Level of Service (LOS) C C C Approach Delay, s/veh / LOS 33.3 C C 28.6 C Intersection Delay, s/veh / LOS 32.6 C Multimodal Results EB WB NB SB Pedestrian LOS Score / LOS 2.3 B 3.5 D 2.4 B 2.7 B Bicycle LOS Score / LOS 1.4 A 1.0 A 0.9 A Copyright 2015 University of Florida, All Rights Reserved. HCS 2010 Streets Version 6.65 Generated: 12/22/2015 1:47:23 PM
85 Appendix C Synchro Analyses
86 Lanes, Volumes, Timings 2: I-75 Ramp P/I-75 Ramp M & Austin Blvd 9/3/2015 Lane Group EBL EBT EBR WBL WBT WBR NBL NBT NBR SBL SBT SBR Lane Configurations Volume (vph) Ideal Flow (vphpl) Storage Length (ft) Storage Lanes Taper Length (ft) Lane Util. Factor Frt Flt Protected Satd. Flow (prot) Flt Permitted Satd. Flow (perm) Right Turn on Red No No No No Satd. Flow (RTOR) Link Speed (mph) Link Distance (ft) Travel Time (s) Peak Hour Factor Adj. Flow (vph) Shared Lane Traffic (%) 48% 10% Lane Group Flow (vph) Enter Blocked Intersection No No No No No No No No No No No No Lane Alignment Left Left Right Left Left Right Left Left Right Left Left Right Median Width(ft) Link Offset(ft) Crosswalk Width(ft) Two way Left Turn Lane Headway Factor Turning Speed (mph) Number of Detectors Detector Template Thru Right Left Thru Left Thru Right Leading Detector (ft) Trailing Detector (ft) Detector 1 Position(ft) Detector 1 Size(ft) Detector 1 Type Cl+Ex Cl+Ex Cl+Ex Cl+Ex Cl+Ex Cl+Ex Cl+Ex Detector 1 Channel Detector 1 Extend (s) Detector 1 Queue (s) Detector 1 Delay (s) Detector 2 Position(ft) Detector 2 Size(ft) Detector 2 Type Cl+Ex Cl+Ex Cl+Ex Detector 2 Channel Detector 2 Extend (s) Turn Type NA Perm Prot NA Perm NA Perm Protected Phases Permitted Phases Detector Phase Existing Conditions 7/31/2014 Baseline Synchro 9 Report MEH Page 1
87 Lanes, Volumes, Timings 2: I-75 Ramp P/I-75 Ramp M & Austin Blvd 9/3/2015 Lane Group EBL EBT EBR WBL WBT WBR NBL NBT NBR SBL SBT SBR Switch Phase Minimum Initial (s) Minimum Split (s) Total Split (s) Total Split (%) 37.5% 37.5% 23.3% 60.8% 39.2% 39.2% 39.2% Maximum Green (s) Yellow Time (s) All-Red Time (s) Lost Time Adjust (s) Total Lost Time (s) Lead/Lag Lag Lag Lead Lead-Lag Optimize? Vehicle Extension (s) Recall Mode None None C-Max C-Max None None None Walk Time (s) Flash Dont Walk (s) Pedestrian Calls (#/hr) Act Effct Green (s) Actuated g/c Ratio v/c Ratio Control Delay Queue Delay Total Delay LOS E E C B E E D Approach Delay Approach LOS E C E Intersection Summary Area Type: Other Cycle Length: 120 Actuated Cycle Length: 120 Offset: 90 (75%), Referenced to phase 1:WBL and 6:WBT, Start of Yellow Natural Cycle: 90 Control Type: Actuated-Coordinated Maximum v/c Ratio: 0.98 Intersection Signal Delay: 50.2 Intersection LOS: D Intersection Capacity Utilization 122.0% ICU Level of Service H Analysis Period (min) 15 Splits and Phases: 2: I-75 Ramp P/I-75 Ramp M & Austin Blvd Existing Conditions 7/31/2014 Baseline Synchro 9 Report MEH Page 2
88 Lanes, Volumes, Timings 3: I-75 Ramp H/I-75 Ramp J & Austin Blvd 9/3/2015 Lane Group EBL EBT EBR WBL WBT WBR NBL NBT NBR SBL SBT SBR Lane Configurations Volume (vph) Ideal Flow (vphpl) Storage Length (ft) Storage Lanes Taper Length (ft) Lane Util. Factor * *1.00 * Frt Flt Protected Satd. Flow (prot) Flt Permitted Satd. Flow (perm) Right Turn on Red No Yes No No Satd. Flow (RTOR) 782 Link Speed (mph) Link Distance (ft) Travel Time (s) Peak Hour Factor Adj. Flow (vph) Shared Lane Traffic (%) 10% 49% Lane Group Flow (vph) Enter Blocked Intersection No No No No No No No No No No No No Lane Alignment Left Left Right Left Left Right Left Left Right Left Left Right Median Width(ft) Link Offset(ft) Crosswalk Width(ft) Two way Left Turn Lane Headway Factor Turning Speed (mph) Number of Detectors Detector Template Left Thru Thru Right Left Thru Right Leading Detector (ft) Trailing Detector (ft) Detector 1 Position(ft) Detector 1 Size(ft) Detector 1 Type Cl+Ex Cl+Ex Cl+Ex Cl+Ex Cl+Ex Cl+Ex Cl+Ex Detector 1 Channel Detector 1 Extend (s) Detector 1 Queue (s) Detector 1 Delay (s) Detector 2 Position(ft) Detector 2 Size(ft) Detector 2 Type Cl+Ex Cl+Ex Cl+Ex Detector 2 Channel Detector 2 Extend (s) Turn Type Prot NA NA Perm Perm NA Perm Protected Phases Permitted Phases Detector Phase Existing Conditions 7/31/2014 Baseline Synchro 9 Report MEH Page 3
89 Lanes, Volumes, Timings 3: I-75 Ramp H/I-75 Ramp J & Austin Blvd 9/3/2015 Lane Group EBL EBT EBR WBL WBT WBR NBL NBT NBR SBL SBT SBR Switch Phase Minimum Initial (s) Minimum Split (s) Total Split (s) Total Split (%) 15.0% 67.5% 52.5% 52.5% 32.5% 32.5% 32.5% Maximum Green (s) Yellow Time (s) All-Red Time (s) Lost Time Adjust (s) Total Lost Time (s) Lead/Lag Lead Lag Lag Lead-Lag Optimize? Vehicle Extension (s) Recall Mode C-Max C-Max None None None None None Walk Time (s) Flash Dont Walk (s) Pedestrian Calls (#/hr) Act Effct Green (s) Actuated g/c Ratio v/c Ratio Control Delay Queue Delay Total Delay LOS D A A F D F F Approach Delay Approach LOS B F F Intersection Summary Area Type: Other Cycle Length: 120 Actuated Cycle Length: 120 Offset: 18 (15%), Referenced to phase 2:EBT and 5:EBL, Start of Yellow Natural Cycle: 120 Control Type: Actuated-Coordinated Maximum v/c Ratio: 1.30 Intersection Signal Delay: 76.2 Intersection LOS: E Intersection Capacity Utilization 122.0% ICU Level of Service H Analysis Period (min) 15 * User Entered Value Splits and Phases: 3: I-75 Ramp H/I-75 Ramp J & Austin Blvd Existing Conditions 7/31/2014 Baseline Synchro 9 Report MEH Page 4
90 Lanes, Volumes, Timings 4: Access Pt. A & Austin Blvd 9/3/2015 Lane Group EBL EBT EBR WBL WBT WBR NBL NBT NBR SBL SBT SBR Lane Configurations Volume (vph) Ideal Flow (vphpl) Storage Length (ft) Storage Lanes Taper Length (ft) Lane Util. Factor Ped Bike Factor Frt Flt Protected Satd. Flow (prot) Flt Permitted Satd. Flow (perm) Right Turn on Red No No No No Satd. Flow (RTOR) Link Speed (mph) Link Distance (ft) Travel Time (s) Confl. Peds. (#/hr) 5 5 Peak Hour Factor Adj. Flow (vph) Shared Lane Traffic (%) Lane Group Flow (vph) Enter Blocked Intersection No No No No No No No No No No No No Lane Alignment Left Left Right Left Left Right Left Left Right Left Left Right Median Width(ft) Link Offset(ft) Crosswalk Width(ft) Two way Left Turn Lane Headway Factor Turning Speed (mph) Number of Detectors Detector Template Left Thru Right Thru Right Left Thru Left Thru Right Leading Detector (ft) Trailing Detector (ft) Detector 1 Position(ft) Detector 1 Size(ft) Detector 1 Type Cl+Ex Cl+Ex Cl+Ex Cl+Ex Cl+Ex Cl+Ex Cl+Ex Cl+Ex Cl+Ex Cl+Ex Detector 1 Channel Detector 1 Extend (s) Detector 1 Queue (s) Detector 1 Delay (s) Detector 2 Position(ft) Detector 2 Size(ft) Detector 2 Type Cl+Ex Cl+Ex Cl+Ex Cl+Ex Detector 2 Channel Detector 2 Extend (s) Turn Type Prot NA pt+ov NA pt+ov Prot NA pm+pt NA pt+ov Protected Phases Existing Conditions 7/31/2014 Baseline Synchro 9 Report MEH Page 5
91 Lanes, Volumes, Timings 4: Access Pt. A & Austin Blvd 9/3/2015 Lane Group EBL EBT EBR WBL WBT WBR NBL NBT NBR SBL SBT SBR Permitted Phases 4 Detector Phase Switch Phase Minimum Initial (s) Minimum Split (s) Total Split (s) Total Split (%) 18.3% 70.8% 52.4% 11.7% 17.6% 11.7% 17.6% Maximum Green (s) Yellow Time (s) All-Red Time (s) Lost Time Adjust (s) Total Lost Time (s) Lead/Lag Lead Lag Lead Lag Lead Lag Lead-Lag Optimize? Vehicle Extension (s) Recall Mode None C-Max C-Max None None None None Act Effct Green (s) Actuated g/c Ratio v/c Ratio Control Delay Queue Delay Total Delay LOS E B A D B F E C D C Approach Delay Approach LOS B D E D Intersection Summary Area Type: Other Cycle Length: 120 Actuated Cycle Length: 120 Offset: 68 (57%), Referenced to phase 2:EBT and 6:WBT, Start of Yellow Natural Cycle: 110 Control Type: Actuated-Coordinated Maximum v/c Ratio: 0.95 Intersection Signal Delay: 31.2 Intersection LOS: C Intersection Capacity Utilization 79.0% ICU Level of Service D Analysis Period (min) 15 Splits and Phases: 4: Access Pt. A & Austin Blvd Existing Conditions 7/31/2014 Baseline Synchro 9 Report MEH Page 6
92 Lanes, Volumes, Timings 13: Austin Blvd & S.R /3/2015 Lane Group EBL EBT WBT WBR SWL SWR ø1 ø2 ø3 ø4 ø5 ø6 Lane Configurations Volume (vph) Ideal Flow (vphpl) Storage Length (ft) Storage Lanes Taper Length (ft) Lane Util. Factor Frt Flt Protected Satd. Flow (prot) Flt Permitted Satd. Flow (perm) Right Turn on Red No No Satd. Flow (RTOR) Link Speed (mph) Link Distance (ft) Travel Time (s) Peak Hour Factor Adj. Flow (vph) Shared Lane Traffic (%) Lane Group Flow (vph) Enter Blocked Intersection No No No No No No Lane Alignment Left Left Left Right Left Right Median Width(ft) Link Offset(ft) Crosswalk Width(ft) Two way Left Turn Lane Headway Factor Turning Speed (mph) Number of Detectors Detector Template Left Thru Thru Right Leading Detector (ft) Trailing Detector (ft) Detector 1 Position(ft) Detector 1 Size(ft) Detector 1 Type Cl+Ex Cl+Ex Cl+Ex Cl+Ex Detector 1 Channel Detector 1 Extend (s) Detector 1 Queue (s) Detector 1 Delay (s) Detector 2 Position(ft) Detector 2 Size(ft) 6 6 Detector 2 Type Cl+Ex Cl+Ex Detector 2 Channel Detector 2 Extend (s) Turn Type Prot NA NA custom Protected Phases Free Permitted Phases Detector Phase Existing Conditions 7/31/2014 Baseline Synchro 9 Report MEH Page 7
93 Lanes, Volumes, Timings 13: Austin Blvd & S.R /3/2015 Lane Group ø7 ø8 ø9 ø11 ø12 ø13 ø14 ø15 ø16 Lane Configurations Volume (vph) Ideal Flow (vphpl) Storage Length (ft) Storage Lanes Taper Length (ft) Lane Util. Factor Frt Flt Protected Satd. Flow (prot) Flt Permitted Satd. Flow (perm) Right Turn on Red Satd. Flow (RTOR) Link Speed (mph) Link Distance (ft) Travel Time (s) Peak Hour Factor Adj. Flow (vph) Shared Lane Traffic (%) Lane Group Flow (vph) Enter Blocked Intersection Lane Alignment Median Width(ft) Link Offset(ft) Crosswalk Width(ft) Two way Left Turn Lane Headway Factor Turning Speed (mph) Number of Detectors Detector Template Leading Detector (ft) Trailing Detector (ft) Detector 1 Position(ft) Detector 1 Size(ft) Detector 1 Type Detector 1 Channel Detector 1 Extend (s) Detector 1 Queue (s) Detector 1 Delay (s) Detector 2 Position(ft) Detector 2 Size(ft) Detector 2 Type Detector 2 Channel Detector 2 Extend (s) Turn Type Protected Phases Permitted Phases Detector Phase Existing Conditions 7/31/2014 Baseline Synchro 9 Report MEH Page 8
94 Lanes, Volumes, Timings 13: Austin Blvd & S.R /3/2015 Lane Group EBL EBT WBT WBR SWL SWR ø1 ø2 ø3 ø4 ø5 ø6 Switch Phase Minimum Initial (s) Minimum Split (s) Total Split (s) Total Split (%) 45% 9% 7% 30% 15% 39% Maximum Green (s) Yellow Time (s) All-Red Time (s) Lost Time Adjust (s) Total Lost Time (s) Lead/Lag Lead Lag Lead Lag Lead-Lag Optimize? Vehicle Extension (s) Recall Mode None Max Max C-Max None Max Act Effct Green (s) Actuated g/c Ratio v/c Ratio Control Delay Queue Delay Total Delay LOS D A E D Approach Delay Approach LOS B E Intersection Summary Area Type: Other Cycle Length: 155 Actuated Cycle Length: 155 Offset: 0 (0%), Referenced to phase 4:WBEB, Start of Yellow, Master Intersection Natural Cycle: 120 Control Type: Actuated-Coordinated Maximum v/c Ratio: 1.26 Intersection Signal Delay: 43.0 Intersection LOS: D Intersection Capacity Utilization 74.3% ICU Level of Service D Analysis Period (min) 15 Splits and Phases: 13: Austin Blvd & S.R. 741 Existing Conditions 7/31/2014 Baseline Synchro 9 Report MEH Page 9
95 Lanes, Volumes, Timings 13: Austin Blvd & S.R /3/2015 Lane Group ø7 ø8 ø9 ø11 ø12 ø13 ø14 ø15 ø16 Switch Phase Minimum Initial (s) Minimum Split (s) Total Split (s) Total Split (%) 8% 24% 6% 61% 18% 12% 22% 9% 8% Maximum Green (s) Yellow Time (s) All-Red Time (s) Lost Time Adjust (s) Total Lost Time (s) Lead/Lag Lead Lag Lead Lag Lead Lag Lead-Lag Optimize? Yes Yes Yes Yes Vehicle Extension (s) Recall Mode Max Min None Min Min None Max Min Max Act Effct Green (s) Actuated g/c Ratio v/c Ratio Control Delay Queue Delay Total Delay LOS Approach Delay Approach LOS Intersection Summary Existing Conditions 7/31/2014 Baseline Synchro 9 Report MEH Page 10
96 Lanes, Volumes, Timings 17: SR 741 & Austin Blvd 9/3/2015 Lane Group EBT EBR2 WBT WBR2 NBL2 NBT NBR2 SBL2 SBT SBR2 SEL2 NWL2 Lane Configurations Volume (vph) Ideal Flow (vphpl) Storage Length (ft) Storage Lanes Taper Length (ft) Lane Util. Factor Frt Flt Protected Satd. Flow (prot) Flt Permitted Satd. Flow (perm) Right Turn on Red Yes Yes No No Satd. Flow (RTOR) Link Speed (mph) Link Distance (ft) Travel Time (s) Peak Hour Factor Adj. Flow (vph) Shared Lane Traffic (%) Lane Group Flow (vph) Enter Blocked Intersection No No No No No No No No No No No No Lane Alignment Left Right Left Right Left Left Right Left Left Right Left Left Median Width(ft) Link Offset(ft) Crosswalk Width(ft) Two way Left Turn Lane Headway Factor Turning Speed (mph) Number of Detectors Detector Template Thru Right Thru Right Left Thru Right Left Thru Right Left Left Leading Detector (ft) Trailing Detector (ft) Detector 1 Position(ft) Detector 1 Size(ft) Detector 1 Type Cl+Ex Cl+Ex Cl+Ex Cl+Ex Cl+Ex Cl+Ex Cl+Ex Cl+Ex Cl+Ex Cl+Ex Cl+Ex Cl+Ex Detector 1 Channel Detector 1 Extend (s) Detector 1 Queue (s) Detector 1 Delay (s) Detector 2 Position(ft) Detector 2 Size(ft) Detector 2 Type Cl+Ex Cl+Ex Cl+Ex Cl+Ex Detector 2 Channel Detector 2 Extend (s) Turn Type NA custom NA custom Prot NA custom Prot NA custom Prot Prot Protected Phases Permitted Phases Detector Phase Existing Conditions 7/31/2014 Baseline Synchro 9 Report MEH Page 11
97 Lanes, Volumes, Timings 17: SR 741 & Austin Blvd 9/3/2015 Lane Group ø2 ø3 ø6 ø7 ø9 ø11 ø13 ø14 ø15 ø16 Lane Configurations Volume (vph) Ideal Flow (vphpl) Storage Length (ft) Storage Lanes Taper Length (ft) Lane Util. Factor Frt Flt Protected Satd. Flow (prot) Flt Permitted Satd. Flow (perm) Right Turn on Red Satd. Flow (RTOR) Link Speed (mph) Link Distance (ft) Travel Time (s) Peak Hour Factor Adj. Flow (vph) Shared Lane Traffic (%) Lane Group Flow (vph) Enter Blocked Intersection Lane Alignment Median Width(ft) Link Offset(ft) Crosswalk Width(ft) Two way Left Turn Lane Headway Factor Turning Speed (mph) Number of Detectors Detector Template Leading Detector (ft) Trailing Detector (ft) Detector 1 Position(ft) Detector 1 Size(ft) Detector 1 Type Detector 1 Channel Detector 1 Extend (s) Detector 1 Queue (s) Detector 1 Delay (s) Detector 2 Position(ft) Detector 2 Size(ft) Detector 2 Type Detector 2 Channel Detector 2 Extend (s) Turn Type Protected Phases Permitted Phases Detector Phase Existing Conditions 7/31/2014 Baseline Synchro 9 Report MEH Page 12
98 Lanes, Volumes, Timings 17: SR 741 & Austin Blvd 9/3/2015 Lane Group EBT EBR2 WBT WBR2 NBL2 NBT NBR2 SBL2 SBT SBR2 SEL2 NWL2 Switch Phase Minimum Initial (s) Minimum Split (s) Total Split (s) Total Split (%) 30.3% 30.3% 45.2% 14.8% 23.9% 18.2% Maximum Green (s) Yellow Time (s) All-Red Time (s) Lost Time Adjust (s) Total Lost Time (s) Lead/Lag Lead Lead Lead Lead Lead-Lag Optimize? Yes Vehicle Extension (s) Recall Mode C-Max C-Max None None Min Min Act Effct Green (s) Actuated g/c Ratio v/c Ratio Control Delay Queue Delay Total Delay LOS D C F B F C A E F A C C Approach Delay Approach LOS D F F E Intersection Summary Area Type: Other Cycle Length: 155 Actuated Cycle Length: 155 Offset: 0 (0%), Referenced to phase 4:WBEB, Start of Yellow, Master Intersection Natural Cycle: 120 Control Type: Actuated-Coordinated Maximum v/c Ratio: 1.26 Intersection Signal Delay: 68.6 Intersection LOS: E Intersection Capacity Utilization 124.3% ICU Level of Service H Analysis Period (min) 15 Splits and Phases: 17: SR 741 & Austin Blvd Existing Conditions 7/31/2014 Baseline Synchro 9 Report MEH Page 13
99 Lanes, Volumes, Timings 17: SR 741 & Austin Blvd 9/3/2015 Lane Group ø2 ø3 ø6 ø7 ø9 ø11 ø13 ø14 ø15 ø16 Switch Phase Minimum Initial (s) Minimum Split (s) Total Split (s) Total Split (%) 9% 7% 39% 8% 6% 61% 12% 22% 9% 8% Maximum Green (s) Yellow Time (s) All-Red Time (s) Lost Time Adjust (s) Total Lost Time (s) Lead/Lag Lag Lag Lag Lag Lead Lag Lead-Lag Optimize? Yes Yes Yes Vehicle Extension (s) Recall Mode Max Max Max Max None Min None Max Min Max Act Effct Green (s) Actuated g/c Ratio v/c Ratio Control Delay Queue Delay Total Delay LOS Approach Delay Approach LOS Intersection Summary Existing Conditions 7/31/2014 Baseline Synchro 9 Report MEH Page 14
100 Lanes, Volumes, Timings 19: S.R. 741 & Austin Blvd 9/3/2015 Lane Group EBT EBR WBL WBT NEL NER ø1 ø2 ø3 ø4 ø5 ø6 Lane Configurations Volume (vph) Ideal Flow (vphpl) Storage Length (ft) Storage Lanes Taper Length (ft) Lane Util. Factor Frt Flt Protected Satd. Flow (prot) Flt Permitted Satd. Flow (perm) Right Turn on Red No No Satd. Flow (RTOR) Link Speed (mph) Link Distance (ft) Travel Time (s) Peak Hour Factor Adj. Flow (vph) Shared Lane Traffic (%) Lane Group Flow (vph) Enter Blocked Intersection No No No No No No Lane Alignment Left Right Left Left Left Right Median Width(ft) Link Offset(ft) Crosswalk Width(ft) Two way Left Turn Lane Headway Factor Turning Speed (mph) Number of Detectors Detector Template Thru Left Thru Right Leading Detector (ft) Trailing Detector (ft) Detector 1 Position(ft) Detector 1 Size(ft) Detector 1 Type Cl+Ex Cl+Ex Cl+Ex Cl+Ex Detector 1 Channel Detector 1 Extend (s) Detector 1 Queue (s) Detector 1 Delay (s) Detector 2 Position(ft) Detector 2 Size(ft) 6 6 Detector 2 Type Cl+Ex Cl+Ex Detector 2 Channel Detector 2 Extend (s) Turn Type NA Prot NA custom Protected Phases Free Permitted Phases Detector Phase Existing Conditions 7/31/2014 Baseline Synchro 9 Report MEH Page 15
101 Lanes, Volumes, Timings 19: S.R. 741 & Austin Blvd 9/3/2015 Lane Group ø7 ø8 ø9 ø11 ø12 ø13 ø14 ø15 ø16 Lane Configurations Volume (vph) Ideal Flow (vphpl) Storage Length (ft) Storage Lanes Taper Length (ft) Lane Util. Factor Frt Flt Protected Satd. Flow (prot) Flt Permitted Satd. Flow (perm) Right Turn on Red Satd. Flow (RTOR) Link Speed (mph) Link Distance (ft) Travel Time (s) Peak Hour Factor Adj. Flow (vph) Shared Lane Traffic (%) Lane Group Flow (vph) Enter Blocked Intersection Lane Alignment Median Width(ft) Link Offset(ft) Crosswalk Width(ft) Two way Left Turn Lane Headway Factor Turning Speed (mph) Number of Detectors Detector Template Leading Detector (ft) Trailing Detector (ft) Detector 1 Position(ft) Detector 1 Size(ft) Detector 1 Type Detector 1 Channel Detector 1 Extend (s) Detector 1 Queue (s) Detector 1 Delay (s) Detector 2 Position(ft) Detector 2 Size(ft) Detector 2 Type Detector 2 Channel Detector 2 Extend (s) Turn Type Protected Phases Permitted Phases Detector Phase Existing Conditions 7/31/2014 Baseline Synchro 9 Report MEH Page 16
102 Lanes, Volumes, Timings 19: S.R. 741 & Austin Blvd 9/3/2015 Lane Group EBT EBR WBL WBT NEL NER ø1 ø2 ø3 ø4 ø5 ø6 Switch Phase Minimum Initial (s) Minimum Split (s) Total Split (s) Total Split (%) 45% 9% 7% 30% 15% 39% Maximum Green (s) Yellow Time (s) All-Red Time (s) Lost Time Adjust (s) Total Lost Time (s) Lead/Lag Lead Lag Lead Lag Lead-Lag Optimize? Vehicle Extension (s) Recall Mode None Max Max C-Max None Max Act Effct Green (s) Actuated g/c Ratio v/c Ratio Control Delay Queue Delay Total Delay LOS E D A D Approach Delay Approach LOS E A Intersection Summary Area Type: Other Cycle Length: 155 Actuated Cycle Length: 155 Offset: 0 (0%), Referenced to phase 4:WBEB, Start of Yellow, Master Intersection Natural Cycle: 120 Control Type: Actuated-Coordinated Maximum v/c Ratio: 1.26 Intersection Signal Delay: 29.6 Intersection LOS: C Intersection Capacity Utilization 35.4% ICU Level of Service A Analysis Period (min) 15 Splits and Phases: 19: S.R. 741 & Austin Blvd Existing Conditions 7/31/2014 Baseline Synchro 9 Report MEH Page 17
103 Lanes, Volumes, Timings 19: S.R. 741 & Austin Blvd 9/3/2015 Lane Group ø7 ø8 ø9 ø11 ø12 ø13 ø14 ø15 ø16 Switch Phase Minimum Initial (s) Minimum Split (s) Total Split (s) Total Split (%) 8% 24% 6% 61% 18% 12% 22% 9% 8% Maximum Green (s) Yellow Time (s) All-Red Time (s) Lost Time Adjust (s) Total Lost Time (s) Lead/Lag Lead Lag Lead Lag Lead Lag Lead-Lag Optimize? Yes Yes Yes Yes Vehicle Extension (s) Recall Mode Max Min None Min Min None Max Min Max Act Effct Green (s) Actuated g/c Ratio v/c Ratio Control Delay Queue Delay Total Delay LOS Approach Delay Approach LOS Intersection Summary Existing Conditions 7/31/2014 Baseline Synchro 9 Report MEH Page 18
104 Lanes, Volumes, Timings 2: I-75 Ramp P/I-75 Ramp M & Austin Blvd 9/3/2015 Lane Group EBL EBT EBR WBL WBT WBR NBL NBT NBR SBL SBT SBR Lane Configurations Volume (vph) Ideal Flow (vphpl) Storage Length (ft) Storage Lanes Taper Length (ft) Lane Util. Factor Frt Flt Protected Satd. Flow (prot) Flt Permitted Satd. Flow (perm) Right Turn on Red No No No No Satd. Flow (RTOR) Link Speed (mph) Link Distance (ft) Travel Time (s) Peak Hour Factor Adj. Flow (vph) Shared Lane Traffic (%) 48% 10% Lane Group Flow (vph) Enter Blocked Intersection No No No No No No No No No No No No Lane Alignment Left Left Right Left Left Right Left Left Right Left Left Right Median Width(ft) Link Offset(ft) Crosswalk Width(ft) Two way Left Turn Lane Headway Factor Turning Speed (mph) Number of Detectors Detector Template Thru Right Left Thru Left Thru Right Leading Detector (ft) Trailing Detector (ft) Detector 1 Position(ft) Detector 1 Size(ft) Detector 1 Type Cl+Ex Cl+Ex Cl+Ex Cl+Ex Cl+Ex Cl+Ex Cl+Ex Detector 1 Channel Detector 1 Extend (s) Detector 1 Queue (s) Detector 1 Delay (s) Detector 2 Position(ft) Detector 2 Size(ft) Detector 2 Type Cl+Ex Cl+Ex Cl+Ex Detector 2 Channel Detector 2 Extend (s) Turn Type NA Perm Prot NA Perm NA Perm Protected Phases Permitted Phases Detector Phase Build3 7/31/2014 Baseline Synchro 8 Report NRW Page 1
105 Lanes, Volumes, Timings 2: I-75 Ramp P/I-75 Ramp M & Austin Blvd 9/3/2015 Lane Group EBL EBT EBR WBL WBT WBR NBL NBT NBR SBL SBT SBR Switch Phase Minimum Initial (s) Minimum Split (s) Total Split (s) Total Split (%) 37.4% 37.4% 23.5% 60.9% 39.1% 39.1% 39.1% Maximum Green (s) Yellow Time (s) All-Red Time (s) Lost Time Adjust (s) Total Lost Time (s) Lead/Lag Lag Lag Lead Lead-Lag Optimize? Vehicle Extension (s) Recall Mode None None C-Max C-Max None None None Walk Time (s) Flash Dont Walk (s) Pedestrian Calls (#/hr) Act Effct Green (s) Actuated g/c Ratio v/c Ratio Control Delay Queue Delay Total Delay LOS E E C B E F D Approach Delay Approach LOS E B E Intersection Summary Area Type: Other Cycle Length: 115 Actuated Cycle Length: 115 Offset: 55 (48%), Referenced to phase 1:WBL and 6:WBT, Start of Yellow Natural Cycle: 90 Control Type: Actuated-Coordinated Maximum v/c Ratio: 0.99 Intersection Signal Delay: 50.9 Intersection LOS: D Intersection Capacity Utilization 90.7% ICU Level of Service E Analysis Period (min) 15 Splits and Phases: 2: I-75 Ramp P/I-75 Ramp M & Austin Blvd Build3 7/31/2014 Baseline Synchro 8 Report NRW Page 2
106 Lanes, Volumes, Timings 3: I-75 Ramp H/I-75 Ramp J & Austin Blvd 9/3/2015 Lane Group EBL EBT EBR WBL WBT WBR NBL NBT NBR SBL SBT SBR Lane Configurations Volume (vph) Ideal Flow (vphpl) Storage Length (ft) Storage Lanes Taper Length (ft) Lane Util. Factor * *1.00 * Frt Flt Protected Satd. Flow (prot) Flt Permitted Satd. Flow (perm) Right Turn on Red No Yes No No Satd. Flow (RTOR) 1478 Link Speed (mph) Link Distance (ft) Travel Time (s) Peak Hour Factor Adj. Flow (vph) Shared Lane Traffic (%) 10% 49% Lane Group Flow (vph) Enter Blocked Intersection No No No No No No No No No No No No Lane Alignment Left Left Right Left Left Right Left Left Right Left Left Right Median Width(ft) Link Offset(ft) Crosswalk Width(ft) Two way Left Turn Lane Headway Factor Turning Speed (mph) Number of Detectors Detector Template Left Thru Thru Right Left Thru Right Leading Detector (ft) Trailing Detector (ft) Detector 1 Position(ft) Detector 1 Size(ft) Detector 1 Type Cl+Ex Cl+Ex Cl+Ex Cl+Ex Cl+Ex Cl+Ex Cl+Ex Detector 1 Channel Detector 1 Extend (s) Detector 1 Queue (s) Detector 1 Delay (s) Detector 2 Position(ft) Detector 2 Size(ft) Detector 2 Type Cl+Ex Cl+Ex Cl+Ex Detector 2 Channel Detector 2 Extend (s) Turn Type Prot NA NA Perm Perm NA Perm Protected Phases Permitted Phases Detector Phase Build3 7/31/2014 Baseline Synchro 8 Report NRW Page 3
107 Lanes, Volumes, Timings 3: I-75 Ramp H/I-75 Ramp J & Austin Blvd 9/3/2015 Lane Group EBL EBT EBR WBL WBT WBR NBL NBT NBR SBL SBT SBR Switch Phase Minimum Initial (s) Minimum Split (s) Total Split (s) Total Split (%) 18.3% 57.4% 39.1% 39.1% 42.6% 42.6% 42.6% Maximum Green (s) Yellow Time (s) All-Red Time (s) Lost Time Adjust (s) Total Lost Time (s) Lead/Lag Lead Lag Lag Lead-Lag Optimize? Vehicle Extension (s) Recall Mode C-Max C-Max None None None None None Walk Time (s) Flash Dont Walk (s) Pedestrian Calls (#/hr) Act Effct Green (s) Actuated g/c Ratio v/c Ratio Control Delay Queue Delay Total Delay LOS B B B A C E E Approach Delay Approach LOS B B E Intersection Summary Area Type: Other Cycle Length: 115 Actuated Cycle Length: 115 Offset: 108 (94%), Referenced to phase 2:EBT and 5:EBL, Start of Yellow Natural Cycle: 90 Control Type: Actuated-Coordinated Maximum v/c Ratio: 0.96 Intersection Signal Delay: 21.9 Intersection LOS: C Intersection Capacity Utilization 90.7% ICU Level of Service E Analysis Period (min) 15 * User Entered Value Splits and Phases: 3: I-75 Ramp H/I-75 Ramp J & Austin Blvd Build3 7/31/2014 Baseline Synchro 8 Report NRW Page 4
108 Lanes, Volumes, Timings 4: Access Pt. A & Austin Blvd 9/3/2015 Lane Group EBL EBT EBR WBL WBT WBR NBL NBT NBR SBL SBT SBR Lane Configurations Volume (vph) Ideal Flow (vphpl) Storage Length (ft) Storage Lanes Taper Length (ft) Lane Util. Factor Ped Bike Factor Frt Flt Protected Satd. Flow (prot) Flt Permitted Satd. Flow (perm) Right Turn on Red No No No No Satd. Flow (RTOR) Link Speed (mph) Link Distance (ft) Travel Time (s) Confl. Peds. (#/hr) 5 5 Peak Hour Factor Adj. Flow (vph) Shared Lane Traffic (%) Lane Group Flow (vph) Enter Blocked Intersection No No No No No No No No No No No No Lane Alignment Left Left Right Left Left Right Left Left Right Left Left Right Median Width(ft) Link Offset(ft) Crosswalk Width(ft) Two way Left Turn Lane Headway Factor Turning Speed (mph) Number of Detectors Detector Template Left Thru Right Thru Left Thru Left Thru Right Leading Detector (ft) Trailing Detector (ft) Detector 1 Position(ft) Detector 1 Size(ft) Detector 1 Type Cl+Ex Cl+Ex Cl+Ex Cl+Ex Cl+Ex Cl+Ex Cl+Ex Cl+Ex Cl+Ex Detector 1 Channel Detector 1 Extend (s) Detector 1 Queue (s) Detector 1 Delay (s) Detector 2 Position(ft) Detector 2 Size(ft) Detector 2 Type Cl+Ex Cl+Ex Cl+Ex Cl+Ex Detector 2 Channel Detector 2 Extend (s) Turn Type Prot NA pt+ov NA Prot NA pm+pt NA pt+ov Protected Phases Build3 7/31/2014 Baseline Synchro 8 Report NRW Page 5
109 Lanes, Volumes, Timings 4: Access Pt. A & Austin Blvd 9/3/2015 Lane Group EBL EBT EBR WBL WBT WBR NBL NBT NBR SBL SBT SBR Permitted Phases 4 Detector Phase Switch Phase Minimum Initial (s) Minimum Split (s) Total Split (s) Total Split (%) 20.9% 68.6% 47.7% 13.0% 19.2% 12.2% 18.3% Maximum Green (s) Yellow Time (s) All-Red Time (s) Lost Time Adjust (s) Total Lost Time (s) Lead/Lag Lead Lag Lead Lag Lead Lag Lead-Lag Optimize? Vehicle Extension (s) Recall Mode None C-Max C-Max None None None None Act Effct Green (s) Actuated g/c Ratio v/c Ratio Control Delay Queue Delay Total Delay LOS D B A C E D C D C Approach Delay Approach LOS C C E D Intersection Summary Area Type: Other Cycle Length: 115 Actuated Cycle Length: 115 Offset: 34 (30%), Referenced to phase 2:EBT and 6:WBT, Start of Yellow Natural Cycle: 90 Control Type: Actuated-Coordinated Maximum v/c Ratio: 0.85 Intersection Signal Delay: 27.9 Intersection LOS: C Intersection Capacity Utilization 69.9% ICU Level of Service C Analysis Period (min) 15 Splits and Phases: 4: Access Pt. A & Austin Blvd Build3 7/31/2014 Baseline Synchro 8 Report NRW Page 6
110 Lanes, Volumes, Timings 13: Austin Blvd & S.R /3/2015 Lane Group EBL EBT WBT WBR SWL SWR ø1 ø2 ø3 ø4 ø5 ø6 Lane Configurations Volume (vph) Ideal Flow (vphpl) Storage Length (ft) Storage Lanes Taper Length (ft) Lane Util. Factor Frt Flt Protected Satd. Flow (prot) Flt Permitted Satd. Flow (perm) Right Turn on Red No No Satd. Flow (RTOR) Link Speed (mph) Link Distance (ft) Travel Time (s) Peak Hour Factor Adj. Flow (vph) Shared Lane Traffic (%) Lane Group Flow (vph) Enter Blocked Intersection No No No No No No Lane Alignment Left Left Left Right Left Right Median Width(ft) Link Offset(ft) Crosswalk Width(ft) Two way Left Turn Lane Headway Factor Turning Speed (mph) Number of Detectors Detector Template Left Thru Thru Right Leading Detector (ft) Trailing Detector (ft) Detector 1 Position(ft) Detector 1 Size(ft) Detector 1 Type Cl+Ex Cl+Ex Cl+Ex Cl+Ex Detector 1 Channel Detector 1 Extend (s) Detector 1 Queue (s) Detector 1 Delay (s) Detector 2 Position(ft) Detector 2 Size(ft) 6 6 Detector 2 Type Cl+Ex Cl+Ex Detector 2 Channel Detector 2 Extend (s) Turn Type Prot NA NA custom Protected Phases Free Permitted Phases Detector Phase Build3 7/31/2014 Baseline Synchro 8 Report NRW Page 7
111 Lanes, Volumes, Timings 13: Austin Blvd & S.R /3/2015 Lane Group ø7 ø8 ø9 ø11 ø12 ø13 ø14 ø15 ø16 Lane Configurations Volume (vph) Ideal Flow (vphpl) Storage Length (ft) Storage Lanes Taper Length (ft) Lane Util. Factor Frt Flt Protected Satd. Flow (prot) Flt Permitted Satd. Flow (perm) Right Turn on Red Satd. Flow (RTOR) Link Speed (mph) Link Distance (ft) Travel Time (s) Peak Hour Factor Adj. Flow (vph) Shared Lane Traffic (%) Lane Group Flow (vph) Enter Blocked Intersection Lane Alignment Median Width(ft) Link Offset(ft) Crosswalk Width(ft) Two way Left Turn Lane Headway Factor Turning Speed (mph) Number of Detectors Detector Template Leading Detector (ft) Trailing Detector (ft) Detector 1 Position(ft) Detector 1 Size(ft) Detector 1 Type Detector 1 Channel Detector 1 Extend (s) Detector 1 Queue (s) Detector 1 Delay (s) Detector 2 Position(ft) Detector 2 Size(ft) Detector 2 Type Detector 2 Channel Detector 2 Extend (s) Turn Type Protected Phases Permitted Phases Detector Phase Build3 7/31/2014 Baseline Synchro 8 Report NRW Page 8
112 Lanes, Volumes, Timings 13: Austin Blvd & S.R /3/2015 Lane Group EBL EBT WBT WBR SWL SWR ø1 ø2 ø3 ø4 ø5 ø6 Switch Phase Minimum Initial (s) Minimum Split (s) Total Split (s) Total Split (%) 35% 13% 7% 37% 15% 32% Maximum Green (s) Yellow Time (s) All-Red Time (s) Lost Time Adjust (s) Total Lost Time (s) Lead/Lag Lead Lag Lead Lag Lead-Lag Optimize? Vehicle Extension (s) Recall Mode None Max Max C-Max None Max Act Effct Green (s) Actuated g/c Ratio v/c Ratio Control Delay Queue Delay Total Delay LOS E A E D Approach Delay Approach LOS B E Intersection Summary Area Type: Other Cycle Length: 155 Actuated Cycle Length: 155 Offset: 0 (0%), Referenced to phase 4:WBEB, Start of Yellow, Master Intersection Natural Cycle: 110 Control Type: Actuated-Coordinated Maximum v/c Ratio: 0.93 Intersection Signal Delay: 43.4 Intersection LOS: D Intersection Capacity Utilization 74.3% ICU Level of Service D Analysis Period (min) 15 Splits and Phases: 13: Austin Blvd & S.R. 741 Build3 7/31/2014 Baseline Synchro 8 Report NRW Page 9
113 Lanes, Volumes, Timings 13: Austin Blvd & S.R /3/2015 Lane Group ø7 ø8 ø9 ø11 ø12 ø13 ø14 ø15 ø16 Switch Phase Minimum Initial (s) Minimum Split (s) Total Split (s) Total Split (%) 8% 30% 6% 55% 17% 20% 21% 16% 8% Maximum Green (s) Yellow Time (s) All-Red Time (s) Lost Time Adjust (s) Total Lost Time (s) Lead/Lag Lead Lag Lead Lag Lead Lag Lead-Lag Optimize? Yes Yes Yes Yes Vehicle Extension (s) Recall Mode Max Min None Min Min None Max Min Max Act Effct Green (s) Actuated g/c Ratio v/c Ratio Control Delay Queue Delay Total Delay LOS Approach Delay Approach LOS Intersection Summary Build3 7/31/2014 Baseline Synchro 8 Report NRW Page 10
114 Lanes, Volumes, Timings 17: SR 741 & Austin Blvd 9/3/2015 Lane Group EBT EBR2 WBT WBR2 NBL2 NBT NBR2 SBL2 SBT SBR2 SEL2 NWL2 Lane Configurations Volume (vph) Ideal Flow (vphpl) Storage Length (ft) Storage Lanes Taper Length (ft) Lane Util. Factor Frt Flt Protected Satd. Flow (prot) Flt Permitted Satd. Flow (perm) Right Turn on Red Yes Yes No No Satd. Flow (RTOR) Link Speed (mph) Link Distance (ft) Travel Time (s) Peak Hour Factor Adj. Flow (vph) Shared Lane Traffic (%) Lane Group Flow (vph) Enter Blocked Intersection No No No No No No No No No No No No Lane Alignment Left Right Left Right Left Left Right Left Left Right Left Left Median Width(ft) Link Offset(ft) Crosswalk Width(ft) Two way Left Turn Lane Headway Factor Turning Speed (mph) Number of Detectors Detector Template Thru Right Thru Right Left Thru Right Left Thru Right Left Left Leading Detector (ft) Trailing Detector (ft) Detector 1 Position(ft) Detector 1 Size(ft) Detector 1 Type Cl+Ex Cl+Ex Cl+Ex Cl+Ex Cl+Ex Cl+Ex Cl+Ex Cl+Ex Cl+Ex Cl+Ex Cl+Ex Cl+Ex Detector 1 Channel Detector 1 Extend (s) Detector 1 Queue (s) Detector 1 Delay (s) Detector 2 Position(ft) Detector 2 Size(ft) Detector 2 Type Cl+Ex Cl+Ex Cl+Ex Cl+Ex Detector 2 Channel Detector 2 Extend (s) Turn Type NA custom NA custom Prot NA custom Prot NA custom Prot Prot Protected Phases Permitted Phases Detector Phase Build3 7/31/2014 Baseline Synchro 8 Report NRW Page 11
115 Lanes, Volumes, Timings 17: SR 741 & Austin Blvd 9/3/2015 Lane Group ø2 ø3 ø6 ø7 ø9 ø11 ø13 ø14 ø15 ø16 Lane Configurations Volume (vph) Ideal Flow (vphpl) Storage Length (ft) Storage Lanes Taper Length (ft) Lane Util. Factor Frt Flt Protected Satd. Flow (prot) Flt Permitted Satd. Flow (perm) Right Turn on Red Satd. Flow (RTOR) Link Speed (mph) Link Distance (ft) Travel Time (s) Peak Hour Factor Adj. Flow (vph) Shared Lane Traffic (%) Lane Group Flow (vph) Enter Blocked Intersection Lane Alignment Median Width(ft) Link Offset(ft) Crosswalk Width(ft) Two way Left Turn Lane Headway Factor Turning Speed (mph) Number of Detectors Detector Template Leading Detector (ft) Trailing Detector (ft) Detector 1 Position(ft) Detector 1 Size(ft) Detector 1 Type Detector 1 Channel Detector 1 Extend (s) Detector 1 Queue (s) Detector 1 Delay (s) Detector 2 Position(ft) Detector 2 Size(ft) Detector 2 Type Detector 2 Channel Detector 2 Extend (s) Turn Type Protected Phases Permitted Phases Detector Phase Build3 7/31/2014 Baseline Synchro 8 Report NRW Page 12
116 Lanes, Volumes, Timings 17: SR 741 & Austin Blvd 9/3/2015 Lane Group EBT EBR2 WBT WBR2 NBL2 NBT NBR2 SBL2 SBT SBR2 SEL2 NWL2 Switch Phase Minimum Initial (s) Minimum Split (s) Total Split (s) Total Split (%) 36.8% 36.8% 34.8% 14.8% 30.3% 16.6% Maximum Green (s) Yellow Time (s) All-Red Time (s) Lost Time Adjust (s) Total Lost Time (s) Lead/Lag Lead Lead Lead Lead Lead-Lag Optimize? Yes Vehicle Extension (s) Recall Mode C-Max C-Max None None Min Min Act Effct Green (s) Actuated g/c Ratio v/c Ratio Control Delay Queue Delay Total Delay LOS D C F A E C A E E A B C Approach Delay Approach LOS D F D D Intersection Summary Area Type: Other Cycle Length: 155 Actuated Cycle Length: 155 Offset: 0 (0%), Referenced to phase 4:WBEB, Start of Yellow, Master Intersection Natural Cycle: 110 Control Type: Actuated-Coordinated Maximum v/c Ratio: 0.93 Intersection Signal Delay: 49.0 Intersection LOS: D Intersection Capacity Utilization 102.4% ICU Level of Service G Analysis Period (min) 15 Splits and Phases: 17: SR 741 & Austin Blvd Build3 7/31/2014 Baseline Synchro 8 Report NRW Page 13
117 Lanes, Volumes, Timings 17: SR 741 & Austin Blvd 9/3/2015 Lane Group ø2 ø3 ø6 ø7 ø9 ø11 ø13 ø14 ø15 ø16 Switch Phase Minimum Initial (s) Minimum Split (s) Total Split (s) Total Split (%) 13% 7% 32% 8% 6% 55% 20% 21% 16% 8% Maximum Green (s) Yellow Time (s) All-Red Time (s) Lost Time Adjust (s) Total Lost Time (s) Lead/Lag Lag Lag Lag Lag Lead Lag Lead-Lag Optimize? Yes Yes Yes Vehicle Extension (s) Recall Mode Max Max Max Max None Min None Max Min Max Act Effct Green (s) Actuated g/c Ratio v/c Ratio Control Delay Queue Delay Total Delay LOS Approach Delay Approach LOS Intersection Summary Build3 7/31/2014 Baseline Synchro 8 Report NRW Page 14
118 Lanes, Volumes, Timings 19: S.R. 741 & Austin Blvd 9/3/2015 Lane Group EBT EBR WBL WBT NEL NER ø1 ø2 ø3 ø4 ø5 ø6 Lane Configurations Volume (vph) Ideal Flow (vphpl) Storage Length (ft) Storage Lanes Taper Length (ft) Lane Util. Factor Frt Flt Protected Satd. Flow (prot) Flt Permitted Satd. Flow (perm) Right Turn on Red No No Satd. Flow (RTOR) Link Speed (mph) Link Distance (ft) Travel Time (s) Peak Hour Factor Adj. Flow (vph) Shared Lane Traffic (%) Lane Group Flow (vph) Enter Blocked Intersection No No No No No No Lane Alignment Left Right Left Left Left Right Median Width(ft) Link Offset(ft) Crosswalk Width(ft) Two way Left Turn Lane Headway Factor Turning Speed (mph) Number of Detectors Detector Template Thru Left Thru Right Leading Detector (ft) Trailing Detector (ft) Detector 1 Position(ft) Detector 1 Size(ft) Detector 1 Type Cl+Ex Cl+Ex Cl+Ex Cl+Ex Detector 1 Channel Detector 1 Extend (s) Detector 1 Queue (s) Detector 1 Delay (s) Detector 2 Position(ft) Detector 2 Size(ft) 6 6 Detector 2 Type Cl+Ex Cl+Ex Detector 2 Channel Detector 2 Extend (s) Turn Type NA Prot NA custom Protected Phases Free Permitted Phases Detector Phase Build3 7/31/2014 Baseline Synchro 8 Report NRW Page 15
119 Lanes, Volumes, Timings 19: S.R. 741 & Austin Blvd 9/3/2015 Lane Group ø7 ø8 ø9 ø11 ø12 ø13 ø14 ø15 ø16 Lane Configurations Volume (vph) Ideal Flow (vphpl) Storage Length (ft) Storage Lanes Taper Length (ft) Lane Util. Factor Frt Flt Protected Satd. Flow (prot) Flt Permitted Satd. Flow (perm) Right Turn on Red Satd. Flow (RTOR) Link Speed (mph) Link Distance (ft) Travel Time (s) Peak Hour Factor Adj. Flow (vph) Shared Lane Traffic (%) Lane Group Flow (vph) Enter Blocked Intersection Lane Alignment Median Width(ft) Link Offset(ft) Crosswalk Width(ft) Two way Left Turn Lane Headway Factor Turning Speed (mph) Number of Detectors Detector Template Leading Detector (ft) Trailing Detector (ft) Detector 1 Position(ft) Detector 1 Size(ft) Detector 1 Type Detector 1 Channel Detector 1 Extend (s) Detector 1 Queue (s) Detector 1 Delay (s) Detector 2 Position(ft) Detector 2 Size(ft) Detector 2 Type Detector 2 Channel Detector 2 Extend (s) Turn Type Protected Phases Permitted Phases Detector Phase Build3 7/31/2014 Baseline Synchro 8 Report NRW Page 16
 54.0 20.0 11.0 57.0 23.0 50.0 Total Split (%) 35% 13% 7% 37% 15% 32% Maximum Green (s) 47.0 11.0 5.0 51.2 16.0 40.1 Yellow Time (s) 3.0 5.0 5.0 4.8 3.0 5.9 All-Red Time (s) 4.")
120 Lanes, Volumes, Timings 19: S.R. 741 & Austin Blvd 9/3/2015 Lane Group EBT EBR WBL WBT NEL NER ø1 ø2 ø3 ø4 ø5 ø6 Switch Phase Minimum Initial (s) Minimum Split (s) Total Split (s) Total Split (%) 35% 13% 7% 37% 15% 32% Maximum Green (s) Yellow Time (s) All-Red Time (s) Lost Time Adjust (s) Total Lost Time (s) Lead/Lag Lead Lag Lead Lag Lead-Lag Optimize? Vehicle Extension (s) Recall Mode None Max Max C-Max None Max Act Effct Green (s) Actuated g/c Ratio v/c Ratio Control Delay Queue Delay Total Delay LOS D D A D Approach Delay Approach LOS D A Intersection Summary Area Type: Other Cycle Length: 155 Actuated Cycle Length: 155 Offset: 0 (0%), Referenced to phase 4:WBEB, Start of Yellow, Master Intersection Natural Cycle: 110 Control Type: Actuated-Coordinated Maximum v/c Ratio: 0.93 Intersection Signal Delay: 19.6 Intersection LOS: B Intersection Capacity Utilization 35.4% ICU Level of Service A Analysis Period (min) 15 Splits and Phases: 19: S.R. 741 & Austin Blvd Build3 7/31/2014 Baseline Synchro 8 Report NRW Page 17
121 Lanes, Volumes, Timings 19: S.R. 741 & Austin Blvd 9/3/2015 Lane Group ø7 ø8 ø9 ø11 ø12 ø13 ø14 ø15 ø16 Switch Phase Minimum Initial (s) Minimum Split (s) Total Split (s) Total Split (%) 8% 30% 6% 55% 17% 20% 21% 16% 8% Maximum Green (s) Yellow Time (s) All-Red Time (s) Lost Time Adjust (s) Total Lost Time (s) Lead/Lag Lead Lag Lead Lag Lead Lag Lead-Lag Optimize? Yes Yes Yes Yes Vehicle Extension (s) Recall Mode Max Min None Min Min None Max Min Max Act Effct Green (s) Actuated g/c Ratio v/c Ratio Control Delay Queue Delay Total Delay LOS Approach Delay Approach LOS Intersection Summary Build3 7/31/2014 Baseline Synchro 8 Report NRW Page 18
122 Lanes, Volumes, Timings 2: I-75 Ramp P/I-75 Ramp M & Austin Blvd 9/3/2015 Lane Group EBL EBT EBR WBL WBT WBR NBL NBT NBR SBL SBT SBR Lane Configurations Volume (vph) Ideal Flow (vphpl) Storage Length (ft) Storage Lanes Taper Length (ft) Lane Util. Factor Frt Flt Protected Satd. Flow (prot) Flt Permitted Satd. Flow (perm) Right Turn on Red No No No No Satd. Flow (RTOR) Link Speed (mph) Link Distance (ft) Travel Time (s) Peak Hour Factor Heavy Vehicles (%) 1% 1% 1% 1% 1% 1% 1% 1% 1% 1% 1% 1% Adj. Flow (vph) Shared Lane Traffic (%) 48% 10% Lane Group Flow (vph) Enter Blocked Intersection No No No No No No No No No No No No Lane Alignment Left Left Right Left Left Right Left Left Right Left Left Right Median Width(ft) Link Offset(ft) Crosswalk Width(ft) Two way Left Turn Lane Headway Factor Turning Speed (mph) Number of Detectors Detector Template Thru Right Left Thru Left Thru Right Leading Detector (ft) Trailing Detector (ft) Detector 1 Position(ft) Detector 1 Size(ft) Detector 1 Type Cl+Ex Cl+Ex Cl+Ex Cl+Ex Cl+Ex Cl+Ex Cl+Ex Detector 1 Channel Detector 1 Extend (s) Detector 1 Queue (s) Detector 1 Delay (s) Detector 2 Position(ft) Detector 2 Size(ft) Detector 2 Type Cl+Ex Cl+Ex Cl+Ex Detector 2 Channel Detector 2 Extend (s) Turn Type NA Perm Prot NA Perm NA Perm Protected Phases Permitted Phases Existing Conditions 7/31/2014 Baseline Synchro 9 Report MEH Page 1
123 Lanes, Volumes, Timings 2: I-75 Ramp P/I-75 Ramp M & Austin Blvd 9/3/2015 Lane Group EBL EBT EBR WBL WBT WBR NBL NBT NBR SBL SBT SBR Detector Phase Switch Phase Minimum Initial (s) Minimum Split (s) Total Split (s) Total Split (%) 27.4% 27.4% 30.1% 57.5% 42.5% 42.5% 42.5% Maximum Green (s) Yellow Time (s) All-Red Time (s) Lost Time Adjust (s) Total Lost Time (s) Lead/Lag Lag Lag Lead Lead-Lag Optimize? Vehicle Extension (s) Recall Mode None None C-Max C-Max None None None Walk Time (s) Flash Dont Walk (s) Pedestrian Calls (#/hr) Act Effct Green (s) Actuated g/c Ratio v/c Ratio Control Delay Queue Delay Total Delay LOS F E F C F F F Approach Delay Approach LOS F F F Intersection Summary Area Type: Other Cycle Length: 120 Actuated Cycle Length: 120 Offset: 2 (2%), Referenced to phase 1:WBL and 6:WBT, Start of Yellow Natural Cycle: 120 Control Type: Actuated-Coordinated Maximum v/c Ratio: 1.43 Intersection Signal Delay: Intersection LOS: F Intersection Capacity Utilization 156.5% ICU Level of Service H Analysis Period (min) 15 Splits and Phases: 2: I-75 Ramp P/I-75 Ramp M & Austin Blvd Existing Conditions 7/31/2014 Baseline Synchro 9 Report MEH Page 2
124 Lanes, Volumes, Timings 3: I-75 Ramp H/I-75 Ramp J & Austin Blvd 9/3/2015 Lane Group EBL EBT EBR WBL WBT WBR NBL NBT NBR SBL SBT SBR Lane Configurations Volume (vph) Ideal Flow (vphpl) Storage Length (ft) Storage Lanes Taper Length (ft) Lane Util. Factor * *1.00 * Frt Flt Protected Satd. Flow (prot) Flt Permitted Satd. Flow (perm) Right Turn on Red No Yes No No Satd. Flow (RTOR) 701 Link Speed (mph) Link Distance (ft) Travel Time (s) Peak Hour Factor Heavy Vehicles (%) 1% 1% 1% 1% 1% 1% 1% 1% 1% 1% 1% 1% Adj. Flow (vph) Shared Lane Traffic (%) 10% 48% Lane Group Flow (vph) Enter Blocked Intersection No No No No No No No No No No No No Lane Alignment Left Left Right Left Left Right Left Left Right Left Left Right Median Width(ft) Link Offset(ft) Crosswalk Width(ft) Two way Left Turn Lane Headway Factor Turning Speed (mph) Number of Detectors Detector Template Left Thru Thru Right Left Thru Right Leading Detector (ft) Trailing Detector (ft) Detector 1 Position(ft) Detector 1 Size(ft) Detector 1 Type Cl+Ex Cl+Ex Cl+Ex Cl+Ex Cl+Ex Cl+Ex Cl+Ex Detector 1 Channel Detector 1 Extend (s) Detector 1 Queue (s) Detector 1 Delay (s) Detector 2 Position(ft) Detector 2 Size(ft) Detector 2 Type Cl+Ex Cl+Ex Cl+Ex Detector 2 Channel Detector 2 Extend (s) Turn Type Prot NA NA Perm Perm NA Perm Protected Phases Permitted Phases Existing Conditions 7/31/2014 Baseline Synchro 9 Report MEH Page 3
125 Lanes, Volumes, Timings 3: I-75 Ramp H/I-75 Ramp J & Austin Blvd 9/3/2015 Lane Group EBL EBT EBR WBL WBT WBR NBL NBT NBR SBL SBT SBR Detector Phase Switch Phase Minimum Initial (s) Minimum Split (s) Total Split (s) Total Split (%) 11.7% 71.7% 60.0% 60.0% 28.3% 28.3% 28.3% Maximum Green (s) Yellow Time (s) All-Red Time (s) Lost Time Adjust (s) Total Lost Time (s) Lead/Lag Lead Lag Lag Lead-Lag Optimize? Vehicle Extension (s) Recall Mode C-Max C-Max None None None None None Walk Time (s) Flash Dont Walk (s) Pedestrian Calls (#/hr) Act Effct Green (s) Actuated g/c Ratio v/c Ratio Control Delay Queue Delay Total Delay LOS F E D B E F F Approach Delay Approach LOS E D F Intersection Summary Area Type: Other Cycle Length: 120 Actuated Cycle Length: 120 Offset: 24 (20%), Referenced to phase 2:EBT and 5:EBL, Start of Yellow Natural Cycle: 110 Control Type: Actuated-Coordinated Maximum v/c Ratio: 1.09 Intersection Signal Delay: 54.3 Intersection LOS: D Intersection Capacity Utilization 156.5% ICU Level of Service H Analysis Period (min) 15 * User Entered Value Splits and Phases: 3: I-75 Ramp H/I-75 Ramp J & Austin Blvd Existing Conditions 7/31/2014 Baseline Synchro 9 Report MEH Page 4
126 Lanes, Volumes, Timings 4: Access Pt. A & Austin Blvd 9/3/2015 Lane Group EBL EBT EBR WBL WBT WBR NBL NBT NBR SBL SBT SBR Lane Configurations Volume (vph) Ideal Flow (vphpl) Storage Length (ft) Storage Lanes Taper Length (ft) Lane Util. Factor Ped Bike Factor Frt Flt Protected Satd. Flow (prot) Flt Permitted Satd. Flow (perm) Right Turn on Red No No No No Satd. Flow (RTOR) Link Speed (mph) Link Distance (ft) Travel Time (s) Confl. Peds. (#/hr) 5 5 Peak Hour Factor Heavy Vehicles (%) 1% 1% 1% 1% 1% 1% 1% 1% 1% 1% 1% 1% Adj. Flow (vph) Shared Lane Traffic (%) Lane Group Flow (vph) Enter Blocked Intersection No No No No No No No No No No No No Lane Alignment Left Left Right Left Left Right Left Left Right Left Left Right Median Width(ft) Link Offset(ft) Crosswalk Width(ft) Two way Left Turn Lane Headway Factor Turning Speed (mph) Number of Detectors Detector Template Left Thru Right Thru Right Left Thru Left Thru Right Leading Detector (ft) Trailing Detector (ft) Detector 1 Position(ft) Detector 1 Size(ft) Detector 1 Type Cl+Ex Cl+Ex Cl+Ex Cl+Ex Cl+Ex Cl+Ex Cl+Ex Cl+Ex Cl+Ex Cl+Ex Detector 1 Channel Detector 1 Extend (s) Detector 1 Queue (s) Detector 1 Delay (s) Detector 2 Position(ft) Detector 2 Size(ft) Detector 2 Type Cl+Ex Cl+Ex Cl+Ex Cl+Ex Detector 2 Channel Detector 2 Extend (s) Turn Type Prot NA pt+ov NA pt+ov Prot NA pm+pt NA pt+ov Existing Conditions 7/31/2014 Baseline Synchro 9 Report MEH Page 5
127 Lanes, Volumes, Timings 4: Access Pt. A & Austin Blvd 9/3/2015 Lane Group EBL EBT EBR WBL WBT WBR NBL NBT NBR SBL SBT SBR Protected Phases Permitted Phases 4 Detector Phase Switch Phase Minimum Initial (s) Minimum Split (s) Total Split (s) Total Split (%) 14.2% 60.8% 46.7% 20.8% 27.5% 11.7% 18.3% Maximum Green (s) Yellow Time (s) All-Red Time (s) Lost Time Adjust (s) Total Lost Time (s) Lead/Lag Lead Lag Lead Lag Lead Lag Lead-Lag Optimize? Vehicle Extension (s) Recall Mode None C-Max C-Max None None None None Act Effct Green (s) Actuated g/c Ratio v/c Ratio Control Delay Queue Delay Total Delay LOS F F A F B F F D D E Approach Delay Approach LOS F F F D Intersection Summary Area Type: Other Cycle Length: 120 Actuated Cycle Length: 120 Offset: 84 (70%), Referenced to phase 2:EBT and 6:WBT, Start of Yellow Natural Cycle: 120 Control Type: Actuated-Coordinated Maximum v/c Ratio: 1.21 Intersection Signal Delay: 90.6 Intersection LOS: F Intersection Capacity Utilization 101.6% ICU Level of Service G Analysis Period (min) 15 Splits and Phases: 4: Access Pt. A & Austin Blvd Existing Conditions 7/31/2014 Baseline Synchro 9 Report MEH Page 6
128 Lanes, Volumes, Timings 13: Austin Blvd & S.R /3/2015 Lane Group EBL EBT WBT WBR SWL SWR ø1 ø2 ø3 ø4 ø5 ø6 Lane Configurations Volume (vph) Ideal Flow (vphpl) Storage Length (ft) Storage Lanes Taper Length (ft) Lane Util. Factor Frt Flt Protected Satd. Flow (prot) Flt Permitted Satd. Flow (perm) Right Turn on Red No No Satd. Flow (RTOR) Link Speed (mph) Link Distance (ft) Travel Time (s) Peak Hour Factor Heavy Vehicles (%) 1% 1% 1% 1% 1% 1% Adj. Flow (vph) Shared Lane Traffic (%) Lane Group Flow (vph) Enter Blocked Intersection No No No No No No Lane Alignment Left Left Left Right Left Right Median Width(ft) Link Offset(ft) Crosswalk Width(ft) Two way Left Turn Lane Headway Factor Turning Speed (mph) Number of Detectors Detector Template Left Thru Thru Right Leading Detector (ft) Trailing Detector (ft) Detector 1 Position(ft) Detector 1 Size(ft) Detector 1 Type Cl+Ex Cl+Ex Cl+Ex Cl+Ex Detector 1 Channel Detector 1 Extend (s) Detector 1 Queue (s) Detector 1 Delay (s) Detector 2 Position(ft) Detector 2 Size(ft) 6 6 Detector 2 Type Cl+Ex Cl+Ex Detector 2 Channel Detector 2 Extend (s) Turn Type Prot NA NA custom Protected Phases Free Permitted Phases Existing Conditions 7/31/2014 Baseline Synchro 9 Report MEH Page 7
129 Lanes, Volumes, Timings 13: Austin Blvd & S.R /3/2015 Lane Group ø7 ø8 ø9 ø11 ø12 ø13 ø14 ø15 ø16 Lane Configurations Volume (vph) Ideal Flow (vphpl) Storage Length (ft) Storage Lanes Taper Length (ft) Lane Util. Factor Frt Flt Protected Satd. Flow (prot) Flt Permitted Satd. Flow (perm) Right Turn on Red Satd. Flow (RTOR) Link Speed (mph) Link Distance (ft) Travel Time (s) Peak Hour Factor Heavy Vehicles (%) Adj. Flow (vph) Shared Lane Traffic (%) Lane Group Flow (vph) Enter Blocked Intersection Lane Alignment Median Width(ft) Link Offset(ft) Crosswalk Width(ft) Two way Left Turn Lane Headway Factor Turning Speed (mph) Number of Detectors Detector Template Leading Detector (ft) Trailing Detector (ft) Detector 1 Position(ft) Detector 1 Size(ft) Detector 1 Type Detector 1 Channel Detector 1 Extend (s) Detector 1 Queue (s) Detector 1 Delay (s) Detector 2 Position(ft) Detector 2 Size(ft) Detector 2 Type Detector 2 Channel Detector 2 Extend (s) Turn Type Protected Phases Permitted Phases Existing Conditions 7/31/2014 Baseline Synchro 9 Report MEH Page 8
130 Lanes, Volumes, Timings 13: Austin Blvd & S.R /3/2015 Lane Group EBL EBT WBT WBR SWL SWR ø1 ø2 ø3 ø4 ø5 ø6 Detector Phase Switch Phase Minimum Initial (s) Minimum Split (s) Total Split (s) Total Split (%) 38% 17% 7% 30% 23% 27% Maximum Green (s) Yellow Time (s) All-Red Time (s) Lost Time Adjust (s) Total Lost Time (s) Lead/Lag Lead Lag Lead Lag Lead-Lag Optimize? Vehicle Extension (s) Recall Mode None Max Max C-Max None Max Act Effct Green (s) Actuated g/c Ratio v/c Ratio Control Delay Queue Delay Total Delay LOS E A D E Approach Delay Approach LOS B D Intersection Summary Area Type: Other Cycle Length: 155 Actuated Cycle Length: 155 Offset: 0 (0%), Referenced to phase 4:WBEB, Start of Yellow, Master Intersection Natural Cycle: 120 Control Type: Actuated-Coordinated Maximum v/c Ratio: 1.51 Intersection Signal Delay: 33.6 Intersection LOS: C Intersection Capacity Utilization 69.7% ICU Level of Service C Analysis Period (min) 15 Splits and Phases: 13: Austin Blvd & S.R. 741 Existing Conditions 7/31/2014 Baseline Synchro 9 Report MEH Page 9
131 Lanes, Volumes, Timings 13: Austin Blvd & S.R /3/2015 Lane Group ø7 ø8 ø9 ø11 ø12 ø13 ø14 ø15 ø16 Detector Phase Switch Phase Minimum Initial (s) Minimum Split (s) Total Split (s) Total Split (%) 12% 23% 6% 62% 17% 12% 15% 15% 8% Maximum Green (s) Yellow Time (s) All-Red Time (s) Lost Time Adjust (s) Total Lost Time (s) Lead/Lag Lead Lag Lead Lag Lead Lag Lead-Lag Optimize? Yes Yes Yes Yes Vehicle Extension (s) Recall Mode Max Min None Min Min None Max Min Max Act Effct Green (s) Actuated g/c Ratio v/c Ratio Control Delay Queue Delay Total Delay LOS Approach Delay Approach LOS Intersection Summary Existing Conditions 7/31/2014 Baseline Synchro 9 Report MEH Page 10
132 Lanes, Volumes, Timings 17: SR 741 & Austin Blvd 9/3/2015 Lane Group EBT EBR2 WBT WBR2 NBL2 NBT NBR2 SBL2 SBT SBR2 SEL2 NWL2 Lane Configurations Volume (vph) Ideal Flow (vphpl) Storage Length (ft) Storage Lanes Taper Length (ft) Lane Util. Factor Frt Flt Protected Satd. Flow (prot) Flt Permitted Satd. Flow (perm) Right Turn on Red Yes Yes No No Satd. Flow (RTOR) Link Speed (mph) Link Distance (ft) Travel Time (s) Peak Hour Factor Heavy Vehicles (%) 1% 1% 1% 1% 1% 1% 1% 1% 1% 1% 1% 1% Adj. Flow (vph) Shared Lane Traffic (%) Lane Group Flow (vph) Enter Blocked Intersection No No No No No No No No No No No No Lane Alignment Left Right Left Right Left Left Right Left Left Right Left Left Median Width(ft) Link Offset(ft) Crosswalk Width(ft) Two way Left Turn Lane Headway Factor Turning Speed (mph) Number of Detectors Detector Template Thru Right Thru Right Left Thru Right Left Thru Right Left Left Leading Detector (ft) Trailing Detector (ft) Detector 1 Position(ft) Detector 1 Size(ft) Detector 1 Type Cl+Ex Cl+Ex Cl+Ex Cl+Ex Cl+Ex Cl+Ex Cl+Ex Cl+Ex Cl+Ex Cl+Ex Cl+Ex Cl+Ex Detector 1 Channel Detector 1 Extend (s) Detector 1 Queue (s) Detector 1 Delay (s) Detector 2 Position(ft) Detector 2 Size(ft) Detector 2 Type Cl+Ex Cl+Ex Cl+Ex Cl+Ex Detector 2 Channel Detector 2 Extend (s) Turn Type NA custom NA custom Prot NA custom Prot NA custom Prot Prot Protected Phases Permitted Phases Existing Conditions 7/31/2014 Baseline Synchro 9 Report MEH Page 11
133 Lanes, Volumes, Timings 17: SR 741 & Austin Blvd 9/3/2015 Lane Group ø2 ø3 ø6 ø7 ø9 ø11 ø13 ø14 ø15 ø16 Lane Configurations Volume (vph) Ideal Flow (vphpl) Storage Length (ft) Storage Lanes Taper Length (ft) Lane Util. Factor Frt Flt Protected Satd. Flow (prot) Flt Permitted Satd. Flow (perm) Right Turn on Red Satd. Flow (RTOR) Link Speed (mph) Link Distance (ft) Travel Time (s) Peak Hour Factor Heavy Vehicles (%) Adj. Flow (vph) Shared Lane Traffic (%) Lane Group Flow (vph) Enter Blocked Intersection Lane Alignment Median Width(ft) Link Offset(ft) Crosswalk Width(ft) Two way Left Turn Lane Headway Factor Turning Speed (mph) Number of Detectors Detector Template Leading Detector (ft) Trailing Detector (ft) Detector 1 Position(ft) Detector 1 Size(ft) Detector 1 Type Detector 1 Channel Detector 1 Extend (s) Detector 1 Queue (s) Detector 1 Delay (s) Detector 2 Position(ft) Detector 2 Size(ft) Detector 2 Type Detector 2 Channel Detector 2 Extend (s) Turn Type Protected Phases Permitted Phases Existing Conditions 7/31/2014 Baseline Synchro 9 Report MEH Page 12
134 Lanes, Volumes, Timings 17: SR 741 & Austin Blvd 9/3/2015 Lane Group EBT EBR2 WBT WBR2 NBL2 NBT NBR2 SBL2 SBT SBR2 SEL2 NWL2 Detector Phase Switch Phase Minimum Initial (s) Minimum Split (s) Total Split (s) Total Split (%) 29.7% 29.7% 38.1% 23.2% 23.2% 17.4% Maximum Green (s) Yellow Time (s) All-Red Time (s) Lost Time Adjust (s) Total Lost Time (s) Lead/Lag Lead Lead Lead Lead Lead-Lag Optimize? Yes Vehicle Extension (s) Recall Mode C-Max C-Max None None Min Min Act Effct Green (s) Actuated g/c Ratio v/c Ratio Control Delay Queue Delay Total Delay LOS F F E A F D A F F A B B Approach Delay Approach LOS F D F F Intersection Summary Area Type: Other Cycle Length: 155 Actuated Cycle Length: 155 Offset: 0 (0%), Referenced to phase 4:WBEB, Start of Yellow, Master Intersection Natural Cycle: 120 Control Type: Actuated-Coordinated Maximum v/c Ratio: 1.51 Intersection Signal Delay: Intersection LOS: F Intersection Capacity Utilization 136.4% ICU Level of Service H Analysis Period (min) 15 Splits and Phases: 17: SR 741 & Austin Blvd Existing Conditions 7/31/2014 Baseline Synchro 9 Report MEH Page 13
135 Lanes, Volumes, Timings 17: SR 741 & Austin Blvd 9/3/2015 Lane Group ø2 ø3 ø6 ø7 ø9 ø11 ø13 ø14 ø15 ø16 Detector Phase Switch Phase Minimum Initial (s) Minimum Split (s) Total Split (s) Total Split (%) 17% 7% 27% 12% 6% 62% 12% 15% 15% 8% Maximum Green (s) Yellow Time (s) All-Red Time (s) Lost Time Adjust (s) Total Lost Time (s) Lead/Lag Lag Lag Lag Lag Lead Lag Lead-Lag Optimize? Yes Yes Yes Vehicle Extension (s) Recall Mode Max Max Max Max None Min None Max Min Max Act Effct Green (s) Actuated g/c Ratio v/c Ratio Control Delay Queue Delay Total Delay LOS Approach Delay Approach LOS Intersection Summary Existing Conditions 7/31/2014 Baseline Synchro 9 Report MEH Page 14
136 Lanes, Volumes, Timings 19: S.R. 741 & Austin Blvd 9/3/2015 Lane Group EBT EBR WBL WBT NEL NER ø1 ø2 ø3 ø4 ø5 ø6 Lane Configurations Volume (vph) Ideal Flow (vphpl) Storage Length (ft) Storage Lanes Taper Length (ft) Lane Util. Factor Frt Flt Protected Satd. Flow (prot) Flt Permitted Satd. Flow (perm) Right Turn on Red No No Satd. Flow (RTOR) Link Speed (mph) Link Distance (ft) Travel Time (s) Peak Hour Factor Heavy Vehicles (%) 1% 1% 1% 1% 1% 1% Adj. Flow (vph) Shared Lane Traffic (%) Lane Group Flow (vph) Enter Blocked Intersection No No No No No No Lane Alignment Left Right Left Left Left Right Median Width(ft) Link Offset(ft) Crosswalk Width(ft) Two way Left Turn Lane Headway Factor Turning Speed (mph) Number of Detectors Detector Template Thru Left Thru Right Leading Detector (ft) Trailing Detector (ft) Detector 1 Position(ft) Detector 1 Size(ft) Detector 1 Type Cl+Ex Cl+Ex Cl+Ex Cl+Ex Detector 1 Channel Detector 1 Extend (s) Detector 1 Queue (s) Detector 1 Delay (s) Detector 2 Position(ft) Detector 2 Size(ft) 6 6 Detector 2 Type Cl+Ex Cl+Ex Detector 2 Channel Detector 2 Extend (s) Turn Type NA Prot NA custom Protected Phases Free Permitted Phases Existing Conditions 7/31/2014 Baseline Synchro 9 Report MEH Page 15
137 Lanes, Volumes, Timings 19: S.R. 741 & Austin Blvd 9/3/2015 Lane Group ø7 ø8 ø9 ø11 ø12 ø13 ø14 ø15 ø16 Lane Configurations Volume (vph) Ideal Flow (vphpl) Storage Length (ft) Storage Lanes Taper Length (ft) Lane Util. Factor Frt Flt Protected Satd. Flow (prot) Flt Permitted Satd. Flow (perm) Right Turn on Red Satd. Flow (RTOR) Link Speed (mph) Link Distance (ft) Travel Time (s) Peak Hour Factor Heavy Vehicles (%) Adj. Flow (vph) Shared Lane Traffic (%) Lane Group Flow (vph) Enter Blocked Intersection Lane Alignment Median Width(ft) Link Offset(ft) Crosswalk Width(ft) Two way Left Turn Lane Headway Factor Turning Speed (mph) Number of Detectors Detector Template Leading Detector (ft) Trailing Detector (ft) Detector 1 Position(ft) Detector 1 Size(ft) Detector 1 Type Detector 1 Channel Detector 1 Extend (s) Detector 1 Queue (s) Detector 1 Delay (s) Detector 2 Position(ft) Detector 2 Size(ft) Detector 2 Type Detector 2 Channel Detector 2 Extend (s) Turn Type Protected Phases Permitted Phases Existing Conditions 7/31/2014 Baseline Synchro 9 Report MEH Page 16
 12.0 14.0 11.0 24.0 12.0 14.9 Total Split (s) 59.0 26.0 11.0 46.0 36.0 42.0 Total Split (%) 38% 17% 7% 30% 23% 27% Maximum Green (s) 52.0 17.0 5.0 40.2 29.0 32.")
138 Lanes, Volumes, Timings 19: S.R. 741 & Austin Blvd 9/3/2015 Lane Group EBT EBR WBL WBT NEL NER ø1 ø2 ø3 ø4 ø5 ø6 Detector Phase Switch Phase Minimum Initial (s) Minimum Split (s) Total Split (s) Total Split (%) 38% 17% 7% 30% 23% 27% Maximum Green (s) Yellow Time (s) All-Red Time (s) Lost Time Adjust (s) Total Lost Time (s) Lead/Lag Lead Lag Lead Lag Lead-Lag Optimize? Vehicle Extension (s) Recall Mode None Max Max C-Max None Max Act Effct Green (s) Actuated g/c Ratio v/c Ratio Control Delay Queue Delay Total Delay LOS E E A E Approach Delay Approach LOS E B Intersection Summary Area Type: Other Cycle Length: 155 Actuated Cycle Length: 155 Offset: 0 (0%), Referenced to phase 4:WBEB, Start of Yellow, Master Intersection Natural Cycle: 120 Control Type: Actuated-Coordinated Maximum v/c Ratio: 1.51 Intersection Signal Delay: 48.4 Intersection LOS: D Intersection Capacity Utilization 64.7% ICU Level of Service C Analysis Period (min) 15 Splits and Phases: 19: S.R. 741 & Austin Blvd Existing Conditions 7/31/2014 Baseline Synchro 9 Report MEH Page 17
139 Lanes, Volumes, Timings 19: S.R. 741 & Austin Blvd 9/3/2015 Lane Group ø7 ø8 ø9 ø11 ø12 ø13 ø14 ø15 ø16 Detector Phase Switch Phase Minimum Initial (s) Minimum Split (s) Total Split (s) Total Split (%) 12% 23% 6% 62% 17% 12% 15% 15% 8% Maximum Green (s) Yellow Time (s) All-Red Time (s) Lost Time Adjust (s) Total Lost Time (s) Lead/Lag Lead Lag Lead Lag Lead Lag Lead-Lag Optimize? Yes Yes Yes Yes Vehicle Extension (s) Recall Mode Max Min None Min Min None Max Min Max Act Effct Green (s) Actuated g/c Ratio v/c Ratio Control Delay Queue Delay Total Delay LOS Approach Delay Approach LOS Intersection Summary Existing Conditions 7/31/2014 Baseline Synchro 9 Report MEH Page 18
140 Lanes, Volumes, Timings 2: I-75 Ramp P/I-75 Ramp M & Austin Blvd 9/3/2015 Lane Group EBL EBT EBR WBL WBT WBR NBL NBT NBR SBL SBT SBR Lane Configurations Volume (vph) Ideal Flow (vphpl) Storage Length (ft) Storage Lanes Taper Length (ft) Lane Util. Factor Frt Flt Protected Satd. Flow (prot) Flt Permitted Satd. Flow (perm) Right Turn on Red No No No No Satd. Flow (RTOR) Link Speed (mph) Link Distance (ft) Travel Time (s) Peak Hour Factor Heavy Vehicles (%) 1% 1% 1% 1% 1% 1% 1% 1% 1% 1% 1% 1% Adj. Flow (vph) Shared Lane Traffic (%) 48% 10% Lane Group Flow (vph) Enter Blocked Intersection No No No No No No No No No No No No Lane Alignment Left Left Right Left Left Right Left Left Right Left Left Right Median Width(ft) Link Offset(ft) Crosswalk Width(ft) Two way Left Turn Lane Headway Factor Turning Speed (mph) Number of Detectors Detector Template Thru Right Left Thru Left Thru Right Leading Detector (ft) Trailing Detector (ft) Detector 1 Position(ft) Detector 1 Size(ft) Detector 1 Type Cl+Ex Cl+Ex Cl+Ex Cl+Ex Cl+Ex Cl+Ex Cl+Ex Detector 1 Channel Detector 1 Extend (s) Detector 1 Queue (s) Detector 1 Delay (s) Detector 2 Position(ft) Detector 2 Size(ft) Detector 2 Type Cl+Ex Cl+Ex Cl+Ex Detector 2 Channel Detector 2 Extend (s) Turn Type NA Perm Prot NA Perm NA Perm Protected Phases Permitted Phases Build3 7/31/2014 Baseline Synchro 8 Report NRW Page 1
141 Lanes, Volumes, Timings 2: I-75 Ramp P/I-75 Ramp M & Austin Blvd 9/3/2015 Lane Group EBL EBT EBR WBL WBT WBR NBL NBT NBR SBL SBT SBR Detector Phase Switch Phase Minimum Initial (s) Minimum Split (s) Total Split (s) Total Split (%) 27.4% 27.4% 30.1% 57.5% 42.5% 42.5% 42.5% Maximum Green (s) Yellow Time (s) All-Red Time (s) Lost Time Adjust (s) Total Lost Time (s) Lead/Lag Lag Lag Lead Lead-Lag Optimize? Vehicle Extension (s) Recall Mode None None C-Max C-Max None None None Walk Time (s) Flash Dont Walk (s) Pedestrian Calls (#/hr) Act Effct Green (s) Actuated g/c Ratio v/c Ratio Control Delay Queue Delay Total Delay LOS F E F C F F F Approach Delay Approach LOS F F F Intersection Summary Area Type: Other Cycle Length: 120 Actuated Cycle Length: 120 Offset: 2 (2%), Referenced to phase 1:WBL and 6:WBT, Start of Yellow Natural Cycle: 120 Control Type: Actuated-Coordinated Maximum v/c Ratio: 1.43 Intersection Signal Delay: Intersection LOS: F Intersection Capacity Utilization 152.7% ICU Level of Service H Analysis Period (min) 15 Splits and Phases: 2: I-75 Ramp P/I-75 Ramp M & Austin Blvd Build3 7/31/2014 Baseline Synchro 8 Report NRW Page 2
142 Lanes, Volumes, Timings 3: I-75 Ramp H/I-75 Ramp J & Austin Blvd 9/3/2015 Lane Group EBL EBT EBR WBL WBT WBR NBL NBT NBR SBL SBT SBR Lane Configurations Volume (vph) Ideal Flow (vphpl) Storage Length (ft) Storage Lanes Taper Length (ft) Lane Util. Factor * *1.00 * Frt Flt Protected Satd. Flow (prot) Flt Permitted Satd. Flow (perm) Right Turn on Red No Yes No No Satd. Flow (RTOR) 701 Link Speed (mph) Link Distance (ft) Travel Time (s) Peak Hour Factor Heavy Vehicles (%) 1% 1% 1% 1% 1% 1% 1% 1% 1% 1% 1% 1% Adj. Flow (vph) Shared Lane Traffic (%) 10% 48% Lane Group Flow (vph) Enter Blocked Intersection No No No No No No No No No No No No Lane Alignment Left Left Right Left Left Right Left Left Right Left Left Right Median Width(ft) Link Offset(ft) Crosswalk Width(ft) Two way Left Turn Lane Headway Factor Turning Speed (mph) Number of Detectors Detector Template Left Thru Thru Right Left Thru Right Leading Detector (ft) Trailing Detector (ft) Detector 1 Position(ft) Detector 1 Size(ft) Detector 1 Type Cl+Ex Cl+Ex Cl+Ex Cl+Ex Cl+Ex Cl+Ex Cl+Ex Detector 1 Channel Detector 1 Extend (s) Detector 1 Queue (s) Detector 1 Delay (s) Detector 2 Position(ft) Detector 2 Size(ft) Detector 2 Type Cl+Ex Cl+Ex Cl+Ex Detector 2 Channel Detector 2 Extend (s) Turn Type Prot NA NA Perm Perm NA Perm Protected Phases Permitted Phases Build3 7/31/2014 Baseline Synchro 8 Report NRW Page 3
143 Lanes, Volumes, Timings 3: I-75 Ramp H/I-75 Ramp J & Austin Blvd 9/3/2015 Lane Group EBL EBT EBR WBL WBT WBR NBL NBT NBR SBL SBT SBR Detector Phase Switch Phase Minimum Initial (s) Minimum Split (s) Total Split (s) Total Split (%) 11.7% 71.7% 60.0% 60.0% 28.3% 28.3% 28.3% Maximum Green (s) Yellow Time (s) All-Red Time (s) Lost Time Adjust (s) Total Lost Time (s) Lead/Lag Lead Lag Lag Lead-Lag Optimize? Vehicle Extension (s) Recall Mode C-Max C-Max None None None None None Walk Time (s) Flash Dont Walk (s) Pedestrian Calls (#/hr) Act Effct Green (s) Actuated g/c Ratio v/c Ratio Control Delay Queue Delay Total Delay LOS F E D A E F F Approach Delay Approach LOS E C F Intersection Summary Area Type: Other Cycle Length: 120 Actuated Cycle Length: 120 Offset: 24 (20%), Referenced to phase 2:EBT and 5:EBL, Start of Yellow Natural Cycle: 110 Control Type: Actuated-Coordinated Maximum v/c Ratio: 1.09 Intersection Signal Delay: 52.5 Intersection LOS: D Intersection Capacity Utilization 152.7% ICU Level of Service H Analysis Period (min) 15 * User Entered Value Splits and Phases: 3: I-75 Ramp H/I-75 Ramp J & Austin Blvd Build3 7/31/2014 Baseline Synchro 8 Report NRW Page 4
144 Lanes, Volumes, Timings 4: Access Pt. A & Austin Blvd 9/3/2015 Lane Group EBL EBT EBR WBL WBT WBR NBL NBT NBR SBL SBT SBR Lane Configurations Volume (vph) Ideal Flow (vphpl) Storage Length (ft) Storage Lanes Taper Length (ft) Lane Util. Factor Ped Bike Factor Frt Flt Protected Satd. Flow (prot) Flt Permitted Satd. Flow (perm) Right Turn on Red No No No No Satd. Flow (RTOR) Link Speed (mph) Link Distance (ft) Travel Time (s) Confl. Peds. (#/hr) 5 5 Peak Hour Factor Heavy Vehicles (%) 1% 1% 1% 1% 1% 1% 1% 1% 1% 1% 1% 1% Adj. Flow (vph) Shared Lane Traffic (%) Lane Group Flow (vph) Enter Blocked Intersection No No No No No No No No No No No No Lane Alignment Left Left Right Left Left Right Left Left Right Left Left Right Median Width(ft) Link Offset(ft) Crosswalk Width(ft) Two way Left Turn Lane Headway Factor Turning Speed (mph) Number of Detectors Detector Template Left Thru Right Thru Left Thru Left Thru Right Leading Detector (ft) Trailing Detector (ft) Detector 1 Position(ft) Detector 1 Size(ft) Detector 1 Type Cl+Ex Cl+Ex Cl+Ex Cl+Ex Cl+Ex Cl+Ex Cl+Ex Cl+Ex Cl+Ex Detector 1 Channel Detector 1 Extend (s) Detector 1 Queue (s) Detector 1 Delay (s) Detector 2 Position(ft) Detector 2 Size(ft) Detector 2 Type Cl+Ex Cl+Ex Cl+Ex Cl+Ex Detector 2 Channel Detector 2 Extend (s) Turn Type Prot NA pt+ov NA Prot NA pm+pt NA pt+ov Build3 7/31/2014 Baseline Synchro 8 Report NRW Page 5
145 Lanes, Volumes, Timings 4: Access Pt. A & Austin Blvd 9/3/2015 Lane Group EBL EBT EBR WBL WBT WBR NBL NBT NBR SBL SBT SBR Protected Phases Permitted Phases 4 Detector Phase Switch Phase Minimum Initial (s) Minimum Split (s) Total Split (s) Total Split (%) 15.8% 60.8% 45.0% 20.8% 27.5% 11.7% 18.3% Maximum Green (s) Yellow Time (s) All-Red Time (s) Lost Time Adjust (s) Total Lost Time (s) Lead/Lag Lead Lag Lead Lag Lead Lag Lead-Lag Optimize? Vehicle Extension (s) Recall Mode None C-Max C-Max None None None None Act Effct Green (s) Actuated g/c Ratio v/c Ratio Control Delay Queue Delay Total Delay LOS E F A D F F D D D Approach Delay Approach LOS F D F D Intersection Summary Area Type: Other Cycle Length: 120 Actuated Cycle Length: 120 Offset: 87 (73%), Referenced to phase 2:EBT and 6:WBT, Start of Yellow Natural Cycle: 120 Control Type: Actuated-Coordinated Maximum v/c Ratio: 1.21 Intersection Signal Delay: 72.4 Intersection LOS: E Intersection Capacity Utilization 101.6% ICU Level of Service G Analysis Period (min) 15 Splits and Phases: 4: Access Pt. A & Austin Blvd Build3 7/31/2014 Baseline Synchro 8 Report NRW Page 6
146 Lanes, Volumes, Timings 13: Austin Blvd & S.R /3/2015 Lane Group EBL EBT WBT WBR SWL SWR ø1 ø2 ø3 ø4 ø5 ø6 Lane Configurations Volume (vph) Ideal Flow (vphpl) Storage Length (ft) Storage Lanes Taper Length (ft) Lane Util. Factor Frt Flt Protected Satd. Flow (prot) Flt Permitted Satd. Flow (perm) Right Turn on Red No No Satd. Flow (RTOR) Link Speed (mph) Link Distance (ft) Travel Time (s) Peak Hour Factor Heavy Vehicles (%) 1% 1% 1% 1% 1% 1% Adj. Flow (vph) Shared Lane Traffic (%) Lane Group Flow (vph) Enter Blocked Intersection No No No No No No Lane Alignment Left Left Left Right Left Right Median Width(ft) Link Offset(ft) Crosswalk Width(ft) Two way Left Turn Lane Headway Factor Turning Speed (mph) Number of Detectors Detector Template Left Thru Thru Right Leading Detector (ft) Trailing Detector (ft) Detector 1 Position(ft) Detector 1 Size(ft) Detector 1 Type Cl+Ex Cl+Ex Cl+Ex Cl+Ex Detector 1 Channel Detector 1 Extend (s) Detector 1 Queue (s) Detector 1 Delay (s) Detector 2 Position(ft) Detector 2 Size(ft) 6 6 Detector 2 Type Cl+Ex Cl+Ex Detector 2 Channel Detector 2 Extend (s) Turn Type Prot NA NA custom Protected Phases Free Permitted Phases Build3 7/31/2014 Baseline Synchro 8 Report NRW Page 7
147 Lanes, Volumes, Timings 13: Austin Blvd & S.R /3/2015 Lane Group ø7 ø8 ø9 ø11 ø12 ø13 ø14 ø15 ø16 Lane Configurations Volume (vph) Ideal Flow (vphpl) Storage Length (ft) Storage Lanes Taper Length (ft) Lane Util. Factor Frt Flt Protected Satd. Flow (prot) Flt Permitted Satd. Flow (perm) Right Turn on Red Satd. Flow (RTOR) Link Speed (mph) Link Distance (ft) Travel Time (s) Peak Hour Factor Heavy Vehicles (%) Adj. Flow (vph) Shared Lane Traffic (%) Lane Group Flow (vph) Enter Blocked Intersection Lane Alignment Median Width(ft) Link Offset(ft) Crosswalk Width(ft) Two way Left Turn Lane Headway Factor Turning Speed (mph) Number of Detectors Detector Template Leading Detector (ft) Trailing Detector (ft) Detector 1 Position(ft) Detector 1 Size(ft) Detector 1 Type Detector 1 Channel Detector 1 Extend (s) Detector 1 Queue (s) Detector 1 Delay (s) Detector 2 Position(ft) Detector 2 Size(ft) Detector 2 Type Detector 2 Channel Detector 2 Extend (s) Turn Type Protected Phases Permitted Phases Build3 7/31/2014 Baseline Synchro 8 Report NRW Page 8
148 Lanes, Volumes, Timings 13: Austin Blvd & S.R /3/2015 Lane Group EBL EBT WBT WBR SWL SWR ø1 ø2 ø3 ø4 ø5 ø6 Detector Phase Switch Phase Minimum Initial (s) Minimum Split (s) Total Split (s) Total Split (%) 35% 17% 7% 32% 23% 25% Maximum Green (s) Yellow Time (s) All-Red Time (s) Lost Time Adjust (s) Total Lost Time (s) Lead/Lag Lead Lag Lead Lag Lead-Lag Optimize? Vehicle Extension (s) Recall Mode None Max Max C-Max None Max Act Effct Green (s) Actuated g/c Ratio v/c Ratio Control Delay Queue Delay Total Delay LOS E A A E Approach Delay Approach LOS A A Intersection Summary Area Type: Other Cycle Length: 155 Actuated Cycle Length: 155 Offset: 0 (0%), Referenced to phase 4:WBEB, Start of Yellow, Master Intersection Natural Cycle: 120 Control Type: Actuated-Coordinated Maximum v/c Ratio: 1.47 Intersection Signal Delay: 17.9 Intersection LOS: B Intersection Capacity Utilization 69.7% ICU Level of Service C Analysis Period (min) 15 Splits and Phases: 13: Austin Blvd & S.R. 741 Build3 7/31/2014 Baseline Synchro 8 Report NRW Page 9
149 Lanes, Volumes, Timings 13: Austin Blvd & S.R /3/2015 Lane Group ø7 ø8 ø9 ø11 ø12 ø13 ø14 ø15 ø16 Detector Phase Switch Phase Minimum Initial (s) Minimum Split (s) Total Split (s) Total Split (%) 12% 25% 6% 60% 18% 14% 15% 17% 8% Maximum Green (s) Yellow Time (s) All-Red Time (s) Lost Time Adjust (s) Total Lost Time (s) Lead/Lag Lead Lag Lead Lag Lead Lag Lead-Lag Optimize? Yes Yes Yes Yes Vehicle Extension (s) Recall Mode Max Min None Min Min None Max Min Max Act Effct Green (s) Actuated g/c Ratio v/c Ratio Control Delay Queue Delay Total Delay LOS Approach Delay Approach LOS Intersection Summary Build3 7/31/2014 Baseline Synchro 8 Report NRW Page 10
150 Lanes, Volumes, Timings 17: SR 741 & Austin Blvd 9/3/2015 Lane Group EBT EBR2 WBT WBR2 NBL2 NBT NBR2 SBL2 SBT SBR2 SEL2 NWL2 Lane Configurations Volume (vph) Ideal Flow (vphpl) Storage Length (ft) Storage Lanes Taper Length (ft) Lane Util. Factor Frt Flt Protected Satd. Flow (prot) Flt Permitted Satd. Flow (perm) Right Turn on Red Yes Yes No No Satd. Flow (RTOR) Link Speed (mph) Link Distance (ft) Travel Time (s) Peak Hour Factor Heavy Vehicles (%) 1% 1% 1% 1% 1% 1% 1% 1% 1% 1% 1% 1% Adj. Flow (vph) Shared Lane Traffic (%) Lane Group Flow (vph) Enter Blocked Intersection No No No No No No No No No No No No Lane Alignment Left Right Left Right Left Left Right Left Left Right Left Left Median Width(ft) Link Offset(ft) Crosswalk Width(ft) Two way Left Turn Lane Headway Factor Turning Speed (mph) Number of Detectors Detector Template Thru Right Thru Right Left Thru Right Left Thru Right Left Left Leading Detector (ft) Trailing Detector (ft) Detector 1 Position(ft) Detector 1 Size(ft) Detector 1 Type Cl+Ex Cl+Ex Cl+Ex Cl+Ex Cl+Ex Cl+Ex Cl+Ex Cl+Ex Cl+Ex Cl+Ex Cl+Ex Cl+Ex Detector 1 Channel Detector 1 Extend (s) Detector 1 Queue (s) Detector 1 Delay (s) Detector 2 Position(ft) Detector 2 Size(ft) Detector 2 Type Cl+Ex Cl+Ex Cl+Ex Cl+Ex Detector 2 Channel Detector 2 Extend (s) Turn Type NA custom NA custom Prot NA custom Prot NA custom Prot Prot Protected Phases Permitted Phases Build3 7/31/2014 Baseline Synchro 8 Report NRW Page 11
151 Lanes, Volumes, Timings 17: SR 741 & Austin Blvd 9/3/2015 Lane Group ø2 ø3 ø6 ø7 ø9 ø11 ø13 ø14 ø15 ø16 Lane Configurations Volume (vph) Ideal Flow (vphpl) Storage Length (ft) Storage Lanes Taper Length (ft) Lane Util. Factor Frt Flt Protected Satd. Flow (prot) Flt Permitted Satd. Flow (perm) Right Turn on Red Satd. Flow (RTOR) Link Speed (mph) Link Distance (ft) Travel Time (s) Peak Hour Factor Heavy Vehicles (%) Adj. Flow (vph) Shared Lane Traffic (%) Lane Group Flow (vph) Enter Blocked Intersection Lane Alignment Median Width(ft) Link Offset(ft) Crosswalk Width(ft) Two way Left Turn Lane Headway Factor Turning Speed (mph) Number of Detectors Detector Template Leading Detector (ft) Trailing Detector (ft) Detector 1 Position(ft) Detector 1 Size(ft) Detector 1 Type Detector 1 Channel Detector 1 Extend (s) Detector 1 Queue (s) Detector 1 Delay (s) Detector 2 Position(ft) Detector 2 Size(ft) Detector 2 Type Detector 2 Channel Detector 2 Extend (s) Turn Type Protected Phases Permitted Phases Build3 7/31/2014 Baseline Synchro 8 Report NRW Page 12
152 Lanes, Volumes, Timings 17: SR 741 & Austin Blvd 9/3/2015 Lane Group EBT EBR2 WBT WBR2 NBL2 NBT NBR2 SBL2 SBT SBR2 SEL2 NWL2 Detector Phase Switch Phase Minimum Initial (s) Minimum Split (s) Total Split (s) Total Split (%) 31.6% 31.6% 35.5% 23.2% 25.2% 17.7% Maximum Green (s) Yellow Time (s) All-Red Time (s) Lost Time Adjust (s) Total Lost Time (s) Lead/Lag Lead Lead Lead Lead Lead-Lag Optimize? Yes Vehicle Extension (s) Recall Mode C-Max C-Max None None Min Min Act Effct Green (s) Actuated g/c Ratio v/c Ratio Control Delay Queue Delay Total Delay LOS F F E A E D A F F A B B Approach Delay Approach LOS F D D F Intersection Summary Area Type: Other Cycle Length: 155 Actuated Cycle Length: 155 Offset: 0 (0%), Referenced to phase 4:WBEB, Start of Yellow, Master Intersection Natural Cycle: 120 Control Type: Actuated-Coordinated Maximum v/c Ratio: 1.47 Intersection Signal Delay: Intersection LOS: F Intersection Capacity Utilization 123.3% ICU Level of Service H Analysis Period (min) 15 Splits and Phases: 17: SR 741 & Austin Blvd Build3 7/31/2014 Baseline Synchro 8 Report NRW Page 13
153 Lanes, Volumes, Timings 17: SR 741 & Austin Blvd 9/3/2015 Lane Group ø2 ø3 ø6 ø7 ø9 ø11 ø13 ø14 ø15 ø16 Detector Phase Switch Phase Minimum Initial (s) Minimum Split (s) Total Split (s) Total Split (%) 17% 7% 25% 12% 6% 60% 14% 15% 17% 8% Maximum Green (s) Yellow Time (s) All-Red Time (s) Lost Time Adjust (s) Total Lost Time (s) Lead/Lag Lag Lag Lag Lag Lead Lag Lead-Lag Optimize? Yes Yes Yes Vehicle Extension (s) Recall Mode Max Max Max Max None Min None Max Min Max Act Effct Green (s) Actuated g/c Ratio v/c Ratio Control Delay Queue Delay Total Delay LOS Approach Delay Approach LOS Intersection Summary Build3 7/31/2014 Baseline Synchro 8 Report NRW Page 14
154 Lanes, Volumes, Timings 19: S.R. 741 & Austin Blvd 9/3/2015 Lane Group EBT EBR WBL WBT NEL NER ø1 ø2 ø3 ø4 ø5 ø6 Lane Configurations Volume (vph) Ideal Flow (vphpl) Storage Length (ft) Storage Lanes Taper Length (ft) Lane Util. Factor Frt Flt Protected Satd. Flow (prot) Flt Permitted Satd. Flow (perm) Right Turn on Red No No Satd. Flow (RTOR) Link Speed (mph) Link Distance (ft) Travel Time (s) Peak Hour Factor Heavy Vehicles (%) 1% 1% 1% 1% 1% 1% Adj. Flow (vph) Shared Lane Traffic (%) Lane Group Flow (vph) Enter Blocked Intersection No No No No No No Lane Alignment Left Right Left Left Left Right Median Width(ft) Link Offset(ft) Crosswalk Width(ft) Two way Left Turn Lane Headway Factor Turning Speed (mph) Number of Detectors Detector Template Thru Left Thru Right Leading Detector (ft) Trailing Detector (ft) Detector 1 Position(ft) Detector 1 Size(ft) Detector 1 Type Cl+Ex Cl+Ex Cl+Ex Cl+Ex Detector 1 Channel Detector 1 Extend (s) Detector 1 Queue (s) Detector 1 Delay (s) Detector 2 Position(ft) Detector 2 Size(ft) 6 6 Detector 2 Type Cl+Ex Cl+Ex Detector 2 Channel Detector 2 Extend (s) Turn Type NA Prot NA custom Protected Phases Free Permitted Phases Build3 7/31/2014 Baseline Synchro 8 Report NRW Page 15
155 Lanes, Volumes, Timings 19: S.R. 741 & Austin Blvd 9/3/2015 Lane Group ø7 ø8 ø9 ø11 ø12 ø13 ø14 ø15 ø16 Lane Configurations Volume (vph) Ideal Flow (vphpl) Storage Length (ft) Storage Lanes Taper Length (ft) Lane Util. Factor Frt Flt Protected Satd. Flow (prot) Flt Permitted Satd. Flow (perm) Right Turn on Red Satd. Flow (RTOR) Link Speed (mph) Link Distance (ft) Travel Time (s) Peak Hour Factor Heavy Vehicles (%) Adj. Flow (vph) Shared Lane Traffic (%) Lane Group Flow (vph) Enter Blocked Intersection Lane Alignment Median Width(ft) Link Offset(ft) Crosswalk Width(ft) Two way Left Turn Lane Headway Factor Turning Speed (mph) Number of Detectors Detector Template Leading Detector (ft) Trailing Detector (ft) Detector 1 Position(ft) Detector 1 Size(ft) Detector 1 Type Detector 1 Channel Detector 1 Extend (s) Detector 1 Queue (s) Detector 1 Delay (s) Detector 2 Position(ft) Detector 2 Size(ft) Detector 2 Type Detector 2 Channel Detector 2 Extend (s) Turn Type Protected Phases Permitted Phases Build3 7/31/2014 Baseline Synchro 8 Report NRW Page 16
 12.0 14.0 11.0 24.0 12.0 14.9 Total Split (s) 55.0 27.0 11.0 49.0 36.0 39.0 Total Split (%) 35% 17% 7% 32% 23% 25% Maximum Green (s) 48.0 18.0 5.0 43.2 29.0 29.")
156 Lanes, Volumes, Timings 19: S.R. 741 & Austin Blvd 9/3/2015 Lane Group EBT EBR WBL WBT NEL NER ø1 ø2 ø3 ø4 ø5 ø6 Detector Phase Switch Phase Minimum Initial (s) Minimum Split (s) Total Split (s) Total Split (%) 35% 17% 7% 32% 23% 25% Maximum Green (s) Yellow Time (s) All-Red Time (s) Lost Time Adjust (s) Total Lost Time (s) Lead/Lag Lead Lag Lead Lag Lead-Lag Optimize? Vehicle Extension (s) Recall Mode None Max Max C-Max None Max Act Effct Green (s) Actuated g/c Ratio v/c Ratio Control Delay Queue Delay Total Delay LOS E E A E Approach Delay Approach LOS E B Intersection Summary Area Type: Other Cycle Length: 155 Actuated Cycle Length: 155 Offset: 0 (0%), Referenced to phase 4:WBEB, Start of Yellow, Master Intersection Natural Cycle: 120 Control Type: Actuated-Coordinated Maximum v/c Ratio: 1.47 Intersection Signal Delay: 47.4 Intersection LOS: D Intersection Capacity Utilization 64.7% ICU Level of Service C Analysis Period (min) 15 Splits and Phases: 19: S.R. 741 & Austin Blvd Build3 7/31/2014 Baseline Synchro 8 Report NRW Page 17
INTERCHANGE OPERTIONS STUDY Interstate 77 / Wallings Road Interchange
 INTERCHANGE OPERTIONS STUDY Interstate 77 / Wallings Road Interchange City of Broadview Heights, Cuyahoga County, Ohio Prepared For: City of Broadview Heights Department of Engineering 9543 Broadview Road
Critical Movement* Delay (sec/veh) Critical Movement* LOS 8 a.m. 9 a.m. B 25.2 C. 3 p.m. 4 p.m. B 17.3 B
 Critical Movement* LOS 8 a.m. 9 a.m. B 25.2 C. 3 p.m. 4 p.m. B 17.3 B") Memorandum DATE: AUGUST 1, 2013 TO: PAUL TILTON, P.E., SANDWICH DPW DIRECTOR/TOWN ENGINEER FROM: LEV MALAKHOFF, SR. TRANSPORTATION ENGINEER RE: ROUTE 130/QUAKER MEETINGHOUSE ROAD INTERSECTION Paul: Per
Memorandum DATE: AUGUST 1, 2013 TO: PAUL TILTON, P.E., SANDWICH DPW DIRECTOR/TOWN ENGINEER FROM: LEV MALAKHOFF, SR. TRANSPORTATION ENGINEER RE: ROUTE 130/QUAKER MEETINGHOUSE ROAD INTERSECTION Paul: Per
Interchange Operations Study
 CUY 480 14.32 PID No. 102053 Ohio Department of Transportation District 12 550 Transportation Boulevard Garfield Heights, OH 44125 5396 Interchange Operations Study Analysis Summary August 2016 8101 N.
P07033 US 50 EB Weaving Analysis between El Dorado Hills and Silva Valley Ramp Metering Analysis for US 50 EB On-Ramp at Latrobe Road
 180 Grand Avenue, Suite 250 428 J Street, Suite 500 Oakland, CA 94612 Sacramento, CA 95814 510.839.1742 916.266.2190 510.839.0871 fax 916.266.2195 Dowling Associates, Inc. www.dowlinginc.com traffic@dowlinginc.com
Freeway Weaving and Ramp Junction Analysis
 TEXAS TECH UNIVERSITY Freeway Weaving and Ramp Junction Analysis Along IH 27 at Plainview, TX Hao Xu, Jared A. Squyres, Wesley Kumfer, and Hongchao Liu 7/15/2011 Table of Contents Project Description...
 Traffic Analysis For Approved Uses within the St. Lucie West DRI Aldi Port St. Lucie, FL Prepared for: Bohler Engineering, LLC 1000 Corporate Drive Suite 250 Fort Lauderdale, FL 33334 Prepared by: 10795
Bennett Pit. Traffic Impact Study. J&T Consulting, Inc. Weld County, Colorado. March 3, 2017
 Bennett Pit Traffic Impact Study J&T Consulting, Inc. Weld County, Colorado March 3, 217 Prepared By: Sustainable Traffic Solutions, Inc. http://www.sustainabletrafficsolutions.com/ Joseph L. Henderson,
Interstate 85 Widening Phase III Interchange Modification Report Exit 98 Frontage Road Off-Ramp. Cherokee County, SC
 Interstate 85 Widening Phase III Interchange Modification Report Exit 98 Frontage Road Off-Ramp Cherokee County, SC Prepared for: South Carolina Department of Transportation Prepared by: Stantec Consulting
APPENDICES C APPENDIX C: CALCULATION WORKSHEETS FOR FREEWAY SEGMENTS AND FREEWAY WEAVE ANALYSIS
 APPENDICES C APPENDIX C: CALCULATION WORKSHEETS FOR FREEWAY SEGMENTS AND FREEWAY WEAVE ANALYSIS Public Review Draft Existing Conditions Report Page C-1 October 2015 SIA PLAN UPDATE This page was intentionally
Appendix H: Construction Impacts H-2 Transportation
 Appendix H: Construction Impacts H-2 Transportation \ AECOM 71 W. 23 rd Street New York, NY 10010 www.aecom.com 212 366 6200 tel 212 366 6214 fax Memorandum To CC Subject Robert Conway Donald Tone Construction
APPENDIX C1 TRAFFIC ANALYSIS DESIGN YEAR TRAFFIC ANALYSIS
 APPENDIX C1 TRAFFIC ANALYSIS DESIGN YEAR TRAFFIC ANALYSIS DESIGN YEAR TRAFFIC ANALYSIS February 2018 Highway & Bridge Project PIN 6754.12 Route 13 Connector Road Chemung County February 2018 Appendix
LAWRENCE TRANSIT CENTER LOCATION ANALYSIS 9 TH STREET & ROCKLEDGE ROAD / 21 ST STREET & IOWA STREET LAWRENCE, KANSAS
 LAWRENCE TRANSIT CENTER LOCATION ANALYSIS 9 TH STREET & ROCKLEDGE ROAD / 21 ST STREET & IOWA STREET LAWRENCE, KANSAS TRAFFIC IMPACT STUDY FEBRUARY 214 OA Project No. 213-542 TABLE OF CONTENTS 1. INTRODUCTION...
TRAFFIC AND TRANSPORTATION TECHNICAL MEMORANDUM
 TRAFFIC AND TRANSPORTATION TECHNICAL MEMORANDUM for ENVIRONMENTAL ASSESSMENT US 460 Bypass Interchange and Southgate Drive Relocation State Project No.: 0460-150-204, P101, R201, C501, B601; UPC 99425
LATSON INTERCHANGE DEVELOPMENT TRAFFIC STUDIES. Genoa Township, Livingston County, MI
 LATSON INTERCHANGE DEVELOPMENT TRAFFIC STUDIES Genoa Township, Livingston County, MI DRAFT TRAFFIC STUDY FOR I-96 AT LATSON RD INTERCHANGE Livingston County CS 47065 JN 101622C Submitted to: Michigan Department
MEMO. McCORMICK RANKIN CORPORATION. File FROM: Keyur Shah DATE: February 1, 2010 COPIES: OUR FILE: SUBJECT: TO:
 McCORMICK RANKIN CORPORATION 2655 North Sheridan Way Mississauga, Ontario, L5K 2P8 Tel: (905)823-8500 Fax: (905) 823-8503 E-mail: mrc@mrc.ca Website: www.mrc.ca MEMO TO: File FROM: Keyur Shah DATE: February
To: File From: Adrian Soo, P. Eng. Markham, ON File: Date: August 18, 2015
 Memo To: From: Adrian Soo, P. Eng. Markham, ON : 165620021 Date: Reference: E.C. Row Expressway, Dominion Boulevard Interchange, Dougall Avenue Interchange, and Howard 1. Review of Interchange Geometry
Traffic Impact Study Morgan Road Commerce Park Pasco County, Florida
 Traffic Impact Study Morgan Road Commerce Park Pasco County, Florida Summary Report June 2008 Prepared by: 12909 N 56 th Street # 201 Tampa, FL 33617 Ph: (813) 988-3180 Fax: (813) 343-6854 Morgan Road
Table 1 - Land Use Comparisons - Proposed King s Wharf Development. Retail (SF) Office (SF) 354 6,000 10, Land Uses 1
 Office (SF) 354 6,000 10, Land Uses 1") Ref. No. 171-6694 Phase 2 November 23, 217 Mr. David Quilichini, Vice President Fares & Co. Developments Inc. 31 Place Keelson Sales Centre DARTMOUTH NS B2Y C1 Sent Via Email to David@faresinc.com RE:
Ref. No. 171-6694 Phase 2 November 23, 217 Mr. David Quilichini, Vice President Fares & Co. Developments Inc. 31 Place Keelson Sales Centre DARTMOUTH NS B2Y C1 Sent Via Email to David@faresinc.com RE:
L1TILE BEARS DAY CARE TRANSPORTATION IMPACT STUDY FORT COLLINS, COLORADO MAY Prepared for:
 L1TILE BEARS DAY CARE TRANSPORTATION IMPACT STUDY FORT COLLINS, COLORADO MAY 2012 Prepared for: Hillside Construction, Inc. 216 Hemlock Street, Suite B Fort Collins, CO 80534 Prepared by: DELICH ASSOCIATES
INTERSECTION ANALYSIS PARK AVENUE AND BRADDOCK ROAD (FROSTBURG, MD) FOR LENHART TRAFFIC CONSULTING, INC.
 FOR LENHART TRAFFIC CONSULTING, INC.") INTERSECTION ANALYSIS FOR PARK AVENUE AND BRADDOCK ROAD (FROSTBURG, MD) Prepared for: City of Frostburg, Maryland & Allegany County Commissioners Prepared by: LENHART TRAFFIC CONSULTING, INC. TRAFFIC ENGINEERING
INTERSECTION ANALYSIS FOR PARK AVENUE AND BRADDOCK ROAD (FROSTBURG, MD) Prepared for: City of Frostburg, Maryland & Allegany County Commissioners Prepared by: LENHART TRAFFIC CONSULTING, INC. TRAFFIC ENGINEERING
TRAFFIC DATA. Existing Derousse Ave./River Rd. AM LOS Analysis Existing Derousse Ave./River Rd. PM LOS Analysis
 Appendix E NJ TRANSIT Pennsauken Junction Transit Center and Park & Ride RiverLINE and Atlantic City Line Pennsauken Township, Camden County, New Jersey TRAFFIC DATA Background Traffic Information for
Interstate Operations Study: Fargo-Moorhead Metropolitan Area Simulation Output
 NDSU Dept #2880 PO Box 6050 Fargo, ND 58108-6050 Tel 701-231-8058 Fax 701-231-6265 www.ugpti.org www.atacenter.org Interstate Operations Study: Fargo-Moorhead Metropolitan Area 2015 Simulation Output Technical
Oakbrook Village Plaza City of Laguna Hills
 Oakbrook Village Plaza City of Laguna Hills Traffic Impact Analysis Prepared by: HDR Engineering 3230 El Camino Real, Suite 200 Irvine, CA 92602 October 2012 Revision 3 D-1 Oakbrook Village Plaza Laguna
MEMORANDUM. Figure 1. Roundabout Interchange under Alternative D
 MEMORANDUM Date: To: Liz Diamond, Dokken Engineering From: Subject: Dave Stanek, Fehr & Peers Western Placerville Interchanges 2045 Analysis RS08-2639 Fehr & Peers has completed a transportation analysis
Quantitative analyses of weekday a.m. and p.m. commuter hour conditions have been conducted for the following five scenarios:
 6.1 TRANSPORTATION AND CIRCULATION 6.1.1 INTRODUCTION This section of the EIR presents the results of TJKM s traffic impact analysis of the proposed Greenbriar Development. The analysis includes consideration
Interstate Operations Study: Fargo-Moorhead Metropolitan Area Simulation Results
 NDSU Dept #2880 PO Box 6050 Fargo, ND 58108-6050 Tel 701-231-8058 Fax 701-231-6265 www.ugpti.org www.atacenter.org Interstate Operations Study: Fargo-Moorhead Metropolitan Area 2025 Simulation Results
One Harbor Point Residential
 Residential Gig Harbor, WA Transportation Impact Analysis January 23, 2017 Prepared for: Neil Walter Company PO Box 2181 Tacoma, WA 98401 Prepared by: TENW Transportation Engineering NorthWest 11400 SE
SR 104/Paradise Bay-Shine Road Intersection Safety Improvements Intersection Control Evaluation
 SR 104/Paradise Bay-Shine Road Intersection Safety Improvements Intersection Control Evaluation Background and Project Needs SR 104 is functionally classified as a rural-principal arterial. It is a limited
886 March Road McDonald's Transportation Study
 McDonald's Restaurants of Canada Limited March 2013 886 March Road McDonald's Transportation Study Submitted by: HDR Corporation 100 York Boulevard, Suite 300 Richmond Hill, ON L4B 1J8 (905) 882-4100 www.hdrinc.com
Weaver Road Senior Housing Traffic Impact Analysis
 Gibson Traffic Consultants, Inc. 2813 Rockefeller Avenue Suite B Everett, WA 9821 425.339.8266 Weaver Road Senior Housing Traffic Impact Analysis Jurisdiction: City of Snohomish January 218 GTC #17-37
Winnetka Avenue Bike Lanes Traffic Impact Analysis
 Winnetka Avenue Bike Lanes Traffic Impact Analysis January 4, 2019 Prepared by City of Los Angeles Department of Transportation Active Transportation Division Winnetka Ave Bike Lanes Traffic Impact Analysis
Traffic Impact Analysis. Alliance Cole Avenue Residential Site Dallas, Texas. Kimley-Horn and Associates, Inc. Dallas, Texas.
 Traffic Impact Analysis Alliance Cole Avenue Residential Site Dallas, Texas February 15, 2018 Kimley-Horn and Associates, Inc. Dallas, Texas Project #064524900 Registered Firm F-928 Traffic Impact Analysis
Ref. No Task 3. April 28, Mr. Cesar Saleh, P. Eng. VP Planning and Design W.M. Fares Group th
 Ref. No. 151-00564 Task 3 April 28, 2015 Mr. Cesar Saleh, P. Eng. VP Planning and Design W.M. Fares Group th 3480 Joseph Howe Drive, 5 Floor HALIFAX NS B3L 4H7 Sent via Email to ceasr.saleh@wmfares.com
Appendix B: Traffic Reports
 Appendix B: Traffic Reports 407 TRANSITWAY - KENNEDY ROAD TO BROCK ROAD MINISTRY OF TRANSPORTATION - CENTRAL REGION Report Markham Road Station Traffic Study Prepared for Ministry of Transportation, Ontario
Shirk Road at State Route 198 Interchange Analysis Tulare County, California
 Shirk Road at State Route 198 Interchange Analysis Tulare County, California DRAFT REPORT Prepared By Tulare County Association of Governments (TCAG) April 2013 Table of Contents Introduction:... 3 Project
TRAFFIC SIGNAL DESIGN REPORT KING OF PRUSSIA ROAD & RAIDER ROAD RADNOR TOWNSHIP PENNSYLVANIA
 TRAFFIC SIGNAL DESIGN REPORT KING OF PRUSSIA ROAD & RAIDER ROAD RADNOR TOWNSHIP PENNSYLVANIA PREPARED FOR: UNIVERSITY OF PENNSYLVANIA HEALTH SYSTEM 34 CIVIC CENTER BOULEVARD PHILADELPHIA, PA 1987 (61)
LOST LAKE CORRIDOR REVIEW
 LOST LAKE CORRIDOR REVIEW Prepared for: Prepared by: Broadview Developments Inc. c/o Westbrook Consulting Watt Consulting Group Our File: 2064.B01 Date: October 31, 2016 TABLE OF CONTENTS 1.0 INTRODUCTION...
Parking/Traffic Assessment Study
 Brock Road Industrial Mall 985 Brock Road South City of Pickering Parking/Traffic Assessment Study Prepared by: Tranplan Associates, Toronto Toronto 416-670-2005 Sudbury 705-522-0272 Peterborough 705-874-3638
APPENDIX A LEVEL OF SERVICE CONCEPTS, ANALYSIS METHODOLOGIES,STANDARDS OF SIGNIFICANCE
 APPENDIX A LEVEL OF SERVICE CONCEPTS, ANALYSIS METHODOLOGIES,STANDARDS OF SIGNIFICANCE Roadway Segment Level of Service Definitions LOS V/C Congestion/Delay Traffic Description (Used for surface streets,
December 5, Red Bank Planning Board Municipal Building 90 Monmouth Street Red Bank, NJ 07701
 Dynamic Traffic, LLC www.dynamic-traffic.com 1904 Main Street Lake Como, NJ 07719 T. 732.681.0760 December 5, 2016 Red Bank Planning Board Municipal Building 90 Monmouth Street Red Bank, NJ 07701 Re: Traffic
Provide an overview of the development proposal including projected site traffic volumes;
 December 19, 2013 File: 163600935 Attention: Troy Elliott Carl Elliott Limited 15-1831 Robertson Road PO Box 11117 Nepean, Ontario K1H 7T8 Dear Mr. Elliott, Reference: 2235 and 2265 Robertson Road Transportation
Traffic Impact Analysis Farmington Center Village
 Traffic Impact Analysis Farmington Center Village Route 4 (Farmington Avenue) Farmington, Connecticut Prepared for: The Town of Farmington, CT Prepared By: BL Companies Meriden, Connecticut December 2016
Alpine Highway to North County Boulevard Connector Study
 Alpine Highway to North County Boulevard Connector Study prepared by Avenue Consultants March 16, 2017 North County Boulevard Connector Study March 16, 2017 Table of Contents 1 Summary of Findings... 1
Aldridge Transportation Consultants, LLC Advanced Transportation Planning and Traffic Engineering
 Aldridge Transportation Consultants, LLC Advanced Transportation Planning and Traffic Engineering John M.W. Aldridge, PE, PTOE, AICP 1082 Chimney Rock Road Colorado Registered Professional Engineer Highlands
KUM & GO 6400 WESTOWN PARKWAY WEST DES MOINES, IOWA 50266
 KUM & GO #300 PECOS STREET & 88 TH AVENUE THORNTON, COLORADO TRAFFIC IMPACT STUDY REVISION 1 PREPARED FOR KUM & GO 6400 WESTOWN PARKWAY WEST DES MOINES, IOWA 50266 JANUARY 23, 2014 OA PROJECT NO. 013-1721
Traffic Impact Analysis Update
 Willow Bend Traffic Impact Analysis Update TABLE OF CONTENTS Page I. INTRODUCTION -------------------------------------------------------------------------------------------- 1 II. EXISTING CONDITIONS
MERIVALE PRIORITY SQUARE 2852 MERIVALE ROAD CITY OF OTTAWA TRANSPORTATION BRIEF. Prepared for: ONT Inc. 25 Winding Way Nepean, Ontario K2C 3H1
 MERIVALE PRIORITY SQUARE 2852 MERIVALE ROAD CITY OF OTTAWA TRANSPORTATION BRIEF Prepared for: 2190986ONT Inc. 25 Winding Way Nepean, Ontario K2C 3H1 October 6, 2010 110-502 Report_1.doc D. J. Halpenny
June 21, Mr. Jeff Mark The Landhuis Company 212 North Wahsatch Avenue, Suite 301. Colorado Springs, CO 80903
 LSC TRANSPORTATION CONSULTANTS, INC. 545 East Pikes Peak Avenue, Suite 210 Colorado Springs, CO 80903 (719) 633-2868 FAX (719) 633-5430 E-mail: lsc@lsctrans.com Website: http://www.lsctrans.com June 21,
JCE 4600 Basic Freeway Segments
 JCE 4600 Basic Freeway Segments HCM Applications What is a Freeway? divided highway with full control of access two or more lanes for the exclusive use of traffic in each direction no signalized or stop-controlled
BUCKLEY ANNEX REDEVELOPMENT PLAN TRANSPORTATION ANALYSIS ADDENDUM
 BUCKLEY ANNEX REDEVELOPMENT PLAN TRANSPORTATION ANALYSIS ADDENDUM Prepared for: City and County of Denver Prepared by: Contact: Brian Bern, P.E., PTOE 303.572.0200 On Behalf of: Lowry Redevelopment Authority
Re: Residential Development - Ogilvie/Cummings Transportation Overview
 1223 Michael Street, Suite 100, Ottawa, ON K1J 7T2 Tel: 613.738.4160 Fax: 613.739.7105 www.delcan.com March 28, 2012 OUR REF: TO3088TOY Barry J. Hobin & Architects 63 Pamilla Street Ottawa, ON K1S 3K7
Traffic Impact Statement (TIS)
") Traffic Impact Statement (TIS) Vincentian PUDA Collier County, FL 10/18/2013 Prepared for: Global Properties of Naples Prepared by: Trebilcock Consulting Solutions, PA 2614 Tamiami Trail N, Suite 615 1205
Traffic Impact Statement (TIS) Vincentian PUDA Collier County, FL 10/18/2013 Prepared for: Global Properties of Naples Prepared by: Trebilcock Consulting Solutions, PA 2614 Tamiami Trail N, Suite 615 1205
Sugarland Crossing Gwinnett County, Georgia
 Sugarland Crossing Gwinnett County, Georgia S IGNAL W ARRANT A NALYSIS For the Intersection of: Sugarloaf Parkway / Richards Middle School Driveway / Sugarland Crossing Main Site Driveway Prepared for:
Lacey Gateway Residential Phase 1
 Lacey Gateway Residential Phase Transportation Impact Study April 23, 203 Prepared for: Gateway 850 LLC 5 Lake Bellevue Drive Suite 02 Bellevue, WA 98005 Prepared by: TENW Transportation Engineering West
April Salvation Army Barrhaven Church 102 Bill Leathem Drive Transportation Brief
 April 26 Salvation Army Barrhaven Church 2 Bill Leathem Drive Transportation Brief Salvation Army Barrhaven Church 2 Bill Leathem Drive Transportation Brief prepared for: The Salvation Army 2 Overlea Blvd.
Traffic Engineering Study
 Traffic Engineering Study Bellaire Boulevard Prepared For: International Management District Technical Services, Inc. Texas Registered Engineering Firm F-3580 November 2009 Executive Summary has been requested
FE Review-Transportation-II. D e p a r t m e n t o f C i v i l E n g i n e e r i n g U n i v e r s i t y O f M e m p h i s
 FE Review-Transportation-II D e p a r t m e n t o f C i v i l E n g i n e e r i n g U n i v e r s i t y O f M e m p h i s Learning Objectives Design, compute, and solve FE problems on Freeway level of
Re: Cyrville Road Car Dealership
 1223 Michael Street, Suite 100, Ottawa, ON K1J 7T2 Tel: 613.738.4160 Fax: 613.739.7105 www.delcan.com February 25, 2013 OUR REF: TO3098TOE Mark Motors of Ottawa 611 Montreal Road Ottawa, ON K1K 0T8 Attention:
APPENDICES. APPENDIX D Synchro Level of Service Output Sheets
 APPENDICES APPENDIX D Synchro Level of Service Output Sheets Lanes, Volumes, Timings NO BUILD 2016 PM 8: 10th St & Thain Rd 10/05/2016 Lane Group NBL NBT NBR SBL SBT SBR SEL SET SER NWL NWT NWR
MEMO. McCORMICK RANKIN CORPORATION. File Mark VanderSluis, Keyur Shah DATE: October 26, 2009 COPIES: OUR FILE: TO: FROM: Jack Thompson
 McCORMICK RANKIN CORPORATION 2655 North Sheridan Way Mississauga, Ontario, L5K 2P8 Tel: (95)823-85 Fax: (95) 823-853 E-mail: mrc@mrc.ca Website: www.mrc.ca MEMO TO: FROM: File Mark VanderSluis, Keyur Shah
TRAFFIC IMPACT STUDY DERRY GREEN CORPORATE BUSINESS PARK MILTON SECONDARY PLAN MODIFICATION
 TRAFFIC IMPACT STUDY DERRY GREEN CORPORATE BUSINESS PARK MILTON SECONDARY PLAN MODIFICATION TRAFFIC IMPACT STUDY DERRY GREEN CORPORATE BUSINESS PARK MILTON SECONDARY PLAN MODIFICATION DECEMBER 2014 UPDATED
RTE. 1 at RTE. 637 & RTE. 639
 INTERSECTION SAFETY STUDY Prepared for: Virginia Department of Transportation Central Region Operations Traffic Engineering (UPC #81378, TO 12-092) DAVENPORT Project Number: 13-368 / /2014 RTE. 1 at RTE.
MURRIETA APARTMENTS TRAFFIC IMPACT ANALYSIS CITY OF MURRIETA, CALIFORNIA
 MURRIETA APARTMENTS TRAFFIC IMPACT ANALYSIS CITY OF MURRIETA, CALIFORNIA SEPTEMBER 20, 2012 Prepared for: Golden Eagle Multi-Family Properties, LLC 6201 Oak Canyon Rd., Suite 250 Irvine, CA 92618 Prepared
Traffic Impact Study Hudson Street Parking Garage MC Project No.: A Table of Contents
 Traffic Impact Study Hudson Street Parking Garage MC Project No.: 15001714A Table of Contents Table of Contents I. INTRODUCTION... 1 II. EXISTING CONDITIONS... 4 III. 2015 EXISTING TRAFFIC CONDITIONS...
Proposed Office Building Traffic Impact Study Chicago Avenue Evanston, Illinois
 Proposed Office Building Traffic Impact Study 1714-1720 Chicago Avenue Evanston, Illinois Prepared For: HOLABIRD & ROOT, LLC Prepared by: Eriksson Engineering Associates, Ltd. 145 Commerce Drive, Ste A,
APPENDIX E. Traffic Analysis Report
 APPENDIX E Traffic Analysis Report THIS PAGE INTENTIONALLY BLANK EAGLE RIVER TRAFFIC MITIGATION PHASE I OLD GLENN HIGHWAY/EAGLE RIVER ROAD INTERSECTION IMPROVEMENTS TRAFFIC ANALYSIS Eagle River, Alaska
Downtown One Way Street Conversion Technical Feasibility Report
 Downtown One Way Street Conversion Technical Feasibility Report As part of the City s Transportation Master Plan, this report reviews the technical feasibility of the proposed conversion of the current
Addendum to Traffic Impact Analysis for Port Marigny Site Mandeville, LA
 Addendum to Traffic Impact Analysis for Port Marigny Site Mandeville, LA (St. Tammany Parish Mandeville, LA) Prepared For The Pittman Companies Michael N Pittman, MD 328 East Boston St Covington, LA 70433
Aldridge Transportation Consultants, LLC Advanced Transportation Planning and Traffic Engineering
 Aldridge Transportation Consultants, LLC Advanced Transportation Planning and Traffic Engineering John M.W. Aldridge, PE, PTOE, AICP 1082 Chimney Rock Road Colorado Registered Professional Engineer Highlands
MINERVA PARK SITE TRAFFIC IMPACT STUDY M/I HOMES. September 2, 2015
 5500 New Albany Road Columbus, Ohio 43054 Phone: 614.775.4500 Fax: 614.775.4800 Toll Free: 1-888-775-EMHT emht.com 2015-1008 MINERVA PARK SITE TRAFFIC IMPACT STUDY M/I HOMES September 2, 2015 Engineers
Traffic Impact Analysis 5742 BEACH BOULEVARD MIXED USE PROJECT
 Traffic Impact Analysis 5742 BEACH BOULEVARD MIXED USE PROJECT CITY OF BUENA PARK Prepared by Project No. 14139 000 April 17 th, 2015 DKS Associates Jeffrey Heald, P.E. Rohit Itadkar, T.E. 2677 North Main
Date: February 7, 2017 John Doyle, Z-Best Products Robert Del Rio. T.E. Z-Best Traffic Operations and Site Access Analysis
 Memorandum Date: February 7, 07 To: From: Subject: John Doyle, Z-Best Products Robert Del Rio. T.E. Z-Best Traffic Operations and Site Access Analysis Introduction Hexagon Transportation Consultants, Inc.
MEMORANDUM. Date: November 4, Cheryl Burrell, Pebble Beach Company. Rob Rees, P.E. Inclusionary Housing Transportation Analysis WC
 MEMORANDUM Date: November 4, 2013 To: From: Subject: Cheryl Burrell, Pebble Beach Company Rob Rees, P.E. Inclusionary Housing Transportation Analysis As requested, Fehr & Peers is providing clarification
MEMO VIA . Ms. Amy Roth DPS Director, City of Three Rivers. To:
 MEMO To: Ms. Amy Roth DPS Director, City of Three Rivers VIA EMAIL From: Michael J. Labadie, PE Julie M. Kroll, PE, PTOE Brandon Hayes, PE, P.Eng. Fleis & VandenBrink Date: January 5, 2017 Re: Proposed
PROJECT: Wilkinson Road Corridor Improvement Traffic Management Planning Project SUBJECT: Traffic Analysis
 TECHNICAL MEMORANDUM DATE: September 10, 2014 PROJECT 5861.03 NO: PROJECT: Wilkinson Road Corridor Improvement Traffic Management Planning Project SUBJECT: Traffic Analysis TO: Steve Holroyd - District
TRAFFIC IMPACT ANALYSIS FOR. RESIDENCE INN PROJECT Davis, CA. Prepared For: JACKSON PROPERTIES 155 Cadillac Drive, Suite 100 Sacramento, CA 95825
 TRAFFIC IMPACT ANALYSIS FOR RESIDENCE INN PROJECT Davis, CA Prepared For: JACKSON PROPERTIES 155 Cadillac Drive, Suite 100 Sacramento, CA 95825 Prepared By: KD Anderson & Associates, Inc. 3853 Taylor Road,
ARVADA TRIANGLE REDEVELOPMENT TRAFFIC IMPACT ANALYSIS
 ARVADA TRIANGLE REDEVELOPMENT TRAFFIC IMPACT ANALYSIS Prepared for: Arvada Urban Renewal Authority 5601 Olde Wadsworth Boulevard, Suite 210 Arvada, Colorado 80002 (720) 898-7062 Prepared by: Felsburg Holt
BARRHAVEN FELLOWSHIP CRC 3058 JOCKVALE ROAD OTTAWA, ONTARIO TRANSPORTATION BRIEF. Prepared for:
 BARRHAVEN FELLOWSHIP CRC 3058 JOCKVALE ROAD OTTAWA, ONTARIO TRANSPORTATION BRIEF Prepared for: Barrhaven Fellowship CRC 3058 Jockvale Road Ottawa, ON K2J 2W7 December 7, 2016 116-649 Report_1.doc D. J.
RESPONSE TO TRAFFIC IMPACT STUDY COMMENTS
 RESPONSE TO TRAFFIC IMPACT STUDY COMMENTS Proposed Gas Station 40 Arthur Street (Highway 26), Town of the Blue Mountains (Thornbury), County of Grey, Ontario AUGUST 2013 August 27, 2013 MR. REG RUSSWURM
TRAFFIC IMPACT ANALYSIS
 TRAFFIC IMPACT ANALYSIS Emerald Isle Commercial Development Prepared by SEPI Engineering & Construction Prepared for Ark Consulting Group, PLLC March 2016 I. Executive Summary A. Site Location The Emerald
Barrhaven Honda Dealership. Dealership Drive, Ottawa, ON. Transportation Brief
 Barrhaven Honda Dealership Dealership Drive, Ottawa, ON Transportation Brief Prepared By: NOVATECH Suite 200, 240 Michael Cowpland Drive Ottawa, Ontario K2M 1P6 September, 2015 File: 115136 Ref: R-2015-152
Prepared For: Toronto Transit Commission 1138 Bathurst Street Toronto, Ontario M5R 3H2. Prepared By:
 TRAFFIC IMPACT STUDY FOR THE TTC MCNICOLL BUS GARAGE CITY OF TORONTO Prepared For: Toronto Transit Commission 1138 Bathurst Street Toronto, Ontario M5R 3H2 Prepared By: Canada Inc. 4th Floor, 3 Leek Crescent
Traffic Impact Study. Eastern Springs. A Proposed Development in Manorville, NY. April Haas Group Inc Transportation Planners and Engineers
 Traffic Impact Study For Eastern Springs A Proposed Development in Manorville, NY April 2018 Haas Group Inc Transportation Planners and Engineers Table of Contents 1) Executive Summary... 2 2) Study Purpose...
JOHNSON RANCH RAPID CITY, SOUTH DAKOTA TRAFFIC IMPACT ANALYSIS
 JOHNSON RANCH RAPID CITY, SOUTH DAKOTA TRAFFIC IMPACT ANALYSIS Prepared for: KTM Design Solutions 528 Kansas City Street, Suite 1 Rapid City, SD 57701 Prepared by: Felsburg Holt & Ullevig 6300 South Syracuse
Table Existing Traffic Conditions for Arterial Segments along Construction Access Route. Daily
 5.8 TRAFFIC, ACCESS, AND CIRCULATION This section describes existing traffic conditions in the project area; summarizes applicable regulations; and analyzes the potential traffic, access, and circulation
Figure 1 Map of intersection of SR 44 (Ravenna Rd) and Butternut Rd
 and Butternut Rd") Abbreviated Study District: 12 County: Geauga Route: SR 44 Section: 1.58 GEA 44 1.58 213 HSP # 47 (Rural Intersection) Prepared April 23, 215 By Bryan Emery Existing Conditions This study contains the
Abbreviated Study District: 12 County: Geauga Route: SR 44 Section: 1.58 GEA 44 1.58 213 HSP # 47 (Rural Intersection) Prepared April 23, 215 By Bryan Emery Existing Conditions This study contains the
V. DEVELOPMENT OF CONCEPTS
 Martin Luther King, Jr. Drive Extension FINAL Feasibility Study Page 9 V. DEVELOPMENT OF CONCEPTS Throughout the study process several alternative alignments were developed and eliminated. Initial discussion
Proposed location of Camp Parkway Commerce Center. Vicinity map of Camp Parkway Commerce Center Southampton County, VA
 Proposed location of Camp Parkway Commerce Center Vicinity map of Camp Parkway Commerce Center Southampton County, VA Camp Parkway Commerce Center is a proposed distribution and industrial center to be
Final Technical Report US 17 Corridor Study Update (Market Street Road Diet)
") Market Street Road Diet Wilmington, NC 2016 Final Technical Report US 17 Corridor Study Update (Market Street Road Diet) Wilmington, NC Parsons Brinckerhoff January 2016 FINAL TECHNICAL REPORT US 17 Corridor
Market Street Road Diet Wilmington, NC 2016 Final Technical Report US 17 Corridor Study Update (Market Street Road Diet) Wilmington, NC Parsons Brinckerhoff January 2016 FINAL TECHNICAL REPORT US 17 Corridor
Transit City Etobicoke - Finch West LRT
 Delcan Corporation Transit City Etobicoke - Finch West LRT APPENDIX D Microsimulation Traffic Modeling Report March 2010 March 2010 Appendix D CONTENTS 1.0 STUDY CONTEXT... 2 Figure 1 Study Limits... 2
Traffic Impact Study Proposed Commercial Development Ballwin, Missouri. Technical Memorandum for Traffic Impact Study
 Traffic Impact Study Proposed Commercial Development Ballwin, Missouri Technical Memorandum for Traffic Impact Study Crawford, Bunte, Brammeier May 1, 2009 MEMORANDUM Date: April 24, 2009 To: From: Subject:
APPENDIX B Traffic Analysis
 APPENDIX B Traffic Analysis Rim of the World Unified School District Reconfiguration Prepared for: Rim of the World School District 27315 North Bay Road, Blue Jay, CA 92317 Prepared by: 400 Oceangate,
HCM Unsignalized Intersection Capacity Analysis 6: Brian Street & LC 111 5/26/2009
 6: Brian Street & LC 111 5/26/2009 Movement EBL EBR NBL NBT SBT SBR Volume (veh/h) 116 20 8 405 137 56 Sign Control Stop Free Free Grade 0% 0% 0% Peak Hour Factor 0.81 0.81 0.67 0.67 0.89 0.89 Hourly flow
Interstate 80 Corridor Study
 Interstate 80 Corridor Study Final Technical Memorandum 5: Traffic Volumes, Accident Locations and Operational Deficiencies West Verdi (SR 425) Interchange to West McCarran Boulevard (SR 651) and East
MULTILANE HIGHWAYS. Highway Capacity Manual 2000 CHAPTER 21 CONTENTS
 CHAPTER 2 MULTILANE HIGHWAYS CONTENTS I. INTRODUCTION...2- Base Conditions for Multilane Highways...2- Limitations of the Methodology...2- II. METHODOLOGY...2- LOS...2-2 Determining FFS...2-3 Estimating
Proposed Hotel and Restaurant Development
 Traffic Impact Study Proposed Hotel and Restaurant Development Marbledale Road Tuckahoe, NY PREPARED FOR BILLWIN DEVELOPMENT AFFILIATES, LLC 365 WHITE PLAINS ROAD EASTCHESTER, NY. 10709 PREPARED BY Engineering
IV. REVISIONS TO THE DRAFT IS/MND
 IV. REVISIONS TO THE DRAFT IS/MND 1. REVISIONS TO THE DRAFT IS/MND This section presents corrections and clarifications that have been made to the text of the Draft IS/MND. These changes include revisions
EXECUTIVE SUMMARY. The following is an outline of the traffic analysis performed by Hales Engineering for the traffic conditions of this project.
 EXECUTIVE SUMMARY This study addresses the traffic impacts associated with the proposed Shopko redevelopment located in Sugarhouse, Utah. The Shopko redevelopment project is located between 1300 East and
King County Metro. Columbia Street Transit Priority Improvements Alternative Analysis. Downtown Southend Transit Study. May 2014.
 King County Metro Columbia Street Transit Priority Improvements Alternative Analysis Downtown Southend Transit Study May 2014 Parametrix Table of Contents Introduction... 1 Methodology... 1 Study Area...
D & B COMMERCIAL TRAFFIC IMPACT ANALYSIS
 D & B COMMERCIAL TRAFFIC IMPACT ANALYSIS TABLE OF CONTENTS I. Introduction...3 II. Project Description...3 III. Existing Conditions...3 IV. Future Traffic Conditions...8 V. Conclusions and Mitigation...14