FE Review-Transportation-II. D e p a r t m e n t o f C i v i l E n g i n e e r i n g U n i v e r s i t y O f M e m p h i s
|
|
|
- Merry Cain
- 6 years ago
- Views:
Transcription
1 FE Review-Transportation-II D e p a r t m e n t o f C i v i l E n g i n e e r i n g U n i v e r s i t y O f M e m p h i s
2 Learning Objectives Design, compute, and solve FE problems on Freeway level of service Vehicle signal change interval Stopping Sight Distance Traffic flow relationship Gravity model (Trip Distribution) Logit model (Mode Choice) Traffic Safety
3 Primary Types of Uninterrupted Flow Facilities Freeways Pure uninterrupted flow Multilane Highways Sections of multilane highways (four or six lane) that are more than two miles from the nearest point of fixed operation Rural Two-lane Highways Sections of two-lane highways (one lane in each direction) that are more than two miles from the nearest point of fixed operation
4 Capacity The capacity of a facility is the maximum hourly rate at which persons or vehicles reasonably can be expected to traverse a point or a uniform section of a lane or roadway during a given time period under prevailing roadway, traffic, and control conditions. (HCM 2000)
5 Capacity Under Ideal Conditions
6 Service Flow Rate Illustration
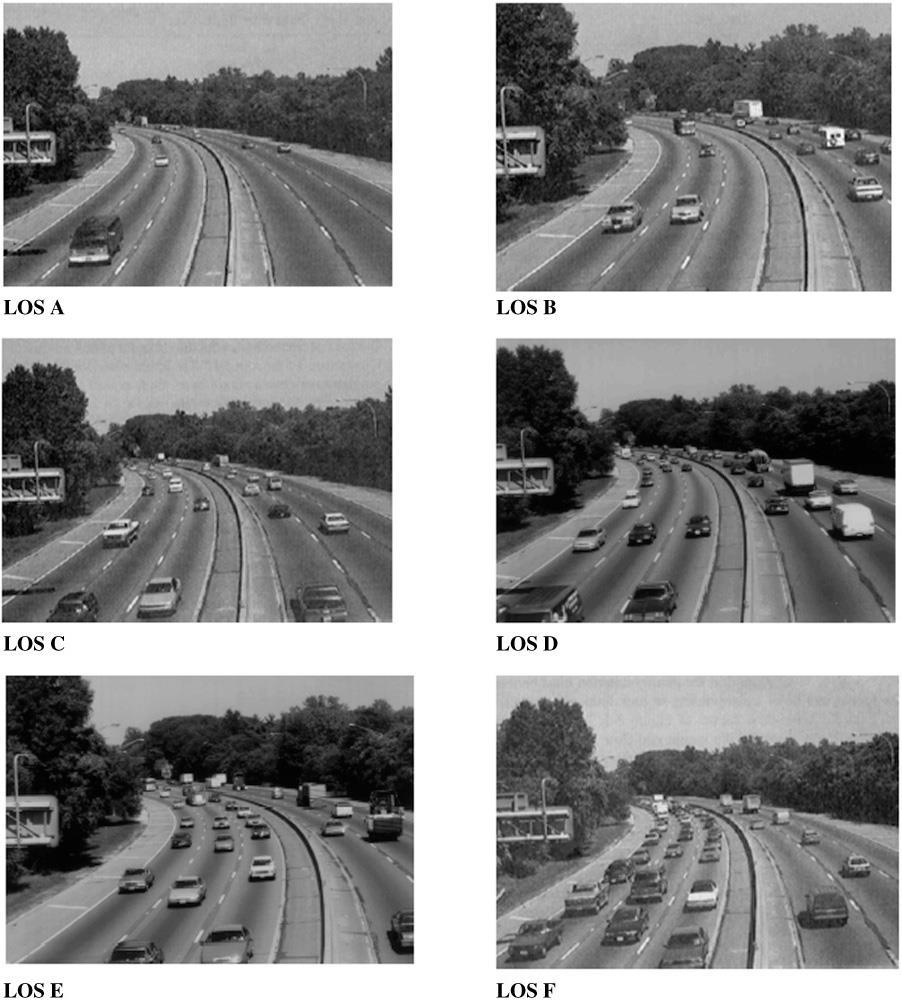
7 The Level of Service Concept A quality measure describing operational conditions within a traffic stream, generally in terms of such service measures as speed and travel time, freedom to maneuver, traffic interruptions, and comfort and convenience (HCM 2010). Rating scale A-F indicate best to worst operation
8
9 LOS Estimation: Freeways
10 Equations for LOS Estimation-Freeways
11 LOS Estimation: Multilane Highways
12 Maximum Service Flow Rate: Basic Freeway Sections
13 Factors Influencing LOS Volume Lane width Lateral obstructions Traffic composition Grade Speed
14 Types of Analysis Operational Analysis Service Flow Rate and Service Volume Analysis Design Analysis
15 Operational Analysis Flow Rate: Where: v p = v p = 15-minute passenger-car equivalent flow rate (pc/h/ln) V = hourly volume in the given direction of flow (vph) PHF = peak-hour factor N = number of lanes in the given direction of flow f HV = an adjustment factor for th presence of heavy vehicles f p = an adjustment factor to account for the fact that all drivers of the facility may not be commuters or regular users. *Basis for analysis is peak 15 min flow rate. V PHF N f HV f p
16 Example: Graphical Solution Speed: 62 mph Density: 29 pc/mi/lane LOS: D S = ( ) 2 = 62.7 mi/h
17 Design Analysis N i = DDHV MSF i PHF f HV f p Where: Ni = number of lanes required (in one direction) to provide LOS i DDHV = directional design hour volume, veh/h
18 Basic Freeway Segment Characteristics Ideal conditions for maximum service flow rate: Minimum interchange spacing 2 miles Only passenger cars Lane widths 12 feet Lateral obstructions 6 ft from roadway edge Level terrain (grades < 2%) Drivers typical of weekday (regular) traffic 10 or more lanes in urban areas **removed in HCM2010
19 Free Flow Speed: Basic Freeway Segments FFS = 75.4 f LW f LC 3.22TRD 0.84 *HCM2010 Where: FFS = estimated free flow speed in mph. BFFS = estimated base free flow speed in mph (75 mph for rural freeways, 70 mph for urban based on HCM recommendations). f LW = adjustment for lane width (if less than 12 ft), mph. f LC = adjustment for right side lateral clearance ( if less than 6 ft), mph. f N = adjustment for # of lanes (if less than 5 in one direction), mph. f ID = adjustment for interchange density if < 2 mi, mph. TRD = total ramp density (ramps/mi)
20 Adjustment for Lane Width: Freeway
21 Adjustment for Lateral Clearance : Freeway
22 Total Ramp Density Total number of on-ramps and off-ramps within 3 miles of the mid-point of the study segment divided by 6 miles Ramp density is a surrogate measure that relates to the intensity of land use activity in the vicinity of study segment
23 Multilane Highway Characteristics Ideal conditions for maximum service flow rate: Lane widths 12 feet Total lateral clearance 12 feet Divided highway No access points Only passenger cars in traffic stream Regular roadway users
24 Heavy Vehicle Effects: f HV 1 P T ( E T 1 1) P R ( E R 1) P T, P R = proportion of trucks and buses, and RV s E T, E R = PCEs for trucks and buses, and RV s ¼
25 Table Passenger-Car Equivalents for Trucks and Buses on Upgrades
26 Table (continued) Passenger-Car Equivalents for Trucks and Buses on Upgrades
27 Table Passenger-Car Equivalents for RVs on Upgrades
28 Table Passenger-Car Equivalents for Trucks and Buses on Downgrades
29 HCM2010
30 Example: FFS on Freeway Given: Six-lane urban freeway (3 in each direction) Lane width = 11 ft Right-side lateral clearance = 2 ft from the pavement edge Commuter traffic (regular users) Find FFS
31 Example: LOS of Basic Freeway (1) Given: Four-lane freeway (2 in each direction) Lane width = 11 ft Right-side lateral clearnece = 2 ft Commuter traffic (regular users) Peak-hour, peak-direction demand volume = 2,000 veh/h 5% trucks, 0% RVs PHF = 0.92 TRD = 4 ramps/mile Rolling terrain Find: LOS
32 Example: LOS of Basic Freeway (2) Step-1: Input Data All the input data is given in the previous slide Step-2: Compute FFS FFS = 75.4-f lw -f lc -3.22(TRD) 0.84 FFS = (4) 0.84 FFS = 60.8 mi/hr Step-3: Select FFS Curve FFS>57.5 and less than 62.5, so 60 mi/h curve will be used
33 Example: LOS of Basic Freeway (3) Step-4: Adjust Demand Volume V = 2000 veh/hr PHF = 0.92 f p = 1.0 (commuter traffic) N = 2 v p = V PHF N f HV f p f HV = 1/[1+0.05(2.5-1)+0] = 0.93 Vp = 1,169 pc/h/lane. f HV 1 P T ( E T 1 1) P R ( E R 1)
34 Step-5: Estimate Speed and Density Density = 1169/60 = 19.5 pc/mi/lane Determine LOS Operates at LOS C Though close to B No improvement is needed
35 Vehicle Signal Change Interval Change Interval (Yellow) This interval allows that is one safe stopping distance away from the STOP line when GREEN is withdrawn to continue at the approach speed and enter the intersection legally on yellow. y = t + v 2a + (64.4 G) Where, y-> length of the yellow interval t-> driver reaction time, s v -> 85 th percentile speed of approaching vehicles or speed limit in ft/sec a-> decelleration rate of vehicles, ft/sec 2 G-> Grade of approach, %
36 Vehicle Signal Clearance Interval Assuming that a vehicle has just entered the intersection legally on yellow, the all-red must provide sufficient time for the vehicle to cross the intersection and clear its back bumper past the far curb line (crosswalk line) before conflicting vehicles that are given GREEN. All Red = AR = w + L v L = length of the clearing vehicle, normally 20 feet W = width of the intersection in feet, measured from the upstream stop bar to the downstream extended edge of pavement w P
37 Stopping Sight Distance Stopping sight distance is composed of how many distances? What are they? Distance traveled during perception/reaction time Distance required to physically brake vehicle Reaction time distance Braking distance SSD = 1.47Vt + V 2 30({a/32.2} ± G) V is in mph
38 Example :Stopping sight distance A section of highway with 1.5% down grade, and design speed of 70 mph. Find the stopping sight distance when the driver reaction time is 2sec, driver eye height is 4ft, and object height is 6 inches.
39 Flow(veh/hr) Speed (miles/hr) Speed (miles/hr) V Traffic Flow Relationship V Density (veh/mi) K Q K Flow (veh/hr) Q Macroscopic: Speed (V): mi/hr Density (K): veh/mi/lane Flow (Q): veh/hr/lane Q= KV
40 Flow(veh/hr) Speed (miles/hr) Speed (miles/hr) V Traffic Flow Relationship (2) V f V f V 0 V 0 Q 0 K j Density (veh/mi) K Q Q m V 0 Macroscopic: Speed (V) Q m Flow (veh/hr) Q Density (K) K 0 K j K Flow (Q) Qm= V f K j /4
41 Question: Traffic Flow Speed on a road is given by S = D 1. If mean speed is 45mph find density 2. Find maximum capacity
42 4-Step Transportation Planning Trip generation is the process of determining the number of trips that will begin or end in each traffic zone within a study area. Trip distribution is the process by which trips generated in one zone are allocated to other zones in the study area. Mode choice determines the number of trips between zones that are made by different modes (such as highway and transit). Traffic Assignment is used to obtain expected traffic volume on the network is known as trip assignment.
43 Trip Distribution T ij = P i A j F ij K ij A j F ij K ij σn j=1 T ij = Trips Volume between i & j Pi = Total number of trips produced in zone i Aj = Total number of trips attracted to zone j F ij = Friction Factor (inverse function of travel time between i and j) K ij = Socioeconomic Adjustment Factor
44 Trip Distribution-Example Zone Total Production Attraction Zone
45 Fij Matrix (Inverse Square Fn) Zone Zone

46 Tij Matrix Zone Sum Target Sum
47 Balance Iteration#1 Iteration#1 Zone Sum Target Ratio Sum Target Ratio Iteration#1.1 Zone Sum Target Ratio Sum Target Ratio
48 Balance Iteration#2 Iteration#2 Zone Sum Target Ratio Sum Target Ratio Iteration#2.2 Zone Sum Target Ratio Sum Target Ratio
49 Mode Choice The choice of mode is a complex process that depends upon factors such as Income Availability of transit service Auto ownership Cost Comfort, convenience, and safety Relative advantage of one mode over other How do we quantify the attractiveness of a mode Utility
50 Utility Definition The attractiveness as a function of Attributes travel time, cost, and other mode specific parameters Characteristics Income, auto ownership or other user parameters Functional form of Utility Where Ux: Utility of mode x a i : Coefficient of attribute X i : Attribute or characteristic value n: Number of attributes n U x = a i X i i=1
51 Numerical Example-1 (1) Suppose that an individual can travel to work by driving alone, carpooling, or riding the bus. Assume that the relevant attributes of these modes are travel time travel cost income
52 Numerical Example-1 (2) Let T denote door-to-door travel time in hours, C denote travel cost in dollars, and Y denote annual income in thousands of dollars per year. Let the utility function be U(T,C,Y) = -T - 5C/Y
 ($) Drive Alone are as following: Mode Time (T) (hours) Cost (C)($) Drive Alone 0.5 2 Carpool 0.75 1 Bus 1 0.")
53 Numerical Example-1 (3) Suppose the values of travel time and cost for the available modes are: Time (T) Cost (C) Mode (hours) ($) Drive Alone are as following: Mode Time (T) (hours) Cost (C)($) Drive Alone Carpool Bus
54 Numerical Example-1 (4) If income is $40,000 per year, for example, the value of U for drive alone is (2.00)/40 = The following table shows the value of U corresponding to each mode for an individual whose income is $40,000 per year (Y = 40) and an individual whose income is $10,000 per year (Y = 10):
55 Numerical Example-1 (5) Mode Time (T) (hours) Cost (C)($) Drive Alone Carpool Bus U(T,C,Y) = -T - 5C/Y Mode Y = 40 Y = 10 Drive Alone Carpool Bus
56 Numerical Example-1 (6) The high-income individual chooses to drive alone (because drive alone has the highest utility for this individual), and the low-income individual chooses to carpool Mode Y = 40 Y = 10 Drive Alone Carpool Bus
57 Numerical Example-1 (7) Note that all utilities are negative because U consists of (generalized) costs of travel but excludes the value of reaching the destination. In this case, the highest value of U is the one that is least negative.
58 Probability of Choosing a Mode Probability of choosing a mode i Where Ui: Utility of mode i j: All available modes
 Prob (Y=10) Drive Alone -0.75-1.5 0.386 0.293 Carpool -0.88-1.25 0.341 0.376 Bus -0.84-1.38 0. 274 0.")
59 Probability of Mode Choice Example If we have two modes then the probability of choosing each mode is given by Mode Y = 40 Y = 10 Prob (Y=40) Prob (Y=10) Drive Alone Carpool Bus
60 Crash Rate at Intersection Represented as Crash Rate per Million Entering Vehicles (RMEV) RMEV = A 1,000,000 V Where A: Number of crashes at a location in a given time period Total crash or by crash type V = ADT * 365 ADT: Average Daily Traffic at the intersection
61 Example: RMEV The number of crashes recorded at an intersection in a year was 23, and average 24 hour volume entering from all approaches was Determine Crash Rate per Million Entering Vehicles (RMEV) 23 1,000,000 RMEV = = 9.69 crashes/million entering vehicles
62 Crash Rate at Roadway Segments Represented as Crash Rate per hundred Million Vehicle Miles (RMVM) Where RMEV = A 1,000,000 VMT A: Number of crashes at a location in a given time period Total crash or by crash type V = ADT * 365 VMT: Vehicle Miles Travelled VMT = ADT*Length of the road*number of days ADT: Average Daily Traffic at the intersection
63 Example: RMVM It is observed that 40 traffic crashes occurred on a 17.5 mile long section of a highway in one year. The ADT on the section was 5000 vehicles. Determine the rate of crashes per 100 million vehicle-miles Determine the rate of fatal crashes per 100 million vehiclemiles if 5% of the crashes involved fatalities RMEV T = 40 1,00,000, = crashes per 100 million veh mi RMEV F = = 6.26 crashes per 100 million veh mi
64 Crash Reduction Crashes Prevented = N CR ADT After Improvement ADT Before Improvement Where N: Expected number of crashes if countermeasure is not implemented and if the traffic volume remains the same CR: Overall crash reduction factor for multiple mutually exclusive improvements CR = CR 1 + (1 CR 1 )*CR 2 +(1-CR 1 )(1-CR 2 ) CR 3 + +(1- CR 1 )* 1 CR m 1 CR m CRi: Crash Reduction Factor for a specific countermeasure i m: Number of countermeasures at the site.
65 Example Crash Reduction At a single location three countermeasures with CRs of 40%, 28%, and 20% are proposed. Determine the overall CR factor? CR = 0.4+(1-0.4)*0.28+(1-0.4)*(1-0.28)*0.2 = 0.66
Lecture 4: Capacity and Level of Service (LoS) of Freeways Basic Segments. Prof. Responsável: Filipe Moura
 of Freeways Basic Segments. Prof. Responsável: Filipe Moura") Lecture 4: Capacity and Level of Service (LoS) of Freeways Basic Segments Prof. Responsável: Filipe Moura Engenharia de Tráfego Rodoviário Lecture 4 - Basic Freeway segments 1 CAPACITY AND LEVEL OF SERVICE
Lecture 4: Capacity and Level of Service (LoS) of Freeways Basic Segments Prof. Responsável: Filipe Moura Engenharia de Tráfego Rodoviário Lecture 4 - Basic Freeway segments 1 CAPACITY AND LEVEL OF SERVICE
Chapter 6. CEE 320 Anne Goodchild. Spring 2008 CEE 320
 Chapter 6 Freeway Level of Service Anne Goodchild Definitions Level of Service (LOS) Chief measure of quality of service Describes operational conditions within a traffic stream. Does not include safety
JCE 4600 Basic Freeway Segments
 JCE 4600 Basic Freeway Segments HCM Applications What is a Freeway? divided highway with full control of access two or more lanes for the exclusive use of traffic in each direction no signalized or stop-controlled
MULTILANE HIGHWAYS. Highway Capacity Manual 2000 CHAPTER 21 CONTENTS
 CHAPTER 2 MULTILANE HIGHWAYS CONTENTS I. INTRODUCTION...2- Base Conditions for Multilane Highways...2- Limitations of the Methodology...2- II. METHODOLOGY...2- LOS...2-2 Determining FFS...2-3 Estimating
Multilane Highways. Lecture Notes in Transportation Systems Engineering. Prof. Tom V. Mathew. 1 Introduction 1
 Multilane Highways Lecture Notes in Transportation Systems Engineering Prof. Tom V. Mathew Contents 1 Introduction 1 2 Multilane Highways 2 2.1 Highway Classification............................... 2 2.2
Capacity and Level of Service for Highway Segments (I)
") Capacity and Level of Service for Highway Segments (I) 1 Learn how to use the HCM procedures to determine the level of service (LOS) Become familiar with highway design capacity terminology Apply the equations
Capacity and Level of Service for Highway Segments (I) 1 Learn how to use the HCM procedures to determine the level of service (LOS) Become familiar with highway design capacity terminology Apply the equations
Interchange Operations Study
 CUY 480 14.32 PID No. 102053 Ohio Department of Transportation District 12 550 Transportation Boulevard Garfield Heights, OH 44125 5396 Interchange Operations Study Analysis Summary August 2016 8101 N.
Two Lane Highways Procedures from 2000 Highway Capacity Manual
 Two Lane Highways Procedures from 2000 Highway Capacity Manual Two lane-1 Maximum flow rates on two-way streets: 1700 cars/hour in one direction and 3200 in both directions Level of Service is based on:
Chapter III Geometric design of Highways. Tewodros N.
 Chapter III Geometric design of Highways Tewodros N. www.tnigatu.wordpress.com tedynihe@gmail.com Introduction Appropriate Geometric Standards Design Controls and Criteria Design Class Sight Distance Design
P07033 US 50 EB Weaving Analysis between El Dorado Hills and Silva Valley Ramp Metering Analysis for US 50 EB On-Ramp at Latrobe Road
 180 Grand Avenue, Suite 250 428 J Street, Suite 500 Oakland, CA 94612 Sacramento, CA 95814 510.839.1742 916.266.2190 510.839.0871 fax 916.266.2195 Dowling Associates, Inc. www.dowlinginc.com traffic@dowlinginc.com
Transport Modes and Technologies A Walking Tour on Capacity, LOS. Urban Transportation Planning MIT Course 1.252j/11.
 Transport Modes and Technologies A Walking Tour on Capacity, LOS Urban Transportation Planning MIT Course 1.252j/11.380j Fall 2006 Mikel Murga, MIT Research Associate Transport Modes and Technologies Private
Sight Distance. A fundamental principle of good design is that
 Session 9 Jack Broz, PE, HR Green May 5-7, 2010 Sight Distance A fundamental principle of good design is that the alignment and cross section should provide adequate sight lines for drivers operating their
Engineering Dept. Highways & Transportation Engineering
 The University College of Applied Sciences UCAS Engineering Dept. Highways & Transportation Engineering (BENG 4326) Instructors: Dr. Y. R. Sarraj Chapter 4 Traffic Engineering Studies Reference: Traffic
CDOT SPF Development and 10 Years of Application. A Practical Approach...
 CDOT SPF Development and 10 Years of Application A Practical Approach...... Jake Kononov, P.E. Ph.D. Bryan K. Allery, P.E. National SPF Summit Chicago 2009 In Order to Manage Safety Effectively, We Need
Table Existing Traffic Conditions for Arterial Segments along Construction Access Route. Daily
 5.8 TRAFFIC, ACCESS, AND CIRCULATION This section describes existing traffic conditions in the project area; summarizes applicable regulations; and analyzes the potential traffic, access, and circulation
State Highway 32 East TIGER Discretionary Grant Application APPENDIX C - BENEFIT COST ANALYSIS REPORT
 State Highway 32 East TIGER Discretionary Grant Application APPENDIX C - BENEFIT COST ANALYSIS REPORT April 2016 I. COST-EFFECTIVENESS ANALYSIS A Benefit-Cost Analysis (BCA) was conducted in conformance
Assignment 4:Rail Analysis and Stopping/Passing Distances
 CEE 3604: Introduction to Transportation Engineering Fall 2011 Date Due: September 26, 2011 Assignment 4:Rail Analysis and Stopping/Passing Distances Instructor: Trani Problem 1 The basic resistance of
JCE4600 Fundamentals of Traffic Engineering
 JCE4600 Fundamentals of Traffic Engineering Introduction to Geometric Design Agenda Kinematics Human Factors Stopping Sight Distance Cornering Intersection Design Cross Sections 1 AASHTO Green Book Kinematics
MEMORANDUM. Figure 1. Roundabout Interchange under Alternative D
 MEMORANDUM Date: To: Liz Diamond, Dokken Engineering From: Subject: Dave Stanek, Fehr & Peers Western Placerville Interchanges 2045 Analysis RS08-2639 Fehr & Peers has completed a transportation analysis
Traffic Engineering Study
 Traffic Engineering Study Bellaire Boulevard Prepared For: International Management District Technical Services, Inc. Texas Registered Engineering Firm F-3580 November 2009 Executive Summary has been requested
STOPPING SIGHT DISTANCE AS A MINIMUM CRITERION FOR APPROACH SPACING
 STOPPING SIGHT DISTANCE AS A MINIMUM CRITERION prepared for Oregon Department of Transportation Salem, Oregon by the Transportation Research Institute Oregon State University Corvallis, Oregon 97331-4304
Interstate 85 Widening Phase III Interchange Modification Report Exit 98 Frontage Road Off-Ramp. Cherokee County, SC
 Interstate 85 Widening Phase III Interchange Modification Report Exit 98 Frontage Road Off-Ramp Cherokee County, SC Prepared for: South Carolina Department of Transportation Prepared by: Stantec Consulting
Conventional Approach
 Session 6 Jack Broz, PE, HR Green May 5-7, 2010 Conventional Approach Classification required by Federal law General Categories: Arterial Collector Local 6-1 Functional Classifications Changing Road Classification
Appendix J Traffic Impact Study
 MRI May 2012 Appendix J Traffic Impact Study Level 2 Traffic Assessment Limited Impact Review Appendix J [This page was left blank intentionally.] www.sgm-inc.com Figure 1. Site Driveway and Trail Crossing
Interstate Operations Study: Fargo-Moorhead Metropolitan Area Simulation Results
 NDSU Dept #2880 PO Box 6050 Fargo, ND 58108-6050 Tel 701-231-8058 Fax 701-231-6265 www.ugpti.org www.atacenter.org Interstate Operations Study: Fargo-Moorhead Metropolitan Area 2025 Simulation Results
Interchange Operations Study MOT (I-75 & Austin Boulevard) ODOT District 7 PID 99213
 ODOT District 7 PID 99213") Interchange Operations Study MOT-75-0.76 (I-75 & Austin Boulevard) ODOT District 7 PID 99213 Table of Contents MOT-75-0.76 Interchange Operations Study (IOS) 1.0 Project Summary... 2 2.0 Study Area...
Interchange Operations Study MOT-75-0.76 (I-75 & Austin Boulevard) ODOT District 7 PID 99213 Table of Contents MOT-75-0.76 Interchange Operations Study (IOS) 1.0 Project Summary... 2 2.0 Study Area...
Driveway Spacing and Traffic Operations
 Driveway Spacing and Traffic Operations ABSTRACT JEROME S. GLUCK, GREG HAAS, JAMAL MAHMOOD Urbitran Associates 71 West 23rd Street, 11th Floor New York, NY 10010 urbitran@ix.netcom.com HERBERT S. LEVINSON
IMPROVEMENT CONCEPTS
 IMPROVEMENT CONCEPTS for the South Novato Transit Hub Study Prepared by: January 11, 2010 DKS Associates With Wilbur Smith Associates IMPROVEMENT CONCEPTS Chapter 1: Introduction 1. INTRODUCTION The strategic
American Association of State Highway and Transportation Officials. June Dear Customer:
 American Association of State Highway and Transportation Officials John R. Njord, President Executive Director Utah Department of Transportation John Horsley Executive Director June 2004 Dear Customer:
1. INTRODUCTION 2. PROJECT DESCRIPTION CUBES SELF-STORAGE MILL CREEK TRIP GENERATION COMPARISON
 CUBES SELF-STORAGE MILL CREEK TRIP GENERATION COMPARISON 1. INTRODUCTION This report summarizes traffic impacts of the proposed CUBES Self-Storage Mill Creek project in comparison to the traffic currently
APPENDIX C1 TRAFFIC ANALYSIS DESIGN YEAR TRAFFIC ANALYSIS
 APPENDIX C1 TRAFFIC ANALYSIS DESIGN YEAR TRAFFIC ANALYSIS DESIGN YEAR TRAFFIC ANALYSIS February 2018 Highway & Bridge Project PIN 6754.12 Route 13 Connector Road Chemung County February 2018 Appendix
Date: February 7, 2017 John Doyle, Z-Best Products Robert Del Rio. T.E. Z-Best Traffic Operations and Site Access Analysis
 Memorandum Date: February 7, 07 To: From: Subject: John Doyle, Z-Best Products Robert Del Rio. T.E. Z-Best Traffic Operations and Site Access Analysis Introduction Hexagon Transportation Consultants, Inc.
Appendix G Traffic Study Methodology
 REVISED DRAFT ENVIRONMENTAL IMPACT REPORT/ Appendix G Traffic Forecasting Model Methodology In addition to the existing/baseline condition (year 2005), a level of service (LOS) analysis was conducted for
Freeway Weaving and Ramp Junction Analysis
 TEXAS TECH UNIVERSITY Freeway Weaving and Ramp Junction Analysis Along IH 27 at Plainview, TX Hao Xu, Jared A. Squyres, Wesley Kumfer, and Hongchao Liu 7/15/2011 Table of Contents Project Description...
MERIVALE PRIORITY SQUARE 2852 MERIVALE ROAD CITY OF OTTAWA TRANSPORTATION BRIEF. Prepared for: ONT Inc. 25 Winding Way Nepean, Ontario K2C 3H1
 MERIVALE PRIORITY SQUARE 2852 MERIVALE ROAD CITY OF OTTAWA TRANSPORTATION BRIEF Prepared for: 2190986ONT Inc. 25 Winding Way Nepean, Ontario K2C 3H1 October 6, 2010 110-502 Report_1.doc D. J. Halpenny
Horizontal Alignment
 Session 8 Jim Rosenow, PE, Mn/DOT March 5-7, 2010 Horizontal Alignment The shortest distance between two points is: A straight line The circumference of a circle passing through both points and the center
The major roadways in the study area are State Route 166 and State Route 33, which are shown on Figure 1-1 and described below:
 3.5 TRAFFIC AND CIRCULATION 3.5.1 Existing Conditions 3.5.1.1 Street Network DRAFT ENVIRONMENTAL IMPACT REPORT The major roadways in the study area are State Route 166 and State Route 33, which are shown
Highway 18 BNSF Railroad Overpass Feasibility Study Craighead County. Executive Summary
 Highway 18 BNSF Railroad Overpass Feasibility Study Craighead County Executive Summary October 2014 Highway 18 BNSF Railroad Overpass Feasibility Study Craighead County Executive Summary October 2014 Prepared
ZINFANDEL LANE / SILVERADO TRAIL INTERSECTION TRAFFIC ANALYSIS
 ZINFANDEL LANE / SILVERADO TRAIL INTERSECTION TRAFFIC ANALYSIS UPDATED TRAFFIC STUDY FOR THE PROPOSED RAYMOND VINEYARDS WINERY USE PERMIT MODIFICATION #P11-00156 AUGUST 5, 2014 PREPARED BY: OMNI-MEANS,
Metropolitan Freeway System 2013 Congestion Report
 Metropolitan Freeway System 2013 Congestion Report Metro District Office of Operations and Maintenance Regional Transportation Management Center May 2014 Table of Contents PURPOSE AND NEED... 1 INTRODUCTION...
Helping Autonomous Vehicles at Signalized Intersections. Ousama Shebeeb, P. Eng. Traffic Signals Engineer. Ministry of Transportation of Ontario
 Helping Autonomous Vehicles at Signalized Intersections Ousama Shebeeb, P. Eng. Traffic Signals Engineer Ministry of Transportation of Ontario Paper Prepared for Presentation At the NEXT GENERATION TRANSPORTATION
Traffic Impact Study Speedway Gas Station Redevelopment
 Traffic Impact Study Speedway Gas Station Redevelopment Warrenville, Illinois Prepared For: Prepared By: April 11, 2018 Table of Contents 1. Introduction... 1 2. Existing Conditions... 4 Site Location...
Corridor Sketch Summary
 Corridor Sketch Summary SR 241: I-82 Jct (Sunnyside) to SR 24 Jct Corridor Highway No. 241 Mileposts: 7.53 to 25.21 Length: 17.65 miles Corridor Description The seventeen and one-half mile corridor begins
2016 Congestion Report
 2016 Congestion Report Metropolitan Freeway System May 2017 2016 Congestion Report 1 Table of Contents Purpose and Need...3 Introduction...3 Methodology...4 2016 Results...5 Explanation of Percentage Miles
APPLICATION OF A PARCEL-BASED SUSTAINABILITY TOOL TO ANALYZE GHG EMISSIONS
 APPLICATION OF A PARCEL-BASED SUSTAINABILITY TOOL TO ANALYZE GHG EMISSIONS Jung Seo, Hsi-Hwa Hu, Frank Wen, Simon Choi, Cheol-Ho Lee Research & Analysis Southern California Association of Governments 2012
One Harbor Point Residential
 Residential Gig Harbor, WA Transportation Impact Analysis January 23, 2017 Prepared for: Neil Walter Company PO Box 2181 Tacoma, WA 98401 Prepared by: TENW Transportation Engineering NorthWest 11400 SE
Travel Time Savings Memorandum
 04-05-2018 TABLE OF CONTENTS 1 Background 3 Methodology 3 Inputs and Calculation 3 Assumptions 4 Light Rail Transit (LRT) Travel Times 5 Auto Travel Times 5 Bus Travel Times 6 Findings 7 Generalized Cost
The Highway Safety Manual: Will you use your new safety powers for good or evil? April 4, 2011
 The Highway Safety Manual: Will you use your new safety powers for good or evil? April 4, 2011 Introductions Russell Brownlee, M.A. Sc., FITE, P. Eng. Specialize in road user and rail safety Transportation
Simulating Trucks in CORSIM
 Simulating Trucks in CORSIM Minnesota Department of Transportation September 13, 2004 Simulating Trucks in CORSIM. Table of Contents 1.0 Overview... 3 2.0 Acquiring Truck Count Information... 5 3.0 Data
A Gap-Based Approach to the Left Turn Signal Warrant. Jeremy R. Chapman, PhD, PE, PTOE Senior Traffic Engineer American Structurepoint, Inc.
 A Gap-Based Approach to the Left Turn Signal Warrant Jeremy R. Chapman, PhD, PE, PTOE Senior Traffic Engineer American Structurepoint, Inc. March 5, 2019 - The problem: Existing signalized intersection
COMPARISON OF FREE FLOW SPEED ESTIMATION MODELS
 COMPARISON OF FREE FLOW SPEED ESTIMATION MODELS Usman Tasiu Abdurrahman 1, Othman Che Puan 2* Muttaka Na iya Ibrahim 3 1,2,3 Faculty of Civil Engineering, Universiti Teknologi Malaysia, 81310 Skudai, Johor,
Interstate Operations Study: Fargo-Moorhead Metropolitan Area Simulation Output
 NDSU Dept #2880 PO Box 6050 Fargo, ND 58108-6050 Tel 701-231-8058 Fax 701-231-6265 www.ugpti.org www.atacenter.org Interstate Operations Study: Fargo-Moorhead Metropolitan Area 2015 Simulation Output Technical
Regional Transportation System The regional transportation system is discussed in Chapter 5, Section 5.7.
 6.7 TRAFFIC 6.7.1 Affected Environment Regional Transportation System The regional transportation system is discussed in Chapter 5, Section 5.7. Local Transportation System The proposed Dillingham Trail
POLICY FOR THE ESTABLISHMENT AND POSTING OF SPEED LIMITS ON COUNTY AND TOWNSHIP HIGHWAYS WITHIN MCHENRY COUNTY, ILLINOIS
 POLICY FOR THE ESTABLISHMENT AND POSTING OF SPEED LIMITS ON COUNTY AND TOWNSHIP HIGHWAYS WITHIN MCHENRY COUNTY, ILLINOIS MCHENRY COUNTY DIVISION OF TRANSPORTATION 16111 NELSON ROAD WOODSTOCK, IL 60098
LAWRENCE TRANSIT CENTER LOCATION ANALYSIS 9 TH STREET & ROCKLEDGE ROAD / 21 ST STREET & IOWA STREET LAWRENCE, KANSAS
 LAWRENCE TRANSIT CENTER LOCATION ANALYSIS 9 TH STREET & ROCKLEDGE ROAD / 21 ST STREET & IOWA STREET LAWRENCE, KANSAS TRAFFIC IMPACT STUDY FEBRUARY 214 OA Project No. 213-542 TABLE OF CONTENTS 1. INTRODUCTION...
Bennett Pit. Traffic Impact Study. J&T Consulting, Inc. Weld County, Colorado. March 3, 2017
 Bennett Pit Traffic Impact Study J&T Consulting, Inc. Weld County, Colorado March 3, 217 Prepared By: Sustainable Traffic Solutions, Inc. http://www.sustainabletrafficsolutions.com/ Joseph L. Henderson,
TRAFFIC AND TRANSPORTATION TECHNICAL MEMORANDUM
 TRAFFIC AND TRANSPORTATION TECHNICAL MEMORANDUM for ENVIRONMENTAL ASSESSMENT US 460 Bypass Interchange and Southgate Drive Relocation State Project No.: 0460-150-204, P101, R201, C501, B601; UPC 99425
CHAPTER 9: VEHICULAR ACCESS CONTROL Introduction and Goals Administration Standards
 9.00 Introduction and Goals 9.01 Administration 9.02 Standards 9.1 9.00 INTRODUCTION AND GOALS City streets serve two purposes that are often in conflict moving traffic and accessing property. The higher
INNOVATIVE APPROACH IN ROAD INFRASTRUCTURE SAFETY MANAGEMENT AND ROAD SAFETY IMPACT ASSESSMENT
 INNOVATIVE APPROACH IN ROAD INFRASTRUCTURE SAFETY MANAGEMENT AND ROAD SAFETY IMPACT ASSESSMENT www.ptvgroup.com Timo Hoffmann, PTV Group TSTS Road Safety Seminar, Bangkok, 2014-10-17 CRASH PREDICTION Tomorrow
Regional Transportation System The regional transportation system is discussed in Chapter 5, Section 5.7.
 6.7 TRAFFIC 6.7.1 Affected Environment Regional Transportation System The regional transportation system is discussed in Chapter 5, Section 5.7. Local Transportation System The proposed Dillingham Trail
Traffic, Transportation & Civil Engineering Ali R. Khorasani, P.E. P.O. Box 804, Spencer, MA 01562, Tel: (508)
") Associates Traffic, Transportation & Civil Engineering Ali R. Khorasani, P.E. P.O. Box 804, Spencer, MA 01562, Tel: (508) 885-5121 Ms. Teri Ford, Associate 800 Boylston Street, Suite 1570 Boston, MA July
Associates Traffic, Transportation & Civil Engineering Ali R. Khorasani, P.E. P.O. Box 804, Spencer, MA 01562, Tel: (508) 885-5121 Ms. Teri Ford, Associate 800 Boylston Street, Suite 1570 Boston, MA July
2 VALUE PROPOSITION VALUE PROPOSITION DEVELOPMENT
 2 VALUE PROPOSITION The purpose of the Value Proposition is to define a number of metrics or interesting facts that clearly demonstrate the value of the existing Xpress system to external audiences including
Collision Types of Motorcycle Accident and Countermeasures
 Proceedings of the 2 nd World Congress on Civil, Structural, and Environmental Engineering (CSEE 17) Barcelona, Spain April 2 4, 2017 Paper No. ICTE 115 ISSN: 2371-5294 DOI: 10.11159/icte17.115 Collision
BARRHAVEN FELLOWSHIP CRC 3058 JOCKVALE ROAD OTTAWA, ONTARIO TRANSPORTATION BRIEF. Prepared for:
 BARRHAVEN FELLOWSHIP CRC 3058 JOCKVALE ROAD OTTAWA, ONTARIO TRANSPORTATION BRIEF Prepared for: Barrhaven Fellowship CRC 3058 Jockvale Road Ottawa, ON K2J 2W7 December 7, 2016 116-649 Report_1.doc D. J.
CEE 320. Fall Horizontal Alignment
 Horizontal Alignment Horizontal Alignment Objective: Geometry of directional transition to ensure: Safety Comfort Primary challenge Transition between two directions Fundamentals Circular curves Superelevation
HCM Unsignalized Intersection Capacity Analysis 6: Brian Street & LC 111 5/26/2009
 6: Brian Street & LC 111 5/26/2009 Movement EBL EBR NBL NBT SBT SBR Volume (veh/h) 116 20 8 405 137 56 Sign Control Stop Free Free Grade 0% 0% 0% Peak Hour Factor 0.81 0.81 0.67 0.67 0.89 0.89 Hourly flow
(Refer Slide Time: 00:01:10min)
") Introduction to Transportation Engineering Dr. Bhargab Maitra Department of Civil Engineering Indian Institute of Technology, Kharagpur Lecture - 11 Overtaking, Intermediate and Headlight Sight Distances
Introduction to Transportation Engineering Dr. Bhargab Maitra Department of Civil Engineering Indian Institute of Technology, Kharagpur Lecture - 11 Overtaking, Intermediate and Headlight Sight Distances
VOA Vista Drive Residential housing Development TIA Project #13915 TABLE OF CONTENTS
 VOA Vista Drive Residential housing Development TIA Project #13915 TABLE OF CONTENTS Executive Summary... 2 Project Background... 2 Conditions... 2 Findings... 3 Recommendations... 4 Introduction... 6
Travel Demand Modeling at NCTCOG
 Travel Demand Modeling at NCTCOG Arash Mirzaei North Central Texas Council Of Governments for Southern Methodist University The ASCE Student Chapter October 24, 2005 Contents NCTCOG DFW Regional Model
AFFECTED SECTIONS OF MUTCD: Section 2C.36 Advance Traffic Control Signs Table 2C-4. Guidelines for Advance Placement of Warning Signs
 1 2 3 4 5 6 7 8 9 10 11 12 13 14 15 16 17 18 19 20 21 22 23 24 25 26 27 28 29 30 31 32 33 34 35 36 37 38 39 RWSTC June 2012 RW # 3 TOPIC: Advance Traffic Control Signs TECHNICAL COMMITTEE: Regulatory &
Level of Service Classification for Urban Heterogeneous Traffic: A Case Study of Kanapur Metropolis
 Level of Service Classification for Urban Heterogeneous Traffic: A Case Study of Kanapur Metropolis B.R. MARWAH Professor, Department of Civil Engineering, I.I.T. Kanpur BHUVANESH SINGH Professional Research
INTERCHANGE OPERTIONS STUDY Interstate 77 / Wallings Road Interchange
 INTERCHANGE OPERTIONS STUDY Interstate 77 / Wallings Road Interchange City of Broadview Heights, Cuyahoga County, Ohio Prepared For: City of Broadview Heights Department of Engineering 9543 Broadview Road
Support: The Crossbuck (R15-1) sign assigns right-of-way to rail traffic at a highway-rail grade crossing.
 sign assigns right-of-way to rail traffic at a highway-rail grade crossing.") TECHNICAL COMMITTEE: Railroad and Light Rail Transit Technical Committee DATE OF ACTION: June 25, 2004 TOPIC: Crossbuck with Yield or Stop Signs and Advance Signs. STATUS: Accepted by the National Committee
TECHNICAL COMMITTEE: Railroad and Light Rail Transit Technical Committee DATE OF ACTION: June 25, 2004 TOPIC: Crossbuck with Yield or Stop Signs and Advance Signs. STATUS: Accepted by the National Committee
2030 Multimodal Transportation Study
 2030 Multimodal Transportation Study City of Jacksonville Planning and Development Department Prepared by Ghyabi & Associates April 29,2010 Introduction Presentation Components 1. Study Basis 2. Study
4 COSTS AND OPERATIONS
 4 COSTS AND OPERATIONS 4.1 INTRODUCTION This chapter summarizes the estimated capital and operations and maintenance (O&M) costs for the Modal and High-Speed Train (HST) Alternatives evaluated in this
Figure 1 Map of intersection of SR 44 (Ravenna Rd) and Butternut Rd
 and Butternut Rd") Abbreviated Study District: 12 County: Geauga Route: SR 44 Section: 1.58 GEA 44 1.58 213 HSP # 47 (Rural Intersection) Prepared April 23, 215 By Bryan Emery Existing Conditions This study contains the
Abbreviated Study District: 12 County: Geauga Route: SR 44 Section: 1.58 GEA 44 1.58 213 HSP # 47 (Rural Intersection) Prepared April 23, 215 By Bryan Emery Existing Conditions This study contains the
Shirk Road at State Route 198 Interchange Analysis Tulare County, California
 Shirk Road at State Route 198 Interchange Analysis Tulare County, California DRAFT REPORT Prepared By Tulare County Association of Governments (TCAG) April 2013 Table of Contents Introduction:... 3 Project
(HIGHWAY GEOMETRIC DESIGN -1)
") LECTURE HOUR-21 TE-1(10CV56) UNIT-3 (HIGHWAY GEOMETRIC DESIGN -1) Typical Cross section of highway class: Typical two lane National or state highway (Rural section) Typical single lane road with paved
LECTURE HOUR-21 TE-1(10CV56) UNIT-3 (HIGHWAY GEOMETRIC DESIGN -1) Typical Cross section of highway class: Typical two lane National or state highway (Rural section) Typical single lane road with paved
Public Transportation Problems and Solutions in the Historical Center of Quito
 TRANSPORTATION RESEARCH RECORD 1266 205 Public Transportation Problems and Solutions in the Historical Center of Quito JACOB GREENSTEIN, Lours BERGER, AND AMIRAM STRULOV Quito, the capital of Ecuador,
APPENDIX B Traffic Analysis
 APPENDIX B Traffic Analysis Rim of the World Unified School District Reconfiguration Prepared for: Rim of the World School District 27315 North Bay Road, Blue Jay, CA 92317 Prepared by: 400 Oceangate,
D & B COMMERCIAL TRAFFIC IMPACT ANALYSIS
 D & B COMMERCIAL TRAFFIC IMPACT ANALYSIS TABLE OF CONTENTS I. Introduction...3 II. Project Description...3 III. Existing Conditions...3 IV. Future Traffic Conditions...8 V. Conclusions and Mitigation...14
EXECUTIVE SUMMARY. The following is an outline of the traffic analysis performed by Hales Engineering for the traffic conditions of this project.
 EXECUTIVE SUMMARY This study addresses the traffic impacts associated with the proposed Shopko redevelopment located in Sugarhouse, Utah. The Shopko redevelopment project is located between 1300 East and
Alpine Highway to North County Boulevard Connector Study
 Alpine Highway to North County Boulevard Connector Study prepared by Avenue Consultants March 16, 2017 North County Boulevard Connector Study March 16, 2017 Table of Contents 1 Summary of Findings... 1
APPENDIX VMT Evaluation
 APPENDIX 2.7-2 VMT Evaluation MEMORANDUM To: From: Mr. Jonathan Frankel New Urban West, Incorporated Chris Mendiara LLG, Engineers Date: May 19, 2017 LLG Ref: 3-16-2614 Subject: Villages VMT Evaluation
Railroad Impact Study
 Railroad Impact Study Ryan Huebschman, PE, PTOE Jason O Neill November 21, 2016 Study Impetus CSXT to lease and improve rail line between Louisville and Indianapolis Rail improvements will allow CSXT to
SPEED CUSHION POLICY AND INSTALLATION PROCEDURES FOR RESIDENTIAL STREETS
 SPEED CUSHION POLICY AND INSTALLATION PROCEDURES FOR RESIDENTIAL STREETS CITY OF GRAND PRAIRIE TRANSPORTATION SERVICES DEPARTMENT SPEED CUSHION INSTALLATION POLICY A. GENERAL Speed cushions are an effective
SN01 STANDARD NOTES CITY OF SAMMAMISH 2018 INTERSECTION IMPROVEMENTS PROJECT NO. DATE BY APPR REVISION COSA0023 KING COUNTY WASHINGTON
 STANDARD NOTES SN01 2 OF 17 STANDARD NOTES SN02 3 OF 17 SITE PREP & T.E.S.C. NOTES GENERAL NOTES SITE PREP & T.E.S.C. PLAN SP01 4 OF 17 SITE PREP & T.E.S.C. NOTES GENERAL NOTES SITE PREP & T.E.S.C. PLAN
SN01 STANDARD NOTES CITY OF SAMMAMISH 2018 FLASHING YELLOW ARROW SIGNALS PROJECT NO. DATE BY APPR REVISION COSA0023 KING COUNTY WASHINGTON
 STANDARD NOTES SN01 2 OF 8 ROADWAY PLAN PL01 3 OF 8 ROADWAY PLAN PL02 4 OF 8 LANE 10 105 150 205 270 450 500 550 11 12 SHOULDER 115 125 MINIMUM LANE CLOSURE TAPER LENGTH = L 165 225 295 180 245 320 5 25
Technical Memorandum Analysis Procedures and Mobility Performance Measures 100 Most Congested Texas Road Sections What s New for 2015
 Technical Memorandum Analysis Procedures and Mobility Performance Measures 100 Most Congested Texas Road Sections Prepared by Texas A&M Transportation Institute August 2015 This memo documents the analysis
Sugarland Crossing Gwinnett County, Georgia
 Sugarland Crossing Gwinnett County, Georgia S IGNAL W ARRANT A NALYSIS For the Intersection of: Sugarloaf Parkway / Richards Middle School Driveway / Sugarland Crossing Main Site Driveway Prepared for:
Performance Measure Summary - Grand Rapids MI. Performance Measures and Definition of Terms
 Performance Measure Summary - Grand Rapids MI There are several inventory and performance measures listed in the pages of this Urban Area Report for the years from 1982 to 2014. There is no single performance
Performance Measure Summary - Toledo OH-MI. Performance Measures and Definition of Terms
 Performance Measure Summary - Toledo OH-MI There are several inventory and performance measures listed in the pages of this Urban Area Report for the years from 1982 to 2014. There is no single performance
Table of Contents. Traffic Impact Analysis Capital One Building at Schilling Place
 Traffic Impact Analysis Capital One Building at Schilling Place Table of Contents Executive Summary... 1 1. Introduction... 4 2. Project Description... 4 3. Background Information... 4 4. Study Scope...
Performance Measure Summary - Boise ID. Performance Measures and Definition of Terms
 Performance Measure Summary - Boise ID There are several inventory and performance measures listed in the pages of this Urban Area Report for the years from 1982 to 2014. There is no single performance
AusRAP assessment of Peak Downs Highway 2013
 AusRAP assessment of Peak Downs Highway 2013 SUMMARY The Royal Automobile Club of Queensland (RACQ) commissioned an AusRAP assessment of Peak Downs Highway based on the irap protocol. The purpose is to
TRAFFIC IMPACT ANALYSIS
 TRAFFIC IMPACT ANALYSIS Emerald Isle Commercial Development Prepared by SEPI Engineering & Construction Prepared for Ark Consulting Group, PLLC March 2016 I. Executive Summary A. Site Location The Emerald
Emergency Signal Warrant Evaluation: A Case Study in Anchorage, Alaska
 Emergency Signal Warrant Evaluation: A Case Study in Anchorage, Alaska by Jeanne Bowie PE, Ph.D., PTOE and Randy Kinney, PE, PTOE Abstract The Manual on Uniform Traffic Control Devices (MUTCD), Chapter
What is ELToD and Why Use it? Toll Choice Key Concepts. ELToD Applications. SW 10 th Street. ELToD Future Enhancements
 June 16, 2017 What is ELToD and Why Use it? Toll Choice Key Concepts ELToD Applications SW 10 th Street ELToD Future Enhancements 2 ELToD (Express Lanes Time of Day) Model is a traffic assignment model
DELINEATOR REFERENCE POINT 200' TYPICAL SPACING (YELLOW DELINEATORS) END OF MERGE LANE TAPER DELINEATOR REFERENCE POINT
 END OF MERGE LANE TAPER DELINEATOR REFERENCE POINT") 200' TYP. 0' < EACH SIDE BOTH ROADWAYS END OF MERGE LANE TAPER TYPICAL FOR ALL 2-LANE MERGES EXCEPT WHERE THERE IS A MERGE FROM THE RIGHT AND NO OFFSET IN THE THROUGH LANES END OF MERGE LANE TAPER 200'
200' TYP. 0' < EACH SIDE BOTH ROADWAYS END OF MERGE LANE TAPER TYPICAL FOR ALL 2-LANE MERGES EXCEPT WHERE THERE IS A MERGE FROM THE RIGHT AND NO OFFSET IN THE THROUGH LANES END OF MERGE LANE TAPER 200'
STH 60 Northern Reliever Route Feasibility Study Report
 #233087 v3 STH 60 Northern Reliever Route Feasibility Study Report Washington County Public Works Committee Meeting September 28, 2016 1 STH 60 Northern Reliever Route Feasibility Study Hartford Area Development