Interchange Operations Study
|
|
|
- Angelina Norman
- 5 years ago
- Views:
Transcription

1 CUY PID No Ohio Department of Transportation District Transportation Boulevard Garfield Heights, OH Interchange Operations Study Analysis Summary August N. High Street, #150 Columbus, OH 43235
2 Table of Contents Ohio Department of Transportation CUY PID No Contents 1.0 Introduction Purpose and Need Existing Conditions Roadways/Interchanges Intersections Traffic Analysis Freeway Analysis Intersection Analysis Storage Length Analysis Summary and Recommendations Appendices Appendix A Project Exhibits Appendix B Certified Traffic Volumes Appendix C HCS Freeway Analysis Appendix D Synchro Operations Analysis Appendix E Storage Length Calculations Interchange Operations Study i July 2016
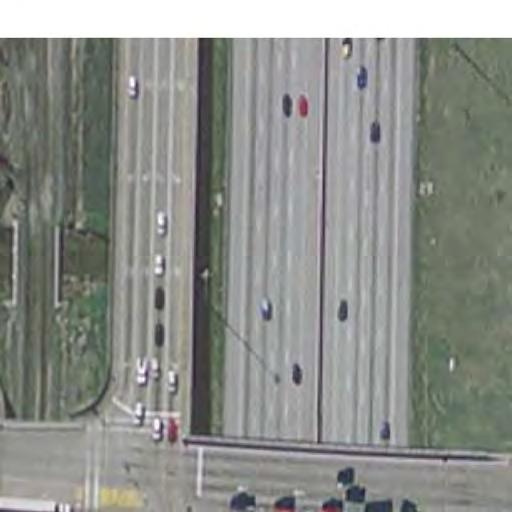
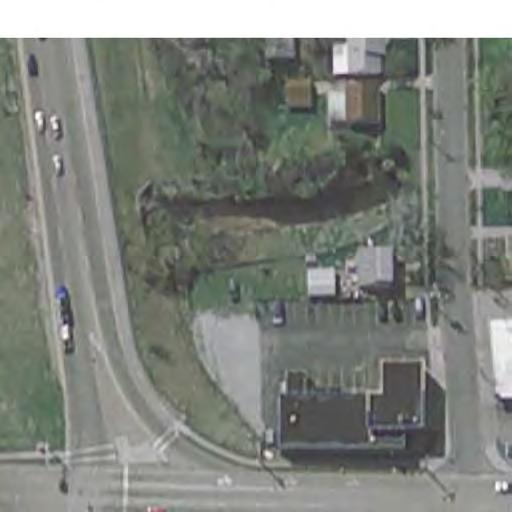
3 Ohio Department of Transportation CUY PID No Introduction An interchange operations study was performed at the Interstate Route 480 (I 480) and State Route 94 (State Road) interchange located in the City of Cleveland (Cuyahoga County). A 2015 safety study identified countermeasures that are the basis for the BUILD condition. 1.1 Purpose and Need A 2015 safety study was completed for I 480 between the SR 94 and SR 176 (Jennings Freeway) interchanges. This section of I 480 had been identified as a safety hot spot and was ranked #67 on the 2013 Urban Freeway Peak Searching Excess Locations list. Also ranked on that list at #87 was the intersection of Brookpark Road (SR 17) and State Road, which is the first signalized intersection south of the I 480 / SR 94 interchange. This study will analyze the countermeasures from the safety study to determine their impacts on traffic operations. The purpose of the proposed project is summarized below: 1. Increase turn lane storage on the WB I 480 exit ramp at State Road (SR 94). 2. Revise the lane configuration of northbound State Road at the EB I 480 ramp intersection from an existing T(L) T TR R configuration to a T(L) T(L) T R configuration. The T(L) lane designation represents a through lane on the northbound approach of the EB I 480 intersection that is aligned with the northbound left turn lanes at the WB I 480 intersection. 3. Revise the lane configuration of southbound State Road at the WB I 480 ramp intersection from an existing T T TR configuration to a T(L) T T R configuration. 4. Revise interchange signal phasing to a Buckeye Diamond (modified TTI 4 phase) configuration. 5. Add an exclusive WB right turn lane (400 feet) on Brookpark Road (SR 17) at State Road (SR 94) intersection. 6. Add an exclusive NB left turn lane on State Road 94 at the Burger Avenue/Ralph Avenue intersection. The analysis will study the capacity of mainline I 480 as well as operations of SR 94 at both ramp terminals, and the adjacent signalized intersections at Brookpark Road (SR 17) and at Burger Avenue/Ralph Road. The limits of the study area on SR 94 begin at the intersection with SR 17 and extend to the intersection with Burger /Ralph Avenue as seen in Figure 1. The limits of the study area along I 480 extend from the interchange at Ridge Road to the interchange at SR 176. Interchange Operations Study 1 August 2016
 Figure 1 Study Location The proposed project will analyze a No build and a Build alternative.")

4 Ohio Department of Transportation CUY PID No Burger Ave. Ralph Ave. Study Area I 480 Brookpark Rd. (SR 17) Figure 1 Study Location The proposed project will analyze a No build and a Build alternative. The Build alternative consists of the countermeasures from the safety study as outlined in the Purpose and Need section of the study. Exhibits showing the analysis locations and the proposed countermeasures are shown in Appendix A. 1.2 Existing Conditions Roadways/Interchanges The proposed countermeasures will improve the safety performance of roadways within the study area. Table 1 summarizes existing roadway information within the study area. The major roads in the study area are I 480, SR 94 (State Road), and SR 17 (Brookpark Road). Facility Table 1 Existing Roadway Data Functional Classification No. of Primary Lanes 2039 ADT Posted Speed Limit I-480 Urban Interstate 8 136, mph SR 94 Urban Minor Arterial , mph SR 17 Urban Minor Arterial 5 21, mph All other project area roads Local Street mph Interchange Operations Study 2 August 2016
5 Ohio Department of Transportation CUY PID No I 480 Interstate Route 480 is an auxiliary Interstate Highway of I 80 that bypasses the central business district of the City of Cleveland. The interstate experiences significant peak volumes during the AM and PM commuter rush hours. I 480 connects I 80 near North Ridgeville (west terminus) to I 80 near Streetsboro (east terminus). The CSXT railroad runs adjacent to the south side of the interstate. SR 94 State Route 94 (State Road) provides access to numerous residential neighborhoods along its length in the City of Cleveland and the City of Parma (south end). The cross section of State Road in the study area varies with numerous auxiliary lanes. Raised medians are present on the approaches to the I 480 interchange. SR 17 State Route 17 (Brookpark Road) runs parallel to I 480 through the study area. SR 17 has a five lane cross section with a center two way left turn lane (TWLTL) or dedicated left turn lane. This highway provides access to varied development in and around the study area. I 480/SR 94 Interchange The I 480/SR 94 interchange is a diamond interchange with single lane ramps that Add or Drop lanes on all ramps to/from I 480 except the WB exit ramp (diverge condition). This interchange provides access to the cities of Cleveland and Parma. Additional auxiliary turn lanes are provided at the ramp intersections on SR Intersections This project analyzes traffic operations at both ramp intersections as well as adjacent signalized intersections. A brief description of each intersection is provided below. State Road (SR 94) and Brookpark Road (SR 17) The existing intersection has 4 legs and is signalized. The eastbound, westbound and northbound approaches all have two travel lanes in each direction as well as a dedicated left turn lane. The southbound approach consists of two southbound through lanes, one exclusive right turn lane, and one exclusive left turn lane. Pedestrian crossing phasing is provided on all approaches. State Road (SR 94) and EB I 480 Ramps The existing signalized, 4 leg intersection provides access from the I 480 eastbound off ramp and access to the eastbound I 480 on ramp. The eastbound approach consists of two left turn and two right turn lanes. The northbound SR 94 approach consists of two through lanes, a shared through/right turn lane, and a dedicated right turn lane. The southbound SR 94 approach consists of three through lanes and one exclusive left turn lane. Pedestrian phasing is provided in the north/south direction. State Road (SR 94) and WB I 480 Ramps The existing signalized, 4 leg intersection provides access from the I 480 westbound off ramp and access to the I 480 westbound on ramp. The westbound approach consists of two exclusive left turn lanes and one exclusive right turn lane. The northbound SR 94 approach consists of two through lanes and two exclusive left turn lanes. Interchange Operations Study 3 August 2016
6 Ohio Department of Transportation CUY PID No The southbound SR 94 approach consists of two through lanes and one shared through/right turn lane. Pedestrian phasing is provided in the north/south direction. State Road (SR 94) and Burger Avenue/Ralph Avenue The existing intersection has 4 legs and is signalized. Both eastbound and westbound approaches are single lanes. The northbound and southbound approaches consist of two through lanes in each direction: the inside lane is a shared left through lane while the curb lane is a shared through right lane. Pedestrian phasing is provided across all approaches. 2.0 Traffic Analysis Certified traffic plates for the operations analysis were provided by ODOT. The certified traffic assumed no growth on the arterial, local, or interstate ramps. Traffic volumes increased less than 2% on mainline I 480. Appendix B includes the traffic volumes used for the analyses. HCS software was utilized to analyze the freeway segments and Synchro was used to analyze intersection operations. Synchro was utilized due to the complexity of signal coordination and phasing at the I 480 and SR 94 interchange. 2.1 Freeway Analysis A capacity analyses were conducted for the I 480 mainline to check the current level of service (LOS) for the freeway segments surrounding the interchange at SR 94. The freeway was broken into mainline, ramp and weave sections using HCS software. No differences of traffic volumes were assumed when analyzing the Build and the No build conditions. The analysis results are summarized in Table 2, Interchange Operations Study 4 August 2016
7 Ohio Department of Transportation CUY PID No Table 3 and Table 4. Table 2 Freeway Mainline Analysis Results I 480 Mainline WB I 480 from SR 176 Ramp to SR 94 Ramp WB I 480 btwn SR 94 Ramps EB I 480 btwn SR 94 Ramps 2039 AM No Build Density LOS (pc/mi/ln) 2039 AM Build 2039 PM No Build Density Density LOS LOS (pc/mi/ln) (pc/mi/ln) 2039 PM Build LOS Density (pc/mi/ln) C 22.1 C 22.1 D 27.1 D 27.1 B 17.5 B 17.5 C 18.4 C 18.4 D 28.4 D 28.4 D 28.4 D 28.4 Interchange Operations Study 5 August 2016
8 Table 3 Freeway Ramp Analysis Results Ohio Department of Transportation CUY PID No I 480 Ramps 2039 AM No Build 2039 AM Build 2039 PM No Build 2039 PM Build LOS Density Density Density Density LOS LOS LOS (pc/mi/ln) (pc/mi/ln) (pc/mi/ln) (pc/mi/ln) WB Off Ramp to SR 94 C 23.1 C 23.1 D 31.7 D 31.7 WB On Ramp from SR 94 B 18.9 B 18.9 B 19.4 B 19.4 EB Off Ramp to SR 94 C 27.0 C 27.0 C 27.0 C 27.0 EB On Ramp from SR 94 D 28.6 D 28.6 D 28.6 D 28.6 Table 4 Freeway Weave Analysis Results I 480 Weave Sections WB I 480 btwn SR 94 & Ridge Road EB I 480 btwn SR 94 & SR AM No Build Density LOS (pc/mi/ln) 2039 AM Build 2039 PM No Build Density Density LOS LOS (pc/mi/ln) (pc/mi/ln) C 27.1 C 27.1 F F 2039 PM Build LOS Density (pc/mi/ln) E 39.1 E 39.1 B 16.9 B 16.9 The analyses found that most I 480 movements operate at or better than LOS D. All mainline and ramp movements operate at LOS D or better. Two weave movements operate below LOS D in the design year (2039): The eastbound weave between SR 94 (State Road) and SR 176 will operate at LOS E (2039 AM peak). The westbound weave between the SR 94 (State Road) on ramp and the Ridge Road off ramp will operate at LOS F (2039 PM peak). The freeway to ramp and ramp to freeway weave movements have balanced volumes for both locations which contributes to the lower LOS. Constrained analysis was not performed because the volume to capacity (v/c) ratios for all movements accessing mainline I 480 were below a v/c ratio of 1.0 for both the No Build and Build conditions. Therefore, the same amount of traffic accesses mainline I 480 for both conditions. Interchange Operations Study 6 August 2016
9 Ohio Department of Transportation CUY PID No Intersection Analysis Capacity analyses were also performed for the signalized intersections on SR 94 (State Road). Synchro was utilized to evaluate the complex signal phasing at the I 480 interchange and to optimize progression of a coordinated signal system. Existing signal phasing was determined from information in the CUY /14.40 Safety Study. For the No Build condition, existing lane configurations, phasing and cycle lengths were used. However, signal splits were optimized and balanced for the No Build condition. The left turn movements were the only movements assumed to have detection and all intersections except the State Road/Brookpark Road intersection were assumed to be pretimed per documentation in the prior safety study. The results of the signalized intersection analyses are summarized in Table 5. Table 5 Signalized Intersection Analysis Results SR 94 Signalized Intersections 2039 AM No Build 2039 AM Build 2039 PM No Build 2039 PM Build LOS Delay Delay Delay Delay LOS LOS LOS (sec/veh) (sec/veh) (sec/veh) (sec/veh) SR 94 (State Road) and SR 17 (Brookpark Road) 150 sec cycle 120 sec cycle 150 sec cycle 120 sec cycle WB Approach D 44.8 E 68.7 F E 59.6 NB Approach F E 71.6 E 58.1 E 67.8 EB Approach E 78.8 E 77.1 F 94.3 E 55.5 SB Approach F 92.7 E 55.4 E 58.3 D 53.6 Overall Intersection F 89.0 E 67.8 F 81.1 E 57.7 SR 94 (State Road) and EB I 480 Ramps 100 sec cycle 120 sec cycle 100 sec cycle 120 sec cycle NB Approach F 94.8 C 28.3 E 74.8 C 26.6 EB Approach F D 50.3 F E 67.1 SB Approach B 15.0 B 16.0 A 8.7 E 63.0 Overall Intersection E 79.7 C 32.1 D 52.7 D 51.6 SR 94 (State Road) and WB I 480 Ramps 100 sec cycle 120 sec cycle 100 sec cycle 120 sec cycle NB Approach B 10.2 C 27.8 B 18.8 D 47.9 WB Approach D 38.0 C 31.1 D 47.8 E 79.5 SB Approach C 31.0 B 16.3 D 41.6 B 18.2 Overall Intersection B 19.9 C 24.8 C 33.1 D 51.1 SR 94 (State Road) & Ralph Ave/Burger Ave 120 sec cycle 60 sec cycle 120 sec cycle 60 sec cycle WB Approach B 14.1 B 15.1 D 43.4 B 15.3 NB Approach B 14.6 B 13.2 A 8.3 B 12.3 EB Approach B 10.9 B 10.6 C 29.1 B 10.3 SB Approach B 13.5 B 10.3 A 8.2 B 11.9 Overall Intersection B 13.9 B 12.0 B 11.4 B 12.2 Interchange Operations Study 7 August 2016
10 Ohio Department of Transportation CUY PID No In the No Build scenario, the intersection of SR 94 (State Road) and SR 17 (Brookpark Road) operated at LOS F in both the AM and PM peak hours. Additionally, certain movements at the eastbound I 480 off ramp terminal intersection operate at LOS F. For the Build scenario, detection was added to approaches where it was lacking to better optimize traffic flow at each intersection and all four signalized intersections were coordinated. The ramp intersections were converted to the modified Texas Transportation Institute (TTI) diamond interchange phase sequence. This is a 4 or 5 phase signal sequence that operates the interchange (2 signalized intersections) as a single intersection (see figure to the right). All countermeasures from the Purpose and Need were included in the Build condition. Both ramp intersections and the Ralph Avenue/Burger Avenue intersection all improved to LOS D or better for both AM and PM peak hours. The Brookpark Road/State Road intersection operations improved from LOS F to LOS E for both the AM and PM peak hours. The westbound I 480 ramp terminal saw an increase overall in delay per vehicle in the AM and PM peak hours, but the overall delay along the corridor decreased significantly. 2.3 Storage Length Analysis Storage length analyses were performed at each signalized intersection. The turn lane storage length was calculated and compared to the existing storage lengths. The results of that analyses are presented in Table 6. The storage lane lengths include the 50 ft. diverging taper. Storage length calculations are found in Appendix E. Interchange Operations Study 8 August 2016
11 Ohio Department of Transportation CUY PID No Table 6 Storage Length Analysis Results Intersection/Turn Lane 2039 DHV for Turn Lane Calculated Turn Lane Potential Thru Existing Turn Lane Proposed Turn Lane AM veh/hr PM veh/hr Storage (feet) Backup (feet) Length (feet) Length (feet) SR 94 (State Rd.) and SR 17 (Brookpark Rd.) 120 sec cycle 120 sec cycle NB Lt SB Lt SB Rt ** 950** EB Lt * 295 WB Lt * 265 WB Rt ^ SR 94 (State Rd.) and EB I 480 Off Ramp 120 sec cycle 120 sec cycle NB Rt SB Lt ** EB Lt (2 lanes) EB Rt (2 lanes) SR 94 (State Rd.) and WB I 480 Off Ramp 120 sec cycle 120 sec cycle NB Lt (2 lanes) ** 730 SB Rt WB Lt (2 lanes) ^ WB Rt ^ SR 94 (State Rd.) and Burger Ave. / Ralph Ave. 60 sec cycle 60 sec cycle NB Lt * Additional storage capacity is available in the two way left turn lane (TWLTL) ** Storage length extends beyond previous intersection ^ Lengths noted in the 2015 safety study At the intersection of Brookpark Road and State Road, the proposed westbound right turn lane addition on Brookpark Road is of sufficient length to avoid queues in the adjacent through lane. Additional storage lane improvements were not identified as a countermeasure in the safety study. The additional westbound right turn lane was determined to provide the most value to reducing intersection delay. Interchange Operations Study 9 August 2016
12 Ohio Department of Transportation CUY PID No The existing storage length of the eastbound I 480 off ramp turn lanes provides adequate storage length for both turn movements. The southbound left turn storage is maximized for length prior to the westbound I 480 ramp terminal; additional storage length is available prior to the westbound I 480 ramp terminal that provides the required storage length for the movement. The northbound right turn has sufficient length to avoid queues in the adjacent through lane for most cycles. The proposed westbound I 480 off ramp turn lane extension is consistent with the improvements outlined in the safety study. The proposed lengths are 3 times longer than the existing lengths and thus will achieve the safety goals of the project. The added northbound left turn lane at the Burger Ave. / Ralph Ave. intersection provides a safety benefit by separating left turning and through traffic. Due to the high northbound through volumes, this turn lane could be blocked by through traffic, but because the left turn volume is low, a longer turn lane length is not warranted. 3.0 Summary and Recommendations The finding of this report is that the improvements defined in the safety study and included as part of the Build condition be implemented. While the proposed improvements are not along I 480, improvements to the SR94 interchange will reduce the frequency of WB queues from extending onto WB I 480. All signalized intersections along SR 94 through the project area will experience reduced delay. Future projects will address the I 480 weave sections and the SR 94 (State Road)/SR 17 (Brookpark Road) intersection. Interchange Operations Study 10 August 2016
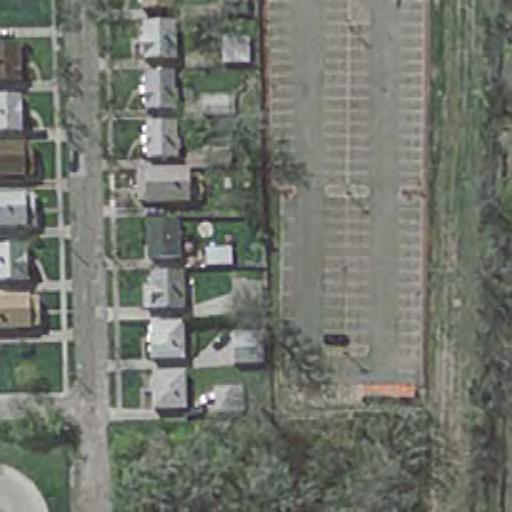
13 Appendix A Project Exhibits Proposed IOS Analysis Points State Road Corridor Improvements
 I-480 WB I-480 EB")
14 I-480/SR 94 (State Road) Intechange Proposed IOS Analysis Points Weave Segment SR 94 (State Road) I-480 WB I-480 EB


15
16 Appendix B Traffic Volumes
17 INTER-OFFICE COMMUNICATION TO: Brian Blayney, P.E., Traffic Planning Engineer, District 12 FROM: Joshua Kieselbach, P.E., Transportation Engineer, Office of Statewide Planning & Research, Modeling & Forecasting Section SUBJECT: CUY , PID DATE: April 1, 2016 In reply to a request dated November 20, 2015, the request for certified traffic has been completed. Attached are plates with 2019/2039 ADT, AM DHV and PM DHV. If needed K&D factors can be calculated from the plates. In addition to the traffic volumes two additional plates have been included with truck factors. If you have any questions, please contact me at Joshua.Kieselbach@dot.ohio.gov or (614) c: M. Byram, OSPR G. Giaimo, OSPR File
18 TI CUY PID PLATE 1 OF / / / / / / / / / / /170 BURGER AVE. 580/ / / / / /550 RALPH AVE. 180/ / / / / / / / / / / / / / / / / / / / / / / / / / / / / / / / / / / / / / / / / / / / /280 I-480 WB ON-RAMP I-480 WB OFF-RAMP I-480 EB OFF-RAMP I-480 EB ON-RAMP DEPARTM ENT STATE OFOHIO OF TRANSPORT ON A N CUY PID /2039 ADT OHIO DEPARTMENT OF TRANSPORTATION OFFICE OF STATEWIDE PLANNING & RESEARCH APRIL 1, 2016 NOT TO SCALE
19 TI CUY PID PLATE 2 OF /10 610/610 10/10 10/10 20/20 40/40 90/90 30/30 60/60 20/20 40/40 10/10 250/ / / / / / / / / / / / / / / / /460 40/40 600/ / /550 30/30 630/ / / / / / / / / / / / / / / / / /760 BURGER AVE. 90/90 50/50 50/ / /20 890/890 RALPH AVE. 720/720 20/20 I-480 WB ON-RAMP 440/ /460 I-480 WB OFF-RAMP I-480 EB OFF-RAMP I-480 EB ON-RAMP DEPARTM ENT STATE OFOHIO OF TRANSPORT ON A N CUY PID /2039 AM DHV OHIO DEPARTMENT OF TRANSPORTATION OFFICE OF STATEWIDE PLANNING & RESEARCH APRIL 1, 2016 NOT TO SCALE
20 TI CUY PID PLATE 3 OF /40 810/810 20/20 20/20 20/20 90/90 100/100 30/30 70/70 20/20 50/50 30/ / / / / / / / / / / / / / / / / / / / / / / / / / / / / / / / / / / / / /830 BURGER AVE. 110/110 80/80 RALPH AVE. 780/780 90/90 40/40 740/740 60/60 I-480 WB ON-RAMP 420/ / / / / /1400 I-480 WB OFF-RAMP I-480 EB OFF-RAMP I-480 EB ON-RAMP DEPARTM ENT STATE OFOHIO OF TRANSPORT ON A N CUY PID /2039 PM DHV OHIO DEPARTMENT OF TRANSPORTATION OFFICE OF STATEWIDE PLANNING & RESEARCH APRIL 1, 2016 NOT TO SCALE
21 TI CUY PID PLATE 4 OF 8 RIDGE RD / / / / / / / /16350 RAMP FROM SR-176 RAMP TO SR / / / / / / / / / / / / / / DEPARTM ENT STATE OFOHIO OF TRANSPORT ON A N CUY PID /2039 ADT OHIO DEPARTMENT OF TRANSPORTATION OFFICE OF STATEWIDE PLANNING & RESEARCH APRIL 1, 2016 NOT TO SCALE
22 TI CUY PID PLATE 5 OF 8 RIDGE RD. 690/690 50/ / / / / / /890 RAMP FROM SR-176 RAMP TO SR / / / / / / / / / / / / / / CUY PID STATE OFOHIO 2019/2039 AM DHV DEPARTM ENT OF TRANSPORT ON A N OHIO DEPARTMENT OF TRANSPORTATION OFFICE OF STATEWIDE PLANNING & RESEARCH APRIL 1, 2016 NOT TO SCALE
23 TI CUY PID PLATE 6 OF 8 RIDGE RD. 1370/ / / / / / / /1770 RAMP FROM SR-176 RAMP TO SR / / / / / / / / / / / / / / CUY PID STATE OFOHIO 2019/2039 PM DHV DEPARTM ENT OF TRANSPORT ON A N OHIO DEPARTMENT OF TRANSPORTATION OFFICE OF STATEWIDE PLANNING & RESEARCH APRIL 1, 2016 NOT TO SCALE
24 TI CUY PID PLATE 7 OF /0.02/ BURGER AVE. 0.01/0.03/ /0.01/0.01 RALPH AVE. 0.03/0.05/0.02 I-480 WB ON-RAMP I-480 WB OFF-RAMP I-480 EB OFF-RAMP I-480 EB ON-RAMP 0.02/0.01/ /0.02/ /0.02/ /0.03/ /0.01/ /0.03/ /0.04/ /0.03/ /0.02/ /0.02/ /0.02/ DEPARTM ENT STATE OFOHIO OF TRANSPORT ON A N CUY PID T24 / AM TD / PM TD OHIO DEPARTMENT OF TRANSPORTATION OFFICE OF STATEWIDE PLANNING & RESEARCH APRIL 1, 2016 NOT TO SCALE
25 TI CUY PID PLATE 8 OF 8 RIDGE RD. 0.03/0.03/ /0.02/ /0.05/ /0.04/0.02 RAMP TO SR-176 RAMP FROM SR /0.05/ /0.05/ /0.05/ /0.07/ /0.04/ /0.01/ CUY PID STATE OFOHIO T24 / AM TD / PM TD DEPARTM ENT OF TRANSPORT ON A N OHIO DEPARTMENT OF TRANSPORTATION OFFICE OF STATEWIDE PLANNING & RESEARCH APRIL 1, 2016 NOT TO SCALE
26 Appendix C HCS Freeway Analysis Eastbound I-480 Segments Westbound I-480 Segments
27 Appendix C Eastbound
28 6/17/2016 HCS 2010 Freeway Facilities Project Properties Analyst GTB Freeway Name I-480 Analysis Period AM Peak Analysis Date 6/16/2016 4:41:13 PM From Ridge Rd Version Date 10/10/2012 Agency CMT To SR 94 Location Analysis Direction Eastbound User Notes File Name C:\Users\gbollinger\AppData\Local\Temp\preview.xml Facility-wide Values Jam Density (pc/h/ln) 190 Time Period Duration (min) 15 Facility Length (mi) Segment Input Data Time Period 1 Mainline Data Seg # From To Type Length Terrain Basic Segment Off Ramp Basic Segment On Ramp Adj. % Demand Trucks % RVs # Lanes FFS 3190 Level Level Level Level Seg # Seg # Type Adj. Demand RampData % Trucks % RVs Lanes Accel/Decel Length 2 Off Ramp On Ramp Ramp to Ramp Prop. Adj. Demand % Trucks Weaving Segment Data On-Ramp % RVs Lanes FFS Adj. Demand % Trucks Off-Ramp FFS % RVs Lanes FFS Time Period Independent Weaving Segment Data Seg # Configuration Short Length # Weaving Lanes Min. Lane Changes Freeway-Ramp Min. Lane Changes Ramp- Freeway Min. Lane Changes Ramp- Ramp Time Period Results Time Period 1 Seg # From To Type Adj. Demand Basic Segment 2 Off Ramp Basic Segment 4 On Ramp Vol. Capacity Capacity Served (pc/h) (veh/h) d/c Ratio v/c ratio Queue Length (ft) Avg. Speed (mi/h) Density (pc/mi/ln) Density (veh/mi/ln) Avg. Travel Time (min/veh) Free-Flow Travel Time (min/veh) Mainline Delay (min/veh) System Delay (min/veh) VMT Demand (vehmin) VMT Volume (vehmin) VHT (vehhrs) VHD (vehhrs) LOS D C D D Overall Results Segment Segment Type Maximum d/c Ratio Avg. Speed (mi/h) Density (pc/mi/ln) Density (veh/mi/ln) Avg. Travel Time (min/veh) Free-Flow Travel Time (min/veh) VMT Demand (veh-min) VMT Volume (veh-min) VHT (veh-hrs) VHD (veh-hrs) Basic , , OffRamp , , Basic , , OnRamp , , Freeway , , , ,001.0
29 6/17/2016 Density-Based LOS by Segment Segment Time Step Basic Off Ramp Basic On Ramp 1 D C D D Demand-Based LOS by Segment Time Step
30 6/17/2016 HCS 2010 Freeway Facilities Project Properties Analyst GTB Freeway Name I-480 Analysis Period PM Peak Analysis Date 6/16/2016 4:41:13 PM From Ridge Rd Version Date 10/10/2012 Agency CMT To SR 94 Location Analysis Direction Eastbound User Notes File Name C:\Users\gbollinger\AppData\Local\Temp\preview.xml Facility-wide Values Jam Density (pc/h/ln) 190 Time Period Duration (min) 15 Facility Length (mi) Segment Input Data Time Period 1 Mainline Data Seg # From To Type Length Terrain Adj. % Demand Trucks % RVs # Lanes Basic Segment 3190 Level Off Ramp 1500 Level Basic Segment 3560 Level On Ramp 1500 Level FFS Seg # Seg # Type Adj. Demand RampData % Trucks % RVs Lanes Accel/Decel Length 2 Off Ramp On Ramp Ramp to Ramp Prop. Adj. Demand Weaving Segment Data On-Ramp % Trucks % RVs Lanes FFS Adj. Demand % Trucks Off-Ramp FFS % RVs Lanes FFS Time Period Independent Weaving Segment Data Seg # Configuration Short Length # Weaving Lanes Min. Lane Changes Freeway-Ramp Min. Lane Changes Ramp- Freeway Min. Lane Changes Ramp- Ramp Time Period Results Time Period 1 Seg # From To Type Adj. Demand Basic Segment 2 Off Ramp Basic Segment 4 On Ramp Vol. Capacity Capacity Served (pc/h) (veh/h) d/c Ratio v/c ratio Queue Length (ft) Avg. Speed (mi/h) Density (pc/mi/ln) Density (veh/mi/ln) Avg. Travel Time (min/veh) Free-Flow Travel Time (min/veh) Mainline Delay (min/veh) System Delay (min/veh) VMT Demand (vehmin) VMT Volume (vehmin) VHT (vehhrs) VHD (vehhrs) LOS D C D D Overall Results Segment Segment Type Maximum d/c Ratio Avg. Speed (mi/h) Density (pc/mi/ln) Density (veh/mi/ln) Avg. Travel Time (min/veh) Free-Flow Travel Time (min/veh) VMT Demand (veh-min) VMT Volume (veh-min) VHT (veh-hrs) VHD (veh-hrs) Basic , , OffRamp , , Basic , , OnRamp , , Freeway , , , ,001.0
31 6/17/2016 Density-Based LOS by Segment Segment Time Step Basic Off Ramp Basic On Ramp 1 D C D D Demand-Based LOS by Segment Time Step
32 4/7/2016 General Information FREEWAY WEAVING WORKSHEET Site Information Analyst GTB Agency/Company CMT Date Performed 4/5/2016 Analysis Time Period AM Peak Freeway/Dir of Travel Eastbound I-480 Weaving Segment Location SR 94 to SR 176 Analysis Year 2039 Project Description CUY IOS Inputs Weaving configuration One-Sided Segment type Freeway Weaving number of lanes, N 5 Freeway minimum speed, S Weaving segment length, L S 3900ft MIN 15 Freeway free-flow speed, FFS 60 mph Freeway maximum capacity, C IFL 2300 Terrain type Level Conversions to pc/h Under Base Conditions V (veh/h) PHF Truck (%) RV (%) E T E R f HV fp v (pc/h) V FF V RF V FR V RR V NW 7042 V = 8425 V W 1383 VR Configuration Characteristics Minimum maneuver lanes, N WL 2 lc Minimum weaving lane changes, LC MIN 1383 lc/h Interchange density, ID 0.8 int/mi Weaving lane changes, LC W 2319 lc/h Minimum RF lane changes, LC RF 1 lc/pc Non-weaving lane changes, LC NW 3259 lc/h Minimum FR lane changes, LC FR 1 lc/pc Total lane changes, LC ALL 5578 lc/h Minimum RR lane changes, LC RR lc/pc Non-weaving vehicle index, I NW 2197 Weaving Segment Speed, Density, Level of Service, and Capacity Weaving segment flow rate, v 8245 veh/h Weaving intensity factor, W Weaving segment capacity, c w veh/h Weaving segment speed, S 43.0 mph Weaving segment v/c ratio Average weaving speed, S W 49.6 mph Weaving segment density, D 39.1 pc/mi/ln Average non-weaving speed, S NW 42.0 mph Level of Service, LOS E Maximum weaving length, L MAX 4173 ft Notes a. Weaving segments longer than the calculated maximum length should be treated as isolated merge and diverge areas using the procedures of Chapter 13, "Freeway Merge and Diverge Segments". b. For volumes that exceed the weaving segment capacity, the level of service is "F". Copyright 2014 University of Florida, All Rights Reserved HCS 2010 TM Version 6.60 Generated: 4/7/2016 9:13 AM
33 4/7/2016 General Information FREEWAY WEAVING WORKSHEET Site Information Analyst GTB Agency/Company CMT Date Performed 4/5/2016 Analysis Time Period PM Peak Freeway/Dir of Travel Eastbound I-480 Weaving Segment Location SR 94 to SR 176 Analysis Year 2039 Project Description CUY IOS Inputs Weaving configuration One-Sided Segment type Freeway Weaving number of lanes, N 5 Freeway minimum speed, S Weaving segment length, L S 3900ft MIN 15 Freeway free-flow speed, FFS 60 mph Freeway maximum capacity, C IFL 2300 Terrain type Level Conversions to pc/h Under Base Conditions V (veh/h) PHF Truck (%) RV (%) E T E R f HV fp v (pc/h) V FF V RF V FR V RR V NW 3046 V = 4150 V W 1104 VR Configuration Characteristics Minimum maneuver lanes, N WL 2 lc Minimum weaving lane changes, LC MIN 1104 lc/h Interchange density, ID 0.8 int/mi Weaving lane changes, LC W 2040 lc/h Minimum RF lane changes, LC RF 1 lc/pc Non-weaving lane changes, LC NW 1778 lc/h Minimum FR lane changes, LC FR 1 lc/pc Total lane changes, LC ALL 3818 lc/h Minimum RR lane changes, LC RR lc/pc Non-weaving vehicle index, I NW 950 Weaving Segment Speed, Density, Level of Service, and Capacity Weaving segment flow rate, v 4054 veh/h Weaving intensity factor, W Weaving segment capacity, c w 8759 veh/h Weaving segment speed, S 49.0 mph Weaving segment v/c ratio Average weaving speed, S W 51.8 mph Weaving segment density, D 16.9 pc/mi/ln Average non-weaving speed, S NW 48.1 mph Level of Service, LOS B Maximum weaving length, L MAX 5222 ft Notes a. Weaving segments longer than the calculated maximum length should be treated as isolated merge and diverge areas using the procedures of Chapter 13, "Freeway Merge and Diverge Segments". b. For volumes that exceed the weaving segment capacity, the level of service is "F". Copyright 2014 University of Florida, All Rights Reserved HCS 2010 TM Version 6.60 Generated: 4/7/2016 9:15 AM
34 Appendix C Westbound
35 4/6/2016 General Information BASIC FREEWAY SEGMENTS WORKSHEET Site Information Analyst GTB Highway/Direction of Travel WB I-480 Agency or Company CMT From/To Between SR 94 & SR 176 Date Performed 4/6/2016 Jurisdiction ODOT Analysis Time Period AM Peak Analysis Year 2039 Project Description CUY IOS Oper.(LOS) Des.(N) Planning Data Flow Inputs Volume, V 4690 veh/h Peak-Hour Factor, PHF 0.94 AADT veh/day %Trucks and Buses, P T 5 Peak-Hr Prop. of AADT, K %RVs, P R 0 Peak-Hr Direction Prop, D General Terrain: Level DDHV = AADT x K x D veh/h Grade % Length mi Up/Down % Calculate Flow Adjustments f p 0.96 E R 1.2 E T 1.5 f HV = 1/[1+P T (E T - 1) + P R (E R - 1)] Speed Inputs Lane Width Rt-Side Lat. Clearance Number of Lanes, N 4 Total Ramp Density, TRD FFS (measured) 60.0 mph Base free-flow Speed, BFFS LOS and Performance Measures Operational (LOS) ft ft ramps/mi mph v p = (V or DDHV) / (PHF x N x f HV x 1329 pc/h/ln f p ) S 60.0 mph D = v p / S 22.1 pc/mi/ln LOS Glossary C Calc Speed Adj and FFS f LW f LC TRD Adjustment mph mph mph FFS 60.0 mph Design (N) Design (N) Design LOS v p = (V or DDHV) / (PHF x N x f HV x f p ) S D = v p / S Required Number of Lanes, N Factor Location pc/h/ln mph pc/mi/ln N - Number of lanes S - Speed E R - Exhibits 11-10, f LW - Exhibit 11-8 V - Hourly volume D - Density E T - Exhibits 11-10, 11-11, f LC - Exhibit 11-9 v p - Flow rate FFS - Free-flow speed f p - Page TRD - Page LOS - Level of service BFFS - Base free-flow speed LOS, S, FFS, v p - Exhibits 11-2, 11- DDHV - Directional design hour volume 3 Copyright 2014 University of Florida, All Rights Reserved HCS 2010 TM Version 6.60 Generated: 4/6/ :59 AM
36 4/7/2016 General Information BASIC FREEWAY SEGMENTS WORKSHEET Site Information Analyst GTB Highway/Direction of Travel WB I-480 Agency or Company CMT From/To Between SR 94 & SR 176 Date Performed 4/6/2016 Jurisdiction ODOT Analysis Time Period PM Peak Analysis Year 2039 Project Description CUY IOS Oper.(LOS) Des.(N) Planning Data Flow Inputs Volume, V 5690 veh/h Peak-Hour Factor, PHF 0.94 AADT veh/day %Trucks and Buses, P T 6 Peak-Hr Prop. of AADT, K %RVs, P R 0 Peak-Hr Direction Prop, D General Terrain: Level DDHV = AADT x K x D veh/h Grade % Length mi Up/Down % Calculate Flow Adjustments f p 0.96 E R 1.2 E T 1.5 f HV = 1/[1+P T (E T - 1) + P R (E R - 1)] Speed Inputs Lane Width Rt-Side Lat. Clearance Number of Lanes, N 4 Total Ramp Density, TRD FFS (measured) 60.0 mph Base free-flow Speed, BFFS LOS and Performance Measures Operational (LOS) ft ft ramps/mi mph v p = (V or DDHV) / (PHF x N x f HV x 1624 pc/h/ln f p ) S 60.0 mph D = v p / S 27.1 pc/mi/ln LOS Glossary D Calc Speed Adj and FFS f LW f LC TRD Adjustment mph mph mph FFS 60.0 mph Design (N) Design (N) Design LOS v p = (V or DDHV) / (PHF x N x f HV x f p ) S D = v p / S Required Number of Lanes, N Factor Location pc/h/ln mph pc/mi/ln N - Number of lanes S - Speed E R - Exhibits 11-10, f LW - Exhibit 11-8 V - Hourly volume D - Density E T - Exhibits 11-10, 11-11, f LC - Exhibit 11-9 v p - Flow rate FFS - Free-flow speed f p - Page TRD - Page LOS - Level of service BFFS - Base free-flow speed LOS, S, FFS, v p - Exhibits 11-2, 11- DDHV - Directional design hour volume 3 Copyright 2014 University of Florida, All Rights Reserved HCS 2010 TM Version 6.60 Generated: 4/7/2016 9:18 AM
37 4/6/2016 RAMPS AND RAMP JUNCTIONS WORKSHEET General Information Site Information Analyst GTB Freeway/Dir of Travel Westbound I-480 Agency or Company CMT Junction SR 94 Off-Ramp Date Performed 4/6/2016 Jurisdiction ODOT Analysis Time Period AM Peak Analysis Year 2039 Project Description CUY IOS Inputs Upstream Adj Ramp Yes On Freeway Number of Lanes, N 4 Ramp Number of Lanes, N 1 Downstream Adj Ramp Acceleration Lane Length, L A Yes On No Off Deceleration Lane Length L D 480 Freeway Volume, V F 4690 No Off L up = ft Ramp Volume, V R 600 L down = ft V u = veh/h Freeway Free-Flow Speed, S FF 60.0 Ramp Free-Flow Speed, S FR 45.0 V D = veh/h Conversion to pc/h Under Base Conditions (pc/h) V (Veh/hr) PHF Terrain %Truck %Rv f HV f p v = V/PHF x f HV x f p Freeway Level Ramp Level UpStream DownStream Merge Areas Diverge Areas Estimation of v 12 Estimation of v 12 V 12 = V F ( P FM ) V 12 = V R + (V F - V R )P FD L EQ = (Equation 13-6 or 13-7) L EQ = (Equation or 13-13) P FM = using Equation (Exhibit 13-6) P FD = using Equation (Exhibit 13-7) V 12 = pc/h V 12 = 2692 pc/h V 3 or V av34 pc/h (Equation or 13-17) V 3 or V av pc/h (Equation or 13-17) Is V 3 or V av34 > 2,700 pc/h? Yes No Is V 3 or V av34 > 2,700 pc/h? Yes No Is V 3 or V av34 > 1.5 * V 12 /2 Yes No Is V 3 or V av34 > 1.5 * V 12 /2 Yes No If Yes,V 12a = pc/h (Equation 13-16, 13-18, or If Yes,V 13-19) 12a = pc/h (Equation 13-16, 13-18, or 13-19) Capacity Checks Capacity Checks Actual Capacity LOS F? Actual Capacity LOS F? V F 5316 Exhibit No V FO Exhibit 13-8 V FO = V F - V R 4652 Exhibit No V R 664 Exhibit No Flow Entering Merge Influence Area Flow Entering Diverge Influence Area Actual Max Desirable Violation? Actual Max Desirable Violation? V R12 Exhibit 13-8 V Exhibit :All No Level of Service Determination (if not F) Level of Service Determination (if not F) D R = v R V L A D R = V L D D R = (pc/mi/ln) D R = 23.1 (pc/mi/ln) LOS = (Exhibit 13-2) LOS = C (Exhibit 13-2) Speed Determination Speed Determination M S = (Exibit 13-11) D s = (Exhibit 13-12) S R = mph (Exhibit 13-11) S R = 53.6 mph (Exhibit 13-12) S 0 = mph (Exhibit 13-11) S 0 = 64.6 mph (Exhibit 13-12) S = mph (Exhibit 13-13) S = 58.5 mph (Exhibit 13-13) Copyright 2014 University of Florida, All Rights Reserved HCS2010 TM Version 6.60 Generated: 4/6/ :55 AM
38 4/7/2016 RAMPS AND RAMP JUNCTIONS WORKSHEET General Information Site Information Analyst GTB Freeway/Dir of Travel Westbound I-480 Agency or Company CMT Junction SR 94 Off-Ramp Date Performed 4/6/2016 Jurisdiction ODOT Analysis Time Period PM Peak Analysis Year 2039 Project Description CUY IOS Inputs Upstream Adj Ramp Yes On Freeway Number of Lanes, N 4 Ramp Number of Lanes, N 1 Downstream Adj Ramp Acceleration Lane Length, L A Yes On No Off Deceleration Lane Length L D 480 Freeway Volume, V F 5690 No Off L up = ft Ramp Volume, V R 1400 L down = ft V u = veh/h Freeway Free-Flow Speed, S FF 60.0 Ramp Free-Flow Speed, S FR 45.0 V D = veh/h Conversion to pc/h Under Base Conditions (pc/h) V (Veh/hr) PHF Terrain %Truck %Rv f HV f p v = V/PHF x f HV x f p Freeway Level Ramp Level UpStream DownStream Merge Areas Diverge Areas Estimation of v 12 Estimation of v 12 V 12 = V F ( P FM ) V 12 = V R + (V F - V R )P FD L EQ = (Equation 13-6 or 13-7) L EQ = (Equation or 13-13) P FM = using Equation (Exhibit 13-6) P FD = using Equation (Exhibit 13-7) V 12 = pc/h V 12 = 3689 pc/h V 3 or V av34 pc/h (Equation or 13-17) V 3 or V av pc/h (Equation or 13-17) Is V 3 or V av34 > 2,700 pc/h? Yes No Is V 3 or V av34 > 2,700 pc/h? Yes No Is V 3 or V av34 > 1.5 * V 12 /2 Yes No Is V 3 or V av34 > 1.5 * V 12 /2 Yes No If Yes,V 12a = pc/h (Equation 13-16, 13-18, or If Yes,V 13-19) 12a = pc/h (Equation 13-16, 13-18, or 13-19) Capacity Checks Capacity Checks Actual Capacity LOS F? Actual Capacity LOS F? V F 6495 Exhibit No V FO Exhibit 13-8 V FO = V F - V R 4976 Exhibit No V R 1519 Exhibit No Flow Entering Merge Influence Area Flow Entering Diverge Influence Area Actual Max Desirable Violation? Actual Max Desirable Violation? V R12 Exhibit 13-8 V Exhibit :All No Level of Service Determination (if not F) Level of Service Determination (if not F) D R = v R V L A D R = V L D D R = (pc/mi/ln) D R = 31.7 (pc/mi/ln) LOS = (Exhibit 13-2) LOS = D (Exhibit 13-2) Speed Determination Speed Determination M S = (Exibit 13-11) D s = (Exhibit 13-12) S R = mph (Exhibit 13-11) S R = 52.2 mph (Exhibit 13-12) S 0 = mph (Exhibit 13-11) S 0 = 64.2 mph (Exhibit 13-12) S = mph (Exhibit 13-13) S = 56.8 mph (Exhibit 13-13) Copyright 2014 University of Florida, All Rights Reserved HCS2010 TM Version 6.60 Generated: 4/7/2016 9:22 AM
39 6/16/2016 HCS 2010 Freeway Facilities Project Properties Analyst GTB Freeway Name I-480 Analysis Period AM Peak Analysis Date 6/16/2016 4:41:13 PM From SR 94 Version Date 10/10/2012 Agency CMT To Ridge Rd Location Analysis Direction Westbound User Notes File Name C:\Users\gbollinger\AppData\Local\Temp\preview.xml Facility-wide Values Jam Density (pc/h/ln) 190 Time Period Duration (min) 15 Facility Length (mi) Segment Input Data Time Period 1 Mainline Data Seg # From To Type Length Terrain Basic Segment On Ramp Basic Segment Adj. % Demand Trucks % RVs # Lanes FFS 3560 Level Level Level Seg # Seg # Type Adj. Demand RampData % Trucks % RVs Lanes Accel/Decel Length 2 On Ramp Ramp to Ramp Prop. Adj. Demand % Trucks Weaving Segment Data On-Ramp % RVs Lanes FFS Adj. Demand % Trucks Off-Ramp FFS % RVs Lanes FFS Time Period Independent Weaving Segment Data Seg # Configuration Short Length # Weaving Lanes Min. Lane Changes Freeway-Ramp Min. Lane Changes Ramp- Freeway Min. Lane Changes Ramp- Ramp Time Period Results Time Period 1 Seg # From To Type Adj. Demand Basic Segment 2 On Ramp Basic Segment Vol. Capacity Capacity Served (pc/h) (veh/h) d/c Ratio v/c ratio Queue Length (ft) Avg. Speed (mi/h) Density (pc/mi/ln) Density (veh/mi/ln) Avg. Travel Time (min/veh) Free-Flow Travel Time (min/veh) Mainline Delay (min/veh) System Delay (min/veh) VMT Demand (vehmin) VMT Volume (vehmin) VHT (vehhrs) VHD (vehhrs) LOS B B B Overall Results Segment Segment Type Maximum d/c Ratio Avg. Speed (mi/h) Density (pc/mi/ln) Density (veh/mi/ln) Avg. Travel Time (min/veh) Free-Flow Travel Time (min/veh) VMT Demand (veh-min) VMT Volume (veh-min) VHT (veh-hrs) VHD (veh-hrs) Basic , , OnRamp , , Basic , , Freeway , , , ,000.4
40 6/16/2016 Density-Based LOS by Segment Segment Time Step Basic On Ramp Basic 1 B B B Demand-Based LOS by Segment Time Step
41 6/16/2016 HCS 2010 Freeway Facilities Project Properties Analyst GTB Freeway Name I-480 Analysis Period PM Peak Analysis Date 6/16/2016 4:41:13 PM From SR 94 Version Date 10/10/2012 Agency CMT To Ridge Rd Location Analysis Direction Westbound User Notes File Name C:\Users\gbollinger\AppData\Local\Temp\preview.xml Facility-wide Values Jam Density (pc/h/ln) 330 Time Period Duration (min) 15 Facility Length (mi) Segment Input Data Time Period 1 Mainline Data Seg # From To Type Length Terrain Adj. % Demand Trucks % RVs # Lanes Basic Segment 3560 Level On Ramp 1500 Level Basic Segment 1690 Level FFS Seg # Seg # Type Adj. Demand RampData % Trucks % RVs Lanes Accel/Decel Length 2 On Ramp Ramp to Ramp Prop. Adj. Demand Weaving Segment Data On-Ramp % Trucks % RVs Lanes FFS Adj. Demand % Trucks Off-Ramp FFS % RVs Lanes FFS Time Period Independent Weaving Segment Data Seg # Configuration Short Length # Weaving Lanes Min. Lane Changes Freeway-Ramp Min. Lane Changes Ramp- Freeway Min. Lane Changes Ramp- Ramp Time Period Results Time Period 1 Seg # From To Type Adj. Demand Basic Segment 2 On Ramp Basic Segment Vol. Capacity Capacity Served (pc/h) (veh/h) d/c Ratio v/c ratio Queue Length (ft) Avg. Speed (mi/h) Density (pc/mi/ln) Density (veh/mi/ln) Avg. Travel Time (min/veh) Free-Flow Travel Time (min/veh) Mainline Delay (min/veh) System Delay (min/veh) VMT Demand (vehmin) VMT Volume (vehmin) VHT (vehhrs) VHD (vehhrs) LOS C B C Overall Results Segment Segment Type Maximum d/c Ratio Avg. Speed (mi/h) Density (pc/mi/ln) Density (veh/mi/ln) Avg. Travel Time (min/veh) Free-Flow Travel Time (min/veh) VMT Demand (veh-min) VMT Volume (veh-min) VHT (veh-hrs) VHD (veh-hrs) Basic , , OnRamp , , Basic , , Freeway , , , ,000.4
42 6/16/2016 Density-Based LOS by Segment Segment Time Step Basic On Ramp Basic 1 C B C Demand-Based LOS by Segment Time Step
43 4/7/2016 General Information FREEWAY WEAVING WORKSHEET Site Information Analyst GTB Agency/Company CMT Date Performed 4/6/2016 Analysis Time Period AM Peak Freeway/Dir of Travel Westbound I-480 Weaving Segment Location Between Ridge Rd & SR 94 Analysis Year 2039 Project Description CUY IOS Inputs Weaving configuration One-Sided Segment type Freeway Weaving number of lanes, N 4 Freeway minimum speed, S Weaving segment length, L S 3935ft MIN 15 Freeway free-flow speed, FFS 60 mph Freeway maximum capacity, C IFL 2300 Terrain type Level Conversions to pc/h Under Base Conditions V (veh/h) PHF Truck (%) RV (%) E T E R f HV fp v (pc/h) V FF V RF V FR V RR V NW 3965 V = 5878 V W 1913 VR Configuration Characteristics Minimum maneuver lanes, N WL 2 lc Minimum weaving lane changes, LC MIN 1913 lc/h Interchange density, ID 0.8 int/mi Weaving lane changes, LC W 2515 lc/h Minimum RF lane changes, LC RF 1 lc/pc Non-weaving lane changes, LC NW 2179 lc/h Minimum FR lane changes, LC FR 1 lc/pc Total lane changes, LC ALL 4694 lc/h Minimum RR lane changes, LC RR lc/pc Non-weaving vehicle index, I NW 1248 Weaving Segment Speed, Density, Level of Service, and Capacity Weaving segment flow rate, v 5586 veh/h Weaving intensity factor, W Weaving segment capacity, c w 6921 veh/h Weaving segment speed, S 42.3 mph Weaving segment v/c ratio Average weaving speed, S W 50.7 mph Weaving segment density, D 34.7 pc/mi/ln Average non-weaving speed, S NW 39.2 mph Level of Service, LOS D Maximum weaving length, L MAX 5859 ft Notes a. Weaving segments longer than the calculated maximum length should be treated as isolated merge and diverge areas using the procedures of Chapter 13, "Freeway Merge and Diverge Segments". b. For volumes that exceed the weaving segment capacity, the level of service is "F". Copyright 2014 University of Florida, All Rights Reserved HCS 2010 TM Version 6.60 Generated: 4/7/2016 9:34 AM
44 4/7/2016 General Information FREEWAY WEAVING WORKSHEET Site Information Analyst GTB Agency/Company CMT Date Performed 4/6/2016 Analysis Time Period PM Peak Freeway/Dir of Travel Westbound I-480 Weaving Segment Location Between Ridge Rd & SR 94 Analysis Year 2039 Project Description CUY IOS Inputs Weaving configuration One-Sided Segment type Freeway Weaving number of lanes, N 4 Freeway minimum speed, S Weaving segment length, L S 3935ft MIN 15 Freeway free-flow speed, FFS 60 mph Freeway maximum capacity, C IFL 2300 Terrain type Level Conversions to pc/h Under Base Conditions V (veh/h) PHF Truck (%) RV (%) E T E R f HV fp v (pc/h) V FF V RF V FR V RR V NW 3504 V = 6009 V W 2505 VR Configuration Characteristics Minimum maneuver lanes, N WL 2 lc Minimum weaving lane changes, LC MIN lc/h Interchange density, ID 0.8 int/mi Weaving lane changes, LC W lc/h Minimum RF lane changes, LC RF 1 lc/pc Non-weaving lane changes, LC NW lc/h Minimum FR lane changes, LC FR 1 lc/pc Total lane changes, LC ALL lc/h Minimum RR lane changes, LC RR lc/pc Non-weaving vehicle index, I NW 1046 Weaving Segment Speed, Density, Level of Service, and Capacity Weaving segment flow rate, v 5713 veh/h Weaving intensity factor, W Weaving segment capacity, c w 5377 veh/h Weaving segment speed, S mph Weaving segment v/c ratio Average weaving speed, S W mph Weaving segment density, D pc/mi/ln Average non-weaving speed, S NW mph Level of Service, LOS F Maximum weaving length, L MAX 6871 ft Notes a. Weaving segments longer than the calculated maximum length should be treated as isolated merge and diverge areas using the procedures of Chapter 13, "Freeway Merge and Diverge Segments". b. For volumes that exceed the weaving segment capacity, the level of service is "F". Copyright 2014 University of Florida, All Rights Reserved HCS 2010 TM Version 6.60 Generated: 4/7/2016 9:34 AM
45 Appendix D Synchro Operations Analysis 2039 AM No Build 2039 PM No Build 2039 AM Build 2039 PM Build
46 Lanes, Volumes, Timings 3: SR 94 (State Rd)/SR 94 & SR 17 (Brookpark Rd) 8/16/2016 Lane Group EBL EBT EBR WBL WBT WBR NBL NBT NBR SBL SBT SBR Lane Configurations Volume (vph) Ideal Flow (vphpl) Storage Length (ft) Storage Lanes Taper Length (ft) Lane Util. Factor Frt Flt Protected Satd. Flow (prot) Flt Permitted Satd. Flow (perm) Right Turn on Red Yes Yes Yes Yes Satd. Flow (RTOR) Link Speed (mph) Link Distance (ft) Travel Time (s) Peak Hour Factor Heavy Vehicles (%) 2% 2% 2% 3% 3% 3% 1% 1% 1% 2% 2% 2% Adj. Flow (vph) Shared Lane Traffic (%) Lane Group Flow (vph) Enter Blocked Intersection No No No No No No No No No No No No Lane Alignment Left Left Right Left Left Right Left Left Right Left Left Right Median Width(ft) Link Offset(ft) Crosswalk Width(ft) Two way Left Turn Lane Yes Yes Headway Factor Turning Speed (mph) Number of Detectors Detector Template Left Thru Left Thru Left Left Leading Detector (ft) Trailing Detector (ft) Detector 1 Position(ft) Detector 1 Size(ft) Detector 1 Type Cl+Ex Cl+Ex Cl+Ex Cl+Ex Cl+Ex Cl+Ex Cl+Ex Cl+Ex Cl+Ex Detector 1 Channel Detector 1 Extend (s) Detector 1 Queue (s) Detector 1 Delay (s) Turn Type pm+pt NA pm+pt NA pm+pt NA pm+pt NA pm+ov Protected Phases Permitted Phases Detector Phase Switch Phase Minimum Initial (s) Minimum Split (s) Total Split (s) I-480/SR 94 Interchange 2039 No Build AM Peak 8:00 am 4/5/2016 Baseline Synchro 8 Report Jerry Bollinger Page 1
47 Lanes, Volumes, Timings 3: SR 94 (State Rd)/SR 94 & SR 17 (Brookpark Rd) 8/16/2016 Lane Group EBL EBT EBR WBL WBT WBR NBL NBT NBR SBL SBT SBR Total Split (%) 25.3% 34.7% 10.7% 20.0% 13.3% 38.7% 16.0% 41.3% 25.3% Maximum Green (s) Yellow Time (s) All-Red Time (s) Lost Time Adjust (s) Total Lost Time (s) Lead/Lag Lead Lag Lead Lag Lead Lag Lead Lag Lead Lead-Lag Optimize? Vehicle Extension (s) Recall Mode None Max None Max None Min None Min None Walk Time (s) Flash Dont Walk (s) Pedestrian Calls (#/hr) Act Effct Green (s) Actuated g/c Ratio v/c Ratio Control Delay Queue Delay Total Delay LOS F D C D C F F D A Approach Delay Approach LOS E D F F Queue Length 50th (ft) ~ ~835 ~ Queue Length 95th (ft) # #978 # Internal Link Dist (ft) Turn Bay Length (ft) Base Capacity (vph) Starvation Cap Reductn Spillback Cap Reductn Storage Cap Reductn Reduced v/c Ratio Intersection Summary Area Type: Other Cycle Length: 150 Actuated Cycle Length: 162 Natural Cycle: 150 Control Type: Semi Act-Uncoord Maximum v/c Ratio: 1.46 Intersection Signal Delay: 89.0 Intersection LOS: F Intersection Capacity Utilization 112.5% ICU Level of Service H Analysis Period (min) 15 ~ Volume exceeds capacity, queue is theoretically infinite. Queue shown is maximum after two cycles. # 95th percentile volume exceeds capacity, queue may be longer. Queue shown is maximum after two cycles. Splits and Phases: 3: SR 94 (State Rd)/SR 94 & SR 17 (Brookpark Rd) I-480/SR 94 Interchange 2039 No Build AM Peak 8:00 am 4/5/2016 Baseline Synchro 8 Report Jerry Bollinger Page 2
48 Lanes, Volumes, Timings 7: SR 94 & EB Off-Ramp/EB On-Ramp 8/16/2016 Lane Group EBL EBT EBR WBL WBT WBR NBL NBT NBR SBL SBT SBR Lane Configurations Volume (vph) Ideal Flow (vphpl) Storage Length (ft) Storage Lanes Taper Length (ft) Lane Util. Factor *0.60 * Frt Flt Protected Satd. Flow (prot) Flt Permitted Satd. Flow (perm) Right Turn on Red No Yes Yes Yes Satd. Flow (RTOR) Link Speed (mph) Link Distance (ft) Travel Time (s) Peak Hour Factor Heavy Vehicles (%) 4% 4% 4% 2% 2% 2% 3% 3% 3% 3% 3% 3% Adj. Flow (vph) Shared Lane Traffic (%) 50% Lane Group Flow (vph) Enter Blocked Intersection No No No No No No No No No No No No Lane Alignment R NA Left Right Left Left Right Left Right Right Left Left Right Median Width(ft) Link Offset(ft) Crosswalk Width(ft) Two way Left Turn Lane Headway Factor Turning Speed (mph) Turn Type Prot Prot NA custom Prot NA Protected Phases Permitted Phases 2 Minimum Split (s) Total Split (s) Total Split (%) 30.0% 30.0% 45.0% 30.0% 25.0% 70.0% Maximum Green (s) Yellow Time (s) All-Red Time (s) Lost Time Adjust (s) Total Lost Time (s) Lead/Lag Lag Lead Lead-Lag Optimize? Yes Yes Walk Time (s) 7.0 Flash Dont Walk (s) 20.0 Pedestrian Calls (#/hr) 0 Act Effct Green (s) Actuated g/c Ratio v/c Ratio I-480/SR 94 Interchange 2039 No Build AM Peak 8:00 am 4/5/2016 Baseline Synchro 8 Report Jerry Bollinger Page 3
49 Lanes, Volumes, Timings 7: SR 94 & EB Off-Ramp/EB On-Ramp 8/16/2016 Lane Group EBL EBT EBR WBL WBT WBR NBL NBT NBR SBL SBT SBR Control Delay Queue Delay Total Delay LOS D F F B D A Approach Delay Approach LOS F B Queue Length 50th (ft) 118 ~344 ~ Queue Length 95th (ft) 165 #473 #781 #764 m#219 6 Internal Link Dist (ft) Turn Bay Length (ft) Base Capacity (vph) Starvation Cap Reductn Spillback Cap Reductn Storage Cap Reductn Reduced v/c Ratio Intersection Summary Area Type: Other Cycle Length: 100 Actuated Cycle Length: 100 Offset: 0 (0%), Referenced to phase 2:NBT and 6:SBT, Start of Green, Master Intersection Natural Cycle: 140 Control Type: Pretimed Maximum v/c Ratio: 1.20 Intersection Signal Delay: 79.7 Intersection LOS: E Intersection Capacity Utilization 75.0% ICU Level of Service D Analysis Period (min) 15 * User Entered Value ~ Volume exceeds capacity, queue is theoretically infinite. Queue shown is maximum after two cycles. # 95th percentile volume exceeds capacity, queue may be longer. Queue shown is maximum after two cycles. m Volume for 95th percentile queue is metered by upstream signal. Splits and Phases: 7: SR 94 & EB Off-Ramp/EB On-Ramp I-480/SR 94 Interchange 2039 No Build AM Peak 8:00 am 4/5/2016 Baseline Synchro 8 Report Jerry Bollinger Page 4
50 Lanes, Volumes, Timings 10: SR 94 & WB On-Ramp/WB Off-Ramp 8/16/2016 Lane Group EBL EBT EBR WBL WBT WBR NBL NBT NBR SBL SBT SBR Lane Configurations Volume (vph) Ideal Flow (vphpl) Storage Length (ft) Storage Lanes Taper Length (ft) Lane Util. Factor * Frt Flt Protected Satd. Flow (prot) Flt Permitted Satd. Flow (perm) Right Turn on Red Yes Yes Yes Yes Satd. Flow (RTOR) Link Speed (mph) Link Distance (ft) Travel Time (s) Peak Hour Factor Heavy Vehicles (%) 2% 2% 2% 5% 5% 5% 3% 3% 3% 2% 2% 2% Adj. Flow (vph) Shared Lane Traffic (%) Lane Group Flow (vph) Enter Blocked Intersection No No No No No No No No No No No No Lane Alignment Left Left Right R NA Left Right Left Left Right Left Right Right Median Width(ft) Link Offset(ft) Crosswalk Width(ft) Two way Left Turn Lane Headway Factor Turning Speed (mph) Turn Type Prot Prot Prot NA NA Protected Phases Permitted Phases Minimum Split (s) Total Split (s) Total Split (%) 33.0% 33.0% 37.0% 67.0% 30.0% Maximum Green (s) Yellow Time (s) All-Red Time (s) Lost Time Adjust (s) Total Lost Time (s) Lead/Lag Lag Lead Lead-Lag Optimize? Yes Yes Walk Time (s) 7.0 Flash Dont Walk (s) 14.0 Pedestrian Calls (#/hr) 0 Act Effct Green (s) Actuated g/c Ratio v/c Ratio dr I-480/SR 94 Interchange 2039 No Build AM Peak 8:00 am 4/5/2016 Baseline Synchro 8 Report Jerry Bollinger Page 5
51 Lanes, Volumes, Timings 10: SR 94 & WB On-Ramp/WB Off-Ramp 8/16/2016 Lane Group EBL EBT EBR WBL WBT WBR NBL NBT NBR SBL SBT SBR Control Delay Queue Delay Total Delay LOS D A B A C Approach Delay Approach LOS B C Queue Length 50th (ft) Queue Length 95th (ft) m190 m Internal Link Dist (ft) Turn Bay Length (ft) Base Capacity (vph) Starvation Cap Reductn Spillback Cap Reductn Storage Cap Reductn Reduced v/c Ratio Intersection Summary Area Type: Other Cycle Length: 100 Actuated Cycle Length: 100 Offset: 5 (5%), Referenced to phase 2:NBT and 6:SBT, Start of Green Natural Cycle: 85 Control Type: Pretimed Maximum v/c Ratio: 0.75 Intersection Signal Delay: 19.9 Intersection LOS: B Intersection Capacity Utilization 75.0% ICU Level of Service D Analysis Period (min) 15 * User Entered Value m Volume for 95th percentile queue is metered by upstream signal. dr Defacto Right Lane. Recode with 1 though lane as a right lane. Splits and Phases: 10: SR 94 & WB On-Ramp/WB Off-Ramp I-480/SR 94 Interchange 2039 No Build AM Peak 8:00 am 4/5/2016 Baseline Synchro 8 Report Jerry Bollinger Page 6
52 Lanes, Volumes, Timings 13: SR 94 & Burger Ave./Ralph Ave. 8/16/2016 Lane Group EBL EBT EBR WBL WBT WBR NBL NBT NBR SBL SBT SBR Lane Configurations Volume (vph) Ideal Flow (vphpl) Lane Util. Factor Frt Flt Protected Satd. Flow (prot) Flt Permitted Satd. Flow (perm) Right Turn on Red Yes Yes Yes Yes Satd. Flow (RTOR) Link Speed (mph) Link Distance (ft) Travel Time (s) Peak Hour Factor Heavy Vehicles (%) 3% 3% 3% 1% 1% 1% 2% 2% 2% 2% 2% 2% Adj. Flow (vph) Shared Lane Traffic (%) Lane Group Flow (vph) Enter Blocked Intersection No No No No No No No No No No No No Lane Alignment Left Left Right Left Left Right Left Left Right Left Left Right Median Width(ft) Link Offset(ft) Crosswalk Width(ft) Two way Left Turn Lane Headway Factor Turning Speed (mph) Number of Detectors Detector Template Left Thru Left Thru Left Thru Left Thru Leading Detector (ft) Trailing Detector (ft) Detector 1 Position(ft) Detector 1 Size(ft) Detector 1 Type Cl+Ex Cl+Ex Cl+Ex Cl+Ex Cl+Ex Cl+Ex Cl+Ex Cl+Ex Detector 1 Channel Detector 1 Extend (s) Detector 1 Queue (s) Detector 1 Delay (s) Turn Type Perm NA Perm NA Perm NA Perm NA Protected Phases Permitted Phases Detector Phase Switch Phase Minimum Initial (s) Minimum Split (s) Total Split (s) Total Split (%) 25.0% 25.0% 25.0% 25.0% 75.0% 75.0% 75.0% 75.0% Maximum Green (s) Yellow Time (s) I-480/SR 94 Interchange 2039 No Build AM Peak 8:00 am 4/5/2016 Baseline Synchro 8 Report Jerry Bollinger Page 7
53 Lanes, Volumes, Timings 13: SR 94 & Burger Ave./Ralph Ave. 8/16/2016 Lane Group EBL EBT EBR WBL WBT WBR NBL NBT NBR SBL SBT SBR All-Red Time (s) Lost Time Adjust (s) Total Lost Time (s) Lead/Lag Lead-Lag Optimize? Vehicle Extension (s) Recall Mode Max Max Max Max Min Min Min Min Walk Time (s) Flash Dont Walk (s) Pedestrian Calls (#/hr) Act Effct Green (s) Actuated g/c Ratio v/c Ratio Control Delay Queue Delay Total Delay LOS B B B B Approach Delay Approach LOS B B B B Queue Length 50th (ft) Queue Length 95th (ft) Internal Link Dist (ft) Turn Bay Length (ft) Base Capacity (vph) Starvation Cap Reductn Spillback Cap Reductn Storage Cap Reductn Reduced v/c Ratio Intersection Summary Area Type: Other Cycle Length: 120 Actuated Cycle Length: 66 Natural Cycle: 60 Control Type: Semi Act-Uncoord Maximum v/c Ratio: 0.54 Intersection Signal Delay: 13.9 Intersection Capacity Utilization 46.1% Analysis Period (min) 15 Intersection LOS: B ICU Level of Service A Splits and Phases: 13: SR 94 & Burger Ave./Ralph Ave. I-480/SR 94 Interchange 2039 No Build AM Peak 8:00 am 4/5/2016 Baseline Synchro 8 Report Jerry Bollinger Page 8
54 Lanes, Volumes, Timings 3: SR 94 (State Rd)/SR 94 & SR 17 (Brookpark Rd) 7/8/2016 Lane Group EBL EBT EBR WBL WBT WBR NBL NBT NBR SBL SBT SBR Lane Configurations Volume (vph) Ideal Flow (vphpl) Storage Length (ft) Storage Lanes Taper Length (ft) Lane Util. Factor Frt Flt Protected Satd. Flow (prot) Flt Permitted Satd. Flow (perm) Right Turn on Red Yes Yes Yes Yes Satd. Flow (RTOR) Link Speed (mph) Link Distance (ft) Travel Time (s) Peak Hour Factor Heavy Vehicles (%) 2% 2% 2% 3% 3% 3% 1% 1% 1% 2% 2% 2% Adj. Flow (vph) Shared Lane Traffic (%) 44% Lane Group Flow (vph) Enter Blocked Intersection No No No No No No No No No No No No Lane Alignment Left Left Right Left Left Right Left Left Right Left Left Right Median Width(ft) Link Offset(ft) Crosswalk Width(ft) Two way Left Turn Lane Yes Yes Headway Factor Turning Speed (mph) Number of Detectors Detector Template Left Thru Left Thru Right Left Thru Left Thru Leading Detector (ft) Trailing Detector (ft) Detector 1 Position(ft) Detector 1 Size(ft) Detector 1 Type Cl+Ex Cl+Ex Cl+Ex Cl+Ex Cl+Ex Cl+Ex Cl+Ex Cl+Ex Cl+Ex Cl+Ex Detector 1 Channel Detector 1 Extend (s) Detector 1 Queue (s) Detector 1 Delay (s) Detector 2 Position(ft) Detector 2 Size(ft) Detector 2 Type Cl+Ex Cl+Ex Cl+Ex Cl+Ex Detector 2 Channel Detector 2 Extend (s) Turn Type pm+pt NA pm+pt NA pm+ov pm+pt NA pm+pt NA pm+ov Protected Phases Permitted Phases I-480/SR 94 Interchange 2039 Build AM Peak 8:00 am 4/5/2016 Build Scenario Synchro 8 Report Jerry Bollinger Page 1
55 Lanes, Volumes, Timings 3: SR 94 (State Rd)/SR 94 & SR 17 (Brookpark Rd) 7/8/2016 Lane Group EBL EBT EBR WBL WBT WBR NBL NBT NBR SBL SBT SBR Detector Phase Switch Phase Minimum Initial (s) Minimum Split (s) Total Split (s) Total Split (%) 25.0% 35.8% 5.8% 16.7% 18.3% 7.5% 40.0% 18.3% 50.8% 25.0% Yellow Time (s) All-Red Time (s) Lost Time Adjust (s) Total Lost Time (s) Lead/Lag Lead Lag Lead Lag Lead Lead Lag Lead Lag Lead Lead-Lag Optimize? Recall Mode None Max None Max None None C-Min None C-Min None Act Effct Green (s) Actuated g/c Ratio v/c Ratio Control Delay Queue Delay Total Delay LOS F D D F B B E F C A Approach Delay Approach LOS E E E E Queue Length 50th (ft) ~ ~568 ~ Queue Length 95th (ft) # # #707 m#413 m268 m118 Internal Link Dist (ft) Turn Bay Length (ft) Base Capacity (vph) Starvation Cap Reductn Spillback Cap Reductn Storage Cap Reductn Reduced v/c Ratio Intersection Summary Area Type: Other Cycle Length: 120 Actuated Cycle Length: 120 Offset: 0 (0%), Referenced to phase 2:NBTL and 6:SBTL, Start of Green Natural Cycle: 130 Control Type: Actuated-Coordinated Maximum v/c Ratio: 1.17 Intersection Signal Delay: 67.8 Intersection LOS: E Intersection Capacity Utilization 105.8% ICU Level of Service G Analysis Period (min) 15 ~ Volume exceeds capacity, queue is theoretically infinite. Queue shown is maximum after two cycles. # 95th percentile volume exceeds capacity, queue may be longer. Queue shown is maximum after two cycles. m Volume for 95th percentile queue is metered by upstream signal. I-480/SR 94 Interchange 2039 Build AM Peak 8:00 am 4/5/2016 Build Scenario Synchro 8 Report Jerry Bollinger Page 2
56 Lanes, Volumes, Timings 3: SR 94 (State Rd)/SR 94 & SR 17 (Brookpark Rd) 7/8/2016 Splits and Phases: 3: SR 94 (State Rd)/SR 94 & SR 17 (Brookpark Rd) I-480/SR 94 Interchange 2039 Build AM Peak 8:00 am 4/5/2016 Build Scenario Synchro 8 Report Jerry Bollinger Page 3
57 Lanes, Volumes, Timings 7: SR 94 & EB Off-Ramp/EB On-Ramp 7/8/2016 Lane Group EBL EBT EBR WBL WBT WBR NBL NBT NBR SBL SBT SBR Lane Configurations Volume (vph) Ideal Flow (vphpl) Storage Length (ft) Storage Lanes Taper Length (ft) Lane Util. Factor Frt Flt Protected Satd. Flow (prot) Flt Permitted Satd. Flow (perm) Right Turn on Red No Yes Yes Yes Satd. Flow (RTOR) 212 Link Speed (mph) Link Distance (ft) Travel Time (s) Peak Hour Factor Heavy Vehicles (%) 4% 4% 4% 2% 2% 2% 3% 3% 3% 3% 3% 3% Adj. Flow (vph) Shared Lane Traffic (%) Lane Group Flow (vph) Enter Blocked Intersection No No No No No No No No No No No No Lane Alignment R NA Left Right Left Left Right Left Left Right Left Left Right Median Width(ft) Link Offset(ft) Crosswalk Width(ft) Two way Left Turn Lane Headway Factor Turning Speed (mph) Number of Detectors Detector Template Left Right Thru Right Left Thru Leading Detector (ft) Trailing Detector (ft) Detector 1 Position(ft) Detector 1 Size(ft) Detector 1 Type Cl+Ex Cl+Ex Cl+Ex Cl+Ex Cl+Ex Cl+Ex Detector 1 Channel Detector 1 Extend (s) Detector 1 Queue (s) Detector 1 Delay (s) Detector 2 Position(ft) Detector 2 Size(ft) 6 6 Detector 2 Type Cl+Ex Cl+Ex Detector 2 Channel Detector 2 Extend (s) Turn Type Prot Prot NA custom Prot NA Protected Phases Permitted Phases 7 I-480/SR 94 Interchange 2039 Build AM Peak 8:00 am 4/5/2016 Build Scenario Synchro 8 Report Jerry Bollinger Page 4
58 Lanes, Volumes, Timings 7: SR 94 & EB Off-Ramp/EB On-Ramp 7/8/2016 Lane Group ø2 ø3 ø4 ø5 ø6 ø8 Lane Configurations Volume (vph) Ideal Flow (vphpl) Storage Length (ft) Storage Lanes Taper Length (ft) Lane Util. Factor Frt Flt Protected Satd. Flow (prot) Flt Permitted Satd. Flow (perm) Right Turn on Red Satd. Flow (RTOR) Link Speed (mph) Link Distance (ft) Travel Time (s) Peak Hour Factor Heavy Vehicles (%) Adj. Flow (vph) Shared Lane Traffic (%) Lane Group Flow (vph) Enter Blocked Intersection Lane Alignment Median Width(ft) Link Offset(ft) Crosswalk Width(ft) Two way Left Turn Lane Headway Factor Turning Speed (mph) Number of Detectors Detector Template Leading Detector (ft) Trailing Detector (ft) Detector 1 Position(ft) Detector 1 Size(ft) Detector 1 Type Detector 1 Channel Detector 1 Extend (s) Detector 1 Queue (s) Detector 1 Delay (s) Detector 2 Position(ft) Detector 2 Size(ft) Detector 2 Type Detector 2 Channel Detector 2 Extend (s) Turn Type Protected Phases Permitted Phases I-480/SR 94 Interchange 2039 Build AM Peak 8:00 am 4/5/2016 Build Scenario Synchro 8 Report Jerry Bollinger Page 5
59 Lanes, Volumes, Timings 7: SR 94 & EB Off-Ramp/EB On-Ramp 7/8/2016 Lane Group EBL EBT EBR WBL WBT WBR NBL NBT NBR SBL SBT SBR Detector Phase Switch Phase Minimum Initial (s) Minimum Split (s) Total Split (s) Total Split (%) 35.8% 35.8% 25.0% Yellow Time (s) All-Red Time (s) Lost Time Adjust (s) Total Lost Time (s) Lead/Lag Lead Lead Lag Lead-Lag Optimize? Yes Yes Yes Recall Mode Max Max None Act Effct Green (s) Actuated g/c Ratio v/c Ratio Control Delay Queue Delay Total Delay LOS C E D B C A Approach Delay Approach LOS C B Queue Length 50th (ft) Queue Length 95th (ft) 175 #467 m257 m551 # Internal Link Dist (ft) Turn Bay Length (ft) Base Capacity (vph) Starvation Cap Reductn Spillback Cap Reductn Storage Cap Reductn Reduced v/c Ratio Intersection Summary Area Type: Other Cycle Length: 120 Actuated Cycle Length: 120 Offset: 0 (0%), Referenced to phase 2:NBSB and 6:, Start of Green, Master Intersection Natural Cycle: 115 Control Type: Actuated-Coordinated Maximum v/c Ratio: 1.02 Intersection Signal Delay: 32.1 Intersection LOS: C Intersection Capacity Utilization 92.6% ICU Level of Service F Analysis Period (min) 15 # 95th percentile volume exceeds capacity, queue may be longer. Queue shown is maximum after two cycles. m Volume for 95th percentile queue is metered by upstream signal. I-480/SR 94 Interchange 2039 Build AM Peak 8:00 am 4/5/2016 Build Scenario Synchro 8 Report Jerry Bollinger Page 6
60 Lanes, Volumes, Timings 7: SR 94 & EB Off-Ramp/EB On-Ramp 7/8/2016 Splits and Phases: 7: SR 94 & EB Off-Ramp/EB On-Ramp I-480/SR 94 Interchange 2039 Build AM Peak 8:00 am 4/5/2016 Build Scenario Synchro 8 Report Jerry Bollinger Page 7
61 Lanes, Volumes, Timings 7: SR 94 & EB Off-Ramp/EB On-Ramp 7/8/2016 Lane Group ø2 ø3 ø4 ø5 ø6 ø8 Detector Phase Switch Phase Minimum Initial (s) Minimum Split (s) Total Split (s) Total Split (%) 29% 21% 25% 27% 28% 10% Yellow Time (s) All-Red Time (s) Lost Time Adjust (s) Total Lost Time (s) Lead/Lag Lead Lag Lead Lead Lag Lag Lead-Lag Optimize? Yes Yes Yes Yes Yes Yes Recall Mode C-Max Max None Max C-Max None Act Effct Green (s) Actuated g/c Ratio v/c Ratio Control Delay Queue Delay Total Delay LOS Approach Delay Approach LOS Queue Length 50th (ft) Queue Length 95th (ft) Internal Link Dist (ft) Turn Bay Length (ft) Base Capacity (vph) Starvation Cap Reductn Spillback Cap Reductn Storage Cap Reductn Reduced v/c Ratio Intersection Summary I-480/SR 94 Interchange 2039 Build AM Peak 8:00 am 4/5/2016 Build Scenario Synchro 8 Report Jerry Bollinger Page 8
62 Lanes, Volumes, Timings 10: SR 94 & WB On-Ramp/WB Off-Ramp 7/8/2016 Lane Group EBL EBT EBR WBL WBT WBR NBL NBT NBR SBL SBT SBR Lane Configurations Volume (vph) Ideal Flow (vphpl) Storage Length (ft) Storage Lanes Taper Length (ft) Lane Util. Factor Frt Flt Protected Satd. Flow (prot) Flt Permitted Satd. Flow (perm) Right Turn on Red Yes Yes Yes Yes Satd. Flow (RTOR) Link Speed (mph) Link Distance (ft) Travel Time (s) Peak Hour Factor Heavy Vehicles (%) 2% 2% 2% 5% 5% 5% 3% 3% 3% 2% 2% 2% Adj. Flow (vph) Shared Lane Traffic (%) Lane Group Flow (vph) Enter Blocked Intersection No No No No No No No No No No No No Lane Alignment Left Left Right Right Left Right Left Left Right Left Left Right Median Width(ft) Link Offset(ft) Crosswalk Width(ft) Two way Left Turn Lane Headway Factor Turning Speed (mph) Number of Detectors Detector Template Left Right Left Thru Thru Right Leading Detector (ft) Trailing Detector (ft) Detector 1 Position(ft) Detector 1 Size(ft) Detector 1 Type Cl+Ex Cl+Ex Cl+Ex Cl+Ex Cl+Ex Cl+Ex Detector 1 Channel Detector 1 Extend (s) Detector 1 Queue (s) Detector 1 Delay (s) Detector 2 Position(ft) Detector 2 Size(ft) 6 6 Detector 2 Type Cl+Ex Cl+Ex Detector 2 Channel Detector 2 Extend (s) Turn Type Prot Prot Prot NA NA Prot Protected Phases Permitted Phases I-480/SR 94 Interchange 2039 Build AM Peak 8:00 am 4/5/2016 Build Scenario Synchro 8 Report Jerry Bollinger Page 9
63 Lanes, Volumes, Timings 10: SR 94 & WB On-Ramp/WB Off-Ramp 7/8/2016 Lane Group ø1 ø2 ø4 ø6 ø7 ø8 Lane Configurations Volume (vph) Ideal Flow (vphpl) Storage Length (ft) Storage Lanes Taper Length (ft) Lane Util. Factor Frt Flt Protected Satd. Flow (prot) Flt Permitted Satd. Flow (perm) Right Turn on Red Satd. Flow (RTOR) Link Speed (mph) Link Distance (ft) Travel Time (s) Peak Hour Factor Heavy Vehicles (%) Adj. Flow (vph) Shared Lane Traffic (%) Lane Group Flow (vph) Enter Blocked Intersection Lane Alignment Median Width(ft) Link Offset(ft) Crosswalk Width(ft) Two way Left Turn Lane Headway Factor Turning Speed (mph) Number of Detectors Detector Template Leading Detector (ft) Trailing Detector (ft) Detector 1 Position(ft) Detector 1 Size(ft) Detector 1 Type Detector 1 Channel Detector 1 Extend (s) Detector 1 Queue (s) Detector 1 Delay (s) Detector 2 Position(ft) Detector 2 Size(ft) Detector 2 Type Detector 2 Channel Detector 2 Extend (s) Turn Type Protected Phases Permitted Phases I-480/SR 94 Interchange 2039 Build AM Peak 8:00 am 4/5/2016 Build Scenario Synchro 8 Report Jerry Bollinger Page 10
64 Lanes, Volumes, Timings 10: SR 94 & WB On-Ramp/WB Off-Ramp 7/8/2016 Lane Group EBL EBT EBR WBL WBT WBR NBL NBT NBR SBL SBT SBR Detector Phase Switch Phase Minimum Initial (s) Minimum Split (s) Total Split (s) Total Split (%) 20.8% 20.8% 26.7% Yellow Time (s) All-Red Time (s) Lost Time Adjust (s) Total Lost Time (s) Lead/Lag Lag Lag Lead Lead-Lag Optimize? Yes Yes Yes Recall Mode Max Max Max Act Effct Green (s) Actuated g/c Ratio v/c Ratio Control Delay Queue Delay Total Delay LOS D A D A C B Approach Delay Approach LOS C B Queue Length 50th (ft) ~ Queue Length 95th (ft) # Internal Link Dist (ft) Turn Bay Length (ft) Base Capacity (vph) Starvation Cap Reductn Spillback Cap Reductn Storage Cap Reductn Reduced v/c Ratio Intersection Summary Area Type: Other Cycle Length: 120 Actuated Cycle Length: 120 Offset: 0 (0%), Referenced to phase 2:NBSB and 6:, Start of Green, Master Intersection Natural Cycle: 115 Control Type: Actuated-Coordinated Maximum v/c Ratio: 1.02 Intersection Signal Delay: 24.8 Intersection LOS: C Intersection Capacity Utilization 92.6% ICU Level of Service F Analysis Period (min) 15 ~ Volume exceeds capacity, queue is theoretically infinite. Queue shown is maximum after two cycles. # 95th percentile volume exceeds capacity, queue may be longer. Queue shown is maximum after two cycles. I-480/SR 94 Interchange 2039 Build AM Peak 8:00 am 4/5/2016 Build Scenario Synchro 8 Report Jerry Bollinger Page 11
65 Lanes, Volumes, Timings 10: SR 94 & WB On-Ramp/WB Off-Ramp 7/8/2016 Splits and Phases: 10: SR 94 & WB On-Ramp/WB Off-Ramp I-480/SR 94 Interchange 2039 Build AM Peak 8:00 am 4/5/2016 Build Scenario Synchro 8 Report Jerry Bollinger Page 12
66 Lanes, Volumes, Timings 10: SR 94 & WB On-Ramp/WB Off-Ramp 7/8/2016 Lane Group ø1 ø2 ø4 ø6 ø7 ø8 Detector Phase Switch Phase Minimum Initial (s) Minimum Split (s) Total Split (s) Total Split (%) 25% 29% 25% 28% 36% 10% Yellow Time (s) All-Red Time (s) Lost Time Adjust (s) Total Lost Time (s) Lead/Lag Lag Lead Lead Lag Lead Lag Lead-Lag Optimize? Yes Yes Yes Yes Yes Yes Recall Mode None C-Max None C-Max Max None Act Effct Green (s) Actuated g/c Ratio v/c Ratio Control Delay Queue Delay Total Delay LOS Approach Delay Approach LOS Queue Length 50th (ft) Queue Length 95th (ft) Internal Link Dist (ft) Turn Bay Length (ft) Base Capacity (vph) Starvation Cap Reductn Spillback Cap Reductn Storage Cap Reductn Reduced v/c Ratio Intersection Summary I-480/SR 94 Interchange 2039 Build AM Peak 8:00 am 4/5/2016 Build Scenario Synchro 8 Report Jerry Bollinger Page 13
67 Lanes, Volumes, Timings 13: SR 94 & Burger Ave./Ralph Ave. 7/8/2016 Lane Group EBL EBT EBR WBL WBT WBR NBL NBT NBR SBL SBT SBR Lane Configurations Volume (vph) Ideal Flow (vphpl) Storage Length (ft) Storage Lanes Taper Length (ft) Lane Util. Factor Frt Flt Protected Satd. Flow (prot) Flt Permitted Satd. Flow (perm) Right Turn on Red Yes Yes Yes Yes Satd. Flow (RTOR) Link Speed (mph) Link Distance (ft) Travel Time (s) Peak Hour Factor Heavy Vehicles (%) 3% 3% 3% 1% 1% 1% 2% 2% 2% 2% 2% 2% Adj. Flow (vph) Shared Lane Traffic (%) Lane Group Flow (vph) Enter Blocked Intersection No No No No No No No No No No No No Lane Alignment Left Left Right Left Left Right Left Left Right Left Left Right Median Width(ft) Link Offset(ft) Crosswalk Width(ft) Two way Left Turn Lane Headway Factor Turning Speed (mph) Number of Detectors Detector Template Left Thru Left Thru Left Thru Left Thru Leading Detector (ft) Trailing Detector (ft) Detector 1 Position(ft) Detector 1 Size(ft) Detector 1 Type Cl+Ex Cl+Ex Cl+Ex Cl+Ex Cl+Ex Cl+Ex Cl+Ex Cl+Ex Detector 1 Channel Detector 1 Extend (s) Detector 1 Queue (s) Detector 1 Delay (s) Detector 2 Position(ft) Detector 2 Size(ft) Detector 2 Type Cl+Ex Cl+Ex Cl+Ex Cl+Ex Detector 2 Channel Detector 2 Extend (s) Turn Type Perm NA Perm NA Perm NA Perm NA Protected Phases Permitted Phases I-480/SR 94 Interchange 2039 Build AM Peak 8:00 am 4/5/2016 Build Scenario Synchro 8 Report Jerry Bollinger Page 14
68 Lanes, Volumes, Timings 13: SR 94 & Burger Ave./Ralph Ave. 7/8/2016 Lane Group EBL EBT EBR WBL WBT WBR NBL NBT NBR SBL SBT SBR Detector Phase Switch Phase Minimum Initial (s) Minimum Split (s) Total Split (s) Total Split (%) 36.7% 36.7% 36.7% 36.7% 63.3% 63.3% 63.3% 63.3% Yellow Time (s) All-Red Time (s) Lost Time Adjust (s) Total Lost Time (s) Lead/Lag Lead-Lag Optimize? Recall Mode Max Max Max Max C-Min C-Min C-Min C-Min Act Effct Green (s) Actuated g/c Ratio v/c Ratio Control Delay Queue Delay Total Delay LOS B B A B B Approach Delay Approach LOS B B B B Queue Length 50th (ft) Queue Length 95th (ft) m Internal Link Dist (ft) Turn Bay Length (ft) 100 Base Capacity (vph) Starvation Cap Reductn Spillback Cap Reductn Storage Cap Reductn Reduced v/c Ratio Intersection Summary Area Type: Other Cycle Length: 60 Actuated Cycle Length: 60 Offset: 0 (0%), Referenced to phase 2:NBTL and 6:SBTL, Start of Green Natural Cycle: 60 Control Type: Actuated-Coordinated Maximum v/c Ratio: 0.46 Intersection Signal Delay: 12.0 Intersection LOS: B Intersection Capacity Utilization 43.5% ICU Level of Service A Analysis Period (min) 15 m Volume for 95th percentile queue is metered by upstream signal. Splits and Phases: 13: SR 94 & Burger Ave./Ralph Ave. I-480/SR 94 Interchange 2039 Build AM Peak 8:00 am 4/5/2016 Build Scenario Synchro 8 Report Jerry Bollinger Page 15
69 Lanes, Volumes, Timings 3: SR 94 (State Rd)/SR 94 & SR 17 (Brookpark Rd) 8/16/2016 Lane Group EBL EBT EBR WBL WBT WBR NBL NBT NBR SBL SBT SBR Lane Configurations Volume (vph) Ideal Flow (vphpl) Storage Length (ft) Storage Lanes Taper Length (ft) Lane Util. Factor Frt Flt Protected Satd. Flow (prot) Flt Permitted Satd. Flow (perm) Right Turn on Red Yes Yes Yes Yes Satd. Flow (RTOR) Link Speed (mph) Link Distance (ft) Travel Time (s) Peak Hour Factor Heavy Vehicles (%) 2% 2% 2% 3% 3% 3% 1% 1% 1% 2% 2% 2% Adj. Flow (vph) Shared Lane Traffic (%) Lane Group Flow (vph) Enter Blocked Intersection No No No No No No No No No No No No Lane Alignment Left Left Right Left Left Right Left Left Right Left Left Right Median Width(ft) Link Offset(ft) Crosswalk Width(ft) Two way Left Turn Lane Yes Yes Headway Factor Turning Speed (mph) Number of Detectors Detector Template Left Thru Left Thru Left Left Leading Detector (ft) Trailing Detector (ft) Detector 1 Position(ft) Detector 1 Size(ft) Detector 1 Type Cl+Ex Cl+Ex Cl+Ex Cl+Ex Cl+Ex Cl+Ex Cl+Ex Cl+Ex Cl+Ex Detector 1 Channel Detector 1 Extend (s) Detector 1 Queue (s) Detector 1 Delay (s) Turn Type pm+pt NA pm+pt NA pm+pt NA pm+pt NA pm+ov Protected Phases Permitted Phases Detector Phase Switch Phase Minimum Initial (s) Minimum Split (s) Total Split (s) I-480/SR 94 Interchange 2039 No Build PM Peak 5:00 pm 4/5/2016 No-Build Synchro 8 Report Jerry Bollinger Page 1
70 Lanes, Volumes, Timings 3: SR 94 (State Rd)/SR 94 & SR 17 (Brookpark Rd) 8/16/2016 Lane Group EBL EBT EBR WBL WBT WBR NBL NBT NBR SBL SBT SBR Total Split (%) 16.7% 28.7% 16.7% 28.7% 16.7% 34.7% 20.0% 38.0% 16.7% Maximum Green (s) Yellow Time (s) All-Red Time (s) Lost Time Adjust (s) Total Lost Time (s) Lead/Lag Lead Lag Lead Lag Lead Lag Lead Lag Lead Lead-Lag Optimize? Vehicle Extension (s) Recall Mode None Max None Max None Min None Min None Walk Time (s) Flash Dont Walk (s) Pedestrian Calls (#/hr) Act Effct Green (s) Actuated g/c Ratio v/c Ratio Control Delay Queue Delay Total Delay LOS F D D F D E F E C Approach Delay Approach LOS F F E E Queue Length 50th (ft) ~ ~ Queue Length 95th (ft) # #300 # #521 # Internal Link Dist (ft) Turn Bay Length (ft) Base Capacity (vph) Starvation Cap Reductn Spillback Cap Reductn Storage Cap Reductn Reduced v/c Ratio Intersection Summary Area Type: Other Cycle Length: 150 Actuated Cycle Length: Natural Cycle: 150 Control Type: Semi Act-Uncoord Maximum v/c Ratio: 1.24 Intersection Signal Delay: 81.1 Intersection LOS: F Intersection Capacity Utilization 108.7% ICU Level of Service G Analysis Period (min) 15 ~ Volume exceeds capacity, queue is theoretically infinite. Queue shown is maximum after two cycles. # 95th percentile volume exceeds capacity, queue may be longer. Queue shown is maximum after two cycles. Splits and Phases: 3: SR 94 (State Rd)/SR 94 & SR 17 (Brookpark Rd) I-480/SR 94 Interchange 2039 No Build PM Peak 5:00 pm 4/5/2016 No-Build Synchro 8 Report Jerry Bollinger Page 2
71 Lanes, Volumes, Timings 7: SR 94 & EB Off-Ramp/EB On-Ramp 8/16/2016 Lane Group EBL EBT EBR WBL WBT WBR NBL NBT NBR SBL SBT SBR Lane Configurations Volume (vph) Ideal Flow (vphpl) Storage Length (ft) Storage Lanes Taper Length (ft) Lane Util. Factor *0.61 * Frt Flt Protected Satd. Flow (prot) Flt Permitted Satd. Flow (perm) Right Turn on Red No Yes Yes Yes Satd. Flow (RTOR) Link Speed (mph) Link Distance (ft) Travel Time (s) Peak Hour Factor Heavy Vehicles (%) 4% 4% 4% 2% 2% 2% 3% 3% 3% 3% 3% 3% Adj. Flow (vph) Shared Lane Traffic (%) 38% Lane Group Flow (vph) Enter Blocked Intersection No No No No No No No No No No No No Lane Alignment R NA Left Right Left Left Right Left Right Right Left Left Right Median Width(ft) Link Offset(ft) Crosswalk Width(ft) Two way Left Turn Lane Headway Factor Turning Speed (mph) Turn Type Prot Prot NA custom Prot NA Protected Phases Permitted Phases 2 Minimum Split (s) Total Split (s) Total Split (%) 35.0% 35.0% 40.0% 35.0% 25.0% 65.0% Maximum Green (s) Yellow Time (s) All-Red Time (s) Lost Time Adjust (s) Total Lost Time (s) Lead/Lag Lag Lead Lead-Lag Optimize? Yes Yes Walk Time (s) 7.0 Flash Dont Walk (s) 20.0 Pedestrian Calls (#/hr) 0 Act Effct Green (s) Actuated g/c Ratio v/c Ratio I-480/SR 94 Interchange 2039 No Build PM Peak 5:00 pm 4/5/2016 No-Build Synchro 8 Report Jerry Bollinger Page 3
72 Lanes, Volumes, Timings 7: SR 94 & EB Off-Ramp/EB On-Ramp 8/16/2016 Lane Group EBL EBT EBR WBL WBT WBR NBL NBT NBR SBL SBT SBR Control Delay Queue Delay Total Delay LOS C F F A D A Approach Delay Approach LOS E A Queue Length 50th (ft) 109 ~383 ~ Queue Length 95th (ft) 154 #516 # m140 m71 Internal Link Dist (ft) Turn Bay Length (ft) Base Capacity (vph) Starvation Cap Reductn Spillback Cap Reductn Storage Cap Reductn Reduced v/c Ratio Intersection Summary Area Type: Other Cycle Length: 100 Actuated Cycle Length: 100 Offset: 0 (0%), Referenced to phase 2:NBT and 6:SBT, Start of Green, Master Intersection Natural Cycle: 120 Control Type: Pretimed Maximum v/c Ratio: 1.14 Intersection Signal Delay: 52.7 Intersection LOS: D Intersection Capacity Utilization 110.9% ICU Level of Service H Analysis Period (min) 15 * User Entered Value ~ Volume exceeds capacity, queue is theoretically infinite. Queue shown is maximum after two cycles. # 95th percentile volume exceeds capacity, queue may be longer. Queue shown is maximum after two cycles. m Volume for 95th percentile queue is metered by upstream signal. Splits and Phases: 7: SR 94 & EB Off-Ramp/EB On-Ramp I-480/SR 94 Interchange 2039 No Build PM Peak 5:00 pm 4/5/2016 No-Build Synchro 8 Report Jerry Bollinger Page 4
73 Lanes, Volumes, Timings 10: SR 94 & WB On-Ramp/WB Off-Ramp 8/16/2016 Lane Group EBL EBT EBR WBL WBT WBR NBL NBT NBR SBL SBT SBR Lane Configurations Volume (vph) Ideal Flow (vphpl) Storage Length (ft) Storage Lanes Taper Length (ft) Lane Util. Factor Frt Flt Protected Satd. Flow (prot) Flt Permitted Satd. Flow (perm) Right Turn on Red Yes Yes Yes Yes Satd. Flow (RTOR) Link Speed (mph) Link Distance (ft) Travel Time (s) Peak Hour Factor Heavy Vehicles (%) 2% 2% 2% 5% 5% 5% 3% 3% 3% 2% 2% 2% Adj. Flow (vph) Shared Lane Traffic (%) Lane Group Flow (vph) Enter Blocked Intersection No No No No No No No No No No No No Lane Alignment Left Left Right R NA Left Right Left Left Right Left Right Right Median Width(ft) Link Offset(ft) Crosswalk Width(ft) Two way Left Turn Lane Headway Factor Turning Speed (mph) Turn Type Prot Prot Prot NA NA Protected Phases Permitted Phases Minimum Split (s) Total Split (s) Total Split (%) 41.0% 41.0% 28.0% 59.0% 31.0% Maximum Green (s) Yellow Time (s) All-Red Time (s) Lost Time Adjust (s) Total Lost Time (s) Lead/Lag Lag Lead Lead-Lag Optimize? Yes Yes Walk Time (s) 7.0 Flash Dont Walk (s) 14.0 Pedestrian Calls (#/hr) 0 Act Effct Green (s) Actuated g/c Ratio v/c Ratio I-480/SR 94 Interchange 2039 No Build PM Peak 5:00 pm 4/5/2016 No-Build Synchro 8 Report Jerry Bollinger Page 5
74 Lanes, Volumes, Timings 10: SR 94 & WB On-Ramp/WB Off-Ramp 8/16/2016 Lane Group EBL EBT EBR WBL WBT WBR NBL NBT NBR SBL SBT SBR Control Delay Queue Delay Total Delay LOS D B C A D Approach Delay Approach LOS B D Queue Length 50th (ft) Queue Length 95th (ft) # m225 m46 #315 Internal Link Dist (ft) Turn Bay Length (ft) Base Capacity (vph) Starvation Cap Reductn Spillback Cap Reductn Storage Cap Reductn Reduced v/c Ratio Intersection Summary Area Type: Other Cycle Length: 100 Actuated Cycle Length: 100 Offset: 0 (0%), Referenced to phase 2:NBT and 6:SBT, Start of Green Natural Cycle: 85 Control Type: Pretimed Maximum v/c Ratio: 0.94 Intersection Signal Delay: 33.1 Intersection LOS: C Intersection Capacity Utilization 110.9% ICU Level of Service H Analysis Period (min) 15 # 95th percentile volume exceeds capacity, queue may be longer. Queue shown is maximum after two cycles. m Volume for 95th percentile queue is metered by upstream signal. Splits and Phases: 10: SR 94 & WB On-Ramp/WB Off-Ramp I-480/SR 94 Interchange 2039 No Build PM Peak 5:00 pm 4/5/2016 No-Build Synchro 8 Report Jerry Bollinger Page 6
75 Lanes, Volumes, Timings 13: SR 94 & Burger Ave./Ralph Ave. 8/16/2016 Lane Group EBL EBT EBR WBL WBT WBR NBL NBT NBR SBL SBT SBR Lane Configurations Volume (vph) Ideal Flow (vphpl) Lane Util. Factor Frt Flt Protected Satd. Flow (prot) Flt Permitted Satd. Flow (perm) Right Turn on Red Yes Yes Yes Yes Satd. Flow (RTOR) Link Speed (mph) Link Distance (ft) Travel Time (s) Peak Hour Factor Heavy Vehicles (%) 3% 3% 3% 1% 1% 1% 2% 2% 2% 2% 2% 2% Adj. Flow (vph) Shared Lane Traffic (%) Lane Group Flow (vph) Enter Blocked Intersection No No No No No No No No No No No No Lane Alignment Left Left Right Left Left Right Left Left Right Left Left Right Median Width(ft) Link Offset(ft) Crosswalk Width(ft) Two way Left Turn Lane Headway Factor Turning Speed (mph) Turn Type Perm NA Perm NA Perm NA Perm NA Protected Phases Permitted Phases Minimum Split (s) Total Split (s) Total Split (%) 25.0% 25.0% 25.0% 25.0% 75.0% 75.0% 75.0% 75.0% Maximum Green (s) Yellow Time (s) All-Red Time (s) Lost Time Adjust (s) Total Lost Time (s) Lead/Lag Lead-Lag Optimize? Walk Time (s) Flash Dont Walk (s) Pedestrian Calls (#/hr) Act Effct Green (s) Actuated g/c Ratio v/c Ratio Control Delay Queue Delay Total Delay I-480/SR 94 Interchange 2039 No Build PM Peak 5:00 pm 4/5/2016 No-Build Synchro 8 Report Jerry Bollinger Page 7
76 Lanes, Volumes, Timings 13: SR 94 & Burger Ave./Ralph Ave. 8/16/2016 Lane Group EBL EBT EBR WBL WBT WBR NBL NBT NBR SBL SBT SBR LOS C D A A Approach Delay Approach LOS C D A A Queue Length 50th (ft) Queue Length 95th (ft) Internal Link Dist (ft) Turn Bay Length (ft) Base Capacity (vph) Starvation Cap Reductn Spillback Cap Reductn Storage Cap Reductn Reduced v/c Ratio Intersection Summary Area Type: Other Cycle Length: 120 Actuated Cycle Length: 120 Offset: 0 (0%), Referenced to phase 2:NBTL and 6:SBTL, Start of Green Natural Cycle: 60 Control Type: Pretimed Maximum v/c Ratio: 0.43 Intersection Signal Delay: 11.4 Intersection LOS: B Intersection Capacity Utilization 66.0% ICU Level of Service C Analysis Period (min) 15 Splits and Phases: 13: SR 94 & Burger Ave./Ralph Ave. I-480/SR 94 Interchange 2039 No Build PM Peak 5:00 pm 4/5/2016 No-Build Synchro 8 Report Jerry Bollinger Page 8
77 Lanes, Volumes, Timings 3: SR 94 (State Rd)/SR 94 & SR 17 (Brookpark Rd) 8/16/2016 Lane Group EBL EBT EBR WBL WBT WBR NBL NBT NBR SBL SBT SBR Lane Configurations Volume (vph) Ideal Flow (vphpl) Storage Length (ft) Storage Lanes Taper Length (ft) Lane Util. Factor Frt Flt Protected Satd. Flow (prot) Flt Permitted Satd. Flow (perm) Right Turn on Red Yes Yes Yes Yes Satd. Flow (RTOR) Link Speed (mph) Link Distance (ft) Travel Time (s) Peak Hour Factor Heavy Vehicles (%) 2% 2% 2% 3% 3% 3% 1% 1% 1% 2% 2% 2% Adj. Flow (vph) Shared Lane Traffic (%) 31% Lane Group Flow (vph) Enter Blocked Intersection No No No No No No No No No No No No Lane Alignment Left Left Right Left Left Right Left Left Right Left Left Right Median Width(ft) Link Offset(ft) Crosswalk Width(ft) Two way Left Turn Lane Yes Yes Headway Factor Turning Speed (mph) Number of Detectors Detector Template Left Thru Left Thru Right Left Thru Left Thru Leading Detector (ft) Trailing Detector (ft) Detector 1 Position(ft) Detector 1 Size(ft) Detector 1 Type Cl+Ex Cl+Ex Cl+Ex Cl+Ex Cl+Ex Cl+Ex Cl+Ex Cl+Ex Cl+Ex Cl+Ex Detector 1 Channel Detector 1 Extend (s) Detector 1 Queue (s) Detector 1 Delay (s) Detector 2 Position(ft) Detector 2 Size(ft) Detector 2 Type Cl+Ex Cl+Ex Cl+Ex Cl+Ex Detector 2 Channel Detector 2 Extend (s) Turn Type pm+pt NA pm+pt NA pm+ov pm+pt NA pm+pt NA pm+ov Protected Phases Permitted Phases I-480/SR 94 Interchange 2039 Build PM Peak 5:00 pm 4/5/2016 Build Scenario Synchro 8 Report Jerry Bollinger Page 1
78 Lanes, Volumes, Timings 3: SR 94 (State Rd)/SR 94 & SR 17 (Brookpark Rd) 8/16/2016 Lane Group EBL EBT EBR WBL WBT WBR NBL NBT NBR SBL SBT SBR Detector Phase Switch Phase Minimum Initial (s) Minimum Split (s) Total Split (s) Total Split (%) 20.8% 35.8% 13.3% 28.3% 20.8% 8.3% 30.0% 20.8% 42.5% 20.8% Yellow Time (s) All-Red Time (s) Lost Time Adjust (s) Total Lost Time (s) Lead/Lag Lead Lag Lead Lag Lead Lead Lag Lead Lag Lead Lead-Lag Optimize? Recall Mode None Max None Max None None C-Min None C-Min None Act Effct Green (s) Actuated g/c Ratio v/c Ratio Control Delay Queue Delay Total Delay LOS F D D E B D E E E C Approach Delay Approach LOS E E E D Queue Length 50th (ft) ~ ~ ~247 ~ Queue Length 95th (ft) # #234 # #104 #489 m#343 m#652 m202 Internal Link Dist (ft) Turn Bay Length (ft) Base Capacity (vph) Starvation Cap Reductn Spillback Cap Reductn Storage Cap Reductn Reduced v/c Ratio Intersection Summary Area Type: Other Cycle Length: 120 Actuated Cycle Length: 120 Offset: 0 (0%), Referenced to phase 2:NBTL and 6:SBTL, Start of Green Natural Cycle: 120 Control Type: Actuated-Coordinated Maximum v/c Ratio: 1.03 Intersection Signal Delay: 57.7 Intersection LOS: E Intersection Capacity Utilization 98.9% ICU Level of Service F Analysis Period (min) 15 ~ Volume exceeds capacity, queue is theoretically infinite. Queue shown is maximum after two cycles. # 95th percentile volume exceeds capacity, queue may be longer. Queue shown is maximum after two cycles. m Volume for 95th percentile queue is metered by upstream signal. I-480/SR 94 Interchange 2039 Build PM Peak 5:00 pm 4/5/2016 Build Scenario Synchro 8 Report Jerry Bollinger Page 2
79 Lanes, Volumes, Timings 3: SR 94 (State Rd)/SR 94 & SR 17 (Brookpark Rd) 8/16/2016 Splits and Phases: 3: SR 94 (State Rd)/SR 94 & SR 17 (Brookpark Rd) I-480/SR 94 Interchange 2039 Build PM Peak 5:00 pm 4/5/2016 Build Scenario Synchro 8 Report Jerry Bollinger Page 3
80 Lanes, Volumes, Timings 7: SR 94 & EB Off-Ramp/EB On-Ramp 8/16/2016 Lane Group EBL EBT EBR WBL WBT WBR NBL NBT NBR SBL SBT SBR Lane Configurations Volume (vph) Ideal Flow (vphpl) Storage Length (ft) Storage Lanes Taper Length (ft) Lane Util. Factor Frt Flt Protected Satd. Flow (prot) Flt Permitted Satd. Flow (perm) Right Turn on Red No Yes Yes Yes Satd. Flow (RTOR) 598 Link Speed (mph) Link Distance (ft) Travel Time (s) Peak Hour Factor Heavy Vehicles (%) 4% 4% 4% 2% 2% 2% 3% 3% 3% 3% 3% 3% Adj. Flow (vph) Shared Lane Traffic (%) Lane Group Flow (vph) Enter Blocked Intersection No No No No No No No No No No No No Lane Alignment R NA Left Right Left Left Right Left Left Right Left Left Right Median Width(ft) Link Offset(ft) Crosswalk Width(ft) Two way Left Turn Lane Headway Factor Turning Speed (mph) Number of Detectors Detector Template Left Right Thru Right Left Thru Leading Detector (ft) Trailing Detector (ft) Detector 1 Position(ft) Detector 1 Size(ft) Detector 1 Type Cl+Ex Cl+Ex Cl+Ex Cl+Ex Cl+Ex Cl+Ex Detector 1 Channel Detector 1 Extend (s) Detector 1 Queue (s) Detector 1 Delay (s) Detector 2 Position(ft) Detector 2 Size(ft) 6 6 Detector 2 Type Cl+Ex Cl+Ex Detector 2 Channel Detector 2 Extend (s) Turn Type Prot Prot NA Prot Prot NA Protected Phases Permitted Phases I-480/SR 94 Interchange 2039 Build PM Peak 5:00 pm 4/5/2016 Build Scenario Synchro 8 Report Jerry Bollinger Page 4
81 Lanes, Volumes, Timings 7: SR 94 & EB Off-Ramp/EB On-Ramp 8/16/2016 Lane Group ø2 ø3 ø4 ø5 ø6 ø8 Lane Configurations Volume (vph) Ideal Flow (vphpl) Storage Length (ft) Storage Lanes Taper Length (ft) Lane Util. Factor Frt Flt Protected Satd. Flow (prot) Flt Permitted Satd. Flow (perm) Right Turn on Red Satd. Flow (RTOR) Link Speed (mph) Link Distance (ft) Travel Time (s) Peak Hour Factor Heavy Vehicles (%) Adj. Flow (vph) Shared Lane Traffic (%) Lane Group Flow (vph) Enter Blocked Intersection Lane Alignment Median Width(ft) Link Offset(ft) Crosswalk Width(ft) Two way Left Turn Lane Headway Factor Turning Speed (mph) Number of Detectors Detector Template Leading Detector (ft) Trailing Detector (ft) Detector 1 Position(ft) Detector 1 Size(ft) Detector 1 Type Detector 1 Channel Detector 1 Extend (s) Detector 1 Queue (s) Detector 1 Delay (s) Detector 2 Position(ft) Detector 2 Size(ft) Detector 2 Type Detector 2 Channel Detector 2 Extend (s) Turn Type Protected Phases Permitted Phases I-480/SR 94 Interchange 2039 Build PM Peak 5:00 pm 4/5/2016 Build Scenario Synchro 8 Report Jerry Bollinger Page 5
82 Lanes, Volumes, Timings 7: SR 94 & EB Off-Ramp/EB On-Ramp 8/16/2016 Lane Group EBL EBT EBR WBL WBT WBR NBL NBT NBR SBL SBT SBR Detector Phase Switch Phase Minimum Initial (s) Minimum Split (s) Total Split (s) Total Split (%) 36.7% 36.7% 20.8% Yellow Time (s) All-Red Time (s) Lost Time Adjust (s) Total Lost Time (s) Lead/Lag Lead Lead Lag Lead-Lag Optimize? Yes Yes Yes Recall Mode Max Max None Act Effct Green (s) Actuated g/c Ratio v/c Ratio Control Delay Queue Delay Total Delay LOS C F C B E E Approach Delay Approach LOS C E Queue Length 50th (ft) 128 ~ Queue Length 95th (ft) 173 #571 m267 m141 #309 m377 Internal Link Dist (ft) Turn Bay Length (ft) Base Capacity (vph) Starvation Cap Reductn Spillback Cap Reductn Storage Cap Reductn Reduced v/c Ratio Intersection Summary Area Type: Other Cycle Length: 120 Actuated Cycle Length: 120 Offset: 0 (0%), Referenced to phase 2:NBSB and 6:, Start of Green, Master Intersection Natural Cycle: 125 Control Type: Actuated-Coordinated Maximum v/c Ratio: 1.10 Intersection Signal Delay: 51.6 Intersection LOS: D Intersection Capacity Utilization 124.4% ICU Level of Service H Analysis Period (min) 15 ~ Volume exceeds capacity, queue is theoretically infinite. Queue shown is maximum after two cycles. # 95th percentile volume exceeds capacity, queue may be longer. Queue shown is maximum after two cycles. m Volume for 95th percentile queue is metered by upstream signal. I-480/SR 94 Interchange 2039 Build PM Peak 5:00 pm 4/5/2016 Build Scenario Synchro 8 Report Jerry Bollinger Page 6
83 Lanes, Volumes, Timings 7: SR 94 & EB Off-Ramp/EB On-Ramp 8/16/2016 Splits and Phases: 7: SR 94 & EB Off-Ramp/EB On-Ramp I-480/SR 94 Interchange 2039 Build PM Peak 5:00 pm 4/5/2016 Build Scenario Synchro 8 Report Jerry Bollinger Page 7
84 Lanes, Volumes, Timings 7: SR 94 & EB Off-Ramp/EB On-Ramp 8/16/2016 Lane Group ø2 ø3 ø4 ø5 ø6 ø8 Detector Phase Switch Phase Minimum Initial (s) Minimum Split (s) Total Split (s) Total Split (%) 26% 35% 18% 23% 23% 17% Yellow Time (s) All-Red Time (s) Lost Time Adjust (s) Total Lost Time (s) Lead/Lag Lead Lag Lead Lead Lag Lag Lead-Lag Optimize? Yes Yes Yes Yes Yes Yes Recall Mode C-Max Max None Max C-Max None Act Effct Green (s) Actuated g/c Ratio v/c Ratio Control Delay Queue Delay Total Delay LOS Approach Delay Approach LOS Queue Length 50th (ft) Queue Length 95th (ft) Internal Link Dist (ft) Turn Bay Length (ft) Base Capacity (vph) Starvation Cap Reductn Spillback Cap Reductn Storage Cap Reductn Reduced v/c Ratio Intersection Summary I-480/SR 94 Interchange 2039 Build PM Peak 5:00 pm 4/5/2016 Build Scenario Synchro 8 Report Jerry Bollinger Page 8
85 Lanes, Volumes, Timings 10: SR 94 & WB On-Ramp/WB Off-Ramp 8/16/2016 Lane Group EBL EBT EBR WBL WBT WBR NBL NBT NBR SBL SBT SBR Lane Configurations Volume (vph) Ideal Flow (vphpl) Storage Length (ft) Storage Lanes Taper Length (ft) Lane Util. Factor Frt Flt Protected Satd. Flow (prot) Flt Permitted Satd. Flow (perm) Right Turn on Red Yes Yes Yes Yes Satd. Flow (RTOR) Link Speed (mph) Link Distance (ft) Travel Time (s) Peak Hour Factor Heavy Vehicles (%) 2% 2% 2% 5% 5% 5% 3% 3% 3% 2% 2% 2% Adj. Flow (vph) Shared Lane Traffic (%) Lane Group Flow (vph) Enter Blocked Intersection No No No No No No No No No No No No Lane Alignment Left Left Right Right Left Right Left Left Right Left Left Right Median Width(ft) Link Offset(ft) Crosswalk Width(ft) Two way Left Turn Lane Headway Factor Turning Speed (mph) Number of Detectors Detector Template Left Right Left Thru Thru Right Leading Detector (ft) Trailing Detector (ft) Detector 1 Position(ft) Detector 1 Size(ft) Detector 1 Type Cl+Ex Cl+Ex Cl+Ex Cl+Ex Cl+Ex Cl+Ex Detector 1 Channel Detector 1 Extend (s) Detector 1 Queue (s) Detector 1 Delay (s) Detector 2 Position(ft) Detector 2 Size(ft) 6 6 Detector 2 Type Cl+Ex Cl+Ex Detector 2 Channel Detector 2 Extend (s) Turn Type Prot Prot Prot NA NA Prot Protected Phases Permitted Phases I-480/SR 94 Interchange 2039 Build PM Peak 5:00 pm 4/5/2016 Build Scenario Synchro 8 Report Jerry Bollinger Page 9
86 Lanes, Volumes, Timings 10: SR 94 & WB On-Ramp/WB Off-Ramp 8/16/2016 Lane Group ø1 ø2 ø4 ø6 ø7 ø8 Lane Configurations Volume (vph) Ideal Flow (vphpl) Storage Length (ft) Storage Lanes Taper Length (ft) Lane Util. Factor Frt Flt Protected Satd. Flow (prot) Flt Permitted Satd. Flow (perm) Right Turn on Red Satd. Flow (RTOR) Link Speed (mph) Link Distance (ft) Travel Time (s) Peak Hour Factor Heavy Vehicles (%) Adj. Flow (vph) Shared Lane Traffic (%) Lane Group Flow (vph) Enter Blocked Intersection Lane Alignment Median Width(ft) Link Offset(ft) Crosswalk Width(ft) Two way Left Turn Lane Headway Factor Turning Speed (mph) Number of Detectors Detector Template Leading Detector (ft) Trailing Detector (ft) Detector 1 Position(ft) Detector 1 Size(ft) Detector 1 Type Detector 1 Channel Detector 1 Extend (s) Detector 1 Queue (s) Detector 1 Delay (s) Detector 2 Position(ft) Detector 2 Size(ft) Detector 2 Type Detector 2 Channel Detector 2 Extend (s) Turn Type Protected Phases Permitted Phases I-480/SR 94 Interchange 2039 Build PM Peak 5:00 pm 4/5/2016 Build Scenario Synchro 8 Report Jerry Bollinger Page 10
87 Lanes, Volumes, Timings 10: SR 94 & WB On-Ramp/WB Off-Ramp 8/16/2016 Lane Group EBL EBT EBR WBL WBT WBR NBL NBT NBR SBL SBT SBR Detector Phase Switch Phase Minimum Initial (s) Minimum Split (s) Total Split (s) Total Split (%) 35.0% 35.0% 23.3% Yellow Time (s) All-Red Time (s) Lost Time Adjust (s) Total Lost Time (s) Lead/Lag Lag Lag Lead Lead-Lag Optimize? Yes Yes Yes Recall Mode Max Max Max Act Effct Green (s) Actuated g/c Ratio v/c Ratio Control Delay Queue Delay Total Delay LOS F C F B C A Approach Delay Approach LOS D B Queue Length 50th (ft) ~ ~ Queue Length 95th (ft) # # Internal Link Dist (ft) Turn Bay Length (ft) Base Capacity (vph) Starvation Cap Reductn Spillback Cap Reductn Storage Cap Reductn Reduced v/c Ratio Intersection Summary Area Type: Other Cycle Length: 120 Actuated Cycle Length: 120 Offset: 0 (0%), Referenced to phase 2:NBSB and 6:, Start of Green, Master Intersection Natural Cycle: 125 Control Type: Actuated-Coordinated Maximum v/c Ratio: 1.10 Intersection Signal Delay: 51.1 Intersection LOS: D Intersection Capacity Utilization 124.4% ICU Level of Service H Analysis Period (min) 15 ~ Volume exceeds capacity, queue is theoretically infinite. Queue shown is maximum after two cycles. # 95th percentile volume exceeds capacity, queue may be longer. Queue shown is maximum after two cycles. I-480/SR 94 Interchange 2039 Build PM Peak 5:00 pm 4/5/2016 Build Scenario Synchro 8 Report Jerry Bollinger Page 11
88 Lanes, Volumes, Timings 10: SR 94 & WB On-Ramp/WB Off-Ramp 8/16/2016 Splits and Phases: 10: SR 94 & WB On-Ramp/WB Off-Ramp I-480/SR 94 Interchange 2039 Build PM Peak 5:00 pm 4/5/2016 Build Scenario Synchro 8 Report Jerry Bollinger Page 12
89 Lanes, Volumes, Timings 10: SR 94 & WB On-Ramp/WB Off-Ramp 8/16/2016 Lane Group ø1 ø2 ø4 ø6 ø7 ø8 Detector Phase Switch Phase Minimum Initial (s) Minimum Split (s) Total Split (s) Total Split (%) 21% 26% 18% 23% 37% 17% Yellow Time (s) All-Red Time (s) Lost Time Adjust (s) Total Lost Time (s) Lead/Lag Lag Lead Lead Lag Lead Lag Lead-Lag Optimize? Yes Yes Yes Yes Yes Yes Recall Mode None C-Max None C-Max Max None Act Effct Green (s) Actuated g/c Ratio v/c Ratio Control Delay Queue Delay Total Delay LOS Approach Delay Approach LOS Queue Length 50th (ft) Queue Length 95th (ft) Internal Link Dist (ft) Turn Bay Length (ft) Base Capacity (vph) Starvation Cap Reductn Spillback Cap Reductn Storage Cap Reductn Reduced v/c Ratio Intersection Summary I-480/SR 94 Interchange 2039 Build PM Peak 5:00 pm 4/5/2016 Build Scenario Synchro 8 Report Jerry Bollinger Page 13
90 Lanes, Volumes, Timings 13: SR 94 & Burger Ave./Ralph Ave. 8/16/2016 Lane Group EBL EBT EBR WBL WBT WBR NBL NBT NBR SBL SBT SBR Lane Configurations Volume (vph) Ideal Flow (vphpl) Storage Length (ft) Storage Lanes Taper Length (ft) Lane Util. Factor Frt Flt Protected Satd. Flow (prot) Flt Permitted Satd. Flow (perm) Right Turn on Red Yes Yes Yes Yes Satd. Flow (RTOR) Link Speed (mph) Link Distance (ft) Travel Time (s) Peak Hour Factor Heavy Vehicles (%) 3% 3% 3% 1% 1% 1% 2% 2% 2% 2% 2% 2% Adj. Flow (vph) Shared Lane Traffic (%) Lane Group Flow (vph) Enter Blocked Intersection No No No No No No No No No No No No Lane Alignment Left Left Right Left Left Right Left Left Right Left Left Right Median Width(ft) Link Offset(ft) Crosswalk Width(ft) Two way Left Turn Lane Headway Factor Turning Speed (mph) Number of Detectors Detector Template Left Thru Left Thru Left Thru Left Thru Leading Detector (ft) Trailing Detector (ft) Detector 1 Position(ft) Detector 1 Size(ft) Detector 1 Type Cl+Ex Cl+Ex Cl+Ex Cl+Ex Cl+Ex Cl+Ex Cl+Ex Cl+Ex Detector 1 Channel Detector 1 Extend (s) Detector 1 Queue (s) Detector 1 Delay (s) Detector 2 Position(ft) Detector 2 Size(ft) Detector 2 Type Cl+Ex Cl+Ex Cl+Ex Cl+Ex Detector 2 Channel Detector 2 Extend (s) Turn Type Perm NA Perm NA Perm NA Perm NA Protected Phases Permitted Phases I-480/SR 94 Interchange 2039 Build PM Peak 5:00 pm 4/5/2016 Build Scenario Synchro 8 Report Jerry Bollinger Page 14
91 Lanes, Volumes, Timings 13: SR 94 & Burger Ave./Ralph Ave. 8/16/2016 Lane Group EBL EBT EBR WBL WBT WBR NBL NBT NBR SBL SBT SBR Detector Phase Switch Phase Minimum Initial (s) Minimum Split (s) Total Split (s) Total Split (%) 36.7% 36.7% 36.7% 36.7% 63.3% 63.3% 63.3% 63.3% Yellow Time (s) All-Red Time (s) Lost Time Adjust (s) Total Lost Time (s) Lead/Lag Lead-Lag Optimize? Recall Mode Max Max Max Max C-Min C-Min C-Min C-Min Act Effct Green (s) Actuated g/c Ratio v/c Ratio Control Delay Queue Delay Total Delay LOS B B A B B Approach Delay Approach LOS B B B B Queue Length 50th (ft) Queue Length 95th (ft) m Internal Link Dist (ft) Turn Bay Length (ft) 100 Base Capacity (vph) Starvation Cap Reductn Spillback Cap Reductn Storage Cap Reductn Reduced v/c Ratio Intersection Summary Area Type: Other Cycle Length: 60 Actuated Cycle Length: 60 Offset: 0 (0%), Referenced to phase 2:NBTL and 6:SBTL, Start of Green Natural Cycle: 60 Control Type: Actuated-Coordinated Maximum v/c Ratio: 0.58 Intersection Signal Delay: 12.2 Intersection LOS: B Intersection Capacity Utilization 59.3% ICU Level of Service B Analysis Period (min) 15 m Volume for 95th percentile queue is metered by upstream signal. Splits and Phases: 13: SR 94 & Burger Ave./Ralph Ave. I-480/SR 94 Interchange 2039 Build PM Peak 5:00 pm 4/5/2016 Build Scenario Synchro 8 Report Jerry Bollinger Page 15
 and Westbound I-480 Ramps SR 94 (State Road) and Ralph Avenue/Burger")
92 Appendix E Storage Length Calculations SR 94 (State Road) and SR 17 (Brookpark Road) SR 94 (State Road) and Eastbound I-480 Ramps SR 94 (State Road) and Westbound I-480 Ramps SR 94 (State Road) and Ralph Avenue/Burger Avenue
INTERCHANGE OPERTIONS STUDY Interstate 77 / Wallings Road Interchange
 INTERCHANGE OPERTIONS STUDY Interstate 77 / Wallings Road Interchange City of Broadview Heights, Cuyahoga County, Ohio Prepared For: City of Broadview Heights Department of Engineering 9543 Broadview Road
Interchange Operations Study MOT (I-75 & Austin Boulevard) ODOT District 7 PID 99213
 ODOT District 7 PID 99213") Interchange Operations Study MOT-75-0.76 (I-75 & Austin Boulevard) ODOT District 7 PID 99213 Table of Contents MOT-75-0.76 Interchange Operations Study (IOS) 1.0 Project Summary... 2 2.0 Study Area...
Interchange Operations Study MOT-75-0.76 (I-75 & Austin Boulevard) ODOT District 7 PID 99213 Table of Contents MOT-75-0.76 Interchange Operations Study (IOS) 1.0 Project Summary... 2 2.0 Study Area...
P07033 US 50 EB Weaving Analysis between El Dorado Hills and Silva Valley Ramp Metering Analysis for US 50 EB On-Ramp at Latrobe Road
 180 Grand Avenue, Suite 250 428 J Street, Suite 500 Oakland, CA 94612 Sacramento, CA 95814 510.839.1742 916.266.2190 510.839.0871 fax 916.266.2195 Dowling Associates, Inc. www.dowlinginc.com traffic@dowlinginc.com
APPENDICES C APPENDIX C: CALCULATION WORKSHEETS FOR FREEWAY SEGMENTS AND FREEWAY WEAVE ANALYSIS
 APPENDICES C APPENDIX C: CALCULATION WORKSHEETS FOR FREEWAY SEGMENTS AND FREEWAY WEAVE ANALYSIS Public Review Draft Existing Conditions Report Page C-1 October 2015 SIA PLAN UPDATE This page was intentionally
Interstate Operations Study: Fargo-Moorhead Metropolitan Area Simulation Results
 NDSU Dept #2880 PO Box 6050 Fargo, ND 58108-6050 Tel 701-231-8058 Fax 701-231-6265 www.ugpti.org www.atacenter.org Interstate Operations Study: Fargo-Moorhead Metropolitan Area 2025 Simulation Results
MULTILANE HIGHWAYS. Highway Capacity Manual 2000 CHAPTER 21 CONTENTS
 CHAPTER 2 MULTILANE HIGHWAYS CONTENTS I. INTRODUCTION...2- Base Conditions for Multilane Highways...2- Limitations of the Methodology...2- II. METHODOLOGY...2- LOS...2-2 Determining FFS...2-3 Estimating
LAWRENCE TRANSIT CENTER LOCATION ANALYSIS 9 TH STREET & ROCKLEDGE ROAD / 21 ST STREET & IOWA STREET LAWRENCE, KANSAS
 LAWRENCE TRANSIT CENTER LOCATION ANALYSIS 9 TH STREET & ROCKLEDGE ROAD / 21 ST STREET & IOWA STREET LAWRENCE, KANSAS TRAFFIC IMPACT STUDY FEBRUARY 214 OA Project No. 213-542 TABLE OF CONTENTS 1. INTRODUCTION...
MERIVALE PRIORITY SQUARE 2852 MERIVALE ROAD CITY OF OTTAWA TRANSPORTATION BRIEF. Prepared for: ONT Inc. 25 Winding Way Nepean, Ontario K2C 3H1
 MERIVALE PRIORITY SQUARE 2852 MERIVALE ROAD CITY OF OTTAWA TRANSPORTATION BRIEF Prepared for: 2190986ONT Inc. 25 Winding Way Nepean, Ontario K2C 3H1 October 6, 2010 110-502 Report_1.doc D. J. Halpenny
Interstate Operations Study: Fargo-Moorhead Metropolitan Area Simulation Output
 NDSU Dept #2880 PO Box 6050 Fargo, ND 58108-6050 Tel 701-231-8058 Fax 701-231-6265 www.ugpti.org www.atacenter.org Interstate Operations Study: Fargo-Moorhead Metropolitan Area 2015 Simulation Output Technical
To: File From: Adrian Soo, P. Eng. Markham, ON File: Date: August 18, 2015
 Memo To: From: Adrian Soo, P. Eng. Markham, ON : 165620021 Date: Reference: E.C. Row Expressway, Dominion Boulevard Interchange, Dougall Avenue Interchange, and Howard 1. Review of Interchange Geometry
Shirk Road at State Route 198 Interchange Analysis Tulare County, California
 Shirk Road at State Route 198 Interchange Analysis Tulare County, California DRAFT REPORT Prepared By Tulare County Association of Governments (TCAG) April 2013 Table of Contents Introduction:... 3 Project
APPENDIX C1 TRAFFIC ANALYSIS DESIGN YEAR TRAFFIC ANALYSIS
 APPENDIX C1 TRAFFIC ANALYSIS DESIGN YEAR TRAFFIC ANALYSIS DESIGN YEAR TRAFFIC ANALYSIS February 2018 Highway & Bridge Project PIN 6754.12 Route 13 Connector Road Chemung County February 2018 Appendix
TRAFFIC DATA. Existing Derousse Ave./River Rd. AM LOS Analysis Existing Derousse Ave./River Rd. PM LOS Analysis
 Appendix E NJ TRANSIT Pennsauken Junction Transit Center and Park & Ride RiverLINE and Atlantic City Line Pennsauken Township, Camden County, New Jersey TRAFFIC DATA Background Traffic Information for
FE Review-Transportation-II. D e p a r t m e n t o f C i v i l E n g i n e e r i n g U n i v e r s i t y O f M e m p h i s
 FE Review-Transportation-II D e p a r t m e n t o f C i v i l E n g i n e e r i n g U n i v e r s i t y O f M e m p h i s Learning Objectives Design, compute, and solve FE problems on Freeway level of
Chapter 6. CEE 320 Anne Goodchild. Spring 2008 CEE 320
 Chapter 6 Freeway Level of Service Anne Goodchild Definitions Level of Service (LOS) Chief measure of quality of service Describes operational conditions within a traffic stream. Does not include safety
Interstate 85 Widening Phase III Interchange Modification Report Exit 98 Frontage Road Off-Ramp. Cherokee County, SC
 Interstate 85 Widening Phase III Interchange Modification Report Exit 98 Frontage Road Off-Ramp Cherokee County, SC Prepared for: South Carolina Department of Transportation Prepared by: Stantec Consulting
Figure 1 Map of intersection of SR 44 (Ravenna Rd) and Butternut Rd
 and Butternut Rd") Abbreviated Study District: 12 County: Geauga Route: SR 44 Section: 1.58 GEA 44 1.58 213 HSP # 47 (Rural Intersection) Prepared April 23, 215 By Bryan Emery Existing Conditions This study contains the
Abbreviated Study District: 12 County: Geauga Route: SR 44 Section: 1.58 GEA 44 1.58 213 HSP # 47 (Rural Intersection) Prepared April 23, 215 By Bryan Emery Existing Conditions This study contains the
Bennett Pit. Traffic Impact Study. J&T Consulting, Inc. Weld County, Colorado. March 3, 2017
 Bennett Pit Traffic Impact Study J&T Consulting, Inc. Weld County, Colorado March 3, 217 Prepared By: Sustainable Traffic Solutions, Inc. http://www.sustainabletrafficsolutions.com/ Joseph L. Henderson,
APPENDIX E. Traffic Analysis Report
 APPENDIX E Traffic Analysis Report THIS PAGE INTENTIONALLY BLANK EAGLE RIVER TRAFFIC MITIGATION PHASE I OLD GLENN HIGHWAY/EAGLE RIVER ROAD INTERSECTION IMPROVEMENTS TRAFFIC ANALYSIS Eagle River, Alaska
Appendix H: Construction Impacts H-2 Transportation
 Appendix H: Construction Impacts H-2 Transportation \ AECOM 71 W. 23 rd Street New York, NY 10010 www.aecom.com 212 366 6200 tel 212 366 6214 fax Memorandum To CC Subject Robert Conway Donald Tone Construction
L1TILE BEARS DAY CARE TRANSPORTATION IMPACT STUDY FORT COLLINS, COLORADO MAY Prepared for:
 L1TILE BEARS DAY CARE TRANSPORTATION IMPACT STUDY FORT COLLINS, COLORADO MAY 2012 Prepared for: Hillside Construction, Inc. 216 Hemlock Street, Suite B Fort Collins, CO 80534 Prepared by: DELICH ASSOCIATES
Freeway Weaving and Ramp Junction Analysis
 TEXAS TECH UNIVERSITY Freeway Weaving and Ramp Junction Analysis Along IH 27 at Plainview, TX Hao Xu, Jared A. Squyres, Wesley Kumfer, and Hongchao Liu 7/15/2011 Table of Contents Project Description...
BARRHAVEN FELLOWSHIP CRC 3058 JOCKVALE ROAD OTTAWA, ONTARIO TRANSPORTATION BRIEF. Prepared for:
 BARRHAVEN FELLOWSHIP CRC 3058 JOCKVALE ROAD OTTAWA, ONTARIO TRANSPORTATION BRIEF Prepared for: Barrhaven Fellowship CRC 3058 Jockvale Road Ottawa, ON K2J 2W7 December 7, 2016 116-649 Report_1.doc D. J.
Traffic Impact Study Morgan Road Commerce Park Pasco County, Florida
 Traffic Impact Study Morgan Road Commerce Park Pasco County, Florida Summary Report June 2008 Prepared by: 12909 N 56 th Street # 201 Tampa, FL 33617 Ph: (813) 988-3180 Fax: (813) 343-6854 Morgan Road
December 5, Red Bank Planning Board Municipal Building 90 Monmouth Street Red Bank, NJ 07701
 Dynamic Traffic, LLC www.dynamic-traffic.com 1904 Main Street Lake Como, NJ 07719 T. 732.681.0760 December 5, 2016 Red Bank Planning Board Municipal Building 90 Monmouth Street Red Bank, NJ 07701 Re: Traffic
DEVELOPMENT PROPERTY 1627 MAXIME STREET CITY OF OTTAWA TRANSPORTATION OVERVIEW. Prepared for: Subhas Bhargava. July 9, Overview_1.
 DEVELOPMENT PROPERTY 1627 MAXIME STREET CITY OF OTTAWA TRANSPORTATION OVERVIEW Prepared for: Subhas Bhargava July 9, 2015 115-620 Overview_1.doc D. J. Halpenny & Associates Ltd. Consulting Transportation
LATSON INTERCHANGE DEVELOPMENT TRAFFIC STUDIES. Genoa Township, Livingston County, MI
 LATSON INTERCHANGE DEVELOPMENT TRAFFIC STUDIES Genoa Township, Livingston County, MI DRAFT TRAFFIC STUDY FOR I-96 AT LATSON RD INTERCHANGE Livingston County CS 47065 JN 101622C Submitted to: Michigan Department
Craig Scheffler, P.E., PTOE HNTB North Carolina, P.C. HNTB Project File: Subject
 TECHNICAL MEMORANDUM To Kumar Neppalli Traffic Engineering Manager Town of Chapel Hill From Craig Scheffler, P.E., PTOE HNTB North Carolina, P.C. Cc HNTB Project File: 38435 Subject Obey Creek TIS 2022
INTERSECTION ANALYSIS PARK AVENUE AND BRADDOCK ROAD (FROSTBURG, MD) FOR LENHART TRAFFIC CONSULTING, INC.
 FOR LENHART TRAFFIC CONSULTING, INC.") INTERSECTION ANALYSIS FOR PARK AVENUE AND BRADDOCK ROAD (FROSTBURG, MD) Prepared for: City of Frostburg, Maryland & Allegany County Commissioners Prepared by: LENHART TRAFFIC CONSULTING, INC. TRAFFIC ENGINEERING
INTERSECTION ANALYSIS FOR PARK AVENUE AND BRADDOCK ROAD (FROSTBURG, MD) Prepared for: City of Frostburg, Maryland & Allegany County Commissioners Prepared by: LENHART TRAFFIC CONSULTING, INC. TRAFFIC ENGINEERING
Transit City Etobicoke - Finch West LRT
 Delcan Corporation Transit City Etobicoke - Finch West LRT APPENDIX D Microsimulation Traffic Modeling Report March 2010 March 2010 Appendix D CONTENTS 1.0 STUDY CONTEXT... 2 Figure 1 Study Limits... 2
TRAFFIC SIGNAL DESIGN REPORT KING OF PRUSSIA ROAD & RAIDER ROAD RADNOR TOWNSHIP PENNSYLVANIA
 TRAFFIC SIGNAL DESIGN REPORT KING OF PRUSSIA ROAD & RAIDER ROAD RADNOR TOWNSHIP PENNSYLVANIA PREPARED FOR: UNIVERSITY OF PENNSYLVANIA HEALTH SYSTEM 34 CIVIC CENTER BOULEVARD PHILADELPHIA, PA 1987 (61)
RICHMOND OAKS HEALTH CENTRE 6265 PERTH STREET OTTAWA, ONTARIO TRANSPORTATION BRIEF. Prepared for: Guycoki (Eastern) Limited.
 Limited.") RICHMOND OAKS HEALTH CENTRE 6265 PERTH STREET OTTAWA, ONTARIO TRANSPORTATION BRIEF Prepared for: Guycoki (Eastern) Limited June 16, 2016 116-638 Brief_1.doc D. J. Halpenny & Associates Ltd. Consulting
RICHMOND OAKS HEALTH CENTRE 6265 PERTH STREET OTTAWA, ONTARIO TRANSPORTATION BRIEF Prepared for: Guycoki (Eastern) Limited June 16, 2016 116-638 Brief_1.doc D. J. Halpenny & Associates Ltd. Consulting
Lacey Gateway Residential Phase 1
 Lacey Gateway Residential Phase Transportation Impact Study April 23, 203 Prepared for: Gateway 850 LLC 5 Lake Bellevue Drive Suite 02 Bellevue, WA 98005 Prepared by: TENW Transportation Engineering West
MEMORANDUM. Figure 1. Roundabout Interchange under Alternative D
 MEMORANDUM Date: To: Liz Diamond, Dokken Engineering From: Subject: Dave Stanek, Fehr & Peers Western Placerville Interchanges 2045 Analysis RS08-2639 Fehr & Peers has completed a transportation analysis
TIMBERVINE TRANSPORTATION IMPACT STUDY FORT COLLINS, COLORADO JANUARY Prepared for:
 TIMBERVINE TRANSPORTATION IMPACT STUDY FORT COLLINS, COLORADO JANUARY 2014 Prepared for: Hartford Companies 1218 W. Ash Street Suite A Windsor, Co 80550 Prepared by: DELICH ASSOCIATES 2272 Glen Haven Drive
CUY SAFETY STUDY KINSMAN RD (US 422) AT E. 93 RD ST CLEVELAND, OHIO - ODOT DISTRICT 12. October 13, LJB Inc.
 AT E. 93 RD ST CLEVELAND, OHIO - ODOT DISTRICT 12. October 13, LJB Inc.") CUY-422-4.34 SAFETY STUDY KINSMAN RD (US 422) AT E. 93 RD ST CLEVELAND, OHIO - ODOT DISTRICT 12 October 13, 2014 PREPARED BY: LJB Inc. 2500 Newmark Drive Miamisburg, OH 45342 (937) 259-5000 Elizabeth L.
CUY-422-4.34 SAFETY STUDY KINSMAN RD (US 422) AT E. 93 RD ST CLEVELAND, OHIO - ODOT DISTRICT 12 October 13, 2014 PREPARED BY: LJB Inc. 2500 Newmark Drive Miamisburg, OH 45342 (937) 259-5000 Elizabeth L.
Interchange Justification Report
 Interchange Justification Report Interstate 29 at 85 th Street- Exit 74 Sioux Falls, SD SEH No. 132589 October 1, 2018 Prepared by: Short Elliott Hendrickson Inc. Executive Summary The Interchange Justification
Proposed location of Camp Parkway Commerce Center. Vicinity map of Camp Parkway Commerce Center Southampton County, VA
 Proposed location of Camp Parkway Commerce Center Vicinity map of Camp Parkway Commerce Center Southampton County, VA Camp Parkway Commerce Center is a proposed distribution and industrial center to be
MINERVA PARK SITE TRAFFIC IMPACT STUDY M/I HOMES. September 2, 2015
 5500 New Albany Road Columbus, Ohio 43054 Phone: 614.775.4500 Fax: 614.775.4800 Toll Free: 1-888-775-EMHT emht.com 2015-1008 MINERVA PARK SITE TRAFFIC IMPACT STUDY M/I HOMES September 2, 2015 Engineers
MEMO VIA . Ms. Amy Roth DPS Director, City of Three Rivers. To:
 MEMO To: Ms. Amy Roth DPS Director, City of Three Rivers VIA EMAIL From: Michael J. Labadie, PE Julie M. Kroll, PE, PTOE Brandon Hayes, PE, P.Eng. Fleis & VandenBrink Date: January 5, 2017 Re: Proposed
Traffic Impact Statement (TIS)
") Traffic Impact Statement (TIS) Vincentian PUDA Collier County, FL 10/18/2013 Prepared for: Global Properties of Naples Prepared by: Trebilcock Consulting Solutions, PA 2614 Tamiami Trail N, Suite 615 1205
Traffic Impact Statement (TIS) Vincentian PUDA Collier County, FL 10/18/2013 Prepared for: Global Properties of Naples Prepared by: Trebilcock Consulting Solutions, PA 2614 Tamiami Trail N, Suite 615 1205
TRAFFIC AND TRANSPORTATION TECHNICAL MEMORANDUM
 TRAFFIC AND TRANSPORTATION TECHNICAL MEMORANDUM for ENVIRONMENTAL ASSESSMENT US 460 Bypass Interchange and Southgate Drive Relocation State Project No.: 0460-150-204, P101, R201, C501, B601; UPC 99425
Traffic Engineering Study
 Traffic Engineering Study Bellaire Boulevard Prepared For: International Management District Technical Services, Inc. Texas Registered Engineering Firm F-3580 November 2009 Executive Summary has been requested
JCE 4600 Basic Freeway Segments
 JCE 4600 Basic Freeway Segments HCM Applications What is a Freeway? divided highway with full control of access two or more lanes for the exclusive use of traffic in each direction no signalized or stop-controlled
EXECUTIVE SUMMARY. The following is an outline of the traffic analysis performed by Hales Engineering for the traffic conditions of this project.
 EXECUTIVE SUMMARY This study addresses the traffic impacts associated with the proposed Shopko redevelopment located in Sugarhouse, Utah. The Shopko redevelopment project is located between 1300 East and
ZINFANDEL LANE / SILVERADO TRAIL INTERSECTION TRAFFIC ANALYSIS
 ZINFANDEL LANE / SILVERADO TRAIL INTERSECTION TRAFFIC ANALYSIS UPDATED TRAFFIC STUDY FOR THE PROPOSED RAYMOND VINEYARDS WINERY USE PERMIT MODIFICATION #P11-00156 AUGUST 5, 2014 PREPARED BY: OMNI-MEANS,
INTERSECTION CONTROL EVALUATION
 INTERSECTION CONTROL EVALUATION Trunk Highway 22 and CSAH 21 (E Hill Street/Shanaska Creek Road) Kasota, Le Sueur County, Minnesota November 2018 Trunk Highway 22 and Le Sueur CSAH 21 (E Hill Street/Shanaska
Interstate 85 Widening Phase III Interchange Modification Report Exit 106 E. Cherokee Street. Cherokee County, SC
 Interstate 85 Widening Phase III Interchange Modification Report Exit 16 E. Cherokee Street Cherokee County, SC Prepared for: South Carolina Department of Transportation Prepared by: Stantec Consulting
Traffic Impact Analysis 5742 BEACH BOULEVARD MIXED USE PROJECT
 Traffic Impact Analysis 5742 BEACH BOULEVARD MIXED USE PROJECT CITY OF BUENA PARK Prepared by Project No. 14139 000 April 17 th, 2015 DKS Associates Jeffrey Heald, P.E. Rohit Itadkar, T.E. 2677 North Main
Oakbrook Village Plaza City of Laguna Hills
 Oakbrook Village Plaza City of Laguna Hills Traffic Impact Analysis Prepared by: HDR Engineering 3230 El Camino Real, Suite 200 Irvine, CA 92602 October 2012 Revision 3 D-1 Oakbrook Village Plaza Laguna
FIELD APPLICATIONS OF CORSIM: I-40 FREEWAY DESIGN EVALUATION, OKLAHOMA CITY, OK. Michelle Thomas
 Proceedings of the 1998 Winter Simulation Conference D.J. Medeiros, E.F. Watson, J.S. Carson and M.S. Manivannan, eds. FIELD APPLICATIONS OF CORSIM: I-40 FREEWAY DESIGN EVALUATION, OKLAHOMA CITY, OK Gene
Evaluation Considerations and Geometric Nuances of Reduced Conflict U-Turn Intersections (RCUTs)
") Evaluation Considerations and Geometric Nuances of Reduced Conflict U-Turn Intersections (RCUTs) 26 th Annual Transportation Research Conference Saint Paul RiverCentre May 20, 2015 Presentation Outline
Evaluation Considerations and Geometric Nuances of Reduced Conflict U-Turn Intersections (RCUTs) 26 th Annual Transportation Research Conference Saint Paul RiverCentre May 20, 2015 Presentation Outline
TRAFFIC IMPACT ANALYSIS FOR. McDONALD S RESTAURANT IN CARMICAEL Sacramento County, CA. Prepared For:
 TRAFFIC IMPACT ANALYSIS FOR McDONALD S RESTAURANT IN CARMICAEL Sacramento County, CA Prepared For: McDonald s USA, LLC Pacific Sierra Region 2999 Oak Road, Suite 900 Walnut Creek, CA 94597 Prepared By:
V. DEVELOPMENT OF CONCEPTS
 Martin Luther King, Jr. Drive Extension FINAL Feasibility Study Page 9 V. DEVELOPMENT OF CONCEPTS Throughout the study process several alternative alignments were developed and eliminated. Initial discussion
 Traffic Analysis For Approved Uses within the St. Lucie West DRI Aldi Port St. Lucie, FL Prepared for: Bohler Engineering, LLC 1000 Corporate Drive Suite 250 Fort Lauderdale, FL 33334 Prepared by: 10795
Traffic Feasibility Study
 Traffic Feasibility Study Town Center South Robbinsville Township, Mercer County, New Jersey December 19, 2017 Prepared For Robbinsville Township Department of Community Development 2298 Route 33 Robbinsville,
Mineola Village Green
 Traffic Impact Analysis Report Mineola Village Green 199 2 nd Street Mineola, New York Prepared for Mineola Metro LLC c/o Lalezarian Properties 1999 Marcus Avenue, Suite 310 Lake Success, NY 11042 Prepared
IV. REVISIONS TO THE DRAFT IS/MND
 IV. REVISIONS TO THE DRAFT IS/MND 1. REVISIONS TO THE DRAFT IS/MND This section presents corrections and clarifications that have been made to the text of the Draft IS/MND. These changes include revisions
Traffic Impact Study Speedway Gas Station Redevelopment
 Traffic Impact Study Speedway Gas Station Redevelopment Warrenville, Illinois Prepared For: Prepared By: April 11, 2018 Table of Contents 1. Introduction... 1 2. Existing Conditions... 4 Site Location...
King Soopers #116 Thornton, Colorado
 Traffic Impact Study King Soopers #116 Thornton, Colorado Prepared for: Galloway & Company, Inc. T R A F F I C I M P A C T S T U D Y King Soopers #116 Thornton, Colorado Prepared for Galloway & Company
Quantitative analyses of weekday a.m. and p.m. commuter hour conditions have been conducted for the following five scenarios:
 6.1 TRANSPORTATION AND CIRCULATION 6.1.1 INTRODUCTION This section of the EIR presents the results of TJKM s traffic impact analysis of the proposed Greenbriar Development. The analysis includes consideration
Date: February 7, 2017 John Doyle, Z-Best Products Robert Del Rio. T.E. Z-Best Traffic Operations and Site Access Analysis
 Memorandum Date: February 7, 07 To: From: Subject: John Doyle, Z-Best Products Robert Del Rio. T.E. Z-Best Traffic Operations and Site Access Analysis Introduction Hexagon Transportation Consultants, Inc.
County State Aid Highway 30 (Diffley Road) and Dodd Road Intersection Study
 and Dodd Road Intersection Study") County State Aid Highway 30 (Diffley Road) and Dodd Road Intersection Study City of Eagan, Dakota County, Minnesota Date: March 2012 Project No. 14957.000 444 Cedar Street, Suite 1500 Saint Paul, MN 55101
County State Aid Highway 30 (Diffley Road) and Dodd Road Intersection Study City of Eagan, Dakota County, Minnesota Date: March 2012 Project No. 14957.000 444 Cedar Street, Suite 1500 Saint Paul, MN 55101
RESPONSE TO TRAFFIC IMPACT STUDY COMMENTS
 RESPONSE TO TRAFFIC IMPACT STUDY COMMENTS Proposed Gas Station 40 Arthur Street (Highway 26), Town of the Blue Mountains (Thornbury), County of Grey, Ontario AUGUST 2013 August 27, 2013 MR. REG RUSSWURM
Critical Movement* Delay (sec/veh) Critical Movement* LOS 8 a.m. 9 a.m. B 25.2 C. 3 p.m. 4 p.m. B 17.3 B
 Critical Movement* LOS 8 a.m. 9 a.m. B 25.2 C. 3 p.m. 4 p.m. B 17.3 B") Memorandum DATE: AUGUST 1, 2013 TO: PAUL TILTON, P.E., SANDWICH DPW DIRECTOR/TOWN ENGINEER FROM: LEV MALAKHOFF, SR. TRANSPORTATION ENGINEER RE: ROUTE 130/QUAKER MEETINGHOUSE ROAD INTERSECTION Paul: Per
Memorandum DATE: AUGUST 1, 2013 TO: PAUL TILTON, P.E., SANDWICH DPW DIRECTOR/TOWN ENGINEER FROM: LEV MALAKHOFF, SR. TRANSPORTATION ENGINEER RE: ROUTE 130/QUAKER MEETINGHOUSE ROAD INTERSECTION Paul: Per
Traffic Impact Analysis. Alliance Cole Avenue Residential Site Dallas, Texas. Kimley-Horn and Associates, Inc. Dallas, Texas.
 Traffic Impact Analysis Alliance Cole Avenue Residential Site Dallas, Texas February 15, 2018 Kimley-Horn and Associates, Inc. Dallas, Texas Project #064524900 Registered Firm F-928 Traffic Impact Analysis
2.1.5 Traffic and Circulation. Table Level of Service Criteria for Highway Segment Regulatory Setting Affected Environment
 2.1.5 Traffic and Circulation This section addresses the potential impacts to traffic and circulation associated with construction and long-term operation of the proposed project. The traffic and circulation
One Harbor Point Residential
 Residential Gig Harbor, WA Transportation Impact Analysis January 23, 2017 Prepared for: Neil Walter Company PO Box 2181 Tacoma, WA 98401 Prepared by: TENW Transportation Engineering NorthWest 11400 SE
TRAFFIC IMPACT STUDY FOR SONIC DRIVE-IN RESTAURANT. Vallejo, CA. Prepared For:
 TRAFFIC IMPACT STUDY FOR SONIC DRIVE-IN RESTAURANT Vallejo, CA Prepared For: ELITE DRIVE-INS, INC. 2190 Meridian Park Blvd, Suite G Concord, CA 94520 Prepared By: KD Anderson & Associates 3853 Taylor Road,
INDUSTRIAL DEVELOPMENT
 INDUSTRIAL DEVELOPMENT Traffic Impact Study Plainfield, Illinois August 2018 Prepared for: Seefried Industrial Properties, Inc. TABLE OF CONTENTS Executive Summary 2 Introduction 3 Existing Conditions
King County Metro. Columbia Street Transit Priority Improvements Alternative Analysis. Downtown Southend Transit Study. May 2014.
 King County Metro Columbia Street Transit Priority Improvements Alternative Analysis Downtown Southend Transit Study May 2014 Parametrix Table of Contents Introduction... 1 Methodology... 1 Study Area...
Winnetka Avenue Bike Lanes Traffic Impact Analysis
 Winnetka Avenue Bike Lanes Traffic Impact Analysis January 4, 2019 Prepared by City of Los Angeles Department of Transportation Active Transportation Division Winnetka Ave Bike Lanes Traffic Impact Analysis
Table of Contents. Traffic Impact Analysis Capital One Building at Schilling Place
 Traffic Impact Analysis Capital One Building at Schilling Place Table of Contents Executive Summary... 1 1. Introduction... 4 2. Project Description... 4 3. Background Information... 4 4. Study Scope...
Escondido Marriott Hotel and Mixed-Use Condominium Project TRAFFIC IMPACT ANALYSIS REPORT
 Escondido Marriott Hotel and Mixed-Use Condominium Project TRAFFIC IMPACT ANALYSIS REPORT Prepared for Phelps Program Management 420 Sixth Avenue, Greeley, CO 80632 Prepared by 5050 Avenida Encinas, Suite
ARE DIAMONDS LRT S BEST FRIEND? AT-GRADE LRT CROSSING AT A DIAMOND INTERCHANGE
 ARE DIAMONDS LRT S BEST FRIEND? AT-GRADE LRT CROSSING AT A DIAMOND INTERCHANGE NATE LARSON HDR SEATTLE, WA ABHISHEK DAYAL VALLEY METRO PHOENIX, AZ ITE WESTERN DISTRICT ANNUAL MEETING JULY 16, 2013 Presentation
TRAFFIC IMPACT ANALYSIS
 TRAFFIC IMPACT ANALYSIS Emerald Isle Commercial Development Prepared by SEPI Engineering & Construction Prepared for Ark Consulting Group, PLLC March 2016 I. Executive Summary A. Site Location The Emerald
Traffic Impact Analysis Update
 Willow Bend Traffic Impact Analysis Update TABLE OF CONTENTS Page I. INTRODUCTION -------------------------------------------------------------------------------------------- 1 II. EXISTING CONDITIONS
Craigieburn Employment Precinct North and English Street
 Craigieburn Employment Precinct North and English Street METROPOLITAN PLANNING AUTHORITY Intersection Analyses 7 February 2014 Intersection Analyses Craigieburn Employment Precinct North and English Street
Sugarland Crossing Gwinnett County, Georgia
 Sugarland Crossing Gwinnett County, Georgia S IGNAL W ARRANT A NALYSIS For the Intersection of: Sugarloaf Parkway / Richards Middle School Driveway / Sugarland Crossing Main Site Driveway Prepared for:
Ryan Coyne, PE City Engineer City of Rye 1051 Boston Post Road Rye, NY Boston Post Road Realignment and Roundabout Design Report
 March 6, 2015 Ryan Coyne, PE City Engineer City of Rye 1051 Boston Post Road Rye, NY 10580 RE: JMC Project 14108 Boston Post Road Roundabout Boston Post Road and Parsons Street City of Rye, NY Dear Ryan:
TRAFFIC IMPACT STUDY. USD #497 Warehouse and Bus Site
 TRAFFIC IMPACT STUDY for USD #497 Warehouse and Bus Site Prepared by: Jason Hoskinson, PE, PTOE BG Project No. 16-12L July 8, 216 145 Wakarusa Drive Lawrence, Kansas 6649 T: 785.749.4474 F: 785.749.734
Lecture 4: Capacity and Level of Service (LoS) of Freeways Basic Segments. Prof. Responsável: Filipe Moura
 of Freeways Basic Segments. Prof. Responsável: Filipe Moura") Lecture 4: Capacity and Level of Service (LoS) of Freeways Basic Segments Prof. Responsável: Filipe Moura Engenharia de Tráfego Rodoviário Lecture 4 - Basic Freeway segments 1 CAPACITY AND LEVEL OF SERVICE
Lecture 4: Capacity and Level of Service (LoS) of Freeways Basic Segments Prof. Responsável: Filipe Moura Engenharia de Tráfego Rodoviário Lecture 4 - Basic Freeway segments 1 CAPACITY AND LEVEL OF SERVICE
The major roadways in the study area are State Route 166 and State Route 33, which are shown on Figure 1-1 and described below:
 3.5 TRAFFIC AND CIRCULATION 3.5.1 Existing Conditions 3.5.1.1 Street Network DRAFT ENVIRONMENTAL IMPACT REPORT The major roadways in the study area are State Route 166 and State Route 33, which are shown
SR 104/Paradise Bay-Shine Road Intersection Safety Improvements Intersection Control Evaluation
 SR 104/Paradise Bay-Shine Road Intersection Safety Improvements Intersection Control Evaluation Background and Project Needs SR 104 is functionally classified as a rural-principal arterial. It is a limited
Speed measurements were taken at the following three locations on October 13 and 14, 2016 (See Location Map in Exhibit 1):
:") 2709 McGraw Drive Bloomington, Illinois 61704 p 309.663.8435 f 309.663.1571 www.f-w.com www.greennavigation.com November 4, 2016 Mr. Kevin Kothe, PE City Engineer City of Bloomington Public Works Department
2709 McGraw Drive Bloomington, Illinois 61704 p 309.663.8435 f 309.663.1571 www.f-w.com www.greennavigation.com November 4, 2016 Mr. Kevin Kothe, PE City Engineer City of Bloomington Public Works Department
TRAFFIC IMPACT STUDY DERRY GREEN CORPORATE BUSINESS PARK MILTON SECONDARY PLAN MODIFICATION
 TRAFFIC IMPACT STUDY DERRY GREEN CORPORATE BUSINESS PARK MILTON SECONDARY PLAN MODIFICATION TRAFFIC IMPACT STUDY DERRY GREEN CORPORATE BUSINESS PARK MILTON SECONDARY PLAN MODIFICATION DECEMBER 24 UPDATED
KUM & GO 6400 WESTOWN PARKWAY WEST DES MOINES, IOWA 50266
 KUM & GO #300 PECOS STREET & 88 TH AVENUE THORNTON, COLORADO TRAFFIC IMPACT STUDY REVISION 1 PREPARED FOR KUM & GO 6400 WESTOWN PARKWAY WEST DES MOINES, IOWA 50266 JANUARY 23, 2014 OA PROJECT NO. 013-1721
CUY Safety Study Final Report
 CUY-175-7.30 Safety Study Final Report Beachwood/Lyndhurst, OH Urban Non-Freeway Intersection Ranking #26 ODOT District 12 5500 Transportation Boulevard Garfield Heights, OH 44125 March 18, 2016 6612 Singletree
Table of Contents INTRODUCTION... 3 PROJECT STUDY AREA Figure 1 Vicinity Map Study Area... 4 EXISTING CONDITIONS... 5 TRAFFIC OPERATIONS...
 Crosshaven Drive Corridor Study City of Vestavia Hills, Alabama Table of Contents INTRODUCTION... 3 PROJECT STUDY AREA... 3 Figure 1 Vicinity Map Study Area... 4 EXISTING CONDITIONS... 5 TRAFFIC OPERATIONS...
RTID Travel Demand Modeling: Assumptions and Method of Analysis
 RTID Travel Demand Modeling: Assumptions and Method of Analysis Overall Model and Scenario Assumptions The Puget Sound Regional Council s (PSRC) regional travel demand model was used to forecast travel
APPENDIX A Interstate 26 Widening Traffic Analysis Report
 Interstate 26 Widening MM 85-MM101, Newberry, Lexington, Richland Counties, SC Environmental Assessment APPENDIX A Interstate 26 Widening Traffic Analysis Report Interstate 26 Widening Traffic Analysis
BROWARD BOULEVARD CORRIDOR TRANSIT STUDY
 BROWARD BOULEVARD CORRIDOR TRANSIT STUDY FM # 42802411201 EXECUTIVE SUMMARY July 2012 GOBROWARD Broward Boulevard Corridor Transit Study FM # 42802411201 Executive Summary Prepared For: Ms. Khalilah Ffrench,
VOA Vista Drive Residential housing Development TIA Project #13915 TABLE OF CONTENTS
 VOA Vista Drive Residential housing Development TIA Project #13915 TABLE OF CONTENTS Executive Summary... 2 Project Background... 2 Conditions... 2 Findings... 3 Recommendations... 4 Introduction... 6
TABLE OF CONTENTS SECTION PAGE. Executive Summary... xii
 TABLE OF CONTENTS SECTION PAGE Executive Summary... xii 1.0 Introduction... 1 1.1 Study Area... 2 1.2 Traffic Impact Analysis Scenarios... 4 1.3 Study Area - City of Orange... 4 2.0 Project Description
Technical Feasibility Report
 Prepared For: Bow Concord I-93 Improvements Project Bow and Concord, NH Prepared By: 53 Regional Drive Concord, NH 03301 NHDOT Project # 13742 Federal Project #T-A000(018) September 2018 TABLE OF CONTENTS
Roundabout Feasibility Study SR 44 at Grand Avenue TABLE OF CONTENTS
 Roundabout Feasibility Study SR 44 at Grand Avenue TABLE OF CONTENTS Introduction and Executive Summary... 1 Existing Conditions... 3 Intersection Volume Conditions... 5 Intersection Operations... 9 Safety
Interstate 85 Widening Traffic Analysis Report
 I-85 Widening Project MM80 MM96 Spartanburg and Cherokee Counties Submitted to: South Carolina Department of Transportation Prepared By: STV Incorporated 140 Stoneridge Drive, Suite 450 Columbia, SC 29210
4.14 TRANSPORTATION AND CIRCULATION
 4.14 TRANSPORTATION AND CIRCULATION 4.14.1 Summary Table 4.14-1 summarizes the identified environmental impacts, proposed mitigation measures, and residual impacts of the proposed project with regard to
Signal System Timing and Phasing Program SAMPLE. Figure 1: General Location Map. Second St.
 I. Overview Consultant A was retained by the Ohio Department of Transportation to conduct traffic signal timing analyses on approximately one mile of roadway on between the Main Street and the Fourth Street
Letter of Transmittal
 Letter of Transmittal To: Chris Lovell City of Richmond Hill Date: 5/2/6 Job 2582 Re: Richmond Hill-South Bryan County Transportation STudy WE ARE SENDING YOU THE FOLLOWING ITEMS ( attached) ( under separate