CUY Safety Study Final Report
|
|
|
- Winfred Phillips
- 5 years ago
- Views:
Transcription


1 CUY Safety Study Final Report Beachwood/Lyndhurst, OH Urban Non-Freeway Intersection Ranking #26 ODOT District Transportation Boulevard Garfield Heights, OH March 18, Singletree Drive Columbus, Ohio

2 Table of Contents 1.0 EXECUTIVE SUMMARY Purpose 1.2 Overview of Safety Issues and Possible Causes 1.3 Recommended Countermeasures and Related Costs 2.0 PURPOSE AND NEED EXISTING CONDITIONS Land Use 3.2 Roadway Conditions 3.3 Intersection Conditions 3.4 Data Collection 3.5 Capacity Analysis 3.6 Clearance Intervals 4.0 CRASH DATA Crash Data Summary 4.2 Crash Analysis 4.3 Highway Safety Manual 4.4 Expected Excess Crash Results 5.0 SUMMARY OF SUPPLEMENTAL TRAFFIC STUDIES COUNTERMEASURES Short Term Countermeasures Upgrade Pavement Markings Upgrade Traffic Signal Installation Upgrade Clearance Intervals Improve Coordination Offsets Restrict Right Turns on Red by Time of Day Lengthen Southbound Dual Left Turn Lane Move Bus Stop on East Leg
3 6.2 Long Term Countermeasures Upgrade Coordination and Reduce Cycle Length Roadway Widening to Improve Capacity Consider Constructing a Median on Cedar Road Connect Beachwood to Acacia Reservation with a Cedar Road Pedestrian Crossing 6.3 Countermeasures Considered But Not Recommended Install Southbound Right Turn Channelizing Island Realign Lanes through Intersection 7.0 BENEFIT COST ANALYSIS...26 List of Appendices Appendix A Existing Conditions Diagram Appendix B Traffic Data Appendix C Capacity Analysis Appendix D Clearance Interval Calculations Appendix E Crash Diagrams Appendix F HSM Output Appendix G Storage Lane Length Calculations Appendix H City of Beachwood 2015 Master Plan Appendix I - ECAT Output and Cost Estimates The contents of this report are protected in accordance with 23 USC Section 409: Discovery and Admission as Evidence of Certain Reports and Surveys.
4 1.0 Executive Summary 1.1 Purpose The purpose of this study is to analyze the existing safety conditions and to determine potential countermeasures to reduce the crash frequency at the intersection of State Route 175 (Richmond Road) and County Route 23 (Cedar Road) in Cuyahoga County. This study intersection is ranked #26 on the Ohio Department of Transportation (ODOT) Highway Safety Improvement Program (HSIP) Urban Intersection Safety Priority List. The study intersection borders the following cities: Lyndhurst to the north of Cedar Road and Beachwood to the south of Cedar Road. 1.2 Overview of Safety Issues and Possible Causes Crash data was furnished by ODOT for the Richmond Road and Cedar Road intersection encompassing a three-year period between January 1, 2012 and December 31, A total of 109 crashes occurred at the study intersection during the three-year period. The top three crash types were rear end, sideswipe-passing, and angle crashes. One pedestrian crash and one pedalcycle crash occurred at the study intersection. 1.3 Recommended Countermeasures and Related Costs Below is a brief overview of the recommended countermeasures. See section 6.0 Countermeasures for more details on the recommended countermeasures. Short Term Countermeasures Upgrade pavement markings Upgrade traffic signal installation Upgrade clearance intervals Improve coordination offsets Restrict right turns on red by time of day Lengthen southbound dual left turn lane Move bus stop on east leg Long Term Countermeasures Upgrade coordination and reduce cycle length Roadway widening to improve capacity Consider constructing median on Cedar Road Connect Beachwood to Acacia Reservation with a pedestrian crossing on Cedar Road The estimated cost for the above countermeasures is $1,697, ODOT VAR-STW Safety Studies CUY March 18, 2016
 and County Route 23 (Cedar Road) in Cuyahoga County.")

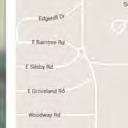
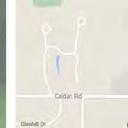
5 2.0 Purpose and Need The purpose of this study is to analyze the existing safety conditions and to determine potential countermeasures to reduce the crash frequency at the intersection of State Route 175 (Richmond Road) and County Route 23 (Cedar Road) in Cuyahoga County. This study intersection is ranked #26 on the Ohio Department of Transportation (ODOT) Highway Safety Improvement Program (HSIP) Urban Intersection Safety Priority List. A project location map and a study area map are provided in Figure 1 and Figure 2, respectively. Figure 1: Project Location Map N Richmond Rd (SR-175) Cedar Rd 2 ODOT VAR-STW Safety Studies CUY March 18, 2016

6 Figure 2: Study Area Map 120/ / /460 Richmond Rd (SR-175) N Cedar Rd 110/ / / / / / / / /100 Notes: 2015 AM peak / PM peak volumes 3.0 Existing Conditions 3.1 Land Use The areas immediately surrounding the study intersection are characterized by mostly commercial land uses with residential land uses in the southwest quadrant of the study intersection. The following are major traffic generators in the near the study intersection and are shown in Figure 3: LaPlace Shopping Center (southeast quadrant of study intersection) Beachwood Place (southeast quadrant of study intersection) Legacy Village (northwest quadrant of study intersection) Cleveland Clinic Journalism-Medicine (2,000 feet north of study intersection) Hawken Lower School (3,500 feet north of study intersection) IR-271 and Cedar Road interchange (4,250 feet east of study intersection) 3 ODOT VAR-STW Safety Studies CUY March 18, 2016

7 Figure 3: Vicinity Map N Hawken Lower School Cleveland Clinic Legacy Village Acacia Reservation Study Intersection LaPlace Shopping Center Beachwood Place IR-271 interchange = signalized intersection The old Acacia Country Club located in the northeast quadrant of the study intersection was obtained by Cleveland Metroparks in 2012 and is now the Acacia Reservation. Beachwood Place proposed a site expansion to the City of Beachwood and a Traffic Impact Study (TIS) was completed by URS Corporation in June The study determined that the site expansion would generate 198 new trips, 95 trips during the AM peak hour and 103 trips during the PM peak hour. It is unknown when this site expansion will take place, but it is understood that these trips will have minimal impact on the study intersection. 4 ODOT VAR-STW Safety Studies CUY March 18, 2016
 (SR-175) East Leg North Leg South Leg Urban Principal Urban Principal Urban Principal Arterial Arterial Arterial Cedar")
8 3.2 Roadway Conditions Existing roadway conditions are summarized in Table 1. An existing conditions diagram is provided in Appendix A. Table 1: Existing Roadway Conditions Richmond Rd Richmond Rd Cedar Rd (SR-175) (SR-175) East Leg North Leg South Leg Urban Principal Urban Principal Urban Principal Arterial Arterial Arterial Cedar Rd West Leg ODOT Functional Classification Urban Principal Arterial Posted speed limit 35 MPH 35 MPH 35 MPH 35 MPH Roadway section 7-lane section 5-lane section 6-lane section 5-lane section ADT 1 18,220 vpd 18,220 vpd 39,074 vpd 39,074 vpd ADT values from ODOT TIMS 3.3 Intersection Conditions Existing lane use for the Richmond Road and Cedar Road approaches to the study intersection can be seen in Figure 4. Roadway lighting is present on all four approaches. An RTA bus stop is present on the east leg of the study intersection in the eastbound receiving lanes. Buses come from the west as well as from the north through the study intersection, both stopping at the bus stop in the receiving lanes of the east leg. Lane widths vary from 10 feet to 14 feet. Pavement markings are in fair condition on all legs, although some of the crosswalk lines are faded. The pavement on all legs is asphalt. The posted speed limit is 35 miles per hour for all legs. Figure 4: Existing Lane Use Richmond Rd (SR-175) N Cedar Rd The Richmond Road and Cedar Road intersection is controlled by a traffic signal operating an eight-phase signal sequence with protected/permitted left turn phases for each approach except for the southbound approach, which has a protected only dual left turn. The southbound and westbound approaches both have overlap right turn phases. 5 ODOT VAR-STW Safety Studies CUY March 18, 2016

9 The traffic signal is a mast arm design with signal supports located at all four corners of the intersection. All signal heads are LED and painted yellow with no backplates. The signal is maintained and operated by the City of Beachwood. No emergency-vehicle preemption system currently exists at this signal. The signal is coordinated in the eastwest direction with adjacent signals on Cedar Road and has a coordinated cycle length of 175 seconds during the AM and PM peak hours. During field observations, it was noted that all of the lanes appear to be fully utilized and there is little no significant preferential lane use. No residual queueing or unmet demand exists at the signal. Coordination between nearby signals appears to be fair, but on a few occasions platoons arrived at the study intersection during the red phase or during the green phase when the back of queue was still stopped. See Figure 5 for a photo of the eastbound queueing between the study intersection and nearby signals during AM peak. Figure 5: Eastbound Queueing at Study Intersection Crosswalks are present on each leg of the study intersection. Curb ramps are present at each corner of the intersection and are all ADA compliant with truncated domes. The pedestrian signal heads are non-countdown type with incandescent light bulbs. Pedestrian pushbuttons are present for each crossing at the signal. The pedestrian phase is on recall in the eastbound-westbound direction, but must be actuated for the northbound-southbound crossing. 3.4 Data Collection Turning movement counts were obtained from the previous safety study conducted by GPD Group in September The manual turning movement counts from this study were conducted at the Cedar Road and Richmond Road intersection between Tuesday, July 7, 2015 and Thursday, July 9, 2015 from 7:00 AM to 8:00 PM. The AM peak hour was determined to be from 7:15 to 8:15 AM and the PM peak hour was determined to be 4:45 to 5:45 PM. Another turning movement count was also collected on Tuesday, September 6 ODOT VAR-STW Safety Studies CUY March 18, 2016
10 15, 2015 from 7:00 AM to 9:00 AM, 11:30 AM to 1:30 PM, and 4:30 PM to 6:30 PM. The AM peak hour was determined to be from 7:30 to 8:30 AM and the PM peak hour was determined to be 5:00 to 6:00 PM. Existing Year 2015, Opening Year 2021, and Design Year 2041 traffic volumes were developed by GPD Group for the previous study and was submitted to ODOT in September The volumes developed for certification are higher than what was the raw counted data as design hourly volume (DHV) factors were applied to the raw counted volumes. The raw counted traffic volumes were not adjusted to account for the unmet demand since this was not observed. Future growth rates were calculated using ODOT historic traffic data from 1992 to present day. Based on the growth of traffic in the previous study s study area, an annual growth rate of 0.25 percent was used to develop future volumes. Traffic volume plates are provided in Appendix B. Traffic volumes developed by GPD Group was used for the traffic analysis used in this report. 3.5 Capacity Analysis Intersection capacity was evaluated to assess existing intersection operations using 2015 traffic volumes and existing signal timing and phasing. Existing levels of service and vehicle delay are summarized in Table 2. Capacity analysis was also performed for Build and No Build scenarios using the Opening Year 2021 and Design Year 2041 traffic volumes developed by GPD Group for the previous study. Detailed evaluation results and an explanation of each scenario are provided in Appendix C. The signal will not function adequately during the PM peak in the current year or the 2041 Design Year without lanes being added to the intersection. Long-term countermeasures to mitigate capacity issues will be discussed further in the countermeasures section. Table 2: Existing Intersection Capacity Summary EB Approach WB Approach NB Approach SB Approach Intersection 2015 AM Peak D/42.2 C/33.0 E/69.9 E/71.5 D/ PM Peak E/63.8 E/75.6 F/126.2 E/73.2 F/82.2 Letter/Number Level of Service/ Average Delay per Vehicle 3.6 Clearance Intervals Vehicular clearance times were calculated for the study intersection based on guidelines published in the Ohio Manual of Uniform Traffic Control Devices (OMUTCD), Traffic Engineering Manual (TEM), and National Cooperative Highway Research Program (NCHRP) 731, and ODOT District 12 clearance interval standards. Calculated clearance 7 ODOT VAR-STW Safety Studies CUY March 18, 2016
11 intervals are based on posted speed limit (35 MPH) for all approaches, 20 MPH for left turns, and measured crossing distances. This methodology helps provide adequate allred clearance times based on operating speeds and avoids excessively long clearance intervals (yellow plus all-red). A summary of existing and recommended clearance intervals is provided in Table 3. Detailed calculations are provided in Appendix D. Recommended clearance intervals differ from the existing timings, suggesting that signal-timing modifications may be warranted based on current industry best practices. Note that the recommended values listed are not necessarily the calculated clearance interval values. With crash issues at the study intersection being linked to congestion issues, increasing total clearance interval time is undesirable as it would reduce green time and add to the congestion. Phase Table 3: Clearance Interval Summary Existing (Yellow/All-Red) Existing Total Recommended (Yellow/All-Red) Recommended Total Phase 1: WB Left 3.6 sec./1.0 sec. 4.6 sec. 3.0 sec./1.6 sec. 4.6 sec. Phase 2: EB Through 3.6 sec./2.0 sec. 5.6 sec. 3.6 sec./2.0 sec. 5.6 sec. Phase 3: NB Left 3.6 sec./1.0 sec. 4.6 sec. 3.0 sec./1.6 sec. 4.6 sec. Phase 4: SB Through 3.6 sec./2.0 sec. 5.6 sec. 3.6 sec./2.0 sec. 5.6 sec. Phase 5: EB Left/SB Right 3.6 sec./1.0 sec. 4.6 sec. 3.0 sec./1.6 sec. 4.6 sec. Phase 6: WB Through 3.6 sec./2.0 sec. 5.6 sec. 3.6 sec./2.0 sec. 5.6 sec. Phase 7: SB Left/WB Right 3.6 sec./1.0 sec. 4.6 sec. 3.0 sec./1.6 sec. 4.6 sec. Phase 8: NB Through 3.6 sec./2.0 sec. 5.6 sec. 3.6 sec./2.0 sec. 5.6 sec. Note: Maximum all-red clearance time set at 3 seconds for through phases and 2 seconds for left turn phases. Calculated values may be longer than 3 seconds. 4.0 Crash Data 4.1 Crash Data Summary Crash data was furnished by ODOT for the Richmond Road and Cedar Road intersection encompassing a three-year period between January 1, 2012 and December 31, The OH-1 report for each documented crash was reviewed to confirm accuracy, correct where necessary, and to locate crashes properly within the study limits. The original crash data query included 116 crashes, which was scaled back to 109 crashes within the study limits after reviewing and relocating crashes as necessary. The crash diagrams for the intersection are included in Appendix E. Table 4 represents the breakdown of the crash data. Note that the statewide averages listed in the table are based on 2010 to 2014 data, whereas the project data encompasses years 2012 to Red text represents a rate higher than the average and therefore over-represented in the study area. 8 ODOT VAR-STW Safety Studies CUY March 18, 2016
12 Table 4: Crash Data Compared to Statewide Averages Number Percent Statewide Average Crash Severity Injury % 26.1% Property Damage Only % 73.5% Rear End % 31.1% Sideswipe - Passing % 8.7% Crash Type Angle % 16.0% Left Turn 7 6.4% 5.3% Pedalcycles 1 0.9% 0.6% Pedestrian 1 0.9% 0.8% Dry % 70.4% Road Condition Wet % 21.2% Snow 5 4.6% 5.0% Table 5 represents the breakdown of the crash data by month of the year, day of the week, and time of day. 4.2 Crash Analysis Safety and operational issues observed and documented at the Richmond Road and Cedar Road intersection are consistent with urban/suburban commercial intersections with high traffic volumes. The afternoon through the PM peak hour (2:00 6:00 PM) is the period that has the highest concentration of crashes. A significant number of crashes occur during the weekend when Table 5: Temporal Crash Data Trends Crash Month Number Percent Hour of Day Number Percent January % 1:00 AM 1 0.9% February 7 6.4% 6:00 AM 1 0.9% March % 7:00 AM 3 2.8% April 8 7.3% 8:00 AM 6 5.5% May % 9:00 AM 6 5.5% June 6 5.5% 10:00 AM 3 2.8% July % 11:00 AM 4 3.7% August 8 7.3% 12:00 PM 7 6.4% September 7 6.4% 1:00 PM 9 8.3% October 8 7.3% 2:00 PM % November % 3:00 PM % December 9 8.3% 4:00 PM % Day of Week Number Percent 5:00 PM % Monday % 6:00 PM 6 5.5% Tuesday % 7:00 PM 6 5.5% Wednesday % 8:00 PM 5 4.6% Thursday % 9:00 PM 6 5.5% Friday % 10:00 PM 2 1.8% Saturday % Sunday % commuter traffic is low, but perhaps when traffic going to/from the nearby shopping centers is high. However, the peak shopping months of November and December did not see the highest frequency of crashes as expected. As shown in Table 4, rear end crashes are over-represented at the study intersection compared to statewide averages, which could be attributed to traffic congestion within the intersection influence area. Congestion is a contributing factor to the majority of crashes at the study intersection for the following reasons: The majority of crashes (70 crashes or 64.2 percent) are rear end crashes 9 ODOT VAR-STW Safety Studies CUY March 18, 2016
13 The highest frequency of crashes (65 crashes or 59.6 percent) involved a vehicle that was slowing or stopped in traffic Noteworthy crash patterns within the study limits are summarized in Table 6 with supporting details following. Rear End Sideswipe - Passing Angle Left Turn Table 6: Crash Summary by Intersection Leg Richmond Rd (SR-175) South Leg Richmond Rd (SR-175) North Leg 14 arriving at intersection 1 while making dual SBLT 1 arriving at intersection 1 departing intersection 1 while making dual SBLT 4 SBRT hits WB thru 2- SBRT hits NBLT 1 SB thru hits EB thru 1 NB thru hits SBLT 4 arriving at intersection 1 arriving at intersection 1 EB thru hits NBLT 1 NB thru hits EB thru 1 NB thru hits WB thru 1 SB thru hits NBLT 1 NBLT hits SB thru Cedar Rd East Leg 18 arriving at intersection 8 - departing intersection 4 arriving at intersection 1 departing intersection 1 WBRT in thru lane hits WB thru 4 WBLT hits EB thru Cedar Rd West Leg 25 arriving at intersection 4 arriving at intersection 1 departing intersection Rear End Crashes Rear end crashes were the most prevalent crash type at the study intersection. A total of 70 rear end crashes were reported during the analysis period, with 27 of those crashes resulting in injury (a relatively high percent for rear end crashes). The most rear end crashes occurred on the west leg of the study intersection, suggesting that this approach is the most in need of improvement. 2. Sideswipe Passing Sideswipe-passing were the second most prevalent crash type at the study intersection. A total of 14 sideswipe-passing crashes were reported, with one of those crashes resulting in injury. The most sideswipe-passing crashes that occurred while arriving at the study intersection were on the east and west legs. 3. Angle Crashes Angle crashes were the third most prevalent crash type at the study intersection. A total of 11 angle crashes were reported, with six of those crashes resulting in injury. Four of those crashes involved a southbound right vehicle attempting to turn right on red and hitting a westbound through vehicle. Two of the crashes involved a southbound right 10 ODOT VAR-STW Safety Studies CUY March 18, 2016
14 vehicle and a northbound left vehicle, but it is unknown if the northbound left had the protected or permitted left indication. 4. Left Turn Crashes Left turn crashes were the fourth most prevalent crash type at the study intersection. Seven left turn crashes were reported, with four of those crashes resulting in injury. Four of the left turn crashes occurred between a westbound left turning vehicle striking an eastbound through vehicle. That being said, left turn crash performance is close to the statewide average and does not appear to be an issue at the study intersection. 5. Pedalcycle One pedalcycle crash occurred at an access drive just east of the study intersection during the study period. The crash occurred when an eastbound through vehicle was attempting to turn right into the access drive while the cyclist traveling in the sidewalk on the south side of Cedar Road was crossing the same access drive. The front of the vehicle struck the cyclist, resulting in non-incapacitating injury to the cyclist. 6. Pedestrian One pedestrian crash occurred at the study intersection during the study period. The crash occurred about 60 feet west of the study intersection between a vehicle headed westbound departing the study intersection and a pedestrian (juvenile female) crossing Cedar Road from the south to the north outside of the marked crosswalk. The pedestrian crossed while the traffic signal was green for through traffic on Cedar Road. The vehicle struck the pedestrian resulting in an incapacitating injury to the pedestrian. The pedestrian appears to have been at fault for this instance. 4.3 Highway Safety Manual The predictive method described in Part C of the Highway Safety Manual provides steps to estimate the expected average crash frequency of a site for a given time period, geometric design, traffic control features, and traffic volumes. The expected average crash frequency (Nexpected) is estimated using a predictive model estimate of crash frequency for a specific site type (Npredicted) together with observed crash frequency (where available). Predicted average crash frequency: This step involves determination of the predicted crash frequency, which reflects how a site would be expected to perform relative to 1,000 similar sites. Calculation of predicted crash frequency utilizes Safety Performance Functions (SPF) for a base condition. Crash Modification Factors (CMF) are applied to 11 ODOT VAR-STW Safety Studies CUY March 18, 2016
.")
15 account for specific site characteristics that differ from the base condition. A state-level calibration factor is then applied to normalize the base condition to localized conditions. The resulting value is the Predicted Crash Frequency (Npredicted). Expected average crash frequency: The next step involves calculation of the expected average crash frequency, which reflects average performance of the site over an extended period of time based on actual crash history. This step incorporates the Empirical Bayes (EB) method, which combines actual (observed) crash history of the study site with predicted average crash frequency. These values are weighted based on an overdispersion parameter (k) that is the measure of the strength of the model (safety performance factors). The resulting value is the expected average crash frequency (Nexpected). 4.4 Expected Excess Crash Results The difference between the predicted and expected average crash frequencies is termed the Expected Excess Figure 6: Expected Excess Crashes Crashes for the site, as shown in Figure 6. If the expected average crash frequency is greater than the predicted average crash frequency, then the site has potential for safety improvement. If expected frequency is less than predicted frequency, then the site is expected to experience fewer crashes per year on average than its peers. The HSM predictive method for urban/suburban arterials was applied to the Richmond Road and Cedar Road intersection and to determine the potential for safety improvement. The results presented in Table 7 shows the expected crash frequency calculated using HSM predictive method with cleaned crash data and existing conditions for the intersection. The results conclude that the expected crash frequency is greater than the predicted crash frequency for the study intersection for fatal and all injury crashes. This 12 ODOT VAR-STW Safety Studies CUY March 18, 2016
16 suggests that the intersection experiences more average crashes per year than its peers and has a potential for reducing crashes. A detailed overview of the HSM output reports are provided in Appendix F. Table 7: HSM Results for Existing Conditions for Fatal and All Injury Crashes Intersection Total: Richmond Cedar Rd (crashes/year) Predicted Average Crash Frequency 4.53 (Npredicted) Expected Average Crash Frequency 6.51 Existing Conditions (Nexpected, existing) Expected Excess Crashes Summary of Supplemental Traffic Studies A previous safety study was conducted by DLZ in April 2014 at the same intersection of Richmond Road and Cedar Road. Crash data was obtained for the three-year period between 2009 and Crash analysis concluded that the most common types of crashes in the study area were rear end (68.3 percent), left turn (8.9 percent), angle (8.9 percent), and sideswipe-passing (8.9 percent) with 28.7 percent of the total crashes resulting in injury. The following countermeasures were proposed in the safety study: Short-Term Countermeasures o Signal timing upgrades for the Richmond Road and Cedar Road intersection o Add dotted line pavement markings for the southbound dual left turn lanes Medium-Term Countermeasures o Extend the storage length for the southbound left turn lanes o Install near right side supplemental signal head on the westbound approach o Upgrade pedestrian signal heads to countdown type Long-Term Countermeasures o Widen the eastbound approach to allow for an additional through lane o Widen the westbound approach to allow for an additional through lane It is assumed that none of the proposed countermeasures from this previous safety study were implemented, except for the southbound left turn lane being lengthened. For this 13 ODOT VAR-STW Safety Studies CUY March 18, 2016
17 reason, some of the proposed countermeasures from this previous safety study are recommended again as part of this safety study. Another previous safety study was conducted by GPD Group in September 2015 for a traffic signal system upgrade for the City of Beachwood. The study area included Richmond Road from Science Park Drive to Cedar Road and Cedar Road from the IR-270 interchange to Halcyon Road, as well as six individual signalized intersections. Crash data was obtained for the three-year period between 2012 and Crash analysis concluded that the most common type of crashes were rear end and sideswipe-passing crashes, suggesting congestion and progression issues exist throughout the corridor, not just at the study intersection. The large number of angle crashes also suggested that signal visibility could be improved. The following long-term countermeasures were proposed in the safety study for all traffic signals within the study area: Reconstruction of all traffic signal installations. This includes signal heads with backplates with reflective tape, actuated-coordinated traffic responsive signals, and countdown pedestrian signal heads with pushbuttons. Optimization of all cycle lengths, phasing splits, offsets, and updated clearance intervals. It is understood that the City of Beachwood is planning to propose a traffic signal system upgrade project that will implement the countermeasures from this previous safety study. It is unknown at this point when the project will occur; the report used 2021 as the opening year for traffic analysis. For this reason, some of the proposed countermeasures from this previous safety study are recommended again as part of this safety study. 6.0 Countermeasures The following section addresses possible countermeasures to mitigate the prevalent crash types at the Richmond Road and Cedar Road intersection. Additional countermeasures are recommended to minimize potential safety issues that may not be directly attributed to historical crash trends. See Figure 7 for a concept plan of the proposed countermeasures. As previously stated, some of the proposed countermeasures are repeated countermeasures from the previous DLZ safety study conducted in 2011 and the previous GPD Group safety study conducted in These are carried forward since the countermeasures were not implemented and are still applicable. Recommended short and long term countermeasures are listed below with supporting details following. 14 ODOT VAR-STW Safety Studies CUY March 18, 2016
18 Short Term Countermeasures Upgrade pavement markings Upgrade traffic signal installation Upgrade clearance intervals Improve coordination offsets Restrict right turns on red by time of day Lengthen southbound dual left turn lane Move bus stop on east leg Long Term Countermeasures Upgrade coordination and reduce cycle length Roadway widening to improve capacity Consider constructing median on Cedar Road Connect Beachwood to Acacia Reservation with a Cedar Road pedestrian crossing 6.1 Short Term Countermeasures Upgrade Pavement Markings It is recommended that the pavement markings throughout the study intersection be upgraded. Pavement markings are in fair condition and acceptable on all legs of the study intersection. However, it is understood that the pavement marking material used by the city is paint and it has a history of fading over time. This is especially an issue for the dotted line separating the southbound dual left turn lanes. It is recommended that applying thermoplastic pavement markings be assessed for any future projects for increased durability, especially for auxiliary markings. Thermoplastic pavement markings are more costly than paint, but are capable of a longer service life and will result in benefits including reduced frequency of renewal and less exposure for pavement marking contractors. This could be completed in conjunction with Cuyahoga County s upcoming 2016 resurfacing job on Cedar Road. If thermoplastic pavement markings are not desirable to the city, it is recommended that the paint at least be monitored and refreshed twice annually and thermoplastic pavement markings still be implemented for auxiliary markings. Also, an existing dotted line is present for the eastbound right turn movement. This pavement marking is not necessary because that lane is a shared through/right turn lane. It is recommended that this dotted line be removed. 15 ODOT VAR-STW Safety Studies CUY March 18, 2016

19 Figure 7: Concept Plan Extend southbound dual left turn lane Richmond Rd (SR-175) Full signal reconstruction Possible pedestrian crossing location with PHB or RRFB Cedar Rd Move back existing bus stop 16 ODOT VAR-STW Safety Studies CUY March 18, 2016


20 6.1.2 Upgrade Traffic Signal Installation Full reconstruction of the traffic signal installation is proposed to improve signal visibility and functionality. This recommendation includes the following components: Install LED signal heads with backplates. The addition of backplates increases the visibility of the signal heads and will help to mitigate red light running and rear ends. See Figure 8 for an example of vehicular signal heads with backplates. Note that the design capacity of the existing signal supports must be checked before adding signal heads with backplates. If new signal supports are necessary, this recommendation would become a medium term countermeasure. Add supplemental near-side mounted vehicular signal heads on all approaches to increase signal visibility. Existing signal head to stop bar distance ranges from approximately 120 feet to 145 feet. The OMUTCD states the maximum signal head to stop bar distance shall be no more than 180 feet for 12-inch signal head faces. While the existing signal head to stop bar distance is acceptable, the addition of the supplemental signal heads will help to increase signal visibility. The southbound left turn signal heads currently have a circular red, yellow arrow, and green arrow indication with no R10-10 Left Turn Signal signs posted. These left turn signal heads should be replaced with signal heads with a red arrow, yellow arrow, and green arrow indication. No R10-10 signs would be necessary with this configuration. See Figure 9 for an example of the existing versus the proposed left turn signal head indications. Replace existing pedestrian signal heads with countdown type pedestrian signal heads. Countdown displays are required as per the Ohio Manual of Uniform Traffic Control Devices (OMUTCD) for all pedestrian Figure 8: Vehicular Signal Head with Backplate Figure 9: Existing vs. Proposed Left Turn Signal Head Figure 10: Countdown Pedestrian Signal Head signal heads in which the pedestrian change interval is greater than seven seconds. The countdown display effectively informs pedestrians of how much 17 ODOT VAR-STW Safety Studies CUY March 18, 2016
21 time they have left to complete their crossing. See Figure 10 for an example of the recommended countdown type pedestrian signal head. Replace existing pedestrian pushbuttons with the vandal-resistant design to fully actuate pedestrian movements. Install an uninterruptible power supply (UPS) to improve the reliability of the operation of this high-volume intersection. Consider installing an emergency-vehicle preemption system. Two Cleveland Clinic Hospitals are within half a mile of the study intersection, one to the north and one to the east. The University Hospitals Chagrin Highlands Health Center is also located three miles to the south of the study intersection. This makes for a considerable amount of ambulance traffic through the study intersection, which was noted during field observations. Emergency-vehicle preemption is utilized at the Lyndhurst signals to the north. Emergency-vehicle preemption would help to get ambulances through the study intersection quickly and safely. Upgrade vehicle detection from loop detection to radar detection on all four approaches. Each radar unit can detect multiple areas. This will allow the intersection to run free during the off-peak. With the signal running free it can have lower minimum green times when necessary. While upgrading vehicle detection, it is also recommended that the vehicle detection for protected/permitted left turn movements be changed from existing first vehicle detection to second vehicle detection. This will also increase efficiency of the signal by skipping the left turn phase if only one vehicle is at the stop line, forcing that vehicle to make a permissive left turn. However, left turn second vehicle detection is not recommended for roadways with more than two opposing through lanes. Therefore, if the long term countermeasures are implemented, left turn second vehicle detection will no longer be a feasible recommendation Upgrade Clearance Intervals Modification of the yellow change and all-red clearance times is recommended to provide the optimal clearance time for the speeds and conditions of the approaches. The recommended timing changes do not change the overall total clearance/change interval time, but it does better allocate time to the all-red/yellow clearance times accordingly to mitigate crashes occurring when motorists attempt movements through the intersection at the end of the clearance phase. Recommended yellow clearance and all-red clearance times can be seen in Table 3 and Appendix D. 18 ODOT VAR-STW Safety Studies CUY March 18, 2016
22 6.1.4 Improve Coordination Offsets It is recommended that the existing coordination offsets between nearby signals be reviewed and improved if necessary. With the majority of crashes being rear end crashes and the highest frequency of crashes involving a vehicle that was slowing or stopped in traffic, it can be concluded that poor progression is a major issue throughout the corridor. One way to mitigate this safety issue is to ensure that progression is optimized throughout a corridor of closely spaced signals. It was observed that some instances occurred when platoons of vehicles would arrive at the intersection at the red signal indication at multiple signals throughout the corridor, and the progression could be improved with fixed offsets. Having progression optimized throughout the corridor would ensure that through vehicles would not have to stop as often and therefore less rear end crashes will occur Restrict Right Turns on Red by Time of Day As stated in the crash analysis section, angle crashes were the third most prevalent crash type at the study intersection with a total of 11 angle crashes. Four of those crashes involved a southbound right vehicle attempting to turn right on red and hitting a westbound through vehicle. Two of the crashes involved a southbound right vehicle and a northbound left vehicle, but it is unknown if the northbound left had the protected or permitted left indication. Half of those angle crashes could have been mitigated by the restriction of right turns on red by time of day. The southbound and westbound approaches both have overlap right turn phases. The city of Lyndhurst has signs posted at the Mayfield Road / Richmond Road intersection directly to the north of the study intersection restricting right turns on red from 7:00 AM to 6:00 PM on all approaches. A similar sign application is recommended for the southbound right turn movement at the study intersection. This recommendation only degrades LOS for the southbound movement by 1.1 seconds during the AM peak and 1.6 seconds during the PM peak in See Figure 7 for proposed sign legend and location Lengthen Southbound Dual Left Turn Lane The current southbound dual left turn lane is 390 feet for the eastern turn lane and 470 feet for the western turn lane. The calculated southbound dual left turn lane is 475 feet for the eastern turn lane and 525 feet for the western turn lane. The calculated through block for the southbound dual left turn lane is 650 feet. While the storage for this movement appears to be adequate as is existing, the calculated turn lane lengths were 19 ODOT VAR-STW Safety Studies CUY March 18, 2016
23 completed using Design Year 2041 traffic volumes and show that the turn lanes will need to be lengthened to accommodate future traffic volumes. It is recommended that the existing dual left turn lane be lengthened to 475 feet for the eastern turn lane and 525 feet for the western turn lane. This can be done without widening the roadway and without shortening the northbound left turn lane into Legacy Village and can be completed in conjunction with the upcoming 2016 pavement marking program. Turn lane length calculations are provided in Appendix G Move Bus Stop on East Leg A bus stop is located approximately 135 feet east of the study intersection on the eastbound receiving lanes. Buses stop here coming from the west through the study intersection and from the north making a southbound left at the study intersection. When the bus stops it causes backup through the study intersection. This is especially true for the bus making the southbound left, which backs up the southbound left turning vehicles through the intersection. A bus stops at this location about three times per hour. It was recommended that the bus stop be moved 200 feet to the east, away from the study intersection. The bus stop location was recently reviewed by Greater Cleveland Regional Transit Authority (GCRTA) as part of this study and moved 75 feet to the east. This will allow for more space for vehicles to queue up behind the stopped bus before blocking the study intersection. Crash data shows that there were eight rear end crashes departing the intersection on the east leg. It is possible that these crashes could be attributed to queueing behind the stopped buses and could be mitigated by moving the bus stop further from the study intersection. It was also observed that most of the bus riders walk south towards the LaPlace Shopping Center or Beachwood Place. Since no significant number of bus riders were observed walking towards the study intersection or to the north or west side of the intersection, moving the bus stop further to the east should not create any issues. 6.2 Long Term Countermeasures Upgrade Coordination and Reduce Cycle Length As stated earlier, a previous safety study was conducted by GPD Group for a traffic signal system upgrade for the City of Beachwood. A safety application was submitted for the project and the countermeasures from the report are intended to be implemented at some point, but the expected start of construction date is unknown. For this reason, the countermeasures from this previous safety study are recommended again as part of this 20 ODOT VAR-STW Safety Studies CUY March 18, 2016
24 safety study. This long-term countermeasure of optimizing all cycle lengths, phasing splits, offsets, and updated clearance intervals for all signals in the Beachwood coordinated system, including the study intersection, is recommended as part of this safety study as well. However, the proposed timing plans for the GPD Group traffic signal system upgrade for the City of Beachwood recommends changing the existing cycle length of 175 seconds during the AM and PM peak hours to 160 seconds during the AM peak and 180 seconds during the PM peak hour. These are relatively long cycle lengths that could contribute to poor progression, bad levels of service, driver frustration, and higher crash frequencies as a result. Therefore, it is recommended that a shorter cycle length for the corridor be considered in the long term. The shorter cycle length used in the capacity analysis was 120 seconds for both AM and PM peak hours. With a shorter cycle length, overall intersection capacity will be improved in the 2021 PM peak scenario from LOS F with 88.6 seconds of delay per vehicle (with proposed traffic signal system upgrade long cycle length) to LOS F with 84.1 seconds of delay per vehicle. In the 2041 PM peak scenario overall intersection capacity is improved from LOS F with seconds of delay per vehicle to LOS F with 99.2 seconds of delay per vehicle. This capacity analysis uses the No Build scenario, the Build scenario with roadway widening described below would increase capacity further. It is understood that long cycle lengths is a City of Beachwood preference and may be difficult to change, but it should be considered Roadway Widening to Improve Capacity The long term countermeasures included in the previous safety study by DLZ in April 2014 are still considered to be applicable and are therefore recommended as long term countermeasures in this report. The countermeasures included widening the eastbound and westbound approaches to allow for an additional through lane in each direction. The additional eastbound through lane is to be created by widening to the south to create a shared through/right turn lane that begins to taper from the existing through lanes about 350 feet back from the stop line. The shared through/right turn lane then continues through the intersection and drops into a right turn only lane at the next adjacent signal at Beachwood Place. The option of extending this eastbound lane to a drop right turn only lane onto the next signal to the east, George Zeiger Drive, was considered. It was determined that dropping the eastbound lane at Beachwood Place would be the best option because a higher eastbound right turn volume is present at Beachwood Place versus George Zeiger Drive (48 percent higher right turn ADT in 2041). Extending the eastbound through lane to George Zeiger Drive has lane utilization benefits, but those 21 ODOT VAR-STW Safety Studies CUY March 18, 2016
25 benefits are not expected to outweigh the additional costs. However, if the additional through lane to Beachwood Place does not reduce congestion adequately through the study intersection, it is recommended that extending the additional eastbound lane to George Zeiger be reconsidered. The additional westbound through lane is to be created by widening to the north for the westbound right turn lane on the east leg. The additional westbound through then continues through the intersection (resulting in some widening on the west leg) and then drops at the right turn lane into Legacy Village. Widening to the north on the east leg of the intersection could pose a challenge to obtaining right of way because that land is now owned by Cleveland Metroparks. Acacia Reservation was donated to Cleveland Metroparks with certain restrictions that do not allow Cleveland Metroparks to subdivide the property. Property negotiations must take place through The Conservation Fund. Also, many existing utility poles and signs in this area would have to be relocated as a result of the widening. The widening of the eastbound and westbound approaches will improve capacity, therefore increasing safety by reducing rear end crashes. Overall intersection capacity will be improved in the 2021 PM peak scenario from LOS F with 88.6 seconds of delay per vehicle to LOS E with 63.7 seconds of delay per vehicle. In the 2041 PM peak scenario overall intersection capacity is improved from LOS F with seconds of delay per vehicle to LOS E with 72.0 seconds of delay per vehicle. This capacity analysis uses the proposed traffic signal system upgrade long cycle length; the LOS and delays are improved further with the recommended shorter cycle length. With the addition of the westbound and eastbound through lanes, which both turn into drop right turn lanes, increased directional and wayfinding signs are recommended. The increased signage will help to direct vehicles into their appropriate lanes as they are approaching the intersection, alleviating confusion and last minute lane changes and thereby reducing sideswipe-passing and rear end crashes that could result from the drop right turn lanes. Recommended directional and wayfinding signs can be seen in Figure 7. Also with the addition of the westbound and eastbound through lanes, additional signal heads will be added to the proposed signal installation for each approach. Another option for implementing this long term countermeasure is to split the improvements into two options: the addition of a westbound through lane and the addition of an eastbound through lane. It was noted in the report that most rear end crashes occurred on the west leg of the study intersection, suggesting that this approach is the most in need of capacity improvement. Also, widening to the north for an additional westbound lane could have significant right of way impacts to the Acacia 22 ODOT VAR-STW Safety Studies CUY March 18, 2016
26 Reservation. The cost for all countermeasures with the addition of an eastbound though lane only is $1,221,000. The cost to later add the westbound through lane (assuming the eastbound through lane and all other countermeasures have already been completed) is $655,000. The total cost of all countermeasures when splitting the widening projects is $1,876,000 compared to $1,697,000 if the widening projects are done together. The addition of a through lane in each direction is still recommended, but it can be noted that only adding a through lane for the eastbound movement would mitigate the majority of crashes and is the lower cost option Consider Constructing a Median on Cedar Road Constructing a median on Cedar Road should be considered in the long term. This improvement would change the feel of Cedar Road for both vehicles and pedestrians. It would allow pedestrians crossing Cedar Road to have a two-stage crossing as opposed to having to cross eight lanes of traffic (after the proposed widening has been implemented). This would create a more pedestrian friendly environment through a heavily traveled corridor. This recommendation would call for further widening of Cedar Road and more right of way impacts to the Acacia Reservation. For these reasons, this countermeasure is recommended and should be considered as part of the larger project, but is not included in the concept plan, cost estimate, or benefit cost analysis Connect Beachwood to Acacia Reservation with a Cedar Road Pedestrian Crossing The City of Beachwood 2015 Master Plan calls for a pedestrian bridge over Cedar Road to connect Beachwood Place to the Acacia Reservation. It is stated that the proposed pedestrian bridge would act as a community gateway and effectively connect with the City of Beachwood s proposed bike paths to connect to the park system. The portion of the City of Beachwood 2015 Master Plan (October 2015 Draft) relevant to this project is included in Appendix H. It is recommended that this pedestrian crossing be considered as part of the proposed project at the study intersection. Especially with the proposed addition of through lanes in each direction, a safe crossing for pedestrians to get from the bus stop and Beachwood Place to the Acacia Reservation is needed. The recommendation of adding a median and a two-stage crossing on Cedar Road would decrease the crossing distance and increase safety for pedestrians. Also, a midblock crossing of Cedar Road east of the study intersection could be constructed. Recommended location of the midblock crossing can be seen in Figure ODOT VAR-STW Safety Studies CUY March 18, 2016
. See Figure 11 for an example of an RRFB application and Figure 12 for an example of a PHB application.")

27 It is recommended that a future pedestrian study be conducted to investigate the need for a curbed median (to provide a refuge area) along with a rectangular rapid flashing beacon (RRFB) or pedestrian hybrid beacon (PHB). See Figure 11 for an example of an RRFB application and Figure 12 for an example of a PHB application. Since the PHB would be closely placed to two signals on Cedar Road (Richmond Road and Beachwood Place), it would have to be coordinated with the nearby signals so that queueing through the already signalized intersections does not occur. This countermeasure is recommended and should be considered as part of the larger project, but is not included in the cost estimate or benefit cost analysis. Figure 11: RRFB Application Figure 12: PHB Application 6.3 Countermeasures Considered But Not Recommended Install Southbound Right Turn Channelizing Island As stated in the crash analysis section and the countermeasure to restrict right turns on red, angle crashes were the third most prevalent crash type at the study intersection. In order for a southbound right turning vehicle to turn right on red they must pull up a considerable distance past the stop line in order to see the westbound through vehicles around the westbound right turning vehicles. A right turn channelizing island was considered for the southbound approach, but was dismissed. It was observed during field observations that a vehicle path for this island is already visible in debris on the roadway, as seen in Figure 13. This island would have many benefits including pulling the southbound approach stop line closer to the intersection, increasing visibility for southbound right turn on red vehicles, decreasing 24 ODOT VAR-STW Safety Studies CUY March 18, 2016


28 vehicular and pedestrian clearance interval time, and creating a pedestrian refuge. The addition of a right turn channelizing island may not be desired because of ADA compliance issues or the cost for possible widening. It was also determined that the prohibition of right turn on red movements would still be enforced with or without the addition of the right turn channelizing island. For these reasons, the countermeasure of installing a southbound right turn channelizing island was dismissed. Figure 13: Vehicle Path Visible in Debris Realign Lanes through Intersection An offset exists between the northbound/southbound lanes and the eastbound/westbound lanes through the study intersection. The offset between the northbound/southbound lanes is approximately 6 feet and the offset between eastbound/westbound lanes ranges from approximately 2 to 5 feet. See Figure 14 for the northbound centerline pavement marking projected through the intersection to show the resulting offset. This offset creates an undesired lane shift through the unmarked center of the intersection, which could cause added confusion and possibly result in a crash. The offset is especially undesired on the eastbound, westbound, and northbound approaches, which have protected/permissive left turn phasing and need a positive offset to be able to see around the opposing queued left turn vehicles to find a gap in the opposing through traffic. Ideally, the lane lines should line up through the intersection on all approaches. That being said, left turn crash performance is close to the statewide average and does not appear to be an issue at the study intersection. For these reasons, the countermeasure of realigning lanes through the intersection was dismissed. Figure 14: Existing Offset Richmond Rd (SR-175) Cedar Rd N 25 ODOT VAR-STW Safety Studies CUY March 18, 2016
29 7.0 Benefit Cost Analysis Benefit cost analysis is a tool to determine the financial benefits of a project by comparing the net present value (NPV) of a project to NPV of the safety benefit provided by that project. Benefit cost values greater than one indicate a positive return on the original investment. Preferred countermeasures are those having the highest NPV of safety benefits. A benefit cost analysis for the recommended countermeasures was prepared using the ODOT Economic Crash Analysis Tool (ECAT). Crash modification factors (CMF) were applied for the following improvements. This does not account for all recommended improvements, rather only those countermeasures that have CMF values. A CMF was also applied within the data inputs of ECAT for the right turn on red prohibition countermeasure for the southbound approach. Intersection countermeasures for Richmond Road and Cedar Road intersection: Addition of auxiliary through lane: A CMF does not exist for this countermeasure, so a CMF equal to the ratio of the capacity improvement in the 2041 PM peak scenario was developed. There would be a 30 percent increase in capacity which yields a CMF of However, a more conservative CMF of 0.80 was used for the analysis instead. This CMF was applied to all crashes. Improve Visibility of Signal Heads: A CMF of 0.93 was applied to all crashes. This CMF was obtained from the FHWA Crash Modification Factor Clearinghouse and has a 4 star quality rating. Advance Street Name Signs: A CMF of was applied to all sideswipe crashes and a CMF of was applied to all other crashes. These CMF s were obtained from the FHWA Crash Modification Factor Clearinghouse and have a 4 star quality rating. Project costs were estimated for all recommended short and long term countermeasures (shown in Figure 7 and listed in the Countermeasures section of this report) including upgrading the traffic signal installation, upgrading the pavement markings, lengthening the southbound left turn lane, roadway widening, and realigning lanes. The estimated cost for the above countermeasures is $1,697,000. Note that the pedestrian crossing proposed in the City of Beachwood 2015 Master Plan was not included in the cost estimate and ECAT analysis. Construction cost estimates assume the following: 35 percent design risk 6.1 percent inflation rate for an estimated 2017 construction year Estimated right of way impacts and anticipated associated costs 26 ODOT VAR-STW Safety Studies CUY March 18, 2016
30 Cost estimates and benefit cost analysis reports from ECAT are included in Appendix I. Table 8 summarizes the benefit cost analysis results. Note that even with the high countermeasure costs, the project still results in a positive benefit/cost ratio. Countermeasures with CMF values used in ECAT Table 8: Benefit Cost Analysis Addition of auxiliary through lane Improve visibility of signal heads Advance street name signs Expected annual crash adjustment Net present value of project $1,765,800 Net present value of safety benefit $2,145,641 Benefit / Cost Ratio ODOT VAR-STW Safety Studies CUY March 18, 2016
31 Appendix A Existing Conditions Diagram Appendix A Page A1 of 6


32 Page A2 of 6


33 Page A3 of 6


34 Page A4 of 6


35 Page A5 of 6


36 Page A6 of 6
37 Appendix B Traffic Data Appendix B Page B1 of 7
38 PLATE 1 EXISTING YEAR 2015 ADT VOLUMES SHEET 1 OF 3 Page B2 of 7 AUGUST 2015
39 PLATE 2 EXISTING YEAR 2015 AM DHV SHEET 1 OF 3 Page B3 of 7 AUGUST 2015
40 PLATE 3 EXISTING YEAR 2015 PM DHV SHEET 1 OF 3 Page B4 of 7 AUGUST 2015
41 LEGEND PLATE 4 YEAR 2021 / YEAR 2041 ADT VOLUMES SHEET 1 OF 3 Page B5 of 7 AUGUST 2015
42 LEGEND PLATE 5 YEAR 2021 / YEAR 2041 AM DHV SHEET 1 OF 3 Page B6 of 7 AUGUST 2015
43 LEGEND PLATE 6 YEAR 2021 / YEAR 2041 PM DHV SHEET 1 OF 3 Page B7 of 7 AUGUST 2015
44 Appendix C Capacity Analysis Appendix C Page C1 of 44
45 Capacity Analysis Intersection capacity was evaluated using Synchro to assess intersection operations under the following scenarios: 2015 Existing conditions o 2015 AM and PM peak volumes o Existing splits, cycle length, clearance intervals, phasing, and lane configuration 2015 No Build Existing Cycle o 2015 AM and PM peak volumes o Existing lane configuration and cycle length o Proposed clearance intervals o Proposed no right turn on red for southbound right turn 2021 No Build Long Cycle o 2021 AM and PM peak volumes o Existing lane configuration o Proposed cycle length from GPD September 2015 Signal System Safety Study o Proposed clearance intervals, optimized splits o Proposed no right turn on red for southbound right turn 2021 No Build Short Cycle o 2021 AM and PM peak volumes o Existing lane configuration o Proposed shorter cycle length o Proposed clearance intervals, optimized splits o Proposed no right turn on red for southbound right turn 2021 Build Long Cycle o 2021 AM and PM peak volumes o Proposed cycle length from GPD September 2015 Signal System Safety Study o Proposed lane configuration, clearance intervals, optimized splits o Proposed no right turn on red for southbound right turn o Assumed lane utilization factors Page C2 of 44
46 2021 Build Short Cycle o 2021 AM and PM peak volumes o Proposed shorter cycle length o Proposed lane configuration, clearance intervals, optimized splits o Proposed no right turn on red for southbound right turn o Assumed lane utilization factors 2041 No Build Long Cycle o 2041 AM and PM peak volumes o Existing lane configuration o Proposed cycle length from GPD September 2015 Signal System Safety Study o Proposed clearance intervals, optimized splits o Proposed no right turn on red for southbound right turn 2041 No Build Short Cycle o 2041 AM and PM peak volumes o Existing lane configuration o Proposed short cycle length o Proposed clearance intervals, optimized splits o Proposed no right turn on red for southbound right turn 2041 Build Long Cycle o 2041 AM and PM peak volumes o Proposed cycle length from GPD September 2015 Signal System Safety Study o Proposed lane configuration, clearance intervals, optimized splits o Proposed no right turn on red for southbound right turn o Assumed lane utilization factors 2041 Build Short Cycle o 2041 AM and PM peak volumes o Proposed short cycle length o Proposed lane configuration, clearance intervals, optimized splits o Proposed no right turn on red for southbound right turn o Assumed lane utilization factors Page C3 of 44
47 CAPACITY ANALYSIS SUMMARY SCENARIO EB APPROACH WB APPROACH NB APPROACH SB APPROACH INTERSECTION EBL EBT EBR TOTAL WBL WBT WBR TOTAL NBL NBT NBR TOTAL SBL SBT SBR TOTAL TOTAL 2015 AM EXISTING C/31.9 D/43.3 D/43.2 D/42.2 C/32.8 D/38.3 B/18.4 C/33.0 D/51.0 E/75.1 E/75.6 E/69.9 F/90.1 E/61.8 D/40.4 E/71.5 D/ AM NO BUILD EXISTING CYCLE C/31.9 D/43.3 D/43.2 D/42.2 C/32.8 D/38.3 B/18.4 C/33.0 D/51.2 E/75.1 E/75.6 E/69.9 F/90.1 E/61.8 D/43.4 E/69.9 D/ AM NO BUILD LONG CYCLE D/42.2 E/58.6 E/58.5 E/57.1 D/42.5 D/47.5 C/23.2 D/41.1 D/46.9 E/57.4 E/75.5 E/55.2 E/75.5 D/43.5 C/30.2 D/53.4 D/ AM NO BUILD SHORT CYCLE C/31.3 D/52.1 D/52.0 D/50.2 C/33.7 D/39.2 B/18.7 C/33.7 D/40.6 D/52.5 D/52.9 D/50.0 E/61.0 D/37.9 C/25.5 D/44.8 D/ AM BUILD LONG CYCLE D/37.9 D/50.1 D/53.1 D/50.1 D/38.2 D/45.1 C/28.3 D/40.5 D/38.5 D/49.3 D/49.5 D/47.0 E/71.2 D/37.4 C/25.5 D/48.1 D/ AM BUILD SHORT CYCLE C/29.8 D/40.3 D/43.5 D/40.5 C/29.7 C/34.8 C/21.9 C/31.2 C/33.2 D/43.9 D/44.1 D/41.6 E/56.8 C/32.6 C/22.4 D/40.1 D/ AM NO BUILD LONG CYCLE D/46.9 E/60.5 E/60.7 E/59.4 D/48.6 D/47.5 C/22.1 D/41.2 D/53.2 E/63.6 E/64.0 E/61.5 E/77.6 D/47.3 C/32.3 E/56.4 D/ AM NO BUILD SHORT CYCLE D/38.6 E/55.8 E/56.0 D/54.4 D/39.9 D/39.1 B/17.8 C/33.8 D/54.1 E/60.2 E/60.9 E/59.1 E/63.6 D/38.7 C/26.1 D/46.2 D/ AM BUILD LONG CYCLE D/45.4 D/49.6 D/52.6 D/50.2 D/54.1 D/45.5 C/27.9 D/41.7 D/42.1 D/51.5 D/51.7 D/49.5 E/71.5 D/37.9 C/26.1 D/48.5 D/ AM BUILD SHORT CYCLE C/33.7 D/42.2 D/46.1 D/42.8 C/33.9 D/35.5 C/22.0 C/32.0 C/34.2 D/46.4 D/46.7 D/43.8 E/57.4 C/34.2 C/23.3 D/41.2 D/ PM EXISTING E/76.8 E/61.7 E/62.7 E/63.8 D/48.0 F/95.3 C/28.9 E/75.6 E/65.0 F/147.0 F/146.7 F/126.2 F/91.2 E/64.8 D/44.1 E/73.2 F/ PM NO BUILD EXISTING CYCLE E/76.8 E/61.7 E/62.7 E/63.8 D/48.0 F/95.3 C/28.9 E/75.6 E/67.0 F/147.0 F/146.7 F/126.7 F/91.2 E/64.8 D/47.7 E/72.1 F/ PM NO BUILD LONG CYCLE F/138.3 F/81.4 F/83.6 F/88.3 F/94.2 F/112.7 C/33.1 F/91.4 E/61.0 F/103.6 F/103.3 F/92.9 F/120.0 E/60.4 D/46.8 F/80.5 F/ PM NO BUILD SHORT CYCLE F/117.2 F/77.0 F/79.6 F/82.3 E/76.4 F/113.9 C/26.6 F/89.4 D/50.8 F/103.3 F/103.0 F/90.2 F/118.7 D/45.7 D/36.4 E/71.5 F/ PM BUILD LONG CYCLE F/82.9 E/62.2 E/67.2 E/66.0 E/70.2 E/68.3 D/42.6 E/61.9 D/49.1 E/72.8 E/72.6 E/66.8 F/90.0 D/46.8 C/34.6 E/61.0 E/ PM BUILD SHORT CYCLE E/67.0 E/56.1 E/63.9 E/59.8 D/51.8 E/64.0 C/34.5 E/55.8 D/36.6 E/67.1 E/66.9 E/59.5 E/69.8 D/35.7 C/27.3 D/47.1 E/ PM NO BUILD LONG CYCLE F/150.0 F/98.8 F/102.8 F/106.0 F/108.7 F/137.1 D/35.3 F/109.4 E/75.1 F/115.7 F/115.4 F/105.3 F/132.4 E/61.7 D/47.4 F/85.9 F/ PM NO BUILD SHORT CYCLE F/139.7 F/93.6 F/98.3 F/100.6 F/96.6 F/137.1 C/28.4 F/106.9 E/56.4 F/119.4 F/119.2 F/103.4 F/135.1 D/50.6 D/39.1 F/80.4 F/ PM BUILD LONG CYCLE F/87.7 E/71.2 E/78.3 E/75.3 E/78.8 F/83.7 D/46.2 E/73.8 E/61.9 F/81.1 F/80.9 E/76.2 F/90.8 D/47.2 C/33.8 E/61.4 E/ PM BUILD SHORT CYCLE F/81.5 E/65.6 E/74.3 E/70.1 E/72.6 F/77.8 D/37.6 E/67.2 D/45.9 E/75.7 E/75.4 E/68.1 E/77.7 D/36.2 C/27.6 D/50.3 E/64.6 Letter/Number = Level of Service / Average Delay (seconds) per Vehicle Page C4 of 44
48 HCM 2010 Signalized Intersection Summary 3: Richmond Road & Cedar Road 3/10/2016 Movement EBL EBT EBR WBL WBT WBR NBL NBT NBR SBL SBT SBR Lane Configurations Traffic Volume (veh/h) Future Volume (veh/h) Number Initial Q (Qb), veh Ped-Bike Adj(A_pbT) Parking Bus, Adj Adj Sat Flow, veh/h/ln Adj Flow Rate, veh/h Adj No. of Lanes Peak Hour Factor Percent Heavy Veh, % Cap, veh/h Arrive On Green Sat Flow, veh/h Grp Volume(v), veh/h Grp Sat Flow(s),veh/h/ln Q Serve(g_s), s Cycle Q Clear(g_c), s Prop In Lane Lane Grp Cap(c), veh/h V/C Ratio(X) Avail Cap(c_a), veh/h HCM Platoon Ratio Upstream Filter(I) Uniform Delay (d), s/veh Incr Delay (d2), s/veh Initial Q Delay(d3),s/veh %ile BackOfQ(50%),veh/ln LnGrp Delay(d),s/veh LnGrp LOS C D D C D B D E E F E D Approach Vol, veh/h Approach Delay, s/veh Approach LOS D C E E Timer Assigned Phs Phs Duration (G+Y+Rc), s Change Period (Y+Rc), s Max Green Setting (Gmax), s Max Q Clear Time (g_c+i1), s Green Ext Time (p_c), s Intersection Summary HCM 2010 Ctrl Delay 50.9 HCM 2010 LOS D CUY-175 AM 2015 Existing 10/28/2015 Synchro 9 Report Page 1 Page C5 of 44
49 Timing Report, Sorted By Phase 3: Richmond Road & Cedar Road 3/10/2016 Phase Number Movement WBL EBTL NBL SBT EBL WBTL SBL NBTL Lead/Lag Lead Lag Lead Lag Lead Lag Lead Lag Lead-Lag Optimize Yes Yes Yes Yes Yes Yes Yes Yes Recall Mode None C-Max None Max None C-Max None Max Maximum Split (s) Maximum Split (%) 15.0% 40.0% 17.0% 28.0% 15.0% 40.0% 20.0% 25.0% Minimum Split (s) Yellow Time (s) All-Red Time (s) Minimum Initial (s) Vehicle Extension (s) Minimum Gap (s) Time Before Reduce (s) Time To Reduce (s) Walk Time (s) Flash Dont Walk (s) Dual Entry No Yes No Yes No Yes No Yes Inhibit Max Yes Yes Yes Yes Yes Yes Yes Yes Start Time (s) End Time (s) Yield/Force Off (s) Yield/Force Off 170(s) Local Start Time (s) Local Yield (s) Local Yield 170(s) Intersection Summary Cycle Length 175 Control Type Actuated-Coordinated Natural Cycle 95 Offset: 10 (6%), Referenced to phase 2:EBTL and 6:WBTL, Start of Green Splits and Phases: 3: Richmond Road & Cedar Road CUY-175 AM 2015 Existing 10/28/2015 Synchro 9 Report Page 2 Page C6 of 44
50 HCM 2010 Signalized Intersection Summary 3: Richmond Road & Cedar Road 3/11/2016 Movement EBL EBT EBR WBL WBT WBR NBL NBT NBR SBL SBT SBR Lane Configurations Traffic Volume (veh/h) Future Volume (veh/h) Number Initial Q (Qb), veh Ped-Bike Adj(A_pbT) Parking Bus, Adj Adj Sat Flow, veh/h/ln Adj Flow Rate, veh/h Adj No. of Lanes Peak Hour Factor Percent Heavy Veh, % Cap, veh/h Arrive On Green Sat Flow, veh/h Grp Volume(v), veh/h Grp Sat Flow(s),veh/h/ln Q Serve(g_s), s Cycle Q Clear(g_c), s Prop In Lane Lane Grp Cap(c), veh/h V/C Ratio(X) Avail Cap(c_a), veh/h HCM Platoon Ratio Upstream Filter(I) Uniform Delay (d), s/veh Incr Delay (d2), s/veh Initial Q Delay(d3),s/veh %ile BackOfQ(50%),veh/ln LnGrp Delay(d),s/veh LnGrp LOS C D D C D B D E E F E D Approach Vol, veh/h Approach Delay, s/veh Approach LOS D C E E Timer Assigned Phs Phs Duration (G+Y+Rc), s Change Period (Y+Rc), s * * * * Max Green Setting (Gmax), s * * * * Max Q Clear Time (g_c+i1), s Green Ext Time (p_c), s Intersection Summary HCM 2010 Ctrl Delay 50.8 HCM 2010 LOS D Notes CUY-175 AM 2015 No Build - Existing Cycle 10/28/2015 Synchro 9 Report Page 1 Page C7 of 44
51 Timing Report, Sorted By Phase 3: Richmond Road & Cedar Road 3/11/2016 Phase Number Movement WBL EBTL NBL SBT EBL WBTL SBL NBTL Lead/Lag Lead Lag Lead Lag Lead Lag Lead Lag Lead-Lag Optimize Yes Yes Yes Yes Yes Yes Yes Yes Recall Mode None C-Max None Max None C-Max None Max Maximum Split (s) Maximum Split (%) 15.0% 40.0% 17.0% 28.0% 15.0% 40.0% 20.0% 25.0% Minimum Split (s) Yellow Time (s) All-Red Time (s) Minimum Initial (s) Vehicle Extension (s) Minimum Gap (s) Time Before Reduce (s) Time To Reduce (s) Walk Time (s) Flash Dont Walk (s) Dual Entry No Yes No Yes No Yes No Yes Inhibit Max Yes Yes Yes Yes Yes Yes Yes Yes Start Time (s) End Time (s) Yield/Force Off (s) Yield/Force Off 170(s) Local Start Time (s) Local Yield (s) Local Yield 170(s) Intersection Summary Cycle Length 175 Control Type Actuated-Coordinated Natural Cycle 95 Offset: 10 (6%), Referenced to phase 2:EBTL and 6:WBTL, Start of Green Splits and Phases: 3: Richmond Road & Cedar Road CUY-175 AM 2015 No Build - Existing Cycle 10/28/2015 Synchro 9 Report Page 3 Page C8 of 44
52 HCM 2010 Signalized Intersection Summary 3: Richmond Road & Cedar Road 3/11/2016 Movement EBL EBT EBR WBL WBT WBR NBL NBT NBR SBL SBT SBR Lane Configurations Traffic Volume (veh/h) Future Volume (veh/h) Number Initial Q (Qb), veh Ped-Bike Adj(A_pbT) Parking Bus, Adj Adj Sat Flow, veh/h/ln Adj Flow Rate, veh/h Adj No. of Lanes Peak Hour Factor Percent Heavy Veh, % Cap, veh/h Arrive On Green Sat Flow, veh/h Grp Volume(v), veh/h Grp Sat Flow(s),veh/h/ln Q Serve(g_s), s Cycle Q Clear(g_c), s Prop In Lane Lane Grp Cap(c), veh/h V/C Ratio(X) Avail Cap(c_a), veh/h HCM Platoon Ratio Upstream Filter(I) Uniform Delay (d), s/veh Incr Delay (d2), s/veh Initial Q Delay(d3),s/veh %ile BackOfQ(50%),veh/ln LnGrp Delay(d),s/veh LnGrp LOS D E E D D C D E E E D C Approach Vol, veh/h Approach Delay, s/veh Approach LOS E D E D Timer Assigned Phs Phs Duration (G+Y+Rc), s Change Period (Y+Rc), s * * * * Max Green Setting (Gmax), s * * * * Max Q Clear Time (g_c+i1), s Green Ext Time (p_c), s Intersection Summary HCM 2010 Ctrl Delay 50.7 HCM 2010 LOS D Notes CUY-175 AM 2021 No Build - Long Cycle Synchro 9 Report Page 1 Page C9 of 44
53 Timing Report, Sorted By Phase 3: Richmond Road & Cedar Road 3/11/2016 Phase Number Movement WBL EBTL NBL SBT EBL WBTL SBL NBTL Lead/Lag Lead Lag Lead Lag Lead Lag Lead Lag Lead-Lag Optimize Yes Yes Yes Yes Yes Yes Yes Yes Recall Mode None C-Max None Max None C-Max None Max Maximum Split (s) Maximum Split (%) 9.4% 41.9% 8.8% 40.0% 9.4% 41.9% 25.0% 23.8% Minimum Split (s) Yellow Time (s) All-Red Time (s) Minimum Initial (s) Vehicle Extension (s) Minimum Gap (s) Time Before Reduce (s) Time To Reduce (s) Walk Time (s) Flash Dont Walk (s) Dual Entry No Yes No Yes No Yes No Yes Inhibit Max Yes Yes Yes Yes Yes Yes Yes Yes Start Time (s) End Time (s) Yield/Force Off (s) Yield/Force Off 170(s) Local Start Time (s) Local Yield (s) Local Yield 170(s) Intersection Summary Cycle Length 160 Control Type Actuated-Coordinated Natural Cycle 95 Offset: 0 (0%), Referenced to phase 2:EBTL and 6:WBTL, Start of Green Splits and Phases: 3: Richmond Road & Cedar Road CUY-175 AM 2021 No Build - Long Cycle Synchro 9 Report Page 3 Page C10 of 44
54 HCM 2010 Signalized Intersection Summary 3: Richmond Road & Cedar Road 3/11/2016 Movement EBL EBT EBR WBL WBT WBR NBL NBT NBR SBL SBT SBR Lane Configurations Traffic Volume (veh/h) Future Volume (veh/h) Number Initial Q (Qb), veh Ped-Bike Adj(A_pbT) Parking Bus, Adj Adj Sat Flow, veh/h/ln Adj Flow Rate, veh/h Adj No. of Lanes Peak Hour Factor Percent Heavy Veh, % Cap, veh/h Arrive On Green Sat Flow, veh/h Grp Volume(v), veh/h Grp Sat Flow(s),veh/h/ln Q Serve(g_s), s Cycle Q Clear(g_c), s Prop In Lane Lane Grp Cap(c), veh/h V/C Ratio(X) Avail Cap(c_a), veh/h HCM Platoon Ratio Upstream Filter(I) Uniform Delay (d), s/veh Incr Delay (d2), s/veh Initial Q Delay(d3),s/veh %ile BackOfQ(50%),veh/ln LnGrp Delay(d),s/veh LnGrp LOS C D D C D B D D D E D C Approach Vol, veh/h Approach Delay, s/veh Approach LOS D C D D Timer Assigned Phs Phs Duration (G+Y+Rc), s Change Period (Y+Rc), s * * * * Max Green Setting (Gmax), s * * * * Max Q Clear Time (g_c+i1), s Green Ext Time (p_c), s Intersection Summary HCM 2010 Ctrl Delay 43.5 HCM 2010 LOS D Notes CUY-175 AM 2021 No Build - Short Cycle 3/11/2016 Synchro 9 Report Page 1 Page C11 of 44
55 Timing Report, Sorted By Phase 3: Richmond Road & Cedar Road 3/11/2016 Phase Number Movement WBL EBTL NBL SBT EBL WBTL SBL NBTL Lead/Lag Lead Lag Lead Lag Lead Lag Lead Lag Lead-Lag Optimize Yes Yes Yes Yes Yes Yes Yes Yes Recall Mode None C-Max None Max None C-Max None Max Maximum Split (s) Maximum Split (%) 9.2% 43.3% 10.0% 37.5% 10.7% 41.8% 22.8% 24.7% Minimum Split (s) Yellow Time (s) All-Red Time (s) Minimum Initial (s) Vehicle Extension (s) Minimum Gap (s) Time Before Reduce (s) Time To Reduce (s) Walk Time (s) Flash Dont Walk (s) Dual Entry No Yes No Yes No Yes No Yes Inhibit Max Yes Yes Yes Yes Yes Yes Yes Yes Start Time (s) End Time (s) Yield/Force Off (s) Yield/Force Off 170(s) Local Start Time (s) Local Yield (s) Local Yield 170(s) Intersection Summary Cycle Length 120 Control Type Actuated-Coordinated Natural Cycle 95 Offset: 0 (0%), Referenced to phase 2:EBTL and 6:WBTL, Start of Green Splits and Phases: 3: Richmond Road & Cedar Road CUY-175 AM 2021 No Build - Short Cycle 3/11/2016 Synchro 9 Report Page 3 Page C12 of 44
56 HCM 2010 Signalized Intersection Summary 3: Richmond Road & Cedar Road 3/14/2016 Movement EBL EBT EBR WBL WBT WBR NBL NBT NBR SBL SBT SBR Lane Configurations Traffic Volume (veh/h) Future Volume (veh/h) Number Initial Q (Qb), veh Ped-Bike Adj(A_pbT) Parking Bus, Adj Adj Sat Flow, veh/h/ln Adj Flow Rate, veh/h Adj No. of Lanes Peak Hour Factor Percent Heavy Veh, % Cap, veh/h Arrive On Green Sat Flow, veh/h Grp Volume(v), veh/h Grp Sat Flow(s),veh/h/ln Q Serve(g_s), s Cycle Q Clear(g_c), s Prop In Lane Lane Grp Cap(c), veh/h V/C Ratio(X) Avail Cap(c_a), veh/h HCM Platoon Ratio Upstream Filter(I) Uniform Delay (d), s/veh Incr Delay (d2), s/veh Initial Q Delay(d3),s/veh %ile BackOfQ(50%),veh/ln LnGrp Delay(d),s/veh LnGrp LOS D D D D D C D D D E D C Approach Vol, veh/h Approach Delay, s/veh Approach LOS D D D D Timer Assigned Phs Phs Duration (G+Y+Rc), s Change Period (Y+Rc), s * * * * Max Green Setting (Gmax), s * * * * Max Q Clear Time (g_c+i1), s Green Ext Time (p_c), s Intersection Summary HCM 2010 Ctrl Delay 46.0 HCM 2010 LOS D Notes CUY-175 AM 2021 Build - Long Cycle 3/11/2016 Synchro 9 Report Page 1 Page C13 of 44
57 Timing Report, Sorted By Phase 3: Richmond Road & Cedar Road 3/14/2016 Phase Number Movement WBL EBTL NBL SBT EBL WBTL SBL NBTL Lead/Lag Lead Lag Lead Lag Lead Lag Lead Lag Lead-Lag Optimize Yes Yes Yes Yes Yes Yes Yes Yes Recall Mode None C-Max None Max None C-Max None Max Maximum Split (s) Maximum Split (%) 9.4% 37.5% 8.8% 44.4% 9.4% 37.5% 29.4% 23.8% Minimum Split (s) Yellow Time (s) All-Red Time (s) Minimum Initial (s) Vehicle Extension (s) Minimum Gap (s) Time Before Reduce (s) Time To Reduce (s) Walk Time (s) Flash Dont Walk (s) Dual Entry No Yes No Yes No Yes No Yes Inhibit Max Yes Yes Yes Yes Yes Yes Yes Yes Start Time (s) End Time (s) Yield/Force Off (s) Yield/Force Off 170(s) Local Start Time (s) Local Yield (s) Local Yield 170(s) Intersection Summary Cycle Length 160 Control Type Actuated-Coordinated Natural Cycle 95 Offset: 0 (0%), Referenced to phase 2:EBTL and 6:WBTL, Start of Green Splits and Phases: 3: Richmond Road & Cedar Road CUY-175 AM 2021 Build - Long Cycle 3/11/2016 Synchro 9 Report Page 3 Page C14 of 44
58 HCM 2010 Signalized Intersection Summary 3: Richmond Road & Cedar Road 3/14/2016 Movement EBL EBT EBR WBL WBT WBR NBL NBT NBR SBL SBT SBR Lane Configurations Traffic Volume (veh/h) Future Volume (veh/h) Number Initial Q (Qb), veh Ped-Bike Adj(A_pbT) Parking Bus, Adj Adj Sat Flow, veh/h/ln Adj Flow Rate, veh/h Adj No. of Lanes Peak Hour Factor Percent Heavy Veh, % Cap, veh/h Arrive On Green Sat Flow, veh/h Grp Volume(v), veh/h Grp Sat Flow(s),veh/h/ln Q Serve(g_s), s Cycle Q Clear(g_c), s Prop In Lane Lane Grp Cap(c), veh/h V/C Ratio(X) Avail Cap(c_a), veh/h HCM Platoon Ratio Upstream Filter(I) Uniform Delay (d), s/veh Incr Delay (d2), s/veh Initial Q Delay(d3),s/veh %ile BackOfQ(50%),veh/ln LnGrp Delay(d),s/veh LnGrp LOS C D D C C C C D D E C C Approach Vol, veh/h Approach Delay, s/veh Approach LOS D C D D Timer Assigned Phs Phs Duration (G+Y+Rc), s Change Period (Y+Rc), s * * * * Max Green Setting (Gmax), s * * * * Max Q Clear Time (g_c+i1), s Green Ext Time (p_c), s Intersection Summary HCM 2010 Ctrl Delay 37.6 HCM 2010 LOS D Notes CUY-175 AM 2021 Build - Short Cycle 3/11/2016 Synchro 9 Report Page 1 Page C15 of 44
59 Timing Report, Sorted By Phase 3: Richmond Road & Cedar Road 3/14/2016 Phase Number Movement WBL EBTL NBL SBT EBL WBTL SBL NBTL Lead/Lag Lead Lag Lead Lag Lead Lag Lead Lag Lead-Lag Optimize Yes Yes Yes Yes Yes Yes Yes Yes Recall Mode None C-Max None Max None C-Max None Max Maximum Split (s) Maximum Split (%) 9.2% 39.2% 10.0% 41.7% 9.2% 39.2% 25.8% 25.8% Minimum Split (s) Yellow Time (s) All-Red Time (s) Minimum Initial (s) Vehicle Extension (s) Minimum Gap (s) Time Before Reduce (s) Time To Reduce (s) Walk Time (s) Flash Dont Walk (s) Dual Entry No Yes No Yes No Yes No Yes Inhibit Max Yes Yes Yes Yes Yes Yes Yes Yes Start Time (s) End Time (s) Yield/Force Off (s) Yield/Force Off 170(s) Local Start Time (s) Local Yield (s) Local Yield 170(s) Intersection Summary Cycle Length 120 Control Type Actuated-Coordinated Natural Cycle 95 Offset: 0 (0%), Referenced to phase 2:EBTL and 6:WBTL, Start of Green Splits and Phases: 3: Richmond Road & Cedar Road CUY-175 AM 2021 Build - Short Cycle 3/11/2016 Synchro 9 Report Page 3 Page C16 of 44
60 HCM 2010 Signalized Intersection Summary 3: Richmond Road & Cedar Road 3/11/2016 Movement EBL EBT EBR WBL WBT WBR NBL NBT NBR SBL SBT SBR Lane Configurations Traffic Volume (veh/h) Future Volume (veh/h) Number Initial Q (Qb), veh Ped-Bike Adj(A_pbT) Parking Bus, Adj Adj Sat Flow, veh/h/ln Adj Flow Rate, veh/h Adj No. of Lanes Peak Hour Factor Percent Heavy Veh, % Cap, veh/h Arrive On Green Sat Flow, veh/h Grp Volume(v), veh/h Grp Sat Flow(s),veh/h/ln Q Serve(g_s), s Cycle Q Clear(g_c), s Prop In Lane Lane Grp Cap(c), veh/h V/C Ratio(X) Avail Cap(c_a), veh/h HCM Platoon Ratio Upstream Filter(I) Uniform Delay (d), s/veh Incr Delay (d2), s/veh Initial Q Delay(d3),s/veh %ile BackOfQ(50%),veh/ln LnGrp Delay(d),s/veh LnGrp LOS D E E D D C D E E E D C Approach Vol, veh/h Approach Delay, s/veh Approach LOS E D E E Timer Assigned Phs Phs Duration (G+Y+Rc), s Change Period (Y+Rc), s * * * * Max Green Setting (Gmax), s * * * * Max Q Clear Time (g_c+i1), s Green Ext Time (p_c), s Intersection Summary HCM 2010 Ctrl Delay 53.1 HCM 2010 LOS D Notes CUY-175 AM 2041 No Build - Long Cycle 3/11/2016 Synchro 9 Report Page 1 Page C17 of 44
61 Timing Report, Sorted By Phase 3: Richmond Road & Cedar Road 3/11/2016 Phase Number Movement WBL EBTL NBL SBT EBL WBTL SBL NBTL Lead/Lag Lead Lag Lead Lag Lead Lag Lead Lag Lead-Lag Optimize Yes Yes Yes Yes Yes Yes Yes Yes Recall Mode None C-Max None Max None C-Max None Max Maximum Split (s) Maximum Split (%) 9.4% 43.1% 9.4% 38.1% 9.4% 43.1% 23.8% 23.8% Minimum Split (s) Yellow Time (s) All-Red Time (s) Minimum Initial (s) Vehicle Extension (s) Minimum Gap (s) Time Before Reduce (s) Time To Reduce (s) Walk Time (s) Flash Dont Walk (s) Dual Entry No Yes No Yes No Yes No Yes Inhibit Max Yes Yes Yes Yes Yes Yes Yes Yes Start Time (s) End Time (s) Yield/Force Off (s) Yield/Force Off 170(s) Local Start Time (s) Local Yield (s) Local Yield 170(s) Intersection Summary Cycle Length 160 Control Type Actuated-Coordinated Natural Cycle 105 Offset: 0 (0%), Referenced to phase 2:EBTL and 6:WBTL, Start of Green Splits and Phases: 3: Richmond Road & Cedar Road CUY-175 AM 2041 No Build - Long Cycle 3/11/2016 Synchro 9 Report Page 3 Page C18 of 44
62 HCM 2010 Signalized Intersection Summary 3: Richmond Road & Cedar Road 3/11/2016 Movement EBL EBT EBR WBL WBT WBR NBL NBT NBR SBL SBT SBR Lane Configurations Traffic Volume (veh/h) Future Volume (veh/h) Number Initial Q (Qb), veh Ped-Bike Adj(A_pbT) Parking Bus, Adj Adj Sat Flow, veh/h/ln Adj Flow Rate, veh/h Adj No. of Lanes Peak Hour Factor Percent Heavy Veh, % Cap, veh/h Arrive On Green Sat Flow, veh/h Grp Volume(v), veh/h Grp Sat Flow(s),veh/h/ln Q Serve(g_s), s Cycle Q Clear(g_c), s Prop In Lane Lane Grp Cap(c), veh/h V/C Ratio(X) Avail Cap(c_a), veh/h HCM Platoon Ratio Upstream Filter(I) Uniform Delay (d), s/veh Incr Delay (d2), s/veh Initial Q Delay(d3),s/veh %ile BackOfQ(50%),veh/ln LnGrp Delay(d),s/veh LnGrp LOS D E E D D B D E E E D C Approach Vol, veh/h Approach Delay, s/veh Approach LOS D C E D Timer Assigned Phs Phs Duration (G+Y+Rc), s Change Period (Y+Rc), s * * * * Max Green Setting (Gmax), s * * * * Max Q Clear Time (g_c+i1), s Green Ext Time (p_c), s Intersection Summary HCM 2010 Ctrl Delay 46.3 HCM 2010 LOS D Notes CUY-175 AM 2041 No Build - Short Cycle 3/11/2016 Synchro 9 Report Page 1 Page C19 of 44
63 Timing Report, Sorted By Phase 3: Richmond Road & Cedar Road 3/11/2016 Phase Number Movement WBL EBTL NBL SBT EBL WBTL SBL NBTL Lead/Lag Lead Lag Lead Lag Lead Lag Lead Lag Lead-Lag Optimize Yes Yes Yes Yes Yes Yes Yes Yes Recall Mode None C-Max None Max None C-Max None Max Maximum Split (s) Maximum Split (%) 9.2% 44.2% 9.2% 37.5% 9.2% 44.2% 22.0% 24.7% Minimum Split (s) Yellow Time (s) All-Red Time (s) Minimum Initial (s) Vehicle Extension (s) Minimum Gap (s) Time Before Reduce (s) Time To Reduce (s) Walk Time (s) Flash Dont Walk (s) Dual Entry No Yes No Yes No Yes No Yes Inhibit Max Yes Yes Yes Yes Yes Yes Yes Yes Start Time (s) End Time (s) Yield/Force Off (s) Yield/Force Off 170(s) Local Start Time (s) Local Yield (s) Local Yield 170(s) Intersection Summary Cycle Length 120 Control Type Actuated-Coordinated Natural Cycle 105 Offset: 0 (0%), Referenced to phase 2:EBTL and 6:WBTL, Start of Green Splits and Phases: 3: Richmond Road & Cedar Road CUY-175 AM 2041 No Build - Short Cycle 3/11/2016 Synchro 9 Report Page 3 Page C20 of 44
64 HCM 2010 Signalized Intersection Summary 3: Richmond Road & Cedar Road 3/14/2016 Movement EBL EBT EBR WBL WBT WBR NBL NBT NBR SBL SBT SBR Lane Configurations Traffic Volume (veh/h) Future Volume (veh/h) Number Initial Q (Qb), veh Ped-Bike Adj(A_pbT) Parking Bus, Adj Adj Sat Flow, veh/h/ln Adj Flow Rate, veh/h Adj No. of Lanes Peak Hour Factor Percent Heavy Veh, % Cap, veh/h Arrive On Green Sat Flow, veh/h Grp Volume(v), veh/h Grp Sat Flow(s),veh/h/ln Q Serve(g_s), s Cycle Q Clear(g_c), s Prop In Lane Lane Grp Cap(c), veh/h V/C Ratio(X) Avail Cap(c_a), veh/h HCM Platoon Ratio Upstream Filter(I) Uniform Delay (d), s/veh Incr Delay (d2), s/veh Initial Q Delay(d3),s/veh %ile BackOfQ(50%),veh/ln LnGrp Delay(d),s/veh LnGrp LOS D D D D D C D D D E D C Approach Vol, veh/h Approach Delay, s/veh Approach LOS D D D D Timer Assigned Phs Phs Duration (G+Y+Rc), s Change Period (Y+Rc), s * * * * Max Green Setting (Gmax), s * * * * Max Q Clear Time (g_c+i1), s Green Ext Time (p_c), s Intersection Summary HCM 2010 Ctrl Delay 46.9 HCM 2010 LOS D Notes CUY-175 AM 2041 Build - Long Cycle 3/11/2016 Synchro 9 Report Page 1 Page C21 of 44
65 Timing Report, Sorted By Phase 3: Richmond Road & Cedar Road 3/14/2016 Phase Number Movement WBL EBTL NBL SBT EBL WBTL SBL NBTL Lead/Lag Lead Lag Lead Lag Lead Lag Lead Lag Lead-Lag Optimize Yes Yes Yes Yes Yes Yes Yes Yes Recall Mode None C-Max None Max None C-Max None Max Maximum Split (s) Maximum Split (%) 6.9% 40.0% 8.8% 44.4% 8.1% 38.8% 29.4% 23.8% Minimum Split (s) Yellow Time (s) All-Red Time (s) Minimum Initial (s) Vehicle Extension (s) Minimum Gap (s) Time Before Reduce (s) Time To Reduce (s) Walk Time (s) Flash Dont Walk (s) Dual Entry No Yes No Yes No Yes No Yes Inhibit Max Yes Yes Yes Yes Yes Yes Yes Yes Start Time (s) End Time (s) Yield/Force Off (s) Yield/Force Off 170(s) Local Start Time (s) Local Yield (s) Local Yield 170(s) Intersection Summary Cycle Length 160 Control Type Actuated-Coordinated Natural Cycle 95 Offset: 0 (0%), Referenced to phase 2:EBTL and 6:WBTL, Start of Green Splits and Phases: 3: Richmond Road & Cedar Road CUY-175 AM 2041 Build - Long Cycle 3/11/2016 Synchro 9 Report Page 3 Page C22 of 44
66 HCM 2010 Signalized Intersection Summary 3: Richmond Road & Cedar Road 3/14/2016 Movement EBL EBT EBR WBL WBT WBR NBL NBT NBR SBL SBT SBR Lane Configurations Traffic Volume (veh/h) Future Volume (veh/h) Number Initial Q (Qb), veh Ped-Bike Adj(A_pbT) Parking Bus, Adj Adj Sat Flow, veh/h/ln Adj Flow Rate, veh/h Adj No. of Lanes Peak Hour Factor Percent Heavy Veh, % Cap, veh/h Arrive On Green Sat Flow, veh/h Grp Volume(v), veh/h Grp Sat Flow(s),veh/h/ln Q Serve(g_s), s Cycle Q Clear(g_c), s Prop In Lane Lane Grp Cap(c), veh/h V/C Ratio(X) Avail Cap(c_a), veh/h HCM Platoon Ratio Upstream Filter(I) Uniform Delay (d), s/veh Incr Delay (d2), s/veh Initial Q Delay(d3),s/veh %ile BackOfQ(50%),veh/ln LnGrp Delay(d),s/veh LnGrp LOS C D D C D C C D D E C C Approach Vol, veh/h Approach Delay, s/veh Approach LOS D C D D Timer Assigned Phs Phs Duration (G+Y+Rc), s Change Period (Y+Rc), s * * * * Max Green Setting (Gmax), s * * * * Max Q Clear Time (g_c+i1), s Green Ext Time (p_c), s Intersection Summary HCM 2010 Ctrl Delay 39.1 HCM 2010 LOS D Notes CUY-175 AM 2041 Build - Short Cycle 3/11/2016 Synchro 9 Report Page 1 Page C23 of 44
67 Timing Report, Sorted By Phase 3: Richmond Road & Cedar Road 3/14/2016 Phase Number Movement WBL EBTL NBL SBT EBL WBTL SBL NBTL Lead/Lag Lead Lag Lead Lag Lead Lag Lead Lag Lead-Lag Optimize Yes Yes Yes Yes Yes Yes Yes Yes Recall Mode None C-Max None Max None C-Max None Max Maximum Split (s) Maximum Split (%) 9.2% 39.2% 10.8% 40.8% 9.2% 39.2% 25.8% 25.8% Minimum Split (s) Yellow Time (s) All-Red Time (s) Minimum Initial (s) Vehicle Extension (s) Minimum Gap (s) Time Before Reduce (s) Time To Reduce (s) Walk Time (s) Flash Dont Walk (s) Dual Entry No Yes No Yes No Yes No Yes Inhibit Max Yes Yes Yes Yes Yes Yes Yes Yes Start Time (s) End Time (s) Yield/Force Off (s) Yield/Force Off 170(s) Local Start Time (s) Local Yield (s) Local Yield 170(s) Intersection Summary Cycle Length 120 Control Type Actuated-Coordinated Natural Cycle 95 Offset: 0 (0%), Referenced to phase 2:EBTL and 6:WBTL, Start of Green Splits and Phases: 3: Richmond Road & Cedar Road CUY-175 AM 2041 Build - Short Cycle 3/11/2016 Synchro 9 Report Page 3 Page C24 of 44
68 HCM 2010 Signalized Intersection Summary 3: Richmond Road & Cedar Road 3/10/2016 Movement EBL EBT EBR WBL WBT WBR NBL NBT NBR SBL SBT SBR Lane Configurations Traffic Volume (veh/h) Future Volume (veh/h) Number Initial Q (Qb), veh Ped-Bike Adj(A_pbT) Parking Bus, Adj Adj Sat Flow, veh/h/ln Adj Flow Rate, veh/h Adj No. of Lanes Peak Hour Factor Percent Heavy Veh, % Cap, veh/h Arrive On Green Sat Flow, veh/h Grp Volume(v), veh/h Grp Sat Flow(s),veh/h/ln Q Serve(g_s), s Cycle Q Clear(g_c), s Prop In Lane Lane Grp Cap(c), veh/h V/C Ratio(X) Avail Cap(c_a), veh/h HCM Platoon Ratio Upstream Filter(I) Uniform Delay (d), s/veh Incr Delay (d2), s/veh Initial Q Delay(d3),s/veh %ile BackOfQ(50%),veh/ln LnGrp Delay(d),s/veh LnGrp LOS E E E D F C E F F F E D Approach Vol, veh/h Approach Delay, s/veh Approach LOS E E F E Timer Assigned Phs Phs Duration (G+Y+Rc), s Change Period (Y+Rc), s Max Green Setting (Gmax), s Max Q Clear Time (g_c+i1), s Green Ext Time (p_c), s Intersection Summary HCM 2010 Ctrl Delay 82.2 HCM 2010 LOS F CUY-175 PM 2015 Existing 10/28/2015 Synchro 9 Report Page 1 Page C25 of 44
69 Timing Report, Sorted By Phase 3: Richmond Road & Cedar Road 3/10/2016 Phase Number Movement WBL EBTL NBL SBT EBL WBTL SBL NBTL Lead/Lag Lead Lag Lead Lag Lead Lag Lead Lag Lead-Lag Optimize Yes Yes Yes Yes Yes Yes Yes Yes Recall Mode None C-Max None Max None C-Max None Max Maximum Split (s) Maximum Split (%) 15.0% 40.0% 17.0% 28.0% 15.0% 40.0% 20.0% 25.0% Minimum Split (s) Yellow Time (s) All-Red Time (s) Minimum Initial (s) Vehicle Extension (s) Minimum Gap (s) Time Before Reduce (s) Time To Reduce (s) Walk Time (s) Flash Dont Walk (s) Dual Entry No Yes No Yes No Yes No Yes Inhibit Max Yes Yes Yes Yes Yes Yes Yes Yes Start Time (s) End Time (s) Yield/Force Off (s) Yield/Force Off 170(s) Local Start Time (s) Local Yield (s) Local Yield 170(s) Intersection Summary Cycle Length 175 Control Type Actuated-Coordinated Natural Cycle 125 Offset: 10 (6%), Referenced to phase 2:EBTL and 6:WBTL, Start of Green Splits and Phases: 3: Richmond Road & Cedar Road CUY-175 PM 2015 Existing 10/28/2015 Synchro 9 Report Page 2 Page C26 of 44
70 HCM 2010 Signalized Intersection Summary 3: Richmond Road & Cedar Road 3/11/2016 Movement EBL EBT EBR WBL WBT WBR NBL NBT NBR SBL SBT SBR Lane Configurations Traffic Volume (veh/h) Future Volume (veh/h) Number Initial Q (Qb), veh Ped-Bike Adj(A_pbT) Parking Bus, Adj Adj Sat Flow, veh/h/ln Adj Flow Rate, veh/h Adj No. of Lanes Peak Hour Factor Percent Heavy Veh, % Cap, veh/h Arrive On Green Sat Flow, veh/h Grp Volume(v), veh/h Grp Sat Flow(s),veh/h/ln Q Serve(g_s), s Cycle Q Clear(g_c), s Prop In Lane Lane Grp Cap(c), veh/h V/C Ratio(X) Avail Cap(c_a), veh/h HCM Platoon Ratio Upstream Filter(I) Uniform Delay (d), s/veh Incr Delay (d2), s/veh Initial Q Delay(d3),s/veh %ile BackOfQ(50%),veh/ln LnGrp Delay(d),s/veh LnGrp LOS E E E D F C E F F F E D Approach Vol, veh/h Approach Delay, s/veh Approach LOS E E F E Timer Assigned Phs Phs Duration (G+Y+Rc), s Change Period (Y+Rc), s * * * * Max Green Setting (Gmax), s * * * * Max Q Clear Time (g_c+i1), s Green Ext Time (p_c), s Intersection Summary HCM 2010 Ctrl Delay 82.0 HCM 2010 LOS F Notes CUY-175 PM 2015 No Build - Existing Cycle 10/28/2015 Synchro 9 Report Page 1 Page C27 of 44
71 Timing Report, Sorted By Phase 3: Richmond Road & Cedar Road 3/11/2016 Phase Number Movement WBL EBTL NBL SBT EBL WBTL SBL NBTL Lead/Lag Lead Lag Lead Lag Lead Lag Lead Lag Lead-Lag Optimize Yes Yes Yes Yes Yes Yes Yes Yes Recall Mode None C-Max None Max None C-Max None Max Maximum Split (s) Maximum Split (%) 15.0% 40.0% 17.0% 28.0% 15.0% 40.0% 20.0% 25.0% Minimum Split (s) Yellow Time (s) All-Red Time (s) Minimum Initial (s) Vehicle Extension (s) Minimum Gap (s) Time Before Reduce (s) Time To Reduce (s) Walk Time (s) Flash Dont Walk (s) Dual Entry No Yes No Yes No Yes No Yes Inhibit Max Yes Yes Yes Yes Yes Yes Yes Yes Start Time (s) End Time (s) Yield/Force Off (s) Yield/Force Off 170(s) Local Start Time (s) Local Yield (s) Local Yield 170(s) Intersection Summary Cycle Length 175 Control Type Actuated-Coordinated Natural Cycle 125 Offset: 10 (6%), Referenced to phase 2:EBTL and 6:WBTL, Start of Green Splits and Phases: 3: Richmond Road & Cedar Road CUY-175 PM 2015 No Build - Existing Cycle 10/28/2015 Synchro 9 Report Page 3 Page C28 of 44
72 HCM 2010 Signalized Intersection Summary 3: Richmond Road & Cedar Road 3/11/2016 Movement EBL EBT EBR WBL WBT WBR NBL NBT NBR SBL SBT SBR Lane Configurations Traffic Volume (veh/h) Future Volume (veh/h) Number Initial Q (Qb), veh Ped-Bike Adj(A_pbT) Parking Bus, Adj Adj Sat Flow, veh/h/ln Adj Flow Rate, veh/h Adj No. of Lanes Peak Hour Factor Percent Heavy Veh, % Cap, veh/h Arrive On Green Sat Flow, veh/h Grp Volume(v), veh/h Grp Sat Flow(s),veh/h/ln Q Serve(g_s), s Cycle Q Clear(g_c), s Prop In Lane Lane Grp Cap(c), veh/h V/C Ratio(X) Avail Cap(c_a), veh/h HCM Platoon Ratio Upstream Filter(I) Uniform Delay (d), s/veh Incr Delay (d2), s/veh Initial Q Delay(d3),s/veh %ile BackOfQ(50%),veh/ln LnGrp Delay(d),s/veh LnGrp LOS F F F F F C E F F F E D Approach Vol, veh/h Approach Delay, s/veh Approach LOS F F F F Timer Assigned Phs Phs Duration (G+Y+Rc), s Change Period (Y+Rc), s * * * * Max Green Setting (Gmax), s * * * * Max Q Clear Time (g_c+i1), s Green Ext Time (p_c), s Intersection Summary HCM 2010 Ctrl Delay 88.6 HCM 2010 LOS F Notes CUY-175 PM 2021 No Build - Long Cycle 10/28/2015 Synchro 9 Report Page 1 Page C29 of 44
73 Timing Report, Sorted By Phase 3: Richmond Road & Cedar Road 3/11/2016 Phase Number Movement WBL EBTL NBL SBT EBL WBTL SBL NBTL Lead/Lag Lead Lag Lead Lag Lead Lag Lead Lag Lead-Lag Optimize Yes Yes Yes Yes Yes Yes Yes Yes Recall Mode None C-Max None Max None C-Max None Max Maximum Split (s) Maximum Split (%) 9.0% 43.6% 16.7% 30.8% 9.2% 43.3% 17.2% 30.2% Minimum Split (s) Yellow Time (s) All-Red Time (s) Minimum Initial (s) Vehicle Extension (s) Minimum Gap (s) Time Before Reduce (s) Time To Reduce (s) Walk Time (s) Flash Dont Walk (s) Dual Entry No Yes No Yes No Yes No Yes Inhibit Max Yes Yes Yes Yes Yes Yes Yes Yes Start Time (s) End Time (s) Yield/Force Off (s) Yield/Force Off 170(s) Local Start Time (s) Local Yield (s) Local Yield 170(s) Intersection Summary Cycle Length 180 Control Type Actuated-Coordinated Natural Cycle 125 Offset: 0 (0%), Referenced to phase 2:EBTL and 6:WBTL, Start of Green Splits and Phases: 3: Richmond Road & Cedar Road CUY-175 PM 2021 No Build - Long Cycle 10/28/2015 Synchro 9 Report Page 3 Page C30 of 44
74 HCM 2010 Signalized Intersection Summary 3: Richmond Road & Cedar Road 3/14/2016 Movement EBL EBT EBR WBL WBT WBR NBL NBT NBR SBL SBT SBR Lane Configurations Traffic Volume (veh/h) Future Volume (veh/h) Number Initial Q (Qb), veh Ped-Bike Adj(A_pbT) Parking Bus, Adj Adj Sat Flow, veh/h/ln Adj Flow Rate, veh/h Adj No. of Lanes Peak Hour Factor Percent Heavy Veh, % Cap, veh/h Arrive On Green Sat Flow, veh/h Grp Volume(v), veh/h Grp Sat Flow(s),veh/h/ln Q Serve(g_s), s Cycle Q Clear(g_c), s Prop In Lane Lane Grp Cap(c), veh/h V/C Ratio(X) Avail Cap(c_a), veh/h HCM Platoon Ratio Upstream Filter(I) Uniform Delay (d), s/veh Incr Delay (d2), s/veh Initial Q Delay(d3),s/veh %ile BackOfQ(50%),veh/ln LnGrp Delay(d),s/veh LnGrp LOS F F F E F C D F F F D D Approach Vol, veh/h Approach Delay, s/veh Approach LOS F F F E Timer Assigned Phs Phs Duration (G+Y+Rc), s Change Period (Y+Rc), s * * * * Max Green Setting (Gmax), s * * * * Max Q Clear Time (g_c+i1), s Green Ext Time (p_c), s Intersection Summary HCM 2010 Ctrl Delay 84.1 HCM 2010 LOS F Notes CUY-175 PM 2021 No Build - Long Cycle 10/28/2015 Synchro 9 Report Page 1 Page C31 of 44
75 Timing Report, Sorted By Phase 3: Richmond Road & Cedar Road 3/14/2016 Phase Number Movement WBL EBTL NBL SBT EBL WBTL SBL NBTL Lead/Lag Lead Lag Lead Lag Lead Lag Lead Lag Lead-Lag Optimize Yes Yes Yes Yes Yes Yes Yes Yes Recall Mode None C-Max None Max None C-Max None Max Maximum Split (s) Maximum Split (%) 9.2% 43.3% 17.5% 30.0% 9.2% 43.3% 17.5% 30.0% Minimum Split (s) Yellow Time (s) All-Red Time (s) Minimum Initial (s) Vehicle Extension (s) Minimum Gap (s) Time Before Reduce (s) Time To Reduce (s) Walk Time (s) Flash Dont Walk (s) Dual Entry No Yes No Yes No Yes No Yes Inhibit Max Yes Yes Yes Yes Yes Yes Yes Yes Start Time (s) End Time (s) Yield/Force Off (s) Yield/Force Off 170(s) Local Start Time (s) Local Yield (s) Local Yield 170(s) Intersection Summary Cycle Length 120 Control Type Actuated-Coordinated Natural Cycle 125 Offset: 0 (0%), Referenced to phase 2:EBTL and 6:WBTL, Start of Green Splits and Phases: 3: Richmond Road & Cedar Road CUY-175 PM 2021 No Build - Long Cycle 10/28/2015 Synchro 9 Report Page 3 Page C32 of 44
76 HCM 2010 Signalized Intersection Summary 3: Richmond Road & Cedar Road 3/14/2016 Movement EBL EBT EBR WBL WBT WBR NBL NBT NBR SBL SBT SBR Lane Configurations Traffic Volume (veh/h) Future Volume (veh/h) Number Initial Q (Qb), veh Ped-Bike Adj(A_pbT) Parking Bus, Adj Adj Sat Flow, veh/h/ln Adj Flow Rate, veh/h Adj No. of Lanes Peak Hour Factor Percent Heavy Veh, % Cap, veh/h Arrive On Green Sat Flow, veh/h Grp Volume(v), veh/h Grp Sat Flow(s),veh/h/ln Q Serve(g_s), s Cycle Q Clear(g_c), s Prop In Lane Lane Grp Cap(c), veh/h V/C Ratio(X) Avail Cap(c_a), veh/h HCM Platoon Ratio Upstream Filter(I) Uniform Delay (d), s/veh Incr Delay (d2), s/veh Initial Q Delay(d3),s/veh %ile BackOfQ(50%),veh/ln LnGrp Delay(d),s/veh LnGrp LOS F E E E E D D E E F D C Approach Vol, veh/h Approach Delay, s/veh Approach LOS E E E E Timer Assigned Phs Phs Duration (G+Y+Rc), s Change Period (Y+Rc), s * * * * Max Green Setting (Gmax), s * * * * Max Q Clear Time (g_c+i1), s Green Ext Time (p_c), s Intersection Summary HCM 2010 Ctrl Delay 63.7 HCM 2010 LOS E Notes CUY-175 PM 2021 Build - Long Cycle 3/11/2016 Synchro 9 Report Page 1 Page C33 of 44
77 Timing Report, Sorted By Phase 3: Richmond Road & Cedar Road 3/14/2016 Phase Number Movement WBL EBTL NBL SBT EBL WBTL SBL NBTL Lead/Lag Lead Lag Lead Lag Lead Lag Lead Lag Lead-Lag Optimize Yes Yes Yes Yes Yes Yes Yes Yes Recall Mode None C-Max None Max None C-Max None Max Maximum Split (s) Maximum Split (%) 8.3% 38.3% 14.4% 38.9% 11.7% 35.0% 21.7% 31.7% Minimum Split (s) Yellow Time (s) All-Red Time (s) Minimum Initial (s) Vehicle Extension (s) Minimum Gap (s) Time Before Reduce (s) Time To Reduce (s) Walk Time (s) Flash Dont Walk (s) Dual Entry No Yes No Yes No Yes No Yes Inhibit Max Yes Yes Yes Yes Yes Yes Yes Yes Start Time (s) End Time (s) Yield/Force Off (s) Yield/Force Off 170(s) Local Start Time (s) Local Yield (s) Local Yield 170(s) Intersection Summary Cycle Length 180 Control Type Actuated-Coordinated Natural Cycle 105 Offset: 0 (0%), Referenced to phase 2:EBTL and 6:WBTL, Start of Green Splits and Phases: 3: Richmond Road & Cedar Road CUY-175 PM 2021 Build - Long Cycle 3/11/2016 Synchro 9 Report Page 3 Page C34 of 44
78 HCM 2010 Signalized Intersection Summary 3: Richmond Road & Cedar Road 3/14/2016 Movement EBL EBT EBR WBL WBT WBR NBL NBT NBR SBL SBT SBR Lane Configurations Traffic Volume (veh/h) Future Volume (veh/h) Number Initial Q (Qb), veh Ped-Bike Adj(A_pbT) Parking Bus, Adj Adj Sat Flow, veh/h/ln Adj Flow Rate, veh/h Adj No. of Lanes Peak Hour Factor Percent Heavy Veh, % Cap, veh/h Arrive On Green Sat Flow, veh/h Grp Volume(v), veh/h Grp Sat Flow(s),veh/h/ln Q Serve(g_s), s Cycle Q Clear(g_c), s Prop In Lane Lane Grp Cap(c), veh/h V/C Ratio(X) Avail Cap(c_a), veh/h HCM Platoon Ratio Upstream Filter(I) Uniform Delay (d), s/veh Incr Delay (d2), s/veh Initial Q Delay(d3),s/veh %ile BackOfQ(50%),veh/ln LnGrp Delay(d),s/veh LnGrp LOS E E E D E C D E E E D C Approach Vol, veh/h Approach Delay, s/veh Approach LOS E E E D Timer Assigned Phs Phs Duration (G+Y+Rc), s Change Period (Y+Rc), s * * * * Max Green Setting (Gmax), s * * * * Max Q Clear Time (g_c+i1), s Green Ext Time (p_c), s Intersection Summary HCM 2010 Ctrl Delay 55.6 HCM 2010 LOS E Notes CUY-175 PM 2021 Build - Short Cycle 3/11/2016 Synchro 9 Report Page 1 Page C35 of 44
79 Timing Report, Sorted By Phase 3: Richmond Road & Cedar Road 3/14/2016 Phase Number Movement WBL EBTL NBL SBT EBL WBTL SBL NBTL Lead/Lag Lead Lag Lead Lag Lead Lag Lead Lag Lead-Lag Optimize Yes Yes Yes Yes Yes Yes Yes Yes Recall Mode None C-Max None Max None C-Max None Max Maximum Split (s) Maximum Split (%) 9.8% 36.7% 16.7% 36.8% 10.8% 35.7% 20.0% 33.5% Minimum Split (s) Yellow Time (s) All-Red Time (s) Minimum Initial (s) Vehicle Extension (s) Minimum Gap (s) Time Before Reduce (s) Time To Reduce (s) Walk Time (s) Flash Dont Walk (s) Dual Entry No Yes No Yes No Yes No Yes Inhibit Max Yes Yes Yes Yes Yes Yes Yes Yes Start Time (s) End Time (s) Yield/Force Off (s) Yield/Force Off 170(s) Local Start Time (s) Local Yield (s) Local Yield 170(s) Intersection Summary Cycle Length 120 Control Type Actuated-Coordinated Natural Cycle 105 Offset: 0 (0%), Referenced to phase 2:EBTL and 6:WBTL, Start of Green Splits and Phases: 3: Richmond Road & Cedar Road CUY-175 PM 2021 Build - Short Cycle 3/11/2016 Synchro 9 Report Page 3 Page C36 of 44
80 HCM 2010 Signalized Intersection Summary 3: Richmond Road & Cedar Road 3/11/2016 Movement EBL EBT EBR WBL WBT WBR NBL NBT NBR SBL SBT SBR Lane Configurations Traffic Volume (veh/h) Future Volume (veh/h) Number Initial Q (Qb), veh Ped-Bike Adj(A_pbT) Parking Bus, Adj Adj Sat Flow, veh/h/ln Adj Flow Rate, veh/h Adj No. of Lanes Peak Hour Factor Percent Heavy Veh, % Cap, veh/h Arrive On Green Sat Flow, veh/h Grp Volume(v), veh/h Grp Sat Flow(s),veh/h/ln Q Serve(g_s), s Cycle Q Clear(g_c), s Prop In Lane Lane Grp Cap(c), veh/h V/C Ratio(X) Avail Cap(c_a), veh/h HCM Platoon Ratio Upstream Filter(I) Uniform Delay (d), s/veh Incr Delay (d2), s/veh Initial Q Delay(d3),s/veh %ile BackOfQ(50%),veh/ln LnGrp Delay(d),s/veh LnGrp LOS F F F F F D E F F F E D Approach Vol, veh/h Approach Delay, s/veh Approach LOS F F F F Timer Assigned Phs Phs Duration (G+Y+Rc), s Change Period (Y+Rc), s * * * * Max Green Setting (Gmax), s * * * * Max Q Clear Time (g_c+i1), s Green Ext Time (p_c), s Intersection Summary HCM 2010 Ctrl Delay HCM 2010 LOS F Notes CUY-175 PM 2041 No Build - Long Cycle 10/28/2015 Synchro 9 Report Page 1 Page C37 of 44
81 Timing Report, Sorted By Phase 3: Richmond Road & Cedar Road 3/11/2016 Phase Number Movement WBL EBTL NBL SBT EBL WBTL SBL NBTL Lead/Lag Lead Lag Lead Lag Lead Lag Lead Lag Lead-Lag Optimize Yes Yes Yes Yes Yes Yes Yes Yes Recall Mode None C-Max None Max None C-Max None Max Maximum Split (s) Maximum Split (%) 9.4% 43.1% 16.7% 30.8% 9.4% 43.1% 17.2% 30.2% Minimum Split (s) Yellow Time (s) All-Red Time (s) Minimum Initial (s) Vehicle Extension (s) Minimum Gap (s) Time Before Reduce (s) Time To Reduce (s) Walk Time (s) Flash Dont Walk (s) Dual Entry No Yes No Yes No Yes No Yes Inhibit Max Yes Yes Yes Yes Yes Yes Yes Yes Start Time (s) End Time (s) Yield/Force Off (s) Yield/Force Off 170(s) Local Start Time (s) Local Yield (s) Local Yield 170(s) Intersection Summary Cycle Length 180 Control Type Actuated-Coordinated Natural Cycle 135 Offset: 0 (0%), Referenced to phase 2:EBTL and 6:WBTL, Start of Green Splits and Phases: 3: Richmond Road & Cedar Road CUY-175 PM 2041 No Build - Long Cycle 10/28/2015 Synchro 9 Report Page 3 Page C38 of 44
82 HCM 2010 Signalized Intersection Summary 3: Richmond Road & Cedar Road 3/14/2016 Movement EBL EBT EBR WBL WBT WBR NBL NBT NBR SBL SBT SBR Lane Configurations Traffic Volume (veh/h) Future Volume (veh/h) Number Initial Q (Qb), veh Ped-Bike Adj(A_pbT) Parking Bus, Adj Adj Sat Flow, veh/h/ln Adj Flow Rate, veh/h Adj No. of Lanes Peak Hour Factor Percent Heavy Veh, % Cap, veh/h Arrive On Green Sat Flow, veh/h Grp Volume(v), veh/h Grp Sat Flow(s),veh/h/ln Q Serve(g_s), s Cycle Q Clear(g_c), s Prop In Lane Lane Grp Cap(c), veh/h V/C Ratio(X) Avail Cap(c_a), veh/h HCM Platoon Ratio Upstream Filter(I) Uniform Delay (d), s/veh Incr Delay (d2), s/veh Initial Q Delay(d3),s/veh %ile BackOfQ(50%),veh/ln LnGrp Delay(d),s/veh LnGrp LOS F F F F F C E F F F D D Approach Vol, veh/h Approach Delay, s/veh Approach LOS F F F F Timer Assigned Phs Phs Duration (G+Y+Rc), s Change Period (Y+Rc), s * * * * Max Green Setting (Gmax), s * * * * Max Q Clear Time (g_c+i1), s Green Ext Time (p_c), s Intersection Summary HCM 2010 Ctrl Delay 99.2 HCM 2010 LOS F Notes CUY-175 PM 2041 No Build - Long Cycle 10/28/2015 Synchro 9 Report Page 1 Page C39 of 44
83 Timing Report, Sorted By Phase 3: Richmond Road & Cedar Road 3/14/2016 Phase Number Movement WBL EBTL NBL SBT EBL WBTL SBL NBTL Lead/Lag Lead Lag Lead Lag Lead Lag Lead Lag Lead-Lag Optimize Yes Yes Yes Yes Yes Yes Yes Yes Recall Mode None C-Max None Max None C-Max None Max Maximum Split (s) Maximum Split (%) 9.2% 43.3% 19.2% 28.3% 9.2% 43.3% 17.5% 30.0% Minimum Split (s) Yellow Time (s) All-Red Time (s) Minimum Initial (s) Vehicle Extension (s) Minimum Gap (s) Time Before Reduce (s) Time To Reduce (s) Walk Time (s) Flash Dont Walk (s) Dual Entry No Yes No Yes No Yes No Yes Inhibit Max Yes Yes Yes Yes Yes Yes Yes Yes Start Time (s) End Time (s) Yield/Force Off (s) Yield/Force Off 170(s) Local Start Time (s) Local Yield (s) Local Yield 170(s) Intersection Summary Cycle Length 120 Control Type Actuated-Coordinated Natural Cycle 135 Offset: 0 (0%), Referenced to phase 2:EBTL and 6:WBTL, Start of Green Splits and Phases: 3: Richmond Road & Cedar Road CUY-175 PM 2041 No Build - Long Cycle 10/28/2015 Synchro 9 Report Page 3 Page C40 of 44
84 HCM 2010 Signalized Intersection Summary 3: Richmond Road & Cedar Road 3/14/2016 Movement EBL EBT EBR WBL WBT WBR NBL NBT NBR SBL SBT SBR Lane Configurations Traffic Volume (veh/h) Future Volume (veh/h) Number Initial Q (Qb), veh Ped-Bike Adj(A_pbT) Parking Bus, Adj Adj Sat Flow, veh/h/ln Adj Flow Rate, veh/h Adj No. of Lanes Peak Hour Factor Percent Heavy Veh, % Cap, veh/h Arrive On Green Sat Flow, veh/h Grp Volume(v), veh/h Grp Sat Flow(s),veh/h/ln Q Serve(g_s), s Cycle Q Clear(g_c), s Prop In Lane Lane Grp Cap(c), veh/h V/C Ratio(X) Avail Cap(c_a), veh/h HCM Platoon Ratio Upstream Filter(I) Uniform Delay (d), s/veh Incr Delay (d2), s/veh Initial Q Delay(d3),s/veh %ile BackOfQ(50%),veh/ln LnGrp Delay(d),s/veh LnGrp LOS F E E E F D E F F F D C Approach Vol, veh/h Approach Delay, s/veh Approach LOS E E E E Timer Assigned Phs Phs Duration (G+Y+Rc), s Change Period (Y+Rc), s * * * * Max Green Setting (Gmax), s * * * * Max Q Clear Time (g_c+i1), s Green Ext Time (p_c), s Intersection Summary HCM 2010 Ctrl Delay 72.0 HCM 2010 LOS E Notes CUY-175 PM 2041 Build - Long Cycle 3/11/2016 Synchro 9 Report Page 1 Page C41 of 44
85 Timing Report, Sorted By Phase 3: Richmond Road & Cedar Road 3/14/2016 Phase Number Movement WBL EBTL NBL SBT EBL WBTL SBL NBTL Lead/Lag Lead Lag Lead Lag Lead Lag Lead Lag Lead-Lag Optimize Yes Yes Yes Yes Yes Yes Yes Yes Recall Mode None C-Max None Max None C-Max None Max Maximum Split (s) Maximum Split (%) 9.4% 37.2% 14.4% 38.9% 12.8% 33.9% 21.7% 31.7% Minimum Split (s) Yellow Time (s) All-Red Time (s) Minimum Initial (s) Vehicle Extension (s) Minimum Gap (s) Time Before Reduce (s) Time To Reduce (s) Walk Time (s) Flash Dont Walk (s) Dual Entry No Yes No Yes No Yes No Yes Inhibit Max Yes Yes Yes Yes Yes Yes Yes Yes Start Time (s) End Time (s) Yield/Force Off (s) Yield/Force Off 170(s) Local Start Time (s) Local Yield (s) Local Yield 170(s) Intersection Summary Cycle Length 180 Control Type Actuated-Coordinated Natural Cycle 105 Offset: 0 (0%), Referenced to phase 2:EBTL and 6:WBTL, Start of Green Splits and Phases: 3: Richmond Road & Cedar Road CUY-175 PM 2041 Build - Long Cycle 3/11/2016 Synchro 9 Report Page 3 Page C42 of 44
86 HCM 2010 Signalized Intersection Summary 3: Richmond Road & Cedar Road 3/14/2016 Movement EBL EBT EBR WBL WBT WBR NBL NBT NBR SBL SBT SBR Lane Configurations Traffic Volume (veh/h) Future Volume (veh/h) Number Initial Q (Qb), veh Ped-Bike Adj(A_pbT) Parking Bus, Adj Adj Sat Flow, veh/h/ln Adj Flow Rate, veh/h Adj No. of Lanes Peak Hour Factor Percent Heavy Veh, % Cap, veh/h Arrive On Green Sat Flow, veh/h Grp Volume(v), veh/h Grp Sat Flow(s),veh/h/ln Q Serve(g_s), s Cycle Q Clear(g_c), s Prop In Lane Lane Grp Cap(c), veh/h V/C Ratio(X) Avail Cap(c_a), veh/h HCM Platoon Ratio Upstream Filter(I) Uniform Delay (d), s/veh Incr Delay (d2), s/veh Initial Q Delay(d3),s/veh %ile BackOfQ(50%),veh/ln LnGrp Delay(d),s/veh LnGrp LOS F E E E F D D E E E D C Approach Vol, veh/h Approach Delay, s/veh Approach LOS E E E D Timer Assigned Phs Phs Duration (G+Y+Rc), s Change Period (Y+Rc), s * * * * Max Green Setting (Gmax), s * * * * Max Q Clear Time (g_c+i1), s Green Ext Time (p_c), s Intersection Summary HCM 2010 Ctrl Delay 64.6 HCM 2010 LOS E Notes CUY-175 PM 2041 Build - Short Cycle 3/11/2016 Synchro 9 Report Page 1 Page C43 of 44
87 Timing Report, Sorted By Phase 3: Richmond Road & Cedar Road 3/14/2016 Phase Number Movement WBL EBTL NBL SBT EBL WBTL SBL NBTL Lead/Lag Lead Lag Lead Lag Lead Lag Lead Lag Lead-Lag Optimize Yes Yes Yes Yes Yes Yes Yes Yes Recall Mode None C-Max None Max None C-Max None Max Maximum Split (s) Maximum Split (%) 9.8% 36.7% 16.7% 36.8% 10.8% 35.7% 20.0% 33.5% Minimum Split (s) Yellow Time (s) All-Red Time (s) Minimum Initial (s) Vehicle Extension (s) Minimum Gap (s) Time Before Reduce (s) Time To Reduce (s) Walk Time (s) Flash Dont Walk (s) Dual Entry No Yes No Yes No Yes No Yes Inhibit Max Yes Yes Yes Yes Yes Yes Yes Yes Start Time (s) End Time (s) Yield/Force Off (s) Yield/Force Off 170(s) Local Start Time (s) Local Yield (s) Local Yield 170(s) Intersection Summary Cycle Length 120 Control Type Actuated-Coordinated Natural Cycle 105 Offset: 0 (0%), Referenced to phase 2:EBTL and 6:WBTL, Start of Green Splits and Phases: 3: Richmond Road & Cedar Road CUY-175 PM 2041 Build - Short Cycle 3/11/2016 Synchro 9 Report Page 3 Page C44 of 44
88 Appendix D Clearance Interval Calculations Appendix D Page D1 of 2
89 CUY Clearance Interval Calculations Richmond Road and Cedar Road Veh. + Ped. Clearance Intervals Approach Movement t - Driver Perception/Reaction Time (s) Approach Speed (mph) V - Approach Speed (ft/s) a - Deceleration Rate (ft/s 2 ) g - Approach Grade W - Width of Intersection (ft)* L - Length of Vehicle (ft) Vehicle Clearance Interval Data Northbound Southbound Eastbound Westbound Thru Left Thru Left Thru Left Thru Left *Measured from stop bar to far edge of opposing crosswalk for through movements, vehicle path required to clear the adjacent crosswalk for left turn movements Pedestrian Clearance Interval Data Through Phase Northbound Southbound Eastbound Westbound Minimum Walk Time (s) 7.0 Additional Walk Time (s) Total Walk Time (s) Pedestrian Walking Speed (ft/s) 3.5 Crossing Distance (ft) Approach Movement Y - Yellow Change Interval (s) Y = t+v/(2a g) AR - Red Clearance Interval (s) AR = (W+L)/V Pedestrian Clearance Interval (s) = (Crossing Distance / Ped. Walk Speed) Clearance Interval Calculations Northbound Southbound Eastbound Westbound Thru Left Thru Left Thru Left Thru Left *Min. yellow change interval is set at 3 sec. and max. set at 6 sec., calculated values may differ **Min. all-red clearance interval is set at 1 sec. and max. set at 3 sec. for through phases and 2 sec. for left turn phases, calculated values may differ 2.0 Recommended Clearance Intervals Approach Northbound Southbound Eastbound Westbound Movement Thru Left Thru Left Thru Left Thru Left Yellow Change Interval Red Clearance Interval Pedestrian Clearance Interval Page D2 of 2
90 Appendix E Crash Diagrams Appendix E Page E1 of 6


91 Page E2 of 6


92 Page E3 of 6


93 Page E4 of 6


94 Page E5 of 6


95 Page E6 of 6
96 Appendix F HSM Output Appendix F Page F1 of 5
97 Project Information General Information Project Name Project Description Reference Number Analyst Agency/Company Perform Benefit Cost Analysis? CUY Safety Study GMB Carpenter Marty Transportation Yes Contact Contact Phone Date Performed Analysis Year Design Exception Analysis? /15/ No Do the proposed improvements fundamentally change the conditions of the base safety performance function (SPF)? (i.e. unsignalized to signalized, undivided to divided, increase or decrease in the number of through lanes (exlude turn lanes), change the number of approaches to an intersection, significant realignment of the roadway) No Project Elements Description Table Project Element ID (Must be Unique) Site Type Intersection Control Type NLFID Begin Logpoint/ Intersection Midpoint End Logpoint (Leave blank for Intersection) Location Information Length (mi) OR Intersection Radius Buffer (mi) Cross Route NLFID(s) Common Name SR175; 7.3 Urban & Suburban Arterial Intersection Signalized SCUYSR00175**C CCUYCR0002 Richmond Road and Cedar Road Traffic Volume Growth Rate Calculation Present ADT (PADT) Future ADT (FADT) Annual Linear Growth Rate Year AADT 0.00 veh / day veh / day Created by the Office of Systems Planning and Program Management Page F2 of 5
98 Project Elements Description Table Location Information Project Element ID (Must be Unique) Site Type Intersection Control Type NLFID Begin Logpoint/ Intersection Midpoint End Logpoint (Leave blank for Intersection) Length (mi) OR Intersection Radius Buffer (mi) Cross Route NLFID(s) Common Name Select Other Non-Site Characteristic Based Countermeasures For Entire Project CMF Nbr Countermeasure CMF KA Value CMF B Value CMF C Value CMF O Value CMF Valid for the Following Site Types CMF 1 Addition of auxiliary through lane CMF 2 Improve visibility of signal heads CMF 3 Advance Street Name Signs By Crash Type By Crash Type By Crash Type By Crash Type 7 CMF 4 CMF 5 CMF 6 CMF 7 CMF 8 CMF 9 CMF 10 Created by the Office of Systems Planning and Program Management Page F3 of 5

99 Project Safety Performance Report General Information Project Name Project Description CUY Safety Study Contact Contact Phone Reference Number Analyst Agency/Company GMB Carpenter Marty Transportation Date Performed Analysis Year 3/15/ Summary of Anticipated Safety Performance of the Project (average crashes/year) Existing Conditions Predicted Average Crash Frequency Existing Conditions Expected Average Crash Frequency Existing Condtions Potential for Safety Improvement KA B C O Total Proposed Conditions Expected Average Crash Frequency N predicted - Existing Conditions N expected - Existing Conditions N potential for improvement - Existing Conditions N expected - Proposed Conditions Project Summary Results (Without Animal Crashes) KA B C O Total Created by the Office of Systems Planning and Program Management Page F4 of 5
100 Project Safety Performance Report General Information Project Name Project Description CUY Safety Study Contact Contact Phone Reference Number Analyst Agency/Company GMB Carpenter Marty Transportation Date Performed Analysis Year 3/15/ Existing Conditions Project Element Predicted Crash Summary (Without Animal Crashes) Crash Severity Level Project Element ID Common Name KA B C O Total SR175; 7.3 Richmond Road and Cedar Road Existing Conditions Project Element Expected Crash Summary (Without Animal Crashes) Crash Severity Level Project Element ID Common Name KA B C O Total SR175; 7.3 Richmond Road and Cedar Road Existing Conditions Project Element Potential for Safety Improvement Summary (Without Animal Crashes) Crash Severity Level Project Element ID Common Name KA B C O Total SR175; 7.3 Richmond Road and Cedar Road Proposed Conditions Project Element Expected Crash Summary (Without Animal Crashes) Crash Severity Level Project Element ID Common Name KA B C O Total SR175; 7.3 Richmond Road and Cedar Road Summary by Crash Type Existing Proposed Crash Type Predicted Crash Expected Crash Expected Crash PSI Frequency Frequency Frequency Unknown Head On Rear End Backing Sideswipe - Meeting Sideswipe - Passing Angle Parked Vehicle Pedestrian Animal Train Pedalcycles Other Non-Vehicle Fixed Object Other Object Overturning Other Non-Collision Left Turn Right Turn Created by the Office of Systems Planning and Program Management Page F5 of 5
101 Appendix G Storage Lane Length Calculations Appendix G Page G1 of 8
102 Storage Lane Length Summary Movement Southbound Dual Left Southbound Right Northbound Left Eastbound Left Westbound Left Westbound Right Time Period Existing Length (ft) Calculated Length (ft) Through Block Length (ft) AM 390/ / PM AM PM AM PM AM PM AM PM AM PM Proposed Length (ft) 475/ * *Westbound right turn lane had to be shortened because of added westbound through lane and ODOT L&D Manual standards for add and drop lanes at intersections. Page G2 of 8
103 CUY Safety Study Turn Lane Analysis Richmond Road and Cedar Road Southbound Left 2041 Build Left Turn Lane Length Calculations AM Peak PM Peak Design Speed Traffic Control Cycle Length Cycles Per Hour Turn Lane Volume Advancing Traffic Left Turn Percentage Location Type Condition Vehicles/Cycle Turn Lane Length Offset Width Approach Taper Design Speed Traffic Control Cycle Length Cycles Per Hour Turn Lane Volume Advancing Traffic Left Turn Percentage Location Type Condition Vehicles/Cycle Turn Lane Length Offset Width Approach Taper 35 mph Signalized 4 Phase Known 20 Enter Cycles Per Hour 470 VPH 1350 VPH 35% Intersection A mph Signalized 4 Phase Known 20 Enter Cycles Per Hour 490 VPH 1310 VPH 37% Intersection A Dual Left Turn Lane Lengths Storage Length Per Lane 400 ft Outer Lane Deceleration Length 125 ft Inner Lane Deceleration Length 75 ft Total Outer Lane Length Total Inner Lane Length 525 ft 475 ft AM Peak PM Peak Adjacent Lane Volume Vehicles / Cycle Required Length* Adjacent Lane Volume Vehicles / Cycle Required Length* Through Block Check *Not including a 50 ft diverging taper Page G3 of 8
104 CUY Safety Study Turn Lane Analysis Richmond Road and Cedar Road Southbound Right 2041 Build Right Turn Lane Length Calculations AM Peak PM Peak Design Speed Traffic Control Cycle Length Cycles Per Hour Turn Lane Volume Advancing Traffic Right Turn Percentage Location Type Condition Vehicles/Cycle Turn Lane Length Design Speed Traffic Control Cycle Length Cycles Per Hour Turn Lane Volume Advancing Traffic Right Turn Percentage Location Type Condition Vehicles/Cycle Turn Lane Length 35 mph Signalized 4 Phase Known 20 Enter Cycles Per Hour 130 VPH 1350 VPH 10% Intersection A mph Signalized 4 Phase Known 20 Enter Cycles Per Hour 210 VPH 1310 VPH 16% Intersection A AM Peak PM Peak Through Block Check Adjacent Lane Volume 375 Vehicles / Cycle 19 Required Length* 700 Adjacent Lane Volume 305 Vehicles / Cycle 16 Required Length* 600 *Required length includes a 50 ft. diverging taper Page G4 of 8
105 CUY Safety Study Turn Lane Analysis Richmond Road and Cedar Road Northbound Left 2041 Build Left Turn Lane Length Calculations AM Peak PM Peak Design Speed Traffic Control Cycle Length Cycles Per Hour Turn Lane Volume Advancing Traffic Left Turn Percentage Location Type Condition Vehicles/Cycle Turn Lane Length Offset Width Approach Taper Design Speed Traffic Control Cycle Length Cycles Per Hour Turn Lane Volume Advancing Traffic Left Turn Percentage Location Type Condition Vehicles/Cycle Turn Lane Length Offset Width Approach Taper 35 mph Signalized 4 Phase Known 20 Enter Cycles Per Hour 160 VPH 730 VPH 22% Intersection A mph Signalized 4 Phase Known 20 Enter Cycles Per Hour 310 VPH 1240 VPH 25% Intersection A AM Peak PM Peak Adjacent Lane Volume Vehicles / Cycle Required Length* Adjacent Lane Volume Vehicles / Cycle Required Length* Through Block Check *Required length includes a 50 ft. diverging taper Page G5 of 8
106 CUY Safety Study Turn Lane Analysis Richmond Road and Cedar Road Eastbound Left 2041 Build Left Turn Lane Length Calculations AM Peak PM Peak Design Speed Traffic Control Cycle Length Cycles Per Hour Turn Lane Volume Advancing Traffic Left Turn Percentage Location Type Condition Vehicles/Cycle Turn Lane Length Offset Width Approach Taper Design Speed Traffic Control Cycle Length Cycles Per Hour Turn Lane Volume Advancing Traffic Left Turn Percentage Location Type Condition Vehicles/Cycle Turn Lane Length Offset Width Approach Taper 35 mph Signalized 4 Phase Known 20 Enter Cycles Per Hour 120 VPH 1340 VPH 9% Intersection A mph Signalized 4 Phase Known 20 Enter Cycles Per Hour 160 VPH 1530 VPH 10% Intersection A AM Peak PM Peak Adjacent Lane Volume Vehicles / Cycle Required Length* Adjacent Lane Volume Vehicles / Cycle Required Length* Through Block Check *Required length includes a 50 ft. diverging taper Page G6 of 8
107 CUY Safety Study Turn Lane Analysis Richmond Road and Cedar Road Westbound Left 2041 Build Left Turn Lane Length Calculations AM Peak PM Peak Design Speed Traffic Control Cycle Length Cycles Per Hour Turn Lane Volume Advancing Traffic Left Turn Percentage Location Type Condition Vehicles/Cycle Turn Lane Length Offset Width Approach Taper Design Speed Traffic Control Cycle Length Cycles Per Hour Turn Lane Volume Advancing Traffic Left Turn Percentage Location Type Condition Vehicles/Cycle Turn Lane Length Offset Width Approach Taper 35 mph Signalized 4 Phase Known 20 Enter Cycles Per Hour 110 VPH 1670 VPH 7% Intersection A mph Signalized 4 Phase Known 20 Enter Cycles Per Hour 140 VPH 2310 VPH 6% Intersection A AM Peak PM Peak Adjacent Lane Volume Vehicles / Cycle Required Length* Adjacent Lane Volume Vehicles / Cycle Required Length* Through Block Check *Required length includes a 50 ft. diverging taper Page G7 of 8
108 CUY Safety Study Turn Lane Analysis Richmond Road and Cedar Road Westbound Right 2041 Build Right Turn Lane Length Calculations AM Peak PM Peak Design Speed Traffic Control Cycle Length Cycles Per Hour Turn Lane Volume Advancing Traffic Right Turn Percentage Location Type Condition Vehicles/Cycle Turn Lane Length Design Speed Traffic Control Cycle Length Cycles Per Hour Turn Lane Volume Advancing Traffic Right Turn Percentage Location Type Condition Vehicles/Cycle Turn Lane Length 35 mph Signalized 4 Phase Known 20 Enter Cycles Per Hour 480 VPH 1670 VPH 29% Intersection A mph Signalized 4 Phase Known 20 Enter Cycles Per Hour 650 VPH 2310 VPH 28% Intersection A AM Peak PM Peak Through Block Check Adjacent Lane Volume 360 Vehicles / Cycle 18 Required Length* 675 Adjacent Lane Volume 507 Vehicles / Cycle 26 Required Length* 905 *Required length includes a 50 ft. diverging taper Page G8 of 8
109 Appendix H City of Beachwood 2015 Master Plan Appendix H Page H1 of 8


110 Page H2 of 8

111 Page H3 of 8

112 Page H4 of 8


113 Page H5 of 8


114 Page H6 of 8

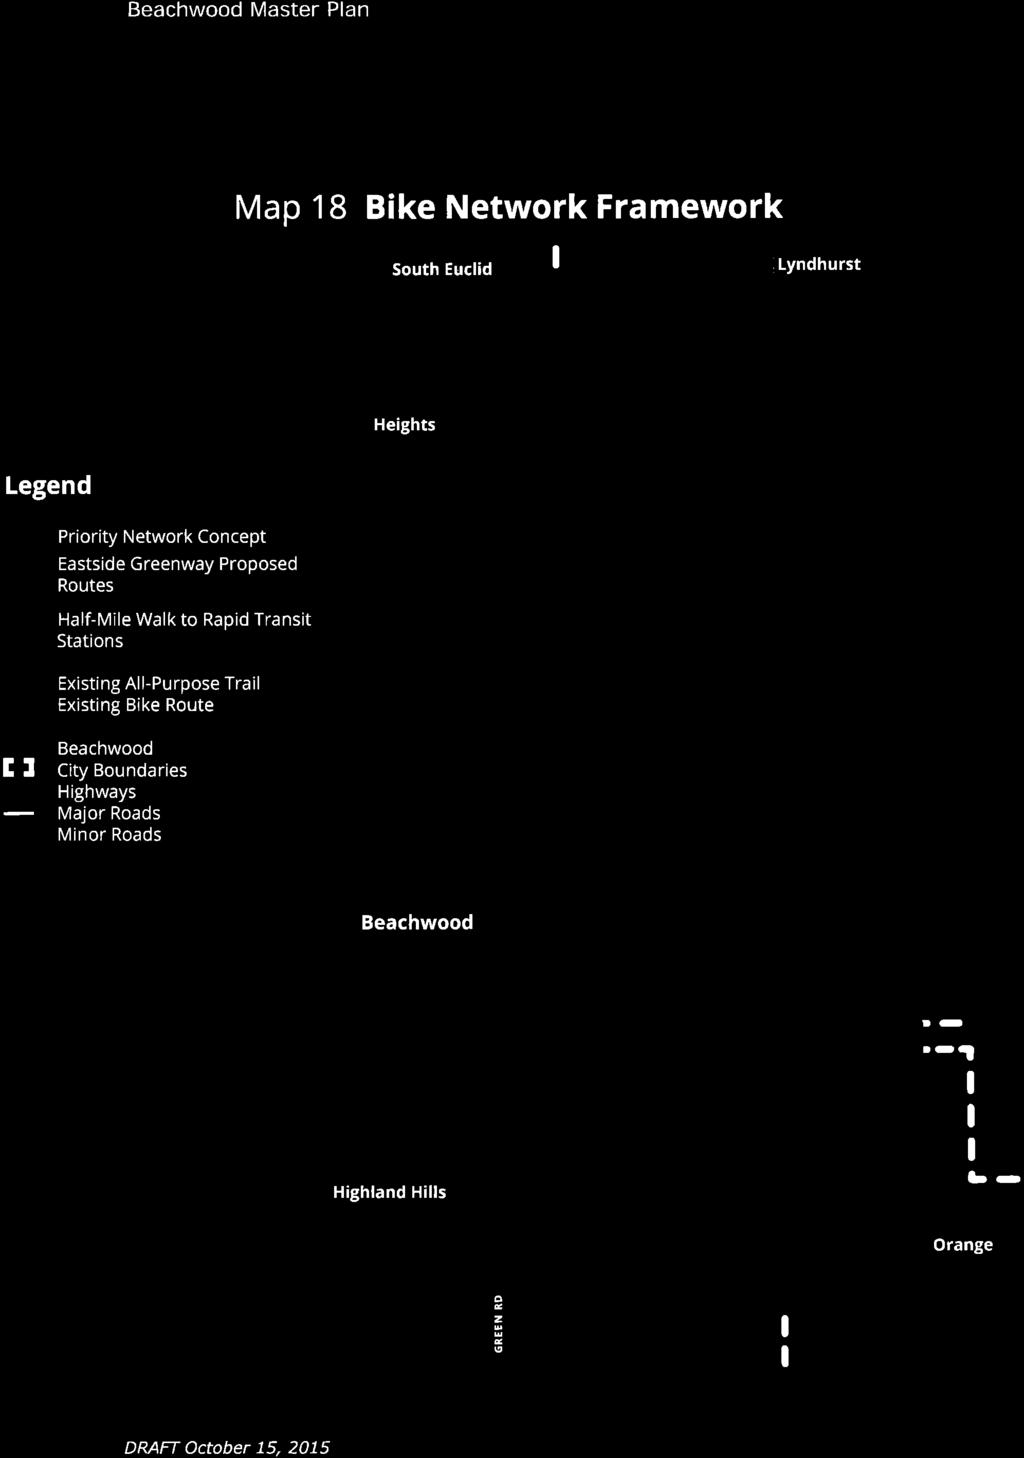
115 Page H7 of 8


116 Page H8 of 8
Figure 1 Map of intersection of SR 44 (Ravenna Rd) and Butternut Rd
 and Butternut Rd") Abbreviated Study District: 12 County: Geauga Route: SR 44 Section: 1.58 GEA 44 1.58 213 HSP # 47 (Rural Intersection) Prepared April 23, 215 By Bryan Emery Existing Conditions This study contains the
Abbreviated Study District: 12 County: Geauga Route: SR 44 Section: 1.58 GEA 44 1.58 213 HSP # 47 (Rural Intersection) Prepared April 23, 215 By Bryan Emery Existing Conditions This study contains the
CUY SAFETY STUDY KINSMAN RD (US 422) AT E. 93 RD ST CLEVELAND, OHIO - ODOT DISTRICT 12. October 13, LJB Inc.
 AT E. 93 RD ST CLEVELAND, OHIO - ODOT DISTRICT 12. October 13, LJB Inc.") CUY-422-4.34 SAFETY STUDY KINSMAN RD (US 422) AT E. 93 RD ST CLEVELAND, OHIO - ODOT DISTRICT 12 October 13, 2014 PREPARED BY: LJB Inc. 2500 Newmark Drive Miamisburg, OH 45342 (937) 259-5000 Elizabeth L.
CUY-422-4.34 SAFETY STUDY KINSMAN RD (US 422) AT E. 93 RD ST CLEVELAND, OHIO - ODOT DISTRICT 12 October 13, 2014 PREPARED BY: LJB Inc. 2500 Newmark Drive Miamisburg, OH 45342 (937) 259-5000 Elizabeth L.
LAWRENCE TRANSIT CENTER LOCATION ANALYSIS 9 TH STREET & ROCKLEDGE ROAD / 21 ST STREET & IOWA STREET LAWRENCE, KANSAS
 LAWRENCE TRANSIT CENTER LOCATION ANALYSIS 9 TH STREET & ROCKLEDGE ROAD / 21 ST STREET & IOWA STREET LAWRENCE, KANSAS TRAFFIC IMPACT STUDY FEBRUARY 214 OA Project No. 213-542 TABLE OF CONTENTS 1. INTRODUCTION...
Traffic Engineering Study
 Traffic Engineering Study Bellaire Boulevard Prepared For: International Management District Technical Services, Inc. Texas Registered Engineering Firm F-3580 November 2009 Executive Summary has been requested
MINERVA PARK SITE TRAFFIC IMPACT STUDY M/I HOMES. September 2, 2015
 5500 New Albany Road Columbus, Ohio 43054 Phone: 614.775.4500 Fax: 614.775.4800 Toll Free: 1-888-775-EMHT emht.com 2015-1008 MINERVA PARK SITE TRAFFIC IMPACT STUDY M/I HOMES September 2, 2015 Engineers
Table of Contents INTRODUCTION... 3 PROJECT STUDY AREA Figure 1 Vicinity Map Study Area... 4 EXISTING CONDITIONS... 5 TRAFFIC OPERATIONS...
 Crosshaven Drive Corridor Study City of Vestavia Hills, Alabama Table of Contents INTRODUCTION... 3 PROJECT STUDY AREA... 3 Figure 1 Vicinity Map Study Area... 4 EXISTING CONDITIONS... 5 TRAFFIC OPERATIONS...
TIMBERVINE TRANSPORTATION IMPACT STUDY FORT COLLINS, COLORADO JANUARY Prepared for:
 TIMBERVINE TRANSPORTATION IMPACT STUDY FORT COLLINS, COLORADO JANUARY 2014 Prepared for: Hartford Companies 1218 W. Ash Street Suite A Windsor, Co 80550 Prepared by: DELICH ASSOCIATES 2272 Glen Haven Drive
MILLERSVILLE PARK TRAFFIC IMPACT ANALYSIS ANNE ARUNDEL COUNTY, MARYLAND
 MILLERSVILLE PARK TRAFFIC IMPACT ANALYSIS ANNE ARUNDEL COUNTY, MARYLAND Prepared for: Department of Public Works Anne Arundel County Prepared by: URS Corporation 4 North Park Drive, Suite 3 Hunt Valley,
Traffic Impact Study Speedway Gas Station Redevelopment
 Traffic Impact Study Speedway Gas Station Redevelopment Warrenville, Illinois Prepared For: Prepared By: April 11, 2018 Table of Contents 1. Introduction... 1 2. Existing Conditions... 4 Site Location...
INDUSTRIAL DEVELOPMENT
 INDUSTRIAL DEVELOPMENT Traffic Impact Study Plainfield, Illinois August 2018 Prepared for: Seefried Industrial Properties, Inc. TABLE OF CONTENTS Executive Summary 2 Introduction 3 Existing Conditions
County State Aid Highway 32 (Cliff Road) and Dodd Road Intersection Study
 and Dodd Road Intersection Study") County State Aid Highway 32 (Cliff Road) and Dodd Road Intersection Study City of Eagan, Dakota County, Minnesota Date: March 2012 Project No. 14957.000 444 Cedar Street, Suite 1500 Saint Paul, MN 55101
County State Aid Highway 32 (Cliff Road) and Dodd Road Intersection Study City of Eagan, Dakota County, Minnesota Date: March 2012 Project No. 14957.000 444 Cedar Street, Suite 1500 Saint Paul, MN 55101
IMPROVEMENT CONCEPTS
 IMPROVEMENT CONCEPTS for the South Novato Transit Hub Study Prepared by: January 11, 2010 DKS Associates With Wilbur Smith Associates IMPROVEMENT CONCEPTS Chapter 1: Introduction 1. INTRODUCTION The strategic
EXECUTIVE SUMMARY. The following is an outline of the traffic analysis performed by Hales Engineering for the traffic conditions of this project.
 EXECUTIVE SUMMARY This study addresses the traffic impacts associated with the proposed Shopko redevelopment located in Sugarhouse, Utah. The Shopko redevelopment project is located between 1300 East and
INTERCHANGE OPERTIONS STUDY Interstate 77 / Wallings Road Interchange
 INTERCHANGE OPERTIONS STUDY Interstate 77 / Wallings Road Interchange City of Broadview Heights, Cuyahoga County, Ohio Prepared For: City of Broadview Heights Department of Engineering 9543 Broadview Road
APPENDIX E. Traffic Analysis Report
 APPENDIX E Traffic Analysis Report THIS PAGE INTENTIONALLY BLANK EAGLE RIVER TRAFFIC MITIGATION PHASE I OLD GLENN HIGHWAY/EAGLE RIVER ROAD INTERSECTION IMPROVEMENTS TRAFFIC ANALYSIS Eagle River, Alaska
Transit City Etobicoke - Finch West LRT
 Delcan Corporation Transit City Etobicoke - Finch West LRT APPENDIX D Microsimulation Traffic Modeling Report March 2010 March 2010 Appendix D CONTENTS 1.0 STUDY CONTEXT... 2 Figure 1 Study Limits... 2
APPENDIX C1 TRAFFIC ANALYSIS DESIGN YEAR TRAFFIC ANALYSIS
 APPENDIX C1 TRAFFIC ANALYSIS DESIGN YEAR TRAFFIC ANALYSIS DESIGN YEAR TRAFFIC ANALYSIS February 2018 Highway & Bridge Project PIN 6754.12 Route 13 Connector Road Chemung County February 2018 Appendix
Traffic Impact Analysis West Street Garden Plots Improvements and DuPage River Park Garden Plots Development Naperville, Illinois
 Traffic Impact Analysis West Street Garden Plots Improvements and DuPage River Park Garden Plots Development Naperville, Illinois Submitted by April 9, 2009 Introduction Kenig, Lindgren, O Hara, Aboona,
TRAFFIC SIGNAL DESIGN REPORT KING OF PRUSSIA ROAD & RAIDER ROAD RADNOR TOWNSHIP PENNSYLVANIA
 TRAFFIC SIGNAL DESIGN REPORT KING OF PRUSSIA ROAD & RAIDER ROAD RADNOR TOWNSHIP PENNSYLVANIA PREPARED FOR: UNIVERSITY OF PENNSYLVANIA HEALTH SYSTEM 34 CIVIC CENTER BOULEVARD PHILADELPHIA, PA 1987 (61)
RICHMOND OAKS HEALTH CENTRE 6265 PERTH STREET OTTAWA, ONTARIO TRANSPORTATION BRIEF. Prepared for: Guycoki (Eastern) Limited.
 Limited.") RICHMOND OAKS HEALTH CENTRE 6265 PERTH STREET OTTAWA, ONTARIO TRANSPORTATION BRIEF Prepared for: Guycoki (Eastern) Limited June 16, 2016 116-638 Brief_1.doc D. J. Halpenny & Associates Ltd. Consulting
RICHMOND OAKS HEALTH CENTRE 6265 PERTH STREET OTTAWA, ONTARIO TRANSPORTATION BRIEF Prepared for: Guycoki (Eastern) Limited June 16, 2016 116-638 Brief_1.doc D. J. Halpenny & Associates Ltd. Consulting
King Soopers #116 Thornton, Colorado
 Traffic Impact Study King Soopers #116 Thornton, Colorado Prepared for: Galloway & Company, Inc. T R A F F I C I M P A C T S T U D Y King Soopers #116 Thornton, Colorado Prepared for Galloway & Company
County State Aid Highway 30 (Diffley Road) and Dodd Road Intersection Study
 and Dodd Road Intersection Study") County State Aid Highway 30 (Diffley Road) and Dodd Road Intersection Study City of Eagan, Dakota County, Minnesota Date: March 2012 Project No. 14957.000 444 Cedar Street, Suite 1500 Saint Paul, MN 55101
County State Aid Highway 30 (Diffley Road) and Dodd Road Intersection Study City of Eagan, Dakota County, Minnesota Date: March 2012 Project No. 14957.000 444 Cedar Street, Suite 1500 Saint Paul, MN 55101
RTE. 1 at RTE. 637 & RTE. 639
 INTERSECTION SAFETY STUDY Prepared for: Virginia Department of Transportation Central Region Operations Traffic Engineering (UPC #81378, TO 12-092) DAVENPORT Project Number: 13-368 / /2014 RTE. 1 at RTE.
Bennett Pit. Traffic Impact Study. J&T Consulting, Inc. Weld County, Colorado. March 3, 2017
 Bennett Pit Traffic Impact Study J&T Consulting, Inc. Weld County, Colorado March 3, 217 Prepared By: Sustainable Traffic Solutions, Inc. http://www.sustainabletrafficsolutions.com/ Joseph L. Henderson,
City of Marina. Regional Roundabout Study Utilizing Caltrans Intersection Control Evaluation Section 4: Transportation Agency for Monterey County
 Regional Roundabout Study Utilizing Caltrans Intersection Control Evaluation Section 4: City of Marina Study Intersections: RESERVATION ROAD AT BEACH ROAD RESERVATION ROAD AT DEFOREST ROAD CARDOZA AVENUE
STH 60 Northern Reliever Route Feasibility Study Report
 #233087 v3 STH 60 Northern Reliever Route Feasibility Study Report Washington County Public Works Committee Meeting September 28, 2016 1 STH 60 Northern Reliever Route Feasibility Study Hartford Area Development
Roundabout Feasibility Study SR 44 at Grand Avenue TABLE OF CONTENTS
 Roundabout Feasibility Study SR 44 at Grand Avenue TABLE OF CONTENTS Introduction and Executive Summary... 1 Existing Conditions... 3 Intersection Volume Conditions... 5 Intersection Operations... 9 Safety
MEMO VIA . Ms. Amy Roth DPS Director, City of Three Rivers. To:
 MEMO To: Ms. Amy Roth DPS Director, City of Three Rivers VIA EMAIL From: Michael J. Labadie, PE Julie M. Kroll, PE, PTOE Brandon Hayes, PE, P.Eng. Fleis & VandenBrink Date: January 5, 2017 Re: Proposed
TRAFFIC IMPACT ANALYSIS
 TRAFFIC IMPACT ANALYSIS Emerald Isle Commercial Development Prepared by SEPI Engineering & Construction Prepared for Ark Consulting Group, PLLC March 2016 I. Executive Summary A. Site Location The Emerald
L1TILE BEARS DAY CARE TRANSPORTATION IMPACT STUDY FORT COLLINS, COLORADO MAY Prepared for:
 L1TILE BEARS DAY CARE TRANSPORTATION IMPACT STUDY FORT COLLINS, COLORADO MAY 2012 Prepared for: Hillside Construction, Inc. 216 Hemlock Street, Suite B Fort Collins, CO 80534 Prepared by: DELICH ASSOCIATES
2.0 Development Driveways. Movin Out June 2017
 Movin Out June 2017 1.0 Introduction The proposed Movin Out development is a mixed use development in the northeast quadrant of the intersection of West Broadway and Fayette Avenue in the City of Madison.
Highway 18 BNSF Railroad Overpass Feasibility Study Craighead County. Executive Summary
 Highway 18 BNSF Railroad Overpass Feasibility Study Craighead County Executive Summary October 2014 Highway 18 BNSF Railroad Overpass Feasibility Study Craighead County Executive Summary October 2014 Prepared
Alpine Highway to North County Boulevard Connector Study
 Alpine Highway to North County Boulevard Connector Study prepared by Avenue Consultants March 16, 2017 North County Boulevard Connector Study March 16, 2017 Table of Contents 1 Summary of Findings... 1
BARRHAVEN FELLOWSHIP CRC 3058 JOCKVALE ROAD OTTAWA, ONTARIO TRANSPORTATION BRIEF. Prepared for:
 BARRHAVEN FELLOWSHIP CRC 3058 JOCKVALE ROAD OTTAWA, ONTARIO TRANSPORTATION BRIEF Prepared for: Barrhaven Fellowship CRC 3058 Jockvale Road Ottawa, ON K2J 2W7 December 7, 2016 116-649 Report_1.doc D. J.
MEMORANDUM. Figure 1. Roundabout Interchange under Alternative D
 MEMORANDUM Date: To: Liz Diamond, Dokken Engineering From: Subject: Dave Stanek, Fehr & Peers Western Placerville Interchanges 2045 Analysis RS08-2639 Fehr & Peers has completed a transportation analysis
DLZ OHIO, US 322 #10 ODOT SAFETY ANALYST 2010 REPORT OCTOBER 2012
 DLZ OHIO, INC. CUY-322-13.60-14.20 SAFETY STUDY US 322 #10 ODOT SAFETY ANALYST 2010 REPORT OCTOBER 2012 Cuyahoga Study Location Prepared for: The Ohio Department of Transportation District 12 5500 Transportation
Appendix J Traffic Impact Study
 MRI May 2012 Appendix J Traffic Impact Study Level 2 Traffic Assessment Limited Impact Review Appendix J [This page was left blank intentionally.] www.sgm-inc.com Figure 1. Site Driveway and Trail Crossing
INTERSECTION CONTROL EVALUATION
 INTERSECTION CONTROL EVALUATION Trunk Highway 22 and CSAH 21 (E Hill Street/Shanaska Creek Road) Kasota, Le Sueur County, Minnesota November 2018 Trunk Highway 22 and Le Sueur CSAH 21 (E Hill Street/Shanaska
Southern Windsor County 2016 Traffic Count Program Summary April 2017
 Southern Windsor County 2016 Traffic Count Program Summary April 2017 The Southern Windsor County Regional Planning Commission (the RPC ) has been monitoring traffic at 19 locations throughout the southern
Traffic Feasibility Study
 Traffic Feasibility Study Town Center South Robbinsville Township, Mercer County, New Jersey December 19, 2017 Prepared For Robbinsville Township Department of Community Development 2298 Route 33 Robbinsville,
TRAFFIC IMPACT STUDY DERRY GREEN CORPORATE BUSINESS PARK MILTON SECONDARY PLAN MODIFICATION
 TRAFFIC IMPACT STUDY DERRY GREEN CORPORATE BUSINESS PARK MILTON SECONDARY PLAN MODIFICATION TRAFFIC IMPACT STUDY DERRY GREEN CORPORATE BUSINESS PARK MILTON SECONDARY PLAN MODIFICATION DECEMBER 24 UPDATED
Date: February 7, 2017 John Doyle, Z-Best Products Robert Del Rio. T.E. Z-Best Traffic Operations and Site Access Analysis
 Memorandum Date: February 7, 07 To: From: Subject: John Doyle, Z-Best Products Robert Del Rio. T.E. Z-Best Traffic Operations and Site Access Analysis Introduction Hexagon Transportation Consultants, Inc.
DRAFT TRANSPORTATION IMPACT STUDY CASTILIAN REDEVELOPMENT PROJECT
 DRAFT TRANSPORTATION IMPACT STUDY CASTILIAN REDEVELOPMENT PROJECT Prepared for: Submitted by: 299 Lava Ridge Ct. Suite 2 Roseville, CA. 95661 June 212 TABLE OF CONTENTS 1. Introduction... 1 Project Location
V. DEVELOPMENT OF CONCEPTS
 Martin Luther King, Jr. Drive Extension FINAL Feasibility Study Page 9 V. DEVELOPMENT OF CONCEPTS Throughout the study process several alternative alignments were developed and eliminated. Initial discussion
Interstate Operations Study: Fargo-Moorhead Metropolitan Area Simulation Results
 NDSU Dept #2880 PO Box 6050 Fargo, ND 58108-6050 Tel 701-231-8058 Fax 701-231-6265 www.ugpti.org www.atacenter.org Interstate Operations Study: Fargo-Moorhead Metropolitan Area 2025 Simulation Results
Downtown One Way Street Conversion Technical Feasibility Report
 Downtown One Way Street Conversion Technical Feasibility Report As part of the City s Transportation Master Plan, this report reviews the technical feasibility of the proposed conversion of the current
King County Metro. Columbia Street Transit Priority Improvements Alternative Analysis. Downtown Southend Transit Study. May 2014.
 King County Metro Columbia Street Transit Priority Improvements Alternative Analysis Downtown Southend Transit Study May 2014 Parametrix Table of Contents Introduction... 1 Methodology... 1 Study Area...
MERIVALE PRIORITY SQUARE 2852 MERIVALE ROAD CITY OF OTTAWA TRANSPORTATION BRIEF. Prepared for: ONT Inc. 25 Winding Way Nepean, Ontario K2C 3H1
 MERIVALE PRIORITY SQUARE 2852 MERIVALE ROAD CITY OF OTTAWA TRANSPORTATION BRIEF Prepared for: 2190986ONT Inc. 25 Winding Way Nepean, Ontario K2C 3H1 October 6, 2010 110-502 Report_1.doc D. J. Halpenny
Clean Harbors Canada, Inc.
 Clean Harbors Canada, Inc. Proposed Lambton Landfill Expansion Environmental Assessment Terms of Reference Transportation Assessment St. Clair Township, Ontario September 2009 itrans Consulting Inc. 260
Section 5.0 Traffic Information
 Section 5.0 Traffic Information 10.0 TRANSPORTATION MDM Transportation Consultants, Inc. (MDM) has prepared an evaluation of transportation impacts for the proposed evaluation for the expansion of the
BROWARD BOULEVARD CORRIDOR TRANSIT STUDY
 BROWARD BOULEVARD CORRIDOR TRANSIT STUDY FM # 42802411201 EXECUTIVE SUMMARY July 2012 GOBROWARD Broward Boulevard Corridor Transit Study FM # 42802411201 Executive Summary Prepared For: Ms. Khalilah Ffrench,
Craig Scheffler, P.E., PTOE HNTB North Carolina, P.C. HNTB Project File: Subject
 TECHNICAL MEMORANDUM To Kumar Neppalli Traffic Engineering Manager Town of Chapel Hill From Craig Scheffler, P.E., PTOE HNTB North Carolina, P.C. Cc HNTB Project File: 38435 Subject Obey Creek TIS 2022
Appendix C-5: Proposed Refinements Rail Operations and Maintenance Facility (ROMF) Traffic Impact Analysis. Durham-Orange Light Rail Transit Project
 Traffic Impact Analysis. Durham-Orange Light Rail Transit Project") Appendix C-5: Proposed Refinements Rail Operations and Maintenance Facility (ROMF) Traffic Impact Analysis Durham-Orange Light Rail Transit Project July 25, 218 ROMF Transportation Impact Analysis Version
Appendix C-5: Proposed Refinements Rail Operations and Maintenance Facility (ROMF) Traffic Impact Analysis Durham-Orange Light Rail Transit Project July 25, 218 ROMF Transportation Impact Analysis Version
ZINFANDEL LANE / SILVERADO TRAIL INTERSECTION TRAFFIC ANALYSIS
 ZINFANDEL LANE / SILVERADO TRAIL INTERSECTION TRAFFIC ANALYSIS UPDATED TRAFFIC STUDY FOR THE PROPOSED RAYMOND VINEYARDS WINERY USE PERMIT MODIFICATION #P11-00156 AUGUST 5, 2014 PREPARED BY: OMNI-MEANS,
Corridor Analysis. For COUNTY LINE ROAD (S.R. 1001) CORRIDOR. located in. File No March 2019
 CORRIDOR. located in. File No March 2019") Corridor Analysis For COUNTY LINE ROAD (S.R. 1001) CORRIDOR located in Radnor Township Delaware County Lower Merion Township Montgomery County File No. 16-11060-02 March 2019 Prepared For: Radnor Township
Corridor Analysis For COUNTY LINE ROAD (S.R. 1001) CORRIDOR located in Radnor Township Delaware County Lower Merion Township Montgomery County File No. 16-11060-02 March 2019 Prepared For: Radnor Township
Downtown Lee s Summit Parking Study
 Downtown Lee s Summit Parking Study As part of the Downtown Lee s Summit Master Plan, a downtown parking and traffic study was completed by TranSystems Corporation in November 2003. The parking analysis
RE: A Traffic Impact Statement for a proposed development on Quinpool Road
 James J. Copeland, P.Eng. GRIFFIN transportation group inc. 30 Bonny View Drive Fall River, NS B2T 1R2 May 31, 2018 Ellen O Hara, P.Eng. Project Engineer DesignPoint Engineering & Surveying Ltd. 200 Waterfront
Proposed Inn at Bellefield Traffic Impact Assessment
 Proposed Inn at Bellefield Traffic Impact Assessment Town of Hyde Park Dutchess County, New York Prepared for: T-Rex Hyde Park Owner LLC 500 Mamroneck Avenue, Suite 300 Harrison, NY 10528 June 21, 2017
Proposed location of Camp Parkway Commerce Center. Vicinity map of Camp Parkway Commerce Center Southampton County, VA
 Proposed location of Camp Parkway Commerce Center Vicinity map of Camp Parkway Commerce Center Southampton County, VA Camp Parkway Commerce Center is a proposed distribution and industrial center to be
Interstate Operations Study: Fargo-Moorhead Metropolitan Area Simulation Output
 NDSU Dept #2880 PO Box 6050 Fargo, ND 58108-6050 Tel 701-231-8058 Fax 701-231-6265 www.ugpti.org www.atacenter.org Interstate Operations Study: Fargo-Moorhead Metropolitan Area 2015 Simulation Output Technical
CTfastrak Expansion. Stakeholder Meeting #4 Manchester Town Hall June 3, 2016
 CTfastrak Expansion Stakeholder Meeting #4 Manchester Town Hall June 3, 2016 Today s Agenda Phase I Update 2016 Service Plan Implementation Schedule & Cost Update Phase II Services Timeline Market Analysis
THE CORNERSTONE APARTMENTS TRAFFIC IMPACT STUDY R&M PROJECT NO
 THE CORNERSTONE APARTMENTS SITUATED AT N/E/C OF STAUDERMAN AVENUE AND FOREST AVENUE VILLAGE OF LYNBROOK NASSAU COUNTY, NEW YORK TRAFFIC IMPACT STUDY R&M PROJECT NO. 2018-089 September 2018 50 Elm Street,
TRAFFIC IMPACT STUDY FOR SONIC DRIVE-IN RESTAURANT. Vallejo, CA. Prepared For:
 TRAFFIC IMPACT STUDY FOR SONIC DRIVE-IN RESTAURANT Vallejo, CA Prepared For: ELITE DRIVE-INS, INC. 2190 Meridian Park Blvd, Suite G Concord, CA 94520 Prepared By: KD Anderson & Associates 3853 Taylor Road,
To: File From: Adrian Soo, P. Eng. Markham, ON File: Date: August 18, 2015
 Memo To: From: Adrian Soo, P. Eng. Markham, ON : 165620021 Date: Reference: E.C. Row Expressway, Dominion Boulevard Interchange, Dougall Avenue Interchange, and Howard 1. Review of Interchange Geometry
105 Toronto Street South, Markdale Transportation Impact Study. Paradigm Transportation Solutions Limited
 105 Toronto Street South, Markdale Transportation Impact Study Paradigm Transportation Solutions Limited December 2016 Project Summary Project Number 162060 December 2016 Client Zelinka Priamo Ltd 318
Lacey Gateway Residential Phase 1
 Lacey Gateway Residential Phase Transportation Impact Study April 23, 203 Prepared for: Gateway 850 LLC 5 Lake Bellevue Drive Suite 02 Bellevue, WA 98005 Prepared by: TENW Transportation Engineering West
ANDERSON PROPERTY SITE ANALYSIS
 ANDERSON PROPERTY SITE ANALYSIS Introduction The Montgomery County Department of Transportation (MCDOT) initiated a feasibility study in the fall of 2012 to evaluate the need for transit service expansion
TRAFFIC IMPACT ANALYSIS. for MILTON SQUARE
 TRAFFIC IMPACT ANALYSIS for MILTON SQUARE US Route 7 Milton, Vermont March 5, 2008 LAMOUREUX & DICKINSON 14 Morse Drive Essex Junction, Vermont 05452 (802) 878-4450 Traffic Impact Assessment EXECUTIVE
TRAFFIC IMPACT STUDY. USD #497 Warehouse and Bus Site
 TRAFFIC IMPACT STUDY for USD #497 Warehouse and Bus Site Prepared by: Jason Hoskinson, PE, PTOE BG Project No. 16-12L July 8, 216 145 Wakarusa Drive Lawrence, Kansas 6649 T: 785.749.4474 F: 785.749.734
City of Pacific Grove
 Regional Study Utilizing Caltrans Intersection Evaluation Section 7: City of Pacific Grove s: FIRST STREET AT CENTRAL AVENUE Transportation Agency for Monterey County Prepared by Transportation Agency
Letter of Transmittal
 Letter of Transmittal To: Chris Lovell City of Richmond Hill Date: 5/2/6 Job 2582 Re: Richmond Hill-South Bryan County Transportation STudy WE ARE SENDING YOU THE FOLLOWING ITEMS ( attached) ( under separate
DEVELOPMENT PROPERTY 1627 MAXIME STREET CITY OF OTTAWA TRANSPORTATION OVERVIEW. Prepared for: Subhas Bhargava. July 9, Overview_1.
 DEVELOPMENT PROPERTY 1627 MAXIME STREET CITY OF OTTAWA TRANSPORTATION OVERVIEW Prepared for: Subhas Bhargava July 9, 2015 115-620 Overview_1.doc D. J. Halpenny & Associates Ltd. Consulting Transportation
Vanier Parkway and Presland Road Residential Development Transportation Impact Study
 Vanier Parkway and Presland Road Residential Development Transportation Impact Study Final Report (Revised) March 2011 Submitted to: Groupe Lépine Ottawa Project No. 09-1613 Submitted by: Groupe Lépine
Study Area and Location District PSA Ward ANC Phase Description C Planned Suitland Parkway Westbound at Stanton Road Southeast
 Speed Limit and Safety Nexus Studies for Automated Enforcement Locations in the District of Columbia Suitland Parkway at Stanton Road SE Study Area and Location District PSA Ward ANC Phase Description
INTERSECTION ANALYSIS PARK AVENUE AND BRADDOCK ROAD (FROSTBURG, MD) FOR LENHART TRAFFIC CONSULTING, INC.
 FOR LENHART TRAFFIC CONSULTING, INC.") INTERSECTION ANALYSIS FOR PARK AVENUE AND BRADDOCK ROAD (FROSTBURG, MD) Prepared for: City of Frostburg, Maryland & Allegany County Commissioners Prepared by: LENHART TRAFFIC CONSULTING, INC. TRAFFIC ENGINEERING
INTERSECTION ANALYSIS FOR PARK AVENUE AND BRADDOCK ROAD (FROSTBURG, MD) Prepared for: City of Frostburg, Maryland & Allegany County Commissioners Prepared by: LENHART TRAFFIC CONSULTING, INC. TRAFFIC ENGINEERING
Subarea Study. Manning Avenue (CSAH 15) Corridor Management and Safety Improvement Project. Final Version 1. Washington County.
 Corridor Management and Safety Improvement Project. Final Version 1. Washington County.") Subarea Study Manning Avenue (CSAH 15) Corridor Management and Safety Improvement Project Final Version 1 Washington County June 12, 214 SRF No. 138141 Table of Contents Introduction... 1 Forecast Methodology
Subarea Study Manning Avenue (CSAH 15) Corridor Management and Safety Improvement Project Final Version 1 Washington County June 12, 214 SRF No. 138141 Table of Contents Introduction... 1 Forecast Methodology
Traffic Impact Analysis 5742 BEACH BOULEVARD MIXED USE PROJECT
 Traffic Impact Analysis 5742 BEACH BOULEVARD MIXED USE PROJECT CITY OF BUENA PARK Prepared by Project No. 14139 000 April 17 th, 2015 DKS Associates Jeffrey Heald, P.E. Rohit Itadkar, T.E. 2677 North Main
West Hills Shopping Centre Lowe s Expansion Traffic Impact Study
 West Hills Shopping Centre Lowe s Expansion Traffic Impact Study Prepared for: Armel Corporation January 2015 Paradigm Transportation Solutions Ltd. 22 King Street South, Suite 300 Waterloo ON N2J 1N8
The major roadways in the study area are State Route 166 and State Route 33, which are shown on Figure 1-1 and described below:
 3.5 TRAFFIC AND CIRCULATION 3.5.1 Existing Conditions 3.5.1.1 Street Network DRAFT ENVIRONMENTAL IMPACT REPORT The major roadways in the study area are State Route 166 and State Route 33, which are shown
2016 Congestion Report
 2016 Congestion Report Metropolitan Freeway System May 2017 2016 Congestion Report 1 Table of Contents Purpose and Need...3 Introduction...3 Methodology...4 2016 Results...5 Explanation of Percentage Miles
Volume 1 Traffic Impact Analysis Turtle Creek Boulevard Dallas, Texas. Kimley-Horn and Associates, Inc. Dallas, Texas.
 Volume 1 Traffic Impact Analysis 2727 Dallas, Texas June 18, 2018 Kimley-Horn and Associates, Inc. Dallas, Texas Project #064523000 Registered Firm F-928 Traffic Impact Analysis 2727 Dallas, Texas Prepared
4.14 TRANSPORTATION AND CIRCULATION
 4.14 TRANSPORTATION AND CIRCULATION 4.14.1 Summary Table 4.14-1 summarizes the identified environmental impacts, proposed mitigation measures, and residual impacts of the proposed project with regard to
Metropolitan Freeway System 2007 Congestion Report
 Metropolitan Freeway System 2007 Congestion Report Minnesota Department of Transportation Office of Traffic, Safety and Operations Freeway Operations Section Regional Transportation Management Center March
Memorandum. To: Sue Polka, City Engineer, City of Arden Hills. From: Sean Delmore, PE, PTOE. Date: June 21, 2017
 Memorandum engineering planning environmental construction 701 Xenia Avenue South Suite 300 Minneapolis, MN 55416 Tel: 763-541-4800 Fax: 763-541-1700 To: Sue Polka, City Engineer, City of Arden Hills From:
LATSON INTERCHANGE DEVELOPMENT TRAFFIC STUDIES. Genoa Township, Livingston County, MI
 LATSON INTERCHANGE DEVELOPMENT TRAFFIC STUDIES Genoa Township, Livingston County, MI DRAFT TRAFFIC STUDY FOR I-96 AT LATSON RD INTERCHANGE Livingston County CS 47065 JN 101622C Submitted to: Michigan Department
Speed Limit and Safety Nexus Studies for Automated Enforcement Locations in the District of Columbia 400 Block 14th Street SW
 Speed Limit and Safety Nexus Studies for Automated Enforcement Locations in the District of Columbia 4 Block 4th Street SW Study Area and Location District PSA Ward ANC Phase Description 27 6 6D Existing
EXCEPTION TO STANDARDS REPORT
 EXCEPTION TO STANDARDS REPORT PROJECT DESCRIPTION AND NEED The project is located in Section 6, Township 23 North, Range 9 East and Section 31 Township 24 North, Range 9 East, in the Town of Stockton,
Safety Assessment. Intersection of Route 29 (Seminole Trail) and Ashwood Blvd (Route 1670). Albemarle County
 and Ashwood Blvd (Route 1670). Albemarle County") Safety Assessment for Intersection of Route 29 (Seminole Trail) and Ashwood Blvd (Route 1670). Albemarle County Prepared by: VIRGINIA DEPARTMENT OF TRANSPORTATION Northwestern Regional Operations - Traffic
Safety Assessment for Intersection of Route 29 (Seminole Trail) and Ashwood Blvd (Route 1670). Albemarle County Prepared by: VIRGINIA DEPARTMENT OF TRANSPORTATION Northwestern Regional Operations - Traffic
Escondido Marriott Hotel and Mixed-Use Condominium Project TRAFFIC IMPACT ANALYSIS REPORT
 Escondido Marriott Hotel and Mixed-Use Condominium Project TRAFFIC IMPACT ANALYSIS REPORT Prepared for Phelps Program Management 420 Sixth Avenue, Greeley, CO 80632 Prepared by 5050 Avenida Encinas, Suite
Metropolitan Freeway System 2013 Congestion Report
 Metropolitan Freeway System 2013 Congestion Report Metro District Office of Operations and Maintenance Regional Transportation Management Center May 2014 Table of Contents PURPOSE AND NEED... 1 INTRODUCTION...
I-820 (East) Project Description. Fort Worth District. Reconstruct Southern I-820/SH 121 Interchange
 Project Description. Fort Worth District. Reconstruct Southern I-820/SH 121 Interchange") I-820 (East) Project Description Fort Worth District Reconstruct Southern I-820/SH 121 Interchange I-820 from approximately 2,000 feet north of Pipeline Road/Glenview Drive to approximately 3,200 feet
I-820 (East) Project Description Fort Worth District Reconstruct Southern I-820/SH 121 Interchange I-820 from approximately 2,000 feet north of Pipeline Road/Glenview Drive to approximately 3,200 feet
Traffic Management Plan and Queuing Analysis Lakehill Preparatory School Z Hillside Drive, Dallas, TX October 27, 2015
 Traffic Management Plan and Queuing Analysis Lakehill Preparatory School Z145-235 2720 Hillside Drive, Dallas, TX October 27, 2015 Introduction: The Lakehill Preparatory School is located on the northeast
APPENDIX B Traffic Analysis
 APPENDIX B Traffic Analysis Rim of the World Unified School District Reconfiguration Prepared for: Rim of the World School District 27315 North Bay Road, Blue Jay, CA 92317 Prepared by: 400 Oceangate,
Appendix H TRAFFIC IMPACT ANALYSIS
 Appendix H TRAFFIC IMPACT ANALYSIS Teichert Boca Quarry Expansion Traffic Impact Analysis Prepared for Teichert Aggregates Prepared by TRANSPORTATION CONSULTANTS, INC. LSC Transportation Consultants, Inc.
Provide an overview of the development proposal including projected site traffic volumes;
 December 19, 2013 File: 163600935 Attention: Troy Elliott Carl Elliott Limited 15-1831 Robertson Road PO Box 11117 Nepean, Ontario K1H 7T8 Dear Mr. Elliott, Reference: 2235 and 2265 Robertson Road Transportation
Missouri Seat Belt Usage Survey for 2017
 Missouri Seat Belt Usage Survey for 2017 Conducted for the Highway Safety & Traffic Division of the Missouri Department of Transportation by The Missouri Safety Center University of Central Missouri Final
Traffic Impact Study for Proposed Olive Boulevard Development
 Traffic Impact Study for Proposed 11330 Olive Boulevard Development Creve Coeur, Missouri July 7, 2017 Prepared For: 11330 Olive Boulevard Development 11330 Olive Boulevard Creve Coeur, Missouri 63141
SOUTHERN GATEWAY. Transportation and Trinity River Project Committee 11 May 2015
 SOUTHERN GATEWAY Transportation and Trinity River Project Committee 11 May 2015 Southern Gateway Project History Began in 2001 as a Major Investment Study [ MIS ], Schematic, and Environmental Assessment
South Lexington Transportation Study Lexington, Massachusetts
 South Lexington Transportation Study Lexington, Massachusetts Preliminary Findings and Options for Consideration Businesses Meeting 10/10/13 Town of Lexington Engineering and Planning Departments Meeting
Signal System Timing and Phasing Program SAMPLE. Figure 1: General Location Map. Second St.
 I. Overview Consultant A was retained by the Ohio Department of Transportation to conduct traffic signal timing analyses on approximately one mile of roadway on between the Main Street and the Fourth Street