Metropolitan Freeway System 2007 Congestion Report
|
|
|
- Michael Shaw
- 5 years ago
- Views:
Transcription


1 Metropolitan Freeway System 2007 Congestion Report Minnesota Department of Transportation Office of Traffic, Safety and Operations Freeway Operations Section Regional Transportation Management Center March 2008
2
3 Table of Contents PURPOSE AND NEED...1 INTRODUCTION...1 METHODOLOGY RESULTS...3 EXPLANATION OF CONGESTION GRAPH METRO CONGESTION FREEWAY MAP: AM METRO CONGESTION FREEWAY MAP: PM...11 APPENDIX A: CENTERLINE HIGHWAY MILES MEASURED FOR CONGESTION...14 APPENDIX B: MAP OF AREAS WITH SURVEILLANCE DETECTORS...15
4 Purpose and Need Introduction The Metropolitan Freeway System Congestion Report is prepared annually to document those segments of the freeway system that experience recurring congestion. This report is prepared for these purposes: Identification of locations that are under capacity Project planning Resource allocation (e.g., RTMC equipment, incident management planning) Construction zone planning Department performance measures What is Congestion? What is a shock wave? Mn/DOT defines congestion as traffic flowing at speeds less than or equal to 45 miles per hour (M.P.H.). This definition does not include delays that may occur at speeds greater than 45 M.P.H. The 45 M.P.H. speed limit was selected since it is the speed where shock waves can propagate. These conditions also pose higher risks of crashes. Although shock waves can occur above 45 M.P.H. there is a distinct difference in traffic flow above and below the 45 M.P.H. limit. A shock wave is a phenomenon where the majority of vehicles brake in a traffic stream. Situations that can create shock waves include: Changes in the characteristics of the roadway, such as a lane ending, a change in grade or curvature, narrowing of shoulders, or an entrance ramp where large traffic volumes enter the freeway. Large volumes of traffic at major intersections with high weaving volumes and entrance ramps causing the demand on the freeway to reach or exceed design capacity. Traffic incidents, such as crashes, stalled vehicles, animals or debris on the roadway, adverse weather conditions and special events. Drivers habits can also contribute to shock waves. Drivers inattentiveness can result in minor speed variations in dense traffic or sudden breaking in more general conditions. In these situations, shock waves move upstream toward oncoming traffic at rates varying according to the density and speed of traffic. As the rate of movement of the shock wave increases, the potential for rear end or sideswipe collisions increases. Multiple shock waves can spread from one instance of a slowdown in traffic flow and blend together 1
5 Methodology with other extended periods of stop-and-go traffic upstream. This condition is referred to as a breakdown in traffic. Usually it lasts the remainder of the peak period if traffic volumes are close to or above design capacity. These types of breakdowns are typical in bottleneck locations on the freeway system. Mn/DOT began collecting and processing congestion data in Since this time, Mn/DOT has improved its data processing and changes in methodology have occurred. These changes as well as variables affecting localized and region-wide traffic volumes, such as ramp metering algorithms, make it difficult to compare congestion from one year to the next. The following are key dates on the progression of developing congestion information in the metro area: 1989: Mn/DOT formed a committee to evaluate congestion on Twin Cities metro freeways : Rapid expansion of the freeway management systems Late 1990 s: Change in approach from reducing congestion to slowing projected increases in congestion : Evaluation and adjustments of ramp metering 2002: Completion of detection calibration How is Congestion Measured? For this report, Mn/DOT derived its congestion data using two processes: Surveillance detectors in roadways Field observations Electronic surveillance systems exist on about 95% of the metro area freeway system. For this report, the Regional Transportation Management Center collected October 2007 data from 2,700 detectors embedded in the mainline roadway (of a total of 4,800 surveillance detectors that also includes ramps) of the Twin Cities freeways. Generally, the month of October is used for congestion reports since it reflects regular patterns of traffic. With summer vacation season over and school back in session, commuter traffic flows return to normal levels. During the month of October, most summer road construction projects are completed and weather conditions are still generally favorable. The RTMC evaluates the 648 directional miles of the Twin Cities urban freeway system to develop the AM Plus PM % of Directional Metro Freeway Miles Congested. It tracks the percentage of miles that operate at speeds below 45 MPH for any length of time during 2
6 the AM and PM peak periods (648 miles AM and 648 miles PM). Mainline detectors are located in each lane of a freeway at approximately one-half mile intervals. Individual lane detectors located at a given location along the same direction of the freeway constitute a station. For the purpose of this report, if any station s detectors experience congestion at any given time, the station is identified as congested. Speed data is based on the median value of data collected at detector locations. Median values are calculated for each fiveminute interval for the periods of 6:00 AM to 9:00 AM and 2:00 PM to 7:00 PM for the fourteen midweek days in October. Mn/DOT uses medians, rather than averages, to minimize the effects of extremes in the data. This process mitigates those occasions of roadwork lane closures, significant traffic incidents, and one-time traffic events not related to daily commuting patterns. Historical Data Since large construction projects can dramatically change traffic patterns, these patterns can be highly variable due to ongoing changes to the roadway and these projects often remove surveillance detectors from operation. This report, therefore, uses historical data from before a project began in some instances. These areas are described in a map in Appendix B (along with the areas without detection) and include the Unweave project at the interchange of I-694 and I-35E and the Crosstown project at the interchange of I-35W and TH Results The total number of congested miles increased for the first time in four years from 267 in 2006 to 305 in This growth can be attributed to both the absence of capacity-adding project completions this past year and the collapse of the I-35W bridge. The launch of the Crosstown project, at the interchange of I-35W and TH 62, is also a significant factor that affected congestion levels this past year. Though the long term trend is upwards, from 2004 to 2006, congestion declined each year. Many factors affect congestion levels (local economy, population growth, gas prices, transit ridership),but these recent declines are largely attributed to the completion of major capacity-adding projects. These included: New bridge carrying I-35E over the Mississippi River Addition of lanes in each direction along I-694 from Brooklyn Boulevard to I Congested miles is calculated as the sum of those experiencing at least five minutes of recurring congestion during the AM peak period and those during the PM peak period. 3
7 Addition of lanes in both direction along I-494 from TH 55 to France Avenue Addition of lanes on I-94 over McKnight Road Addition of lanes on TH 100 at TH 7 Completion of the first of two bridges carrying I-494 over the Mississippi River adding a lane in each direction However, this past year saw the completion of no major capacity adding projects. The long term trend of growth in congestion can be seen throughout the region. The collapse of the I-35W bridge had impacts on congestion in both its immediate area and also across much of the Twin Cities freeway network. Although congestion likely would have increased, it would not have been so dramatic without the collapse of this bridge. Several temporary projects were immediately completed afterwards to minimize the affect it has had on congestion levels. These include 2 : TH 280 conversion to a freeway and addition of a Traffic Management System I-94 conversion of shoulders to an additional lane in each direction between TH 280 and I-35W TH 100 addition of auxiliary lane southbound between Duluth St and TH 55 and addition of one lane to northbound exit to eastbound I-694 I-694 addition of one eastbound lane at TH 47 I-35W at 4 th Ave southbound exit and northbound entrance converted to two lanes The value of these projects is demonstrated by the shoulder lanes added to I-94. Daily trips increased in this area from 175,000 before the I-35W bridge collapse to 210,000 afterwards. Congestion in the AM peak is less now and in the PM it remains stable since last year. Despite efforts to minimize the impacts of the bridge collapse, congestion on parallel routes grew dramatically, including in the AM on TH 280, TH 100, TH 169 and I-694 westbound west of I-35W. In the PM peak, TH 280, I-694 and TH 100 experienced the most dramatic increases in congestion. Significant congestion relief is anticipated with the completion of the I-35W bridge and with major capacity improvements that are currently in progress. These projects include the Unweave the Weave project at the interchange of I-35E and I-694 and the Crosstown project at I-35W and Highway A complete list of projects is available at 4
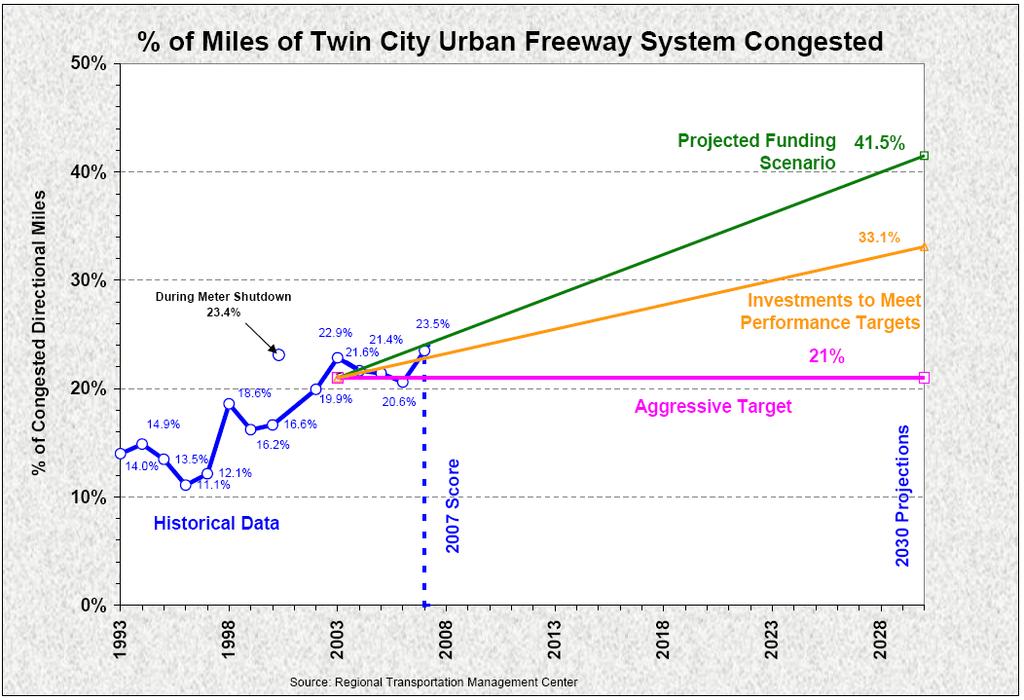
8 The Congestion Management Planning Study was completed in 2007 to identify low cost projects that can have a high benefit in helping to mitigate congestion in the near term. These projects are similar to projects completed in recent years on I-394 from Louisiana Ave. to Highway 169 or on Highway 100 at Highway 7. Mn/DOT is continuing to explore the feasibility of similar projects that could be implemented in the next two years. Mn/DOT plans to manage congestion on additional fronts with the Urban Partnership Agreement (UPA), a joint proposal by Mn/DOT and the Metropolitan Council to improve transit use and traffic speed on I-35W and Highway 77 from Minneapolis to the southern suburbs. The proposal includes bus rapid transit, park-and-ride lots, high occupancy toll lanes similar to I-394 and the promotion of telecommuting. Although the three years before this one saw a number of important project completions that lead to some modest declines in congested miles on the Twin Cities freeways and this year s dramatic increase was largely related to the collapse of the I-35W bridge. Without additions to freeway capacity, we can expect the future to continue the long term trend of growth in congestion. Explanation of % Miles of Twin City Urban Freeway System Congested Graph Mitigating congestion is critical to the travelling public. Mn/DOT has limited resources to slow projected increases in congestion. The graph that follows represents levels of congestion based on three scenarios. The projected congestion levels are based on anticipated growth in traffic volumes (Vehicles Miles Traveled). The green line shows the projected funding scenario, where there are no new funding sources or increases in funding. Congestion could increase to the level of 41.5% by the year However, if Mn/DOT received the investment needed to meet its performance targets, as established in the 2003 Statewide Plan, congestion would be expected to grow to the level of 33% by The gold line demonstrates this scenario. This long-term moderate target reduces the rate of growth in congestion. Finally, maintaining congestion at the aggressive target of 21% (pink line) though the year 2030 would require a significant, yet undetermined, commitment. 5
9 6
10 AM Plus PM Miles of Directional Congestion Early 2000 Late Severe Moderate Low Total AM Plus PM Percent of Miles of Directional Congestion Early 2000 Late * 2005* 2006* 2007* Severe 0.5% 1.1% 1.3% 3.7% 2.7% 3.2% 9.8% 5.5% 6.4% 5.5% 6.4% 4.9% 6.3% Moderate 4.1% 3.7% 4.2% 5.0% 6.0% 5.3% 7.3% 6.6% 8.2% 8.1% 7.3% 7.5% 8.6% Low 8.9% 6.3% 6.6% 9.9% 7.6% 8.2% 6.4% 7.9% 8.2% 8.0% 7.8% 8.2% 8.6% Total 13.5% 11.1% 12.1% 18.6% 16.2% 16.6% 23.4% 19.9% 22.9% 21.6% 21.4% 20.6% 23.5% For years prior to 2004, Percent of miles of directional congestion = am + pm miles (table above) / 1280 miles miles = 320 centerline miles X 2 (directional miles) X 2 (am and pm) * For 2004 to 2007 Percent of miles of directional congestion = am + pm miles (table above) / 1296 miles miles = 324 centerline miles X 2 (directional miles) X 2 (am and pm) 7
11 8
12 Directional Metro Freeway Miles Congested 6:00 AM - 9:00 AM Congested Interstate Miles (AM) 1 Highway Early 2000 Late I I-35E I-35W I I-394/TH I I Subtotal Congested Trunk Highway Miles (AM) 1, 2 Highway Early 2000 Late TH TH TH TH TH TH TH TH TH TH TH TH Subtotal Total Congested Metro Freeway Miles (AM) Grand Total Before 2004: Interstate Miles = 450 TH Miles = 190 Total Miles = 640 Since 2004: Interstate Miles = 450 TH Miles = 198 Total Miles = Congestion was measured for the freeway segments of trunk highways 9

13 Miles and Duration of Congestion Metro Interstate and Trunk Highways 6:00-9:00 AM 2-3 Hrs 1-2 Hrs < 1 Hr Miles of Congestion 10
14 11
15 Directional Metro Freeway Miles Congested 2:00 PM - 7:00 PM Highway Congested Interstate Miles (PM) 1 Early 2000 Late I I-35E I-35W I I-394/TH I I Subtotal Highway Congested Trunk Highway Miles (PM) 1, 2 Early 2000 Late TH TH TH TH TH TH TH TH TH TH TH TH Subtotal Total Congested Metro Freeway Miles (PM) Grand Total Before 2004: Interstate Miles = 450 TH Miles = 190 Total Miles = 640 Since 2004: Interstate Miles = 450 TH Miles = 198 Total Miles = Congestion was measured for the freeway segments of trunk highways 12
16 Miles and Duration of Congestion Metro Interstate and Trunk Highways 2:00-7:00 PM >3 Hrs 2-3 Hrs 1-2 Hrs < 1 Hr Miles of Congestion 13
17 Appendix A: Centerline Miles Measured for Congestion Highway Centerline Miles of Highway I North split to Hwy 8 & South split to Cty 70 I-35E 41 Entire Highway I-35W 44 Entire Highway I I-394/TH Limits Additions for 2007 Rogers to St. Croix River Central Ave to Downtown Mpls I Entire Highway I Entire Highway Subtotal 225 Highway TH 5 3 I-494 to Miss Rvr TH Hwy 169 to I-35W TH 36 7 I-35W to English St TH 52 6 I-94 to Upper 55th St TH I-494 to Hwy 55 TH th St to I-35W TH I-494 to I-694 TH I-494 to 77th Ave TH I-494 to Hwy 62 TH Hwy 169 to Hwy 10 TH th St to Hwy 62 TH I-94 to Broadway Subtotal 99 Grand Total
18 Appendix B: 2007 Metro Freeway Data Sources 15
Metropolitan Freeway System 2013 Congestion Report
 Metropolitan Freeway System 2013 Congestion Report Metro District Office of Operations and Maintenance Regional Transportation Management Center May 2014 Table of Contents PURPOSE AND NEED... 1 INTRODUCTION...
2016 Congestion Report
 2016 Congestion Report Metropolitan Freeway System May 2017 2016 Congestion Report 1 Table of Contents Purpose and Need...3 Introduction...3 Methodology...4 2016 Results...5 Explanation of Percentage Miles
Interstate Operations Study: Fargo-Moorhead Metropolitan Area Simulation Results
 NDSU Dept #2880 PO Box 6050 Fargo, ND 58108-6050 Tel 701-231-8058 Fax 701-231-6265 www.ugpti.org www.atacenter.org Interstate Operations Study: Fargo-Moorhead Metropolitan Area 2025 Simulation Results
Interstate Operations Study: Fargo-Moorhead Metropolitan Area Simulation Output
 NDSU Dept #2880 PO Box 6050 Fargo, ND 58108-6050 Tel 701-231-8058 Fax 701-231-6265 www.ugpti.org www.atacenter.org Interstate Operations Study: Fargo-Moorhead Metropolitan Area 2015 Simulation Output Technical
Investigation of the Impact the I-94 ATM System has on the Safety of the I-94 Commons High Crash Area
 Investigation of the Impact the I-94 ATM System has on the Safety of the I-94 Commons High Crash Area John Hourdos and Stephen Zitzow Minnesota Traffic Observatory Overview Project Objectives I- 94 High
IH 45 (GULF FWY) IH 10 (Katy Fwy) to IH 610 S (South Loop) 2010 Rank: Rank: 12
 IH 10 (Katy Fwy) to IH 610 S (South Loop) 2010 Rank: Rank: 12") Mobility Investment Priorities Project Houston IH 45 IH 45 (GULF FWY) IH 10 (Katy Fwy) to IH 610 S (South Loop) Current Conditions From IH 10 to IH 610 south, IH 45 is a 6- to 9-lane facility with three
Mobility Investment Priorities Project Houston IH 45 IH 45 (GULF FWY) IH 10 (Katy Fwy) to IH 610 S (South Loop) Current Conditions From IH 10 to IH 610 south, IH 45 is a 6- to 9-lane facility with three
JCE 4600 Basic Freeway Segments
 JCE 4600 Basic Freeway Segments HCM Applications What is a Freeway? divided highway with full control of access two or more lanes for the exclusive use of traffic in each direction no signalized or stop-controlled
US 59 (SOUTHWEST FWY) IH 610 (West Loop) to SH 288 (South Fwy)
 IH 610 (West Loop) to SH 288 (South Fwy)") Mobility Investment Priorities Project Houston US 59 US 59 (SOUTHWEST FWY) IH 610 (West Loop) to SH 288 (South Fwy) Current Conditions From IH 610 West to SH 288, US 59 operates with four or five lanes
Mobility Investment Priorities Project Houston US 59 US 59 (SOUTHWEST FWY) IH 610 (West Loop) to SH 288 (South Fwy) Current Conditions From IH 610 West to SH 288, US 59 operates with four or five lanes
5. OPPORTUNITIES AND NEXT STEPS
 5. OPPORTUNITIES AND NEXT STEPS When the METRO Green Line LRT begins operating in mid-2014, a strong emphasis will be placed on providing frequent connecting bus service with Green Line trains. Bus hours
Introduction and Background Study Purpose
 Introduction and Background The Brent Spence Bridge on I-71/75 across the Ohio River is arguably the single most important piece of transportation infrastructure the Ohio-Kentucky-Indiana (OKI) region.
I-820 (East) Project Description. Fort Worth District. Reconstruct Southern I-820/SH 121 Interchange
 Project Description. Fort Worth District. Reconstruct Southern I-820/SH 121 Interchange") I-820 (East) Project Description Fort Worth District Reconstruct Southern I-820/SH 121 Interchange I-820 from approximately 2,000 feet north of Pipeline Road/Glenview Drive to approximately 3,200 feet
I-820 (East) Project Description Fort Worth District Reconstruct Southern I-820/SH 121 Interchange I-820 from approximately 2,000 feet north of Pipeline Road/Glenview Drive to approximately 3,200 feet
Performance Measure Summary - Grand Rapids MI. Performance Measures and Definition of Terms
 Performance Measure Summary - Grand Rapids MI There are several inventory and performance measures listed in the pages of this Urban Area Report for the years from 1982 to 2014. There is no single performance
Organization. SDOT Date and Commute Seattle. Dave Sowers, Deputy Program Administrator
 Organization SDOT Date and Commute Seattle Dave Sowers, Deputy Program Administrator October 22, 2018 TODAY S FOCUS The big picture #Realign99 closure/opening the tunnel Removal, decommissioning, surface
2 EXISTING ROUTE STRUCTURE AND SERVICE LEVELS
 2 EXISTING ROUTE STRUCTURE AND SERVICE LEVELS In the Study Area, as in most of the Metro Transit network, there are two distinct route structures. The base service structure operates all day and the peak
SOUTHERN GATEWAY. Transportation and Trinity River Project Committee 11 May 2015
 SOUTHERN GATEWAY Transportation and Trinity River Project Committee 11 May 2015 Southern Gateway Project History Began in 2001 as a Major Investment Study [ MIS ], Schematic, and Environmental Assessment
RTID Travel Demand Modeling: Assumptions and Method of Analysis
 RTID Travel Demand Modeling: Assumptions and Method of Analysis Overall Model and Scenario Assumptions The Puget Sound Regional Council s (PSRC) regional travel demand model was used to forecast travel
IMPROVEMENT CONCEPTS
 IMPROVEMENT CONCEPTS for the South Novato Transit Hub Study Prepared by: January 11, 2010 DKS Associates With Wilbur Smith Associates IMPROVEMENT CONCEPTS Chapter 1: Introduction 1. INTRODUCTION The strategic
Operating & Maintenance Cost Results Report
 Operating & Maintenance Cost Results Report Prepared for: Hennepin County Regional Railroad Authority Prepared by: Connetics Transportation Group Under Contract To: Kimley-Horn and Associates FINAL June
HIGHWAY 28 FUNCTIONAL DESIGN
 HIGHWAY 28 FUNCTIONAL DESIGN PUBLIC OPEN HOUSE #1 WEDNESDAY, MARCH 12, 2014 Stantec Presenters: Brad Vander Heyden, Project Engineer Neal Cormack, Project Manager Dave Parker, Project Engineer Beth Thola,
Escondido Marriott Hotel and Mixed-Use Condominium Project TRAFFIC IMPACT ANALYSIS REPORT
 Escondido Marriott Hotel and Mixed-Use Condominium Project TRAFFIC IMPACT ANALYSIS REPORT Prepared for Phelps Program Management 420 Sixth Avenue, Greeley, CO 80632 Prepared by 5050 Avenida Encinas, Suite
Evaluation of Renton Ramp Meters on I-405
 Evaluation of Renton Ramp Meters on I-405 From the SE 8 th St. Interchange in Bellevue to the SR 167 Interchange in Renton January 2000 By Hien Trinh Edited by Jason Gibbens Northwest Region Traffic Systems
Performance Measure Summary - Minneapolis-St. Paul MN-WI. Performance Measures and Definition of Terms
 Performance Measure Summary - Minneapolis-St. Paul MN-WI There are several inventory and performance measures listed in the pages of this Urban Area Report for the years from 1982 to 2014. There is no
New Buck O Neil (U. S. 169) Crossing Benefit-Cost Analysis. Kansas City, Missouri
 Crossing Benefit-Cost Analysis. Kansas City, Missouri") New Buck O Neil (U. S. 169) Crossing Benefit-Cost Analysis Kansas City, Missouri New Buck O Neil (U. S. 169) Crossing Benefit-Cost Analysis prepared for Kansas City, Missouri prepared by Burns & McDonnell
New Buck O Neil (U. S. 169) Crossing Benefit-Cost Analysis Kansas City, Missouri New Buck O Neil (U. S. 169) Crossing Benefit-Cost Analysis prepared for Kansas City, Missouri prepared by Burns & McDonnell
US 81 Bypass of Chickasha Environmental Assessment Public Meeting
 US 81 Bypass of Chickasha Environmental Assessment Public Meeting March 14, 2013 Introductions ODOT FHWA SAIC Meeting Purpose Present need for bypass Provide responses to 10/04/11 public meeting comments
EXECUTIVE SUMMARY. The following is an outline of the traffic analysis performed by Hales Engineering for the traffic conditions of this project.
 EXECUTIVE SUMMARY This study addresses the traffic impacts associated with the proposed Shopko redevelopment located in Sugarhouse, Utah. The Shopko redevelopment project is located between 1300 East and
Subarea Study. Manning Avenue (CSAH 15) Corridor Management and Safety Improvement Project. Final Version 1. Washington County.
 Corridor Management and Safety Improvement Project. Final Version 1. Washington County.") Subarea Study Manning Avenue (CSAH 15) Corridor Management and Safety Improvement Project Final Version 1 Washington County June 12, 214 SRF No. 138141 Table of Contents Introduction... 1 Forecast Methodology
Subarea Study Manning Avenue (CSAH 15) Corridor Management and Safety Improvement Project Final Version 1 Washington County June 12, 214 SRF No. 138141 Table of Contents Introduction... 1 Forecast Methodology
Performance Measure Summary - Large Area Sum. Performance Measures and Definition of Terms
 Performance Measure Summary - Large Area Sum There are several inventory and performance measures listed in the pages of this Urban Area Report for the years from 1982 to 2014. There is no single performance
Performance Measure Summary - Medium Area Sum. Performance Measures and Definition of Terms
 Performance Measure Summary - Medium Area Sum There are several inventory and performance measures listed in the pages of this Urban Area Report for the years from 1982 to 2014. There is no single performance
Alpine Highway to North County Boulevard Connector Study
 Alpine Highway to North County Boulevard Connector Study prepared by Avenue Consultants March 16, 2017 North County Boulevard Connector Study March 16, 2017 Table of Contents 1 Summary of Findings... 1
MILLERSVILLE PARK TRAFFIC IMPACT ANALYSIS ANNE ARUNDEL COUNTY, MARYLAND
 MILLERSVILLE PARK TRAFFIC IMPACT ANALYSIS ANNE ARUNDEL COUNTY, MARYLAND Prepared for: Department of Public Works Anne Arundel County Prepared by: URS Corporation 4 North Park Drive, Suite 3 Hunt Valley,
Performance Measures and Definition of Terms
 Performance Measure Summary - All 471 Areas Sum There are several inventory and performance measures listed in the pages of this Urban Area Report for the years from 1982 to 2014. There is no single performance
To: File From: Adrian Soo, P. Eng. Markham, ON File: Date: August 18, 2015
 Memo To: From: Adrian Soo, P. Eng. Markham, ON : 165620021 Date: Reference: E.C. Row Expressway, Dominion Boulevard Interchange, Dougall Avenue Interchange, and Howard 1. Review of Interchange Geometry
New Jersey Turnpike Authority Interchange 6 to 9 Widening Program
 New Jersey Turnpike Authority Interchange 6 to 9 Widening Program Tuesday, September 18, 2007 Public Hearings: Time: 5:00 PM - 8:00 PM Wednesday, September 19, 2007 Senior Center 3 Municipal Drive Bordentown,
TRAFFIC PARKING ANALYSIS
 TRAFFIC PARKING ANALYSIS NAPA FLEA MARKET COUNTY OF NAPA Prepared for: Tom Harding Napa-Vallejo Flea Market 33 Kelly Road American Canyon, CA 9453 Prepared by: 166 Olympic Boulevard, Suite 21 Walnut Creek,
Transitways. Chapter 4
 4 Transitways Figure 4-1: Hiawatha LRT Train at the Lake Street/Midtown Station The 23 Transportation Policy Plan identifies a network of transitway corridors to be implemented by 23. Transitways recommended
Traffic Engineering Study
 Traffic Engineering Study Bellaire Boulevard Prepared For: International Management District Technical Services, Inc. Texas Registered Engineering Firm F-3580 November 2009 Executive Summary has been requested
Performance Measure Summary - Austin TX. Performance Measures and Definition of Terms
 Performance Measure Summary - Austin TX There are several inventory and performance measures listed in the pages of this Urban Area Report for the years from 1982 to 2014. There is no single performance
Performance Measure Summary - Pittsburgh PA. Performance Measures and Definition of Terms
 Performance Measure Summary - Pittsburgh PA There are several inventory and performance measures listed in the pages of this Urban Area Report for the years from 1982 to 2014. There is no single performance
Performance Measure Summary - New Orleans LA. Performance Measures and Definition of Terms
 Performance Measure Summary - New Orleans LA There are several inventory and performance measures listed in the pages of this Urban Area Report for the years from 1982 to 2014. There is no single performance
Performance Measure Summary - Portland OR-WA. Performance Measures and Definition of Terms
 Performance Measure Summary - Portland OR-WA There are several inventory and performance measures listed in the pages of this Urban Area Report for the years from 1982 to 2014. There is no single performance
Performance Measure Summary - Oklahoma City OK. Performance Measures and Definition of Terms
 Performance Measure Summary - Oklahoma City OK There are several inventory and performance measures listed in the pages of this Urban Area Report for the years from 1982 to 2014. There is no single performance
Performance Measure Summary - Seattle WA. Performance Measures and Definition of Terms
 Performance Measure Summary - Seattle WA There are several inventory and performance measures listed in the pages of this Urban Area Report for the years from 1982 to 2014. There is no single performance
Performance Measure Summary - Buffalo NY. Performance Measures and Definition of Terms
 Performance Measure Summary - Buffalo NY There are several inventory and performance measures listed in the pages of this Urban Area Report for the years from 1982 to 2014. There is no single performance
Performance Measure Summary - Fresno CA. Performance Measures and Definition of Terms
 Performance Measure Summary - Fresno CA There are several inventory and performance measures listed in the pages of this Urban Area Report for the years from 1982 to 2014. There is no single performance
Performance Measure Summary - Hartford CT. Performance Measures and Definition of Terms
 Performance Measure Summary - Hartford CT There are several inventory and performance measures listed in the pages of this Urban Area Report for the years from 1982 to 2014. There is no single performance
Performance Measure Summary - Boise ID. Performance Measures and Definition of Terms
 Performance Measure Summary - Boise ID There are several inventory and performance measures listed in the pages of this Urban Area Report for the years from 1982 to 2014. There is no single performance
Performance Measure Summary - Tucson AZ. Performance Measures and Definition of Terms
 Performance Measure Summary - Tucson AZ There are several inventory and performance measures listed in the pages of this Urban Area Report for the years from 1982 to 2014. There is no single performance
Performance Measure Summary - Wichita KS. Performance Measures and Definition of Terms
 Performance Measure Summary - Wichita KS There are several inventory and performance measures listed in the pages of this Urban Area Report for the years from 1982 to 2014. There is no single performance
Performance Measure Summary - Spokane WA. Performance Measures and Definition of Terms
 Performance Measure Summary - Spokane WA There are several inventory and performance measures listed in the pages of this Urban Area Report for the years from 1982 to 2014. There is no single performance
Performance Measure Summary - Washington DC-VA-MD. Performance Measures and Definition of Terms
 Performance Measure Summary - Washington DC-VA-MD There are several inventory and performance measures listed in the pages of this Urban Area Report for the years from 1982 to 2014. There is no single
Performance Measure Summary - Charlotte NC-SC. Performance Measures and Definition of Terms
 Performance Measure Summary - Charlotte NC-SC There are several inventory and performance measures listed in the pages of this Urban Area Report for the years from 1982 to 2014. There is no single performance
Performance Measure Summary - Toledo OH-MI. Performance Measures and Definition of Terms
 Performance Measure Summary - Toledo OH-MI There are several inventory and performance measures listed in the pages of this Urban Area Report for the years from 1982 to 2014. There is no single performance
Performance Measure Summary - Pensacola FL-AL. Performance Measures and Definition of Terms
 Performance Measure Summary - Pensacola FL-AL There are several inventory and performance measures listed in the pages of this Urban Area Report for the years from 1982 to 2014. There is no single performance
Performance Measure Summary - Omaha NE-IA. Performance Measures and Definition of Terms
 Performance Measure Summary - Omaha NE-IA There are several inventory and performance measures listed in the pages of this Urban Area Report for the years from 1982 to 2014. There is no single performance
Performance Measure Summary - Allentown PA-NJ. Performance Measures and Definition of Terms
 Performance Measure Summary - Allentown PA-NJ There are several inventory and performance measures listed in the pages of this Urban Area Report for the years from 1982 to 2014. There is no single performance
Performance Measure Summary - Nashville-Davidson TN. Performance Measures and Definition of Terms
 Performance Measure Summary - Nashville-Davidson TN There are several inventory and performance measures listed in the pages of this Urban Area Report for the years from 1982 to 2014. There is no single
Performance Measure Summary - Corpus Christi TX. Performance Measures and Definition of Terms
 Performance Measure Summary - Corpus Christi TX There are several inventory and performance measures listed in the pages of this Urban Area Report for the years from 1982 to 2014. There is no single performance
CEDAR AVENUE TRANSITWAY Implementation Plan Update
 CEDAR AVENUE TRANSITWAY Implementation Plan Update EECUTIVE SUMMARY DECEMBER 2015 Executive Summary In 2013, the Twin Cities metropolitan area s first bus rapid transit (BRT) line, the METRO Red Line,
FIELD APPLICATIONS OF CORSIM: I-40 FREEWAY DESIGN EVALUATION, OKLAHOMA CITY, OK. Michelle Thomas
 Proceedings of the 1998 Winter Simulation Conference D.J. Medeiros, E.F. Watson, J.S. Carson and M.S. Manivannan, eds. FIELD APPLICATIONS OF CORSIM: I-40 FREEWAY DESIGN EVALUATION, OKLAHOMA CITY, OK Gene
APPENDIX C1 TRAFFIC ANALYSIS DESIGN YEAR TRAFFIC ANALYSIS
 APPENDIX C1 TRAFFIC ANALYSIS DESIGN YEAR TRAFFIC ANALYSIS DESIGN YEAR TRAFFIC ANALYSIS February 2018 Highway & Bridge Project PIN 6754.12 Route 13 Connector Road Chemung County February 2018 Appendix
Table Existing Traffic Conditions for Arterial Segments along Construction Access Route. Daily
 5.8 TRAFFIC, ACCESS, AND CIRCULATION This section describes existing traffic conditions in the project area; summarizes applicable regulations; and analyzes the potential traffic, access, and circulation
Maryland Gets to Work
 I-695/Leeds Avenue Interchange Reconstruction Baltimore County Reconstruction of the I-695/Leeds Avenue interchange including replacing the I-695 Inner Loop bridges over Benson Avenue, Amtrak s Northeast
Performance Measure Summary - Boston MA-NH-RI. Performance Measures and Definition of Terms
 Performance Measure Summary - Boston MA-NH-RI There are several inventory and performance measures listed in the pages of this Urban Area Report for the years from 1982 to 2014. There is no single performance
Performance Measure Summary - El Paso TX-NM. Performance Measures and Definition of Terms
 Performance Measure Summary - El Paso TX-NM There are several inventory and performance measures listed in the pages of this Urban Area Report for the years from 1982 to 2014. There is no single performance
Performance Measure Summary - Louisville-Jefferson County KY-IN. Performance Measures and Definition of Terms
 Performance Measure Summary - Louisville-Jefferson County KY-IN There are several inventory and performance measures listed in the pages of this Urban Area Report for the years from 1982 to 2014. There
FREQUENTLY ASKED QUESTIONS
 THE PROJECT Last updated on 9/8/16 FREQUENTLY ASKED QUESTIONS What s happening on Highway 169? The Minnesota Department of Transportation (MnDOT) is planning to rebuild and repair the infrastructure on
state, and federal levels, complete reconstruction and expansion of I35 in the near future is not likely.
 Project Summary Johnson County is an economic engine for the Kansas City metropolitan area and the State of Kansas. It s the fastest growing county in the state of Kansas and has the nation s third highest
TRAFFIC IMPACT STUDY. USD #497 Warehouse and Bus Site
 TRAFFIC IMPACT STUDY for USD #497 Warehouse and Bus Site Prepared by: Jason Hoskinson, PE, PTOE BG Project No. 16-12L July 8, 216 145 Wakarusa Drive Lawrence, Kansas 6649 T: 785.749.4474 F: 785.749.734
Performance Measure Summary - New York-Newark NY-NJ-CT. Performance Measures and Definition of Terms
 Performance Measure Summary - New York-Newark NY-NJ-CT There are several inventory and performance measures listed in the pages of this Urban Area Report for the years from 1982 to 2014. There is no single
Central Park Drives Traffic Management Overview
 Central Park Drives Traffic Management Overview Spring 2015 New York City Department of Transportation Existing Traffic Management From Labor Day thru Last Day of NYC Public School: 8-10 AM weekdays (Southbound)
V. DEVELOPMENT OF CONCEPTS
 Martin Luther King, Jr. Drive Extension FINAL Feasibility Study Page 9 V. DEVELOPMENT OF CONCEPTS Throughout the study process several alternative alignments were developed and eliminated. Initial discussion
METRO Orange Line BRT American Boulevard Station Options
 METRO Orange Line BRT American Boulevard Station Options Bloomington City Council Work Session November 18, 2013 Christina Morrison BRT/Small Starts Project Office Coordinating Planning and Design AMERICAN
SH 249 IN GRIMES COUNTY. Open House April 3, 2014
 SH 249 IN GRIMES COUNTY Open House April 3, 2014 Meeting Agenda Purpose of Meeting Today: Review the purpose and need for the SH 249 Grimes County project Review the proposed project and alternatives Discuss
The major roadways in the study area are State Route 166 and State Route 33, which are shown on Figure 1-1 and described below:
 3.5 TRAFFIC AND CIRCULATION 3.5.1 Existing Conditions 3.5.1.1 Street Network DRAFT ENVIRONMENTAL IMPACT REPORT The major roadways in the study area are State Route 166 and State Route 33, which are shown
Road User Cost Analysis
 Road User Cost Analysis I-45 Gulf Freeway at Beltway 8 Interchange CSJ #500-03-382 1994 Texas Transportation Institute ROAD USER COST ANALYSIS CSJ #500-03-382 The Texas Department of Transportation (TxDOT)
Open House. Highway212. Meetings. Corridor Access Management, Safety & Phasing Plan. 5:30 to 6:30 p.m. - Southwest Corridor Transportation Coalition
 Welcome Meetings 5:30 to 6:30 p.m. - Southwest Corridor Transportation Coalition 6:30 to 8:00 p.m. - Open House Why is Highway 212 Project Important? Important Arterial Route Local Support Highway 212
Sound Transit Operations July 2016 Service Performance Report. Ridership
 Ridership Total Boardings by Mode Mode Jul-15 Jul-16 % YTD-15 YTD-16 % ST Express 1,618,779 1,545,852-4.5% 10,803,486 10,774,063-0.3% Sounder 333,000 323,233-2.9% 2,176,914 2,423,058 11.3% Tacoma Link
FREQUENTLY ASKED QUESTIONS
 THE PROJECT Last updated on 2/19/16 FREQUENTLY ASKED QUESTIONS What s happening on Highway 169? The Minnesota Department of Transportation (MnDOT) is planning to rebuild and repair the infrastructure on
March 2, 2017 Integrating Transportation Planning, Project Development, and Project Programming
 COORDINATION WITH VDOT DISTRICTS TO DELIVER IMPLEMENTABLE IMPROVEMENT PROJECTS March 2, 2017 Integrating Transportation Planning, Project Development, and Project Programming PRESENTATION OUTLINE What
1 On Time Performance
 MEMORANDUM: US 29 Travel Time & OTP To: From: Joana Conklin, Montgomery County DOT James A. Bunch, SWAI Subject: US 29 Travel Time and On Time Performance Analysis Date: This memorandum documents the US
3.1 Introduction Transportation Elements and Study Area Meeting the Need for the Project
 Chapter 3 Transportation Environment and Consequences 3. Introduction This chapter summarizes the characteristics of the transportation system in the East Link Project vicinity and discusses potential
I-35W Past, Present, and Future: METRO Orange Line
 I-35W Past, Present, and Future: METRO Orange Line 2018 State Public Transportation Partnerships Conference Charles Carlson Director, BRT Projects Metro Transit Charles.Carlson@metrotransit.org Metro Transit:
PROJECT: Wilkinson Road Corridor Improvement Traffic Management Planning Project SUBJECT: Traffic Analysis
 TECHNICAL MEMORANDUM DATE: September 10, 2014 PROJECT 5861.03 NO: PROJECT: Wilkinson Road Corridor Improvement Traffic Management Planning Project SUBJECT: Traffic Analysis TO: Steve Holroyd - District
Simulating Trucks in CORSIM
 Simulating Trucks in CORSIM Minnesota Department of Transportation September 13, 2004 Simulating Trucks in CORSIM. Table of Contents 1.0 Overview... 3 2.0 Acquiring Truck Count Information... 5 3.0 Data
I-405 Corridor Master Plan
 Southern California Association of Governments I-405 Corridor Master Plan Presentation to Streets and Freeways Subcommittee October 13, 2015 1 Presentation Overview Expectations and Approach Corridor Performance
Technical Feasibility Report
 Prepared For: Bow Concord I-93 Improvements Project Bow and Concord, NH Prepared By: 53 Regional Drive Concord, NH 03301 NHDOT Project # 13742 Federal Project #T-A000(018) September 2018 TABLE OF CONTENTS
Appendix J Traffic Impact Study
 MRI May 2012 Appendix J Traffic Impact Study Level 2 Traffic Assessment Limited Impact Review Appendix J [This page was left blank intentionally.] www.sgm-inc.com Figure 1. Site Driveway and Trail Crossing
BROWARD BOULEVARD CORRIDOR TRANSIT STUDY
 BROWARD BOULEVARD CORRIDOR TRANSIT STUDY FM # 42802411201 EXECUTIVE SUMMARY July 2012 GOBROWARD Broward Boulevard Corridor Transit Study FM # 42802411201 Executive Summary Prepared For: Ms. Khalilah Ffrench,
King County Metro. Columbia Street Transit Priority Improvements Alternative Analysis. Downtown Southend Transit Study. May 2014.
 King County Metro Columbia Street Transit Priority Improvements Alternative Analysis Downtown Southend Transit Study May 2014 Parametrix Table of Contents Introduction... 1 Methodology... 1 Study Area...
Mountainland Association of Governments SPRINGVILLE-SPANISH FORK AREA TRANSPORTATION STUDY APRIL 2012
 Mountainland Association of Governments SPRINGVILLE-SPANISH FORK AREA TRANSPORTATION STUDY APRIL 2012 PLANNING FOR OUR FUTURE Planners with the Mountainland Association of Governments (MAG) have evaluated
Sherman Oaks Community Traffic Plan
 Sherman Oaks is a community that is geographically bound by the Santa Monica mountains on its southern boundary, and the ever-expanding San Fernando Valley on its western, northern, and eastern boundaries.
TRAFFIC IMPACT ANALYSIS
 TRAFFIC IMPACT ANALYSIS Emerald Isle Commercial Development Prepared by SEPI Engineering & Construction Prepared for Ark Consulting Group, PLLC March 2016 I. Executive Summary A. Site Location The Emerald
Chapter 7: Travel Demand Analysis. Chapter 8. Plan Scenarios. LaSalle Community Center. Image Credit: Town of LaSalle
 Chapter 7: Travel Demand Analysis Chapter 8 Plan Scenarios LaSalle Community Center. Image Credit: Town of LaSalle 164 Chapter 8: Plan Scenarios Moving Ahead for Progress in the 21 st Century Act (MAP
SANTA BARBARA COUNTY ASSOCIATION OF GOVERNMENTS GOLETA RAMP METERING STUDY MAY 8, 2018 FINAL REPORT
 SANTA BARBARA COUNTY ASSOCIATION OF GOVERNMENTS GOLETA RAMP METERING STUDY MAY 8, 2018 FINAL REPORT May 8, 2018 Page i TABLE OF CONTENTS Table of Contents... i 1. Introduction... 1 1.1 Summary... 1 2.
Executive Summary. Draft Environmental Impact Statement/Environmental Impact Report ES-1
 Executive Summary Introduction The Eastside Transit Corridor Phase 2 Project is a vital public transit infrastructure investment that would provide a transit connection to the existing Metro Gold Line
Southern Windsor County 2016 Traffic Count Program Summary April 2017
 Southern Windsor County 2016 Traffic Count Program Summary April 2017 The Southern Windsor County Regional Planning Commission (the RPC ) has been monitoring traffic at 19 locations throughout the southern
The Jack A. Markell Trail Delaware s Bicycle Highway New England Bike- Walk Summit
 The Jack A. Markell Trail Delaware s Bicycle Highway 2018 New England Bike- Walk Summit The Jack A. Markell Trail Sometimes a very difficult project, including significant investment and perseverance,
LAWRENCE TRANSIT CENTER LOCATION ANALYSIS 9 TH STREET & ROCKLEDGE ROAD / 21 ST STREET & IOWA STREET LAWRENCE, KANSAS
 LAWRENCE TRANSIT CENTER LOCATION ANALYSIS 9 TH STREET & ROCKLEDGE ROAD / 21 ST STREET & IOWA STREET LAWRENCE, KANSAS TRAFFIC IMPACT STUDY FEBRUARY 214 OA Project No. 213-542 TABLE OF CONTENTS 1. INTRODUCTION...
Central Loop Bus Rapid Transit
 Central Loop Bus Rapid Transit Transportation Goals of the Chicago Central Area ACTION Plan, page 2-6 Central Area Plan Improve Transit in Central Area Improve Pedestrian Environment Manage Traffic Circulation
Strategies to keep people and goods moving in and through Seattle
 Strategies to keep people and goods moving in and through Seattle SR 99 Closure and the Seattle Squeeze 2018-2024 DON Information Session Department of Transportation Delridge Community Center November