Corridor Analysis. For COUNTY LINE ROAD (S.R. 1001) CORRIDOR. located in. File No March 2019
|
|
|
- Moris Rodgers
- 5 years ago
- Views:
Transcription

1 Corridor Analysis For COUNTY LINE ROAD (S.R. 1001) CORRIDOR located in Radnor Township Delaware County Lower Merion Township Montgomery County File No March 2019 Prepared For: Radnor Township & Lower Merion Township Prepared By: Gilmore & Associates, Inc. Engineers Land Surveyors Planners GIS Consultants 65 E. Butler Avenue New Britain, PA
2
3 County Line Road Corridor Transportation Evaluation March 2019 TABLE OF CONTENTS APPENDICES... ii LIST OF FIGURES... ii LIST OF TABLES... iii Corridor Improvements... iv Intersection Improvements... v I. INTRODUCTION AND BACKGROUND... 1 STUDY AREA... 1 II. EXISTING ROADWAY NETWORK... 2 FIELD OBSERVATIONS... 4 SIGHT DISTANCE ANALYSIS... 5 CRASH ANALYSIS... 5 III. EXISTING CONDITIONS LEVEL OF SERVICE ANALYSIS TRAVEL TIME ANALYSIS IV. PEDESTRIAN AND BICYCLE FACILITY EVALUATION PEDESTRIAN FACILITIES BICYCLE FACILITIES V. RECOMMENDED IMPROVEMENTS OUT OF SCOPE INVESTIGATIONS VI. CONCLUSIONS i
4 County Line Road Corridor Transportation Evaluation March 2019 APPENDICES Appendix A: Stakeholder s Meeting Minutes Appendix B: Sight Distance Evaluation Appendix C: Collision Diagrams Appendix D: Traffic Signal Warrant Analyses Appendix E: Existing Traffic Count Data Appendix F: Capacity Analysis Procedures Appendix G: Existing Traffic Signal Permit Plans Appendix H: Capacity Analysis Results Appendix I: Existing Level of Service and Delay Appendix J: Existing 95 th Percentile Queues Appendix K: Pedestrian and Vehicle Clearance Calculations Appendix L: PennDOT Traffic Information Repository Data LIST OF FIGURES Figure 1 Project Location Map Figure 2A Existing Conditions AM Peak Hour Traffic Volumes Figure 2B Existing Conditions PM Peak Hour Traffic Volumes Figure 2C Existing Conditions Saturday Midday Peak Hour Traffic Volumes Figure 3A Existing Conditions AM Peak Hour Levels of Service Figure 3B Existing Conditions PM Peak Hour Levels of Service Figure 3C Existing Conditions Midday Peak Hour Levels of Service Figure 4A Existing Conditions Conceptual Sketch Figure 4B Existing Conditions Conceptual Sketch Figure 4C Existing Conditions Conceptual Sketch Figure 4D Existing Conditions Conceptual Sketch Figure 5A Proposed Conceptual Sketch w/ Recommendations Figure 5B Proposed Conceptual Sketch w/ Recommendations Figure 5C Proposed Conceptual Sketch w/ Recommendations Figure 5D Proposed Conceptual Sketch w/ Recommendations Figure 6A AM Peak Hour Levels of Service w/ Improvements Figure 6B PM Peak Hour Levels of Service w/ Improvements Figure 6C Midday Peak Hour Levels of Service w/ Improvements Figure 7 Level of Service, Delay & Queue Comparison Sketch ii
5 County Line Road Corridor Transportation Evaluation March 2019 LIST OF TABLES Table 1 Roadway Data Summary Table 2 Crash Data Table 3 Sight Distance Table 4 Existing Roadway Deficiencies Table 5 Level of Service Analysis: Center Turn Lane Through Entire Study Area Table 6 95 th Percentile Queue Analysis: Center Turn Lane Through Entire Study Area Table 7 Level of Service Analysis: Center Turn Lane Excluding Conestoga Road and Bryn Mawr Avenue Table 8 Corridor Travel Times Table 9 Overall Corridor Travel Time Improvement Table 10 Improvement Cost Summary iii
6 County Line Road Corridor Transportation Evaluation March 2019 EXECUTIVE SUMMARY Gilmore & Associates, Inc. (G&A) was retained through a cooperative effort between Radnor Township and Lower Merion Township to perform a transportation evaluation of traffic and pedestrian improvements along the County Line Road corridor from Lancaster Avenue (S.R. 0030) to Haverford Road (S.R. 1001) & County Line Road/ Landover Road (S.R. 1009). The County Line Road Corridor is a four-lane roadway that experiences heavy vehicular volumes as well as high pedestrian traffic due to the proximity of residential homes and apartments, the SEPTA Bryn Mawr Station, various restaurants and retail stores, the Bryn Mawr Hospital and the north/south movement of pedestrian traffic moving to and from the Lancaster Avenue (S.R. 0030) corridor. The report identifies improvements along the corridor to improve the traffic flow and overall safety for all roadway users. For purposes of this evaluation, County Line Road, Old Lancaster Road are considered north/south roadways and Lancaster Avenue, Conestoga Road and all other County Line Road cross-streets were considered east/west roadways. The posted 35 mile per hour speed limit compares favorably to the obtained 85 th percentile speeds ranging from 33.6 to 42.7 miles per hour. The following improvements were identified and recommended for the corridor study: Corridor Improvements Provide speed limit signs at ½ mile increments along the corridor as required by Title 75 of the Pennsylvania Vehicle Code 3362(b)(1). Continue to restrict parking for a minimum of 50 feet in advance of all intersections. Provide upgraded pedestrian equipment at signalized intersections, as needed Implement a roadway diet and re-stripe the corridor between Arthur Road and Landover Road from a four lane facility to three lane facility (two-way center leftturn lane with one (1) lane in each direction) with five foot shoulders in both directions of travel Following implementation of a roadway diet from a four lane cross-section to a three lane cross-section, consider reducing the speed from 35 MPH to 25 MPH. Upgrade curb ramps at signalized and unsignalized intersections for Americans with Disabilities Act (ADA) compliancy as needed Refresh pavement markings and pedestrian crossings throughout the corridor Upgrade pedestrian and vehicle clearance times at all signalized intersections as needed Lower Merion Township obtained a Green Light Go grant to install a traffic adaptive system on County Line Road at the intersections of Lindsay Avenue, Bryn Mawr Avenue and Landover Road. Extending the traffic adaptive system in the future to include the intersections of Conestoga Road/Glenbrook Avenue and Roberts Road should be considered. iv
7 County Line Road Corridor Transportation Evaluation March 2019 Intersection Improvements County Line Road and Lancaster Avenue Install an advanced warning signage for RED SIGNAL AHEAD Include curve warning signage for both directions of travel near Arthur Road Modify the length of the concrete median nose on County Line Road at Lancaster Avenue to provide improved left turn movements from Lancaster Avenue County Line Road and Montrose Avenue Construct a traffic signal at the intersection of County Line Road and Montrose Avenue County Line Road and Roberts Road Upon construction of the traffic signal at County Line Road and Montrose Avenue and the center turn lane along County Line Road, re-evaluate left turn movements at Roberts Road. County Line Road and Conestoga Road/Glenbrook Avenue Construct a dedicated left-turn lane along the northbound approach of County Line Road at Conestoga Road & Thomas Avenue/Glenbrook Avenue Implement signal timing adjustments at the intersection of County Line Road and Conestoga Road/Thomas Avenue/Glenbrook Avenue to improve the traffic flow on the major approaches County Line Road and Old Lancaster Road Realign Old Lancaster Road between the northern and southern legs of the intersection to provide a safer through movement for vehicles Investigate the installation of a Rectangular Rapid Flashing Beacon (RRFB) for pedestrians to cross County Line Road at this location adjacent to the Warner Avenue Park and Playground County Line Road and Bryn Mawr Avenue/Railroad Avenue Provide a dotted extension line between the northbound left-turn lane and the inside northbound through lane to provide improved lane assignment for motorists Install a nearside traffic signal head for the northbound left turn lane County Line Road and Landover Road/Haverford Road Provide advanced dilemma zone radar detection at the intersection of County Line Road/Haverford Road & Landover Road Provide an emergency pre-emption system County Line Road and S. Warner Avenue/Old Lancaster Road Reduce the number of driveways servicing the shopping center opposite S. Warner Avenue and Old Lancaster Road v
8 County Line Road Corridor Transportation Evaluation March 2019 With the construction of the identified roadway improvements, it is anticipated the study corridor will experience a marked improvement in traffic flow and overall safety. In addition to the identified roadway improvements, areas to the north and south of the corridor were also studied for potential improvements and are noted in the report. Additional studies are required to further evaluate the issues encountered during this evaluation that were not included in this project scope and are as follows: Lancaster Avenue and Montrose Avenue Install additional warning signage on Lancaster Avenue (both directions) in advance of the existing pedestrian crossing at Lancaster Avenue and Montrose Avenue Investigate the installation of a Rectangular Rapid Flashing Beacon (RRFB) for pedestrians to cross Lancaster Avenue at this location. Conestoga Road and Montrose Avenue Construct sidewalk along the north side of Conestoga Road between Montrose Avenue and Roberts Road Install a crosswalk and pedestrian warning signs for pedestrians to cross Conestoga Road Investigate the installation of a Rectangular Rapid Flashing Beacon (RRFB) for pedestrians to cross Conestoga Road at this location. Conestoga Road and Roberts Road Install DON T BLOCK THE BOX signage and striping at the intersection. vi
9 County Line Road Corridor Transportation Evaluation March 2019 I. INTRODUCTION AND BACKGROUND A corridor analysis was performed along County Line Road (S.R. 1001) within Radnor and Lower Merion Townships in an effort to identify traffic and pedestrian improvements for providing a safer environment for both vehicular and pedestrian traffic. The 0.8 mile corridor lies along County Line Road (S.R. 1001) from the intersection of County Line Road (S.R. 1001) & Lancaster Avenue (S.R. 0030) to Haverford Road (S.R. 1001) & County Line Road/ Landover Road (S.R. 1009). For purposes of this evaluation, County Line Road was considered a north/south roadway and Lancaster Avenue, Montrose Avenue and all other County Line Road cross-streets were considered east/west roadways. County Line Road (S.R. 1001) is a four-lane roadway that experiences heavy vehicular traffic. According to PennDOT s Traffic Information Repository (TIRe) system, the average daily traffic along the corridor varies from 19,260 vehicles near Mondella Avenue to 20,533 vehicles near County Line Road/Landover Road. Villanova University and access to I-476 via Lancaster Avenue (S.R. 0030) is within two miles of the study corridor. No significant development has occurred along the corridor; however, minor intersection improvements were implemented to mitigate traffic over the years. The report will identify recommended improvements along the corridor to accommodate pedestrians and existing traffic volumes while considering stakeholders and known safety concerns. The report was conducted at a macro level; as such, improvements identified in this report have neither been designed nor fully engineered. Engineering, along with additional analyses, may be necessary prior to implementation of any subsequent improvements. A meeting was scheduled on August 23, 2018 with Lower Merion Township and Radnor Township where stakeholders were invited to discuss their concerns for the area surrounding the studied corridor. A second public meeting was held on January 29, 2019 to present the draft report to both Townships. The concerns noted at both meetings were taken into account throughout the course of this study and are summarized in Appendix A. STUDY AREA The following ten intersections were identified by Radnor and Lower Merion Townships for this comprehensive analysis: 1. County Line Road (S.R. 1001) & Lancaster Avenue (S.R. 0030)/ McDonalds Driveway 2. County Line Road (S.R. 1001) & Montrose Avenue 3. County Line Road (S.R. 1001) & Roberts Road 4. County Line Road (S.R. 1001) & Conestoga Road (S.R. 1019) & Thomas Avenue/ Glenbrook Avenue 5. County Line Road (S.R. 1001) & South Warner Avenue 6. County Line Road (S.R. 1001) & Old Lancaster Road 7. County Line Road (S.R. 1001) & Mondella Avenue 8. County Line Road (S.R. 1001) & Lindsay Avenue 9. County Line Road/ Haverford Road (S.R. 1001) & South Bryn Mawr Avenue (S.R. 1032/ S.R. 3038) & Railroad Avenue (S.R. 3047) &Glenbrook Avenue 1
10 County Line Road Corridor Transportation Evaluation March County Line Road/ Haverford Road (S.R. 1001) & Landover Road (S.R. 1009) A project location map is provided in Figure 1. II. EXISTING ROADWAY NETWORK County Line Road (S.R. 1001) is a four lane roadway with an approximate cartway width of 40 feet with four 10 travel lanes; two lanes in both directions, a right-of-way width that varies from feet, and a posted speed limit of 35 miles per hour. Curb and pedestrian facilities exist along the entire corridor from Lancaster Avenue to Haverford Road/ Landover Road. A four foot sidewalk is provided along both sides of County Line Road. The corridor is approximately 0.8 miles with a mix of residential and commercial uses. A more detailed description of each study area intersection and existing pedestrian facilities is provided below. For purposes of this discussion, County Line Road is considered to run north/south. Lancaster Avenue (S.R. 0030) & County Line Road (S.R. 1001)/ McDonald s Driveway The intersection is signalized with a median island along the northbound County Line Road (S.R. 1001) approach. Lancaster Avenue (S.R. 0030) is a four lane roadway with 11 foot travel lanes and a posted speed limit of 25 miles per hour (MPH). Pedestrian facilities are provided for crossing all four legs of the intersection; however, the curb ramps do not appear to meet the latest ADA standards. Montrose Avenue & County Line Road (S.R. 1001) Montrose Avenue is stop controlled at County Line Road and provides access to an apartment complex, single family residential housing and commercial buildings. A varying cartway width of feet is provided with sidewalk on both sides of Montrose Avenue with a posted speed limit of 25 mph. Curb ramps are provided to cross all legs of the intersection; however, the curb ramps do not appear to up to the latest ADA standards and no pedestrian crosswalks are present. Based on information from stakeholders, Montrose Avenue also serves as a connection between Conestoga Road and Lancaster Avenue with high volumes of cross traffic present at County Line Road. On-street parking is permitted on one side of the roadway. S. Roberts Road & County Line Road (S.R. 1001) S. Roberts Road is a two-lane roadway with a posted speed limit of 25 MPH that is stop controlled at County Line Road and provides access to single family residential homes. A cartway width of approximately 22 feet is provided with sidewalks along both sides of Roberts Road east of County Line Road. However, west of County Line Road, sidewalk is only provided on the north side. Pedestrian facilities are provided on all legs of the intersection with the exception of the southwest side of Roberts Road. No crosswalk pavement markings are present and all existing curb ramps do not appear to be up to the latest ADA standards. Conestoga Road (S.R. 1019)/ Thomas Avenue/ Glenbrook Avenue & County Line Road (S.R. 1001) is a five-legged signalized intersection with ADA compliant pedestrian accommodations including push buttons, pedestrian countdown signals and curb ramps. Painted crosswalks are provided on all legs of the intersection with the exception of Conestoga Road west of Glenbrook Avenue where pedestrians are prohibited from 2
11 County Line Road Corridor Transportation Evaluation March 2019 crossing. Conestoga Road has a 26 foot cartway width and a posted speed limit of 35 miles per hour while Thomas Avenue and Glenbrook Avenue have a cartway width of 24 feet and a speed limit of 25 miles per hour. Glenbrook Avenue provides access to the Bryn Mawr SEPTA station and includes two directions of travel from County Line Road to the SEPTA station where the road changes to one way northbound from County Line Road/S. Bryn Mawr Avenue intersection to the SEPTA station. S. Warner Avenue & County Line Road (S.R. 1001) S. Warner Avenue is a one-way roadway departing County Line Road in the eastbound direction towards Lancaster Avenue. The cartway width is 21 feet with a posted speed limit of 25 mph. Pedestrian facilities are provided on all legs of the intersection; however, the existing curb ramps appear to be non-compliant with current ADA standards and there are no marked pedestrian crosswalks. Old Lancaster Road & County Line Road (S.R. 1001) Old Lancaster Road is stop controlled at a skewed T-intersection with County Line Road. Old Lancaster Road has a posted speed limit of 30 MPH and provides a 28 foot cartway width with street parking on the south side of the roadway between County Line Road and Mondella Avenue. Sidewalks are provided on all legs of the intersection in addition it appears the curb ramps are non-compliant with current ADA standards for crossing Old Lancaster Road. Access to Bryn Mawr Hospital is provided from Old Lancaster Road. Mondella Avenue & County Line Road (S.R. 1001) Mondella Avenue intersects County Line Road at a stop-controlled T-intersection and provides a connection to Old Lancaster Road. The cartway width is 24 feet with street parking permitted on the southeast side of the street. Sidewalks are provided on all legs of the intersection and it appears the curb ramps are non-compliant with current ADA standards for crossing Mondella Avenue. Lindsay Avenue & County Line Road (S.R. 1001) Lindsay Avenue is a three-legged signalized intersection that provides access to Bryn Mawr Hospital. Pedestrians are currently only permitted to cross the northbound leg of County Line Road and the westbound leg of Lindsay Avenue via marked crosswalks, ADA compliant curb ramps, push buttons and pedestrian (hand/man) signals. The cartway width along Lindsay Avenue is 30 feet. S. Bryn Mawr Avenue (S.R. 1032/ S.R. 3038)/ Haverford Road (S.R. 1001)/ W. Railroad Avenue (S.R. 3047)/ Glenbrook Avenue & County Line Road (S.R. 1001) is a five-legged signalized intersection with ADA compliant pedestrian accommodations along all legs of the intersection. Railroad Avenue is a one-way road departing the intersection toward the southeast with a 24 foot cartway width and parking permitted on the southwest side of the street. Bryn Mawr Avenue is a two-lane road with a posted speed limit of 40 miles per hour to the west and 30 miles per hour to the east while County Line Road/Haverford Road has a posted speed limit of 35 miles per hour. The cartway width along Bryn Mawr Avenue varies from 28 feet to 47 feet. Glenbrook Avenue is a one-way road departing the intersection toward the northwest providing access to the Bryn Mawr SEPTA Station where the one-way road changes to two directions of travel and intersects County Line Road approximately 160 feet north of the S. Bryn Mawr Avenue/County Line Road intersection. The Glenbrook Avenue leg is 3
12 County Line Road Corridor Transportation Evaluation March 2019 incorporated in the signalized intersection. The cartway width along Glenbrook Avenue is 22 feet with parking permitted on the western side. Updated pedestrian accommodations are provided for crossing Glenbrook Avenue; however, pedestrians are restricted via signage from crossing County Line Road at this location. Haverford Road & County Line Road/ Landover Road is a four-legged signalized intersection with ADA compliant curb ramps. However, updated pedestrian hand/man signals and push buttons are not currently provided at the intersection. Landover Road is a two lane road with a cartway width of 26 feet and a posted speed limit of 35 mph. Sidewalk is not present along Landover Road, and the sidewalk along the east side of County Line Road terminates just south of the intersection. County Line Road/ Lower Merion Township Lower Merion Township recently obtained a PennDOT Green Light Go grant to install a traffic adaptive system on County Line Road at the intersections of Lindsay Avenue, Bryn Mawr Avenue and Landover Road. The existing roadway characteristics of the County Line Road corridor are summarized in Table 1. The posted 35 mile per hour speed limit compares favorably to the obtained 85 th percentile speeds ranging from 33.6 to 42.7 miles per hour along the corridor. Table 1: Existing Roadway Summary ROAD County Line Rd between Montrose Ave and Roberts Rd CARTWAY WIDTH RIGHT- OF-WAY WIDTH POSTED SPEED 85 th PERCENTILE SPEED AVERAGE DAILY TRAFFIC MPH / ,165 1 / 7,547 2 County Line Rd between Roberts Rd and Thomas Ave County Line Rd between Thomas Ave and Mondella Ave MPH / ,799 1 / 7, MPH 38 1 / ,475 1 / 10, Southbound 2 Northbound 3 PennDOT Traffic Information Repository Data (Appendix L) FIELD OBSERVATIONS During the field investigation, the following observations should be resolved by Radnor Township and/or Lower Merion Township: Install R4-7 KEEP RIGHT and OM1-3 OBJECT MARKER signs at both ends of the median located at the intersection of Lancaster Avenue and County Line Road. The signs are noted on the signal permit plan and may have been knocked down. Eliminate the WAIT FOR GREEN BALL sign at the intersection of Conestoga Road & Glenbrook Avenue/Thomas Avenue. This sign is no longer supported by PennDOT and is not included on the most current signal permit plan. For improved visibility, replace the faded R3-2 NO LEFT TURN signs at the intersection of Conestoga Road & Glenbrook Avenue/Thomas Avenue. 4
13 County Line Road Corridor Transportation Evaluation March 2019 Overhead Street Name (OSN) signs at: Lancaster Avenue & County Line Road; Conestoga Road & Glenbrook Avenue/Thomas Avenue; and Landover Road & Haverford Road should be replaced to meet current Manual of Uniform Traffic Control Devices (MUTCD) and PennDOT standards. SIGHT DISTANCE ANALYSIS Sight distance was measured at each of the unsignalized study intersections to identify potential issues. The sight distance evaluation was performed utilizing PennDOT standards with the sight line measured from a point 10 feet from the through travel lane of the main street from a position 3 ½ feet above the road to an object height of 3 ½ feet above the pavement. As shown in Table 2, all of the unsignalized intersections meet the minimum sight distance criteria with the exception of northbound Montrose Avenue and Old Lancaster Road. However, appropriate sight distance can be achieved by trimming some of the adjacent vegetation. Calculations and photos at each of the studied intersections are provided in Appendix B. Table 2: Sight Distance Summary Looking Left (in Feet) Intersection Approach Calculated 1 Available/ Existing Looking Right (in Feet) Calculated 1 Available/ Existing Remarks Southbound Montrose Ave No deficiency Northbound Montrose Ave Trim vegetation & reevaluate periodically. Northbound Roberts Ave No deficiency Southbound Roberts Ave No deficiency Old Lancaster Road Trim vegetation & reevaluate periodically. Mondella Ave No deficiency 1 Based on PennDOT and AASHTO Minimum Stopping Sight Distance and the 85 th Percentile speed of the roadway. CRASH ANALYSIS As part of the analysis, crash data was obtained from Radnor and Lower Merion Townships, as well as PennDOT, for each of the study intersections. Reportable and non-reportable crash information was reviewed for the most recent five-year period and is tabulated in Table 3. Reportable crashes are those in which either the vehicle sustained enough damage that it must be towed or there is any type of injury or death. Non-reportable crashes are all other incidents and are considered fender benders. During the most recent five years of data collected, no fatalities occurred along the corridor. Collision diagrams were prepared for each study intersection and are provided in Appendix C. In accordance with MUTCD and PennDOT, the threshold to consider improvements at an intersection is the occurrence of 5 or more reported crashes within a continuous 12 month period. Therefore, each of the study area intersections warrant some mitigation to improve the safety of the corridor, with the exception of the Mondella Avenue, and 5

14 County Line Road Corridor Transportation Evaluation March 2019 Lindsay Avenue intersections. However, all locations were reviewed to identify even minor modifications that could improve the safety of the corridor. Many of the crashes along County Line Road in the vicinity of Lancaster Avenue involved negotiating the curve near the intersection of County Line Road at Arthur Road. Additional signage along County Line Road would provide advanced warning for drivers of the upcoming change in horizontal alignment such as W1-8 CHEVRON ALIGNMENT signs and W1-6 LARGE SINGLE ARROW signs. In an effort to reduce rear end crashes, the Townships may want to consider implementation of a dynamic RED SIGNAL AHEAD sign for northbound County Line Road to alert drivers when the signal at the intersection is red for the northbound approach. Table 3: Crash Summary LOCATION Number of Crashes Reportable and Non-Reportable County Line Road & Lancaster Ave County Line Road & Montrose Ave County Line Road & Roberts Ave County Line Road & Thomas Ave/ Conestoga Road County Line Road & South Warner Ave County Line Road & Old Lancaster Road County Line Road & Mondella Ave County Line Road & Lindsay Ave County Line Road & Bryn Mawr Ave/ Glenbrook Ave/ Railroad Ave County Line Road & Haverford Road/ Landover Road Between Arthur Road and Montrose Avenue, there were a number of crashes that involved improper entrances to County Line Road. This could be attributed to the high number of curb cuts along the northeast side of County Line Road associated with the many businesses along this stretch such as CVS Pharmacy, Sunoco and the Ferrari Dealership. In addition to the number of curb cuts, the sidewalk and driveway aprons blend together making it difficult to clearly identify the location of the driveways. Installing a separation material such as a two-foot grass verge between the roadway and the sidewalk could improve the visibility and better define the location of these driveways as indicated below. As an alternative, the Township may want to consider creating a continuous contrasting sidewalk through the driveways to more prominently note the presence of pedestrians. There were a high number of crashes (31) at the Montrose Avenue intersection which were attributable to motorists not stopping at the stop sign and/or turning without proper 6

15 County Line Road Corridor Transportation Evaluation March 2019 clearance, many of which were through movements from Montrose Avenue attempting to cross over County Line Road. 27 of the 31 crashes at the intersection were directly related to crossover traffic. Based on the results of the sight distance analysis, eastbound Montrose Avenue motorists looking left do not have adequate sight distance due to vegetation along the adjacent property frontage. A traffic signal warrant was reviewed to determine if a traffic signal could be installed at this location. The results of the analysis indicate that under existing conditions, a traffic signal is warranted based upon the Manual for Uniform Traffic Control Devices (MUTCD) Warrant 1-Eight-Hour Vehicular Volume. The signal warrant analysis can be found in Appendix D. Similarly, there were a high number of crashes (49) at the Roberts Road intersection, most of which involved vehicles proceeding from the stop-controlled approaches of Roberts Road without proper clearance along County Line Road. Most of the incidents (39) involved vehicles from Roberts Road attempting to cross County Line Road, likely to access the traffic signal at Lancaster Avenue. Due to the right turn only at the Conestoga Road/County Line Road intersection, vehicles must cut through Roberts Road to gain access to Lancaster Avenue. Based on the number of incidents, a signal warrant was reviewed to determine if a traffic signal could be installed at this location to improve the safety of the intersection. The results of the analysis indicate that under existing conditions, a signal is warranted based upon the Manual for Uniform Traffic Control Devices (MUTCD) Warrant 1 Eight-Hour Vehicular Volume and Warrant 2 Four-Hour Vehicular Volume. Review of the crash data at the Conestoga Road/Thomas Avenue/Glenbrook Avenue intersection did not reveal common patterns in crashes that could be mitigated with roadway improvements. However, there were some crashes involving northbound leftturning vehicles that may be reduced by updating the signal head to a traditional 5-section head rather than a 4-section head. The existing 4-section signal displays a green arrow during the protected phase that is extinguished after the phase is completed to allow the southbound movement. Additional crashes may be associated with vehicles accelerating to beat the light. Installing a 5-section signal would provide an additional clearance interval during the yellow arrow indication therefore warning drivers when the opposing traffic will begin moving through the intersection. The crash data revealed that the crashes in the vicinity of South Warner Avenue and Old Lancaster Road involved vehicles exiting the plaza on the west side of County Line Road. There are currently three access driveways within 200 along County Line Road beginning from the northern limits of the shopping center as follows: a one-way entrance, a one-way exit and one full access driveway. Consolidating the driveways into one shared access may be effective in reducing the number of crashes. In addition, property owners should consider removing the one-way entrance and the one-way exit driveways at the plaza to reduce the number of turn conflicts in the 200 frontage along the roadway. During the field investigation, several motorists were observed traveling between County Line Road and Glenbrook Avenue through the narrow driveway running 7


16 County Line Road Corridor Transportation Evaluation March 2019 along the north side of the shopping center building in both directions; given the narrow width of the driveway (approximately 10 wide), a safer operation would include altering the driveway movement to one direction only to prohibit motorists from using this narrow drive as a cut-through between the two roadways. The existing one-way driveway along the south side of the shopping center building should remain to provide a means of circulation around the entire building Old Lancaster Road intersects County Line Road at a less than ideal skewed angle making turning movements from Old Lancaster Road awkward and difficult. Drivers must turn almost completely around to view oncoming vehicles from the south and alternatively, motorists traveling southbound along County Line Road only have to turn slightly to access Old Lancaster Road. The crash data shows that motorists from 8


17 County Line Road Corridor Transportation Evaluation March 2019 southbound County Line Road make careless turns in front of other vehicles while attempting to perform this turn maneuver. Reconfiguring the alignment of Old Lancaster Road to a more perpendicular alignment with County Line Road and narrowing down the cartway width on Old Lancaster Road at County Line Road could reduce the crash incidents at this location. An intersection realignment would provide better sight lines for vehicles turning from Old Lancaster Road to County Line Road and would require southbound motorists to turn more slowly from County Line Road. 9
18 County Line Road Corridor Transportation Evaluation March 2019 There were a total of four (4) crashes at Lindsay Avenue; this road provides access to Bryn Mawr Hospital. No clear patterns were observed and therefore, no improvements are recommended at this location. There were a total of eight (8) crashes, five (5) of which were attributed to southbound rear-end collisions at the intersection of County Line Road and Mondella Avenue. The collisions were mostly a result of collisions with southbound left-turning vehicles. The recommended mitigation at this location would be to provide a dedicated left-turn lane; however, implementing a center left-turn lane at this location would serve the same purpose. At the County Line Road & Bryn Mawr Avenue/Railroad Avenue intersection, there is a high number of crashes involving rear-end collisions on the northbound County Line Road movement. This is likely due to the inadequate left turn lane length, the absence of a shadow lane, the absence of a full-length/full-width taper, interjected with the left turn movements into the Wawa driveway. Motorists may be stopping quickly or prematurely to enter the Wawa driveway, thereby causing rear-end collisions with motorists that are proceeding through to turn left at the intersection and are not anticipating the left turn into the Wawa driveway. Although extending the left-turn lane would be favorable; this is not feasible due to the available cartway and right-of-way width. The recommended improvement includes providing a dotted extension line at the beginning of the development of the left turn lane taper to more clearly define the dedicated left turn lane from the inside through lane along with the installation of a nearside traffic signal head for the benefit of motorists in the northbound left turn lane. The crash data indicates that more than half of the crashes at the County Line Road/Haverford Road & Landover Road intersection were caused by motorists running a red light. This could be alleviated by providing advanced dilemma zone detection via radar. Based on the speed of the approaching vehicle, the radar detector can extend the green interval if a vehicle is in the dilemma zone before displaying the yellow clearance interval. Motorists are then able to travel through the dilemma zone or zone of indecision, without having to make a quick decision of whether to stop or proceed through the yellow indication. This has proven to significantly reduce the occurrence of crashes due to red light running. The clearance intervals at this intersection were evaluated and found to be appropriate; therefore, extending the yellow/red time is not recommended as a countermeasure. Due to the high number of crashes specifically between Lancaster Avenue and Roberts Road, the benefits of a road diet were examined for the entire length of the corridor. A road diet reduces the number of lanes on a roadway which can improve safety for motorists, bicyclists and pedestrians. According to the Federal Highway Administration (FHWA), reasons to consider converting from a four-lane roadway to a three-lane roadway with a center turn lane include a high crash rate involving left turn movements, sideswipes, rear-end collisions, and crossing traffic. Typically, a four-lane roadway operates as two travel lanes in either direction with two defacto left turn lanes as motorists tend to bob and weave to avoid impending left turning vehicles. A roadway diet can reduce automobile crashes from 20% to 50% by reducing the number of conflict points in half and greatly reducing the number of left turning, rear-end, sideswipe and head-on collisions. Three-lane roads also reduce speeds which are a concern along this 10

19 County Line Road Corridor Transportation Evaluation March 2019 portion of the corridor. The implementation of a three-lane roadway will greatly improve safety along the corridor and reduce the number of conflicts a pedestrian must contend with when crossing the roadway. An added benefit for the roadway diet is the center turn lane provides a refuge for left turning vehicles from County Line Road to the minor streets and also provides a two-stage left turn refuge area for motorists turning left from the minor side streets to gain access to County Line Road. III. EXISTING CONDITIONS The study area intersections were analyzed during the AM peak, PM peak and Saturday Midday peak periods for the Existing (2018) conditions. The majority of existing traffic volume information for the AM and PM peak periods (7:00AM-9:00AM) and (4:00PM- 6:00PM) was obtained from various traffic studies conducted along the corridor in recent years. Data was also collected during the Saturday Midday peak period (11:00AM- 1:00PM) for all study intersections. The existing traffic count data is included in Appendix E. The yearly growth factor provided by PennDOT s Bureau of Planning and Research for Urban Non-Interstate roadways within Delaware County and Montgomery County for 2018/2019 is 0.00 and 0.34, respectively. To provide a more conservative analysis, the counts were factored to the existing analysis year (2018) utilizing a yearly growth factor of 0.34 per Montgomery County. The resultant current year traffic volumes are shown on Figures 2A-2C for the AM Peak Hour, PM Peak Hour, and Saturday Midday peak hour. LEVEL OF SERVICE ANALYSIS The volumes were subjected to a detailed Level of Service (LOS) analysis according to standard procedures found in Highway Capacity Manual 6 th Edition (HCM) published by the Transportation Research Board, Washington DC and provided in Appendix F. At the signalized intersections, the analysis utilized the existing signal timings as identified on the signal permit plans provided by PennDOT and in Appendix G. The detailed analysis reports for the Existing conditions are provided in Appendix H. The LOS results are summarized on Figures 3A-3C for each of the analysis periods. Typically, PennDOT considers LOS D to be an acceptable overall level of service for intersections within an urban area. As noted in Appendix H, all of the study intersections 11
20 County Line Road Corridor Transportation Evaluation March 2019 meet this criteria; however, there are several movements throughout the corridor that operate at LOS E or F. These movements were examined to determine if improvements could be identified to achieve improved operation. The eastbound and westbound stop-controlled approaches of Montrose Avenue operate at deficient levels of service during the AM and PM peak periods. At Roberts Road, the eastbound approach operates at a LOS F during the AM peak period. In addition, the following queues were noted. Along Lancaster Avenue, the eastbound queue extends beyond the adjacent intersection at County Line Road by approximately 160 feet during the PM peak period. At the intersection of Bryn Mawr Avenue and Haverford Road the northbound left queue extends beyond the available storage by less than a cars length during the AM and PM peak periods. At the intersection of Glenbrook Avenue the southbound queue extends beyond the adjacent intersection at Lindsay Avenue approximately 65 and 315 feet during the AM and PM peak periods, respectively. Table 4 provides a summary of the deficient movements detailed above. Table 4: Existing Roadway Deficiencies Intersection w/ County Line Road Movement Levels of Service (seconds) 95 th Percentile Queue (feet) AM Peak Hour PM Peak Hour SAT Peak Hour LOS AM Peak Hour PM Peak Hour SAT Peak Hour Lancaster Ave EB Montrose Ave EB F (51.7) F (88.1) WB E (38.4) F (62.0) Roberts Road EB F (109.7) Bryn Mawr Ave & Haverford Road NBL Glenbrook Ave SB A detailed Level of Service analysis was also performed along the corridor with the implementation of the noted improvements. Two analyses were conducted; one evaluating a center left turn lane along the corridor excluding the intersections of Conestoga Road and Bryn Mawr Avenue, and one evaluating a center turn lane at all study intersections. Apart from safety improvements and minor signal timing revisions, the impact of installing a center left turn lane through the intersections of Conestoga Road and Bryn Mawr Avenue can be seen in Tables 5 and 6. As shown in Tables 5 and 6, the level of service and queue are negatively impacted when reducing the number of lanes servicing the northbound and southbound approaches at these intersections. Figure 7 provides a sketch detailing the failing movements noted in Tables 5 and 6. 12
21 County Line Road Corridor Transportation Evaluation March 2019 Table 5: Level of Service Analysis - Center Turn Lane Through Entire Study Area Conestoga Road/ Thomas Ave/ Glenbrook Ave Movement AM Peak Hour LOS (seconds) Existing Conditions PM Peak Hour LOS (seconds) SAT Peak Hour LOS (seconds) Proposed w/ TWTL 1 Corridor Improvements Excluding Conestoga Rd & Bryn Mawr Ave AM Peak Hour LOS (seconds) PM Peak Hour LOS (seconds) SAT Peak Hour LOS (seconds) Proposed w/ TWTL 1 Corridor Improvements Including Conestoga Rd & Bryn Mawr Ave AM Peak Hour LOS (seconds) PM Peak Hour LOS (seconds) SAT Peak Hour LOS (seconds) Thomas WB C (25.5) C (30.7) C (27.1) C (28.8) D (42.9) C (29.4) C (28.8) D (42.9) C (29.4) Glenbrook NEB C (28.2) C (30.9) C (29.6) C (33.2) D (44.9) C (32.6) C (33.2) D (44.9) C (32.6) Conestoga SEB C (27.9) C (31.8) B (25.4) C (22.8) D (35.1) C (24.2) C (22.8) D (35.1) C (24.2) County Line NB Left County Line NB Thru/Right County Line SB Left County Line SB Thru/Right A (8.1) A (5.3) A (3.9) B (16.7) C (24.2) B (16.9) A (5.8) A (3.5) A (2.8) B (12.9) B (12.5) A (3.9) A (6.6) A (3.2) A (4.4) A (6.6) A (3.2) A (4.4) A (0.0) B (15.7) B (10.5) A (0.0) B (15.7) B (10.5) B (16.9) B (12.9) A (9.7) E (75.2) C (26.1) B (14.9) Overall B (15.8) B (19.1) B (13.8) B (14.3) B (17.0) B (12.1) C (30.3) C (22.6) B (13.5) Bryn Mawr Ave/ Haverford Road/ Railroad Ave Glenbrook Ave Bryn Mawr EB Left C (21.6) C (23.9) B (18.6) C (21.6) C (23.9) B (18.5) C (21.6) C (23.9) B (18.5) Bryn Mawr EB Thru/Right D (41.5) D (46.2) C (30.5) D (41.5) D (46.2) C (30.4) D (41.5) D (46.2) C (30.4) Bryn Mawr WB Left C (23.8) D (40.9) C (20.0) C (23.8) D (40.9) C (20.3) C (23.8) D (40.9) C (20.3) Bryn Mawr WB Thru C (30.6) D (38.2) C (27.7) C (30.6) D (38.2) C (28.1) C (30.6) D (38.2) C (28.1) Bryn Mawr WB Right C (25.1) C (28.2) C (24.2) C (25.1) C (28.2) C (24.4) C (25.1) C (28.2) C (24.4) County Line NB Left B (13.0) C (22.1) B (10.5) C (21.8) C (24.5) B (12.7) C (32.3) D (37.1) B (15.7) County Line NB Thru/Right C (24.0) B (16.7) B (18.2) D (37.5) C (21.7) C (21.5) F (282.3) D (35.2) D (42.4) County Line SB Left C (36.6) A (4.4) B (10.6) C (30.5) A (5.9) B (12.5) E (55.6) B (12.0) C (34.0) County Line SB Thru/Right A (2.9) A (6.5) A (2.9) A (3.7) A (8.0) A (3.7) C (24.8) F (227.3) B (13.7) Overall C (23.1) C (22.4) B (16.7) C (28.2) C (24.1) B (18.0) F (118.4) F (101.9) C (26.9) County Line NB Left/Thru County Line NB Thru/Right County Line SB Thru County Line SB Thru/Right A (0.4) A (0.2) A (0.1) A (0.4) A (0.2) A (0.3) C (32.5) C (23.2) C (22.2) A (1.4) C (31.4) C (31.3) C (31.3) D (36.7) C (22.7) C (30.4) C (34.6) C (22.8) F (110.2) F (298.2) E (64.8) Overall B (11.8) C (22.1) B (10.2) B (11.5) C (20.9) B (10.4) D (41.5) F (191.4) D (46.1) 1 TWTL= Two Way Turn Lane or Center Turn Lane 13
22 County Line Road Corridor Transportation Evaluation March 2019 Table 6: Queue Analysis - Center Turn Lane Through Entire Study Area Conestoga Road/ Thomas Ave/ Glenbrook Ave Bryn Mawr Ave/ Haverford Road/ Railroad Ave Movement Storage (feet) AM Peak Hour LOS (seconds) Existing Conditions PM Peak Hour LOS (seconds) SAT Peak Hour LOS (seconds) Proposed w/ TWTL Corridor Improvements Excluding Conestoga Rd & Bryn Mawr Ave AM Peak Hour LOS (seconds) PM Peak Hour LOS (seconds) SAT Peak Hour LOS (seconds) Proposed w/ TWTL 1 Corridor Improvements Including Conestoga Rd & Bryn Mawr Ave AM Peak Hour LOS (seconds) PM Peak Hour LOS (seconds) Thomas WB Glenbrook NEB Conestoga SEB SAT Peak Hour LOS (seconds) County Line NB Left County Line NB Thru/Right County Line SB Left County Line SB Thru/Right Bryn Mawr EB Left Bryn Mawr EB Thru/Right Bryn Mawr WB Left Bryn Mawr WB Thru Bryn Mawr WB Right County Line NB Left County Line NB Thru/Right County Line SB Left County Line SB Thru/Right County Line NB Left/Thru County Line NB Thru/Right County Line SB 235 Thru County Line SB 235 Thru/Right 1 TWTL= Two Way Turn Lane or Center Turn Lane Glenbrook Ave Based on the findings noted above regarding queues extending beyond adjacent intersections and excessive delays, no center turn lane should be provided through the intersections of Conestoga Road and Bryn Mawr Avenue. A summary of the overall level of service at each of the study area intersections can be found in Table 7 and a detailed summary of the level of service and 95th percentile queue results are provided in Appendix I and J, respectively. In addition, the LOS results with recommended improvements are shown on Figures 6A-6C for each of the analysis periods. 14
23 County Line Road Corridor Transportation Evaluation March 2019 Table 7: Level of Service Analysis - Center Turn Lane Excluding Conestoga Road and Bryn Mawr Avenue Existing LOS Existing w/ Center Turn Lane Excluding Conestoga & Bryn Mawr Intersection AM Peak Hour LOS (seconds) PM Peak Hour LOS (seconds) SAT Peak Hour LOS (seconds) AM Peak Hour LOS (seconds) PM Peak Hour LOS (seconds) SAT Peak Hour LOS (seconds) Lancaster Avenue (S.R. 0030) 2 C (20.3) C (23.0) B (16.0) C (20.4) C (24.3) B (16.0) Montrose Avenue 1/2 B (7.8) B (12.4) A (2.7) B (11.7) B (10.4) A (6.9) South Roberts Road 1 B (16.2) A (3.4) A (3.0) C (26.3) A (4.3) A (3.8) Conestoga Road (S.R. 1019) & Glenbrook B (15.8) B (19.1) B (13.8) B (14.3) B (17.0) B (12.1) Avenue & Thomas Avenue 2 South Warner Avenue 1 A (0.1) A (0.2) A (0.1) A (0.1) A (0.2) A (0.1) Old Lancaster Avenue 1 A (4.4) A (3.9) A (2.4) A (3.8) A (3.9) A (2.2) Mondella Avenue 1 A (0.5) A (0.4) A (0.1) A (0.4) A (0.4) A (0.3) Lindsay Avenue 2 A (1.9) A (1.5) A (0.2) B (15.0) A (7.6) A (0.7) S. Bryn Mawr Avenue (S.R. 3038) & Haverford Road & W. Railroad Avenue & Glenbrook Avenue 2 C (23.1) C (22.4) B (16.7) C (28.2) C (24.1) B (18.0) Glenbrook Avenue 2 B (11.7) C (22.1) B (10.4) B (11.5) C (20.9) B (10.4) Haverford Road (S.R. 1009) & Landover Road 2 B (16.0) B (13.7) B (10.5) C (22.8) E (56.8) B (12.8) 1 Analyzed as stop controlled 2 Analyzed as signal In general, the traffic signal operations of minor approaches will degrade slightly for the benefit of the major through movements along a corridor with optimizing signal timings for progression through a corridor. However, if desired, minor adjustments to the signal timings could be made at the signalized intersections to reduce the delay on the minor approaches if the delays are found to be too significant. The level of service for County Line Road may be minimally impacted at these locations, but are still within industry standard for acceptable LOS and delay levels. TRAVEL TIME ANALYSIS The corridor was subjected to a detailed travel time analysis using SimTraffic software. SimTraffic provides an animated simulation of the corridor modeled in Synchro which is the software used to develop the capacity analyses. The corridor was analyzed during the AM peak, PM peak and Saturday Midday peak periods for the existing conditions as well as with the implementation of the recommended improvements. Table 8 shows five simulated travel time runs through the corridor, both north and south, which were then averaged for comparison purposes. The overall travel time improvement from the existing conditions compared to the corridor with recommended improvements is outlined in Table 9. With the exception of the southbound movement during the PM peak hour, both the northbound and southbound travel times through the corridor improve slightly during the AM, PM and Saturday Peak hours. The detailed travel time analysis reports are provided in Appendix H. 15

24 County Line Road Corridor Transportation Evaluation March 2019 Table 8: Corridor Travel Times AM PEAK PM PEAK SAT PEAK EXISTING W/ W/ W/ EXISTING EXISTING IMPROVEMENTS IMPROVEMENTS IMPROVEMENTS NB SB NB SB NB SB NB SB NB SB NB SB Run Run Run Run Run Average Run Table 9: Overall Corridor Travel Time Improvement AM PEAK PM PEAK SAT PEAK NB (s) NB (s) NB (s) SB (s) SB (s) SB (s) IV. PEDESTRIAN AND BICYCLE FACILITY EVALUATION PEDESTRIAN FACILITIES There are existing pedestrian facilities along the entire length of the studied corridor from Lancaster Avenue to Landover Road. Four (4) foot sidewalks are provided on both the east and west sides of County Line Road directly adjacent to the curb and travel lane. Most of the studied cross streets include sidewalk along both sides of the roadway with the exception of Conestoga Road, Roberts Road and Haverford Road. Conestoga Road does not provide sidewalk on the north side of the road; in addition, pedestrian crossings are only provided at the intersection of Roberts Road and Glenbrook Avenue. Residents raised concerns that due to the lack of sidewalk on the north side of the street, pedestrians are forced to cross Conestoga Road in order to reach the sidewalk on the southern side. Locations of greatest concerns are the specific crossings at Montrose Avenue and Petrie Avenue. To improve safety for pedestrians, provide a crosswalk across Conestoga Road along with W11-2 PEDESTRIAN signs and advanced warning signs on both approaches. In addition, construct a sidewalk along the north side of Conestoga Road in order to provide a more obvious and improved crossing between Montrose Avenue and Roberts Road. Extending the sidewalk from Roberts Road to County Line Road in front of the Yangming parcel may be difficult due to the need for an extensive retaining wall and the presence of mature trees along the north side of County Line Road. An additional study may need to be conducted at this location to further investigate other potential safety improvements such as the installation of a Rectangular Rapid Flashing Beacon (RRFB). 16


")
25 County Line Road Corridor Transportation Evaluation March 2019 Residents noted that vehicles often do not yield to pedestrians at the intersection of Lancaster Avenue and Montrose Avenue. During a field investigation it was observed there is a marked mid-block crosswalk for pedestrians to cross Lancaster Avenue; however no pedestrian signal is provided and a W11-2 PEDESTRIAN warning sign is only provided on the eastbound approach immediately adjacent to the existing crosswalk. To improve the safety for pedestrians the recommended improvement includes installing W11-2 PEDESTRIAN signs along both the eastbound and westbound approaches of Lancaster Avenue at the crosswalk and 100 in advance of the crosswalk. Given this location is outside the identified study area but of great importance, an additional study should be initiated to investigate the installation of a Rectangular Rapid Flashing Beacon (RRFB) for the pedestrian crossing. Residents noted that due to the location of the Warner Avenue Park & Playground and the 958/968 Lancaster Ave. Shopping Center located near Old Lancaster Road and County Line Road, increased pedestrian traffic at this intersection and crossing County Line Road could benefit from a dedicated crosswalk, compliant curb ramps and potentially a Rectangular Rapid Flashing Beacon. An additional study should be conducted at this location in order to investigate other potential safety improvements. In order to increase the safety of pedestrians at each of the intersections, continental crosswalks (piano keys) and pedestrian countdown timers should be installed where needed. The continental style crosswalk is more visible to approaching vehicles and alerts drivers to the potential for pedestrians within the intersection. The pedestrian countdown timers inform pedestrians how many seconds remain to safely cross the road before the DON T WALK symbol is displayed; this allows the pedestrian to make better decisions about whether to begin to cross the road. Both of these measures could improve the safety of the intersections for motorists and pedestrians alike. The intersections of County Line Road & Landover Road as well as County Line Road & Lancaster Avenue should be upgraded with pedestrian countdown timers and pushbuttons. In addition, upgraded ADA accessible curb ramps should be constructed at the intersections of County Line Road and: Lancaster Avenue; Montrose Avenue; Roberts Road; South Warner Avenue; Old Lancaster Road; and Mondella Avenue. 17
26 County Line Road Corridor Transportation Evaluation March 2019 BICYCLE FACILITIES There are currently no bicycle facilities located along the County Line Road corridor or on any surrounding roadways in the vicinity of the study area. The traffic counts obtained for the purposes of this analysis show that bicyclists do utilize the corridor. Local residents have expressed concerns regarding bicycles traveling along the current corridor. Reducing County Line Road to include two 10 travel lanes with a shared 10 center left-turn lane would provide two 5 feet wide shoulders on the north and southbound approaches of County Line Road. The shoulders would provide the additional safety benefit for not only bicycle riders in a more protected environment, but would also provide an additional 5 feet of buffer between pedestrians on the sidewalks and vehicles traveling on the roadway; and also improve motorists visibility of pedestrians crossing County Line Road from the minor cross streets along the corridor. V. RECOMMENDED IMPROVEMENTS Based on a review of the level of service results, the crash data and the sight distance analysis, there are some improvements that can be implemented to provide improved progression and a safer environment for both vehicular and pedestrian traffic. Figures 5A 5D provide a conceptual sketch of the recommended improvements. As noted in the sight distance analysis summary table, the existing vegetation on the eastbound Montrose Avenue and westbound Old Lancaster Road approaches to County Line Road impedes the line of sight for drivers at those locations. Both Townships should trim the vegetation to ensure adequate sight distance is available. The legal right-of-way should be identified in these locations to determine if a sight line easement is necessary to clear the vegetation and to maintain the sight distance in the future. Once trimmed, another evaluation should be performed to ensure adequate sight distance is available. The vegetation should be monitored bi-annually to maintain the necessary sight distance. The approximate cost of this improvement is $5,000. In an effort to improve safety along County Line Road between Lancaster Avenue and Landover Road, the County Line Road corridor should alter from a four lane assignment to a three lane assignment with 5 shoulders on both sides of the corridor. The three lane assignment would include a shared center turn lane along with one travel lane in both directions of travel The three lane section would terminate at County Line Road and Roberts Road and return to a four-lane roadway alignment. Due to the high volumes on both County Line Road and Conestoga Road in addition to the three-phase signal control at the intersection of County Line Road & Conestoga Road/Thomas Ave/Glenbrook Ave, two lanes are necessary on County Line Road in order to effectively move traffic through the intersection. The three lane section would then pick back up after the intersection of County Line Road and Old Lancaster Avenue and continue through to Lindsay Avenue. The existing roadway configuration would remain through the intersection of County Line Road & Bryn Mawr Avenue/Glenbrook Avenue due to the complexity of the signal phasing, associated auxiliary turn lanes, and high volumes. It is important to note that the implementation of a three lane cross section as described above is conditioned on the assumption that PennDOT would permit reduced lane reduction tapers based on a speed limit of 25 miles per hour. The advanced warning distance and lane reduction tapers required at 35 miles per hour are nearly double those 18

27 County Line Road Corridor Transportation Evaluation March 2019 required at 25 MPH and there is insufficient distance to provide the taper adjustments from a 4 lane to a 3 lane alignment. Reducing the corridor speed from 35 MPH to 25 MPH should be considered with the corridor lane reassignment discussed with PennDOT as part of the proposed changes to the entire corridor. The approximate cost to install these improvements is $680,000. The traffic signal at Lancaster Avenue is not visible to drivers traveling northbound along County Line Road due to the horizontal and vertical geometry of the roadway and surrounding parcels. Therefore, to improve the safety of the approach to the intersection, a dynamic Red Signal Ahead sign should be installed to warn motorists of the upcoming red signal indication. This could reduce the number of rear-end accidents approaching the intersection. Alternatively, additional warning signs should be installed along southbound County Line Road to warn them of the horizontal curve in the vicinity of the intersection. This could include curve warning signs (W1-2) or several chevron signs (W1-8) along the curve. It was also noted that the pedestrian facilities at the intersection are not ADA-compliant and therefore, updated curb ramps, crosswalks, push buttons and pedestrian countdown signal heads should be installed. The approximate cost of these improvements is $175,000. Montrose Avenue is an unsignalized intersection that provides access between Conestoga Road and Lancaster Avenue. Therefore a majority of the traffic is through traffic that must cross the four lanes of traffic. A signal warrant analysis was reviewed and determined that a traffic signal is warranted. Additionally, the existing vegetation should be cleared to allow for proper sight distance for the eastbound approach of Montrose Avenue. The curb ramps should also be upgraded to be ADA-compliant along with the installation of crosswalks crossing both legs of Montrose Avenue to provide safer crossings for pedestrians. In the event that a signal is installed at this location, push buttons and pedestrian signal heads should also be provided. The approximate cost to install these improvements (without the installation of a traffic signal) is $55,000. A similar situation occurs at Roberts Road where the unsignalized intersection also provides access between Conestoga Road and Lancaster Avenue and most of the minor 19


28 County Line Road Corridor Transportation Evaluation March 2019 street traffic is through traffic crossing over County Line Road. With the number of incidents at the intersection, a signal warrant was conducted and determined that a traffic signal is also warranted at this location. Therefore, the townships should discuss with PennDOT whether the installation of a traffic signal at this location is appropriate. It was noted that the pedestrian accommodations are not ADA-compliant and should, therefore, be upgraded along with the installation of crosswalks crossing both legs of Roberts Road. In the event that a signal is installed at this location, push buttons, pedestrian signal heads and crosswalks for all four crossings should be provided. The approximate cost to install these improvements (without the installation of a traffic signal) is $55,000. Although a traffic signal was warranted at both Montrose Avenue and Roberts Road, the signal should be installed at the intersection of Montrose Avenue and County Line Road because of the additional cartway width and the greater separation from other signalized intersections Installing the traffic signal at this location along County Line Road could potentially alleviate some of the congestion along southeastbound Conestoga Road by providing a more favorable and efficient crossing of County Line Road. In addition, it would allow for the protected movement of cross traffic as well as a centralized location for a protected pedestrian crossing between Lancaster Avenue and Conestoga Road. The new signal should be coordinated with the adjacent signalized intersection at County Line Road and Conestoga Road. The approximate cost to signalize the intersection of Montrose Avenue is $360,000. Upon construction of a signal at Montrose Avenue and implementation of a three-lane roadway cross section, further review should be considered regarding the need to restrict left turns and through traffic along the eastbound and westbound approaches of Roberts Road. Once the other improvements have been implemented, cross traffic may reduce because of the signal at Montrose. Additionally, the three-lane cross section only requires vehicles to cross two lanes of oncoming traffic instead of four lanes and left turns from County Line Road to Roberts Road will move to the more protected center turn lane. If the need for a restriction is still apparent after the noted improvements have been constructed, cross traffic movement on Roberts may need to be prohibited by constructing a channelized concrete island or the installation of flexible delineator posts. The approximate cost of installing the concrete island would be $28,000 and the cost for delineators would be $7,000. It is important to note that while delineators are the less expensive option, delineators require frequent maintenance. 20
29 County Line Road Corridor Transportation Evaluation March 2019 A review of the crash data at the County Line Road & Conestoga Road/Thomas Avenue/Glenbrook Avenue intersection revealed that there were crashes involving northbound left-turning vehicles. Updating the signal head to a traditional 5-section signal head rather than a 4-section signal head may help reduce the occurrence of accidents. The existing 4-section signal displays a green arrow during the protected phase that is extinguished after the phase is complete to allow the southbound (green ball) movement. This may encourage motorists to accelerate to beat the light. Installing a 5-section signal would provide drivers with more warning that the opposing approach will be moving through the inclusion of a yellow arrow indication and phasing. In addition, the intersection would benefit from the installation of a northbound County Line Road dedicated left turn lane with signal timings adjustments to provide more green time for both Conestoga Road and County Line Road. A review of the vehicle clearance intervals and crash records indicate that adjustments should be made to increase the all red interval from 2 seconds to 3 seconds for the major approaches. The calculations are provided in Appendix K. The approximate cost to install these improvements is $55,000. Due to the proximity to the existing park, the pedestrian ramps at South Warner Avenue should be upgraded to be ADA-compliant. Additionally, a crosswalk should be installed crossing South Warner Avenue to allow a more prominent location to access the park. The approximate cost of these improvements is $24,000. Based on the analysis of the crash data, the incidents in the vicinity of the intersection appear to be related to the access driveways for the retail shopping plaza opposite the Old Lancaster Road intersection. There is an existing full access driveway as well as a one-way entrance and one-way exit driveway within the approximately 200 frontage. Eliminatiing both one-way driveways would serve to reduce the number of conflict points and concentrate vehicular access from one shared full-access driveway to County Line Road. It is understood this improvement requires cooperation with the property owners; concerns related to conflicts with turn movements at the intersection of Old Lancaster Road and County Line Road could be alleviated if the full access driveway for the retail shopping plaza was shifted to the eastern most corner of the parcels. The approximate cost of the driveway improvements is approximately $167,000. Old Lancaster Road meets County Line Road at a skewed angle with a wide cartway width at the intersection. The skewed angle makes it difficult for exiting drivers to view oncoming vehicles and requires motorists to turn their heads greater than 90 degrees to view approaching vehicles on County Line Road. The excessively wide cartway width on Old Lancaster Road at County Line Road effectively encourages southbound left turning motorists on County Line Road to perform left turns at a relatively high speed compared to more traditional alignments with less cartway widths. Realigning Old Lancaster Road to a 90 degree angle and reducing the cartway width at County Line Road would improve the sight line for motorists on Old Lancaster Road and would also reduce the speed of motorists traveling southbound to make a more traditional 90 degree left-turn onto Old Lancaster Road. The improvements could be done within the existing right-ofway for the intersection and depending on the available funds, there are a number of options to improve the intersection geometry such as a concrete channelized island with mountable curbs, a robust Qwick Kurb installation or flexible delineator posts.. 21
30 County Line Road Corridor Transportation Evaluation March 2019 Additionally, as noted in the sight distance analysis, the existing vegetation obstructs the line of sight for drivers at this location. Therefore, it is recommended the Township trim the existing vegetation to ensure adequate sight distance. Due to the proximity of the existing park, pedestrian ramps should be upgraded to comply with ADA requirements while also providing a pedestrian crosswalk on Old Lancaster Road. The approximate cost of installing these improvements is $97,000 for the mountable curb option, $73,000 for the Quick Kurb option, and $68,000 for the delineator post option. The unsignalized intersection of Mondella Avenue provides access between County Line Road and Old Lancaster Road; the Township should consider upgrading the pedestrian ramps to be ADA-compliant and installing a crosswalk for the pedestrian crossing at Mondella Avenue. The approximate cost of installing these improvements is $24,000. Lindsay Avenue provides access to Bryn Mawr Hospital and the intersection is presently equipped with compliant pedestrian facilities; however, the existing crosswalks should be upgraded to continental style crosswalks for improved visibility. Furthermore, a six month post-construction re-evaluation of the traffic signal timing should be performed to ensure proper timing of the traffic signal. The approximate cost to update the pavement markings is $3,000 and the signal timing re-evaluation should be the responsibility of the land development Applicant. Bryn Mawr Avenue/Railroad Avenue/Glenbrook Avenue intersection would benefit from including a dotted white extension line to more clearly define the left turn lane from the inside northbound through lane along County Line Road and a nearside traffic signal indication centered over the northbound left turn lane on the backside of the mast arm located in the southwest corner of County Line Road/Haverford Road and Bryn Mawr Avenue intersection. This improvement may help reduce rear-end collisions occurring along this approach and provide advance notice of the impending left turn lane for approaching motorists. In addition, upgrading the existing crosswalks with continental style crosswalks would provide a pedestrian safety improvement to the intersection. The approximate cost to install these improvements is $16,000. In addition to the above, residents raised concerns that westbound traffic is unable to turn left into the Wawa site on the southwest corner of Bryn Mawr Avenue and County Line Road/Haverford Road. The eastbound queues on Bryn Mawr Avenue do not allow for gaps in traffic to allow the lefts into the site, thereby causing traffic to backup into the intersection. The Township may want to facilitate a discussion between PennDOT and the property owners of the Wawa site in order to restrict lefts into the site via westbound Bryn Mawr Avenue and prohibit left turns out of the same driveway minimally during the peak hours. Based on a review of the crash information, there were several instances of vehicles running the red light at the County Line Road/Landover Road intersection. This could be alleviated by providing advanced dilemma zone detection via radar. Additionally, the pedestrian facilities at the intersection do not appear to be include ADA-compliant facilities; the crosswalks, pedestrian push buttons and pedestrian signals should be upgraded to include ADA accessible equipment. It was also noted that this intersection is not equipped with emergency pre-emption. Due to the near proximity of Bryn Mawr 22
31 County Line Road Corridor Transportation Evaluation March 2019 Hospital, the traffic signal should be upgraded to include emergency pre-emption to allow emergency vehicles more efficient and safer access to the hospital. The approximate cost to install these improvements is $83,000. A review of signage along the corridor revealed that there is a lack of R MPH SPEED LIMIT signs along northbound County Line Road. Additional signs should be posted at half mile increments along the corridor between Roberts Road and Landover Road. OUT OF SCOPE INVESTIGATIONS In addition to the recommended improvements noted above, thought was taken into considering altering the current traffic flow along Montrose Avenue and Roberts Road to provide one-way pairs between Lancaster Avenue and Conestoga Road. Residents raised concerns that the cartway width along Roberts Road is narrow and does not allow for two vehicles to pass at the same time while also permitting parking on one side of the street. And while Montrose Avenue is slightly wider than Roberts Road, the same issue occurs with the presence of on-street parking. Changing the streets from two-way to one-way operation would not only affect County Line Road but also, the four (4) additional intersections along Lancaster Avenue and Conestoga Road. This would require additional investigation including manual traffic counts at the intersections noted above and capacity analyses at all six (6) intersections to fully evaluate the impact of altering the traffic flow. The following characteristics are often paired with one-way operation: Increased speeds due to the absence of opposing traffic and the feeling of driving on a wider roadway. Double the volume in each direction because all eastbound traffic would be re-distributed to one roadway and westbound traffic to the other. The additional cartway width can be dedicated to providing separate turn lanes at the intersections (i.e. a dedicated left turn lane and a through/right turn lane). 23


32 County Line Road Corridor Transportation Evaluation March 2019 Conestoga Road does not include sidewalks along the north side of the road and the only pedestrian crossings are provided at the intersection of Roberts Road and Glenbrook Avenue. Construction of a sidewalk along the north side of Conestoga Road would provide a safe connection from Montrose Avenue to Roberts Road. The approximate cost to install the sidewalk is $320,000. Residents noted the intersection of Roberts Road and Conestoga Road becomes blocked by vehicles stacked on Conestoga Road from the traffic signal located at the intersection of County Line Road and Conestoga Road/Glenbrook Avenue/Thomas Avenue. Along with enforcement, installing DON T BLOCK THE BOX signage and pavement markings would discourage vehicles from entering the Roberts Road/Conestoga Road intersection when the queue extends from the next adjacent intersection. 24
33 County Line Road Corridor Transportation Evaluation March 2019 VI. CONCLUSIONS As comprehensive as this study is, the noted improvements could be implemented over time with or without grant funding. Overall, including a roadway diet along the corridor to move from a four lane cartway to two lanes with a center turn lane and shoulders with a reduced travel speed would likely provide the greatest safety improvement with the least amount of cost. PennDOT may be willing to install the recommended pavement markings on County Line Road from Arthur Road to Landover Road and reduce the speed limit along the entire corridor from 35 MPH to 25 MPH based on information included in this study along with more detailed drawings noting the pavement marking colors, tapers, dimensions and required sign locations. Other improvements were noted for Lancaster Avenue and Conestoga Road that were apparent during the development of this study that should be reevaluated outside the report. In all, this report provides a reference for implementing safety improvements along the County Line Road corridor to the benefit of all roadway users in both Radnor and Lower Merion Township. 25
34 County Line Road Corridor Transportation Evaluation March 2019 Table 10: Improvement Costs Summary Improvement Construction Cost Responsibility Grant Center Turn Lane $680, Municipality/ PennDOT ARLE Tree Trimming $5, Property Owner/ ARLE Municipality Lancaster Avenue Intersection Improvements $175, Municipality ARLE, GLG, MTF Roberts Road Intersection Improvements $55, Option 1 Mountable Curb Option 2 Delineator Posts $28, $7, Municipality Montrose Avenue Signalization $360, Municipality GLG Thomas Ave/ Glenbrook Ave Dedicated Left Turn Lane $55, Municipality MTF ARLE, GLG, MTF S. Warner Ave Pedestrian Improvements $24, Municipality MTF S. Warner Ave Shopping Center Driveway Improvements Old Lancaster Ave Intersection Improvements Option 1 Curbed Realignment Option 2 Concrete Island Option 3 Qwick Kurb Option 4 Flexible Delineators $167, $120, $97, $73, $68, Property Owner/ Municipality Municipality Modella Ave Intersection Improvements $24, Municipality MTF Lindsay Ave Intersection Improvements $3, Municipality MTF Bryn Mawr Ave Intersection Improvements $16, Municipality Landover Road Intersection Improvements $83, Municipality Montrose & Conestoga RRFB $55, Montrose & Lancaster RRFB $100, County Line & Old Lancaster RRFB $75, Conestoga Road Sidewalk $320, Radnor Township Lower Merion Township Lower Merion Township Radnor Township MTF MTF MTF, GLG, ARLE GLG, ARLE, MTF MTF MTF MTF MTF All Corridor Related Improvements $2,340, TA Set Aside 1 PennDOT Green Light Go (GLG) Typically open late Fall to early Winter 2 PennDOT Transportation Alternatives Set-Aside Last open 7/10/2017-9/22/2017 for 2018 awards 3 Multimodal Transportation Fund (MTF) - DCED: Annually, 3-1 thru 7-31; PennDOT: Last open March, Automated Red Light Enforcement Program (ARLE) Open annually the month of June 26

35 Lower Merion Township, Montgomery County N Radnor Township, Delaware County Corridor Intersections Evaluated Figure 1 Project Location Map County Line Road Corridor Transportation Evaluation Radnor Township & Lower Merion Township Delaware County & Montgomery County, Pennsylvania March 2018
36 65 EAST BUTLER AVENUE, SUITE 100, NEW BRITAIN, PA (215)
37 65 EAST BUTLER AVENUE, SUITE 100, NEW BRITAIN, PA (215)
38 65 EAST BUTLER AVENUE, SUITE 100, NEW BRITAIN, PA (215)
39 65 EAST BUTLER AVENUE, SUITE 100, NEW BRITAIN, PA (215)
40 65 EAST BUTLER AVENUE, SUITE 100, NEW BRITAIN, PA (215)
41 65 EAST BUTLER AVENUE, SUITE 100, NEW BRITAIN, PA (215)


42 65 EAST BUTLER AVENUE, SUITE 100, NEW BRITAIN, PA (215) Microsoft Corp
43 65 EAST BUTLER AVENUE, SUITE 100, NEW BRITAIN, PA (215) orporation 2018


44 2018 Microsoft Corporation EAST BUTLER AVENUE, SUITE 100, NEW BRITAIN, PA (215)

 345-4330")
45 65 EAST BUTLER AVENUE, SUITE 100, NEW BRITAIN, PA (215) Microsoft

 345-4330 2018")
46 65 EAST BUTLER AVENUE, SUITE 100, NEW BRITAIN, PA (215) Microsoft Corp


")

47 65 EAST BUTLER AVENUE, SUITE 100, NEW BRITAIN, PA (215) orporation 2018


48 65 EAST BUTLER AVENUE, SUITE 100, NEW BRITAIN, PA (215) Microsoft Corporation

 345-4330 2018")
49 65 EAST BUTLER AVENUE, SUITE 100, NEW BRITAIN, PA (215) Microsoft
50 65 EAST BUTLER AVENUE, SUITE 100, NEW BRITAIN, PA (215)
51 65 EAST BUTLER AVENUE, SUITE 100, NEW BRITAIN, PA (215)
52 65 EAST BUTLER AVENUE, SUITE 100, NEW BRITAIN, PA (215)
53 2019 Microsoft Corporation 2019 DigitalGlobe CNES (2019) Distribution Airbus DS 2019 Microsoft Corporat 2019 Microsoft Corporation 2019 DigitalGlobe CNES (2019) Distribution Airbus DS 2019 Micros 65 EAST BUTLER AVENUE, SUITE 100, NEW BRITAIN, PA (215)
54 APPENDIX
55 APPENDIX A Stakeholder s Meeting Minutes
56 MEETING NOTES Date of Meeting: August 23, 2018 Time of Meeting: Location: Project: Notes Prepared By: 6:00 PM Church of the Good Shepard 1116 Lancaster Ave. Bryn Mawr, PA County Line Road Corridor Study County Line Road (S.R. 1001) Radnor & Lower Merion Townships; Delaware & Montgomery Counties G&A Job # Amy Kaminski Date Finalized: September 11, 2018 Attendees: Commissioner John Nagle/W-5 RT Commissioner W Superintendent Chris Flanagan RTPD X108 Leslie Salsbury, E.I.T. Gilmore & Assoc. Inc Amy Kaminski, P.E., PTOE Gilmore & Assoc. Inc residents from Radnor and Lower Merion Township A meeting was held to review the corridor project and obtain stakeholder input on noted problems and safety concerns along the corridor. The following summarizes the discussion: 1. Superintendent Flanagan opened the meeting with a brief discussion regarding the history of the project. He explained both Lower Merion Township and Radnor Township had safety concerns and discussed installing traffic signals at various intersections along County Line Road. Further discussions continued that led both Townships to consider a comprehensive corridor analysis to develop mitigation measures. S. Flanagan introduced Commissioner Nagel and apologized to attendees from Lower Merion Township because LMTPD had an emergency call that required all staff to address the call. 2. Amy Kaminski discussed the data collection process including traffic counts, speed data, traffic volume data and historical crash records along with field investigations which included: sidewalks, pavement markings, traffic control measures, pedestrian accommodations and sight distance evaluations. 65 E. Butler Ave Suite 100 New Britain, PA Phone: Fax:
57 County Line Road Corridor Analysis File No September 11, 2018 Page 2 of 2 3. The following comments were provided during the question and answer period of the meeting: Consider installing a signal at Montrose & Lancaster Sight lines are poor at Conestoga and Montrose; parked vehicles reduce visibility Pedestrian crossing at Montrose and Lancaster is very difficult PD should consider a patrol in the area to deter speeding particularly on Montrose Motorists do not stop for school busses There is a bottleneck at Montrose & County Line Road; consider peak hour parking prohibition Provide a pedestrian crosswalk placard at Montrose and County Line Road Consider traffic calming on County Line Road near this section and near railroad tracks Montrose high pedestrian traffic to and from Conestoga High pedestrian traffic to and from the train/trolley: Norristown High Speed Line (NHSL) at both S. Roberts Road and S. Bryn Mawr Ave/Glenbrook Ave: Residents noted the disparity of 2 hr. parking (LMT) and 4 hr. parking (RT) on Montrose. Residents have concerns with nearby apartments parking on Montrose Residents questioned why Lancaster is posted at 25 MPH where Conestoga is posted at 35 MPH Visibility on Montrose is poor due to grade differential (negative from Lancaster to County Line Road to Conestoga on average -4%) Petrie Ave (1 way southwest bound) is narrower but appears to have higher speeds No sidewalks along north side of Conestoga Motorists do not stop for pedestrians at Montrose/Lancaster crosswalk (only one sign at the crosswalk on the eastbound, south side of crossing.) No advanced warning signs on both approaches of Lancaster Avenue. Delay along both Conestoga Road and County Line Road encourages motorists to cut through on Montrose and Roberts Road. 4. Residents were provided a corridor plan set and were asked to provide their safety concerns on the plan with post it notes. Any repeats were to be check marked if others shared similar concerns. 5. Residents asked if there would be an list prepared to keep stakeholders informed of the project progress.
 Radnor & Lower Merion Townships; Delaware & Montgomery Counties G&A Job #16-11060.")
58 MEETING NOTES Date of Meeting: January 29, 2019 Time of Meeting: Location: Project: Notes Prepared By: 7:00 PM Ludington Library 5 S. Bryn Mawr Avenue Bryn Mawr, PA County Line Road Corridor Study County Line Road (S.R. 1001) Radnor & Lower Merion Townships; Delaware & Montgomery Counties G&A Job # Leslie Salsbury Date Finalized: February 1, 2019 Attendees: Commissioner John Nagle/W-5 RT Commissioner W jnagle@radnor.org Superintendent Chris Flanagan RTPD cflanagan@radnor.org Steve Norcini, P.E. RT Engineer snorcini@radnor.org Brian Keaveney Pennoni bkeaveney@pennoni.com Ernie McNeely LMT Manager emcneely@lowermerion.org Commissioner Scott Zelov LMT Commissioner W vscottzelov@lowermerion.org Superintendent Michael McGrath LMT PD mmcgrath@lowermerion.org Leslie Salsbury, P.E. Gilmore & Assoc. Inc lsalsbury@gilmore-assoc.com Amy Kaminski, P.E., PTOE Gilmore & Assoc. Inc akaminski@gilmore-assoc.com Residents of Radnor and Lower Merion Township attended this meeting A meeting was held to present the draft report for the corridor project and obtain input on noted problems and safety concerns along the corridor. The following summarizes the discussion: 1. Commissioner Scott Zelov and Commissioner John Nagle opened the meeting with a brief discussion regarding the history of the project. They explained that a draft report was created and that additional input from this meeting would be addressed in the final report. They then introduced Amy Kaminski and Leslie Salsbury to begin the presentation. 2. Amy Kaminski discussed the data collection process including traffic counts, speed data, traffic volume data and historical crash records along with field investigations which included: sidewalks, pavement markings, traffic control measures, pedestrian accommodations and sight distance evaluations. 65 E. Butler Ave Suite 100 New Britain, PA Phone: Fax:
59 County Line Road Corridor Analysis File No February 1, 2019 Page 2 of 2 3. The following comments were provided during the question and answer period of the meeting: Parking on Roberts & Montrose does not allow for two cars to pass at one time Many pedestrians cross at Old Lancaster Road from the park to the shopping center across the street, potential location for an RRFB When cars turn left onto Roberts they pull onto driveway/sidewalk to allow westbound cars to pass Consider investigating channelized islands at Montrose or Roberts after the signal gets installed An advantage of installing a signal at Montrose is that it provides a central crossing location between Lancaster and Conestoga Concerns with RRFB s being ignored and the flash seen as more of a recommendation Roundabout at Thomas/Glenbrook/Conestoga intersection There is more room for cars to pass on Montrose than Roberts Utilize the green space at Warner Avenue Park to widen County Line Road and allow for bikes lanes Difficult for pedestrians to walk along Roberts Road west of County Line Road, shrubs, poles and sometimes snow forces them into the cartway County Line Road seems to be the only section in the area that is not posted at 25 mph High speeds on Conestoga between overpass and Glenbrook Does a center left turn lane cause people to slow down or speed up? Will emergency vehicles have more difficulty getting to the hospital with a three lane cross section? Residents noted that there are multiple locations where brush covers/blocks sidewalks and/or signs. Township representatives noted that they should be informed right away and this would be taken care of Difficult to make the left turn from westbound Lancaster onto County Line Queues at Sunoco back-up towards CVS Which improvements are eligible for grants?
60 APPENDIX B Sight Distance Evaluation
61 Minimum Stopping Sight Distance Job No County: Delaware County Muncipality: Radnor Township Location: County Line Road & Montrose Avenue PA Code Title 67; 441 SSD= 1.47VT + (V²)/30(f ± g) Eastbound Exiting Motorist LEFT- SSD Minimum Calc. Existing in Field SSD = Stopping Sight Distance V = 85th Percentile Speed (miles per hour) T = Perception Time of Driver (2.5 seconds) f = Coefficient of Friction for Wet Pavements g = Percent of Grade of Roadway Divided by 100 Minimum Calc. Existing in Field SSD = SSD = V = 38 V = 43 T = 2.5 T = 2.5 f = 0.32 f = 0.31 g = 2.3 g = -2.5 PennDOT Form M-950 "A" Westbound Exiting Motorist LEFT- SSD Minimum Calc. Existing in Field Minimum Calc. RIGHT-SSD RIGHT-SSD Existing in Field SSD = SSD = V = 43 V = 38 T = 2.5 T = 2.5 f = 0.31 f = 0.32 g = -2.5 g = 2.3 Minimum Stopping Sight Distance (feet) Grade = 85th Percentile Coefficient of Speed Friction -10% -5% 0% 5% 10% Conclusion: Eastbound left sight distance is deficient due to shrubs and vegetation along the adjacent propery frontage. Consider trimming the vegetation to improve sight distance. Date: 7/9/2018 Compiled by: LAS Checked by: ABK (Calculations)
62 Minimum Stopping Sight Distance Job No County: Delaware County Muncipality: Radnor Township Location: County Line Road & Roberts Road PA Code Title 67; 441 SSD= 1.47VT + (V²)/30(f ± g) Eastbound Exiting Motorist LEFT- SSD Minimum Calc. Existing in Field SSD = Stopping Sight Distance V = 85th Percentile Speed (miles per hour) T = Perception Time of Driver (2.5 seconds) f = Coefficient of Friction for Wet Pavements g = Percent of Grade of Roadway Divided by 100 Minimum Calc. Existing in Field SSD = SSD = V = 38 V = 43 T = 2.5 T = 2.5 f = 0.32 f = 0.31 g = 1.5 g = -3.0 PennDOT Form M-950 "A" Westbound Exiting Motorist LEFT- SSD Minimum Calc. Existing in Field Minimum Calc. RIGHT-SSD RIGHT-SSD Existing in Field SSD = SSD = V = 43 V = 38 T = 2.5 T = 2.5 f = 0.31 f = 0.32 g = -3 g = 1.5 Minimum Stopping Sight Distance (feet) Grade = 85th Percentile Coefficient of Speed Friction -10% -5% 0% 5% 10% Conclusion: No sight distance deficiencies noted. Date: 7/9/2018 Compiled by: LAS Checked by: ABK (Calculations)
63 Minimum Stopping Sight Distance Job No County: Delaware County Muncipality: Radnor Township Location: County Line Road & Old Lancaster Road PA Code Title 67; 441 SSD= 1.47VT + (V²)/30(f ± g) Westbound Exiting Motorist LEFT- SSD Minimum Calc. Existing in Field SSD = Stopping Sight Distance V = 85th Percentile Speed (miles per hour) T = Perception Time of Driver (2.5 seconds) f = Coefficient of Friction for Wet Pavements g = Percent of Grade of Roadway Divided by 100 Minimum Calc. RIGHT-SSD Existing in Field SSD = SSD = V = 40 V = 38 T = 2.5 T = 2.5 f = 0.32 f = 0.31 g = -2.5 g = 1.5 PennDOT Form M-950 "A" Minimum Stopping Sight Distance (feet) Grade = 85th Percentile Coefficient of Speed Friction -10% -5% 0% 5% 10% Conclusion: Westbound left sight distance is deficient due to existing vegetation along County Line Road. Consider trimming the vegetation to improve sight distance. Date: 7/9/2018 Compiled by: LAS Checked by: ABK (Calculations)
/30(f ± g) Westbound Exiting Motorist LEFT- SSD Minimum Calc. Existing in Field SSD = Stopping Sight Distance V = 85th Percentile Speed (miles per hour) T = Perception Time of Driver (2.")
64 Minimum Stopping Sight Distance Job No County: Delaware County Muncipality: Radnor Township Location: County Line Road & Modella Avenue PA Code Title 67; 441 SSD= 1.47VT + (V²)/30(f ± g) Westbound Exiting Motorist LEFT- SSD Minimum Calc. Existing in Field SSD = Stopping Sight Distance V = 85th Percentile Speed (miles per hour) T = Perception Time of Driver (2.5 seconds) f = Coefficient of Friction for Wet Pavements g = Percent of Grade of Roadway Divided by 100 Minimum Calc. RIGHT-SSD Existing in Field SSD = SSD = V = 40 V = 38 T = 2.5 T = 2.5 f = 0.32 f = 0.31 g = 1.6 g = -1.3 PennDOT Form M-950 "A" Minimum Stopping Sight Distance (feet) Grade = 85th Percentile Coefficient of Speed Friction -10% -5% 0% 5% 10% Conclusion: No sight distance deficiencies noted. Date: 7/9/2018 Compiled by: LAS Checked by: ABK (Calculations)


65 Project Photo Sheet County: Delaware County Municipality: Radnor Township Intersection: County Line Road Job Number: Photo 1: Eastbound Montorse Ave, looking left. Photo 2: Eastbound Montrose Ave, looking right. Photo 3: Westbound Montorse Ave, looking left. Photo 4: Westbound Montrose Ave, looking right. Photo 5: Eastbound Roberts Road, looking left. Photo 6: Eastbound Roberts Road, looking right (Calculations)


66 Project Photo Sheet County: Delaware County Municipality: Radnor Township Intersection: County Line Road Job Number: Photo 7: Westbound Roberts Road, looking left. Photo 8: Westbound Roberts Road, looking right. Photo 9: Westbound Old Lancaster Rd, looking left. Photo 10: Westbound Old Lancaster Rd, looking right. Photo 11: Westbound Mondella Ave, looking left. Photo 12: Westbound Mondella Ave, looking right (Calculations)
67 APPENDIX C Collision Diagrams
68 County Line Road Corridor Analysis Radnor Township and Lower Merion Township County Line Road (SR 1001) & Montrose Avenue Collision Diagram Montrose Ave County Line Road (SR 1001) County Line Road (SR 1001) Montrose Ave /18/ of 10
69 County Line Road Corridor Analysis Radnor Township and Lower Merion Township County Line Road (SR 1001) & Roberts Road Collision Diagram Roberts Road County Line Road (SR 1001) Roberts Road /18/ of 10
70 County Line Road Corridor Analysis Radnor Township and Lower Merion Township County Line Road (SR 1001) & Conestoga Road & Glenbrook Avenue & Thomas Avenue Collision Diagram Thomas Avenue County Line Road (SR 1001) Conestoga Road Glenbrook Avenue 9/18/ of 10
71 County Line Road Corridor Analysis Radnor Township and Lower Merion Township County Line Road (SR 1001) & S Warner Avenue & Old Lancaster Road Collision Diagram S Warner Avenue Old Lancaster Road County Line Road (SR 1001) /18/ of 10
72 County Line Road Corridor Analysis Radnor Township and Lower Merion Township County Line Road (SR 1001) & Mondella Avenue Collision Diagram Mondella Avenue County Line Road (SR 1001) 9/18/ of 10
73 County Line Road Corridor Analysis Radnor Township and Lower Merion Township County Line Road (SR 1001) & Lindsay Avenue Collision Diagram Lindsay Avenue County Line Road SR (1001) 9/18/ of 10
74 County Line Road Corridor Analysis Radnor Township and Lower Merion Township County Line Road (SR 1001) & Bryn Mawr Avenue & Glenbrook Ave & Railroad Ave & Haverford Road Collision Diagram Glenbrook Avenue Bryn Mawr Avenue County Line Road SR (1001) Bryn Mawr Avenue Railroad Avenue Haverford Road /18/ of 10
75 County Line Road Corridor Analysis Radnor Township and Lower Merion Township County Line Road (SR 1001) & Haverford Road & Landover Road Collision Diagram County Line Road (SR 1001) Haverford Road Landover Road 9/18/ of 10
76 County Line Road Corridor Analysis Radnor Township and Lower Merion Township County Line Road (SR 1001) & Lancaster Avenue Collision Diagram McDonalds Entrance Lancaster Avenue County Line Road (SR 1001) /18/ of 10
77 County Line Road Corridor Analysis Radnor Township and Lower Merion Township County Line Road (SR 1001) & Arthur Avenue Collision Diagram County Line Road (SR 1001) Arthur Road 9/18/ of 10
78 APPENDIX D Traffic Signal Warrant Analyses
79 Traffic Signal Warrant Analysis Workbook 10/11/2018 Municipality: Radnor Township Analysis Date: 8/27/2018 County: Delaware County Conducted By: LAS PennDOT Engineering District: 6 Agency/Company Name: G&A Data Collection Date: 12/1/2016 Day of the Week: Tuesday STUDY AND ANALYSIS INFORMATION Analysis Information Is the intersection in a built-up area of an isolated community of <10,000 population? No Major Street Information Major Street Name and Route Number: County Line Road Major Street Approach #1 Direction: N-Bound Major Street Approach #2 Direction: S-Bound Number of Lanes for Moving Traffic on Each Major Street Approach: Speed Limit or 85th Percentile Speed on the Major Street: 2 LANE(S) 40.5 MPH Minor Street Information Minor Street Name and Route Number: Montrose Ave Minor Street Approach #1 Direction: E-Bound Minor Street Approach #2 Direction: W-Bound Number of Lanes for Moving Traffic on Each Minor Street Approach: 1 LANE(S) TRAFFIC SIGNAL WARRANT ANALYSIS FINDINGS Warrant 1, Eight-Hour Vehicular Volume Warrant 2, Four-Hour Vehicular Volume Warrant 3, Peak Hour Warrant 4, Pedestrian Volume Warrant 5, School Crossing Warrant 6, Coordinated Signal System Warrant 7, Crash Experience Warrant 8, Roadway Network Warrant 9, Intersection Near a Grade Crossing Warrant PA-1, ADT Volume Warrant Warrant PA-2, Midblock and Trail Crossings Applicable? Yes Yes Yes Yes No No Yes No No No No Warrant Met? Yes Yes No No N/A N/A No N/A N/A N/A N/A Traffic Signal Warrant Analysis MONTROSE
80 Traffic Signal Warrant Analysis Workbook 10/11/2018 ENTER VOLUME DATA PER 15 MINUTE INTERVAL, PER APPROACH Major Street Major Street Minor Street Minor Street Major Street Approach #1 Approach #2 Approach #1 Approach #2 Combined Time Interval (N-Bound) (S-Bound) (E-Bound) (W-Bound) Begin At End Of Volume Volume Total Volume Volume Volume 12:00 AM 12:14 AM 0 12:15 AM 12:29 AM 0 12:30 AM 12:44 AM 0 12:45 AM 12:59 AM 0 1:00 AM 1:14 AM 0 1:15 AM 1:29 AM 0 1:30 AM 1:44 AM 0 1:45 AM 1:59 AM 0 2:00 AM 2:14 AM 0 2:15 AM 2:29 AM 0 2:30 AM 2:44 AM 0 2:45 AM 2:59 AM 0 3:00 AM 3:14 AM 0 3:15 AM 3:29 AM 0 3:30 AM 3:44 AM 0 3:45 AM 3:59 AM 0 4:00 AM 4:14 AM 0 4:15 AM 4:29 AM 0 4:30 AM 4:44 AM 0 4:45 AM 4:59 AM 0 5:00 AM 5:14 AM 0 5:15 AM 5:29 AM 0 5:30 AM 5:44 AM 0 5:45 AM 5:59 AM 0 6:00 AM 6:14 AM :15 AM 6:29 AM :30 AM 6:44 AM :45 AM 6:59 AM :00 AM 7:14 AM :15 AM 7:29 AM :30 AM 7:44 AM :45 AM 7:59 AM :00 AM 8:14 AM :15 AM 8:29 AM :30 AM 8:44 AM :45 AM 8:59 AM :00 AM 9:14 AM :15 AM 9:29 AM :30 AM 9:44 AM :45 AM 9:59 AM :00 AM 10:14 AM :15 AM 10:29 AM :30 AM 10:44 AM :45 AM 10:59 AM :00 AM 11:14 AM :15 AM 11:29 AM :30 AM 11:44 AM :45 AM 11:59 AM Traffic Signal Warrant Analysis MONTROSE
81 Traffic Signal Warrant Analysis Workbook 10/11/2018 ENTER VOLUME DATA PER 15 MINUTE INTERVAL, PER APPROACH Major Street Major Street Minor Street Minor Street Major Street Approach #1 Approach #2 Approach #1 Approach #2 Combined Time Interval (N-Bound) (S-Bound) (E-Bound) (W-Bound) Begin At End Of Volume Volume Total Volume Volume Volume 12:00 PM 12:14 PM :15 PM 12:29 PM :30 PM 12:44 PM :45 PM 12:59 PM :00 PM 1:14 PM :15 PM 1:29 PM :30 PM 1:44 PM :45 PM 1:59 PM :00 PM 2:14 PM :15 PM 2:29 PM :30 PM 2:44 PM :45 PM 2:59 PM :00 PM 3:14 PM :15 PM 3:29 PM :30 PM 3:44 PM :45 PM 3:59 PM :00 PM 4:14 PM :15 PM 4:29 PM :30 PM 4:44 PM :45 PM 4:59 PM :00 PM 5:14 PM :15 PM 5:29 PM :30 PM 5:44 PM :45 PM 5:59 PM :00 PM 6:14 PM :15 PM 6:29 PM :30 PM 6:44 PM :45 PM 6:59 PM :00 PM 7:14 PM 0 7:15 PM 7:29 PM 0 7:30 PM 7:44 PM 0 7:45 PM 7:59 PM 0 8:00 PM 8:14 PM 0 8:15 PM 8:29 PM 0 8:30 PM 8:44 PM 0 8:45 PM 8:59 PM 0 9:00 PM 9:14 PM 0 9:15 PM 9:29 PM 0 9:30 PM 9:44 PM 0 9:45 PM 9:59 PM 0 10:00 PM 10:14 PM 0 10:15 PM 10:29 PM 0 10:30 PM 10:44 PM 0 10:45 PM 10:59 PM 0 11:00 PM 11:14 PM 0 11:15 PM 11:29 PM 0 11:30 PM 11:44 PM 0 11:45 PM 11:59 PM 0 Approach Totals: Traffic Signal Warrant Analysis MONTROSE
82 MUTCD Warrant 1 Sheet 1 of 1 Number of Lanes for Moving Traffic on Each Approach Major Street: 2 or More Lanes Minor Street: 1 Lane MUTCD WARRANT 1, EIGHT-HOUR VEHICULAR VOLUME Built-up Isolated Community With Less Than 10,000 Population or Above 40 MPH on Major Street? Yes Combination of Conditions A and B Necessary?*: No *Only applicable for Warrant 1 if after an adequate trial of other alternatives that could cause less delay and inconvenience to traffic has failed to solve the traffic problems. See Section 4C.02 of the 2009 MUTCD for application. Number of lanes for moving traffic on each approach Condition A - Minimum Vehicular Volume Vehicles per hour on major street (total of both approaches) Vehicles per hour on higher-volume minor street approach (one direction only) Major Street Minor Street 100% 80% 70% 56% 100% 80% 70% 56% or More or More 2 or More or More Number of lanes for moving traffic on each approach Condition B - Interruption of Continuous Traffic Vehicles per hour on major street (total of both approaches) Vehicles per hour on higher-volume minor street approach (one direction only) Major Street Minor Street 100% 80% 70% 56% 100% 80% 70% 56% or More or More 2 or More or More Condition A Evaluation Number of Unique Hours Met: 4 Condition A Satisfied? No Condition B Evaluation Number of Unique Hours Met: 12 Condition B Satisfied? Yes Combination of Condition A and Condition B Evaluation Number of Unique Hours Met for Condition A: Number of Unique Hours Met for Condition B: Combination of Condition A and Condition B Satisfied? N/A N/A N/A 10/11/2018 Traffic Signal Warrant Analysis MONTROSE
83 MUTCD Warrant 2 Page 6 of 16 MUTCD WARRANT 2, FOUR-HOUR VEHICULAR VOLUME Number of Lanes for Moving Traffic on Each Approach Total Number of Unique Hours Met On Figure 4C-2 Major Street: 2 or More Lanes 10 Minor Street: 1 Lane Built-up Isolated Community With Less Than 10,000 Population or Above 40 MPH on Major Street? Yes Hourly Vehicular Volume Hour Interval Major Street Combined Highest Minor Street Approach Beginning At Vehicles Per Hour (VPH) Vehicles Per Hour (VPH) Hour Met? 12:00 AM :15 AM :30 AM :45 AM 0 0 1:00 AM 0 0 1:15 AM 0 0 1:30 AM 0 0 1:45 AM 0 0 2:00 AM 0 0 2:15 AM 0 0 2:30 AM 0 0 2:45 AM 0 0 3:00 AM 0 0 3:15 AM 0 0 3:30 AM 0 0 3:45 AM 0 0 4:00 AM 0 0 4:15 AM 0 0 4:30 AM 0 0 4:45 AM 0 0 5:00 AM 0 0 5:15 AM :30 AM :45 AM :00 AM :15 AM :30 AM :45 AM Met 7:00 AM Met 7:15 AM Met 7:30 AM Met 7:45 AM Met 8:00 AM Met 8:15 AM Met 8:30 AM Met 8:45 AM Met 9:00 AM Met 9:15 AM Met 9:30 AM :45 AM :00 AM :15 AM :30 AM :45 AM :00 AM :15 AM :30 AM Met 11:45 AM Met 10/11/2018 Traffic Signal Warrant Analysis MONTROSE
84 MUTCD Warrant 2 Page 7 of 16 Hourly Vehicular Volume Hour Interval Major Street Combined Highest Minor Street Approach Beginning At Vehicles Per Hour (VPH) Vehicles Per Hour (VPH) Hour Met? 12:00 PM Met 12:15 PM Met 12:30 PM Met 12:45 PM Met 1:00 PM Met 1:15 PM :30 PM Met 1:45 PM Met 2:00 PM Met 2:15 PM Met 2:30 PM Met 2:45 PM Met 3:00 PM Met 3:15 PM Met 3:30 PM Met 3:45 PM Met 4:00 PM Met 4:15 PM Met 4:30 PM Met 4:45 PM Met 5:00 PM Met 5:15 PM Met 5:30 PM Met 5:45 PM Met 6:00 PM Met 6:15 PM :30 PM :45 PM :00 PM 0 0 7:15 PM 0 0 7:30 PM 0 0 7:45 PM 0 0 8:00 PM 0 0 8:15 PM 0 0 8:30 PM 0 0 8:45 PM 0 0 9:00 PM 0 0 9:15 PM 0 0 9:30 PM 0 0 9:45 PM :00 PM :15 PM :30 PM :45 PM :00 PM /11/2018 Traffic Signal Warrant Analysis MONTROSE
85 MUTCD Warrant 3 Page 8 of 16 MUTCD WARRANT 3, PEAK HOUR Number of Lanes for Moving Traffic on Each Approach Major Street: 2 or More Lanes Minor Street: 1 Lane Built-up Isolated Community With Less Than 10,000 Population or Above 40 MPH on Major Street? Is this signal warrant being applied for an unusual case, such as office complexes, manufacturing plants, industrial complexes, or high-occupancy vehicle facilities that attract or discharge large numbers of vehicles over a short time? Yes No Indicate whether all three of the following conditions for the same 1 hour (any four consecutive 15- minute periods) of an average day are present* Does the total stopped time delay experienced by the traffic on one minor-street approach (one direction only) controlled by a STOP sign equal or exceed 4 vehicle-hours for a one-lane approach or 5 vehicle-hours for a two-lane approach? Does the volume on the same minor-street approach (one direction only) equal or exceed 100 vehicles per hour for one moving lane of traffic or 150 vehicles per hour for two moving lanes? Does the total entering volume serviced during the hour equal or exceed 650 vehicles per hour for intersection with three approaches or 800 vehicles per hour for intersections with four or more approaches? *If applicable, attach all supporting calculations and documentation. N/A N/A N/A Total Number of Unique Hours Met On Figure 4C-4 4 Hourly Vehicular Volume Hour Interval Major Street Combined Highest Minor Street Approach Beginning At Vehicles Per Hour (VPH) Vehicles Per Hour (VPH) Hour Met? 12:00 AM :15 AM :30 AM :45 AM 0 0 1:00 AM 0 0 1:15 AM 0 0 1:30 AM 0 0 1:45 AM 0 0 2:00 AM 0 0 2:15 AM 0 0 2:30 AM 0 0 2:45 AM 0 0 3:00 AM 0 0 3:15 AM 0 0 3:30 AM 0 0 3:45 AM 0 0 4:00 AM 0 0 4:15 AM 0 0 4:30 AM 0 0 4:45 AM 0 0 5:00 AM 0 0 5:15 AM :30 AM :45 AM :00 AM :15 AM :30 AM :45 AM :00 AM :15 AM Met 7:30 AM Met 7:45 AM Met 8:00 AM Met 8:15 AM Met 10/11/2018 Traffic Signal Warrant Analysis MONTROSE
86 MUTCD Warrant 3 Page 9 of 16 Hourly Vehicular Volume Hour Interval Major Street Combined Highest Minor Street Approach Beginning At Vehicles Per Hour (VPH) Vehicles Per Hour (VPH) Hour Met? 8:30 AM :45 AM :00 AM :15 AM :30 AM :45 AM :00 AM :15 AM :30 AM :45 AM :00 AM :15 AM :30 AM :45 AM :00 PM :15 PM :30 PM :45 PM :00 PM :15 PM :30 PM :45 PM :00 PM :15 PM :30 PM :45 PM :00 PM :15 PM :30 PM :45 PM Met 4:00 PM Met 4:15 PM Met 4:30 PM Met 4:45 PM Met 5:00 PM Met 5:15 PM Met 5:30 PM Met 5:45 PM :00 PM :15 PM :30 PM :45 PM :00 PM 0 0 7:15 PM 0 0 7:30 PM 0 0 7:45 PM 0 0 8:00 PM 0 0 8:15 PM 0 0 8:30 PM 0 0 8:45 PM 0 0 9:00 PM 0 0 9:15 PM 0 0 9:30 PM 0 0 9:45 PM :00 PM :15 PM :30 PM :45 PM :00 PM /11/2018 Traffic Signal Warrant Analysis MONTROSE
87 MUTCD Warrant 4 Page 10 of 16 MUTCD WARRANT 4, PEDESTRIAN VOLUME Built-up Isolated Community With Less Than 10,000 Population or Above 35 MPH on Major Street? 15th Percentile Pedestrian Crossing Speed Less than 3.5 f/s?* *If applicable, attach all supporting calculations, documentation, and findings. Is the distance to the nearest traffic control signal or STOP sign controlling the major street that pedestrians desire to cross less than 300 feet? If the distance to the nearest traffic control signal or STOP sign controlling the major street that pedestrians desire to cross is less than 300 feet, will the proposed traffic control signal restrict the progressive movement of traffic?* *If applicable, attach supporting justification. Total Number of Unique Hours Met for Criterion A: Total Number of Unique Hours Met for Criterion B: Yes No No No 0 0 Hourly Vehicular & Pedestrian Volume Hour Interval Major Street Combined Total of All Pedestrians Crossing Major Street Criterion A: 4-Hour Criterion B: 1-Hour Beginning At Vehicles Per Hour (VPH) Pedestrians Per Hour (PPH) Hour Met on Figure 4C-6? Hour Met on Figure 4C-8? 12:00 AM 0 12:15 AM 0 12:30 AM 0 12:45 AM 0 1:00 AM 0 1:15 AM 0 1:30 AM 0 1:45 AM 0 2:00 AM 0 2:15 AM 0 2:30 AM 0 2:45 AM 0 3:00 AM 0 3:15 AM 0 3:30 AM 0 3:45 AM 0 4:00 AM 0 4:15 AM 0 4:30 AM 0 4:45 AM 0 5:00 AM 0 5:15 AM 75 5:30 AM 190 5:45 AM 354 6:00 AM 549 6:15 AM 680 6:30 AM 793 6:45 AM 895 7:00 AM :15 AM :30 AM :45 AM :00 AM :15 AM :30 AM :45 AM :00 AM :15 AM 958 9:30 AM 886 9:45 AM /11/2018 Traffic Signal Warrant Analysis MONTROSE
88 MUTCD Warrant 4 Page 11 of 16 Hourly Vehicular & Pedestrian Volume Hour Interval Major Street Combined Total of All Pedestrians Crossing Major Street Criterion A: 4-Hour Criterion B: 1-Hour Beginning At Vehicles Per Hour (VPH) Pedestrians Per Hour (PPH) Hour Met on Figure 4C-6? Hour Met on Figure 4C-8? 10:00 AM :15 AM :30 AM :45 AM :00 AM :15 AM :30 AM :45 AM :00 PM :15 PM :30 PM :45 PM 911 1:00 PM :15 PM 891 1:30 PM 937 1:45 PM 932 2:00 PM :15 PM :30 PM :45 PM :00 PM :15 PM :30 PM :45 PM :00 PM :15 PM :30 PM :45 PM :00 PM :15 PM :30 PM :45 PM :00 PM :15 PM 725 6:30 PM 452 6:45 PM 223 7:00 PM 0 7 7:15 PM 0 7:30 PM 0 7:45 PM 0 8:00 PM 0 8:15 PM 0 8:30 PM 0 8:45 PM 0 9:00 PM 0 9:15 PM 0 9:30 PM 0 9:45 PM 0 10:00 PM 0 10:15 PM 0 10:30 PM 0 10:45 PM 0 11:00 PM 0 10/11/2018 Traffic Signal Warrant Analysis MONTROSE
89 MUTCD Warrant 7 and 8 Sheet 1 of 1 MUTCD WARRANT 7, CRASH EXPERIENCE Built-up Isolated Community With Less Than 10,000 Population or Above 40 MPH on Major Street? Yes Number of Lanes for Moving Traffic on Each Approach Major Street: 2 or More Lanes Minor Street: 1 Lane Has adequate trial of alternatives with satisfactory observance and enforcement failed to reduce the crash frequency? Five or more reportable and/or non-reportable crashes, of types susceptible to correction by a traffic control signal, have occurred within a 12-month period during the most recent 3 years of available crash data.* *If applicable, attach a summary of the crash data analysis used for this criterion. For each of any 8 hours of an average day, the vehicles per hour given in both the 80% columns of Condition A in Table 4C-1 exists on the major-street and the higher-volume minor-street approach, respectively, to the intersection. For each of any 8 hours of an average day, the vehicles per hour given in both the 80% columns of Condition B in Table 4C-1 exists on the major-street and the higher-volume minor-street approach, respectively, to the intersection. The volume of pedestrian traffic is not less than 80% of the requirements specified in Warrant 4, the Pedestrian Volume warrant.* *If applicable, attach all supporting calculations and documentation. No Yes No Yes N/A MUTCD WARRANT 8, ROADWAY NETWORK* Is the major street classified as an Urban Extension, Principal Arterial, or Minor Arterial that is a reasonable connection between two Principal Arterials and/or Urban Extensions as shown on the official Functional Classification Map? Does the intersection have a total existing, or immediately projected, entering volume of at least 1,000 vehicles per hour during the peak hour of a typical weekday and has 5-year projected traffic volumes, based on an engineering study, that meet one or more of Warrants 1,2, and 3 during an average weekday? Does the intersection have a total existing or immediately projected entering volume of at least 1,000 vehicles per hour for each of any 5 hours of a non-normal business day (Saturday or Sunday)? Is the major street part of the street or highway system that serves as the principal roadway network for through traffic flow? Does the major street include rural or suburban highways outside, entering, or traversing a city? Does the major street appear as a major route on an official plan, such as a major street plan in an urban area traffic and transportation study? No No No No No No *Refer to Section 4.3 of PennDOT Publication 46 (Traffic Engineering Manual) for additional Department documentation requirements to justify the installation of a signal under Warrant 8. Attach all supplementary documentation and calculations, especially those relating to traffic volume projections and subsequent Warrant analyses. 10/11/2018 Traffic Signal Warrant Analysis MONTROSE
90 Traffic Signal Warrant Analysis Workbook 10/11/2018 Municipality: Radnor Township Analysis Date: 8/27/2018 County: Delaware County Conducted By: LAS PennDOT Engineering District: 6 Agency/Company Name: G&A Data Collection Date: 1/31/2017 Day of the Week: Thursday STUDY AND ANALYSIS INFORMATION Analysis Information Is the intersection in a built-up area of an isolated community of <10,000 population? No Major Street Information Major Street Name and Route Number: County Line Road Major Street Approach #1 Direction: N-Bound Major Street Approach #2 Direction: S-Bound Number of Lanes for Moving Traffic on Each Major Street Approach: Speed Limit or 85th Percentile Speed on the Major Street: 2 LANE(S) 40.5 MPH Minor Street Information Minor Street Name and Route Number: Roberts Road Minor Street Approach #1 Direction: E-Bound Minor Street Approach #2 Direction: W-Bound Number of Lanes for Moving Traffic on Each Minor Street Approach: 1 LANE(S) TRAFFIC SIGNAL WARRANT ANALYSIS FINDINGS Warrant 1, Eight-Hour Vehicular Volume Warrant 2, Four-Hour Vehicular Volume Warrant 3, Peak Hour Warrant 4, Pedestrian Volume Warrant 5, School Crossing Warrant 6, Coordinated Signal System Warrant 7, Crash Experience Warrant 8, Roadway Network Warrant 9, Intersection Near a Grade Crossing Warrant PA-1, ADT Volume Warrant Warrant PA-2, Midblock and Trail Crossings Applicable? Yes Yes Yes Yes No No Yes No No No No Warrant Met? Yes Yes No No N/A N/A No N/A N/A N/A N/A Traffic Signal Warrant Analysis ROBERTS
91 Traffic Signal Warrant Analysis Workbook 10/11/2018 ENTER VOLUME DATA PER 15 MINUTE INTERVAL, PER APPROACH Major Street Major Street Minor Street Minor Street Major Street Approach #1 Approach #2 Approach #1 Approach #2 Combined Time Interval (N-Bound) (S-Bound) (E-Bound) (W-Bound) Begin At End Of Volume Volume Total Volume Volume Volume 12:00 AM 12:14 AM 0 12:15 AM 12:29 AM 0 12:30 AM 12:44 AM 0 12:45 AM 12:59 AM 0 1:00 AM 1:14 AM 0 1:15 AM 1:29 AM 0 1:30 AM 1:44 AM 0 1:45 AM 1:59 AM 0 2:00 AM 2:14 AM 0 2:15 AM 2:29 AM 0 2:30 AM 2:44 AM 0 2:45 AM 2:59 AM 0 3:00 AM 3:14 AM 0 3:15 AM 3:29 AM 0 3:30 AM 3:44 AM 0 3:45 AM 3:59 AM 0 4:00 AM 4:14 AM 0 4:15 AM 4:29 AM 0 4:30 AM 4:44 AM 0 4:45 AM 4:59 AM 0 5:00 AM 5:14 AM 0 5:15 AM 5:29 AM 0 5:30 AM 5:44 AM 0 5:45 AM 5:59 AM 0 6:00 AM 6:14 AM :15 AM 6:29 AM :30 AM 6:44 AM :45 AM 6:59 AM :00 AM 7:14 AM :15 AM 7:29 AM :30 AM 7:44 AM :45 AM 7:59 AM :00 AM 8:14 AM :15 AM 8:29 AM :30 AM 8:44 AM :45 AM 8:59 AM :00 AM 9:14 AM :15 AM 9:29 AM :30 AM 9:44 AM :45 AM 9:59 AM :00 AM 10:14 AM :15 AM 10:29 AM :30 AM 10:44 AM :45 AM 10:59 AM :00 AM 11:14 AM :15 AM 11:29 AM :30 AM 11:44 AM :45 AM 11:59 AM Traffic Signal Warrant Analysis ROBERTS
92 Traffic Signal Warrant Analysis Workbook 10/11/2018 ENTER VOLUME DATA PER 15 MINUTE INTERVAL, PER APPROACH Major Street Major Street Minor Street Minor Street Major Street Approach #1 Approach #2 Approach #1 Approach #2 Combined Time Interval (N-Bound) (S-Bound) (E-Bound) (W-Bound) Begin At End Of Volume Volume Total Volume Volume Volume 12:00 PM 12:14 PM :15 PM 12:29 PM :30 PM 12:44 PM :45 PM 12:59 PM :00 PM 1:14 PM :15 PM 1:29 PM :30 PM 1:44 PM :45 PM 1:59 PM :00 PM 2:14 PM :15 PM 2:29 PM :30 PM 2:44 PM :45 PM 2:59 PM :00 PM 3:14 PM :15 PM 3:29 PM :30 PM 3:44 PM :45 PM 3:59 PM :00 PM 4:14 PM :15 PM 4:29 PM :30 PM 4:44 PM :45 PM 4:59 PM :00 PM 5:14 PM :15 PM 5:29 PM :30 PM 5:44 PM :45 PM 5:59 PM :00 PM 6:14 PM 0 6:15 PM 6:29 PM 0 6:30 PM 6:44 PM 0 6:45 PM 6:59 PM 0 7:00 PM 7:14 PM 0 7:15 PM 7:29 PM 0 7:30 PM 7:44 PM 0 7:45 PM 7:59 PM 0 8:00 PM 8:14 PM 0 8:15 PM 8:29 PM 0 8:30 PM 8:44 PM 0 8:45 PM 8:59 PM 0 9:00 PM 9:14 PM 0 9:15 PM 9:29 PM 0 9:30 PM 9:44 PM 0 9:45 PM 9:59 PM 0 10:00 PM 10:14 PM 0 10:15 PM 10:29 PM 0 10:30 PM 10:44 PM 0 10:45 PM 10:59 PM 0 11:00 PM 11:14 PM 0 11:15 PM 11:29 PM 0 11:30 PM 11:44 PM 0 11:45 PM 11:59 PM 0 Approach Totals: Traffic Signal Warrant Analysis ROBERTS
93 MUTCD Warrant 1 Sheet 1 of 1 Number of Lanes for Moving Traffic on Each Approach Major Street: 2 or More Lanes Minor Street: 1 Lane MUTCD WARRANT 1, EIGHT-HOUR VEHICULAR VOLUME Built-up Isolated Community With Less Than 10,000 Population or Above 40 MPH on Major Street? Yes Combination of Conditions A and B Necessary?*: No *Only applicable for Warrant 1 if after an adequate trial of other alternatives that could cause less delay and inconvenience to traffic has failed to solve the traffic problems. See Section 4C.02 of the 2009 MUTCD for application. Number of lanes for moving traffic on each approach Condition A - Minimum Vehicular Volume Vehicles per hour on major street (total of both approaches) Vehicles per hour on higher-volume minor street approach (one direction only) Major Street Minor Street 100% 80% 70% 56% 100% 80% 70% 56% or More or More 2 or More or More Number of lanes for moving traffic on each approach Condition B - Interruption of Continuous Traffic Vehicles per hour on major street (total of both approaches) Vehicles per hour on higher-volume minor street approach (one direction only) Major Street Minor Street 100% 80% 70% 56% 100% 80% 70% 56% or More or More 2 or More or More Condition A Evaluation Number of Unique Hours Met: 3 Condition A Satisfied? No Condition B Evaluation Number of Unique Hours Met: 10 Condition B Satisfied? Yes Combination of Condition A and Condition B Evaluation Number of Unique Hours Met for Condition A: Number of Unique Hours Met for Condition B: Combination of Condition A and Condition B Satisfied? N/A N/A N/A 10/11/2018 Traffic Signal Warrant Analysis ROBERTS
94 MUTCD Warrant 2 Page 6 of 16 MUTCD WARRANT 2, FOUR-HOUR VEHICULAR VOLUME Number of Lanes for Moving Traffic on Each Approach Total Number of Unique Hours Met On Figure 4C-2 Major Street: 2 or More Lanes 7 Minor Street: 1 Lane Built-up Isolated Community With Less Than 10,000 Population or Above 40 MPH on Major Street? Yes Hourly Vehicular Volume Hour Interval Major Street Combined Highest Minor Street Approach Beginning At Vehicles Per Hour (VPH) Vehicles Per Hour (VPH) Hour Met? 12:00 AM :15 AM :30 AM :45 AM 0 0 1:00 AM 0 0 1:15 AM 0 0 1:30 AM 0 0 1:45 AM 0 0 2:00 AM 0 0 2:15 AM 0 0 2:30 AM 0 0 2:45 AM 0 0 3:00 AM 0 0 3:15 AM 0 0 3:30 AM 0 0 3:45 AM 0 0 4:00 AM 0 0 4:15 AM 0 0 4:30 AM 0 0 4:45 AM 0 0 5:00 AM 0 0 5:15 AM :30 AM :45 AM :00 AM :15 AM :30 AM :45 AM Met 7:00 AM Met 7:15 AM Met 7:30 AM Met 7:45 AM Met 8:00 AM Met 8:15 AM Met 8:30 AM Met 8:45 AM Met 9:00 AM Met 9:15 AM Met 9:30 AM Met 9:45 AM :00 AM :15 AM :30 AM :45 AM :00 AM :15 AM :30 AM :45 AM /11/2018 Traffic Signal Warrant Analysis ROBERTS
95 MUTCD Warrant 2 Page 7 of 16 Hourly Vehicular Volume Hour Interval Major Street Combined Highest Minor Street Approach Beginning At Vehicles Per Hour (VPH) Vehicles Per Hour (VPH) Hour Met? 12:00 PM :15 PM :30 PM :45 PM :00 PM :15 PM :30 PM :45 PM Met 2:00 PM Met 2:15 PM Met 2:30 PM Met 2:45 PM Met 3:00 PM Met 3:15 PM Met 3:30 PM Met 3:45 PM Met 4:00 PM Met 4:15 PM Met 4:30 PM Met 4:45 PM Met 5:00 PM Met 5:15 PM :30 PM :45 PM :00 PM 0 0 6:15 PM 0 0 6:30 PM 0 0 6:45 PM 0 0 7:00 PM 0 0 7:15 PM 0 0 7:30 PM 0 0 7:45 PM 0 0 8:00 PM 0 0 8:15 PM 0 0 8:30 PM 0 0 8:45 PM 0 0 9:00 PM 0 0 9:15 PM 0 0 9:30 PM 0 0 9:45 PM :00 PM :15 PM :30 PM :45 PM :00 PM /11/2018 Traffic Signal Warrant Analysis ROBERTS
96 MUTCD Warrant 3 Page 8 of 16 MUTCD WARRANT 3, PEAK HOUR Number of Lanes for Moving Traffic on Each Approach Major Street: 2 or More Lanes Minor Street: 1 Lane Built-up Isolated Community With Less Than 10,000 Population or Above 40 MPH on Major Street? Is this signal warrant being applied for an unusual case, such as office complexes, manufacturing plants, industrial complexes, or high-occupancy vehicle facilities that attract or discharge large numbers of vehicles over a short time? Yes No Indicate whether all three of the following conditions for the same 1 hour (any four consecutive 15- minute periods) of an average day are present* Does the total stopped time delay experienced by the traffic on one minor-street approach (one direction only) controlled by a STOP sign equal or exceed 4 vehicle-hours for a one-lane approach or 5 vehicle-hours for a two-lane approach? Does the volume on the same minor-street approach (one direction only) equal or exceed 100 vehicles per hour for one moving lane of traffic or 150 vehicles per hour for two moving lanes? Does the total entering volume serviced during the hour equal or exceed 650 vehicles per hour for intersection with three approaches or 800 vehicles per hour for intersections with four or more approaches? *If applicable, attach all supporting calculations and documentation. N/A N/A N/A Total Number of Unique Hours Met On Figure 4C-4 3 Hourly Vehicular Volume Hour Interval Major Street Combined Highest Minor Street Approach Beginning At Vehicles Per Hour (VPH) Vehicles Per Hour (VPH) Hour Met? 12:00 AM :15 AM :30 AM :45 AM 0 0 1:00 AM 0 0 1:15 AM 0 0 1:30 AM 0 0 1:45 AM 0 0 2:00 AM 0 0 2:15 AM 0 0 2:30 AM 0 0 2:45 AM 0 0 3:00 AM 0 0 3:15 AM 0 0 3:30 AM 0 0 3:45 AM 0 0 4:00 AM 0 0 4:15 AM 0 0 4:30 AM 0 0 4:45 AM 0 0 5:00 AM 0 0 5:15 AM :30 AM :45 AM :00 AM :15 AM :30 AM :45 AM :00 AM Met 7:15 AM Met 7:30 AM Met 7:45 AM Met 8:00 AM Met 8:15 AM /11/2018 Traffic Signal Warrant Analysis ROBERTS
97 MUTCD Warrant 3 Page 9 of 16 Hourly Vehicular Volume Hour Interval Major Street Combined Highest Minor Street Approach Beginning At Vehicles Per Hour (VPH) Vehicles Per Hour (VPH) Hour Met? 8:30 AM :45 AM :00 AM :15 AM :30 AM :45 AM :00 AM :15 AM :30 AM :45 AM :00 AM :15 AM :30 AM :45 AM :00 PM :15 PM :30 PM :45 PM :00 PM :15 PM :30 PM :45 PM :00 PM :15 PM :30 PM :45 PM :00 PM Met 3:15 PM :30 PM Met 3:45 PM :00 PM :15 PM :30 PM :45 PM :00 PM :15 PM :30 PM :45 PM :00 PM 0 0 6:15 PM 0 0 6:30 PM 0 0 6:45 PM 0 0 7:00 PM 0 0 7:15 PM 0 0 7:30 PM 0 0 7:45 PM 0 0 8:00 PM 0 0 8:15 PM 0 0 8:30 PM 0 0 8:45 PM 0 0 9:00 PM 0 0 9:15 PM 0 0 9:30 PM 0 0 9:45 PM :00 PM :15 PM :30 PM :45 PM :00 PM /11/2018 Traffic Signal Warrant Analysis ROBERTS
98 APPENDIX E Existing Traffic Count Data
99 Project: County Line Road Municipality: Radnor Township, Delaware County Setup: MAK Location: , Imperial Traffic & Data Collection PO BOX 4673 Cherry Hill, New Jersey, United States Count Name: 1. County Line Road & Lancaster Ave/McDonalds Driveway Site Code: 1 Start Date: 04/28/2018 Page No: 6 Start Time Turning Movement Peak Hour Data (7:45 AM) Lancaster Avenue Lancaster Avenue County Line Road McDonalds Driveway U-Turn Left Thru Right Peds Eastbound Westbound Northbound Southbound App. Total U-Turn Left Thru Right Peds App. Total U-Turn Left Thru Right Peds App. Total U-Turn Left Thru Right Peds 7:45 AM :00 AM :15 AM :30 AM Total Approach % Total % PHF Lights % Lights Mediums % Mediums Articulated Trucks % Articulated Trucks Bicycles on Crosswalk % Bicycles on Crosswalk Pedestrians % Pedestrians App. Total Int. Total
100 Project: County Line Road Municipality: Radnor Township, Delaware County Setup: MAK Location: , Imperial Traffic & Data Collection PO BOX 4673 Cherry Hill, New Jersey, United States Count Name: 1. County Line Road & Lancaster Ave/McDonalds Driveway Site Code: 1 Start Date: 04/28/2018 Page No: 8 Start Time Turning Movement Peak Hour Data (5:00 PM) Lancaster Avenue Lancaster Avenue County Line Road McDonalds Driveway U-Turn Left Thru Right Peds Eastbound Westbound Northbound Southbound App. Total U-Turn Left Thru Right Peds App. Total U-Turn Left Thru Right Peds App. Total U-Turn Left Thru Right Peds 5:00 PM :15 PM :30 PM :45 PM Total Approach % Total % PHF Lights % Lights Mediums % Mediums Articulated Trucks % Articulated Trucks Bicycles on Crosswalk % Bicycles on Crosswalk Pedestrians % Pedestrians App. Total Int. Total
101 Project: County Line Road Municipality: Radnor Township, Delaware County Setup: MAK Location: , Imperial Traffic & Data Collection PO BOX 4673 Cherry Hill, New Jersey, United States Count Name: 1. County Line Road & Lancaster Ave/McDonalds Driveway Site Code: 1 Start Date: 04/28/2018 Page No: 4 Start Time Turning Movement Peak Hour Data (11:45 AM) Lancaster Avenue Lancaster Avenue County Line Road McDonalds Driveway U-Turn Left Thru Right Peds Eastbound Westbound Northbound Southbound App. Total U-Turn Left Thru Right Peds App. Total U-Turn Left Thru Right Peds App. Total U-Turn Left Thru Right Peds 11:45 AM :00 PM :15 PM :30 PM Total Approach % Total % PHF Lights % Lights Mediums % Mediums Articulated Trucks % Articulated Trucks Bicycles on Crosswalk % Bicycles on Crosswalk Pedestrians % Pedestrians App. Total Int. Total
102 Montgomery County, PA County Line Rd/Montrose Ave Thursday, December 1, 2016 Location: , Baker Rd Coatesville, Pennsylvania, United States Serving Transportation Professionals Since 1995 Count Name: County Line Rd/Montrose Ave Site Code: Start Date: 12/01/2016 Page No: 4 Start Time Right Thru Left Turning Movement Peak Hour Data (7:45 AM) County Line Rd Montrose Ave County Line Rd Montrose Ave Southbound Westbound Northbound Eastbound U- Turn Peds App. Total Right Thru Left U- Turn Peds App. Total Right Thru Left U- Turn Peds App. Total Right Thru Left U- Turn Peds App. Total 7:45 AM :00 AM :15 AM :30 AM Total Approach % Total % PHF Lights % Lights Buses % Buses Trucks % Trucks Bicycles on Crosswalk % Bicycles on Crosswalk Pedestrians % Pedestrians Int. Total
103 Montgomery County, PA County Line Rd/Montrose Ave Thursday, December 1, 2016 Location: , Baker Rd Coatesville, Pennsylvania, United States Serving Transportation Professionals Since 1995 Count Name: County Line Rd/Montrose Ave Site Code: Start Date: 12/01/2016 Page No: 8 Start Time Right Thru Left Turning Movement Peak Hour Data (5:00 PM) County Line Rd Montrose Ave County Line Rd Montrose Ave Southbound Westbound Northbound Eastbound U- Turn Peds App. Total Right Thru Left U- Turn Peds App. Total Right Thru Left U- Turn Peds App. Total Right Thru Left U- Turn Peds App. Total 5:00 PM :15 PM :30 PM :45 PM Total Approach % Total % PHF Lights % Lights Buses % Buses Trucks % Trucks Bicycles on Crosswalk % Bicycles on Crosswalk Pedestrians % Pedestrians Int. Total
104 Project: County Line Road Municipality: Radnor Township, Delaware County, PA Setup: MAK Location: , Imperial Traffic & Data Collection PO BOX 4673 Cherry Hill, New Jersey, United States Count Name: 2. County Line Road & Montrose Avenue Site Code: 2 Start Date: 04/28/2018 Page No: 1 Start Time Turning Movement Data Montrose Avenue Montrose Avenue County Line Road County Line Road U-Turn Left Thru Right Peds Eastbound Westbound Northbound Southbound App. Total U-Turn Left Thru Right Peds App. Total U-Turn Left Thru Right Peds App. Total U-Turn Left Thru Right Peds 11:00 AM :15 AM :30 AM :45 AM Hourly Total :00 PM :15 PM :30 PM :45 PM Hourly Total :00 PM :15 PM :30 PM :45 PM Hourly Total Grand Total Approach % Total % Lights % Lights Mediums % Mediums Articulated Trucks % Articulated Trucks Bicycles on Crosswalk % Bicycles on Crosswalk Pedestrians % Pedestrians App. Total Int. Total
105 County Line Rd/Roberts Road - TMC Tue Jan 31, 2017 AM Peak (7:45AM - 8:45AM) - Overall Peak Hour All Classes (Articulated Trucks and Single-Unit Trucks, Bicycles on Crosswalk, Buses, Lights, Pedestrians) All Movements ID: , Location: , Provided by: Tri-State Traffic Data, Inc. 184 Baker Road, Coatesville, PA, 19320, US Le g Robe rts Road County Line Road Robe rts Road County Line Road Dire ction Southbound We stbound Northbound Eastbound Tim e R T L U App Pe d* R T L U App Pe d* R T L U App Pe d* R T L U App Pe d* Int :45AM :00AM :15AM :30AM Total % Approac h 33.3% 52.1% 14.6% 0% % 94.6% 0.7% 0% % 54.9% 36.4% 0% % 89.4% 1.8% 0% % Total 1.2% 1.9% 0.5% 0% 3.6% - 2.1% 42.0% 0.3% 0% % - 1.2% 7.6% 5.0% 0% 13.8% - 3.4% 34.1% 0.7% 0% 38.2% - - PHF Lights % Lights 100% 100% 100% 0% 100% % 98.0% 100% 0% 98.0% - 100% 98.0% 91.0% 0% 95.7% - 100% 95.8% 100% 0% 96.3% % Articulated Trucks and Single -Unit T ruc ks % Articulated Trucks and Single -Unit T ruc ks 0% 0% 0% 0% 0% - 3.6% 0.9% 0% 0% 1.0% - 0% 2.0% 0% 0% 1.1% - 0% 1.8% 0% 0% 1.6% - 1.2% Buse s % Buse s 0% 0% 0% 0% 0% - 0% 1.1% 0% 0% 1.0% - 0% 0% 9.0% 0% 3.3% - 0% 2.4% 0% 0% 2.2% - 1.7% Pe de strians % Pe de strians % % % Bicycle s on Crosswalk % Bicycle s on Crosswalk % % % * Pedestrians and Bicycles on Crosswalk. L: Left, R: Right, T: Thru, U: U-Turn. 3 of 8
106 County Line Rd/Roberts Road - TMC Tue Jan 31, 2017 PM Peak (3:15PM - 4:15PM) All Classes (Articulated Trucks and Single-Unit Trucks, Bicycles on Crosswalk, Buses, Lights, Pedestrians) All Movements ID: , Location: , Provided by: Tri-State Traffic Data, Inc. 184 Baker Road, Coatesville, PA, 19320, US Le g Robe rts Road County Line Road Robe rts Road County Line Road Dire ction Southbound We stbound Northbound Eastbound Tim e R T L U App Pe d* R T L U App Pe d* R T L U App Pe d* R T L U App Pe d* Int :15PM :30PM :45PM :00PM T otal % Approac h 17.0% 58.5% 24.5% 0% % 95.2% 0% 0% % 44.0% 39.3% 0% % 83.8% 0.7% 0% % Total 0.7% 2.4% 1.0% 0% 4.1% - 2.1% 41.6% 0% 0% 4 3.7% - 1.1% 2.9% 2.6% 0% 6.5% - 7.1% 38.3% 0.3% 0% 4 5.6% - - PHF Lights % Lights 100% 100% 100% 0% 100% - 100% 96.4% 0% 0% 96.6% % 100% 87.9% 0% 94.0% % 97.6% 100% 0% 97.3% % Articulated Trucks and Single -Unit T ruc ks % Articulated Trucks and Single -Unit T ruc ks 0% 0% 0% 0% 0% - 0% 1.1% 0% 0% 1.1% - 0% 0% 0% 0% 0% - 0% 0.2% 0% 0% 0.2% - 0.5% Buse s % Buse s 0% 0% 0% 0% 0% - 0% 2.4% 0% 0% 2.3% - 7.1% 0% 12.1% 0% 6.0% - 4.4% 2.2% 0% 0% 2.6% - 2.6% Pe de strians % Pe de strians % % % % Bicycle s on Crosswalk % Bicycle s on Crosswalk % % % % * Pedestrians and Bicycles on Crosswalk. L: Left, R: Right, T: Thru, U: U-Turn. 7 of 8
107 Project: County Line Road Municipality: Radnor Township, Delaware County, PA Setup: MAK Location: , Imperial Traffic & Data Collection PO BOX 4673 Cherry Hill, New Jersey, United States Count Name: 3. County Line Road & Robert's Road Site Code: 3 Start Date: 04/28/2018 Page No: 3 Start Time Turning Movement Peak Hour Data (11:45 AM) S Roberts Road S Roberts Road County Line Road County Line Road U-Turn Left Thru Right Peds Eastbound Westbound Northbound Southbound App. Total U-Turn Left Thru Right Peds App. Total U-Turn Left Thru Right Peds App. Total U-Turn Left Thru Right Peds 11:45 AM :00 PM :15 PM :30 PM Total Approach % Total % PHF Lights % Lights Mediums % Mediums Articulated Trucks % Articulated Trucks Bicycles on Crosswalk % Bicycles on Crosswalk Pedestrians % Pedestrians App. Total Int. Total
108 County Line Rd/Thomas Ave - TMC Tue Jan 31, 2017 AM Peak (7:30AM - 8:30AM) All Classes (Articulated Trucks and Single-Unit Trucks, Buses, Lights, Pedestrians) All Movements ID: , Location: , Le g Thomas Ave County Line Road Gle nbrook Ave Dire ction Southbound We stbound Northwe stbound Provided by: Tri-State Traffic Data, Inc. 184 Baker Road, Coatesville, PA, 19320, US Time R T BL L U RR App Ped* R T L HL U RR App Ped* HR BR BL HL U HRR BRR App Ped* :30AM :45AM :00AM :15AM T otal % Approac h 4.5% 77.3% 0% 18.2% 0% 0% % 60.0% 38.5% 0% 0% 0.1% % 12.8% 45.9% 15.0% 0% 0.8% 0% - - % Total 0.1% 0.9% 0% 0.2% 0% 0% 1.1% - 0.6% 28.2% 18.1% 0% 0% 0.1% 4 7.0% - 1.8% 0.9% 3.2% 1.0% 0% 0.1% 0% 6.9% - PHF Lights % Lights 100% 94.1% 0% 100% 0% 0% 95.5% % 97.2% 97.4% 0% 0% 100% 97.2% % 100% 100% 95.0% 0% 100% 0% 98.5% - Artic ulate d T ruc ks and S ingle -Unit T ruc ks % Artic ulate d T ruc ks and S ingle -Unit T ruc ks 0% 0% 0% 0% 0% 0% 0% - 8.3% 1.7% 2.0% 0% 0% 0% 1.9% - 0% 0% 0% 0% 0% 0% 0% 0% - Buse s % Buses 0% 5.9% 0% 0% 0% 0% 4.5% - 0% 1.1% 0.6% 0% 0% 0% 0.9% - 2.9% 0% 0% 5.0% 0% 0% 0% 1.5% - Pe de strians % Pe de strians % % * Pedestrians and Bicycles on Crosswalk. BL: Bear left, BR: Bear right, BRR: Bear right on red, HL: Hard left, HR: Hard right, HRR: Hard right on red, L: Left, R: Right, RR: Right on red, T: Thru, U: U-Turn. 4 of 12
109 County Line Rd/Thomas Ave - TMC Tue Jan 31, 2017 AM Peak (7:30AM - 8:30AM) All Classes (Articulated Trucks and Single-Unit Trucks, Buses, Lights, Pedestrians) All Movements ID: , Location: , Le g Cone stoga Road County Line Road Dire ction Northbound Eastbound Provided by: Tri-State Traffic Data, Inc. 184 Baker Road, Coatesville, PA, 19320, US Tim e HR R T L U HRR RR App Pe d* R BR T L U RR BRR App Pe d* Int :30AM :45AM :00AM :15AM Total % Approac h 1.6% 98.4% 0% 0% 0% 0% 0% - - 0% 2.7% 97.3% 0% 0% 0% 0% % T otal 0.3% 19.5% 0% 0% 0% 0% 0% 19.8% - 0% 0.7% 24.5% 0% 0% 0% 0% 25.1% - - PHF Lights % Lights 100% 98.4% 0% 0% 0% 0% 0% 98.4 % - 0% 76.9% 95.1% 0% 0% 0% 0% 94.6% % Artic ulate d T ruc ks and S ingle -Unit T ruc ks % Artic ulate d T ruc ks and S ingle -Unit T ruc ks 0% 0.5% 0% 0% 0% 0% 0% 0.5% - 0% 0% 2.1% 0% 0% 0% 0% 2.1% - 1.5% Buse s % Buse s 0% 1.1% 0% 0% 0% 0% 0% 1.0% - 0% 23.1% 2.8% 0% 0% 0% 0% 3.3% - 1.6% Pe de strians % Pe de strians % * Pedestrians and Bicycles on Crosswalk. BL: Bear left, BR: Bear right, BRR: Bear right on red, HL: Hard left, HR: Hard right, HRR: Hard right on red, L: Left, R: Right, RR: Right on red, T: Thru, U: U-Turn. 5 of 12
110 County Line Rd/Thomas Ave - TMC Tue Jan 31, 2017 PM Peak (4:15PM - 5:15PM) - Overall Peak Hour All Classes (Articulated Trucks and Single-Unit Trucks, Buses, Lights, Pedestrians) All Movements ID: , Location: , Le g Thomas Ave County Line Road Gle nbrook Ave Dire ction Southbound We stbound Northwe stbound Provided by: Tri-State Traffic Data, Inc. 184 Baker Road, Coatesville, PA, 19320, US Time R T BL L U RR App Ped* R T L HL U RR App Ped* HR BR BL HL U HRR BRR App Ped* :15PM :30PM :45PM :00PM T otal % Approac h 10.8% 37.8% 21.6% 29.7% 0% 0% % 51.7% 45.4% 0% 0% 0.1% % 16.0% 24.4% 18.5% 0% 0% 0% - - % Total 0.2% 0.7% 0.4% 0.6% 0% 0% 1.9% - 1.2% 20.9% 18.4% 0% 0% 0.1% 4 0.5% - 2.5% 1.0% 1.5% 1.1% 0% 0% 0% 6.0% - PHF Lights % Lights 75.0% 100% 100% 90.9% 0% 0% 94.6% % 98.3% 100% 0% 0% 100% 99.0% - 100% 100% 100% 100% 0% 0% 0% 100% - Artic ulate d T ruc ks and S ingle -Unit T ruc ks % Articulated Trucks and Single -Unit Trucks 0% 0% 0% 9.1% 0% 0% 2.7% - 0% 0.7% 0% 0% 0% 0% 0.4 % - 0% 0% 0% 0% 0% 0% 0% 0% - Buse s % Buse s 25.0% 0% 0% 0% 0% 0% 2.7% - 4.3% 1.0% 0% 0% 0% 0% 0.6% - 0% 0% 0% 0% 0% 0% 0% 0% - Pe de strians % Pe de strians % % % * Pedestrians and Bicycles on Crosswalk. BL: Bear left, BR: Bear right, BRR: Bear right on red, HL: Hard left, HR: Hard right, HRR: Hard right on red, L: Left, R: Right, RR: Right on red, T: Thru, U: U-Turn. 10 of 12
111 County Line Rd/Thomas Ave - TMC Tue Jan 31, 2017 PM Peak (4:15PM - 5:15PM) - Overall Peak Hour All Classes (Articulated Trucks and Single-Unit Trucks, Buses, Lights, Pedestrians) All Movements ID: , Location: , Le g Cone stoga Road County Line Road Dire ction Northbound Eastbound Provided by: Tri-State Traffic Data, Inc. 184 Baker Road, Coatesville, PA, 19320, US Tim e HR R T L U HRR RR App Pe d* R BR T L U RR BRR App Pe d* Int :15PM :30PM :45PM :00PM Total % Approac h 6.1% 93.9% 0% 0% 0% 0% 0% % 3.1% 95.6% 0.8% 0% 0% 0% % T otal 1.3% 19.4% 0% 0% 0% 0% 0% 20.7% - 0.2% 1.0% 29.6% 0.3% 0% 0% 0% 30.9% - - PHF Lights % Lights 100% 99.0% 0% 0% 0% 0% 0% 99.0% - 100% 94.7% 99.7% 100% 0% 0% 0% 99.5% % Artic ulate d T ruc ks and S ingle -Unit T ruc ks % Artic ulate d T ruc ks and S ingle -Unit T ruc ks 0% 0.5% 0% 0% 0% 0% 0% 0.5% - 0% 0% 0.2% 0% 0% 0% 0% 0.2% - 0.4% Buse s % Buse s 0% 0.5% 0% 0% 0% 0% 0% 0.5% - 0% 5.3% 0.2% 0% 0% 0% 0% 0.3% - 0.5% Pe de strians % Pe de strians % * Pedestrians and Bicycles on Crosswalk. BL: Bear left, BR: Bear right, BRR: Bear right on red, HL: Hard left, HR: Hard right, HRR: Hard right on red, L: Left, R: Right, RR: Right on red, T: Thru, U: U-Turn. 11 of 12
112 4. County Line Road & Conestog a Road/Thomas Avenue/Glenbrook Avenu - TMC Sat Apr 28, 2018 Midday Peak (WKND), Forced Peak (11:45AM - 12:45PM) - Overall Peak Hour All Classes (Lig hts, Articulated Trucks, Buses and Sing le-unit Trucks, Pedestrians, Bicycles on Crosswalk) All Movements ID: , Location: , , Site Code: 4 Provided by: Imperial Traffic & Data Collection 27 Imperial Drive, Cherry Hill, NJ, 08003, US Le g Thomas Ave nue County Line Road County Line Road Dire ction We stbound Northbound Southbound Time L BL BR R U App Pe d* HL BL T R U App Pe d* L T BR HR U App Pe d* :45AM :00PM :15PM :30PM T otal % Approac h 56.3% 9.4% 15.6% 18.8% 0% - - 0% 36.0% 60.2% 3.8% 0% % 96.3% 1.6% 1.1% 0% - - % T otal 1.2% 0.2% 0.3% 0.4% 0% 2.1% - 0% 16.5% 27.6% 1.7% 0% 4 5.9% - 0.3% 23.5% 0.4% 0.3% 0% 24.4 % - PHF Lights % Lights 100% 66.7% 100% 100% 0% 96.9% - 0% 99.6% 97.7% 100% 0% 98.4 % - 100% 98.6% 100% 100% 0% 98.7% - Artic ulate d T ruc ks % Artic ulate d T ruc ks 0% 0% 0% 0% 0% 0% - 0% 0% 0% 0% 0% 0% - 0% 0% 0% 0% 0% 0% - Buse s and S ingle -Unit T ruc ks % Buse s and S ingle - Unit T ruc ks 0% 33.3% 0% 0% 0% 3.1% - 0% 0.4% 2.3% 0% 0% 1.6% - 0% 1.4% 0% 0% 0% 1.3% - Pe de strians % Pe de strians % % % Bicycle s on Crosswalk % Bicycle s on Crosswalk % % % * Pedestrians and Bicycles on Crosswalk. BL: Bear left, BR: Bear right, HL: Hard left, HR: Hard right, L: Left, R: Right, T: Thru, U: U- Turn 4 of 6
113 4. County Line Road & Conestog a Road/Thomas Avenue/Glenbrook Avenu - TMC Sat Apr 28, 2018 Midday Peak (WKND), Forced Peak (11:45AM - 12:45PM) - Overall Peak Hour All Classes (Lig hts, Articulated Trucks, Buses and Sing le-unit Trucks, Pedestrians, Bicycles on Crosswalk) All Movements ID: , Location: , , Site Code: 4 Provided by: Imperial Traffic & Data Collection 27 Imperial Drive, Cherry Hill, NJ, 08003, US Le g Cone stoga Road Gle nbrook Ave nue Dire ction Southe astbound Northe astbound Time HL BL BR R U App Pe d* L BL BR HR U App Pe d* Int :45AM :00PM :15PM :30PM T otal % Approac h 0% 0% 96.4% 3.6% 0% % 28.1% 18.2% 42.1% 0% % T otal 0% 0% 19.1% 0.7% 0% 19.9% - 0.9% 2.2% 1.4% 3.3% 0% 7.8% - - PHF Lights % Lights 0% 0% 100% 100% 0% 100% - 100% 100% 100% 98.0% 0% 99.2% % Artic ulate d T ruc ks % Artic ulate d T ruc ks 0% 0% 0% 0% 0% 0% - 0% 0% 0% 0% 0% 0% - 0% Buse s and S ingle -Unit T ruc ks % Buse s and S ingle -Unit T ruc ks 0% 0% 0% 0% 0% 0% - 0% 0% 0% 2.0% 0% 0.8% - 1.2% Pe de strians % Pe de strians % % - Bicycle s on Crosswalk % Bicycle s on Crosswalk % % - * Pedestrians and Bicycles on Crosswalk. BL: Bear left, BR: Bear right, HL: Hard left, HR: Hard right, L: Left, R: Right, T: Thru, U: U-Turn 5 of 6
114 5/6. County Line Road & S. Warner Avenue & Old Lancaster Road - T MC Tue May 1, 2018 AM Peak (May :30AM - 8:30AM) All Classes (Lig hts, Articulated Trucks, Buses and Sing le-unit Trucks, Pedestrians, Bicycles on Crosswalk) All Movements ID: , Location: , , Site Code: 5, 6 Provided by: Imperial Traffic & Data Collection 27 Imperial Drive, Cherry Hill, NJ, 08003, US Le g County Line Road County Line Road Old Lancaste r Road S. Warne r Ave nue Dire ction Northbound Southbound Northwe stbound Southwe stbound Time T BR HR U App Pe d* HL BL T U App Pe d* HL BR R U App Pe d* App Pe d* Int :30AM :45AM :00AM :15AM T otal % Approac h 98.2% 1.8% 0% 0% % 29.8% 69.7% 0% % 93.1% 5.0% 0% % Total 44.7% 0.8% 0% 0% 4 5.5% - 0.3% 13.8% 32.4% 0% % - 0.2% 7.5% 0.4% 0% 8.0% - 0% - - PHF Lights % Lights 96.8% 87.5% 0% 0% 96.7% - 100% 99.3% 95.6% 0% 96.7% % 98.0% 87.5% 0% 96.9% % Artic ulate d Truc ks % Artic ulate d Truc ks 0.2% 0% 0% 0% 0.2% - 0% 0% 0.3% 0% 0.2% % 0% 0% 0% 0.6% % Buse s and S ingle -Unit Truc ks % Buse s and S ingle - Unit Truc ks 2.9% 12.5% 0% 0% 3.1% - 0% 0.7% 4.1% 0% 3.0% - 0% 2.0% 12.5% 0% 2.5% % Pe de strians % Pe de strians % % % - Bicycle s on Crosswalk % Bicycle s on Crosswalk % % % - * Pedestrians and Bicycles on Crosswalk. BL: Bear left, BR: Bear right, HL: Hard left, HR: Hard right, R: Right, T: Thru, U: U-Turn 5 of 8
115 5/6. County Line Road & S. Warner Avenue & Old Lancaster Road - T MC Tue May 1, 2018 PM Peak (May :45PM - 5:45PM) - Overall Peak Hour All Classes (Lig hts, Articulated Trucks, Buses and Sing le-unit Trucks, Pedestrians, Bicycles on Crosswalk) All Movements ID: , Location: , , Site Code: 5, 6 Provided by: Imperial Traffic & Data Collection 27 Imperial Drive, Cherry Hill, NJ, 08003, US Le g County Line Road County Line Road Old Lancaste r Road S. Warne r Ave nue Dire ction Northbound Southbound Northwe stbound Southwe stbound Time T BR HR U App Pe d* HL BL T U App Pe d* HL BR R U App Pe d* App Pe d* Int :45PM :00PM :15PM :30PM T otal % Approac h 96.2% 3.4% 0.4% 0% % 11.2% 87.5% 0% % 87.3% 9.9% 0.3% % T otal 31.0% 1.1% 0.1% 0% 32.2% - 0.7% 6.0% 47.1% 0% 53.9% - 0.3% 12.1% 1.4% 0% 13.9% - 0% - - PHF Lights % Lights 98.6% 100% 100% 0% 98.7% - 100% 97.6% 98.9% 0% 98.8% - 100% 99.2% 96.6% 100% 99.0% % Artic ulate d Truc ks % Artic ulate d Truc ks 0% 0% 0% 0% 0% - 0% 0% 0% 0% 0% - 0% 0% 0% 0% 0% % Buse s and S ingle -Unit Truc ks % Buse s and S ingle - Unit Truc ks 1.4% 0% 0% 0% 1.3% - 0% 2.4% 1.1% 0% 1.2% - 0% 0.8% 3.4% 0% 1.0% % Pe de strians % Pe de strians % % % - Bicycle s on Crosswalk % Bicycle s on Crosswalk % % - 6.7% - * Pedestrians and Bicycles on Crosswalk. BL: Bear left, BR: Bear right, HL: Hard left, HR: Hard right, R: Right, T: Thru, U: U-Turn 7 of 8
116 5/6. County Line Road & S. Warner Avenue & Old Lancaster Road - T MC Sat Apr 28, 2018 Midday Peak (WKND) (Apr :45AM - 12:45PM) All Classes (Lig hts, Articulated Trucks, Buses and Sing le-unit Trucks, Pedestrians, Bicycles on Crosswalk) All Movements ID: , Location: , , Site Code: 5, 6 Provided by: Imperial Traffic & Data Collection 27 Imperial Drive, Cherry Hill, NJ, 08003, US Le g County Line Road County Line Road Old Lancaste r Road S. Warne r Ave nue Dire ction Northbound Southbound Northwe stbound Southwe stbound Time T BR HR U App Pe d* HL BL T U App Pe d* HL BR R U App Pe d* App Pe d* Int :45AM :00PM :15PM :30PM Total % Approac h 96.2% 3.5% 0.3% 0% % 13.4% 84.8% 0.1% % 80.3% 12.4% 0% % Total 39.3% 1.4% 0.1% 0% 4 0.9% - 0.7% 6.3% 39.9% 0.1% 4 7.0% - 0.9% 9.7% 1.5% 0% 12.1% - 0% - - PHF Lights % Lights 98.6% 100% 100% 0% 98.7% % 98.9% 99.1% 100% 98.8% - 100% 98.6% 95.5% 0% 98.3% % Artic ulate d Truc ks % Artic ulate d Truc ks 0% 0% 0% 0% 0% - 9.1% 0% 0% 0% 0.1% - 0% 0% 0% 0% 0% % Buse s and S ingle -Unit Truc ks % Buse s and S ingle - Unit Truc ks 1.4% 0% 0% 0% 1.3% - 9.1% 1.1% 0.9% 0% 1.0% - 0% 1.4% 4.5% 0% 1.7% % Pe de strians % Pe de strians % % % - 100% - Bicycle s on Crosswalk % Bicycle s on Crosswalk % % % - 0% - * Pedestrians and Bicycles on Crosswalk. BL: Bear left, BR: Bear right, HL: Hard left, HR: Hard right, R: Right, T: Thru, U: U-Turn 3 of 8
117 Project: County Line Road Municipality: Radnor Township, Delaware County, PA Setup: MAK Location: , Imperial Traffic & Data Collection PO BOX 4673 Cherry Hill, New Jersey, United States Count Name: 7. County Line Road & Mondella Avenue Site Code: 7 Start Date: 04/28/2018 Page No: 6 Turning Movement Peak Hour Data (7:30 AM) Mondella Avenue County Line Road County Line Road Start Time Westbound Northbound Southbound U-Turn Left Right Peds App. Total U-Turn Thru Right Peds App. Total U-Turn Left Thru Peds App. Total Int. Total 7:30 AM :45 AM :00 AM :15 AM Total Approach % Total % PHF Lights % Lights Mediums % Mediums Articulated Trucks % Articulated Trucks Bicycles on Crosswalk % Bicycles on Crosswalk Pedestrians % Pedestrians
118 Project: County Line Road Municipality: Radnor Township, Delaware County, PA Setup: MAK Location: , Imperial Traffic & Data Collection PO BOX 4673 Cherry Hill, New Jersey, United States Count Name: 7. County Line Road & Mondella Avenue Site Code: 7 Start Date: 04/28/2018 Page No: 8 Turning Movement Peak Hour Data (4:45 PM) Mondella Avenue County Line Road County Line Road Start Time Westbound Northbound Southbound U-Turn Left Right Peds App. Total U-Turn Thru Right Peds App. Total U-Turn Left Thru Peds App. Total Int. Total 4:45 PM :00 PM :15 PM :30 PM Total Approach % Total % PHF Lights % Lights Mediums % Mediums Articulated Trucks % Articulated Trucks Bicycles on Crosswalk % Bicycles on Crosswalk Pedestrians % Pedestrians
119 Project: County Line Road Municipality: Radnor Township, Delaware County, PA Setup: MAK Location: , Imperial Traffic & Data Collection PO BOX 4673 Cherry Hill, New Jersey, United States Count Name: 7. County Line Road & Mondella Avenue Site Code: 7 Start Date: 04/28/2018 Page No: 4 Turning Movement Peak Hour Data (12:00 PM) Mondella Avenue County Line Road County Line Road Start Time Westbound Northbound Southbound U-Turn Left Right Peds App. Total U-Turn Thru Right Peds App. Total U-Turn Left Thru Peds App. Total Int. Total 12:00 PM :15 PM :30 PM :45 PM Total Approach % Total % PHF Lights % Lights Mediums % Mediums Articulated Trucks % Articulated Trucks Bicycles on Crosswalk % Bicycles on Crosswalk Pedestrians % Pedestrians
120 Project: County Line Road Municipality: Radnor Township, Delaware County, PA Setup: MAK Location: , Imperial Traffic & Data Collection PO BOX 4673 Cherry Hill, New Jersey, United States Count Name: 8. County Line Road & Lindsay Avenue Site Code: 8 Start Date: 04/28/2018 Page No: 6 Turning Movement Peak Hour Data (7:30 AM) Lindsay Avenue County Line Road County Line Road Start Time Westbound Northbound Southbound U-Turn Left Right Peds App. Total U-Turn Thru Right Peds App. Total U-Turn Left Thru Peds App. Total Int. Total 7:30 AM :45 AM :00 AM :15 AM Total Approach % Total % PHF Lights % Lights Mediums % Mediums Articulated Trucks % Articulated Trucks Bicycles on Crosswalk % Bicycles on Crosswalk Pedestrians % Pedestrians
121 Project: County Line Road Municipality: Radnor Township, Delaware County, PA Setup: MAK Location: , Imperial Traffic & Data Collection PO BOX 4673 Cherry Hill, New Jersey, United States Count Name: 8. County Line Road & Lindsay Avenue Site Code: 8 Start Date: 04/28/2018 Page No: 8 Turning Movement Peak Hour Data (4:45 PM) Lindsay Avenue County Line Road County Line Road Start Time Westbound Northbound Southbound U-Turn Left Right Peds App. Total U-Turn Thru Right Peds App. Total U-Turn Left Thru Peds App. Total Int. Total 4:45 PM :00 PM :15 PM :30 PM Total Approach % Total % PHF Lights % Lights Mediums % Mediums Articulated Trucks % Articulated Trucks Bicycles on Crosswalk % Bicycles on Crosswalk Pedestrians % Pedestrians
122 Project: County Line Road Municipality: Radnor Township, Delaware County, PA Setup: MAK Location: , Imperial Traffic & Data Collection PO BOX 4673 Cherry Hill, New Jersey, United States Count Name: 8. County Line Road & Lindsay Avenue Site Code: 8 Start Date: 04/28/2018 Page No: 4 Turning Movement Peak Hour Data (12:00 PM) Lindsay Avenue County Line Road County Line Road Start Time Westbound Northbound Southbound U-Turn Left Right Peds App. Total U-Turn Thru Right Peds App. Total U-Turn Left Thru Peds App. Total Int. Total 12:00 PM :15 PM :30 PM :45 PM Total Approach % Total % PHF Lights % Lights Mediums % Mediums Articulated Trucks % Articulated Trucks Bicycles on Crosswalk % Bicycles on Crosswalk Pedestrians % Pedestrians
123 9. County Line Road & S. Bryn Mawr Avenue/Haverf ord Road/ W. Railroad Avenue/ Glenbrook Avenue - TMC Tue May 1, 2018 AM Peak (May :30AM - 8:30AM) All Classes (Lig hts, Articulated Trucks, Buses and Sing le-unit Trucks, Pedestrians, Bicycles on Crosswalk) All Movements ID: , Location: , , Site Code: 9 Provided by: Imperial Traffic & Data Collection 27 Imperial Drive, Cherry Hill, NJ, 08003, US Le g S. Bryn Mawr Ave nue Have rford Road County Line Road Dire ction Eastbound Northbound Southbound Time L BL BR R U App Pe d* L T BR HR U App Pe d* HL BL T R U App Pe d* :30AM :45AM :00AM :15AM T otal % Approac h 24.1% 52.5% 7.7% 15.7% 0% % 77.7% 10.3% 0.6% 0% % 3.1% 72.8% 16.8% 0% - - % T otal 5.5% 12.0% 1.7% 3.6% 0% 22.8% - 4.5% 30.4% 4.0% 0.2% 0% 39.1% - 1.7% 0.7% 16.6% 3.8% 0% 22.8% - PHF Lights % Lights 93.9% 97.8% 100% 97.9% 0% 97.1% % 98.2% 100% 100% 0% 98.0% % 94.7% 96.0% 90.3% 0% 95.0% - Artic ulate d Truc ks % Artic ulate d Truc ks 0% 0% 0% 0% 0% 0% - 0.8% 0.1% 0% 0% 0% 0.2% - 0% 0% 0.7% 0% 0% 0.5% - Buse s and S ingle -Unit Truc ks % Buse s and S ingle - Unit Truc ks 6.1% 2.2% 0% 2.1% 0% 2.9% - 4.1% 1.7% 0% 0% 0% 1.8% - 4.4% 5.3% 3.4% 9.7% 0% 4.6% - Pe de strians % Pe de strians % % % Bicycle s on Crosswalk % Bicycle s on Crosswalk % % % * Pedestrians and Bicycles on Crosswalk. BL: Bear left, BR: Bear right, HL: Hard left, HR: Hard right, L: Left, R: Right, T: Thru, U: U-Turn 7 of 12
124 9. County Line Road & S. Bryn Mawr Avenue/Haverf ord Road/ W. Railroad Avenue/ Glenbrook Avenue - TMC Tue May 1, 2018 AM Peak (May :30AM - 8:30AM) All Classes (Lig hts, Articulated Trucks, Buses and Sing le-unit Trucks, Pedestrians, Bicycles on Crosswalk) All Movements ID: , Location: , , Site Code: 9 Provided by: Imperial Traffic & Data Collection 27 Imperial Drive, Cherry Hill, NJ, 08003, US Le g W. Old Railroad Ave nue S. Bryn Mawr Ave nue Dire ction Northwe stbound Southwe stbound Time HL BL BR R U App Pe d* L BL BR HR U App Pe d* Int :30AM :45AM :00AM :15AM T otal % Approac h 0% 0% 0% 0% 0% % 14.6% 68.9% 15.6% 0% % T otal 0% 0% 0% 0% 0% 0% - 0.1% 2.2% 10.5% 2.4% 0% 15.3% - - PHF Lights % Lights 0% 0% 0% 0% 0% % 96.7% 96.8% 90.6% 0% 95.6% % Artic ulate d T ruc ks % Artic ulate d T ruc ks 0% 0% 0% 0% 0% - - 0% 0% 0.4% 1.6% 0% 0.5% - 0.3% Buse s and S ingle -Unit T ruc ks % Buse s and S ingle -Unit T ruc ks 0% 0% 0% 0% 0% % 3.3% 2.8% 7.8% 0% 3.9% - 3.0% Pe de strians % Pe de strians % % - Bicycle s on Crosswalk % Bicycle s on Crosswalk % % - * Pedestrians and Bicycles on Crosswalk. BL: Bear left, BR: Bear right, HL: Hard left, HR: Hard right, L: Left, R: Right, T: Thru, U: U-Turn 8 of 12
125 9. County Line Road & S. Bryn Mawr Avenue/Haverf ord Road/ W. Railroad Avenue/ Glenbrook Avenue - TMC Tue May 1, 2018 PM Peak (May :45PM - 5:45PM) - Overall Peak Hour All Classes (Lig hts, Articulated Trucks, Buses and Sing le-unit Trucks, Pedestrians, Bicycles on Crosswalk) All Movements ID: , Location: , , Site Code: 9 Provided by: Imperial Traffic & Data Collection 27 Imperial Drive, Cherry Hill, NJ, 08003, US Le g S. Bryn Mawr Ave nue Have rford Road County Line Road Dire ction Eastbound Northbound Southbound Time L BL BR R U App Pe d* L T BR HR U App Pe d* HL BL T R U App Pe d* :45PM :00PM :15PM :30PM T otal % Approac h 18.9% 46.1% 8.8% 26.2% 0% % 73.8% 10.5% 0.6% 0% % 2.5% 87.3% 6.7% 0% - - % T otal 3.4% 8.3% 1.6% 4.7% 0% 17.9% - 3.6% 17.5% 2.5% 0.1% 0% 23.7% - 1.3% 0.9% 31.6% 2.4% 0% 36.1% - PHF Lights % Lights 99.0% 99.6% 97.8% 97.8% 0% 98.9% % 98.8% 98.6% 100% 0% 98.4 % % 100% 99.3% 95.8% 0% 99.1% - Artic ulate d Truc ks % Artic ulate d Truc ks 0% 0% 0% 0% 0% 0% - 0% 0.2% 0% 0% 0% 0.1% - 0% 0% 0% 0% 0% 0% - Buse s and S ingle -Unit Truc ks % Buse s and S ingle - Unit Truc ks 1.0% 0.4% 2.2% 2.2% 0% 1.1% - 3.8% 1.0% 1.4% 0% 0% 1.4 % - 2.7% 0% 0.7% 4.2% 0% 0.9% - Pe de strians % Pe de strians % % % Bicycle s on Crosswalk % Bicycle s on Crosswalk % % % * Pedestrians and Bicycles on Crosswalk. BL: Bear left, BR: Bear right, HL: Hard left, HR: Hard right, L: Left, R: Right, T: Thru, U: U-Turn 10 of 12
126 9. County Line Road & S. Bryn Mawr Avenue/Haverf ord Road/ W. Railroad Avenue/ Glenbrook Avenue - TMC Tue May 1, 2018 PM Peak (May :45PM - 5:45PM) - Overall Peak Hour All Classes (Lig hts, Articulated Trucks, Buses and Sing le-unit Trucks, Pedestrians, Bicycles on Crosswalk) All Movements ID: , Location: , , Site Code: 9 Provided by: Imperial Traffic & Data Collection 27 Imperial Drive, Cherry Hill, NJ, 08003, US Le g W. Old Railroad Ave nue S. Bryn Mawr Ave nue Dire ction Northwe stbound Southwe stbound Time HL BL BR R U App Pe d* L BL BR HR U App Pe d* Int :45PM :00PM :15PM :30PM T otal % Approac h 0% 0% 0% 0% 0% % 31.9% 56.2% 10.9% 0% % T otal 0% 0% 0% 0% 0% 0% - 0.2% 7.1% 12.5% 2.4% 0% 22.2% - - PHF Lights % Lights 0% 0% 0% 0% 0% % 100% 99.5% 98.6% 0% 99.5% % Artic ulate d T ruc ks % Artic ulate d T ruc ks 0% 0% 0% 0% 0% - - 0% 0% 0% 0% 0% 0% - 0% Buse s and S ingle -Unit T ruc ks % Buse s and S ingle -Unit T ruc ks 0% 0% 0% 0% 0% - - 0% 0% 0.5% 1.4% 0% 0.5% - 1.0% Pe de strians % Pe de strians % % - Bicycle s on Crosswalk % Bicycle s on Crosswalk % % - * Pedestrians and Bicycles on Crosswalk. BL: Bear left, BR: Bear right, HL: Hard left, HR: Hard right, L: Left, R: Right, T: Thru, U: U-Turn 11 of 12
127 9. County Line Road & S. Bryn Mawr Avenue/Haverf ord Road/ W. Railroad Avenue/ Glenbrook Avenue - TMC Sat Apr 28, 2018 Midday Peak (WKND) (Apr :30AM - 12:30PM) All Classes (Lig hts, Articulated Trucks, Buses and Sing le-unit Trucks, Pedestrians, Bicycles on Crosswalk) All Movements ID: , Location: , , Site Code: 9 Provided by: Imperial Traffic & Data Collection 27 Imperial Drive, Cherry Hill, NJ, 08003, US Le g S. Bryn Mawr Ave nue Have rford Road County Line Road Dire ction Eastbound Northbound Southbound Time L BL BR R U App Pe d* L T BR HR U App Pe d* HL BL T R U App Pe d* :30AM :45AM :00PM :15PM Total % Approac h 34.5% 38.1% 5.5% 21.9% 0% % 71.2% 12.4% 0.1% 0% % 1.7% 79.3% 10.9% 0% - - % T otal 7.5% 8.3% 1.2% 4.8% 0% 21.8% - 5.3% 23.0% 4.0% 0% 0% 32.3% - 2.3% 0.5% 22.1% 3.0% 0% 27.9% - PHF Lights % Lights 98.7% 100% 100% 100% 0% 99.6% % 99.4% 96.4% 100% 0% 98.8% % 100% 99.3% 98.4% 0% 99.1% - Artic ulate d Truc ks % Artic ulate d Truc ks 0% 0% 0% 0% 0% 0% - 0% 0% 0% 0% 0% 0% - 0% 0% 0% 0% 0% 0% - Buse s and S ingle -Unit Truc ks % Buse s and S ingle - Unit Truc ks 1.3% 0% 0% 0% 0% 0.4 % - 1.8% 0.6% 3.6% 0% 0% 1.2% - 2.1% 0% 0.7% 1.6% 0% 0.9% - Pe de strians % Pe de strians % % % Bicycle s on Crosswalk % Bicycle s on Crosswalk % % % * Pedestrians and Bicycles on Crosswalk. BL: Bear left, BR: Bear right, HL: Hard left, HR: Hard right, L: Left, R: Right, T: Thru, U: U-Turn 4 of 12
128 9. County Line Road & S. Bryn Mawr Avenue/Haverf ord Road/ W. Railroad Avenue/ Glenbrook Avenue - TMC Sat Apr 28, 2018 Midday Peak (WKND) (Apr :30AM - 12:30PM) All Classes (Lig hts, Articulated Trucks, Buses and Sing le-unit Trucks, Pedestrians, Bicycles on Crosswalk) All Movements ID: , Location: , , Site Code: 9 Provided by: Imperial Traffic & Data Collection 27 Imperial Drive, Cherry Hill, NJ, 08003, US Le g W. Old Railroad Ave nue S. Bryn Mawr Ave nue Dire ction Northwe stbound Southwe stbound Time HL BL BR R U App Pe d* L BL BR HR U App Pe d* Int :30AM :45AM :00PM :15PM T otal % Approac h 0% 0% 0% 0% 0% - - 0% 29.8% 52.8% 17.4% 0% % T otal 0% 0% 0% 0% 0% 0% - 0% 5.4% 9.5% 3.1% 0% 18.0% - - PHF Lights % Lights 0% 0% 0% 0% 0% - - 0% 100% 98.0% 100% 0% 98.9% % Artic ulate d T ruc ks % Artic ulate d T ruc ks 0% 0% 0% 0% 0% - - 0% 0% 0% 0% 0% 0% - 0% Buse s and S ingle -Unit T ruc ks % Buse s and S ingle -Unit T ruc ks 0% 0% 0% 0% 0% - - 0% 0% 2.0% 0% 0% 1.1% - 0.9% Pe de strians % Pe de strians % % - Bicycle s on Crosswalk % Bicycle s on Crosswalk % % - * Pedestrians and Bicycles on Crosswalk. BL: Bear left, BR: Bear right, HL: Hard left, HR: Hard right, L: Left, R: Right, T: Thru, U: U-Turn 5 of 12
129 Study Name 9b. County Line Road & Glenbrook Avenue Start Date 04/28/2018 Start Time 11:00 AM Site Code 9b Project Gilmore: County Line Road Project County Line Road Municipality Radnor Township, Delaware County Setup MAK Location Type Road Classification Totals Glenbrook Avenue County Line Road County Line Road Eastbound Northbound Southbound Start Time U-Turn Left Right U-Turn Left Thru U-Turn Thru Right 11:00 AM :15 AM :30 AM :45 AM :00 PM :15 PM :30 PM :45 PM :00 PM :15 PM :30 PM :45 PM :00 AM :15 AM :30 AM :45 AM :00 AM :15 AM :30 AM :45 AM :00 PM :15 PM :30 PM :45 PM :00 PM :15 PM :30 PM :45 PM
130 Project: County Line Road Municipality: Radnor Township, Delaware County Setup: MAK Location: , Imperial Traffic & Data Collection PO BOX 4673 Cherry Hill, New Jersey, United States Count Name: 10. County Line Road/ Haverford Road & County Line Road/Landover Road Site Code: 10 Start Date: 04/28/2018 Page No: 6 Start Time Turning Movement Peak Hour Data (7:30 AM) Landover Road County Line Road Haverford Road County Line Road U-Turn Left Thru Right Peds Eastbound Westbound Northbound Southbound App. Total U-Turn Left Thru Right Peds App. Total U-Turn Left Thru Right Peds App. Total U-Turn Left Thru Right Peds 7:30 AM :45 AM :00 AM :15 AM Total Approach % Total % PHF Lights % Lights Mediums % Mediums Articulated Trucks % Articulated Trucks Bicycles on Crosswalk % Bicycles on Crosswalk Pedestrians % Pedestrians App. Total Int. Total
131 Project: County Line Road Municipality: Radnor Township, Delaware County Setup: MAK Location: , Imperial Traffic & Data Collection PO BOX 4673 Cherry Hill, New Jersey, United States Count Name: 10. County Line Road/ Haverford Road & County Line Road/Landover Road Site Code: 10 Start Date: 04/28/2018 Page No: 8 Start Time Turning Movement Peak Hour Data (4:45 PM) Landover Road County Line Road Haverford Road County Line Road U-Turn Left Thru Right Peds Eastbound Westbound Northbound Southbound App. Total U-Turn Left Thru Right Peds App. Total U-Turn Left Thru Right Peds App. Total U-Turn Left Thru Right Peds 4:45 PM :00 PM :15 PM :30 PM Total Approach % Total % PHF Lights % Lights Mediums % Mediums Articulated Trucks % Articulated Trucks Bicycles on Crosswalk % Bicycles on Crosswalk Pedestrians % Pedestrians App. Total Int. Total
132 Project: County Line Road Municipality: Radnor Township, Delaware County Setup: MAK Location: , Imperial Traffic & Data Collection PO BOX 4673 Cherry Hill, New Jersey, United States Count Name: 10. County Line Road/ Haverford Road & County Line Road/Landover Road Site Code: 10 Start Date: 04/28/2018 Page No: 4 Start Time Turning Movement Peak Hour Data (11:30 AM) Landover Road County Line Road Haverford Road County Line Road U-Turn Left Thru Right Peds Eastbound Westbound Northbound Southbound App. Total U-Turn Left Thru Right Peds App. Total U-Turn Left Thru Right Peds App. Total U-Turn Left Thru Right Peds 11:30 AM :45 AM :00 PM :15 PM Total Approach % Total % PHF Lights % Lights Mediums % Mediums Articulated Trucks % Articulated Trucks Bicycles on Crosswalk % Bicycles on Crosswalk Pedestrians % Pedestrians App. Total Int. Total
133 APPENDIX F Capacity Analysis Procedures
134 LEVEL OF SERVICE METHODOLOGY As defined, vehicle capacity means the maximum number of vehicles that can pass a given point during a specified period under prevailing roadway, traffic and control conditions. The level at which an intersection or section of a lane or roadway functions can be expressed in terms of level of service. Level of service is defined as qualitative measures that characterize operational conditions within a traffic stream and their perception by motorists and passengers. Some measures that are included are speed and travel time, freedom to maneuver, traffic interruptions, and comfort and convenience. The concept of stop-controlled or yield-controlled intersection analysis is based on the estimate of average total delay on minor streets. The methodology of the analysis relies on three elements: the distribution and size of gaps available in the major street traffic flow; the usefulness of these gaps to the minor stream drivers; and, the relative priority of the various traffic movements at the intersection. The results of the analysis provide an estimate of total average delay for the various critical movements at the unsignalized intersections. Correlation between average total delay and the respective levels of service are provided in Table 1: Level of Service Criteria. Level of Service Table 1: Level of Service Criteria Unsignalized Intersections Control Delay per Vehicle (seconds) Signalized Intersections Control Delay per Vehicle (seconds) A B > 10 and 15 > 10 and 20 C > 15 and 25 > 20 and 35 D > 25 and 35 > 35 and 55 E > 35 and 50 > 55 and 80 F > 50 > 80 At signalized intersections, additional elements must be considered. These elements are green time allocations and volume/capacity relationships. Level of service is based primarily on the average control delay per vehicle for various movements within an intersection. Thus, both volume/capacity and delay are considered to evaluate the overall operation of a signalized intersection. Correlation between average delay per vehicle and the respective levels of service are provided for signalized intersections in Table 1: Level of Service Criteria. B-1
135 APPENDIX G Existing Traffic Signal Permit Plans
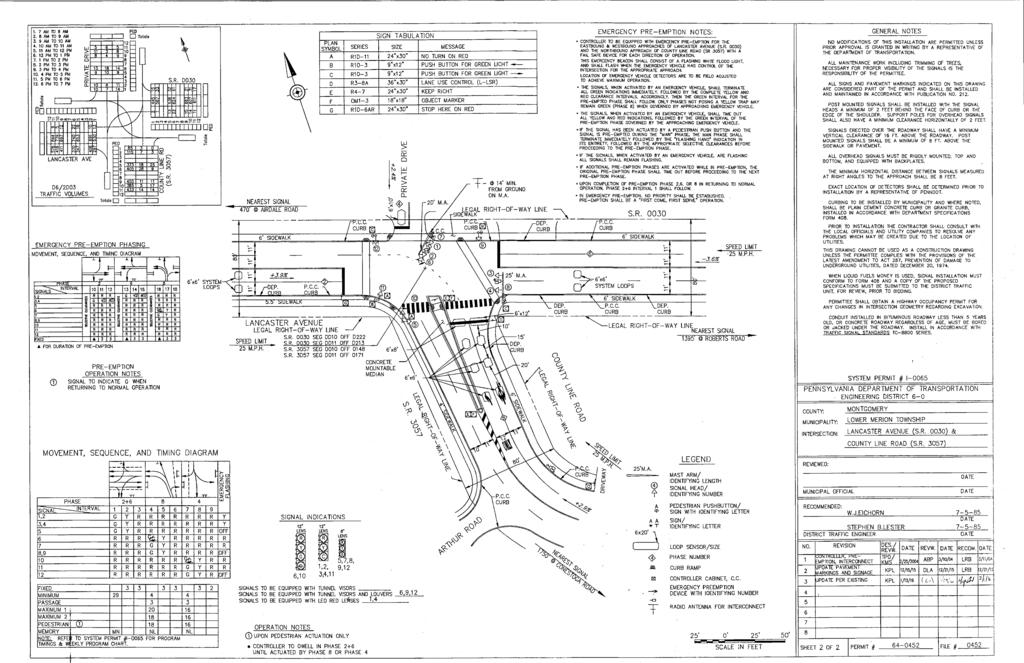
136
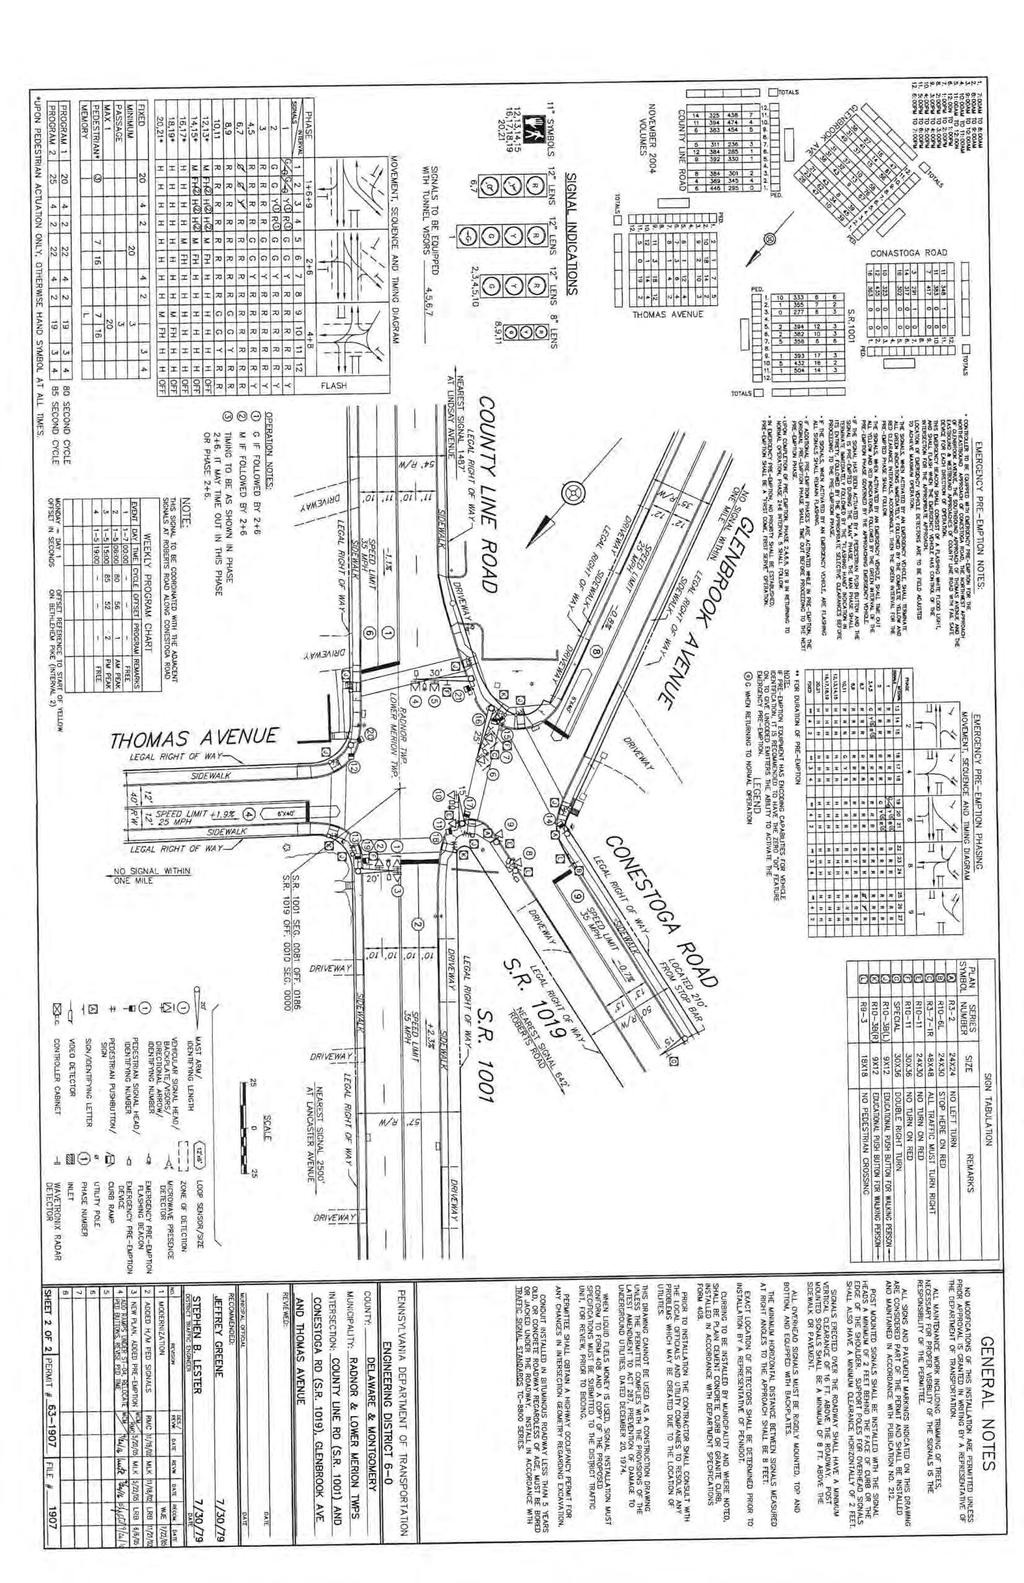
137
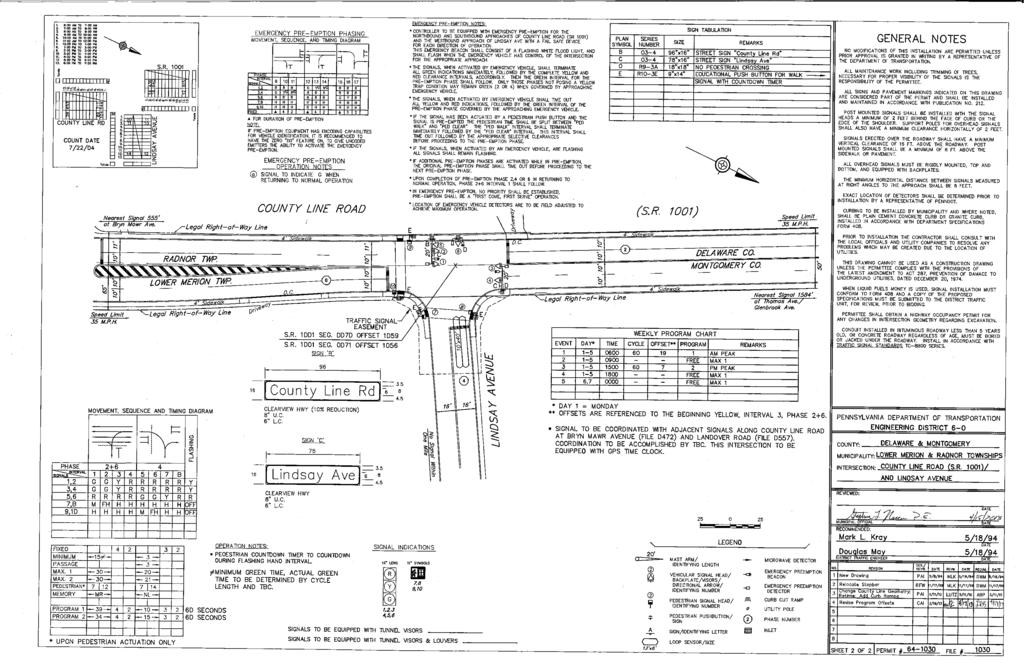
138
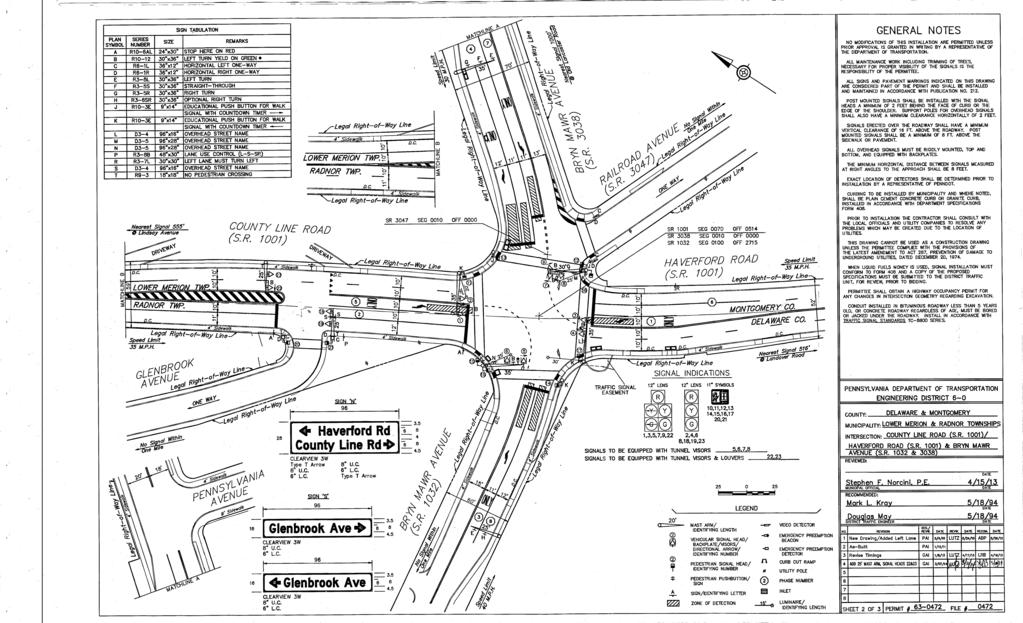
139
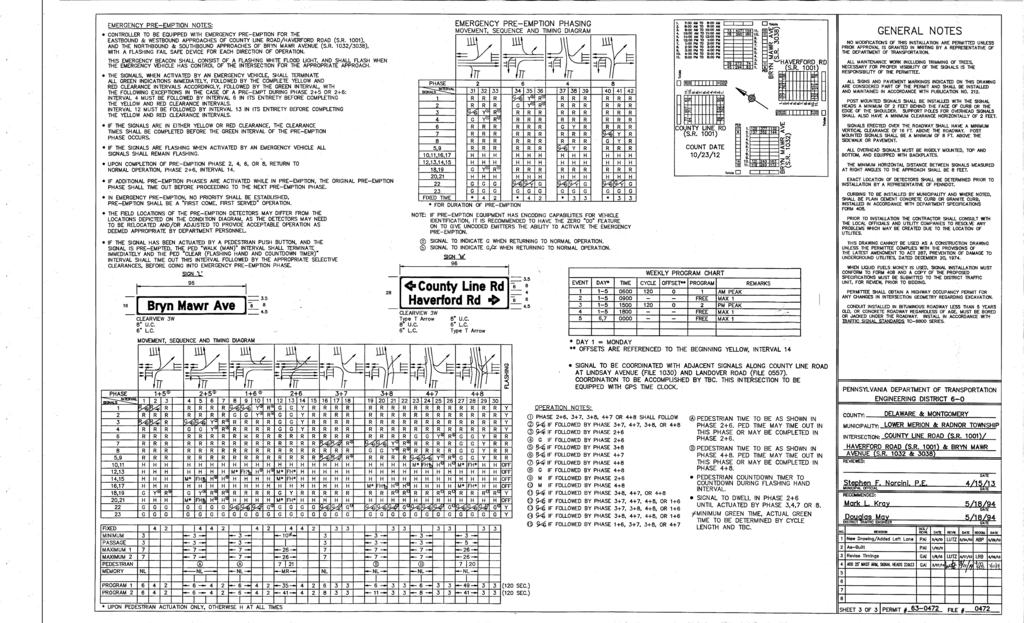
140
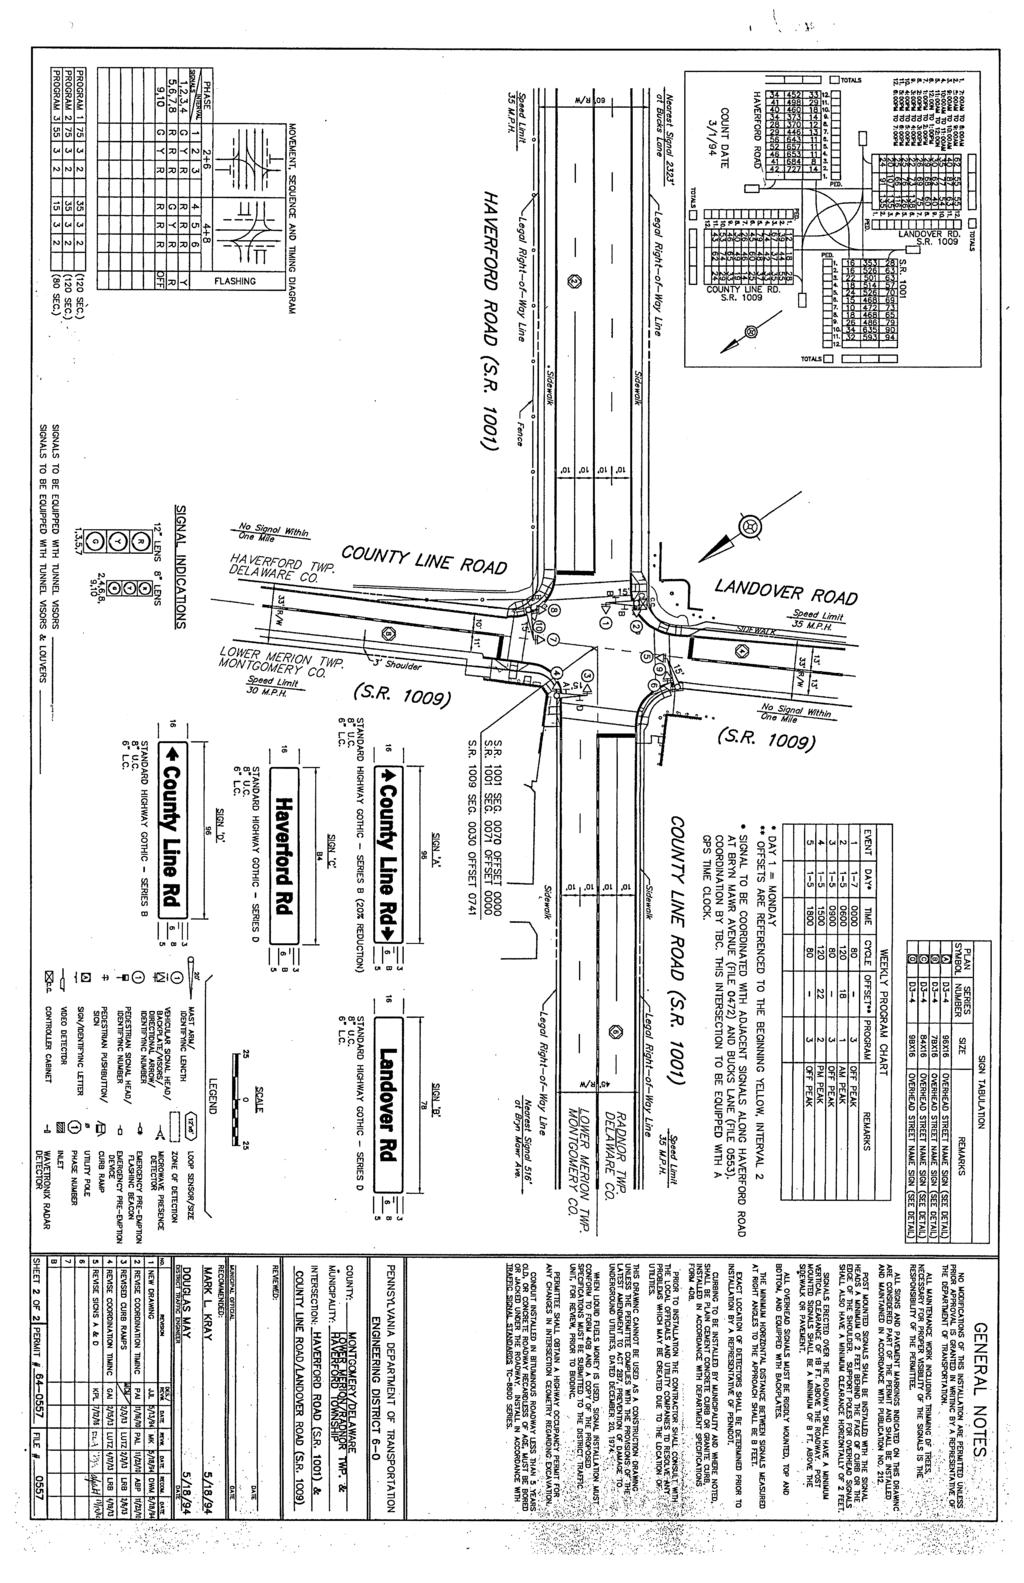
141
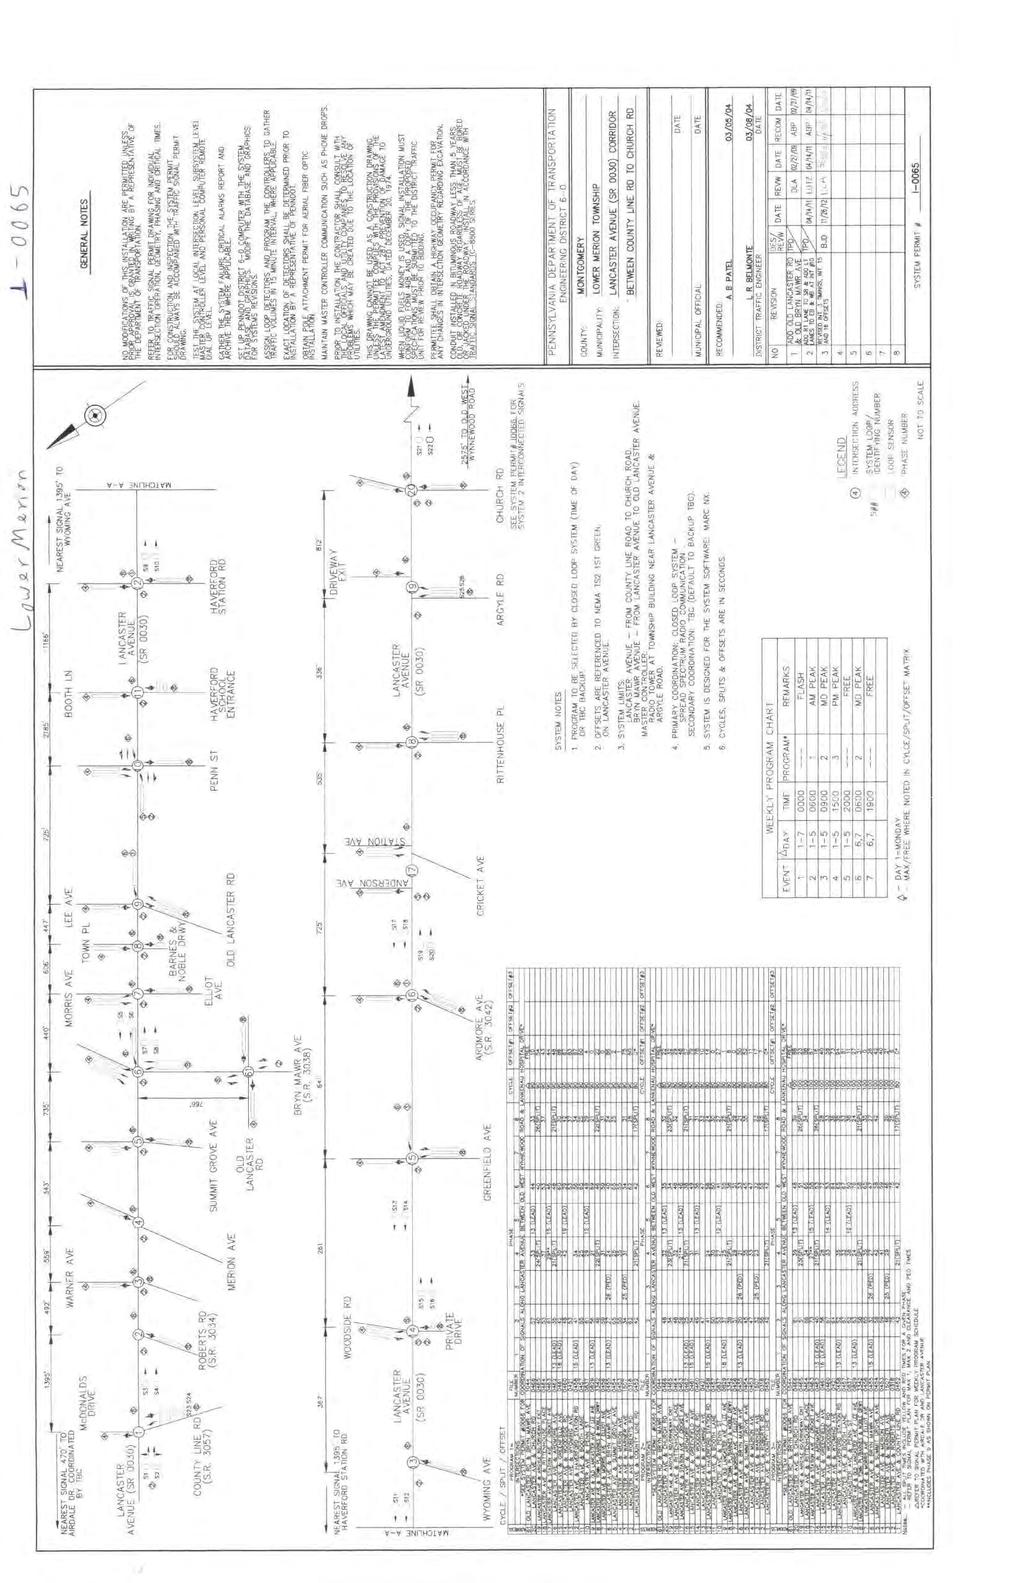
142
143 APPENDIX H Capacity Analysis Results
144 Existing Analysis
145 Lanes, Volumes, Timings Existing AM Peak 1: County Line Rd & Lancaster Ave 02/25/2019 Lane Group EBT WBT NBL NBT SBT Lane Group Flow (vph) v/c Ratio Control Delay Queue Delay Total Delay Queue Length 50th (ft) Queue Length 95th (ft) #325 # Internal Link Dist (ft) Turn Bay Length (ft) Base Capacity (vph) Starvation Cap Reductn Spillback Cap Reductn Storage Cap Reductn Reduced v/c Ratio Intersection Summary # 95th percentile volume exceeds capacity, queue may be longer. Queue shown is maximum after two cycles. Existing AM Peak Synchro 10 Report Page 1
146 HCM Signalized Intersection Capacity Analysis Existing AM Peak 1: County Line Rd & Lancaster Ave 02/25/2019 Movement EBL EBT EBR WBL WBT WBR NBL NBT NBR SBL SBT SBR Lane Configurations Traffic Volume (vph) Future Volume (vph) Ideal Flow (vphpl) Lane Width Grade (%) 4% -4% 2% 3% Total Lost time (s) Lane Util. Factor Frt Flt Protected Satd. Flow (prot) Flt Permitted Satd. Flow (perm) Peak-hour factor, PHF Adj. Flow (vph) RTOR Reduction (vph) Lane Group Flow (vph) Heavy Vehicles (%) 0% 5% 6% 0% 5% 17% 3% 4% 0% 0% 0% 0% Turn Type Perm NA Perm NA Split NA Split NA Protected Phases Permitted Phases 2 6 Actuated Green, G (s) Effective Green, g (s) Actuated g/c Ratio Clearance Time (s) Vehicle Extension (s) Lane Grp Cap (vph) v/s Ratio Prot 0.23 c0.23 c0.01 v/s Ratio Perm c v/c Ratio Uniform Delay, d Progression Factor Incremental Delay, d Delay (s) Level of Service C B C C C Approach Delay (s) Approach LOS C B C C Intersection Summary HCM 2000 Control Delay 19.8 HCM 2000 Level of Service B HCM 2000 Volume to Capacity ratio 0.67 Actuated Cycle Length (s) 80.0 Sum of lost time (s) 10.0 Intersection Capacity Utilization 70.7% ICU Level of Service C Analysis Period (min) 15 c Critical Lane Group Existing AM Peak Synchro 10 Report Page 2
147 HCM 6th TWSC Existing AM Peak 2: County Line Rd & Montrose Ave 02/25/2019 Intersection Int Delay, s/veh 7.8 Movement EBL EBT EBR WBL WBT WBR NBL NBT NBR SBL SBT SBR Lane Configurations Traffic Vol, veh/h Future Vol, veh/h Conflicting Peds, #/hr Sign Control Stop Stop Stop Stop Stop Stop Free Free Free Free Free Free RT Channelized - - None - - None - - None - - None Storage Length Veh in Median Storage, # Grade, % Peak Hour Factor Heavy Vehicles, % Mvmt Flow Major/Minor Minor2 Minor1 Major1 Major2 Conflicting Flow All Stage Stage Critical Hdwy Critical Hdwy Stg Critical Hdwy Stg Follow-up Hdwy Pot Cap-1 Maneuver Stage Stage Platoon blocked, % Mov Cap-1 Maneuver Mov Cap-2 Maneuver Stage Stage Approach EB WB NB SB HCM Control Delay, s HCM LOS F E Minor Lane/Major Mvmt NBL NBT NBR EBLn1WBLn1 SBL SBT SBR Capacity (veh/h) HCM Lane V/C Ratio HCM Control Delay (s) HCM Lane LOS A A - F E A A - HCM 95th %tile Q(veh) Existing AM Peak Synchro 10 Report Page 2
148 HCM 6th TWSC Existing AM Peak 3: County Line Rd & Roberts Rd 02/25/2019 Intersection Int Delay, s/veh 16.2 Movement EBL EBT EBR WBL WBT WBR NBL NBT NBR SBL SBT SBR Lane Configurations Traffic Vol, veh/h Future Vol, veh/h Conflicting Peds, #/hr Sign Control Stop Stop Stop Stop Stop Stop Free Free Free Free Free Free RT Channelized - - None - - None - - None - - None Storage Length Veh in Median Storage, # Grade, % Peak Hour Factor Heavy Vehicles, % Mvmt Flow Major/Minor Minor2 Minor1 Major1 Major2 Conflicting Flow All Stage Stage Critical Hdwy Critical Hdwy Stg Critical Hdwy Stg Follow-up Hdwy Pot Cap-1 Maneuver Stage Stage Platoon blocked, % Mov Cap-1 Maneuver Mov Cap-2 Maneuver Stage Stage Approach EB WB NB SB HCM Control Delay, s HCM LOS F D Minor Lane/Major Mvmt NBL NBT NBR EBLn1WBLn1 SBL SBT SBR Capacity (veh/h) HCM Lane V/C Ratio HCM Control Delay (s) HCM Lane LOS A A - F D A A - HCM 95th %tile Q(veh) Existing AM Peak Synchro 10 Report Page 4
149 Lanes, Volumes, Timings Existing AM Peak 4: Glenbrook Ave & County Line Rd & Thomas Ave & Conestoga Rd 02/25/2019 Lane Group WBL NBT SBT SER NEL Lane Group Flow (vph) v/c Ratio Control Delay Queue Delay Total Delay Queue Length 50th (ft) Queue Length 95th (ft) # Internal Link Dist (ft) Turn Bay Length (ft) Base Capacity (vph) Starvation Cap Reductn Spillback Cap Reductn Storage Cap Reductn Reduced v/c Ratio Intersection Summary # 95th percentile volume exceeds capacity, queue may be longer. Queue shown is maximum after two cycles. Existing AM Peak Synchro 10 Report Page 3
150 HCM Signalized Intersection Capacity Analysis Existing AM Peak 4: Glenbrook Ave & County Line Rd & Thomas Ave & Conestoga Rd 02/25/2019 Movement WBL2 WBL WBR WBR2 NBL NBT NBR SBT SBR SER SER2 NEL2 Lane Configurations Traffic Volume (vph) Future Volume (vph) Ideal Flow (vphpl) Lane Width Grade (%) 2% -1% 2% Total Lost time (s) Lane Util. Factor 1.00 * Frt Flt Protected Satd. Flow (prot) Flt Permitted Satd. Flow (perm) Peak-hour factor, PHF Adj. Flow (vph) RTOR Reduction (vph) Lane Group Flow (vph) Heavy Vehicles (%) 0% 0% 6% 0% 3% 3% 8% 5% 0% 2% 0% 5% Parking (#/hr) Turn Type Perm Perm pm+pt NA NA Perm Perm Protected Phases Permitted Phases Actuated Green, G (s) Effective Green, g (s) Actuated g/c Ratio Clearance Time (s) Vehicle Extension (s) Lane Grp Cap (vph) v/s Ratio Prot v/s Ratio Perm 0.02 c0.23 c0.27 v/c Ratio Uniform Delay, d Progression Factor Incremental Delay, d Delay (s) Level of Service C A B C Approach Delay (s) Approach LOS C A B Intersection Summary HCM 2000 Control Delay 16.3 HCM 2000 Level of Service B HCM 2000 Volume to Capacity ratio 0.73 Actuated Cycle Length (s) 80.0 Sum of lost time (s) 15.5 Intersection Capacity Utilization 68.5% ICU Level of Service C Analysis Period (min) 15 c Critical Lane Group Existing AM Peak Synchro 10 Report Page 4
151 HCM Signalized Intersection Capacity Analysis Existing AM Peak 4: Glenbrook Ave & County Line Rd & Thomas Ave & Conestoga Rd 02/25/2019 Movement NEL NER NER2 Lane Configurations Traffic Volume (vph) Future Volume (vph) Ideal Flow (vphpl) Lane Width Grade (%) -1% Total Lost time (s) 2.5 Lane Util. Factor 1.00 Frt 0.95 Flt Protected 0.97 Satd. Flow (prot) 1639 Flt Permitted 0.97 Satd. Flow (perm) 1639 Peak-hour factor, PHF Adj. Flow (vph) RTOR Reduction (vph) Lane Group Flow (vph) Heavy Vehicles (%) 0% 0% 3% Parking (#/hr) 0 Turn Type Perm Protected Phases Permitted Phases 4 Actuated Green, G (s) 12.3 Effective Green, g (s) 16.8 Actuated g/c Ratio 0.21 Clearance Time (s) 7.0 Vehicle Extension (s) 3.0 Lane Grp Cap (vph) 344 v/s Ratio Prot v/s Ratio Perm c0.09 v/c Ratio 0.42 Uniform Delay, d Progression Factor 1.00 Incremental Delay, d2 0.8 Delay (s) 28.2 Level of Service C Approach Delay (s) 28.2 Approach LOS C Intersection Summary Existing AM Peak Synchro 10 Report Page 5
152 HCM 6th TWSC Existing AM Peak 5: County Line Rd & S Warner Ave 03/15/2019 Intersection Int Delay, s/veh 0.1 Movement NBT NBR SBL SBT SWL SWR Lane Configurations Traffic Vol, veh/h Future Vol, veh/h Conflicting Peds, #/hr Sign Control Free Free Free Free Stop Stop RT Channelized - None - None - None Storage Length Veh in Median Storage, # Grade, % Peak Hour Factor Heavy Vehicles, % Mvmt Flow Major/Minor Major1 Major2 Minor1 Conflicting Flow All Stage Stage Critical Hdwy Critical Hdwy Stg Critical Hdwy Stg Follow-up Hdwy Pot Cap-1 Maneuver Stage Stage Platoon blocked, % Mov Cap-1 Maneuver Mov Cap-2 Maneuver Stage Stage Approach NB SB SW HCM Control Delay, s HCM LOS A Minor Lane/Major Mvmt NBT NBR SBL SBTSWLn1 Capacity (veh/h) HCM Lane V/C Ratio HCM Control Delay (s) HCM Lane LOS - - B A A HCM 95th %tile Q(veh) Existing AM Peak Synchro 10 Report Page 1
153 HCM 6th TWSC Existing AM Peak 6: County Line Rd & Old Lancaster Rd 02/25/2019 Intersection Int Delay, s/veh 4.4 Movement WBL WBR NBT NBR SBL SBT Lane Configurations Traffic Vol, veh/h Future Vol, veh/h Conflicting Peds, #/hr Sign Control Stop Stop Free Free Free Free RT Channelized - None - None - None Storage Length Veh in Median Storage, # Grade, % Peak Hour Factor Heavy Vehicles, % Mvmt Flow Major/Minor Minor1 Major1 Major2 Conflicting Flow All Stage Stage Critical Hdwy Critical Hdwy Stg Critical Hdwy Stg Follow-up Hdwy Pot Cap-1 Maneuver Stage Stage Platoon blocked, % Mov Cap-1 Maneuver Mov Cap-2 Maneuver Stage Stage Approach WB NB SB HCM Control Delay, s HCM LOS C Minor Lane/Major Mvmt NBT NBRWBLn1 SBL SBT Capacity (veh/h) HCM Lane V/C Ratio HCM Control Delay (s) HCM Lane LOS - - C B A HCM 95th %tile Q(veh) Existing AM Peak Synchro 10 Report Page 7
154 HCM 6th TWSC Existing AM Peak 7: County Line Rd & Mondella Ave 02/25/2019 Intersection Int Delay, s/veh 0.5 Movement WBL WBR NBT NBR SBL SBT Lane Configurations Traffic Vol, veh/h Future Vol, veh/h Conflicting Peds, #/hr Sign Control Stop Stop Free Free Free Free RT Channelized - None - None - None Storage Length Veh in Median Storage, # Grade, % Peak Hour Factor Heavy Vehicles, % Mvmt Flow Major/Minor Minor1 Major1 Major2 Conflicting Flow All Stage Stage Critical Hdwy Critical Hdwy Stg Critical Hdwy Stg Follow-up Hdwy Pot Cap-1 Maneuver Stage Stage Platoon blocked, % Mov Cap-1 Maneuver Mov Cap-2 Maneuver Stage Stage Approach WB NB SB HCM Control Delay, s HCM LOS D Minor Lane/Major Mvmt NBT NBRWBLn1 SBL SBT Capacity (veh/h) HCM Lane V/C Ratio HCM Control Delay (s) HCM Lane LOS - - D B A HCM 95th %tile Q(veh) Existing AM Peak Synchro 10 Report Page 9
155 Lanes, Volumes, Timings Existing AM Peak 8: County Line Rd & Lindsay Ave 02/25/2019 Lane Group WBL NBT SBT Lane Group Flow (vph) v/c Ratio Control Delay Queue Delay Total Delay Queue Length 50th (ft) Queue Length 95th (ft) Internal Link Dist (ft) Turn Bay Length (ft) Base Capacity (vph) Starvation Cap Reductn Spillback Cap Reductn Storage Cap Reductn Reduced v/c Ratio Intersection Summary Existing AM Peak Synchro 10 Report Page 6
156 HCM Signalized Intersection Capacity Analysis Existing AM Peak 8: County Line Rd & Lindsay Ave 02/25/2019 Movement WBL WBR NBT NBR SBL SBT Lane Configurations Traffic Volume (vph) Future Volume (vph) Ideal Flow (vphpl) Lane Width Total Lost time (s) Lane Util. Factor Frt Flt Protected Satd. Flow (prot) Flt Permitted Satd. Flow (perm) Peak-hour factor, PHF Adj. Flow (vph) RTOR Reduction (vph) Lane Group Flow (vph) Heavy Vehicles (%) 27% 25% 3% 0% 50% 4% Turn Type Prot NA Perm NA Protected Phases Permitted Phases 2 Actuated Green, G (s) Effective Green, g (s) Actuated g/c Ratio Clearance Time (s) Vehicle Extension (s) Lane Grp Cap (vph) v/s Ratio Prot c0.01 c0.33 v/s Ratio Perm 0.23 v/c Ratio Uniform Delay, d Progression Factor Incremental Delay, d Delay (s) Level of Service C A A Approach Delay (s) Approach LOS C A A Intersection Summary HCM 2000 Control Delay 1.7 HCM 2000 Level of Service A HCM 2000 Volume to Capacity ratio 0.37 Actuated Cycle Length (s) 60.0 Sum of lost time (s) 5.0 Intersection Capacity Utilization 39.2% ICU Level of Service A Analysis Period (min) 15 c Critical Lane Group Existing AM Peak Synchro 10 Report Page 7
157 Lanes, Volumes, Timings Existing AM Peak 9: County Line Rd & Railroad Ave & Bryn Mawr Ave 02/25/2019 Lane Group EBL EBT WBL WBT WBR NBL NBT SBL SBT Lane Group Flow (vph) v/c Ratio Control Delay Queue Delay Total Delay Queue Length 50th (ft) Queue Length 95th (ft) m80 #538 m46 0 Internal Link Dist (ft) Turn Bay Length (ft) Base Capacity (vph) Starvation Cap Reductn Spillback Cap Reductn Storage Cap Reductn Reduced v/c Ratio Intersection Summary # 95th percentile volume exceeds capacity, queue may be longer. Queue shown is maximum after two cycles. m Volume for 95th percentile queue is metered by upstream signal. Existing AM Peak Synchro 10 Report Page 8
158 HCM Signalized Intersection Capacity Analysis Existing AM Peak 9: County Line Rd & Railroad Ave & Bryn Mawr Ave 02/25/2019 Movement EBL EBT EBR EBR2 WBL2 WBL WBT WBR NBL NBT NBR NBR2 Lane Configurations Traffic Volume (vph) Future Volume (vph) Ideal Flow (vphpl) Lane Width Total Lost time (s) Lane Util. Factor Frt Flt Protected Satd. Flow (prot) Flt Permitted Satd. Flow (perm) Peak-hour factor, PHF Adj. Flow (vph) RTOR Reduction (vph) Lane Group Flow (vph) Heavy Vehicles (%) 6% 2% 0% 2% 0% 0% 2% 0% 25% 3% 3% 9% Turn Type pm+pt NA pm+pt pm+pt NA Perm pm+pt NA Protected Phases Permitted Phases Actuated Green, G (s) Effective Green, g (s) Actuated g/c Ratio Clearance Time (s) Vehicle Extension (s) Lane Grp Cap (vph) v/s Ratio Prot c0.03 c c0.05 c0.32 v/s Ratio Perm v/c Ratio Uniform Delay, d Progression Factor Incremental Delay, d Delay (s) Level of Service C D C C C B C Approach Delay (s) Approach LOS D C C Intersection Summary HCM 2000 Control Delay 24.6 HCM 2000 Level of Service C HCM 2000 Volume to Capacity ratio 0.80 Actuated Cycle Length (s) Sum of lost time (s) 17.0 Intersection Capacity Utilization 75.6% ICU Level of Service D Analysis Period (min) 15 c Critical Lane Group Existing AM Peak Synchro 10 Report Page 9
159 HCM Signalized Intersection Capacity Analysis Existing AM Peak 9: County Line Rd & Railroad Ave & Bryn Mawr Ave 02/25/2019 Movement SBL2 SBL SBT SBR Lane Configurations Traffic Volume (vph) Future Volume (vph) Ideal Flow (vphpl) Lane Width Total Lost time (s) Lane Util. Factor Frt Flt Protected Satd. Flow (prot) Flt Permitted Satd. Flow (perm) Peak-hour factor, PHF Adj. Flow (vph) RTOR Reduction (vph) Lane Group Flow (vph) Heavy Vehicles (%) 4% 5% 4% 10% Turn Type pm+pt pm+pt NA Protected Phases Permitted Phases Actuated Green, G (s) Effective Green, g (s) Actuated g/c Ratio Clearance Time (s) Vehicle Extension (s) Lane Grp Cap (vph) v/s Ratio Prot v/s Ratio Perm 0.12 v/c Ratio Uniform Delay, d Progression Factor Incremental Delay, d Delay (s) Level of Service C A Approach Delay (s) 5.6 Approach LOS A Intersection Summary Existing AM Peak Synchro 10 Report Page 10
160 Lanes, Volumes, Timings Existing AM Peak 10: County Line Rd & Landover Rd 02/25/2019 Lane Group EBT WBT NBT SBT Lane Group Flow (vph) v/c Ratio Control Delay Queue Delay Total Delay Queue Length 50th (ft) Queue Length 95th (ft) # Internal Link Dist (ft) Turn Bay Length (ft) Base Capacity (vph) Starvation Cap Reductn Spillback Cap Reductn Storage Cap Reductn Reduced v/c Ratio Intersection Summary # 95th percentile volume exceeds capacity, queue may be longer. Queue shown is maximum after two cycles. Existing AM Peak Synchro 10 Report Page 1
161 HCM 6th Signalized Intersection Summary Existing AM Peak 10: County Line Rd & Landover Rd 02/25/2019 Movement EBL EBT EBR WBL WBT WBR NBL NBT NBR SBL SBT SBR Lane Configurations Traffic Volume (veh/h) Future Volume (veh/h) Initial Q (Qb), veh Ped-Bike Adj(A_pbT) Parking Bus, Adj Work Zone On Approach No No No No Adj Sat Flow, veh/h/ln Adj Flow Rate, veh/h Peak Hour Factor Percent Heavy Veh, % Cap, veh/h Arrive On Green Sat Flow, veh/h Grp Volume(v), veh/h Grp Sat Flow(s),veh/h/ln Q Serve(g_s), s Cycle Q Clear(g_c), s Prop In Lane Lane Grp Cap(c), veh/h V/C Ratio(X) Avail Cap(c_a), veh/h HCM Platoon Ratio Upstream Filter(I) Uniform Delay (d), s/veh Incr Delay (d2), s/veh Initial Q Delay(d3),s/veh %ile BackOfQ(95%),veh/ln Unsig. Movement Delay, s/veh LnGrp Delay(d),s/veh LnGrp LOS D A A D A A B A B A A A Approach Vol, veh/h Approach Delay, s/veh Approach LOS D D B A Timer - Assigned Phs Phs Duration (G+Y+Rc), s Change Period (Y+Rc), s Max Green Setting (Gmax), s Max Q Clear Time (g_c+i1), s Green Ext Time (p_c), s Intersection Summary HCM 6th Ctrl Delay 16.0 HCM 6th LOS B Existing AM Peak Synchro 10 Report Page 2
162 Lanes, Volumes, Timings Existing AM Peak 11: County Line Rd & Glenbrook Ave 02/25/2019 Lane Group NBT SBT Lane Group Flow (vph) v/c Ratio Control Delay Queue Delay Total Delay Queue Length 50th (ft) Queue Length 95th (ft) Internal Link Dist (ft) Turn Bay Length (ft) Base Capacity (vph) Starvation Cap Reductn Spillback Cap Reductn 0 0 Storage Cap Reductn 0 0 Reduced v/c Ratio Intersection Summary Existing AM Peak Synchro 10 Report Page 11
163 HCM Signalized Intersection Capacity Analysis Existing AM Peak 11: County Line Rd & Glenbrook Ave 02/25/2019 Movement EBL EBR NBL NBT SBT SBR Lane Configurations Traffic Volume (vph) Future Volume (vph) Ideal Flow (vphpl) Lane Width Total Lost time (s) Lane Util. Factor Frt Flt Protected Satd. Flow (prot) Flt Permitted Satd. Flow (perm) Peak-hour factor, PHF Adj. Flow (vph) RTOR Reduction (vph) Lane Group Flow (vph) Heavy Vehicles (%) 2% 2% 2% 2% 4% 2% Turn Type pm+pt NA NA Protected Phases Permitted Phases Actuated Green, G (s) Effective Green, g (s) Actuated g/c Ratio Clearance Time (s) Vehicle Extension (s) Lane Grp Cap (vph) v/s Ratio Prot c0.15 c0.21 v/s Ratio Perm c0.22 v/c Ratio Uniform Delay, d Progression Factor Incremental Delay, d Delay (s) Level of Service A C Approach Delay (s) Approach LOS A A C Intersection Summary HCM 2000 Control Delay 11.8 HCM 2000 Level of Service B HCM 2000 Volume to Capacity ratio 0.53 Actuated Cycle Length (s) Sum of lost time (s) 20.5 Intersection Capacity Utilization 56.3% ICU Level of Service B Analysis Period (min) 15 c Critical Lane Group Existing AM Peak Synchro 10 Report Page 12
164 Lanes, Volumes, Timings Existing PM Peak 1: County Line Rd & Lancaster Ave 02/25/2019 Lane Group EBL EBT EBR WBL WBT WBR NBL NBT NBR SBL SBT SBR Lane Configurations Traffic Volume (vph) Future Volume (vph) Ideal Flow (vphpl) Lane Width (ft) Grade (%) 4% -4% 2% 3% Right Turn on Red Yes Yes Yes Yes Link Speed (mph) Link Distance (ft) Travel Time (s) Lane Group Flow (vph) Turn Type Perm NA Perm NA Split NA Split NA Protected Phases Permitted Phases 2 6 Detector Phase Switch Phase Minimum Initial (s) Minimum Split (s) Total Split (s) Total Split (%) 52.5% 52.5% 52.5% 52.5% 21.3% 21.3% 26.3% 26.3% Maximum Green (s) Yellow Time (s) All-Red Time (s) Lost Time Adjust (s) Total Lost Time (s) Lead/Lag Lead-Lag Optimize? Vehicle Extension (s) Recall Mode C-Max C-Max None None None None None None Act Effct Green (s) Actuated g/c Ratio v/c Ratio Control Delay Queue Delay Total Delay LOS C B C C C Approach Delay Approach LOS C B C C Queue Length 50th (ft) Queue Length 95th (ft) # Internal Link Dist (ft) Turn Bay Length (ft) Base Capacity (vph) Starvation Cap Reductn Spillback Cap Reductn Storage Cap Reductn Reduced v/c Ratio Intersection Summary Existing PM Peak Synchro 10 Report Page 1
165 Lanes, Volumes, Timings Existing PM Peak 1: County Line Rd & Lancaster Ave 02/25/2019 Area Type: Other Cycle Length: 80 Actuated Cycle Length: 80 Offset: 0 (0%), Referenced to phase 2:EBTL, Start of Green Natural Cycle: 60 Control Type: Actuated-Coordinated Maximum v/c Ratio: 0.88 Intersection Signal Delay: 21.0 Intersection LOS: C Intersection Capacity Utilization 81.1% ICU Level of Service D Analysis Period (min) 15 # 95th percentile volume exceeds capacity, queue may be longer. Queue shown is maximum after two cycles. Splits and Phases: 1: County Line Rd & Lancaster Ave Existing PM Peak Synchro 10 Report Page 2
166 HCM Signalized Intersection Capacity Analysis Existing PM Peak 1: County Line Rd & Lancaster Ave 02/25/2019 Movement EBL EBT EBR WBL WBT WBR NBL NBT NBR SBL SBT SBR Lane Configurations Traffic Volume (vph) Future Volume (vph) Ideal Flow (vphpl) Lane Width Grade (%) 4% -4% 2% 3% Total Lost time (s) Lane Util. Factor Frt Flt Protected Satd. Flow (prot) Flt Permitted Satd. Flow (perm) Peak-hour factor, PHF Adj. Flow (vph) RTOR Reduction (vph) Lane Group Flow (vph) Heavy Vehicles (%) 0% 1% 1% 0% 2% 0% 1% 0% 0% 0% 0% 0% Turn Type Perm NA Perm NA Split NA Split NA Protected Phases Permitted Phases 2 6 Actuated Green, G (s) Effective Green, g (s) Actuated g/c Ratio Clearance Time (s) Vehicle Extension (s) Lane Grp Cap (vph) v/s Ratio Prot 0.17 c0.17 c0.02 v/s Ratio Perm c v/c Ratio Uniform Delay, d Progression Factor Incremental Delay, d Delay (s) Level of Service C B C C C Approach Delay (s) Approach LOS C B C C Intersection Summary HCM 2000 Control Delay 23.0 HCM 2000 Level of Service C HCM 2000 Volume to Capacity ratio 0.77 Actuated Cycle Length (s) 80.0 Sum of lost time (s) 10.0 Intersection Capacity Utilization 81.1% ICU Level of Service D Analysis Period (min) 15 c Critical Lane Group Existing PM Peak Synchro 10 Report Page 3
167 Lanes, Volumes, Timings Existing PM Peak 2: County Line Rd & Montrose Ave 02/25/2019 Lane Group EBL EBT EBR WBL WBT WBR NBL NBT NBR SBL SBT SBR Lane Configurations Traffic Volume (vph) Future Volume (vph) Ideal Flow (vphpl) Lane Width (ft) Link Speed (mph) Link Distance (ft) Travel Time (s) Lane Group Flow (vph) Sign Control Stop Stop Free Free Intersection Summary Area Type: Other Control Type: Unsignalized Intersection Capacity Utilization 48.1% Analysis Period (min) 15 ICU Level of Service A Existing PM Peak Synchro 10 Report Page 1
168 HCM 6th TWSC Existing PM Peak 2: County Line Rd & Montrose Ave 02/25/2019 Intersection Int Delay, s/veh 12.4 Movement EBL EBT EBR WBL WBT WBR NBL NBT NBR SBL SBT SBR Lane Configurations Traffic Vol, veh/h Future Vol, veh/h Conflicting Peds, #/hr Sign Control Stop Stop Stop Stop Stop Stop Free Free Free Free Free Free RT Channelized - - None - - None - - None - - None Storage Length Veh in Median Storage, # Grade, % Peak Hour Factor Heavy Vehicles, % Mvmt Flow Major/Minor Minor2 Minor1 Major1 Major2 Conflicting Flow All Stage Stage Critical Hdwy Critical Hdwy Stg Critical Hdwy Stg Follow-up Hdwy Pot Cap-1 Maneuver Stage Stage Platoon blocked, % Mov Cap-1 Maneuver Mov Cap-2 Maneuver Stage Stage Approach EB WB NB SB HCM Control Delay, s HCM LOS F F Minor Lane/Major Mvmt NBL NBT NBR EBLn1WBLn1 SBL SBT SBR Capacity (veh/h) HCM Lane V/C Ratio HCM Control Delay (s) HCM Lane LOS A A - F F A A - HCM 95th %tile Q(veh) Existing PM Peak Synchro 10 Report Page 2
169 Lanes, Volumes, Timings Existing PM Peak 3: County Line Rd & Roberts Rd 02/25/2019 Lane Group EBL EBT EBR WBL WBT WBR NBL NBT NBR SBL SBT SBR Lane Configurations Traffic Volume (vph) Future Volume (vph) Ideal Flow (vphpl) Lane Width (ft) Link Speed (mph) Link Distance (ft) Travel Time (s) Lane Group Flow (vph) Sign Control Stop Stop Free Free Intersection Summary Area Type: Other Control Type: Unsignalized Intersection Capacity Utilization 35.2% Analysis Period (min) 15 ICU Level of Service A Existing PM Peak Synchro 10 Report Page 3
170 HCM 6th TWSC Existing PM Peak 3: County Line Rd & Roberts Rd 02/25/2019 Intersection Int Delay, s/veh 3.4 Movement EBL EBT EBR WBL WBT WBR NBL NBT NBR SBL SBT SBR Lane Configurations Traffic Vol, veh/h Future Vol, veh/h Conflicting Peds, #/hr Sign Control Stop Stop Stop Stop Stop Stop Free Free Free Free Free Free RT Channelized - - None - - None - - None - - None Storage Length Veh in Median Storage, # Grade, % Peak Hour Factor Heavy Vehicles, % Mvmt Flow Major/Minor Minor2 Minor1 Major1 Major2 Conflicting Flow All Stage Stage Critical Hdwy Critical Hdwy Stg Critical Hdwy Stg Follow-up Hdwy Pot Cap-1 Maneuver Stage Stage Platoon blocked, % Mov Cap-1 Maneuver Mov Cap-2 Maneuver Stage Stage Approach EB WB NB SB HCM Control Delay, s HCM LOS D D Minor Lane/Major Mvmt NBL NBT NBR EBLn1WBLn1 SBL SBT SBR Capacity (veh/h) HCM Lane V/C Ratio HCM Control Delay (s) HCM Lane LOS A - - D D A A - HCM 95th %tile Q(veh) Existing PM Peak Synchro 10 Report Page 4
171 Lanes, Volumes, Timings Existing PM Peak 4: Glenbrook Ave & County Line Rd & Thomas Ave & Conestoga Rd 02/25/2019 Lane Group WBL2 WBL WBR WBR2 NBL NBT NBR SBL SBT SBR SBR2 SER Lane Configurations Traffic Volume (vph) Future Volume (vph) Ideal Flow (vphpl) Lane Width (ft) Grade (%) 2% -1% 2% Right Turn on Red No No No Link Speed (mph) Link Distance (ft) Travel Time (s) Lane Group Flow (vph) Turn Type Perm Perm pm+pt NA Perm NA Perm Protected Phases Permitted Phases Detector Phase Switch Phase Minimum Initial (s) Minimum Split (s) Total Split (s) Total Split (%) 30.6% 30.6% 36.5% 69.4% 32.9% 32.9% 36.5% Maximum Green (s) Yellow Time (s) All-Red Time (s) Lost Time Adjust (s) Total Lost Time (s) Lead/Lag Lead Lag Lag Lead Lead-Lag Optimize? Vehicle Extension (s) Recall Mode None None None C-Max C-Max C-Max None Act Effct Green (s) Actuated g/c Ratio v/c Ratio Control Delay Queue Delay Total Delay LOS C A C D Approach Delay Approach LOS C A C Queue Length 50th (ft) Queue Length 95th (ft) #347 Internal Link Dist (ft) Turn Bay Length (ft) Base Capacity (vph) Starvation Cap Reductn Spillback Cap Reductn Storage Cap Reductn Reduced v/c Ratio Intersection Summary Existing PM Peak Synchro 10 Report Page 4
172 Lanes, Volumes, Timings Existing PM Peak 4: Glenbrook Ave & County Line Rd & Thomas Ave & Conestoga Rd 02/25/2019 Lane Group SER2 NEL2 NEL NER NER2 Lane Configurations Traffic Volume (vph) Future Volume (vph) Ideal Flow (vphpl) Lane Width (ft) Grade (%) -1% Right Turn on Red No No Link Speed (mph) 25 Link Distance (ft) 393 Travel Time (s) 10.7 Lane Group Flow (vph) Turn Type Perm Perm Protected Phases Permitted Phases 4 4 Detector Phase 4 4 Switch Phase Minimum Initial (s) Minimum Split (s) Total Split (s) Total Split (%) 30.6% 30.6% Maximum Green (s) Yellow Time (s) All-Red Time (s) Lost Time Adjust (s) -4.5 Total Lost Time (s) 2.5 Lead/Lag Lead-Lag Optimize? Vehicle Extension (s) Recall Mode None None Act Effct Green (s) 16.4 Actuated g/c Ratio 0.19 v/c Ratio 0.41 Control Delay 33.1 Queue Delay 0.0 Total Delay 33.1 LOS C Approach Delay 33.1 Approach LOS C Queue Length 50th (ft) 59 Queue Length 95th (ft) 103 Internal Link Dist (ft) 313 Turn Bay Length (ft) Base Capacity (vph) 448 Starvation Cap Reductn 0 Spillback Cap Reductn 0 Storage Cap Reductn 0 Reduced v/c Ratio 0.28 Intersection Summary Existing PM Peak Synchro 10 Report Page 5
173 Lanes, Volumes, Timings Existing PM Peak 4: Glenbrook Ave & County Line Rd & Thomas Ave & Conestoga Rd 02/25/2019 Area Type: Other Cycle Length: 85 Actuated Cycle Length: 85 Offset: 53 (62%), Referenced to phase 2:SBTL and 6:NBTL, Start of Yellow Natural Cycle: 65 Control Type: Actuated-Coordinated Maximum v/c Ratio: 0.78 Intersection Signal Delay: 21.0 Intersection LOS: C Intersection Capacity Utilization 69.6% ICU Level of Service C Analysis Period (min) 15 # 95th percentile volume exceeds capacity, queue may be longer. Queue shown is maximum after two cycles. Splits and Phases: 4: Glenbrook Ave & County Line Rd & Thomas Ave & Conestoga Rd Existing PM Peak Synchro 10 Report Page 6
174 HCM Signalized Intersection Capacity Analysis Existing PM Peak 4: Glenbrook Ave & County Line Rd & Thomas Ave & Conestoga Rd 02/25/2019 Movement WBL2 WBL WBR WBR2 NBL NBT NBR SBL SBT SBR SBR2 SER Lane Configurations Traffic Volume (vph) Future Volume (vph) Ideal Flow (vphpl) Lane Width Grade (%) 2% -1% 2% Total Lost time (s) Lane Util. Factor 1.00 * Frt Flt Protected Satd. Flow (prot) Flt Permitted Satd. Flow (perm) Peak-hour factor, PHF Adj. Flow (vph) RTOR Reduction (vph) Lane Group Flow (vph) Heavy Vehicles (%) 9% 0% 0% 25% 0% 2% 4% 0% 0% 5% 0% 1% Turn Type Perm Perm pm+pt NA Perm NA Perm Protected Phases Permitted Phases Actuated Green, G (s) Effective Green, g (s) Actuated g/c Ratio Clearance Time (s) Vehicle Extension (s) Lane Grp Cap (vph) v/s Ratio Prot 0.20 v/s Ratio Perm 0.07 c c0.27 v/c Ratio Uniform Delay, d Progression Factor Incremental Delay, d Delay (s) Level of Service C A C C Approach Delay (s) Approach LOS C A C Intersection Summary HCM 2000 Control Delay 19.1 HCM 2000 Level of Service B HCM 2000 Volume to Capacity ratio 0.71 Actuated Cycle Length (s) 85.0 Sum of lost time (s) 15.5 Intersection Capacity Utilization 69.6% ICU Level of Service C Analysis Period (min) 15 c Critical Lane Group Existing PM Peak Synchro 10 Report Page 7
175 HCM Signalized Intersection Capacity Analysis Existing PM Peak 4: Glenbrook Ave & County Line Rd & Thomas Ave & Conestoga Rd 02/25/2019 Movement SER2 NEL2 NEL NER NER2 Lane Configurations Traffic Volume (vph) Future Volume (vph) Ideal Flow (vphpl) Lane Width Grade (%) -1% Total Lost time (s) 2.5 Lane Util. Factor 1.00 Frt 0.92 Flt Protected 0.98 Satd. Flow (prot) 1621 Flt Permitted 0.98 Satd. Flow (perm) 1621 Peak-hour factor, PHF Adj. Flow (vph) RTOR Reduction (vph) Lane Group Flow (vph) Heavy Vehicles (%) 0% 0% 0% 0% 2% Turn Type Perm Perm Protected Phases Permitted Phases 4 4 Actuated Green, G (s) 11.9 Effective Green, g (s) 16.4 Actuated g/c Ratio 0.19 Clearance Time (s) 7.0 Vehicle Extension (s) 3.0 Lane Grp Cap (vph) 312 v/s Ratio Prot v/s Ratio Perm c0.08 v/c Ratio 0.40 Uniform Delay, d Progression Factor 1.00 Incremental Delay, d2 0.9 Delay (s) 30.9 Level of Service C Approach Delay (s) 30.9 Approach LOS C Intersection Summary Existing PM Peak Synchro 10 Report Page 8
176 HCM 6th TWSC Existing PM Peak 5: County Line Rd & S Warner Ave 03/15/2019 Intersection Int Delay, s/veh 0.2 Movement NBT NBR SBL SBT SWL SWR Lane Configurations Traffic Vol, veh/h Future Vol, veh/h Conflicting Peds, #/hr Sign Control Free Free Free Free Stop Stop RT Channelized - None - None - None Storage Length Veh in Median Storage, # Grade, % Peak Hour Factor Heavy Vehicles, % Mvmt Flow Major/Minor Major1 Major2 Minor1 Conflicting Flow All Stage Stage Critical Hdwy Critical Hdwy Stg Critical Hdwy Stg Follow-up Hdwy Pot Cap-1 Maneuver Stage Stage Platoon blocked, % Mov Cap-1 Maneuver Mov Cap-2 Maneuver Stage Stage Approach NB SB SW HCM Control Delay, s HCM LOS A Minor Lane/Major Mvmt NBT NBR SBL SBTSWLn1 Capacity (veh/h) HCM Lane V/C Ratio HCM Control Delay (s) HCM Lane LOS - - A A A HCM 95th %tile Q(veh) Existing PM Peak Synchro 10 Report Page 1
177 HCM 6th TWSC Existing PM Peak 6: County Line Rd & Old Lancaster Rd 02/25/2019 Intersection Int Delay, s/veh 3.9 Movement WBL WBR NBT NBR SBL SBT Lane Configurations Traffic Vol, veh/h Future Vol, veh/h Conflicting Peds, #/hr Sign Control Stop Stop Free Free Free Free RT Channelized - None - None - None Storage Length Veh in Median Storage, # Grade, % Peak Hour Factor Heavy Vehicles, % Mvmt Flow Major/Minor Minor1 Major1 Major2 Conflicting Flow All Stage Stage Critical Hdwy Critical Hdwy Stg Critical Hdwy Stg Follow-up Hdwy Pot Cap-1 Maneuver Stage Stage Platoon blocked, % Mov Cap-1 Maneuver Mov Cap-2 Maneuver Stage Stage Approach WB NB SB HCM Control Delay, s HCM LOS C Minor Lane/Major Mvmt NBT NBRWBLn1 SBL SBT Capacity (veh/h) HCM Lane V/C Ratio HCM Control Delay (s) HCM Lane LOS - - C A A HCM 95th %tile Q(veh) Existing PM Peak Synchro 10 Report Page 7
178 HCM 6th TWSC Existing PM Peak 7: County Line Rd & Mondella Ave 02/25/2019 Intersection Int Delay, s/veh 0.4 Movement WBL WBR NBT NBR SBL SBT Lane Configurations Traffic Vol, veh/h Future Vol, veh/h Conflicting Peds, #/hr Sign Control Stop Stop Free Free Free Free RT Channelized - None - None - None Storage Length Veh in Median Storage, # Grade, % Peak Hour Factor Heavy Vehicles, % Mvmt Flow Major/Minor Minor1 Major1 Major2 Conflicting Flow All Stage Stage Critical Hdwy Critical Hdwy Stg Critical Hdwy Stg Follow-up Hdwy Pot Cap-1 Maneuver Stage Stage Platoon blocked, % Mov Cap-1 Maneuver Mov Cap-2 Maneuver Stage Stage Approach WB NB SB HCM Control Delay, s HCM LOS C Minor Lane/Major Mvmt NBT NBRWBLn1 SBL SBT Capacity (veh/h) HCM Lane V/C Ratio HCM Control Delay (s) HCM Lane LOS - - C A A HCM 95th %tile Q(veh) Existing PM Peak Synchro 10 Report Page 9
179 Lanes, Volumes, Timings Existing PM Peak 8: County Line Rd & Lindsay Ave 02/25/2019 Lane Group WBL WBR NBT NBR SBL SBT Lane Configurations Traffic Volume (vph) Future Volume (vph) Ideal Flow (vphpl) Lane Width (ft) Right Turn on Red Yes Yes Link Speed (mph) Link Distance (ft) Travel Time (s) Lane Group Flow (vph) Turn Type Prot NA Perm NA Protected Phases Permitted Phases 2 Detector Phase Switch Phase Minimum Initial (s) Minimum Split (s) Total Split (s) Total Split (%) 33.3% 66.7% 66.7% 66.7% Maximum Green (s) Yellow Time (s) All-Red Time (s) Lost Time Adjust (s) Total Lost Time (s) Lead/Lag Lead-Lag Optimize? Vehicle Extension (s) Recall Mode None C-Max C-Max C-Max Act Effct Green (s) Actuated g/c Ratio v/c Ratio Control Delay Queue Delay Total Delay LOS B A A Approach Delay Approach LOS B A A Queue Length 50th (ft) Queue Length 95th (ft) Internal Link Dist (ft) Turn Bay Length (ft) Base Capacity (vph) Starvation Cap Reductn Spillback Cap Reductn Storage Cap Reductn Reduced v/c Ratio Intersection Summary Area Type: Other Existing PM Peak Synchro 10 Report Page 9
180 Lanes, Volumes, Timings Existing PM Peak 8: County Line Rd & Lindsay Ave 02/25/2019 Cycle Length: 60 Actuated Cycle Length: 60 Offset: 34 (57%), Referenced to phase 2:SBTL and 6:NBT, Start of Yellow Natural Cycle: 40 Control Type: Actuated-Coordinated Maximum v/c Ratio: 0.39 Intersection Signal Delay: 1.2 Intersection LOS: A Intersection Capacity Utilization 41.7% ICU Level of Service A Analysis Period (min) 15 Splits and Phases: 8: County Line Rd & Lindsay Ave Existing PM Peak Synchro 10 Report Page 10
181 HCM Signalized Intersection Capacity Analysis Existing PM Peak 8: County Line Rd & Lindsay Ave 02/25/2019 Movement WBL WBR NBT NBR SBL SBT Lane Configurations Traffic Volume (vph) Future Volume (vph) Ideal Flow (vphpl) Lane Width Total Lost time (s) Lane Util. Factor Frt Flt Protected Satd. Flow (prot) Flt Permitted Satd. Flow (perm) Peak-hour factor, PHF Adj. Flow (vph) RTOR Reduction (vph) Lane Group Flow (vph) Heavy Vehicles (%) 0% 0% 2% 0% 0% 1% Turn Type Prot NA Perm NA Protected Phases Permitted Phases 2 Actuated Green, G (s) Effective Green, g (s) Actuated g/c Ratio Clearance Time (s) Vehicle Extension (s) Lane Grp Cap (vph) v/s Ratio Prot c v/s Ratio Perm c0.37 v/c Ratio Uniform Delay, d Progression Factor Incremental Delay, d Delay (s) Level of Service C A A Approach Delay (s) Approach LOS C A A Intersection Summary HCM 2000 Control Delay 1.5 HCM 2000 Level of Service A HCM 2000 Volume to Capacity ratio 0.40 Actuated Cycle Length (s) 60.0 Sum of lost time (s) 4.0 Intersection Capacity Utilization 41.7% ICU Level of Service A Analysis Period (min) 15 c Critical Lane Group Existing PM Peak Synchro 10 Report Page 11
182 Lanes, Volumes, Timings Existing PM Peak 9: County Line Rd & Railroad Ave & Bryn Mawr Ave 02/25/2019 Lane Group EBL EBT EBR EBR2 WBL2 WBL WBT WBR NBL NBT NBR NBR2 Lane Configurations Traffic Volume (vph) Future Volume (vph) Ideal Flow (vphpl) Lane Width (ft) Storage Length (ft) Storage Lanes Taper Length (ft) Right Turn on Red Yes Yes Yes Link Speed (mph) Link Distance (ft) Travel Time (s) Lane Group Flow (vph) Turn Type pm+pt NA pm+pt pm+pt NA Perm pm+pt NA Protected Phases Permitted Phases Detector Phase Switch Phase Minimum Initial (s) Minimum Split (s) Total Split (s) Total Split (%) 11.7% 39.2% 11.7% 11.7% 39.2% 39.2% 10.0% 39.2% Maximum Green (s) Yellow Time (s) All-Red Time (s) Lost Time Adjust (s) Total Lost Time (s) Lead/Lag Lead Lag Lead Lead Lag Lag Lead Lag Lead-Lag Optimize? Vehicle Extension (s) Recall Mode None None None None None None None C-Max Act Effct Green (s) Actuated g/c Ratio v/c Ratio Control Delay Queue Delay Total Delay LOS C D D D A C B Approach Delay Approach LOS D D C Queue Length 50th (ft) Queue Length 95th (ft) # m85 m157 Internal Link Dist (ft) Turn Bay Length (ft) Base Capacity (vph) Starvation Cap Reductn Spillback Cap Reductn Storage Cap Reductn Reduced v/c Ratio Existing PM Peak Synchro 10 Report Page 12
183 Lanes, Volumes, Timings Existing PM Peak 9: County Line Rd & Railroad Ave & Bryn Mawr Ave 02/25/2019 Lane Group SBL2 SBL SBT SBR Lane Configurations Traffic Volume (vph) Future Volume (vph) Ideal Flow (vphpl) Lane Width (ft) Storage Length (ft) 0 0 Storage Lanes 1 0 Taper Length (ft) 25 Right Turn on Red Yes Link Speed (mph) 35 Link Distance (ft) 198 Travel Time (s) 3.9 Lane Group Flow (vph) Turn Type pm+pt pm+pt NA Protected Phases Permitted Phases Detector Phase Switch Phase Minimum Initial (s) Minimum Split (s) Total Split (s) Total Split (%) 10.0% 10.0% 39.2% Maximum Green (s) Yellow Time (s) All-Red Time (s) Lost Time Adjust (s) Total Lost Time (s) Lead/Lag Lead Lead Lag Lead-Lag Optimize? Vehicle Extension (s) Recall Mode None None C-Max Act Effct Green (s) Actuated g/c Ratio v/c Ratio Control Delay Queue Delay Total Delay LOS A A Approach Delay 7.6 Approach LOS A Queue Length 50th (ft) 2 0 Queue Length 95th (ft) m5 1 Internal Link Dist (ft) 118 Turn Bay Length (ft) Base Capacity (vph) Starvation Cap Reductn Spillback Cap Reductn 0 27 Storage Cap Reductn 0 0 Reduced v/c Ratio Existing PM Peak Synchro 10 Report Page 13
184 Lanes, Volumes, Timings Existing PM Peak 9: County Line Rd & Railroad Ave & Bryn Mawr Ave 02/25/2019 Intersection Summary Area Type: Other Cycle Length: 120 Actuated Cycle Length: 120 Offset: 41 (34%), Referenced to phase 2:SBTL and 6:NBTL, Start of Yellow Natural Cycle: 75 Control Type: Actuated-Coordinated Maximum v/c Ratio: 0.83 Intersection Signal Delay: 23.6 Intersection LOS: C Intersection Capacity Utilization 86.3% ICU Level of Service E Analysis Period (min) 15 # 95th percentile volume exceeds capacity, queue may be longer. Queue shown is maximum after two cycles. m Volume for 95th percentile queue is metered by upstream signal. Splits and Phases: 9: County Line Rd & Railroad Ave & Bryn Mawr Ave Existing PM Peak Synchro 10 Report Page 14
185 HCM Signalized Intersection Capacity Analysis Existing PM Peak 9: County Line Rd & Railroad Ave & Bryn Mawr Ave 02/25/2019 Movement EBL EBT EBR EBR2 WBL2 WBL WBT WBR NBL NBT NBR NBR2 Lane Configurations Traffic Volume (vph) Future Volume (vph) Ideal Flow (vphpl) Lane Width Total Lost time (s) Lane Util. Factor Frt Flt Protected Satd. Flow (prot) Flt Permitted Satd. Flow (perm) Peak-hour factor, PHF Adj. Flow (vph) RTOR Reduction (vph) Lane Group Flow (vph) Heavy Vehicles (%) 1% 0% 2% 2% 0% 0% 0% 1% 4% 1% 1% 0% Turn Type pm+pt NA pm+pt pm+pt NA Perm pm+pt NA Protected Phases Permitted Phases Actuated Green, G (s) Effective Green, g (s) Actuated g/c Ratio Clearance Time (s) Vehicle Extension (s) Lane Grp Cap (vph) v/s Ratio Prot 0.03 c0.25 c c v/s Ratio Perm v/c Ratio Uniform Delay, d Progression Factor Incremental Delay, d Delay (s) Level of Service C D D D C C B Approach Delay (s) Approach LOS D D C Intersection Summary HCM 2000 Control Delay 23.1 HCM 2000 Level of Service C HCM 2000 Volume to Capacity ratio 0.81 Actuated Cycle Length (s) Sum of lost time (s) 17.0 Intersection Capacity Utilization 86.3% ICU Level of Service E Analysis Period (min) 15 c Critical Lane Group Existing PM Peak Synchro 10 Report Page 15
186 HCM Signalized Intersection Capacity Analysis Existing PM Peak 9: County Line Rd & Railroad Ave & Bryn Mawr Ave 02/25/2019 Movement SBL2 SBL SBT SBR Lane Configurations Traffic Volume (vph) Future Volume (vph) Ideal Flow (vphpl) Lane Width Total Lost time (s) Lane Util. Factor Frt Flt Protected Satd. Flow (prot) Flt Permitted Satd. Flow (perm) Peak-hour factor, PHF Adj. Flow (vph) RTOR Reduction (vph) Lane Group Flow (vph) Heavy Vehicles (%) 3% 0% 1% 4% Turn Type pm+pt pm+pt NA Protected Phases Permitted Phases Actuated Green, G (s) Effective Green, g (s) Actuated g/c Ratio Clearance Time (s) Vehicle Extension (s) Lane Grp Cap (vph) v/s Ratio Prot 0.01 c0.32 v/s Ratio Perm 0.07 v/c Ratio Uniform Delay, d Progression Factor Incremental Delay, d Delay (s) Level of Service A A Approach Delay (s) 6.4 Approach LOS A Intersection Summary Existing PM Peak Synchro 10 Report Page 16
187 Lanes, Volumes, Timings Existing PM Peak 10: County Line Rd & Landover Rd 02/25/2019 Lane Group EBL EBT EBR WBL WBT WBR NBL NBT NBR SBL SBT SBR Lane Configurations Traffic Volume (vph) Future Volume (vph) Ideal Flow (vphpl) Lane Width (ft) Right Turn on Red Yes Yes Yes Yes Link Speed (mph) Link Distance (ft) Travel Time (s) Lane Group Flow (vph) Turn Type Perm NA Perm NA Perm NA Perm NA Protected Phases Permitted Phases Detector Phase Switch Phase Minimum Initial (s) Minimum Split (s) Total Split (s) Total Split (%) 33.3% 33.3% 33.3% 33.3% 66.7% 66.7% 66.7% 66.7% Maximum Green (s) Yellow Time (s) All-Red Time (s) Lost Time Adjust (s) Total Lost Time (s) Lead/Lag Lead-Lag Optimize? Vehicle Extension (s) Recall Mode None None None None C-Max C-Max C-Max C-Max Act Effct Green (s) Actuated g/c Ratio v/c Ratio Control Delay Queue Delay Total Delay LOS D E B A Approach Delay Approach LOS D E B A Queue Length 50th (ft) Queue Length 95th (ft) 205 # Internal Link Dist (ft) Turn Bay Length (ft) Base Capacity (vph) Starvation Cap Reductn Spillback Cap Reductn Storage Cap Reductn Reduced v/c Ratio Intersection Summary Area Type: Other Existing PM Peak Synchro 10 Report Page 1
188 Lanes, Volumes, Timings Existing PM Peak 10: County Line Rd & Landover Rd 02/25/2019 Cycle Length: 120 Actuated Cycle Length: 120 Offset: 75 (63%), Referenced to phase 2:NBTL and 6:SBTL, Start of Yellow Natural Cycle: 120 Control Type: Actuated-Coordinated Maximum v/c Ratio: 0.89 Intersection Signal Delay: 18.7 Intersection LOS: B Intersection Capacity Utilization 85.7% ICU Level of Service E Analysis Period (min) 15 # 95th percentile volume exceeds capacity, queue may be longer. Queue shown is maximum after two cycles. Splits and Phases: 10: County Line Rd & Landover Rd Existing PM Peak Synchro 10 Report Page 2
189 HCM 6th Signalized Intersection Summary Existing PM Peak 10: County Line Rd & Landover Rd 02/25/2019 Movement EBL EBT EBR WBL WBT WBR NBL NBT NBR SBL SBT SBR Lane Configurations Traffic Volume (veh/h) Future Volume (veh/h) Initial Q (Qb), veh Ped-Bike Adj(A_pbT) Parking Bus, Adj Work Zone On Approach No No No No Adj Sat Flow, veh/h/ln Adj Flow Rate, veh/h Peak Hour Factor Percent Heavy Veh, % Cap, veh/h Arrive On Green Sat Flow, veh/h Grp Volume(v), veh/h Grp Sat Flow(s),veh/h/ln Q Serve(g_s), s Cycle Q Clear(g_c), s Prop In Lane Lane Grp Cap(c), veh/h V/C Ratio(X) Avail Cap(c_a), veh/h HCM Platoon Ratio Upstream Filter(I) Uniform Delay (d), s/veh Incr Delay (d2), s/veh Initial Q Delay(d3),s/veh %ile BackOfQ(95%),veh/ln Unsig. Movement Delay, s/veh LnGrp Delay(d),s/veh LnGrp LOS D A A D A A A A A A A A Approach Vol, veh/h Approach Delay, s/veh Approach LOS D D A A Timer - Assigned Phs Phs Duration (G+Y+Rc), s Change Period (Y+Rc), s Max Green Setting (Gmax), s Max Q Clear Time (g_c+i1), s Green Ext Time (p_c), s Intersection Summary HCM 6th Ctrl Delay 13.7 HCM 6th LOS B Existing PM Peak Synchro 10 Report Page 3
190 Lanes, Volumes, Timings Existing PM Peak 11: County Line Rd & Glenbrook Ave 02/25/2019 Lane Group EBL EBR NBL NBT SBT SBR Ø3 Ø4 Ø5 Ø7 Ø8 Lane Configurations Traffic Volume (vph) Future Volume (vph) Ideal Flow (vphpl) Lane Width (ft) Right Turn on Red Yes Yes Link Speed (mph) Link Distance (ft) Travel Time (s) Lane Group Flow (vph) Turn Type pm+pt NA NA Protected Phases Permitted Phases Detector Phase Switch Phase Minimum Initial (s) Minimum Split (s) Total Split (s) Total Split (%) 10.0% 39.2% 39.2% 12% 39% 10% 12% 39% Maximum Green (s) Yellow Time (s) All-Red Time (s) Lost Time Adjust (s) Total Lost Time (s) Lead/Lag Lead Lag Lag Lead Lag Lead Lead Lag Lead-Lag Optimize? Vehicle Extension (s) Recall Mode None C-Max C-Max None None None None None Act Effct Green (s) Actuated g/c Ratio v/c Ratio Control Delay Queue Delay Total Delay LOS A D Approach Delay Approach LOS A D Queue Length 50th (ft) Queue Length 95th (ft) 1 #550 Internal Link Dist (ft) Turn Bay Length (ft) Base Capacity (vph) Starvation Cap Reductn Spillback Cap Reductn 0 0 Storage Cap Reductn 0 0 Reduced v/c Ratio Intersection Summary Area Type: Other Existing PM Peak Synchro 10 Report Page 17
191 Lanes, Volumes, Timings Existing PM Peak 11: County Line Rd & Glenbrook Ave 02/25/2019 Cycle Length: 120 Actuated Cycle Length: 120 Offset: 41 (34%), Referenced to phase 2:SBTL and 6:NBTL, Start of Yellow Natural Cycle: 75 Control Type: Actuated-Coordinated Maximum v/c Ratio: 0.83 Intersection Signal Delay: 25.6 Intersection LOS: C Intersection Capacity Utilization 43.2% ICU Level of Service A Analysis Period (min) 15 # 95th percentile volume exceeds capacity, queue may be longer. Queue shown is maximum after two cycles. Splits and Phases: 11: County Line Rd & Glenbrook Ave Existing PM Peak Synchro 10 Report Page 18
192 HCM Signalized Intersection Capacity Analysis Existing PM Peak 11: County Line Rd & Glenbrook Ave 02/25/2019 Movement EBL EBR NBL NBT SBT SBR Lane Configurations Traffic Volume (vph) Future Volume (vph) Ideal Flow (vphpl) Lane Width Total Lost time (s) Lane Util. Factor Frt Flt Protected Satd. Flow (prot) Flt Permitted Satd. Flow (perm) Peak-hour factor, PHF Adj. Flow (vph) RTOR Reduction (vph) Lane Group Flow (vph) Heavy Vehicles (%) 0% 0% 1% 2% 1% 2% Turn Type pm+pt NA NA Protected Phases Permitted Phases Actuated Green, G (s) Effective Green, g (s) Actuated g/c Ratio Clearance Time (s) Vehicle Extension (s) Lane Grp Cap (vph) v/s Ratio Prot c0.10 c0.34 v/s Ratio Perm c0.12 v/c Ratio Uniform Delay, d Progression Factor Incremental Delay, d Delay (s) Level of Service A D Approach Delay (s) Approach LOS A A D Intersection Summary HCM 2000 Control Delay 22.1 HCM 2000 Level of Service C HCM 2000 Volume to Capacity ratio 0.56 Actuated Cycle Length (s) Sum of lost time (s) 20.5 Intersection Capacity Utilization 43.2% ICU Level of Service A Analysis Period (min) 15 c Critical Lane Group Existing PM Peak Synchro 10 Report Page 19
193 Lanes, Volumes, Timings Existing SAT Midday Peak 1: County Line Rd & Lancaster Ave 02/25/2019 Lane Group EBL EBT EBR WBL WBT WBR NBL NBT NBR SBL SBT SBR Lane Configurations Traffic Volume (vph) Future Volume (vph) Ideal Flow (vphpl) Lane Width (ft) Grade (%) 4% -4% 2% 3% Right Turn on Red Yes Yes Yes Yes Link Speed (mph) Link Distance (ft) Travel Time (s) Lane Group Flow (vph) Turn Type Perm NA Perm NA Split NA Split NA Protected Phases Permitted Phases 2 6 Detector Phase Switch Phase Minimum Initial (s) Minimum Split (s) Total Split (s) Total Split (%) 52.5% 52.5% 52.5% 52.5% 21.3% 21.3% 26.3% 26.3% Maximum Green (s) Yellow Time (s) All-Red Time (s) Lost Time Adjust (s) Total Lost Time (s) Lead/Lag Lead-Lag Optimize? Vehicle Extension (s) Recall Mode C-Max C-Max None None None None None None Act Effct Green (s) Actuated g/c Ratio v/c Ratio Control Delay Queue Delay Total Delay LOS A B C C C Approach Delay Approach LOS A B C C Queue Length 50th (ft) Queue Length 95th (ft) Internal Link Dist (ft) Turn Bay Length (ft) Base Capacity (vph) Starvation Cap Reductn Spillback Cap Reductn Storage Cap Reductn Reduced v/c Ratio Intersection Summary Existing SAT Midday Peak Lanes, Volumes, Timings Page 1
194 Lanes, Volumes, Timings Existing SAT Midday Peak 1: County Line Rd & Lancaster Ave 02/25/2019 Area Type: Other Cycle Length: 80 Actuated Cycle Length: 80 Offset: 0 (0%), Referenced to phase 2:EBTL, Start of Green Natural Cycle: 60 Control Type: Actuated-Coordinated Maximum v/c Ratio: 0.62 Intersection Signal Delay: 15.8 Intersection Capacity Utilization 72.0% Analysis Period (min) 15 Intersection LOS: B ICU Level of Service C Splits and Phases: 1: County Line Rd & Lancaster Ave Existing SAT Midday Peak Lanes, Volumes, Timings Page 2
195 HCM Signalized Intersection Capacity Analysis Existing SAT Midday Peak 1: County Line Rd & Lancaster Ave 02/25/2019 Movement EBL EBT EBR WBL WBT WBR NBL NBT NBR SBL SBT SBR Lane Configurations Traffic Volume (vph) Future Volume (vph) Ideal Flow (vphpl) Lane Width Grade (%) 4% -4% 2% 3% Total Lost time (s) Lane Util. Factor Frt Flt Protected Satd. Flow (prot) Flt Permitted Satd. Flow (perm) Peak-hour factor, PHF Adj. Flow (vph) RTOR Reduction (vph) Lane Group Flow (vph) Heavy Vehicles (%) 2% 0% 0% 0% 0% 0% 5% 1% 1% 0% 1% 0% Turn Type Perm NA Perm NA Split NA Split NA Protected Phases Permitted Phases 2 6 Actuated Green, G (s) Effective Green, g (s) Actuated g/c Ratio Clearance Time (s) Vehicle Extension (s) Lane Grp Cap (vph) v/s Ratio Prot 0.16 c0.17 c0.02 v/s Ratio Perm c v/c Ratio Uniform Delay, d Progression Factor Incremental Delay, d Delay (s) Level of Service B B C C C Approach Delay (s) Approach LOS B B C C Intersection Summary HCM 2000 Control Delay 16.0 HCM 2000 Level of Service B HCM 2000 Volume to Capacity ratio 0.55 Actuated Cycle Length (s) 80.0 Sum of lost time (s) 10.0 Intersection Capacity Utilization 72.0% ICU Level of Service C Analysis Period (min) 15 c Critical Lane Group Existing SAT Midday Peak HCM Signalized Intersection Capacity Analysis Page 3
196 Lanes, Volumes, Timings Existing SAT Midday Peak 2: County Line Rd & Montrose Ave 02/25/2019 Lane Group EBL EBT EBR WBL WBT WBR NBL NBT NBR SBL SBT SBR Lane Configurations Ideal Flow (vphpl) Lane Width (ft) Link Speed (mph) Link Distance (ft) Travel Time (s) Lane Group Flow (vph) Intersection Summary Area Type: Other Existing SAT Midday Peak Lanes, Volumes, Timings Page 1
197 HCM 6th TWSC Existing SAT Midday Peak 2: County Line Rd & Montrose Ave 02/25/2019 Intersection Int Delay, s/veh 2.7 Movement EBL EBT EBR WBL WBT WBR NBL NBT NBR SBL SBT SBR Lane Configurations Traffic Vol, veh/h Future Vol, veh/h Conflicting Peds, #/hr Sign Control Stop Stop Stop Stop Stop Stop Free Free Free Free Free Free RT Channelized - - None - - None - - None - - None Storage Length Veh in Median Storage, # Grade, % Peak Hour Factor Heavy Vehicles, % Mvmt Flow Major/Minor Minor2 Minor1 Major1 Major2 Conflicting Flow All Stage Stage Critical Hdwy Critical Hdwy Stg Critical Hdwy Stg Follow-up Hdwy Pot Cap-1 Maneuver Stage Stage Platoon blocked, % Mov Cap-1 Maneuver Mov Cap-2 Maneuver Stage Stage Approach EB WB NB SB HCM Control Delay, s HCM LOS C C Minor Lane/Major Mvmt NBL NBT NBR EBLn1WBLn1 SBL SBT SBR Capacity (veh/h) HCM Lane V/C Ratio HCM Control Delay (s) HCM Lane LOS A A - C C A A - HCM 95th %tile Q(veh) Existing SAT Midday Peak HCM 6th TWSC Page 2
198 Lanes, Volumes, Timings Existing SAT Midday Peak 3: County Line Rd & Roberts Rd 02/25/2019 Lane Group EBL EBT EBR WBL WBT WBR NBL NBT NBR SBL SBT SBR Lane Configurations Ideal Flow (vphpl) Lane Width (ft) Link Speed (mph) Link Distance (ft) Travel Time (s) Lane Group Flow (vph) Intersection Summary Area Type: Other Existing SAT Midday Peak Lanes, Volumes, Timings Page 3
199 HCM 6th TWSC Existing SAT Midday Peak 3: County Line Rd & Roberts Rd 02/25/2019 Intersection Int Delay, s/veh 3 Movement EBL EBT EBR WBL WBT WBR NBL NBT NBR SBL SBT SBR Lane Configurations Traffic Vol, veh/h Future Vol, veh/h Conflicting Peds, #/hr Sign Control Stop Stop Stop Stop Stop Stop Free Free Free Free Free Free RT Channelized - - None - - None - - None - - None Storage Length Veh in Median Storage, # Grade, % Peak Hour Factor Heavy Vehicles, % Mvmt Flow Major/Minor Minor2 Minor1 Major1 Major2 Conflicting Flow All Stage Stage Critical Hdwy Critical Hdwy Stg Critical Hdwy Stg Follow-up Hdwy Pot Cap-1 Maneuver Stage Stage Platoon blocked, % Mov Cap-1 Maneuver Mov Cap-2 Maneuver Stage Stage Approach EB WB NB SB HCM Control Delay, s HCM LOS C C Minor Lane/Major Mvmt NBL NBT NBR EBLn1WBLn1 SBL SBT SBR Capacity (veh/h) HCM Lane V/C Ratio HCM Control Delay (s) HCM Lane LOS A A - C C A A - HCM 95th %tile Q(veh) Existing SAT Midday Peak HCM 6th TWSC Page 4
200 Lanes, Volumes, Timings Existing SAT Midday Peak 4: Glenbrook Ave & County Line Rd & Thomas Ave & Conestoga Rd 02/25/2019 Lane Group WBL2 WBL WBR WBR2 NBL NBT NBR SBL SBT SBR SBR2 SER Lane Configurations Traffic Volume (vph) Future Volume (vph) Ideal Flow (vphpl) Lane Width (ft) Grade (%) 2% -1% 2% Right Turn on Red No No No Link Speed (mph) Link Distance (ft) Travel Time (s) Lane Group Flow (vph) Turn Type Perm Perm pm+pt NA Perm NA Perm Protected Phases Permitted Phases Detector Phase Switch Phase Minimum Initial (s) Minimum Split (s) Total Split (s) Total Split (%) 34.2% 34.2% 32.9% 65.8% 32.9% 32.9% 32.9% Maximum Green (s) Yellow Time (s) All-Red Time (s) Lost Time Adjust (s) Total Lost Time (s) Lead/Lag Lead Lag Lag Lead Lead-Lag Optimize? Vehicle Extension (s) Recall Mode None None None C-Max C-Max C-Max None Act Effct Green (s) Actuated g/c Ratio v/c Ratio Control Delay Queue Delay Total Delay LOS C A B C Approach Delay Approach LOS C A B Queue Length 50th (ft) Queue Length 95th (ft) Internal Link Dist (ft) Turn Bay Length (ft) Base Capacity (vph) Starvation Cap Reductn Spillback Cap Reductn Storage Cap Reductn Reduced v/c Ratio Intersection Summary Existing SAT Midday Peak Lanes, Volumes, Timings Page 4
201 Lanes, Volumes, Timings Existing SAT Midday Peak 4: Glenbrook Ave & County Line Rd & Thomas Ave & Conestoga Rd 02/25/2019 Lane Group SER2 NEL2 NEL NER NER2 Lane Configurations Traffic Volume (vph) Future Volume (vph) Ideal Flow (vphpl) Lane Width (ft) Grade (%) -1% Right Turn on Red No No Link Speed (mph) 25 Link Distance (ft) 393 Travel Time (s) 10.7 Lane Group Flow (vph) Turn Type Perm Perm Protected Phases Permitted Phases 4 4 Detector Phase 4 4 Switch Phase Minimum Initial (s) Minimum Split (s) Total Split (s) Total Split (%) 34.2% 34.2% Maximum Green (s) Yellow Time (s) All-Red Time (s) Lost Time Adjust (s) -4.5 Total Lost Time (s) 2.5 Lead/Lag Lead-Lag Optimize? Vehicle Extension (s) Recall Mode None None Act Effct Green (s) 15.9 Actuated g/c Ratio 0.20 v/c Ratio 0.39 Control Delay 30.0 Queue Delay 0.0 Total Delay 30.0 LOS C Approach Delay 30.0 Approach LOS C Queue Length 50th (ft) 54 Queue Length 95th (ft) 96 Internal Link Dist (ft) 313 Turn Bay Length (ft) Base Capacity (vph) 501 Starvation Cap Reductn 0 Spillback Cap Reductn 0 Storage Cap Reductn 0 Reduced v/c Ratio 0.25 Intersection Summary Existing SAT Midday Peak Lanes, Volumes, Timings Page 5
202 Lanes, Volumes, Timings Existing SAT Midday Peak 4: Glenbrook Ave & County Line Rd & Thomas Ave & Conestoga Rd 02/25/2019 Area Type: Other Cycle Length: 79 Actuated Cycle Length: 79 Offset: 52 (66%), Referenced to phase 2:SBTL and 6:NBTL, Start of Yellow Natural Cycle: 65 Control Type: Actuated-Coordinated Maximum v/c Ratio: 0.62 Intersection Signal Delay: 15.4 Intersection LOS: B Intersection Capacity Utilization 62.1% ICU Level of Service B Analysis Period (min) 15 Splits and Phases: 4: Glenbrook Ave & County Line Rd & Thomas Ave & Conestoga Rd Existing SAT Midday Peak Lanes, Volumes, Timings Page 6
203 HCM Signalized Intersection Capacity Analysis Existing SAT Midday Peak 4: Glenbrook Ave & County Line Rd & Thomas Ave & Conestoga Rd 02/25/2019 Movement WBL2 WBL WBR WBR2 NBL NBT NBR SBL SBT SBR SBR2 SER Lane Configurations Traffic Volume (vph) Future Volume (vph) Ideal Flow (vphpl) Lane Width Grade (%) 2% -1% 2% Total Lost time (s) Lane Util. Factor 1.00 * Frt Flt Protected Satd. Flow (prot) Flt Permitted Satd. Flow (perm) Peak-hour factor, PHF Adj. Flow (vph) RTOR Reduction (vph) Lane Group Flow (vph) Heavy Vehicles (%) 0% 33% 0% 0% 0% 2% 0% 0% 1% 0% 0% 0% Turn Type Perm Perm pm+pt NA Perm NA Perm Protected Phases Permitted Phases Actuated Green, G (s) Effective Green, g (s) Actuated g/c Ratio Clearance Time (s) Vehicle Extension (s) Lane Grp Cap (vph) v/s Ratio Prot 0.15 v/s Ratio Perm 0.02 c c0.20 v/c Ratio Uniform Delay, d Progression Factor Incremental Delay, d Delay (s) Level of Service C A B C Approach Delay (s) Approach LOS C A B Intersection Summary HCM 2000 Control Delay 13.8 HCM 2000 Level of Service B HCM 2000 Volume to Capacity ratio 0.59 Actuated Cycle Length (s) 79.0 Sum of lost time (s) 15.5 Intersection Capacity Utilization 62.1% ICU Level of Service B Analysis Period (min) 15 c Critical Lane Group Existing SAT Midday Peak HCM Signalized Intersection Capacity Analysis Page 7
204 HCM Signalized Intersection Capacity Analysis Existing SAT Midday Peak 4: Glenbrook Ave & County Line Rd & Thomas Ave & Conestoga Rd 02/25/2019 Movement SER2 NEL2 NEL NER NER2 Lane Configurations Traffic Volume (vph) Future Volume (vph) Ideal Flow (vphpl) Lane Width Grade (%) -1% Total Lost time (s) 2.5 Lane Util. Factor 1.00 Frt 0.92 Flt Protected 0.98 Satd. Flow (prot) 1616 Flt Permitted 0.98 Satd. Flow (perm) 1616 Peak-hour factor, PHF Adj. Flow (vph) RTOR Reduction (vph) Lane Group Flow (vph) Heavy Vehicles (%) 0% 0% 0% 0% 2% Turn Type Perm Perm Protected Phases Permitted Phases 4 4 Actuated Green, G (s) 10.0 Effective Green, g (s) 14.5 Actuated g/c Ratio 0.18 Clearance Time (s) 7.0 Vehicle Extension (s) 3.0 Lane Grp Cap (vph) 296 v/s Ratio Prot v/s Ratio Perm c0.08 v/c Ratio 0.43 Uniform Delay, d Progression Factor 1.00 Incremental Delay, d2 1.0 Delay (s) 29.6 Level of Service C Approach Delay (s) 29.6 Approach LOS C Intersection Summary Existing SAT Midday Peak HCM Signalized Intersection Capacity Analysis Page 8
205 HCM 6th TWSC Existing SAT Midday Peak 5: County Line Rd & S Warner Ave 03/15/2019 Intersection Int Delay, s/veh 0.1 Movement NBT NBR SBL SBT SWL SWR Lane Configurations Traffic Vol, veh/h Future Vol, veh/h Conflicting Peds, #/hr Sign Control Free Free Free Free Stop Stop RT Channelized - None - None - None Storage Length Veh in Median Storage, # Grade, % Peak Hour Factor Heavy Vehicles, % Mvmt Flow Major/Minor Major1 Major2 Minor1 Conflicting Flow All Stage Stage Critical Hdwy Critical Hdwy Stg Critical Hdwy Stg Follow-up Hdwy Pot Cap-1 Maneuver Stage Stage Platoon blocked, % Mov Cap-1 Maneuver Mov Cap-2 Maneuver Stage Stage Approach NB SB SW HCM Control Delay, s HCM LOS A Minor Lane/Major Mvmt NBT NBR SBL SBTSWLn1 Capacity (veh/h) HCM Lane V/C Ratio HCM Control Delay (s) HCM Lane LOS - - B A A HCM 95th %tile Q(veh) Existing SAT Midday Peak Synchro 10 Report Page 1
206 HCM 6th TWSC Existing SAT Midday Peak 6: County Line Rd & Old Lancaster Rd 02/25/2019 Intersection Int Delay, s/veh 2.4 Movement WBL WBR NBT NBR SBL SBT Lane Configurations Traffic Vol, veh/h Future Vol, veh/h Conflicting Peds, #/hr Sign Control Stop Stop Free Free Free Free RT Channelized - None - None - None Storage Length Veh in Median Storage, # Grade, % Peak Hour Factor Heavy Vehicles, % Mvmt Flow Major/Minor Minor1 Major1 Major2 Conflicting Flow All Stage Stage Critical Hdwy Critical Hdwy Stg Critical Hdwy Stg Follow-up Hdwy Pot Cap-1 Maneuver Stage Stage Platoon blocked, % Mov Cap-1 Maneuver Mov Cap-2 Maneuver Stage Stage Approach WB NB SB HCM Control Delay, s HCM LOS B Minor Lane/Major Mvmt NBT NBRWBLn1 SBL SBT Capacity (veh/h) HCM Lane V/C Ratio HCM Control Delay (s) HCM Lane LOS - - B A A HCM 95th %tile Q(veh) Existing SAT Midday Peak HCM 6th TWSC Page 7
207 HCM 6th TWSC Existing SAT Midday Peak 7: County Line Rd & Mondella Ave 02/25/2019 Intersection Int Delay, s/veh 0.1 Movement WBL WBR NBT NBR SBL SBT Lane Configurations Traffic Vol, veh/h Future Vol, veh/h Conflicting Peds, #/hr Sign Control Stop Stop Free Free Free Free RT Channelized - None - None - None Storage Length Veh in Median Storage, # Grade, % Peak Hour Factor Heavy Vehicles, % Mvmt Flow Major/Minor Minor1 Major1 Major2 Conflicting Flow All Stage Stage Critical Hdwy Critical Hdwy Stg Critical Hdwy Stg Follow-up Hdwy Pot Cap-1 Maneuver Stage Stage Platoon blocked, % Mov Cap-1 Maneuver Mov Cap-2 Maneuver Stage Stage Approach WB NB SB HCM Control Delay, s HCM LOS B Minor Lane/Major Mvmt NBT NBRWBLn1 SBL SBT Capacity (veh/h) HCM Lane V/C Ratio HCM Control Delay (s) HCM Lane LOS - - B A A HCM 95th %tile Q(veh) Existing SAT Midday Peak HCM 6th TWSC Page 9
208 Lanes, Volumes, Timings Existing SAT Midday Peak 8: County Line Rd & Lindsay Ave 02/25/2019 Lane Group WBL WBR NBT NBR SBL SBT Lane Configurations Traffic Volume (vph) Future Volume (vph) Ideal Flow (vphpl) Lane Width (ft) Right Turn on Red Yes Yes Link Speed (mph) Link Distance (ft) Travel Time (s) Lane Group Flow (vph) Turn Type Prot NA Perm NA Protected Phases Permitted Phases 2 Detector Phase Switch Phase Minimum Initial (s) Minimum Split (s) Total Split (s) Total Split (%) 41.0% 59.0% 59.0% 59.0% Maximum Green (s) Yellow Time (s) All-Red Time (s) Lost Time Adjust (s) Total Lost Time (s) Lead/Lag Lead-Lag Optimize? Vehicle Extension (s) Recall Mode None C-Max C-Max C-Max Act Effct Green (s) Actuated g/c Ratio v/c Ratio Control Delay Queue Delay Total Delay LOS A A Approach Delay Approach LOS A A Queue Length 50th (ft) 0 0 Queue Length 95th (ft) 0 0 Internal Link Dist (ft) Turn Bay Length (ft) Base Capacity (vph) Starvation Cap Reductn 0 0 Spillback Cap Reductn 0 0 Storage Cap Reductn 0 0 Reduced v/c Ratio Intersection Summary Area Type: Other Existing SAT Midday Peak Lanes, Volumes, Timings Page 9
209 Lanes, Volumes, Timings Existing SAT Midday Peak 8: County Line Rd & Lindsay Ave 02/25/2019 Cycle Length: 61 Actuated Cycle Length: 61 Offset: 30 (49%), Referenced to phase 2:SBTL and 6:NBT, Start of Yellow Natural Cycle: 40 Control Type: Actuated-Coordinated Maximum v/c Ratio: 0.22 Intersection Signal Delay: 0.2 Intersection LOS: A Intersection Capacity Utilization 22.7% ICU Level of Service A Analysis Period (min) 15 Splits and Phases: 8: County Line Rd & Lindsay Ave Existing SAT Midday Peak Lanes, Volumes, Timings Page 10
210 HCM Signalized Intersection Capacity Analysis Existing SAT Midday Peak 8: County Line Rd & Lindsay Ave 02/25/2019 Movement WBL WBR NBT NBR SBL SBT Lane Configurations Traffic Volume (vph) Future Volume (vph) Ideal Flow (vphpl) Lane Width Total Lost time (s) Lane Util. Factor Frt Flt Protected Satd. Flow (prot) Flt Permitted Satd. Flow (perm) Peak-hour factor, PHF Adj. Flow (vph) RTOR Reduction (vph) Lane Group Flow (vph) Heavy Vehicles (%) 0% 0% 1% 0% 0% 1% Turn Type Prot NA Perm NA Protected Phases Permitted Phases 2 Actuated Green, G (s) Effective Green, g (s) Actuated g/c Ratio Clearance Time (s) Vehicle Extension (s) Lane Grp Cap (vph) v/s Ratio Prot 0.21 v/s Ratio Perm c0.22 v/c Ratio Uniform Delay, d Progression Factor Incremental Delay, d Delay (s) Level of Service A A Approach Delay (s) Approach LOS A A A Intersection Summary HCM 2000 Control Delay 0.2 HCM 2000 Level of Service A HCM 2000 Volume to Capacity ratio 0.24 Actuated Cycle Length (s) 61.0 Sum of lost time (s) 4.0 Intersection Capacity Utilization 22.7% ICU Level of Service A Analysis Period (min) 15 c Critical Lane Group Existing SAT Midday Peak HCM Signalized Intersection Capacity Analysis Page 11
211 Lanes, Volumes, Timings Existing SAT Midday Peak 9: County Line Rd & Railroad Ave & Bryn Mawr Ave 02/25/2019 Lane Group EBL EBT EBR EBR2 WBL WBT WBR NBL NBT NBR NBR2 SBL2 Lane Configurations Traffic Volume (vph) Future Volume (vph) Ideal Flow (vphpl) Lane Width (ft) Storage Length (ft) Storage Lanes Taper Length (ft) Right Turn on Red Yes Yes Yes Link Speed (mph) Link Distance (ft) Travel Time (s) Lane Group Flow (vph) Turn Type pm+pt NA pm+pt NA Perm pm+pt NA pm+pt Protected Phases Permitted Phases Detector Phase Switch Phase Minimum Initial (s) Minimum Split (s) Total Split (s) Total Split (%) 14.4% 35.6% 14.4% 35.6% 35.6% 14.4% 35.6% 14.4% Maximum Green (s) Yellow Time (s) All-Red Time (s) Lost Time Adjust (s) Total Lost Time (s) Lead/Lag Lead Lag Lead Lag Lag Lead Lag Lead Lead-Lag Optimize? Vehicle Extension (s) Recall Mode None None None None None None C-Max None Act Effct Green (s) Actuated g/c Ratio v/c Ratio Control Delay Queue Delay Total Delay LOS B C B C A B C Approach Delay Approach LOS C C C Queue Length 50th (ft) Queue Length 95th (ft) Internal Link Dist (ft) Turn Bay Length (ft) Base Capacity (vph) Starvation Cap Reductn Spillback Cap Reductn Storage Cap Reductn Reduced v/c Ratio Existing SAT Midday Peak Lanes, Volumes, Timings Page 12
212 Lanes, Volumes, Timings Existing SAT Midday Peak 9: County Line Rd & Railroad Ave & Bryn Mawr Ave 02/25/2019 Lane Group SBL SBT SBR Lane Configurations Traffic Volume (vph) Future Volume (vph) Ideal Flow (vphpl) Lane Width (ft) Storage Length (ft) 0 0 Storage Lanes 1 0 Taper Length (ft) 25 Right Turn on Red Yes Link Speed (mph) 35 Link Distance (ft) 198 Travel Time (s) 3.9 Lane Group Flow (vph) Turn Type pm+pt NA Protected Phases 5 2 Permitted Phases 2 Detector Phase 5 2 Switch Phase Minimum Initial (s) Minimum Split (s) Total Split (s) Total Split (%) 14.4% 35.6% Maximum Green (s) Yellow Time (s) All-Red Time (s) Lost Time Adjust (s) Total Lost Time (s) Lead/Lag Lead Lag Lead-Lag Optimize? Vehicle Extension (s) Recall Mode None C-Max Act Effct Green (s) Actuated g/c Ratio v/c Ratio Control Delay Queue Delay Total Delay LOS A A Approach Delay 3.5 Approach LOS A Queue Length 50th (ft) 4 0 Queue Length 95th (ft) m16 0 Internal Link Dist (ft) 118 Turn Bay Length (ft) Base Capacity (vph) Starvation Cap Reductn Spillback Cap Reductn 0 0 Storage Cap Reductn 0 0 Reduced v/c Ratio Existing SAT Midday Peak Lanes, Volumes, Timings Page 13
213 Lanes, Volumes, Timings Existing SAT Midday Peak 9: County Line Rd & Railroad Ave & Bryn Mawr Ave 02/25/2019 Intersection Summary Area Type: Other Cycle Length: 90 Actuated Cycle Length: 90 Offset: 26 (29%), Referenced to phase 2:SBTL and 6:NBTL, Start of Yellow Natural Cycle: 55 Control Type: Actuated-Coordinated Maximum v/c Ratio: 0.63 Intersection Signal Delay: 17.5 Intersection LOS: B Intersection Capacity Utilization 61.6% ICU Level of Service B Analysis Period (min) 15 m Volume for 95th percentile queue is metered by upstream signal. Splits and Phases: 9: County Line Rd & Railroad Ave & Bryn Mawr Ave Existing SAT Midday Peak Lanes, Volumes, Timings Page 14
214 HCM Signalized Intersection Capacity Analysis Existing SAT Midday Peak 9: County Line Rd & Railroad Ave & Bryn Mawr Ave 02/25/2019 Movement EBL EBT EBR EBR2 WBL WBT WBR NBL NBT NBR NBR2 SBL2 Lane Configurations Traffic Volume (vph) Future Volume (vph) Ideal Flow (vphpl) Lane Width Total Lost time (s) Lane Util. Factor Frt Flt Protected Satd. Flow (prot) Flt Permitted Satd. Flow (perm) Peak-hour factor, PHF Adj. Flow (vph) RTOR Reduction (vph) Lane Group Flow (vph) Heavy Vehicles (%) 1% 0% 0% 0% 0% 2% 0% 2% 0% 1% 2% 2% Turn Type pm+pt NA pm+pt NA Perm pm+pt NA pm+pt Protected Phases Permitted Phases Actuated Green, G (s) Effective Green, g (s) Actuated g/c Ratio Clearance Time (s) Vehicle Extension (s) Lane Grp Cap (vph) v/s Ratio Prot c0.04 c c0.03 c0.19 v/s Ratio Perm v/c Ratio Uniform Delay, d Progression Factor Incremental Delay, d Delay (s) Level of Service B C C C C B C Approach Delay (s) Approach LOS C C B Intersection Summary HCM 2000 Control Delay 17.7 HCM 2000 Level of Service B HCM 2000 Volume to Capacity ratio 0.56 Actuated Cycle Length (s) 90.0 Sum of lost time (s) 20.5 Intersection Capacity Utilization 61.6% ICU Level of Service B Analysis Period (min) 15 c Critical Lane Group Existing SAT Midday Peak HCM Signalized Intersection Capacity Analysis Page 15
215 HCM Signalized Intersection Capacity Analysis Existing SAT Midday Peak 9: County Line Rd & Railroad Ave & Bryn Mawr Ave 02/25/2019 Movement SBL SBT SBR Lane Configurations Traffic Volume (vph) Future Volume (vph) Ideal Flow (vphpl) Lane Width Total Lost time (s) Lane Util. Factor Frt Flt Protected Satd. Flow (prot) Flt Permitted Satd. Flow (perm) Peak-hour factor, PHF Adj. Flow (vph) RTOR Reduction (vph) Lane Group Flow (vph) Heavy Vehicles (%) 1% 4% 0% Turn Type pm+pt NA Protected Phases 5 2 Permitted Phases 2 Actuated Green, G (s) Effective Green, g (s) Actuated g/c Ratio Clearance Time (s) Vehicle Extension (s) Lane Grp Cap (vph) v/s Ratio Prot v/s Ratio Perm 0.09 v/c Ratio Uniform Delay, d Progression Factor Incremental Delay, d Delay (s) Level of Service A A Approach Delay (s) 3.6 Approach LOS A Intersection Summary Existing SAT Midday Peak HCM Signalized Intersection Capacity Analysis Page 16
216 Lanes, Volumes, Timings Existing SAT Midday Peak 10: County Line Rd & Landover Rd 02/25/2019 Lane Group EBL EBT EBR WBL WBT WBR NBL NBT NBR SBL SBT SBR Lane Configurations Traffic Volume (vph) Future Volume (vph) Ideal Flow (vphpl) Lane Width (ft) Right Turn on Red Yes Yes Yes Yes Link Speed (mph) Link Distance (ft) Travel Time (s) Lane Group Flow (vph) Turn Type Perm NA Perm NA Perm NA Perm NA Protected Phases Permitted Phases Detector Phase Switch Phase Minimum Initial (s) Minimum Split (s) Total Split (s) Total Split (%) 25.0% 25.0% 25.0% 25.0% 75.0% 75.0% 75.0% 75.0% Maximum Green (s) Yellow Time (s) All-Red Time (s) Lost Time Adjust (s) Total Lost Time (s) Lead/Lag Lead-Lag Optimize? Vehicle Extension (s) Recall Mode None None None None C-Max C-Max C-Max C-Max Act Effct Green (s) Actuated g/c Ratio v/c Ratio Control Delay Queue Delay Total Delay LOS D C A A Approach Delay Approach LOS D C A A Queue Length 50th (ft) Queue Length 95th (ft) # Internal Link Dist (ft) Turn Bay Length (ft) Base Capacity (vph) Starvation Cap Reductn Spillback Cap Reductn Storage Cap Reductn Reduced v/c Ratio Intersection Summary Area Type: Other Existing SAT Midday Peak Lanes, Volumes, Timings Page 1
217 Lanes, Volumes, Timings Existing SAT Midday Peak 10: County Line Rd & Landover Rd 02/25/2019 Cycle Length: 80 Actuated Cycle Length: 80 Offset: 55 (69%), Referenced to phase 2:NBTL and 6:SBTL, Start of Yellow Natural Cycle: 80 Control Type: Actuated-Coordinated Maximum v/c Ratio: 0.81 Intersection Signal Delay: 12.8 Intersection LOS: B Intersection Capacity Utilization 67.4% ICU Level of Service C Analysis Period (min) 15 # 95th percentile volume exceeds capacity, queue may be longer. Queue shown is maximum after two cycles. Splits and Phases: 10: County Line Rd & Landover Rd Existing SAT Midday Peak Lanes, Volumes, Timings Page 2
218 HCM 6th Signalized Intersection Summary Existing SAT Midday Peak 10: County Line Rd & Landover Rd 02/25/2019 Movement EBL EBT EBR WBL WBT WBR NBL NBT NBR SBL SBT SBR Lane Configurations Traffic Volume (veh/h) Future Volume (veh/h) Initial Q (Qb), veh Ped-Bike Adj(A_pbT) Parking Bus, Adj Work Zone On Approach No No No No Adj Sat Flow, veh/h/ln Adj Flow Rate, veh/h Peak Hour Factor Percent Heavy Veh, % Cap, veh/h Arrive On Green Sat Flow, veh/h Grp Volume(v), veh/h Grp Sat Flow(s),veh/h/ln Q Serve(g_s), s Cycle Q Clear(g_c), s Prop In Lane Lane Grp Cap(c), veh/h V/C Ratio(X) Avail Cap(c_a), veh/h HCM Platoon Ratio Upstream Filter(I) Uniform Delay (d), s/veh Incr Delay (d2), s/veh Initial Q Delay(d3),s/veh %ile BackOfQ(95%),veh/ln Unsig. Movement Delay, s/veh LnGrp Delay(d),s/veh LnGrp LOS D A A C A A A A A A A A Approach Vol, veh/h Approach Delay, s/veh Approach LOS D C A A Timer - Assigned Phs Phs Duration (G+Y+Rc), s Change Period (Y+Rc), s Max Green Setting (Gmax), s Max Q Clear Time (g_c+i1), s Green Ext Time (p_c), s Intersection Summary HCM 6th Ctrl Delay 10.5 HCM 6th LOS B Notes User approved pedestrian interval to be less than phase max green. Existing SAT Midday Peak HCM 6th Signalized Intersection Summary Page 3
219 Lanes, Volumes, Timings Existing SAT Midday Peak 11: County Line Rd & Glenbrook Ave 02/25/2019 Lane Group EBL EBR NBL NBT SBT SBR Ø3 Ø4 Ø5 Ø7 Ø8 Lane Configurations Traffic Volume (vph) Future Volume (vph) Ideal Flow (vphpl) Lane Width (ft) Right Turn on Red Yes Yes Link Speed (mph) Link Distance (ft) Travel Time (s) Lane Group Flow (vph) Turn Type pm+pt NA NA Protected Phases Permitted Phases Detector Phase Switch Phase Minimum Initial (s) Minimum Split (s) Total Split (s) Total Split (%) 14.4% 35.6% 35.6% 14% 36% 14% 14% 36% Maximum Green (s) Yellow Time (s) All-Red Time (s) Lost Time Adjust (s) Total Lost Time (s) Lead/Lag Lead Lag Lag Lead Lag Lead Lead Lag Lead-Lag Optimize? Vehicle Extension (s) Recall Mode None C-Max C-Max None None None None None Act Effct Green (s) Actuated g/c Ratio v/c Ratio Control Delay Queue Delay Total Delay LOS A C Approach Delay Approach LOS A C Queue Length 50th (ft) Queue Length 95th (ft) Internal Link Dist (ft) Turn Bay Length (ft) Base Capacity (vph) Starvation Cap Reductn Spillback Cap Reductn 0 0 Storage Cap Reductn 0 0 Reduced v/c Ratio Intersection Summary Area Type: Other Existing SAT Midday Peak Lanes, Volumes, Timings Page 17
220 Lanes, Volumes, Timings Existing SAT Midday Peak 11: County Line Rd & Glenbrook Ave 02/25/2019 Cycle Length: 90 Actuated Cycle Length: 90 Offset: 26 (29%), Referenced to phase 2:SBTL and 6:NBTL, Start of Yellow Natural Cycle: 55 Control Type: Actuated-Coordinated Maximum v/c Ratio: 0.63 Intersection Signal Delay: 10.8 Intersection LOS: B Intersection Capacity Utilization 45.4% ICU Level of Service A Analysis Period (min) 15 Splits and Phases: 11: County Line Rd & Glenbrook Ave Existing SAT Midday Peak Lanes, Volumes, Timings Page 18
221 HCM Signalized Intersection Capacity Analysis Existing SAT Midday Peak 11: County Line Rd & Glenbrook Ave 02/25/2019 Movement EBL EBR NBL NBT SBT SBR Lane Configurations Traffic Volume (vph) Future Volume (vph) Ideal Flow (vphpl) Lane Width Total Lost time (s) Lane Util. Factor Frt Flt Protected Satd. Flow (prot) Flt Permitted Satd. Flow (perm) Peak-hour factor, PHF Adj. Flow (vph) RTOR Reduction (vph) Lane Group Flow (vph) Turn Type pm+pt NA NA Protected Phases Permitted Phases Actuated Green, G (s) Effective Green, g (s) Actuated g/c Ratio Clearance Time (s) Vehicle Extension (s) Lane Grp Cap (vph) v/s Ratio Prot c0.10 c0.21 v/s Ratio Perm c0.14 v/c Ratio Uniform Delay, d Progression Factor Incremental Delay, d Delay (s) Level of Service A C Approach Delay (s) Approach LOS A A C Intersection Summary HCM 2000 Control Delay 10.2 HCM 2000 Level of Service B HCM 2000 Volume to Capacity ratio 0.46 Actuated Cycle Length (s) 90.0 Sum of lost time (s) 21.0 Intersection Capacity Utilization 45.4% ICU Level of Service A Analysis Period (min) 15 c Critical Lane Group Existing SAT Midday Peak HCM Signalized Intersection Capacity Analysis Page 19
222 Analysis w/ Center Turn Lane Excluding Conestoga Road and Bryn Mawr Avenue
223 Lanes, Volumes, Timings AM Peak w/ Improvements 1: County Line Rd & Lancaster Ave 02/25/2019 Lane Group EBL EBT EBR WBL WBT WBR NBL NBT NBR SBL SBT SBR Lane Configurations Traffic Volume (vph) Future Volume (vph) Ideal Flow (vphpl) Lane Width (ft) Grade (%) 4% -4% 2% 3% Right Turn on Red Yes Yes Yes Yes Link Speed (mph) Link Distance (ft) Travel Time (s) Lane Group Flow (vph) Turn Type Perm NA Perm NA Split NA Split NA Protected Phases Permitted Phases 2 6 Detector Phase Switch Phase Minimum Initial (s) Minimum Split (s) Total Split (s) Total Split (%) 52.5% 52.5% 52.5% 52.5% 21.3% 21.3% 26.3% 26.3% Maximum Green (s) Yellow Time (s) All-Red Time (s) Lost Time Adjust (s) Total Lost Time (s) Lead/Lag Lead-Lag Optimize? Vehicle Extension (s) Recall Mode C-Max C-Max None None None None None None Act Effct Green (s) Actuated g/c Ratio v/c Ratio Control Delay Queue Delay Total Delay LOS B B C C B Approach Delay Approach LOS B B C B Queue Length 50th (ft) Queue Length 95th (ft) #347 # Internal Link Dist (ft) Turn Bay Length (ft) Base Capacity (vph) Starvation Cap Reductn Spillback Cap Reductn Storage Cap Reductn Reduced v/c Ratio Intersection Summary AM Peak w/ Improvements Synchro 10 Report Page 1
224 Lanes, Volumes, Timings AM Peak w/ Improvements 1: County Line Rd & Lancaster Ave 02/25/2019 Area Type: Other Cycle Length: 80 Actuated Cycle Length: 80 Offset: 0 (0%), Referenced to phase 2:EBTL, Start of Green Natural Cycle: 65 Control Type: Actuated-Coordinated Maximum v/c Ratio: 0.74 Intersection Signal Delay: 18.4 Intersection LOS: B Intersection Capacity Utilization 70.7% ICU Level of Service C Analysis Period (min) 15 # 95th percentile volume exceeds capacity, queue may be longer. Queue shown is maximum after two cycles. Splits and Phases: 1: County Line Rd & Lancaster Ave AM Peak w/ Improvements Synchro 10 Report Page 2
225 HCM Signalized Intersection Capacity Analysis AM Peak w/ Improvements 1: County Line Rd & Lancaster Ave 02/25/2019 Movement EBL EBT EBR WBL WBT WBR NBL NBT NBR SBL SBT SBR Lane Configurations Traffic Volume (vph) Future Volume (vph) Ideal Flow (vphpl) Lane Width Grade (%) 4% -4% 2% 3% Total Lost time (s) Lane Util. Factor Frt Flt Protected Satd. Flow (prot) Flt Permitted Satd. Flow (perm) Peak-hour factor, PHF Adj. Flow (vph) RTOR Reduction (vph) Lane Group Flow (vph) Heavy Vehicles (%) 0% 5% 6% 0% 5% 17% 3% 4% 0% 0% 0% 0% Turn Type Perm NA Perm NA Split NA Split NA Protected Phases Permitted Phases 2 6 Actuated Green, G (s) Effective Green, g (s) Actuated g/c Ratio Clearance Time (s) Vehicle Extension (s) Lane Grp Cap (vph) v/s Ratio Prot 0.23 c0.23 c0.01 v/s Ratio Perm c v/c Ratio Uniform Delay, d Progression Factor Incremental Delay, d Delay (s) Level of Service C B C C C Approach Delay (s) Approach LOS C B C C Intersection Summary HCM 2000 Control Delay 20.4 HCM 2000 Level of Service C HCM 2000 Volume to Capacity ratio 0.69 Actuated Cycle Length (s) 80.0 Sum of lost time (s) 12.0 Intersection Capacity Utilization 70.7% ICU Level of Service C Analysis Period (min) 15 c Critical Lane Group AM Peak w/ Improvements Synchro 10 Report Page 3
226 Lanes, Volumes, Timings AM Peak w/ Improvements 2: County Line Rd & Montrose Ave 02/25/2019 Lane Group EBL EBT EBR WBL WBT WBR NBL NBT NBR SBL SBT SBR Lane Configurations Traffic Volume (vph) Future Volume (vph) Ideal Flow (vphpl) Lane Width (ft) Storage Length (ft) Storage Lanes Taper Length (ft) Right Turn on Red Yes Yes Yes Yes Link Speed (mph) Link Distance (ft) Travel Time (s) Lane Group Flow (vph) Turn Type Perm NA Perm NA Perm NA Perm NA Protected Phases Permitted Phases Detector Phase Switch Phase Minimum Initial (s) Minimum Split (s) Total Split (s) Total Split (%) 31.3% 31.3% 31.3% 31.3% 68.8% 68.8% 68.8% 68.8% Maximum Green (s) Yellow Time (s) All-Red Time (s) Lost Time Adjust (s) Total Lost Time (s) Lead/Lag Lead-Lag Optimize? Vehicle Extension (s) Recall Mode None None None None C-Max C-Max C-Max C-Max Walk Time (s) Flash Dont Walk (s) Pedestrian Calls (#/hr) Act Effct Green (s) Actuated g/c Ratio v/c Ratio Control Delay Queue Delay Total Delay LOS C C A A A A Approach Delay Approach LOS C C A A Queue Length 50th (ft) Queue Length 95th (ft) m4 200 m1 265 Internal Link Dist (ft) Turn Bay Length (ft) Base Capacity (vph) Starvation Cap Reductn AM Peak w/ Improvements Synchro 10 Report Page 1
227 Lanes, Volumes, Timings AM Peak w/ Improvements 2: County Line Rd & Montrose Ave 02/25/2019 Lane Group EBL EBT EBR WBL WBT WBR NBL NBT NBR SBL SBT SBR Spillback Cap Reductn Storage Cap Reductn Reduced v/c Ratio Intersection Summary Area Type: Other Cycle Length: 80 Actuated Cycle Length: 80 Offset: 0 (0%), Referenced to phase 2:NBTL and 6:SBTL, Start of Yellow Natural Cycle: 60 Control Type: Actuated-Coordinated Maximum v/c Ratio: 0.65 Intersection Signal Delay: 11.4 Intersection LOS: B Intersection Capacity Utilization 62.4% ICU Level of Service B Analysis Period (min) 15 m Volume for 95th percentile queue is metered by upstream signal. Splits and Phases: 2: County Line Rd & Montrose Ave AM Peak w/ Improvements Synchro 10 Report Page 2
228 HCM 6th Signalized Intersection Summary AM Peak w/ Improvements 2: County Line Rd & Montrose Ave 02/25/2019 Movement EBL EBT EBR WBL WBT WBR NBL NBT NBR SBL SBT SBR Lane Configurations Traffic Volume (veh/h) Future Volume (veh/h) Initial Q (Qb), veh Ped-Bike Adj(A_pbT) Parking Bus, Adj Work Zone On Approach No No No No Adj Sat Flow, veh/h/ln Adj Flow Rate, veh/h Peak Hour Factor Percent Heavy Veh, % Cap, veh/h Arrive On Green Sat Flow, veh/h Grp Volume(v), veh/h Grp Sat Flow(s),veh/h/ln Q Serve(g_s), s Cycle Q Clear(g_c), s Prop In Lane Lane Grp Cap(c), veh/h V/C Ratio(X) Avail Cap(c_a), veh/h HCM Platoon Ratio Upstream Filter(I) Uniform Delay (d), s/veh Incr Delay (d2), s/veh Initial Q Delay(d3),s/veh %ile BackOfQ(95%),veh/ln Unsig. Movement Delay, s/veh LnGrp Delay(d),s/veh LnGrp LOS D A A C A A A A A B A A Approach Vol, veh/h Approach Delay, s/veh Approach LOS D C A A Timer - Assigned Phs Phs Duration (G+Y+Rc), s Change Period (Y+Rc), s Max Green Setting (Gmax), s Max Q Clear Time (g_c+i1), s Green Ext Time (p_c), s Intersection Summary HCM 6th Ctrl Delay 11.7 HCM 6th LOS B AM Peak w/ Improvements Synchro 10 Report Page 3
229 Lanes, Volumes, Timings AM Peak w/ Improvements 3: County Line Rd & Roberts Rd 02/25/2019 Lane Group EBL EBT EBR WBL WBT WBR NBL NBT NBR SBL SBT SBR Lane Configurations Traffic Volume (vph) Future Volume (vph) Ideal Flow (vphpl) Lane Width (ft) Storage Length (ft) Storage Lanes Taper Length (ft) Link Speed (mph) Link Distance (ft) Travel Time (s) Lane Group Flow (vph) Sign Control Stop Stop Free Free Intersection Summary Area Type: Other Control Type: Unsignalized Intersection Capacity Utilization 59.1% Analysis Period (min) 15 ICU Level of Service B AM Peak w/ Improvements 06/06/2018 Baseline Synchro 10 Report Page 1
230 HCM 6th TWSC AM Peak w/ Improvements 3: County Line Rd & Roberts Rd 02/25/2019 Intersection Int Delay, s/veh 26.3 Movement EBL EBT EBR WBL WBT WBR NBL NBT NBR SBL SBT SBR Lane Configurations Traffic Vol, veh/h Future Vol, veh/h Conflicting Peds, #/hr Sign Control Stop Stop Stop Stop Stop Stop Free Free Free Free Free Free RT Channelized - - None - - None - - None - - None Storage Length Veh in Median Storage, # Grade, % Peak Hour Factor Heavy Vehicles, % Mvmt Flow Major/Minor Minor2 Minor1 Major1 Major2 Conflicting Flow All Stage Stage Critical Hdwy Critical Hdwy Stg Critical Hdwy Stg Follow-up Hdwy Pot Cap-1 Maneuver Stage Stage Platoon blocked, % Mov Cap-1 Maneuver Mov Cap-2 Maneuver Stage Stage Approach EB WB NB SB HCM Control Delay, s HCM LOS F D Minor Lane/Major Mvmt NBL NBT NBR EBLn1WBLn1 SBL SBT SBR Capacity (veh/h) HCM Lane V/C Ratio HCM Control Delay (s) HCM Lane LOS A A - F D A A - HCM 95th %tile Q(veh) AM Peak w/ Improvements 06/06/2018 Baseline Synchro 10 Report Page 2
231 Lanes, Volumes, Timings AM Peak w/ Improvements 4: Glenbrook Ave & County Line Rd & Thomas Ave & Conestoga Rd 02/25/2019 Lane Group WBL2 WBL WBR WBR2 NBL NBT NBR SBL SBT SBR SER SER2 Lane Configurations Traffic Volume (vph) Future Volume (vph) Ideal Flow (vphpl) Lane Width (ft) Grade (%) 2% -1% 2% Storage Length (ft) Storage Lanes Taper Length (ft) Right Turn on Red No No No Link Speed (mph) Link Distance (ft) Travel Time (s) Lane Group Flow (vph) Turn Type Perm Perm pm+pt NA Perm NA Perm Protected Phases Permitted Phases Detector Phase Switch Phase Minimum Initial (s) Minimum Split (s) Total Split (s) Total Split (%) 20.0% 20.0% 45.0% 80.0% 35.0% 35.0% 45.0% Maximum Green (s) Yellow Time (s) All-Red Time (s) Lost Time Adjust (s) Total Lost Time (s) Lead/Lag Lead Lag Lag Lead Lead-Lag Optimize? Vehicle Extension (s) Recall Mode None None C-Max C-Max Max Max C-Max Act Effct Green (s) Actuated g/c Ratio v/c Ratio Control Delay Queue Delay Total Delay LOS C A A B C Approach Delay Approach LOS C A B Queue Length 50th (ft) Queue Length 95th (ft) Internal Link Dist (ft) Turn Bay Length (ft) Base Capacity (vph) Starvation Cap Reductn Spillback Cap Reductn Storage Cap Reductn AM Peak w/ Improvements Synchro 10 Report Page 4
232 Lanes, Volumes, Timings AM Peak w/ Improvements 4: Glenbrook Ave & County Line Rd & Thomas Ave & Conestoga Rd 02/25/2019 Lane Group NEL2 NEL NER NER2 Lane Configurations Traffic Volume (vph) Future Volume (vph) Ideal Flow (vphpl) Lane Width (ft) Grade (%) -1% Storage Length (ft) 0 0 Storage Lanes 1 0 Taper Length (ft) 25 Right Turn on Red No Link Speed (mph) 25 Link Distance (ft) 393 Travel Time (s) 10.7 Lane Group Flow (vph) Turn Type Perm Perm Protected Phases Permitted Phases 4 4 Detector Phase 4 4 Switch Phase Minimum Initial (s) Minimum Split (s) Total Split (s) Total Split (%) 20.0% 20.0% Maximum Green (s) Yellow Time (s) All-Red Time (s) Lost Time Adjust (s) -5.0 Total Lost Time (s) 3.0 Lead/Lag Lead-Lag Optimize? Vehicle Extension (s) Recall Mode None None Act Effct Green (s) 12.9 Actuated g/c Ratio 0.16 v/c Ratio 0.55 Control Delay 39.6 Queue Delay 0.0 Total Delay 39.6 LOS D Approach Delay 39.6 Approach LOS D Queue Length 50th (ft) 67 Queue Length 95th (ft) 125 Internal Link Dist (ft) 313 Turn Bay Length (ft) Base Capacity (vph) 266 Starvation Cap Reductn 0 Spillback Cap Reductn 0 Storage Cap Reductn 0 AM Peak w/ Improvements Synchro 10 Report Page 5
233 Lanes, Volumes, Timings AM Peak w/ Improvements 4: Glenbrook Ave & County Line Rd & Thomas Ave & Conestoga Rd 02/25/2019 Lane Group WBL2 WBL WBR WBR2 NBL NBT NBR SBL SBT SBR SER SER2 Reduced v/c Ratio Intersection Summary Area Type: Other Cycle Length: 80 Actuated Cycle Length: 80 Offset: 47 (59%), Referenced to phase 1:NBL and 6:NBTL, Start of Yellow Natural Cycle: 65 Control Type: Actuated-Coordinated Maximum v/c Ratio: 0.63 Intersection Signal Delay: 15.0 Intersection LOS: B Intersection Capacity Utilization 72.5% ICU Level of Service C Analysis Period (min) 15 Splits and Phases: 4: Glenbrook Ave & County Line Rd & Thomas Ave & Conestoga Rd AM Peak w/ Improvements Synchro 10 Report Page 6
234 Lanes, Volumes, Timings AM Peak w/ Improvements 4: Glenbrook Ave & County Line Rd & Thomas Ave & Conestoga Rd 02/25/2019 Lane Group NEL2 NEL NER NER2 Reduced v/c Ratio 0.55 Intersection Summary AM Peak w/ Improvements Synchro 10 Report Page 7
235 HCM Signalized Intersection Capacity Analysis AM Peak w/ Improvements 4: Glenbrook Ave & County Line Rd & Thomas Ave & Conestoga Rd 02/25/2019 Movement WBL2 WBL WBR WBR2 NBL NBT NBR SBL SBT SBR SER SER2 Lane Configurations Traffic Volume (vph) Future Volume (vph) Ideal Flow (vphpl) Lane Width Grade (%) 2% -1% 2% Total Lost time (s) Lane Util. Factor * Frt Flt Protected Satd. Flow (prot) Flt Permitted Satd. Flow (perm) Peak-hour factor, PHF Adj. Flow (vph) RTOR Reduction (vph) Lane Group Flow (vph) Heavy Vehicles (%) 0% 0% 6% 0% 3% 3% 8% 0% 5% 0% 2% 0% Parking (#/hr) Turn Type Perm Perm pm+pt NA Perm NA Perm Protected Phases Permitted Phases Actuated Green, G (s) Effective Green, g (s) Actuated g/c Ratio Clearance Time (s) Vehicle Extension (s) Lane Grp Cap (vph) v/s Ratio Prot 0.19 c v/s Ratio Perm c0.27 v/c Ratio Uniform Delay, d Progression Factor Incremental Delay, d Delay (s) Level of Service C A A B C Approach Delay (s) Approach LOS C A B Intersection Summary HCM 2000 Control Delay 14.3 HCM 2000 Level of Service B HCM 2000 Volume to Capacity ratio 0.67 Actuated Cycle Length (s) 80.0 Sum of lost time (s) 13.0 Intersection Capacity Utilization 72.5% ICU Level of Service C Analysis Period (min) 15 c Critical Lane Group AM Peak w/ Improvements Synchro 10 Report Page 8
236 HCM Signalized Intersection Capacity Analysis AM Peak w/ Improvements 4: Glenbrook Ave & County Line Rd & Thomas Ave & Conestoga Rd 02/25/2019 Movement NEL2 NEL NER NER2 Lane Configurations Traffic Volume (vph) Future Volume (vph) Ideal Flow (vphpl) Lane Width Grade (%) -1% Total Lost time (s) 3.0 Lane Util. Factor 1.00 Frt 0.95 Flt Protected 0.97 Satd. Flow (prot) 1639 Flt Permitted 0.97 Satd. Flow (perm) 1639 Peak-hour factor, PHF Adj. Flow (vph) RTOR Reduction (vph) Lane Group Flow (vph) Heavy Vehicles (%) 5% 0% 0% 3% Parking (#/hr) 0 Turn Type Perm Perm Protected Phases Permitted Phases 4 4 Actuated Green, G (s) 7.9 Effective Green, g (s) 12.9 Actuated g/c Ratio 0.16 Clearance Time (s) 8.0 Vehicle Extension (s) 3.0 Lane Grp Cap (vph) 264 v/s Ratio Prot v/s Ratio Perm c0.09 v/c Ratio 0.55 Uniform Delay, d Progression Factor 1.00 Incremental Delay, d2 2.3 Delay (s) 33.2 Level of Service C Approach Delay (s) 33.2 Approach LOS C Intersection Summary AM Peak w/ Improvements Synchro 10 Report Page 9
237 HCM 6th TWSC AM Peak w/ Improvements 5: County Line Rd & S Warner Ave 03/15/2019 Intersection Int Delay, s/veh 0.1 Movement NBT NBR SBL SBT SWL SWR Lane Configurations Traffic Vol, veh/h Future Vol, veh/h Conflicting Peds, #/hr Sign Control Free Free Free Free Stop Stop RT Channelized - None - None - None Storage Length Veh in Median Storage, # Grade, % Peak Hour Factor Heavy Vehicles, % Mvmt Flow Major/Minor Major1 Major2 Minor1 Conflicting Flow All Stage Stage Critical Hdwy Critical Hdwy Stg Critical Hdwy Stg Follow-up Hdwy Pot Cap-1 Maneuver Stage Stage Platoon blocked, % Mov Cap-1 Maneuver Mov Cap-2 Maneuver Stage Stage Approach NB SB SW HCM Control Delay, s HCM LOS A Minor Lane/Major Mvmt NBT NBR SBL SBTSWLn1 Capacity (veh/h) HCM Lane V/C Ratio HCM Control Delay (s) HCM Lane LOS - - B A A HCM 95th %tile Q(veh) AM Peak w/ Improvements Synchro 10 Report Page 1
238 Lanes, Volumes, Timings AM Peak w/ Improvements 6: County Line Rd & Old Lancaster Rd 02/25/2019 Lane Group WBL WBR NBT NBR SBL SBT Lane Configurations Traffic Volume (vph) Future Volume (vph) Ideal Flow (vphpl) Lane Width (ft) Link Speed (mph) Link Distance (ft) Travel Time (s) Lane Group Flow (vph) Sign Control Stop Free Free Intersection Summary Area Type: Other Control Type: Unsignalized Intersection Capacity Utilization 71.9% Analysis Period (min) 15 ICU Level of Service C AM Peak w/ Improvements 06/06/2018 Baseline Synchro 10 Report Page 4
239 HCM 6th TWSC AM Peak w/ Improvements 6: County Line Rd & Old Lancaster Rd 02/25/2019 Intersection Int Delay, s/veh 3.8 Movement WBL WBR NBT NBR SBL SBT Lane Configurations Traffic Vol, veh/h Future Vol, veh/h Conflicting Peds, #/hr Sign Control Stop Stop Free Free Free Free RT Channelized - Stop - None - None Storage Length Veh in Median Storage, # Grade, % Peak Hour Factor Heavy Vehicles, % Mvmt Flow Major/Minor Minor1 Major1 Major2 Conflicting Flow All Stage Stage Critical Hdwy Critical Hdwy Stg Critical Hdwy Stg Follow-up Hdwy Pot Cap-1 Maneuver Stage Stage Platoon blocked, % Mov Cap-1 Maneuver Mov Cap-2 Maneuver Stage Stage Approach WB NB SB HCM Control Delay, s HCM LOS D Minor Lane/Major Mvmt NBT NBRWBLn1 SBL SBT Capacity (veh/h) HCM Lane V/C Ratio HCM Control Delay (s) HCM Lane LOS - - D B - HCM 95th %tile Q(veh) AM Peak w/ Improvements 06/06/2018 Baseline Synchro 10 Report Page 5
240 Lanes, Volumes, Timings AM Peak w/ Improvements 7: County Line Rd & Mondella Ave 02/25/2019 Lane Group WBL WBR NBT NBR SBL SBT Lane Configurations Traffic Volume (vph) Future Volume (vph) Ideal Flow (vphpl) Lane Width (ft) Link Speed (mph) Link Distance (ft) Travel Time (s) Lane Group Flow (vph) Sign Control Stop Free Free Intersection Summary Area Type: Other Control Type: Unsignalized Intersection Capacity Utilization 62.5% Analysis Period (min) 15 ICU Level of Service B AM Peak w/ Improvements 06/06/2018 Baseline Synchro 10 Report Page 6
241 HCM 6th TWSC AM Peak w/ Improvements 7: County Line Rd & Mondella Ave 02/25/2019 Intersection Int Delay, s/veh 0.4 Movement WBL WBR NBT NBR SBL SBT Lane Configurations Traffic Vol, veh/h Future Vol, veh/h Conflicting Peds, #/hr Sign Control Stop Stop Free Free Free Free RT Channelized - None - None - None Storage Length Veh in Median Storage, # Grade, % Peak Hour Factor Heavy Vehicles, % Mvmt Flow Major/Minor Minor1 Major1 Major2 Conflicting Flow All Stage Stage Critical Hdwy Critical Hdwy Stg Critical Hdwy Stg Follow-up Hdwy Pot Cap-1 Maneuver Stage Stage Platoon blocked, % Mov Cap-1 Maneuver Mov Cap-2 Maneuver Stage Stage Approach WB NB SB HCM Control Delay, s HCM LOS C Minor Lane/Major Mvmt NBT NBRWBLn1 SBL SBT Capacity (veh/h) HCM Lane V/C Ratio HCM Control Delay (s) HCM Lane LOS - - C B A HCM 95th %tile Q(veh) AM Peak w/ Improvements 06/06/2018 Baseline Synchro 10 Report Page 7
242 Lanes, Volumes, Timings AM Peak w/ Improvements 8: County Line Rd & Lindsay Ave 02/25/2019 Lane Group WBL WBR NBT NBR SBL SBT Lane Configurations Traffic Volume (vph) Future Volume (vph) Ideal Flow (vphpl) Lane Width (ft) Storage Length (ft) Storage Lanes Taper Length (ft) Right Turn on Red Yes Yes Link Speed (mph) Link Distance (ft) Travel Time (s) Lane Group Flow (vph) Turn Type Prot NA Perm NA Protected Phases Permitted Phases 2 Detector Phase Switch Phase Minimum Initial (s) Minimum Split (s) Total Split (s) Total Split (%) 25.0% 75.0% 75.0% 75.0% Maximum Green (s) Yellow Time (s) All-Red Time (s) Lost Time Adjust (s) Total Lost Time (s) Lead/Lag Lead-Lag Optimize? Vehicle Extension (s) Recall Mode None C-Max C-Max C-Max Act Effct Green (s) Actuated g/c Ratio v/c Ratio Control Delay Queue Delay Total Delay LOS B B A A Approach Delay Approach LOS B B A Queue Length 50th (ft) Queue Length 95th (ft) 19 # Internal Link Dist (ft) Turn Bay Length (ft) 75 Base Capacity (vph) Starvation Cap Reductn Spillback Cap Reductn Storage Cap Reductn Reduced v/c Ratio AM Peak w/ Improvements Synchro 10 Report Page 10
243 Lanes, Volumes, Timings AM Peak w/ Improvements 8: County Line Rd & Lindsay Ave 02/25/2019 Intersection Summary Area Type: Other Cycle Length: 60 Actuated Cycle Length: 60 Offset: 39 (65%), Referenced to phase 2:SBTL and 6:NBT, Start of Yellow Natural Cycle: 60 Control Type: Actuated-Coordinated Maximum v/c Ratio: 0.68 Intersection Signal Delay: 10.6 Intersection LOS: B Intersection Capacity Utilization 65.6% ICU Level of Service C Analysis Period (min) 15 # 95th percentile volume exceeds capacity, queue may be longer. Queue shown is maximum after two cycles. Splits and Phases: 8: County Line Rd & Lindsay Ave AM Peak w/ Improvements Synchro 10 Report Page 11
244 HCM Signalized Intersection Capacity Analysis AM Peak w/ Improvements 8: County Line Rd & Lindsay Ave 02/25/2019 Movement WBL WBR NBT NBR SBL SBT Lane Configurations Traffic Volume (vph) Future Volume (vph) Ideal Flow (vphpl) Lane Width Total Lost time (s) Lane Util. Factor Frt Flt Protected Satd. Flow (prot) Flt Permitted Satd. Flow (perm) Peak-hour factor, PHF Adj. Flow (vph) RTOR Reduction (vph) Lane Group Flow (vph) Heavy Vehicles (%) 27% 25% 3% 0% 50% 4% Turn Type Prot NA Perm NA Protected Phases Permitted Phases 2 Actuated Green, G (s) Effective Green, g (s) Actuated g/c Ratio Clearance Time (s) Vehicle Extension (s) Lane Grp Cap (vph) v/s Ratio Prot c0.01 c v/s Ratio Perm 0.02 v/c Ratio Uniform Delay, d Progression Factor Incremental Delay, d Delay (s) Level of Service C C A A Approach Delay (s) Approach LOS C C A Intersection Summary HCM 2000 Control Delay 15.0 HCM 2000 Level of Service B HCM 2000 Volume to Capacity ratio 0.72 Actuated Cycle Length (s) 60.0 Sum of lost time (s) 6.0 Intersection Capacity Utilization 65.6% ICU Level of Service C Analysis Period (min) 15 c Critical Lane Group AM Peak w/ Improvements Synchro 10 Report Page 12
245 Lanes, Volumes, Timings AM Peak w/ Improvements 9: County Line Rd & Railroad Ave & Bryn Mawr Ave 02/25/2019 Lane Group EBL EBT EBR EBR2 WBL2 WBL WBT WBR NBL NBT NBR NBR2 Lane Configurations Traffic Volume (vph) Future Volume (vph) Ideal Flow (vphpl) Lane Width (ft) Storage Length (ft) Storage Lanes Taper Length (ft) Right Turn on Red Yes Yes Yes Link Speed (mph) Link Distance (ft) Travel Time (s) Lane Group Flow (vph) Turn Type pm+pt NA pm+pt pm+pt NA Perm pm+pt NA Protected Phases Permitted Phases Detector Phase Switch Phase Minimum Initial (s) Minimum Split (s) Total Split (s) Total Split (%) 10.0% 45.8% 10.0% 10.0% 45.8% 45.8% 10.0% 34.2% Maximum Green (s) Yellow Time (s) All-Red Time (s) Lost Time Adjust (s) Total Lost Time (s) Lead/Lag Lead Lag Lead Lead Lag Lag Lead Lag Lead-Lag Optimize? Vehicle Extension (s) Recall Mode None None None None None None None C-Max Act Effct Green (s) Actuated g/c Ratio v/c Ratio Control Delay Queue Delay Total Delay LOS C D B C A C D Approach Delay Approach LOS D C D Queue Length 50th (ft) Queue Length 95th (ft) m77 m#482 Internal Link Dist (ft) Turn Bay Length (ft) Base Capacity (vph) Starvation Cap Reductn Spillback Cap Reductn Storage Cap Reductn Reduced v/c Ratio AM Peak w/ Improvements Synchro 10 Report Page 13
246 Lanes, Volumes, Timings AM Peak w/ Improvements 9: County Line Rd & Railroad Ave & Bryn Mawr Ave 02/25/2019 Lane Group SBL2 SBL SBT SBR Lane Configurations Traffic Volume (vph) Future Volume (vph) Ideal Flow (vphpl) Lane Width (ft) Storage Length (ft) Storage Lanes 1 0 Taper Length (ft) 25 Right Turn on Red Yes Link Speed (mph) 25 Link Distance (ft) 198 Travel Time (s) 5.4 Lane Group Flow (vph) Turn Type pm+pt pm+pt NA Protected Phases Permitted Phases Detector Phase Switch Phase Minimum Initial (s) Minimum Split (s) Total Split (s) Total Split (%) 10.0% 10.0% 34.2% Maximum Green (s) Yellow Time (s) All-Red Time (s) Lost Time Adjust (s) Total Lost Time (s) Lead/Lag Lead Lead Lag Lead-Lag Optimize? Vehicle Extension (s) Recall Mode None None C-Max Act Effct Green (s) Actuated g/c Ratio v/c Ratio Control Delay Queue Delay Total Delay LOS C A Approach Delay 6.4 Approach LOS A Queue Length 50th (ft) 10 0 Queue Length 95th (ft) m48 0 Internal Link Dist (ft) 118 Turn Bay Length (ft) 198 Base Capacity (vph) Starvation Cap Reductn Spillback Cap Reductn 0 0 Storage Cap Reductn 0 0 Reduced v/c Ratio AM Peak w/ Improvements Synchro 10 Report Page 14
247 Lanes, Volumes, Timings AM Peak w/ Improvements 9: County Line Rd & Railroad Ave & Bryn Mawr Ave 02/25/2019 Intersection Summary Area Type: Other Cycle Length: 120 Actuated Cycle Length: 120 Offset: 35 (29%), Referenced to phase 2:SBTL and 6:NBTL, Start of Yellow Natural Cycle: 75 Control Type: Actuated-Coordinated Maximum v/c Ratio: 0.80 Intersection Signal Delay: 28.5 Intersection LOS: C Intersection Capacity Utilization 75.6% ICU Level of Service D Analysis Period (min) 15 # 95th percentile volume exceeds capacity, queue may be longer. Queue shown is maximum after two cycles. m Volume for 95th percentile queue is metered by upstream signal. Splits and Phases: 9: County Line Rd & Railroad Ave & Bryn Mawr Ave AM Peak w/ Improvements Synchro 10 Report Page 15
248 HCM Signalized Intersection Capacity Analysis AM Peak w/ Improvements 9: County Line Rd & Railroad Ave & Bryn Mawr Ave 02/25/2019 Movement EBL EBT EBR EBR2 WBL2 WBL WBT WBR NBL NBT NBR NBR2 Lane Configurations Traffic Volume (vph) Future Volume (vph) Ideal Flow (vphpl) Lane Width Total Lost time (s) Lane Util. Factor Frt Flt Protected Satd. Flow (prot) Flt Permitted Satd. Flow (perm) Peak-hour factor, PHF Adj. Flow (vph) RTOR Reduction (vph) Lane Group Flow (vph) Heavy Vehicles (%) 6% 2% 0% 2% 0% 0% 2% 0% 25% 3% 3% 9% Turn Type pm+pt NA pm+pt pm+pt NA Perm pm+pt NA Protected Phases Permitted Phases Actuated Green, G (s) Effective Green, g (s) Actuated g/c Ratio Clearance Time (s) Vehicle Extension (s) Lane Grp Cap (vph) v/s Ratio Prot c0.03 c c0.05 c0.32 v/s Ratio Perm v/c Ratio Uniform Delay, d Progression Factor Incremental Delay, d Delay (s) Level of Service C D C C C C D Approach Delay (s) Approach LOS D C D Intersection Summary HCM 2000 Control Delay 28.2 HCM 2000 Level of Service C HCM 2000 Volume to Capacity ratio 0.80 Actuated Cycle Length (s) Sum of lost time (s) 17.0 Intersection Capacity Utilization 75.6% ICU Level of Service D Analysis Period (min) 15 c Critical Lane Group AM Peak w/ Improvements Synchro 10 Report Page 16
249 HCM Signalized Intersection Capacity Analysis AM Peak w/ Improvements 9: County Line Rd & Railroad Ave & Bryn Mawr Ave 02/25/2019 Movement SBL2 SBL SBT SBR Lane Configurations Traffic Volume (vph) Future Volume (vph) Ideal Flow (vphpl) Lane Width Total Lost time (s) Lane Util. Factor Frt Flt Protected Satd. Flow (prot) Flt Permitted Satd. Flow (perm) Peak-hour factor, PHF Adj. Flow (vph) RTOR Reduction (vph) Lane Group Flow (vph) Heavy Vehicles (%) 4% 5% 4% 10% Turn Type pm+pt pm+pt NA Protected Phases Permitted Phases Actuated Green, G (s) Effective Green, g (s) Actuated g/c Ratio Clearance Time (s) Vehicle Extension (s) Lane Grp Cap (vph) v/s Ratio Prot v/s Ratio Perm 0.12 v/c Ratio Uniform Delay, d Progression Factor Incremental Delay, d Delay (s) Level of Service C A Approach Delay (s) 6.5 Approach LOS A Intersection Summary AM Peak w/ Improvements Synchro 10 Report Page 17
250 Lanes, Volumes, Timings AM Peak w/ Improvements 10: County Line Rd & Landover Rd 02/25/2019 Lane Group EBL EBT EBR WBL WBT WBR NBL NBT NBR SBL SBT SBR Lane Configurations Traffic Volume (vph) Future Volume (vph) Ideal Flow (vphpl) Lane Width (ft) Storage Length (ft) Storage Lanes Taper Length (ft) Right Turn on Red Yes Yes Yes Yes Link Speed (mph) Link Distance (ft) Travel Time (s) Lane Group Flow (vph) Turn Type Perm NA Perm NA Perm NA Perm NA Protected Phases Permitted Phases Detector Phase Switch Phase Minimum Initial (s) Minimum Split (s) Total Split (s) Total Split (%) 33.3% 33.3% 33.3% 33.3% 66.7% 66.7% 66.7% 66.7% Maximum Green (s) Yellow Time (s) All-Red Time (s) Lost Time Adjust (s) Total Lost Time (s) Lead/Lag Lead-Lag Optimize? Vehicle Extension (s) Recall Mode None None None None C-Max C-Max C-Max C-Max Act Effct Green (s) Actuated g/c Ratio v/c Ratio Control Delay Queue Delay Total Delay LOS E C A D B B Approach Delay Approach LOS E C D B Queue Length 50th (ft) Queue Length 95th (ft) # #1045 m9 126 Internal Link Dist (ft) Turn Bay Length (ft) Base Capacity (vph) Starvation Cap Reductn Spillback Cap Reductn Storage Cap Reductn Reduced v/c Ratio AM Peak w/ Improvements Synchro 10 Report Page 4
251 Lanes, Volumes, Timings AM Peak w/ Improvements 10: County Line Rd & Landover Rd 02/25/2019 Intersection Summary Area Type: Other Cycle Length: 120 Actuated Cycle Length: 120 Offset: 75 (63%), Referenced to phase 2:NBTL and 6:SBTL, Start of Yellow Natural Cycle: 120 Control Type: Actuated-Coordinated Maximum v/c Ratio: 0.94 Intersection Signal Delay: 38.8 Intersection LOS: D Intersection Capacity Utilization 89.2% ICU Level of Service E Analysis Period (min) 15 # 95th percentile volume exceeds capacity, queue may be longer. Queue shown is maximum after two cycles. m Volume for 95th percentile queue is metered by upstream signal. Splits and Phases: 10: County Line Rd & Landover Rd AM Peak w/ Improvements Synchro 10 Report Page 5
252 HCM 6th Signalized Intersection Summary AM Peak w/ Improvements 10: County Line Rd & Landover Rd 02/25/2019 Movement EBL EBT EBR WBL WBT WBR NBL NBT NBR SBL SBT SBR Lane Configurations Traffic Volume (veh/h) Future Volume (veh/h) Initial Q (Qb), veh Ped-Bike Adj(A_pbT) Parking Bus, Adj Work Zone On Approach No No No No Adj Sat Flow, veh/h/ln Adj Flow Rate, veh/h Peak Hour Factor Percent Heavy Veh, % Cap, veh/h Arrive On Green Sat Flow, veh/h Grp Volume(v), veh/h Grp Sat Flow(s),veh/h/ln Q Serve(g_s), s Cycle Q Clear(g_c), s Prop In Lane Lane Grp Cap(c), veh/h V/C Ratio(X) Avail Cap(c_a), veh/h HCM Platoon Ratio Upstream Filter(I) Uniform Delay (d), s/veh Incr Delay (d2), s/veh Initial Q Delay(d3),s/veh %ile BackOfQ(95%),veh/ln Unsig. Movement Delay, s/veh LnGrp Delay(d),s/veh LnGrp LOS D A A D A A A A C C A A Approach Vol, veh/h Approach Delay, s/veh Approach LOS D D C A Timer - Assigned Phs Phs Duration (G+Y+Rc), s Change Period (Y+Rc), s Max Green Setting (Gmax), s Max Q Clear Time (g_c+i1), s Green Ext Time (p_c), s Intersection Summary HCM 6th Ctrl Delay 22.8 HCM 6th LOS C AM Peak w/ Improvements Synchro 10 Report Page 6
253 Lanes, Volumes, Timings AM Peak w/ Improvements 11: County Line Rd & Glenbrook Ave 02/25/2019 Lane Group EBL EBR NBL NBT SBT SBR Ø3 Ø4 Ø5 Ø7 Ø8 Lane Configurations Traffic Volume (vph) Future Volume (vph) Ideal Flow (vphpl) Lane Width (ft) Right Turn on Red Yes Yes Link Speed (mph) Link Distance (ft) Travel Time (s) Lane Group Flow (vph) Turn Type pm+pt NA NA Protected Phases Permitted Phases Detector Phase Switch Phase Minimum Initial (s) Minimum Split (s) Total Split (s) Total Split (%) 10.0% 34.2% 34.2% 10% 46% 10% 10% 46% Maximum Green (s) Yellow Time (s) All-Red Time (s) Lost Time Adjust (s) Total Lost Time (s) Lead/Lag Lead Lag Lag Lead Lag Lead Lead Lag Lead-Lag Optimize? Vehicle Extension (s) Recall Mode None C-Max C-Max None None None None None Act Effct Green (s) Actuated g/c Ratio v/c Ratio Control Delay Queue Delay Total Delay LOS A C Approach Delay Approach LOS A C Queue Length 50th (ft) Queue Length 95th (ft) Internal Link Dist (ft) Turn Bay Length (ft) Base Capacity (vph) Starvation Cap Reductn Spillback Cap Reductn Storage Cap Reductn 0 0 Reduced v/c Ratio Intersection Summary Area Type: Other AM Peak w/ Improvements Synchro 10 Report Page 18
254 Lanes, Volumes, Timings AM Peak w/ Improvements 11: County Line Rd & Glenbrook Ave 02/25/2019 Cycle Length: 120 Actuated Cycle Length: 120 Offset: 35 (29%), Referenced to phase 2:SBTL and 6:NBTL, Start of Yellow Natural Cycle: 75 Control Type: Actuated-Coordinated Maximum v/c Ratio: 0.80 Intersection Signal Delay: 13.1 Intersection LOS: B Intersection Capacity Utilization 56.3% ICU Level of Service B Analysis Period (min) 15 Splits and Phases: 11: County Line Rd & Glenbrook Ave AM Peak w/ Improvements Synchro 10 Report Page 19
255 HCM Signalized Intersection Capacity Analysis AM Peak w/ Improvements 11: County Line Rd & Glenbrook Ave 02/25/2019 Movement EBL EBR NBL NBT SBT SBR Lane Configurations Traffic Volume (vph) Future Volume (vph) Ideal Flow (vphpl) Lane Width Total Lost time (s) Lane Util. Factor Frt Flt Protected Satd. Flow (prot) Flt Permitted Satd. Flow (perm) Peak-hour factor, PHF Adj. Flow (vph) RTOR Reduction (vph) Lane Group Flow (vph) Heavy Vehicles (%) 2% 2% 2% 2% 4% 2% Turn Type pm+pt NA NA Protected Phases Permitted Phases Actuated Green, G (s) Effective Green, g (s) Actuated g/c Ratio Clearance Time (s) Vehicle Extension (s) Lane Grp Cap (vph) v/s Ratio Prot c0.15 c0.21 v/s Ratio Perm c0.22 v/c Ratio Uniform Delay, d Progression Factor Incremental Delay, d Delay (s) Level of Service A C Approach Delay (s) Approach LOS A A C Intersection Summary HCM 2000 Control Delay 11.5 HCM 2000 Level of Service B HCM 2000 Volume to Capacity ratio 0.53 Actuated Cycle Length (s) Sum of lost time (s) 20.5 Intersection Capacity Utilization 56.3% ICU Level of Service B Analysis Period (min) 15 c Critical Lane Group AM Peak w/ Improvements Synchro 10 Report Page 20
256 Lanes, Volumes, Timings PM Peak w/ Improvements 1: County Line Road & Lancaster Ave 02/25/2019 Lane Group EBL EBT EBR WBL WBT WBR NBL NBT NBR SBL SBT SBR Lane Configurations Traffic Volume (vph) Future Volume (vph) Ideal Flow (vphpl) Lane Width (ft) Grade (%) 4% -4% 2% 3% Right Turn on Red Yes Yes Yes Yes Link Speed (mph) Link Distance (ft) Travel Time (s) Lane Group Flow (vph) Turn Type Perm NA Perm NA Split NA Split NA Protected Phases Permitted Phases 2 6 Detector Phase Switch Phase Minimum Initial (s) Minimum Split (s) Total Split (s) Total Split (%) 52.5% 52.5% 52.5% 52.5% 21.3% 21.3% 26.3% 26.3% Yellow Time (s) All-Red Time (s) Lost Time Adjust (s) Total Lost Time (s) Lead/Lag Lead-Lag Optimize? Recall Mode C-Max C-Max None None None None None None Act Effct Green (s) Actuated g/c Ratio v/c Ratio Control Delay Queue Delay Total Delay LOS C B C C C Approach Delay Approach LOS C B C C Queue Length 50th (ft) Queue Length 95th (ft) # #218 # Internal Link Dist (ft) Turn Bay Length (ft) Base Capacity (vph) Starvation Cap Reductn Spillback Cap Reductn Storage Cap Reductn Reduced v/c Ratio Intersection Summary Area Type: Cycle Length: 80 Other PM Peak w/ Improvements Synchro 10 Report Page 1
257 Lanes, Volumes, Timings PM Peak w/ Improvements 1: County Line Road & Lancaster Ave 02/25/2019 Actuated Cycle Length: 80 Offset: 0 (0%), Referenced to phase 2:EBTL, Start of Green Natural Cycle: 60 Control Type: Actuated-Coordinated Maximum v/c Ratio: 0.89 Intersection Signal Delay: 21.5 Intersection Capacity Utilization 81.1% Analysis Period (min) 15 # 95th percentile volume exceeds capacity, queue may be longer. Queue shown is maximum after two cycles. Intersection LOS: C ICU Level of Service D Splits and Phases: 1: County Line Road & Lancaster Ave PM Peak w/ Improvements Synchro 10 Report Page 2
258 HCM Signalized Intersection Capacity Analysis PM Peak w/ Improvements 1: County Line Road & Lancaster Ave 02/25/2019 Movement EBL EBT EBR WBL WBT WBR NBL NBT NBR SBL SBT SBR Lane Configurations Traffic Volume (vph) Future Volume (vph) Ideal Flow (vphpl) Lane Width Grade (%) 4% -4% 2% 3% Total Lost time (s) Lane Util. Factor Frt Flt Protected Satd. Flow (prot) Flt Permitted Satd. Flow (perm) Peak-hour factor, PHF Adj. Flow (vph) RTOR Reduction (vph) Lane Group Flow (vph) Heavy Vehicles (%) 0% 1% 1% 0% 2% 0% 1% 0% 0% 0% 0% 0% Turn Type Perm NA Perm NA Split NA Split NA Protected Phases Permitted Phases 2 6 Actuated Green, G (s) Effective Green, g (s) Actuated g/c Ratio Clearance Time (s) Vehicle Extension (s) Lane Grp Cap (vph) v/s Ratio Prot 0.17 c0.17 c0.02 v/s Ratio Perm c v/c Ratio Uniform Delay, d Progression Factor Incremental Delay, d Delay (s) Level of Service C B C C C Approach Delay (s) Approach LOS C B C C Intersection Summary HCM 2000 Control Delay 24.3 HCM 2000 Level of Service C HCM 2000 Volume to Capacity ratio 0.78 Actuated Cycle Length (s) 80.0 Sum of lost time (s) 11.0 Intersection Capacity Utilization 81.1% ICU Level of Service D Analysis Period (min) 15 c Critical Lane Group PM Peak w/ Improvements Synchro 10 Report Page 3
259 Lanes, Volumes, Timings PM Peak w/ Improvements 2: County Line Road & Montrose Ave 02/26/2019 Lane Group EBL EBT EBR WBL WBT WBR NBL NBT NBR SBL SBT SBR Lane Configurations Traffic Volume (vph) Future Volume (vph) Ideal Flow (vphpl) Lane Width (ft) Storage Length (ft) Storage Lanes Taper Length (ft) Right Turn on Red Yes Yes Yes Yes Link Speed (mph) Link Distance (ft) Travel Time (s) Lane Group Flow (vph) Turn Type Perm NA Perm NA Perm NA Perm NA Protected Phases Permitted Phases Detector Phase Switch Phase Minimum Initial (s) Minimum Split (s) Total Split (s) Total Split (%) 40.0% 40.0% 40.0% 40.0% 60.0% 60.0% 60.0% 60.0% Yellow Time (s) All-Red Time (s) Lost Time Adjust (s) Total Lost Time (s) Lead/Lag Lead-Lag Optimize? Recall Mode None None None None C-Max C-Max C-Max C-Max Act Effct Green (s) Actuated g/c Ratio v/c Ratio Control Delay Queue Delay Total Delay LOS C C A A A B Approach Delay Approach LOS C C A B Queue Length 50th (ft) Queue Length 95th (ft) m #531 Internal Link Dist (ft) Turn Bay Length (ft) Base Capacity (vph) Starvation Cap Reductn Spillback Cap Reductn Storage Cap Reductn Reduced v/c Ratio Intersection Summary PM Peak w/ Improvements Synchro 10 Report Page 1
260 Lanes, Volumes, Timings PM Peak w/ Improvements 2: County Line Road & Montrose Ave 02/26/2019 Area Type: Other Cycle Length: 75 Actuated Cycle Length: 75 Offset: 0 (0%), Referenced to phase 2:NBTL and 6:SBTL, Start of Yellow Natural Cycle: 80 Control Type: Actuated-Coordinated Maximum v/c Ratio: 0.74 Intersection Signal Delay: 13.9 Intersection LOS: B Intersection Capacity Utilization 63.0% ICU Level of Service B Analysis Period (min) 15 # 95th percentile volume exceeds capacity, queue may be longer. Queue shown is maximum after two cycles. m Volume for 95th percentile queue is metered by upstream signal. Splits and Phases: 2: County Line Road & Montrose Ave PM Peak w/ Improvements Synchro 10 Report Page 2
261 HCM 6th Signalized Intersection Summary PM Peak w/ Improvements 2: County Line Road & Montrose Ave 02/26/2019 Movement EBL EBT EBR WBL WBT WBR NBL NBT NBR SBL SBT SBR Lane Configurations Traffic Volume (veh/h) Future Volume (veh/h) Initial Q (Qb), veh Ped-Bike Adj(A_pbT) Parking Bus, Adj Work Zone On Approach No No No No Adj Sat Flow, veh/h/ln Adj Flow Rate, veh/h Peak Hour Factor Percent Heavy Veh, % Cap, veh/h Arrive On Green Sat Flow, veh/h Grp Volume(v), veh/h Grp Sat Flow(s),veh/h/ln Q Serve(g_s), s Cycle Q Clear(g_c), s Prop In Lane Lane Grp Cap(c), veh/h V/C Ratio(X) Avail Cap(c_a), veh/h HCM Platoon Ratio Upstream Filter(I) Uniform Delay (d), s/veh Incr Delay (d2), s/veh Initial Q Delay(d3),s/veh %ile BackOfQ(95%),veh/ln Unsig. Movement Delay, s/veh LnGrp Delay(d),s/veh LnGrp LOS C A A C A A A A A A A A Approach Vol, veh/h Approach Delay, s/veh Approach LOS C C A A Timer - Assigned Phs Phs Duration (G+Y+Rc), s Change Period (Y+Rc), s Max Green Setting (Gmax), s Max Q Clear Time (g_c+i1), s Green Ext Time (p_c), s Intersection Summary HCM 6th Ctrl Delay 10.4 HCM 6th LOS B PM Peak w/ Improvements Synchro 10 Report Page 3
262 Lanes, Volumes, Timings PM Peak w/ Improvements 3: County Line Road & Roberts Rd 02/26/2019 Lane Group EBL EBT EBR WBL WBT WBR NBL NBT NBR SBL SBT SBR Lane Configurations Traffic Volume (vph) Future Volume (vph) Ideal Flow (vphpl) Lane Width (ft) Storage Length (ft) Storage Lanes Taper Length (ft) Link Speed (mph) Link Distance (ft) Travel Time (s) Lane Group Flow (vph) Sign Control Stop Stop Free Free Intersection Summary Area Type: Other Control Type: Unsignalized Intersection Capacity Utilization 51.4% Analysis Period (min) 15 ICU Level of Service A PM Peak w/ Improvements Synchro 10 Report Page 1
263 HCM 6th TWSC PM Peak w/ Improvements 3: County Line Road & Roberts Rd 02/26/2019 Intersection Int Delay, s/veh 4.3 Movement EBL EBT EBR WBL WBT WBR NBL NBT NBR SBL SBT SBR Lane Configurations Traffic Vol, veh/h Future Vol, veh/h Conflicting Peds, #/hr Sign Control Stop Stop Stop Stop Stop Stop Free Free Free Free Free Free RT Channelized - - None - - None - - None - - None Storage Length Veh in Median Storage, # Grade, % Peak Hour Factor Heavy Vehicles, % Mvmt Flow Major/Minor Minor2 Minor1 Major1 Major2 Conflicting Flow All Stage Stage Critical Hdwy Critical Hdwy Stg Critical Hdwy Stg Follow-up Hdwy Pot Cap-1 Maneuver Stage Stage Platoon blocked, % Mov Cap-1 Maneuver Mov Cap-2 Maneuver Stage Stage Approach EB WB NB SB HCM Control Delay, s HCM LOS E D Minor Lane/Major Mvmt NBL NBT NBR EBLn1WBLn1 SBL SBT SBR Capacity (veh/h) HCM Lane V/C Ratio HCM Control Delay (s) HCM Lane LOS A - - E D A A - HCM 95th %tile Q(veh) PM Peak w/ Improvements Synchro 10 Report Page 2
264 Lanes, Volumes, Timings PM Peak w/ Improvements 4: Glenbrook Ave & County Line Road & Thomas Ave & Conestoga Rd 02/25/2019 Lane Group WBL2 WBL WBR WBR2 NBL NBT NBR SBL SBT SBR SBR2 SER Lane Configurations Traffic Volume (vph) Future Volume (vph) Ideal Flow (vphpl) Lane Width (ft) Grade (%) 2% -1% 2% Storage Length (ft) Storage Lanes Taper Length (ft) Right Turn on Red No No No Link Speed (mph) Link Distance (ft) Travel Time (s) Lane Group Flow (vph) Turn Type Perm Perm pm+pt NA Perm NA Perm Protected Phases Permitted Phases Detector Phase Switch Phase Minimum Initial (s) Minimum Split (s) Total Split (s) Total Split (%) 16.0% 16.0% 36.0% 84.0% 48.0% 48.0% 36.0% Yellow Time (s) All-Red Time (s) Lost Time Adjust (s) Total Lost Time (s) Lead/Lag Lead Lag Lag Lead Lead-Lag Optimize? Recall Mode None None None C-Max C-Max C-Max None Act Effct Green (s) Actuated g/c Ratio v/c Ratio Control Delay Queue Delay Total Delay LOS D A A B B D Approach Delay Approach LOS D A B Queue Length 50th (ft) Queue Length 95th (ft) # m4 121 #345 Internal Link Dist (ft) Turn Bay Length (ft) 75 Base Capacity (vph) Starvation Cap Reductn Spillback Cap Reductn Storage Cap Reductn Reduced v/c Ratio PM Peak w/ Improvements Synchro 10 Report Page 4
265 Lanes, Volumes, Timings PM Peak w/ Improvements 4: Glenbrook Ave & County Line Road & Thomas Ave & Conestoga Rd 02/25/2019 Intersection Summary Area Type: Other Cycle Length: 75 Actuated Cycle Length: 75 Offset: 0 (0%), Referenced to phase 2:SBTL and 6:NBTL, Start of Yellow Natural Cycle: 70 Control Type: Actuated-Coordinated Maximum v/c Ratio: 0.84 Intersection Signal Delay: 18.7 Intersection LOS: B Intersection Capacity Utilization 69.9% ICU Level of Service C Analysis Period (min) 15 # 95th percentile volume exceeds capacity, queue may be longer. Queue shown is maximum after two cycles. m Volume for 95th percentile queue is metered by upstream signal. Splits and Phases: 4: Glenbrook Ave & County Line Road & Thomas Ave & Conestoga Rd PM Peak w/ Improvements Synchro 10 Report Page 5
266 Lanes, Volumes, Timings PM Peak w/ Improvements 4: Glenbrook Ave & County Line Road & Thomas Ave & Conestoga Rd 02/25/2019 Lane Group SER2 NEL2 NEL NER NER2 Lane Configurations Traffic Volume (vph) Future Volume (vph) Ideal Flow (vphpl) Lane Width (ft) Grade (%) -1% Storage Length (ft) 0 0 Storage Lanes 1 0 Taper Length (ft) 25 Right Turn on Red No No Link Speed (mph) 25 Link Distance (ft) 393 Travel Time (s) 10.7 Lane Group Flow (vph) Turn Type Perm Perm Protected Phases Permitted Phases 4 4 Detector Phase 4 4 Switch Phase Minimum Initial (s) Minimum Split (s) Total Split (s) Total Split (%) 16.0% 16.0% Yellow Time (s) All-Red Time (s) Lost Time Adjust (s) -5.0 Total Lost Time (s) 3.0 Lead/Lag Lead-Lag Optimize? Recall Mode None None Act Effct Green (s) 9.0 Actuated g/c Ratio 0.12 v/c Ratio 0.65 Control Delay 49.1 Queue Delay 0.0 Total Delay 49.1 LOS D Approach Delay 49.1 Approach LOS D Queue Length 50th (ft) 57 Queue Length 95th (ft) #130 Internal Link Dist (ft) 313 Turn Bay Length (ft) Base Capacity (vph) 194 Starvation Cap Reductn 0 Spillback Cap Reductn 0 Storage Cap Reductn 0 Reduced v/c Ratio 0.65 PM Peak w/ Improvements Synchro 10 Report Page 6
267 HCM Signalized Intersection Capacity Analysis PM Peak w/ Improvements 4: Glenbrook Ave & County Line Road & Thomas Ave & Conestoga Rd 02/25/2019 Movement WBL2 WBL WBR WBR2 NBL NBT NBR SBL SBT SBR SBR2 SER Lane Configurations Traffic Volume (vph) Future Volume (vph) Ideal Flow (vphpl) Lane Width Grade (%) 2% -1% 2% Total Lost time (s) Lane Util. Factor * Frt Flt Protected Satd. Flow (prot) Flt Permitted Satd. Flow (perm) Peak-hour factor, PHF Adj. Flow (vph) RTOR Reduction (vph) Lane Group Flow (vph) Heavy Vehicles (%) 9% 0% 0% 25% 0% 2% 4% 0% 0% 5% 0% 1% Turn Type Perm Perm pm+pt NA Perm NA Perm Protected Phases Permitted Phases Actuated Green, G (s) Effective Green, g (s) Actuated g/c Ratio Clearance Time (s) Vehicle Extension (s) Lane Grp Cap (vph) v/s Ratio Prot v/s Ratio Perm 0.07 c c0.27 v/c Ratio Uniform Delay, d Progression Factor Incremental Delay, d Delay (s) Level of Service D A A B B D Approach Delay (s) Approach LOS D A B Intersection Summary HCM 2000 Control Delay 17.0 HCM 2000 Level of Service B HCM 2000 Volume to Capacity ratio 0.72 Actuated Cycle Length (s) 75.0 Sum of lost time (s) 13.0 Intersection Capacity Utilization 69.9% ICU Level of Service C Analysis Period (min) 15 c Critical Lane Group PM Peak w/ Improvements Synchro 10 Report Page 8
268 HCM Signalized Intersection Capacity Analysis PM Peak w/ Improvements 4: Glenbrook Ave & County Line Road & Thomas Ave & Conestoga Rd 02/25/2019 Movement SER2 NEL2 NEL NER NER2 Lane Configurations Traffic Volume (vph) Future Volume (vph) Ideal Flow (vphpl) Lane Width Grade (%) -1% Total Lost time (s) 3.0 Lane Util. Factor 1.00 Frt 0.92 Flt Protected 0.98 Satd. Flow (prot) 1621 Flt Permitted 0.98 Satd. Flow (perm) 1621 Peak-hour factor, PHF Adj. Flow (vph) RTOR Reduction (vph) Lane Group Flow (vph) Heavy Vehicles (%) 0% 0% 0% 0% 2% Turn Type Perm Perm Protected Phases Permitted Phases 4 4 Actuated Green, G (s) 3.2 Effective Green, g (s) 8.2 Actuated g/c Ratio 0.11 Clearance Time (s) 8.0 Vehicle Extension (s) 3.0 Lane Grp Cap (vph) 177 v/s Ratio Prot v/s Ratio Perm c0.08 v/c Ratio 0.71 Uniform Delay, d Progression Factor 1.00 Incremental Delay, d Delay (s) 44.9 Level of Service D Approach Delay (s) 44.9 Approach LOS D Intersection Summary PM Peak w/ Improvements Synchro 10 Report Page 9
269 Lanes, Volumes, Timings PM Peak w/ Improvements 5: County Line Road & S Warner Ave 02/26/2019 Lane Group NBT NBR SBL SBT SWL SWR Lane Configurations Traffic Volume (vph) Future Volume (vph) Ideal Flow (vphpl) Lane Width (ft) Link Speed (mph) Link Distance (ft) Travel Time (s) Lane Group Flow (vph) Sign Control Free Free Stop Intersection Summary Area Type: Other Control Type: Unsignalized Intersection Capacity Utilization 46.3% Analysis Period (min) 15 ICU Level of Service A PM Peak w/ Improvements Synchro 10 Report Page 3
270 HCM 6th TWSC PM Peak w/ Improvements 5: County Line Road & S Warner Ave 03/15/2019 Intersection Int Delay, s/veh 0.2 Movement NBT NBR SBL SBT SWL SWR Lane Configurations Traffic Vol, veh/h Future Vol, veh/h Conflicting Peds, #/hr Sign Control Free Free Free Free Stop Stop RT Channelized - None - None - None Storage Length Veh in Median Storage, # Grade, % Peak Hour Factor Heavy Vehicles, % Mvmt Flow Major/Minor Major1 Major2 Minor1 Conflicting Flow All Stage Stage Critical Hdwy Critical Hdwy Stg Critical Hdwy Stg Follow-up Hdwy Pot Cap-1 Maneuver Stage Stage Platoon blocked, % Mov Cap-1 Maneuver Mov Cap-2 Maneuver Stage Stage Approach NB SB SW HCM Control Delay, s HCM LOS A Minor Lane/Major Mvmt NBT NBR SBL SBTSWLn1 Capacity (veh/h) HCM Lane V/C Ratio HCM Control Delay (s) HCM Lane LOS - - A A A HCM 95th %tile Q(veh) PM Peak w/ Improvements Synchro 10 Report Page 1
271 Lanes, Volumes, Timings PM Peak w/ Improvements 6: County Line Road & Old Lancaster Rd 02/26/2019 Lane Group WBL WBR NBT NBR SBL SBT Lane Configurations Traffic Volume (vph) Future Volume (vph) Ideal Flow (vphpl) Lane Width (ft) Link Speed (mph) Link Distance (ft) Travel Time (s) Lane Group Flow (vph) Sign Control Stop Free Free Intersection Summary Area Type: Other Control Type: Unsignalized Intersection Capacity Utilization 59.7% Analysis Period (min) 15 ICU Level of Service B PM Peak w/ Improvements Synchro 10 Report Page 4
272 HCM 6th TWSC PM Peak w/ Improvements 6: County Line Road & Old Lancaster Rd 02/26/2019 Intersection Int Delay, s/veh 3.9 Movement WBL WBR NBT NBR SBL SBT Lane Configurations Traffic Vol, veh/h Future Vol, veh/h Conflicting Peds, #/hr Sign Control Stop Stop Free Free Free Free RT Channelized - Stop - None - None Storage Length Veh in Median Storage, # Grade, % Peak Hour Factor Heavy Vehicles, % Mvmt Flow Major/Minor Minor1 Major1 Major2 Conflicting Flow All Stage Stage Critical Hdwy Critical Hdwy Stg Critical Hdwy Stg Follow-up Hdwy Pot Cap-1 Maneuver Stage Stage Platoon blocked, % Mov Cap-1 Maneuver Mov Cap-2 Maneuver Stage Stage Approach WB NB SB HCM Control Delay, s HCM LOS D Minor Lane/Major Mvmt NBT NBRWBLn1 SBL SBT Capacity (veh/h) HCM Lane V/C Ratio HCM Control Delay (s) HCM Lane LOS - - D A - HCM 95th %tile Q(veh) PM Peak w/ Improvements Synchro 10 Report Page 5
273 Lanes, Volumes, Timings PM Peak w/ Improvements 7: County Line Road & Mondella Ave 02/26/2019 Lane Group WBL WBR NBT NBR SBL SBT Lane Configurations Traffic Volume (vph) Future Volume (vph) Ideal Flow (vphpl) Lane Width (ft) Link Speed (mph) Link Distance (ft) Travel Time (s) Lane Group Flow (vph) Sign Control Stop Free Free Intersection Summary Area Type: Other Control Type: Unsignalized Intersection Capacity Utilization 72.4% Analysis Period (min) 15 ICU Level of Service C PM Peak w/ Improvements Synchro 10 Report Page 6
274 HCM 6th TWSC PM Peak w/ Improvements 7: County Line Road & Mondella Ave 02/26/2019 Intersection Int Delay, s/veh 0.4 Movement WBL WBR NBT NBR SBL SBT Lane Configurations Traffic Vol, veh/h Future Vol, veh/h Conflicting Peds, #/hr Sign Control Stop Stop Free Free Free Free RT Channelized - None - None - None Storage Length Veh in Median Storage, # Grade, % Peak Hour Factor Heavy Vehicles, % Mvmt Flow Major/Minor Minor1 Major1 Major2 Conflicting Flow All Stage Stage Critical Hdwy Critical Hdwy Stg Critical Hdwy Stg Follow-up Hdwy Pot Cap-1 Maneuver Stage Stage Platoon blocked, % Mov Cap-1 Maneuver Mov Cap-2 Maneuver Stage Stage Approach WB NB SB HCM Control Delay, s HCM LOS C Minor Lane/Major Mvmt NBT NBRWBLn1 SBL SBT Capacity (veh/h) HCM Lane V/C Ratio HCM Control Delay (s) HCM Lane LOS - - C A A HCM 95th %tile Q(veh) PM Peak w/ Improvements Synchro 10 Report Page 7
275 Lanes, Volumes, Timings PM Peak w/ Improvements 8: County Line Road & Lindsay Ave 02/25/2019 Lane Group WBL WBR NBT NBR SBL SBT Lane Configurations Traffic Volume (vph) Future Volume (vph) Ideal Flow (vphpl) Lane Width (ft) Storage Length (ft) Storage Lanes Taper Length (ft) Right Turn on Red Yes Yes Link Speed (mph) Link Distance (ft) Travel Time (s) Lane Group Flow (vph) Turn Type Prot NA Perm NA Protected Phases Permitted Phases 2 Detector Phase Switch Phase Minimum Initial (s) Minimum Split (s) Total Split (s) Total Split (%) 33.3% 66.7% 66.7% 66.7% Yellow Time (s) All-Red Time (s) Lost Time Adjust (s) Total Lost Time (s) Lead/Lag Lead-Lag Optimize? Recall Mode None C-Max C-Max C-Max Act Effct Green (s) Actuated g/c Ratio v/c Ratio Control Delay Queue Delay Total Delay LOS B A A B Approach Delay Approach LOS B A B Queue Length 50th (ft) Queue Length 95th (ft) #599 Internal Link Dist (ft) Turn Bay Length (ft) 50 Base Capacity (vph) Starvation Cap Reductn Spillback Cap Reductn Storage Cap Reductn Reduced v/c Ratio Intersection Summary PM Peak w/ Improvements Synchro 10 Report Page 10
276 Lanes, Volumes, Timings PM Peak w/ Improvements 8: County Line Road & Lindsay Ave 02/25/2019 Area Type: Other Cycle Length: 60 Actuated Cycle Length: 60 Offset: 0 (0%), Referenced to phase 2:SBTL and 6:NBT, Start of Green Natural Cycle: 60 Control Type: Actuated-Coordinated Maximum v/c Ratio: 0.71 Intersection Signal Delay: 9.6 Intersection LOS: A Intersection Capacity Utilization 68.9% ICU Level of Service C Analysis Period (min) 15 # 95th percentile volume exceeds capacity, queue may be longer. Queue shown is maximum after two cycles. Splits and Phases: 8: County Line Road & Lindsay Ave PM Peak w/ Improvements Synchro 10 Report Page 11
277 HCM Signalized Intersection Capacity Analysis PM Peak w/ Improvements 8: County Line Road & Lindsay Ave 02/25/2019 Movement WBL WBR NBT NBR SBL SBT Lane Configurations Traffic Volume (vph) Future Volume (vph) Ideal Flow (vphpl) Lane Width Total Lost time (s) Lane Util. Factor Frt Flt Protected Satd. Flow (prot) Flt Permitted Satd. Flow (perm) Peak-hour factor, PHF Adj. Flow (vph) RTOR Reduction (vph) Lane Group Flow (vph) Heavy Vehicles (%) 0% 0% 2% 0% 0% 1% Turn Type Prot NA Perm NA Protected Phases Permitted Phases 2 Actuated Green, G (s) Effective Green, g (s) Actuated g/c Ratio Clearance Time (s) Vehicle Extension (s) Lane Grp Cap (vph) v/s Ratio Prot c c0.67 v/s Ratio Perm 0.00 v/c Ratio Uniform Delay, d Progression Factor Incremental Delay, d Delay (s) Level of Service C A A A Approach Delay (s) Approach LOS C A A Intersection Summary HCM 2000 Control Delay 7.6 HCM 2000 Level of Service A HCM 2000 Volume to Capacity ratio 0.74 Actuated Cycle Length (s) 60.0 Sum of lost time (s) 5.0 Intersection Capacity Utilization 68.9% ICU Level of Service C Analysis Period (min) 15 c Critical Lane Group PM Peak w/ Improvements Synchro 10 Report Page 12
278 Lanes, Volumes, Timings PM Peak w/ Improvements 9: County Line Road & Railroad Ave & Bryn Mawr Ave 02/25/2019 Lane Group EBL EBT EBR EBR2 WBL2 WBL WBT WBR NBL NBT NBR NBR2 Lane Configurations Traffic Volume (vph) Future Volume (vph) Ideal Flow (vphpl) Lane Width (ft) Storage Length (ft) Storage Lanes Taper Length (ft) Right Turn on Red Yes Yes Yes Link Speed (mph) Link Distance (ft) Travel Time (s) Lane Group Flow (vph) Turn Type pm+pt NA pm+pt pm+pt NA Perm pm+pt NA Protected Phases Permitted Phases Detector Phase Switch Phase Minimum Initial (s) Minimum Split (s) Total Split (s) Total Split (%) 11.7% 39.2% 11.7% 11.7% 39.2% 39.2% 10.0% 39.2% Yellow Time (s) All-Red Time (s) Lost Time Adjust (s) Total Lost Time (s) Lead/Lag Lead Lag Lead Lead Lag Lag Lead Lag Lead-Lag Optimize? Recall Mode None None None None None None None C-Max Act Effct Green (s) Actuated g/c Ratio v/c Ratio Control Delay Queue Delay Total Delay LOS C D D D A C C Approach Delay Approach LOS D D C Queue Length 50th (ft) Queue Length 95th (ft) # m82 m195 Internal Link Dist (ft) Turn Bay Length (ft) Base Capacity (vph) Starvation Cap Reductn Spillback Cap Reductn Storage Cap Reductn Reduced v/c Ratio Intersection Summary PM Peak w/ Improvements Synchro 10 Report Page 13
279 Lanes, Volumes, Timings PM Peak w/ Improvements 9: County Line Road & Railroad Ave & Bryn Mawr Ave 02/25/2019 Lane Group SBL2 SBL SBT SBR Lane Configurations Traffic Volume (vph) Future Volume (vph) Ideal Flow (vphpl) Lane Width (ft) Storage Length (ft) Storage Lanes 1 0 Taper Length (ft) 25 Right Turn on Red Yes Link Speed (mph) 25 Link Distance (ft) 198 Travel Time (s) 5.4 Lane Group Flow (vph) Turn Type pm+pt pm+pt NA Protected Phases Permitted Phases Detector Phase Switch Phase Minimum Initial (s) Minimum Split (s) Total Split (s) Total Split (%) 10.0% 10.0% 39.2% Yellow Time (s) All-Red Time (s) Lost Time Adjust (s) Total Lost Time (s) Lead/Lag Lead Lead Lag Lead-Lag Optimize? Recall Mode None None C-Max Act Effct Green (s) Actuated g/c Ratio v/c Ratio Control Delay Queue Delay Total Delay LOS A C Approach Delay 21.8 Approach LOS C Queue Length 50th (ft) 2 0 Queue Length 95th (ft) m8 1 Internal Link Dist (ft) 118 Turn Bay Length (ft) 198 Base Capacity (vph) Starvation Cap Reductn Spillback Cap Reductn Storage Cap Reductn 0 0 Reduced v/c Ratio Intersection Summary PM Peak w/ Improvements Synchro 10 Report Page 14
280 Lanes, Volumes, Timings PM Peak w/ Improvements 9: County Line Road & Railroad Ave & Bryn Mawr Ave 02/25/2019 Area Type: Other Cycle Length: 120 Actuated Cycle Length: 120 Offset: 41 (34%), Referenced to phase 2:SBTL and 6:NBTL, Start of Yellow Natural Cycle: 75 Control Type: Actuated-Coordinated Maximum v/c Ratio: 0.83 Intersection Signal Delay: 29.2 Intersection LOS: C Intersection Capacity Utilization 86.3% ICU Level of Service E Analysis Period (min) 15 # 95th percentile volume exceeds capacity, queue may be longer. Queue shown is maximum after two cycles. m Volume for 95th percentile queue is metered by upstream signal. Splits and Phases: 9: County Line Road & Railroad Ave & Bryn Mawr Ave PM Peak w/ Improvements Synchro 10 Report Page 15
281 HCM Signalized Intersection Capacity Analysis PM Peak w/ Improvements 9: County Line Road & Railroad Ave & Bryn Mawr Ave 02/25/2019 Movement EBL EBT EBR EBR2 WBL2 WBL WBT WBR NBL NBT NBR NBR2 Lane Configurations Traffic Volume (vph) Future Volume (vph) Ideal Flow (vphpl) Lane Width Total Lost time (s) Lane Util. Factor Frt Flt Protected Satd. Flow (prot) Flt Permitted Satd. Flow (perm) Peak-hour factor, PHF Adj. Flow (vph) RTOR Reduction (vph) Lane Group Flow (vph) Heavy Vehicles (%) 1% 0% 2% 2% 0% 0% 0% 1% 4% 1% 1% 0% Turn Type pm+pt NA pm+pt pm+pt NA Perm pm+pt NA Protected Phases Permitted Phases Actuated Green, G (s) Effective Green, g (s) Actuated g/c Ratio Clearance Time (s) Vehicle Extension (s) Lane Grp Cap (vph) v/s Ratio Prot 0.03 c0.25 c c v/s Ratio Perm v/c Ratio Uniform Delay, d Progression Factor Incremental Delay, d Delay (s) Level of Service C D D D C C C Approach Delay (s) Approach LOS D D C Intersection Summary HCM 2000 Control Delay 24.1 HCM 2000 Level of Service C HCM 2000 Volume to Capacity ratio 0.81 Actuated Cycle Length (s) Sum of lost time (s) 17.0 Intersection Capacity Utilization 86.3% ICU Level of Service E Analysis Period (min) 15 c Critical Lane Group PM Peak w/ Improvements Synchro 10 Report Page 16
282 HCM Signalized Intersection Capacity Analysis PM Peak w/ Improvements 9: County Line Road & Railroad Ave & Bryn Mawr Ave 02/25/2019 Movement SBL2 SBL SBT SBR Lane Configurations Traffic Volume (vph) Future Volume (vph) Ideal Flow (vphpl) Lane Width Total Lost time (s) Lane Util. Factor Frt Flt Protected Satd. Flow (prot) Flt Permitted Satd. Flow (perm) Peak-hour factor, PHF Adj. Flow (vph) RTOR Reduction (vph) Lane Group Flow (vph) Heavy Vehicles (%) 3% 0% 1% 4% Turn Type pm+pt pm+pt NA Protected Phases Permitted Phases Actuated Green, G (s) Effective Green, g (s) Actuated g/c Ratio Clearance Time (s) Vehicle Extension (s) Lane Grp Cap (vph) v/s Ratio Prot 0.01 c0.32 v/s Ratio Perm 0.07 v/c Ratio Uniform Delay, d Progression Factor Incremental Delay, d Delay (s) Level of Service A A Approach Delay (s) 7.9 Approach LOS A Intersection Summary PM Peak w/ Improvements Synchro 10 Report Page 17
283 Lanes, Volumes, Timings PM Peak w/ Improvements 10: County Line Road & Landover Rd/County Line Rd 02/26/2019 Lane Group EBL EBT EBR WBL WBT WBR NBL NBT NBR SBL SBT SBR Lane Configurations Traffic Volume (vph) Future Volume (vph) Ideal Flow (vphpl) Lane Width (ft) Storage Length (ft) Storage Lanes Taper Length (ft) Right Turn on Red Yes Yes Yes Yes Link Speed (mph) Link Distance (ft) Travel Time (s) Lane Group Flow (vph) Turn Type Perm NA Perm NA Perm NA Perm NA Protected Phases Permitted Phases Detector Phase Switch Phase Minimum Initial (s) Minimum Split (s) Total Split (s) Total Split (%) 33.3% 33.3% 33.3% 33.3% 66.7% 66.7% 66.7% 66.7% Yellow Time (s) All-Red Time (s) Lost Time Adjust (s) Total Lost Time (s) Lead/Lag Lead-Lag Optimize? Recall Mode None None None None C-Max C-Max C-Max C-Max Act Effct Green (s) Actuated g/c Ratio v/c Ratio Control Delay Queue Delay Total Delay LOS D E D B A F Approach Delay Approach LOS D E B F Queue Length 50th (ft) ~1331 Queue Length 95th (ft) 205 #426 # m5 #1606 Internal Link Dist (ft) Turn Bay Length (ft) Base Capacity (vph) Starvation Cap Reductn Spillback Cap Reductn Storage Cap Reductn Reduced v/c Ratio Intersection Summary PM Peak w/ Improvements Synchro 10 Report Page 4
284 Lanes, Volumes, Timings PM Peak w/ Improvements 10: County Line Road & Landover Rd/County Line Rd 02/26/2019 Area Type: Other Cycle Length: 120 Actuated Cycle Length: 120 Offset: 74 (62%), Referenced to phase 2:NBTL and 6:SBTL, Start of Yellow Natural Cycle: 150 Control Type: Actuated-Coordinated Maximum v/c Ratio: 1.24 Intersection Signal Delay: 83.5 Intersection LOS: F Intersection Capacity Utilization 100.8% ICU Level of Service G Analysis Period (min) 15 ~ Volume exceeds capacity, queue is theoretically infinite. Queue shown is maximum after two cycles. # 95th percentile volume exceeds capacity, queue may be longer. Queue shown is maximum after two cycles. m Volume for 95th percentile queue is metered by upstream signal. Splits and Phases: 10: County Line Road & Landover Rd/County Line Rd PM Peak w/ Improvements Synchro 10 Report Page 5
285 HCM 6th Signalized Intersection Summary PM Peak w/ Improvements 10: County Line Road & Landover Rd/County Line Rd 02/26/2019 Movement EBL EBT EBR WBL WBT WBR NBL NBT NBR SBL SBT SBR Lane Configurations Traffic Volume (veh/h) Future Volume (veh/h) Initial Q (Qb), veh Ped-Bike Adj(A_pbT) Parking Bus, Adj Work Zone On Approach No No No No Adj Sat Flow, veh/h/ln Adj Flow Rate, veh/h Peak Hour Factor Percent Heavy Veh, % Cap, veh/h Arrive On Green Sat Flow, veh/h Grp Volume(v), veh/h Grp Sat Flow(s),veh/h/ln Q Serve(g_s), s Cycle Q Clear(g_c), s Prop In Lane Lane Grp Cap(c), veh/h V/C Ratio(X) Avail Cap(c_a), veh/h HCM Platoon Ratio Upstream Filter(I) Uniform Delay (d), s/veh Incr Delay (d2), s/veh Initial Q Delay(d3),s/veh %ile BackOfQ(95%),veh/ln Unsig. Movement Delay, s/veh LnGrp Delay(d),s/veh LnGrp LOS D A A D A A F A B A A F Approach Vol, veh/h Approach Delay, s/veh Approach LOS D D B F Timer - Assigned Phs Phs Duration (G+Y+Rc), s Change Period (Y+Rc), s Max Green Setting (Gmax), s Max Q Clear Time (g_c+i1), s Green Ext Time (p_c), s Intersection Summary HCM 6th Ctrl Delay 56.8 HCM 6th LOS E PM Peak w/ Improvements Synchro 10 Report Page 6
286 Lanes, Volumes, Timings PM Peak w/ Improvements 11: County Line Road & Glenbrook Ave 02/25/2019 Lane Group EBL EBR NBL NBT SBT SBR Ø3 Ø4 Ø5 Ø7 Ø8 Lane Configurations Traffic Volume (vph) Future Volume (vph) Ideal Flow (vphpl) Lane Width (ft) Right Turn on Red Yes Yes Link Speed (mph) Link Distance (ft) Travel Time (s) Lane Group Flow (vph) Turn Type pm+pt NA NA Protected Phases Permitted Phases Detector Phase Switch Phase Minimum Initial (s) Minimum Split (s) Total Split (s) Total Split (%) 10.0% 39.2% 39.2% 12% 39% 10% 12% 39% Yellow Time (s) All-Red Time (s) Lost Time Adjust (s) Total Lost Time (s) Lead/Lag Lead Lag Lag Lead Lag Lead Lead Lag Lead-Lag Optimize? Recall Mode None C-Max C-Max None None None None None Act Effct Green (s) Actuated g/c Ratio v/c Ratio Control Delay Queue Delay Total Delay LOS A E Approach Delay Approach LOS A E Queue Length 50th (ft) Queue Length 95th (ft) 1 #542 Internal Link Dist (ft) Turn Bay Length (ft) Base Capacity (vph) Starvation Cap Reductn Spillback Cap Reductn Storage Cap Reductn 0 0 Reduced v/c Ratio Intersection Summary Area Type: Other Cycle Length: 120 Actuated Cycle Length: 120 PM Peak w/ Improvements Synchro 10 Report Page 18
287 Lanes, Volumes, Timings PM Peak w/ Improvements 11: County Line Road & Glenbrook Ave 02/25/2019 Offset: 41 (34%), Referenced to phase 2:SBTL and 6:NBTL, Start of Yellow Natural Cycle: 75 Control Type: Actuated-Coordinated Maximum v/c Ratio: 0.83 Intersection Signal Delay: 44.5 Intersection LOS: D Intersection Capacity Utilization 43.2% ICU Level of Service A Analysis Period (min) 15 # 95th percentile volume exceeds capacity, queue may be longer. Queue shown is maximum after two cycles. Splits and Phases: 11: County Line Road & Glenbrook Ave PM Peak w/ Improvements Synchro 10 Report Page 19
288 HCM Signalized Intersection Capacity Analysis PM Peak w/ Improvements 11: County Line Road & Glenbrook Ave 02/25/2019 Movement EBL EBR NBL NBT SBT SBR Lane Configurations Traffic Volume (vph) Future Volume (vph) Ideal Flow (vphpl) Lane Width Total Lost time (s) Lane Util. Factor Frt Flt Protected Satd. Flow (prot) Flt Permitted Satd. Flow (perm) Peak-hour factor, PHF Adj. Flow (vph) RTOR Reduction (vph) Lane Group Flow (vph) Heavy Vehicles (%) 0% 0% 1% 2% 1% 2% Turn Type pm+pt NA NA Protected Phases Permitted Phases Actuated Green, G (s) Effective Green, g (s) Actuated g/c Ratio Clearance Time (s) Vehicle Extension (s) Lane Grp Cap (vph) v/s Ratio Prot c0.11 c0.34 v/s Ratio Perm c0.13 v/c Ratio Uniform Delay, d Progression Factor Incremental Delay, d Delay (s) Level of Service A C Approach Delay (s) Approach LOS A A C Intersection Summary HCM 2000 Control Delay 20.9 HCM 2000 Level of Service C HCM 2000 Volume to Capacity ratio 0.57 Actuated Cycle Length (s) Sum of lost time (s) 20.5 Intersection Capacity Utilization 43.2% ICU Level of Service A Analysis Period (min) 15 c Critical Lane Group PM Peak w/ Improvements Synchro 10 Report Page 20
289 Lanes, Volumes, Timings SAT Peak w/ Improvements 1: County Line Rd & Lancaster Ave 02/25/2019 Lane Group EBL EBT EBR WBL WBT WBR NBL NBT NBR SBL SBT SBR Lane Configurations Traffic Volume (vph) Future Volume (vph) Ideal Flow (vphpl) Lane Width (ft) Grade (%) 4% -4% 2% 3% Right Turn on Red Yes Yes Yes Yes Link Speed (mph) Link Distance (ft) Travel Time (s) Lane Group Flow (vph) Turn Type Perm NA Perm NA Split NA Split NA Protected Phases Permitted Phases 2 6 Detector Phase Switch Phase Minimum Initial (s) Minimum Split (s) Total Split (s) Total Split (%) 52.5% 52.5% 52.5% 52.5% 21.3% 21.3% 26.3% 26.3% Maximum Green (s) Yellow Time (s) All-Red Time (s) Lost Time Adjust (s) Total Lost Time (s) Lead/Lag Lead-Lag Optimize? Vehicle Extension (s) Recall Mode C-Max C-Max None None None None None None Act Effct Green (s) Actuated g/c Ratio v/c Ratio Control Delay Queue Delay Total Delay LOS A B C C C Approach Delay Approach LOS A B C C Queue Length 50th (ft) Queue Length 95th (ft) Internal Link Dist (ft) Turn Bay Length (ft) Base Capacity (vph) Starvation Cap Reductn Spillback Cap Reductn Storage Cap Reductn Reduced v/c Ratio Intersection Summary SAT Peak w/ Improvements 06/06/2018 Baseline Synchro 10 Report Page 1
290 Lanes, Volumes, Timings SAT Peak w/ Improvements 1: County Line Rd & Lancaster Ave 02/25/2019 Area Type: Other Cycle Length: 80 Actuated Cycle Length: 80 Offset: 0 (0%), Referenced to phase 2:EBTL, Start of Green Natural Cycle: 60 Control Type: Actuated-Coordinated Maximum v/c Ratio: 0.62 Intersection Signal Delay: 15.7 Intersection Capacity Utilization 72.0% Analysis Period (min) 15 Intersection LOS: B ICU Level of Service C Splits and Phases: 1: County Line Rd & Lancaster Ave SAT Peak w/ Improvements 06/06/2018 Baseline Synchro 10 Report Page 2
291 HCM Signalized Intersection Capacity Analysis SAT Peak w/ Improvements 1: County Line Rd & Lancaster Ave 02/25/2019 Movement EBL EBT EBR WBL WBT WBR NBL NBT NBR SBL SBT SBR Lane Configurations Traffic Volume (vph) Future Volume (vph) Ideal Flow (vphpl) Lane Width Grade (%) 4% -4% 2% 3% Total Lost time (s) Lane Util. Factor Frt Flt Protected Satd. Flow (prot) Flt Permitted Satd. Flow (perm) Peak-hour factor, PHF Adj. Flow (vph) RTOR Reduction (vph) Lane Group Flow (vph) Heavy Vehicles (%) 2% 0% 0% 0% 0% 0% 5% 1% 1% 0% 1% 0% Turn Type Perm NA Perm NA Split NA Split NA Protected Phases Permitted Phases 2 6 Actuated Green, G (s) Effective Green, g (s) Actuated g/c Ratio Clearance Time (s) Vehicle Extension (s) Lane Grp Cap (vph) v/s Ratio Prot 0.16 c0.17 c0.02 v/s Ratio Perm c v/c Ratio Uniform Delay, d Progression Factor Incremental Delay, d Delay (s) Level of Service B B C C C Approach Delay (s) Approach LOS B B C C Intersection Summary HCM 2000 Control Delay 16.0 HCM 2000 Level of Service B HCM 2000 Volume to Capacity ratio 0.55 Actuated Cycle Length (s) 80.0 Sum of lost time (s) 10.0 Intersection Capacity Utilization 72.0% ICU Level of Service C Analysis Period (min) 15 c Critical Lane Group SAT Peak w/ Improvements 06/06/2018 Baseline Synchro 10 Report Page 3
292 Lanes, Volumes, Timings SAT Peak w/ Improvements 2: County Line Rd & Montrose Ave 02/25/2019 Lane Group EBL EBT EBR WBL WBT WBR NBL NBT NBR SBL SBT SBR Lane Configurations Traffic Volume (vph) Future Volume (vph) Ideal Flow (vphpl) Lane Width (ft) Storage Length (ft) Storage Lanes Taper Length (ft) Right Turn on Red Yes Yes Yes Yes Link Speed (mph) Link Distance (ft) Travel Time (s) Lane Group Flow (vph) Turn Type Perm NA Perm NA Perm NA Perm NA Protected Phases Permitted Phases Detector Phase Switch Phase Minimum Initial (s) Minimum Split (s) Total Split (s) Total Split (%) 36.3% 36.3% 36.3% 36.3% 63.8% 63.8% 63.8% 63.8% Maximum Green (s) Yellow Time (s) All-Red Time (s) Lost Time Adjust (s) Total Lost Time (s) Lead/Lag Lead-Lag Optimize? Vehicle Extension (s) Recall Mode None None None None C-Max C-Max C-Max C-Max Walk Time (s) Flash Dont Walk (s) Pedestrian Calls (#/hr) Act Effct Green (s) Actuated g/c Ratio v/c Ratio Control Delay Queue Delay Total Delay LOS C C A A A A Approach Delay Approach LOS C C A A Queue Length 50th (ft) Queue Length 95th (ft) m1 128 m0 16 Internal Link Dist (ft) Turn Bay Length (ft) Base Capacity (vph) Starvation Cap Reductn SAT Peak w/ Improvements 06/06/2018 Baseline Synchro 10 Report Page 1
293 Lanes, Volumes, Timings SAT Peak w/ Improvements 2: County Line Rd & Montrose Ave 02/25/2019 Lane Group EBL EBT EBR WBL WBT WBR NBL NBT NBR SBL SBT SBR Spillback Cap Reductn Storage Cap Reductn Reduced v/c Ratio Intersection Summary Area Type: Other Cycle Length: 80 Actuated Cycle Length: 80 Offset: 0 (0%), Referenced to phase 2:NBTL and 6:SBTL, Start of Yellow Natural Cycle: 55 Control Type: Actuated-Coordinated Maximum v/c Ratio: 0.45 Intersection Signal Delay: 7.7 Intersection LOS: A Intersection Capacity Utilization 43.4% ICU Level of Service A Analysis Period (min) 15 m Volume for 95th percentile queue is metered by upstream signal. Splits and Phases: 2: County Line Rd & Montrose Ave SAT Peak w/ Improvements 06/06/2018 Baseline Synchro 10 Report Page 2
294 HCM 6th Signalized Intersection Summary SAT Peak w/ Improvements 2: County Line Rd & Montrose Ave 02/25/2019 Movement EBL EBT EBR WBL WBT WBR NBL NBT NBR SBL SBT SBR Lane Configurations Traffic Volume (veh/h) Future Volume (veh/h) Initial Q (Qb), veh Ped-Bike Adj(A_pbT) Parking Bus, Adj Work Zone On Approach No No No No Adj Sat Flow, veh/h/ln Adj Flow Rate, veh/h Peak Hour Factor Percent Heavy Veh, % Cap, veh/h Arrive On Green Sat Flow, veh/h Grp Volume(v), veh/h Grp Sat Flow(s),veh/h/ln Q Serve(g_s), s Cycle Q Clear(g_c), s Prop In Lane Lane Grp Cap(c), veh/h V/C Ratio(X) Avail Cap(c_a), veh/h HCM Platoon Ratio Upstream Filter(I) Uniform Delay (d), s/veh Incr Delay (d2), s/veh Initial Q Delay(d3),s/veh %ile BackOfQ(95%),veh/ln Unsig. Movement Delay, s/veh LnGrp Delay(d),s/veh LnGrp LOS D A A D A A A A A A A A Approach Vol, veh/h Approach Delay, s/veh Approach LOS D D A A Timer - Assigned Phs Phs Duration (G+Y+Rc), s Change Period (Y+Rc), s Max Green Setting (Gmax), s Max Q Clear Time (g_c+i1), s Green Ext Time (p_c), s Intersection Summary HCM 6th Ctrl Delay 6.9 HCM 6th LOS A SAT Peak w/ Improvements 06/06/2018 Baseline Synchro 10 Report Page 3
295 Lanes, Volumes, Timings SAT Peak w/ Improvements 3: County Line Rd & Roberts Rd 02/25/2019 Lane Group EBL EBT EBR WBL WBT WBR NBL NBT NBR SBL SBT SBR Lane Configurations Traffic Volume (vph) Future Volume (vph) Ideal Flow (vphpl) Lane Width (ft) Storage Length (ft) Storage Lanes Taper Length (ft) Link Speed (mph) Link Distance (ft) Travel Time (s) Lane Group Flow (vph) Sign Control Stop Stop Free Free Intersection Summary Area Type: Other Control Type: Unsignalized Intersection Capacity Utilization 49.8% Analysis Period (min) 15 ICU Level of Service A SAT Peak w/ Improvements 06/06/2018 Baseline Synchro 10 Report Page 1
296 HCM 6th TWSC SAT Peak w/ Improvements 3: County Line Rd & Roberts Rd 02/25/2019 Intersection Int Delay, s/veh 3.8 Movement EBL EBT EBR WBL WBT WBR NBL NBT NBR SBL SBT SBR Lane Configurations Traffic Vol, veh/h Future Vol, veh/h Conflicting Peds, #/hr Sign Control Stop Stop Stop Stop Stop Stop Free Free Free Free Free Free RT Channelized - - None - - None - - None - - None Storage Length Veh in Median Storage, # Grade, % Peak Hour Factor Heavy Vehicles, % Mvmt Flow Major/Minor Minor2 Minor1 Major1 Major2 Conflicting Flow All Stage Stage Critical Hdwy Critical Hdwy Stg Critical Hdwy Stg Follow-up Hdwy Pot Cap-1 Maneuver Stage Stage Platoon blocked, % Mov Cap-1 Maneuver Mov Cap-2 Maneuver Stage Stage Approach EB WB NB SB HCM Control Delay, s HCM LOS D C Minor Lane/Major Mvmt NBL NBT NBR EBLn1WBLn1 SBL SBT SBR Capacity (veh/h) HCM Lane V/C Ratio HCM Control Delay (s) HCM Lane LOS A A - D C A A - HCM 95th %tile Q(veh) SAT Peak w/ Improvements 06/06/2018 Baseline Synchro 10 Report Page 2
297 Lanes, Volumes, Timings SAT Peak w/ Improvements 4: Glenbrook Ave & County Line Rd & Thomas Ave & Conestoga Rd 02/25/2019 Lane Group WBL2 WBL WBR WBR2 NBL NBT NBR SBL SBT SBR SBR2 SER Lane Configurations Traffic Volume (vph) Future Volume (vph) Ideal Flow (vphpl) Lane Width (ft) Grade (%) 2% -1% 2% Storage Length (ft) Storage Lanes Taper Length (ft) Right Turn on Red No No No Link Speed (mph) Link Distance (ft) Travel Time (s) Lane Group Flow (vph) Turn Type Perm Perm pm+pt NA Perm NA Perm Protected Phases Permitted Phases Detector Phase Switch Phase Minimum Initial (s) Minimum Split (s) Total Split (s) Total Split (%) 21.3% 21.3% 40.0% 78.8% 38.8% 38.8% 40.0% Maximum Green (s) Yellow Time (s) All-Red Time (s) Lost Time Adjust (s) Total Lost Time (s) Lead/Lag Lead Lag Lag Lead Lead-Lag Optimize? Vehicle Extension (s) Recall Mode None None None C-Max C-Max C-Max None Act Effct Green (s) Actuated g/c Ratio v/c Ratio Control Delay Queue Delay Total Delay LOS C A A B B C Approach Delay Approach LOS C A B Queue Length 50th (ft) Queue Length 95th (ft) m Internal Link Dist (ft) Turn Bay Length (ft) 75 Base Capacity (vph) Starvation Cap Reductn Spillback Cap Reductn Storage Cap Reductn SAT Peak w/ Improvements 06/06/2018 Baseline Synchro 10 Report Page 4
298 Lanes, Volumes, Timings SAT Peak w/ Improvements 4: Glenbrook Ave & County Line Rd & Thomas Ave & Conestoga Rd 02/25/2019 Lane Group SER2 NEL2 NEL NER NER2 Lane Configurations Traffic Volume (vph) Future Volume (vph) Ideal Flow (vphpl) Lane Width (ft) Grade (%) -1% Storage Length (ft) 0 0 Storage Lanes 1 0 Taper Length (ft) 25 Right Turn on Red No No Link Speed (mph) 25 Link Distance (ft) 393 Travel Time (s) 10.7 Lane Group Flow (vph) Turn Type Perm Perm Protected Phases Permitted Phases 4 4 Detector Phase 4 4 Switch Phase Minimum Initial (s) Minimum Split (s) Total Split (s) Total Split (%) 21.3% 21.3% Maximum Green (s) Yellow Time (s) All-Red Time (s) Lost Time Adjust (s) -4.5 Total Lost Time (s) 2.5 Lead/Lag Lead-Lag Optimize? Vehicle Extension (s) Recall Mode None None Act Effct Green (s) 13.8 Actuated g/c Ratio 0.17 v/c Ratio 0.45 Control Delay 35.2 Queue Delay 0.0 Total Delay 35.2 LOS D Approach Delay 35.2 Approach LOS D Queue Length 50th (ft) 56 Queue Length 95th (ft) 108 Internal Link Dist (ft) 313 Turn Bay Length (ft) Base Capacity (vph) 293 Starvation Cap Reductn 0 Spillback Cap Reductn 0 Storage Cap Reductn 0 SAT Peak w/ Improvements 06/06/2018 Baseline Synchro 10 Report Page 5
299 Lanes, Volumes, Timings SAT Peak w/ Improvements 4: Glenbrook Ave & County Line Rd & Thomas Ave & Conestoga Rd 02/25/2019 Lane Group WBL2 WBL WBR WBR2 NBL NBT NBR SBL SBT SBR SBR2 SER Reduced v/c Ratio Intersection Summary Area Type: Other Cycle Length: 80 Actuated Cycle Length: 80 Offset: 0 (0%), Referenced to phase 2:SBTL and 6:NBTL, Start of Yellow Natural Cycle: 65 Control Type: Actuated-Coordinated Maximum v/c Ratio: 0.60 Intersection Signal Delay: 13.3 Intersection LOS: B Intersection Capacity Utilization 66.3% ICU Level of Service C Analysis Period (min) 15 m Volume for 95th percentile queue is metered by upstream signal. Splits and Phases: 4: Glenbrook Ave & County Line Rd & Thomas Ave & Conestoga Rd SAT Peak w/ Improvements 06/06/2018 Baseline Synchro 10 Report Page 6
300 Lanes, Volumes, Timings SAT Peak w/ Improvements 4: Glenbrook Ave & County Line Rd & Thomas Ave & Conestoga Rd 02/25/2019 Lane Group SER2 NEL2 NEL NER NER2 Reduced v/c Ratio 0.43 Intersection Summary SAT Peak w/ Improvements 06/06/2018 Baseline Synchro 10 Report Page 7
301 HCM Signalized Intersection Capacity Analysis SAT Peak w/ Improvements 4: Glenbrook Ave & County Line Rd & Thomas Ave & Conestoga Rd 02/25/2019 Movement WBL2 WBL WBR WBR2 NBL NBT NBR SBL SBT SBR SBR2 SER Lane Configurations Traffic Volume (vph) Future Volume (vph) Ideal Flow (vphpl) Lane Width Grade (%) 2% -1% 2% Total Lost time (s) Lane Util. Factor * Frt Flt Protected Satd. Flow (prot) Flt Permitted Satd. Flow (perm) Peak-hour factor, PHF Adj. Flow (vph) RTOR Reduction (vph) Lane Group Flow (vph) Heavy Vehicles (%) 0% 33% 0% 0% 0% 2% 0% 0% 1% 0% 0% 0% Turn Type Perm Perm pm+pt NA Perm NA Perm Protected Phases Permitted Phases Actuated Green, G (s) Effective Green, g (s) Actuated g/c Ratio Clearance Time (s) Vehicle Extension (s) Lane Grp Cap (vph) v/s Ratio Prot 0.10 c v/s Ratio Perm c0.20 v/c Ratio Uniform Delay, d Progression Factor Incremental Delay, d Delay (s) Level of Service C A A B A C Approach Delay (s) Approach LOS C A A Intersection Summary HCM 2000 Control Delay 12.1 HCM 2000 Level of Service B HCM 2000 Volume to Capacity ratio 0.57 Actuated Cycle Length (s) 80.0 Sum of lost time (s) 12.0 Intersection Capacity Utilization 66.3% ICU Level of Service C Analysis Period (min) 15 c Critical Lane Group SAT Peak w/ Improvements 06/06/2018 Baseline Synchro 10 Report Page 8
302 HCM Signalized Intersection Capacity Analysis SAT Peak w/ Improvements 4: Glenbrook Ave & County Line Rd & Thomas Ave & Conestoga Rd 02/25/2019 Movement SER2 NEL2 NEL NER NER2 Lane Configurations Traffic Volume (vph) Future Volume (vph) Ideal Flow (vphpl) Lane Width Grade (%) -1% Total Lost time (s) 2.5 Lane Util. Factor 1.00 Frt 0.92 Flt Protected 0.98 Satd. Flow (prot) 1616 Flt Permitted 0.98 Satd. Flow (perm) 1616 Peak-hour factor, PHF Adj. Flow (vph) RTOR Reduction (vph) Lane Group Flow (vph) Heavy Vehicles (%) 0% 0% 0% 0% 2% Turn Type Perm Perm Protected Phases Permitted Phases 4 4 Actuated Green, G (s) 7.9 Effective Green, g (s) 12.4 Actuated g/c Ratio 0.16 Clearance Time (s) 7.0 Vehicle Extension (s) 3.0 Lane Grp Cap (vph) 250 v/s Ratio Prot v/s Ratio Perm c0.08 v/c Ratio 0.50 Uniform Delay, d Progression Factor 1.00 Incremental Delay, d2 1.6 Delay (s) 32.6 Level of Service C Approach Delay (s) 32.6 Approach LOS C Intersection Summary SAT Peak w/ Improvements 06/06/2018 Baseline Synchro 10 Report Page 9
303 Lanes, Volumes, Timings SAT Peak w/ Improvements 5: County Line Rd & S Warner Ave 02/25/2019 Lane Group NBT NBR SBL SBT SWL SWR Lane Configurations Traffic Volume (vph) Future Volume (vph) Ideal Flow (vphpl) Lane Width (ft) Link Speed (mph) Link Distance (ft) Travel Time (s) Lane Group Flow (vph) Sign Control Free Free Stop Intersection Summary Area Type: Other Control Type: Unsignalized Intersection Capacity Utilization 31.4% Analysis Period (min) 15 ICU Level of Service A SAT Peak w/ Improvements 06/06/2018 Baseline Synchro 10 Report Page 3
304 HCM 6th TWSC SAT Peak w/ Improvements 5: County Line Rd & S Warner Ave 03/15/2019 Intersection Int Delay, s/veh 0.1 Movement NBT NBR SBL SBT SWL SWR Lane Configurations Traffic Vol, veh/h Future Vol, veh/h Conflicting Peds, #/hr Sign Control Free Free Free Free Stop Stop RT Channelized - None - None - None Storage Length Veh in Median Storage, # Grade, % Peak Hour Factor Heavy Vehicles, % Mvmt Flow Major/Minor Major1 Major2 Minor1 Conflicting Flow All Stage Stage Critical Hdwy Critical Hdwy Stg Critical Hdwy Stg Follow-up Hdwy Pot Cap-1 Maneuver Stage Stage Platoon blocked, % Mov Cap-1 Maneuver Mov Cap-2 Maneuver Stage Stage Approach NB SB SW HCM Control Delay, s HCM LOS A Minor Lane/Major Mvmt NBT NBR SBL SBTSWLn1 Capacity (veh/h) HCM Lane V/C Ratio HCM Control Delay (s) HCM Lane LOS - - B A A HCM 95th %tile Q(veh) SAT Peak w/ Improvements Synchro 10 Report Page 1
305 Lanes, Volumes, Timings SAT Peak w/ Improvements 6: County Line Rd & Old Lancaster Rd 02/25/2019 Lane Group WBL WBR NBT NBR SBL SBT Lane Configurations Traffic Volume (vph) Future Volume (vph) Ideal Flow (vphpl) Lane Width (ft) Link Speed (mph) Link Distance (ft) Travel Time (s) Lane Group Flow (vph) Sign Control Stop Free Free Intersection Summary Area Type: Other Control Type: Unsignalized Intersection Capacity Utilization 48.3% Analysis Period (min) 15 ICU Level of Service A SAT Peak w/ Improvements 06/06/2018 Baseline Synchro 10 Report Page 4
306 HCM 6th TWSC SAT Peak w/ Improvements 6: County Line Rd & Old Lancaster Rd 02/25/2019 Intersection Int Delay, s/veh 2.2 Movement WBL WBR NBT NBR SBL SBT Lane Configurations Traffic Vol, veh/h Future Vol, veh/h Conflicting Peds, #/hr Sign Control Stop Stop Free Free Free Free RT Channelized - Stop - None - None Storage Length Veh in Median Storage, # Grade, % Peak Hour Factor Heavy Vehicles, % Mvmt Flow Major/Minor Minor1 Major1 Major2 Conflicting Flow All Stage Stage Critical Hdwy Critical Hdwy Stg Critical Hdwy Stg Follow-up Hdwy Pot Cap-1 Maneuver Stage Stage Platoon blocked, % Mov Cap-1 Maneuver Mov Cap-2 Maneuver Stage Stage Approach WB NB SB HCM Control Delay, s HCM LOS C Minor Lane/Major Mvmt NBT NBRWBLn1 SBL SBT Capacity (veh/h) HCM Lane V/C Ratio HCM Control Delay (s) HCM Lane LOS - - C A - HCM 95th %tile Q(veh) SAT Peak w/ Improvements 06/06/2018 Baseline Synchro 10 Report Page 5
307 Lanes, Volumes, Timings SAT Peak w/ Improvements 7: County Line Rd & Mondella Ave 02/25/2019 Lane Group WBL WBR NBT NBR SBL SBT Lane Configurations Traffic Volume (vph) Future Volume (vph) Ideal Flow (vphpl) Lane Width (ft) Link Speed (mph) Link Distance (ft) Travel Time (s) Lane Group Flow (vph) Sign Control Stop Free Free Intersection Summary Area Type: Other Control Type: Unsignalized Intersection Capacity Utilization 47.0% Analysis Period (min) 15 ICU Level of Service A SAT Peak w/ Improvements 06/06/2018 Baseline Synchro 10 Report Page 6
308 HCM 6th TWSC SAT Peak w/ Improvements 7: County Line Rd & Mondella Ave 02/25/2019 Intersection Int Delay, s/veh 0.3 Movement WBL WBR NBT NBR SBL SBT Lane Configurations Traffic Vol, veh/h Future Vol, veh/h Conflicting Peds, #/hr Sign Control Stop Stop Free Free Free Free RT Channelized - None - None - None Storage Length Veh in Median Storage, # Grade, % Peak Hour Factor Heavy Vehicles, % Mvmt Flow Major/Minor Minor1 Major1 Major2 Conflicting Flow All Stage Stage Critical Hdwy Critical Hdwy Stg Critical Hdwy Stg Follow-up Hdwy Pot Cap-1 Maneuver Stage Stage Platoon blocked, % Mov Cap-1 Maneuver Mov Cap-2 Maneuver Stage Stage Approach WB NB SB HCM Control Delay, s HCM LOS C Minor Lane/Major Mvmt NBT NBRWBLn1 SBL SBT Capacity (veh/h) HCM Lane V/C Ratio HCM Control Delay (s) HCM Lane LOS - - C A A HCM 95th %tile Q(veh) SAT Peak w/ Improvements 06/06/2018 Baseline Synchro 10 Report Page 7
309 Lanes, Volumes, Timings SAT Peak w/ Improvements 8: County Line Rd & Lindsay Ave 02/25/2019 Lane Group WBL WBR NBT NBR SBL SBT Lane Configurations Traffic Volume (vph) Future Volume (vph) Ideal Flow (vphpl) Lane Width (ft) Storage Length (ft) Storage Lanes Taper Length (ft) Right Turn on Red Yes Yes Link Speed (mph) Link Distance (ft) Travel Time (s) Lane Group Flow (vph) Turn Type Prot NA Perm NA Protected Phases Permitted Phases 2 Detector Phase Switch Phase Minimum Initial (s) Minimum Split (s) Total Split (s) Total Split (%) 41.0% 59.0% 59.0% 59.0% Maximum Green (s) Yellow Time (s) All-Red Time (s) Lost Time Adjust (s) Total Lost Time (s) Lead/Lag Lead-Lag Optimize? Vehicle Extension (s) Recall Mode None C-Max C-Max C-Max Act Effct Green (s) Actuated g/c Ratio v/c Ratio Control Delay Queue Delay Total Delay LOS A A A Approach Delay Approach LOS A A Queue Length 50th (ft) Queue Length 95th (ft) Internal Link Dist (ft) Turn Bay Length (ft) 75 Base Capacity (vph) Starvation Cap Reductn Spillback Cap Reductn Storage Cap Reductn Reduced v/c Ratio SAT Peak w/ Improvements 06/06/2018 Baseline Synchro 10 Report Page 10
310 Lanes, Volumes, Timings SAT Peak w/ Improvements 8: County Line Rd & Lindsay Ave 02/25/2019 Intersection Summary Area Type: Other Cycle Length: 61 Actuated Cycle Length: 61 Offset: 30 (49%), Referenced to phase 2:SBTL and 6:NBT, Start of Yellow Natural Cycle: 40 Control Type: Actuated-Coordinated Maximum v/c Ratio: 0.40 Intersection Signal Delay: 0.7 Intersection LOS: A Intersection Capacity Utilization 38.8% ICU Level of Service A Analysis Period (min) 15 Splits and Phases: 8: County Line Rd & Lindsay Ave SAT Peak w/ Improvements 06/06/2018 Baseline Synchro 10 Report Page 11
311 HCM Signalized Intersection Capacity Analysis SAT Peak w/ Improvements 8: County Line Rd & Lindsay Ave 02/25/2019 Movement WBL WBR NBT NBR SBL SBT Lane Configurations Traffic Volume (vph) Future Volume (vph) Ideal Flow (vphpl) Lane Width Total Lost time (s) Lane Util. Factor Frt Flt Protected Satd. Flow (prot) Flt Permitted Satd. Flow (perm) Peak-hour factor, PHF Adj. Flow (vph) RTOR Reduction (vph) Lane Group Flow (vph) Heavy Vehicles (%) 0% 0% 1% 0% 0% 1% Turn Type Prot NA Perm NA Protected Phases Permitted Phases 2 Actuated Green, G (s) Effective Green, g (s) Actuated g/c Ratio Clearance Time (s) Vehicle Extension (s) Lane Grp Cap (vph) v/s Ratio Prot 0.39 c0.40 v/s Ratio Perm 0.00 v/c Ratio Uniform Delay, d Progression Factor Incremental Delay, d Delay (s) Level of Service A A A Approach Delay (s) Approach LOS A A A Intersection Summary HCM 2000 Control Delay 0.7 HCM 2000 Level of Service A HCM 2000 Volume to Capacity ratio 0.44 Actuated Cycle Length (s) 61.0 Sum of lost time (s) 5.0 Intersection Capacity Utilization 38.8% ICU Level of Service A Analysis Period (min) 15 c Critical Lane Group SAT Peak w/ Improvements 06/06/2018 Baseline Synchro 10 Report Page 12
312 Lanes, Volumes, Timings SAT Peak w/ Improvements 9: County Line Rd & Railroad Ave & Bryn Mawr Ave 02/25/2019 Lane Group EBL EBT EBR EBR2 WBL WBT WBR NBL NBT NBR NBR2 SBL2 Lane Configurations Traffic Volume (vph) Future Volume (vph) Ideal Flow (vphpl) Lane Width (ft) Storage Length (ft) Storage Lanes Taper Length (ft) Right Turn on Red Yes Yes Yes Link Speed (mph) Link Distance (ft) Travel Time (s) Lane Group Flow (vph) Turn Type pm+pt NA pm+pt NA Perm pm+pt NA pm+pt Protected Phases Permitted Phases Detector Phase Switch Phase Minimum Initial (s) Minimum Split (s) Total Split (s) Total Split (%) 14.4% 35.6% 14.4% 35.6% 35.6% 14.4% 35.6% 14.4% Maximum Green (s) Yellow Time (s) All-Red Time (s) Lost Time Adjust (s) Total Lost Time (s) Lead/Lag Lead Lag Lead Lag Lag Lead Lag Lead Lead-Lag Optimize? Vehicle Extension (s) Recall Mode None None None None None None C-Max None Act Effct Green (s) Actuated g/c Ratio v/c Ratio Control Delay Queue Delay Total Delay LOS B C B C A B C Approach Delay Approach LOS C C C Queue Length 50th (ft) Queue Length 95th (ft) Internal Link Dist (ft) Turn Bay Length (ft) Base Capacity (vph) Starvation Cap Reductn Spillback Cap Reductn Storage Cap Reductn Reduced v/c Ratio SAT Peak w/ Improvements 06/06/2018 Baseline Synchro 10 Report Page 13
313 Lanes, Volumes, Timings SAT Peak w/ Improvements 9: County Line Rd & Railroad Ave & Bryn Mawr Ave 02/25/2019 Lane Group SBL SBT SBR Lane Configurations Traffic Volume (vph) Future Volume (vph) Ideal Flow (vphpl) Lane Width (ft) Storage Length (ft) Storage Lanes 1 0 Taper Length (ft) 25 Right Turn on Red Yes Link Speed (mph) 25 Link Distance (ft) 198 Travel Time (s) 5.4 Lane Group Flow (vph) Turn Type pm+pt NA Protected Phases 5 2 Permitted Phases 2 2 Detector Phase 5 2 Switch Phase Minimum Initial (s) Minimum Split (s) Total Split (s) Total Split (%) 14.4% 35.6% Maximum Green (s) Yellow Time (s) All-Red Time (s) Lost Time Adjust (s) Total Lost Time (s) Lead/Lag Lead Lag Lead-Lag Optimize? Vehicle Extension (s) Recall Mode None C-Max Act Effct Green (s) Actuated g/c Ratio v/c Ratio Control Delay Queue Delay Total Delay LOS B A Approach Delay 4.5 Approach LOS A Queue Length 50th (ft) 5 0 Queue Length 95th (ft) m20 0 Internal Link Dist (ft) 118 Turn Bay Length (ft) 198 Base Capacity (vph) Starvation Cap Reductn Spillback Cap Reductn 0 0 Storage Cap Reductn 0 0 Reduced v/c Ratio SAT Peak w/ Improvements 06/06/2018 Baseline Synchro 10 Report Page 14
314 Lanes, Volumes, Timings SAT Peak w/ Improvements 9: County Line Rd & Railroad Ave & Bryn Mawr Ave 02/25/2019 Intersection Summary Area Type: Other Cycle Length: 90 Actuated Cycle Length: 90 Offset: 26 (29%), Referenced to phase 2:SBTL and 6:NBTL, Start of Yellow Natural Cycle: 55 Control Type: Actuated-Coordinated Maximum v/c Ratio: 0.63 Intersection Signal Delay: 17.8 Intersection LOS: B Intersection Capacity Utilization 61.6% ICU Level of Service B Analysis Period (min) 15 m Volume for 95th percentile queue is metered by upstream signal. Splits and Phases: 9: County Line Rd & Railroad Ave & Bryn Mawr Ave SAT Peak w/ Improvements 06/06/2018 Baseline Synchro 10 Report Page 15
315 HCM Signalized Intersection Capacity Analysis SAT Peak w/ Improvements 9: County Line Rd & Railroad Ave & Bryn Mawr Ave 02/25/2019 Movement EBL EBT EBR EBR2 WBL WBT WBR NBL NBT NBR NBR2 SBL2 Lane Configurations Traffic Volume (vph) Future Volume (vph) Ideal Flow (vphpl) Lane Width Total Lost time (s) Lane Util. Factor Frt Flt Protected Satd. Flow (prot) Flt Permitted Satd. Flow (perm) Peak-hour factor, PHF Adj. Flow (vph) RTOR Reduction (vph) Lane Group Flow (vph) Heavy Vehicles (%) 1% 0% 0% 0% 0% 2% 0% 2% 0% 1% 2% 2% Turn Type pm+pt NA pm+pt NA Perm pm+pt NA pm+pt Protected Phases Permitted Phases Actuated Green, G (s) Effective Green, g (s) Actuated g/c Ratio Clearance Time (s) Vehicle Extension (s) Lane Grp Cap (vph) v/s Ratio Prot c0.04 c c0.03 c0.19 v/s Ratio Perm v/c Ratio Uniform Delay, d Progression Factor Incremental Delay, d Delay (s) Level of Service B C C C C B C Approach Delay (s) Approach LOS C C C Intersection Summary HCM 2000 Control Delay 18.0 HCM 2000 Level of Service B HCM 2000 Volume to Capacity ratio 0.56 Actuated Cycle Length (s) 90.0 Sum of lost time (s) 20.5 Intersection Capacity Utilization 61.6% ICU Level of Service B Analysis Period (min) 15 c Critical Lane Group SAT Peak w/ Improvements 06/06/2018 Baseline Synchro 10 Report Page 16
316 HCM Signalized Intersection Capacity Analysis SAT Peak w/ Improvements 9: County Line Rd & Railroad Ave & Bryn Mawr Ave 02/25/2019 Movement SBL SBT SBR Lane Configurations Traffic Volume (vph) Future Volume (vph) Ideal Flow (vphpl) Lane Width Total Lost time (s) Lane Util. Factor Frt Flt Protected Satd. Flow (prot) Flt Permitted Satd. Flow (perm) Peak-hour factor, PHF Adj. Flow (vph) RTOR Reduction (vph) Lane Group Flow (vph) Heavy Vehicles (%) 1% 4% 0% Turn Type pm+pt NA Protected Phases 5 2 Permitted Phases 2 2 Actuated Green, G (s) Effective Green, g (s) Actuated g/c Ratio Clearance Time (s) Vehicle Extension (s) Lane Grp Cap (vph) v/s Ratio Prot v/s Ratio Perm 0.09 v/c Ratio Uniform Delay, d Progression Factor Incremental Delay, d Delay (s) Level of Service B A Approach Delay (s) 4.6 Approach LOS A Intersection Summary SAT Peak w/ Improvements 06/06/2018 Baseline Synchro 10 Report Page 17
317 Lanes, Volumes, Timings SAT Peak w/ Improvements 10: County Line Rd & Landover Rd 02/25/2019 Lane Group EBL EBT EBR WBL WBT WBR NBL NBT NBR SBL SBT SBR Lane Configurations Traffic Volume (vph) Future Volume (vph) Ideal Flow (vphpl) Lane Width (ft) Storage Length (ft) Storage Lanes Taper Length (ft) Right Turn on Red Yes Yes Yes Yes Link Speed (mph) Link Distance (ft) Travel Time (s) Lane Group Flow (vph) Turn Type Perm NA Perm NA Perm NA Perm NA Protected Phases Permitted Phases Detector Phase Switch Phase Minimum Initial (s) Minimum Split (s) Total Split (s) Total Split (%) 25.0% 25.0% 25.0% 25.0% 75.0% 75.0% 75.0% 75.0% Maximum Green (s) Yellow Time (s) All-Red Time (s) Lost Time Adjust (s) Total Lost Time (s) Lead/Lag Lead-Lag Optimize? Vehicle Extension (s) Recall Mode None None None None C-Max C-Max C-Max C-Max Act Effct Green (s) Actuated g/c Ratio v/c Ratio Control Delay Queue Delay Total Delay LOS D E A A A A Approach Delay Approach LOS D E A A Queue Length 50th (ft) Queue Length 95th (ft) #187 # Internal Link Dist (ft) Turn Bay Length (ft) Base Capacity (vph) Starvation Cap Reductn Spillback Cap Reductn Storage Cap Reductn Reduced v/c Ratio SAT Peak w/ Improvements 06/06/2018 Baseline Synchro 10 Report Page 4
318 Lanes, Volumes, Timings SAT Peak w/ Improvements 10: County Line Rd & Landover Rd 02/25/2019 Intersection Summary Area Type: Other Cycle Length: 80 Actuated Cycle Length: 80 Offset: 54 (68%), Referenced to phase 2:NBTL and 6:SBTL, Start of Yellow Natural Cycle: 80 Control Type: Actuated-Coordinated Maximum v/c Ratio: 0.89 Intersection Signal Delay: 18.0 Intersection LOS: B Intersection Capacity Utilization 61.2% ICU Level of Service B Analysis Period (min) 15 # 95th percentile volume exceeds capacity, queue may be longer. Queue shown is maximum after two cycles. Splits and Phases: 10: County Line Rd & Landover Rd SAT Peak w/ Improvements 06/06/2018 Baseline Synchro 10 Report Page 5
319 HCM 6th Signalized Intersection Summary SAT Peak w/ Improvements 10: County Line Rd & Landover Rd 02/25/2019 Movement EBL EBT EBR WBL WBT WBR NBL NBT NBR SBL SBT SBR Lane Configurations Traffic Volume (veh/h) Future Volume (veh/h) Initial Q (Qb), veh Ped-Bike Adj(A_pbT) Parking Bus, Adj Work Zone On Approach No No No No Adj Sat Flow, veh/h/ln Adj Flow Rate, veh/h Peak Hour Factor Percent Heavy Veh, % Cap, veh/h Arrive On Green Sat Flow, veh/h Grp Volume(v), veh/h Grp Sat Flow(s),veh/h/ln Q Serve(g_s), s Cycle Q Clear(g_c), s Prop In Lane Lane Grp Cap(c), veh/h V/C Ratio(X) Avail Cap(c_a), veh/h HCM Platoon Ratio Upstream Filter(I) Uniform Delay (d), s/veh Incr Delay (d2), s/veh Initial Q Delay(d3),s/veh %ile BackOfQ(95%),veh/ln Unsig. Movement Delay, s/veh LnGrp Delay(d),s/veh LnGrp LOS D A A C A A A A A A A A Approach Vol, veh/h Approach Delay, s/veh Approach LOS D C A A Timer - Assigned Phs Phs Duration (G+Y+Rc), s Change Period (Y+Rc), s Max Green Setting (Gmax), s Max Q Clear Time (g_c+i1), s Green Ext Time (p_c), s Intersection Summary HCM 6th Ctrl Delay 12.8 HCM 6th LOS B Notes User approved pedestrian interval to be less than phase max green. SAT Peak w/ Improvements 06/06/2018 Baseline Synchro 10 Report Page 6
320 Lanes, Volumes, Timings SAT Peak w/ Improvements 11: County Line Rd & Glenbrook Ave 02/25/2019 Lane Group EBL EBR NBL NBT SBT SBR Ø3 Ø4 Ø5 Ø7 Ø8 Lane Configurations Traffic Volume (vph) Future Volume (vph) Ideal Flow (vphpl) Lane Width (ft) Right Turn on Red Yes Yes Link Speed (mph) Link Distance (ft) Travel Time (s) Lane Group Flow (vph) Turn Type pm+pt NA NA Protected Phases Permitted Phases Detector Phase Switch Phase Minimum Initial (s) Minimum Split (s) Total Split (s) Total Split (%) 14.4% 35.6% 35.6% 14% 36% 14% 14% 36% Maximum Green (s) Yellow Time (s) All-Red Time (s) Lost Time Adjust (s) Total Lost Time (s) Lead/Lag Lead Lag Lag Lead Lag Lead Lead Lag Lead-Lag Optimize? Vehicle Extension (s) Recall Mode None C-Max C-Max None None None None None Act Effct Green (s) Actuated g/c Ratio v/c Ratio Control Delay Queue Delay Total Delay LOS A C Approach Delay Approach LOS A C Queue Length 50th (ft) Queue Length 95th (ft) Internal Link Dist (ft) Turn Bay Length (ft) Base Capacity (vph) Starvation Cap Reductn Spillback Cap Reductn 0 0 Storage Cap Reductn 0 0 Reduced v/c Ratio Intersection Summary Area Type: Other SAT Peak w/ Improvements 06/06/2018 Baseline Synchro 10 Report Page 18
321 Lanes, Volumes, Timings SAT Peak w/ Improvements 11: County Line Rd & Glenbrook Ave 02/25/2019 Cycle Length: 90 Actuated Cycle Length: 90 Offset: 26 (29%), Referenced to phase 2:SBTL and 6:NBTL, Start of Yellow Natural Cycle: 55 Control Type: Actuated-Coordinated Maximum v/c Ratio: 0.63 Intersection Signal Delay: 10.9 Intersection LOS: B Intersection Capacity Utilization 45.4% ICU Level of Service A Analysis Period (min) 15 Splits and Phases: 11: County Line Rd & Glenbrook Ave SAT Peak w/ Improvements 06/06/2018 Baseline Synchro 10 Report Page 19
322 HCM Signalized Intersection Capacity Analysis SAT Peak w/ Improvements 11: County Line Rd & Glenbrook Ave 02/25/2019 Movement EBL EBR NBL NBT SBT SBR Lane Configurations Traffic Volume (vph) Future Volume (vph) Ideal Flow (vphpl) Lane Width Total Lost time (s) Lane Util. Factor Frt Flt Protected Satd. Flow (prot) Flt Permitted Satd. Flow (perm) Peak-hour factor, PHF Adj. Flow (vph) RTOR Reduction (vph) Lane Group Flow (vph) Turn Type pm+pt NA NA Protected Phases Permitted Phases Actuated Green, G (s) Effective Green, g (s) Actuated g/c Ratio Clearance Time (s) Vehicle Extension (s) Lane Grp Cap (vph) v/s Ratio Prot c0.11 c0.21 v/s Ratio Perm c0.15 v/c Ratio Uniform Delay, d Progression Factor Incremental Delay, d Delay (s) Level of Service A C Approach Delay (s) Approach LOS A A C Intersection Summary HCM 2000 Control Delay 10.4 HCM 2000 Level of Service B HCM 2000 Volume to Capacity ratio 0.46 Actuated Cycle Length (s) 90.0 Sum of lost time (s) 21.0 Intersection Capacity Utilization 45.4% ICU Level of Service A Analysis Period (min) 15 c Critical Lane Group SAT Peak w/ Improvements 06/06/2018 Baseline Synchro 10 Report Page 20
323 Analysis w/ Center Turn Lane Through Entire Study Area
324 Lanes, Volumes, Timings AM AM Peak Peak TWLT w/ Improvements Entire Length 1: County Line Rd & Lancaster Ave 02/28/2019 Lane Group EBL EBT EBR WBL WBT WBR NBL NBT NBR SBL SBT SBR Lane Configurations Traffic Volume (vph) Future Volume (vph) Ideal Flow (vphpl) Lane Width (ft) Grade (%) 4% -4% 2% 3% Right Turn on Red Yes Yes Yes Yes Link Speed (mph) Link Distance (ft) Travel Time (s) Lane Group Flow (vph) Turn Type Perm NA Perm NA Split NA Split NA Protected Phases Permitted Phases 2 6 Detector Phase Switch Phase Minimum Initial (s) Minimum Split (s) Total Split (s) Total Split (%) 52.5% 52.5% 52.5% 52.5% 21.3% 21.3% 26.3% 26.3% Maximum Green (s) Yellow Time (s) All-Red Time (s) Lost Time Adjust (s) Total Lost Time (s) Lead/Lag Lead-Lag Optimize? Vehicle Extension (s) Recall Mode C-Max C-Max None None None None None None Act Effct Green (s) Actuated g/c Ratio v/c Ratio Control Delay Queue Delay Total Delay LOS B B C C B Approach Delay Approach LOS B B C B Queue Length 50th (ft) Queue Length 95th (ft) #347 # Internal Link Dist (ft) Turn Bay Length (ft) Base Capacity (vph) Starvation Cap Reductn Spillback Cap Reductn Storage Cap Reductn Reduced v/c Ratio Intersection Summary AM Peak w/ Improvements Synchro 10 Report Page 1
325 Lanes, Volumes, Timings AM AM Peak Peak TWLT w/ Improvements Entire Length 1: County Line Rd & Lancaster Ave 02/28/2019 Area Type: Other Cycle Length: 80 Actuated Cycle Length: 80 Offset: 0 (0%), Referenced to phase 2:EBTL, Start of Green Natural Cycle: 65 Control Type: Actuated-Coordinated Maximum v/c Ratio: 0.74 Intersection Signal Delay: 18.4 Intersection LOS: B Intersection Capacity Utilization 70.7% ICU Level of Service C Analysis Period (min) 15 # 95th percentile volume exceeds capacity, queue may be longer. Queue shown is maximum after two cycles. Splits and Phases: 1: County Line Rd & Lancaster Ave AM Peak w/ Improvements Synchro 10 Report Page 2
326 HCM Signalized Intersection Capacity Analysis AM AM Peak Peak TWLT w/ Improvements Entire Length 1: County Line Rd & Lancaster Ave 02/28/2019 Movement EBL EBT EBR WBL WBT WBR NBL NBT NBR SBL SBT SBR Lane Configurations Traffic Volume (vph) Future Volume (vph) Ideal Flow (vphpl) Lane Width Grade (%) 4% -4% 2% 3% Total Lost time (s) Lane Util. Factor Frt Flt Protected Satd. Flow (prot) Flt Permitted Satd. Flow (perm) Peak-hour factor, PHF Adj. Flow (vph) RTOR Reduction (vph) Lane Group Flow (vph) Heavy Vehicles (%) 0% 5% 6% 0% 5% 17% 3% 4% 0% 0% 0% 0% Turn Type Perm NA Perm NA Split NA Split NA Protected Phases Permitted Phases 2 6 Actuated Green, G (s) Effective Green, g (s) Actuated g/c Ratio Clearance Time (s) Vehicle Extension (s) Lane Grp Cap (vph) v/s Ratio Prot 0.23 c0.23 c0.01 v/s Ratio Perm c v/c Ratio Uniform Delay, d Progression Factor Incremental Delay, d Delay (s) Level of Service C B C C C Approach Delay (s) Approach LOS C B C C Intersection Summary HCM 2000 Control Delay 20.4 HCM 2000 Level of Service C HCM 2000 Volume to Capacity ratio 0.69 Actuated Cycle Length (s) 80.0 Sum of lost time (s) 12.0 Intersection Capacity Utilization 70.7% ICU Level of Service C Analysis Period (min) 15 c Critical Lane Group AM Peak w/ Improvements Synchro 10 Report Page 3
327 Lanes, Volumes, Timings AM AM Peak Peak TWLT w/ Improvements Entire Length 4: Glenbrook Ave & County Line Rd & Thomas Ave & Conestoga Rd 02/28/2019 Lane Group WBL2 WBL WBR WBR2 NBL NBT NBR SBL SBT SBR SER SER2 Lane Configurations Traffic Volume (vph) Future Volume (vph) Ideal Flow (vphpl) Lane Width (ft) Grade (%) 2% -1% 2% Storage Length (ft) Storage Lanes Taper Length (ft) Right Turn on Red No No No Link Speed (mph) Link Distance (ft) Travel Time (s) Lane Group Flow (vph) Turn Type Perm Perm pm+pt NA Perm NA Perm Protected Phases Permitted Phases Detector Phase Switch Phase Minimum Initial (s) Minimum Split (s) Total Split (s) Total Split (%) 20.0% 20.0% 45.0% 80.0% 35.0% 35.0% 45.0% Maximum Green (s) Yellow Time (s) All-Red Time (s) Lost Time Adjust (s) Total Lost Time (s) Lead/Lag Lead Lag Lag Lead Lead-Lag Optimize? Vehicle Extension (s) Recall Mode None None C-Max C-Max Max Max C-Max Act Effct Green (s) Actuated g/c Ratio v/c Ratio Control Delay Queue Delay Total Delay LOS C B A E C Approach Delay Approach LOS C A E Queue Length 50th (ft) ~ Queue Length 95th (ft) # Internal Link Dist (ft) Turn Bay Length (ft) 200 Base Capacity (vph) Starvation Cap Reductn Spillback Cap Reductn Storage Cap Reductn AM Peak w/ Improvements Synchro 10 Report Page 4
328 Lanes, Volumes, Timings AM AM Peak Peak TWLT w/ Improvements Entire Length 4: Glenbrook Ave & County Line Rd & Thomas Ave & Conestoga Rd 02/28/2019 Lane Group NEL2 NEL NER NER2 Lane Configurations Traffic Volume (vph) Future Volume (vph) Ideal Flow (vphpl) Lane Width (ft) Grade (%) -1% Storage Length (ft) 0 0 Storage Lanes 1 0 Taper Length (ft) 25 Right Turn on Red No Link Speed (mph) 25 Link Distance (ft) 393 Travel Time (s) 10.7 Lane Group Flow (vph) Turn Type Perm Perm Protected Phases Permitted Phases 4 4 Detector Phase 4 4 Switch Phase Minimum Initial (s) Minimum Split (s) Total Split (s) Total Split (%) 20.0% 20.0% Maximum Green (s) Yellow Time (s) All-Red Time (s) Lost Time Adjust (s) -5.0 Total Lost Time (s) 3.0 Lead/Lag Lead-Lag Optimize? Vehicle Extension (s) Recall Mode None None Act Effct Green (s) 12.9 Actuated g/c Ratio 0.16 v/c Ratio 0.55 Control Delay 39.6 Queue Delay 0.0 Total Delay 39.6 LOS D Approach Delay 39.6 Approach LOS D Queue Length 50th (ft) 67 Queue Length 95th (ft) 125 Internal Link Dist (ft) 313 Turn Bay Length (ft) Base Capacity (vph) 266 Starvation Cap Reductn 0 Spillback Cap Reductn 0 Storage Cap Reductn 0 AM Peak w/ Improvements Synchro 10 Report Page 5
329 Lanes, Volumes, Timings AM AM Peak Peak TWLT w/ Improvements Entire Length 4: Glenbrook Ave & County Line Rd & Thomas Ave & Conestoga Rd 02/28/2019 Lane Group WBL2 WBL WBR WBR2 NBL NBT NBR SBL SBT SBR SER SER2 Reduced v/c Ratio Intersection Summary Area Type: Other Cycle Length: 80 Actuated Cycle Length: 80 Offset: 47 (59%), Referenced to phase 1:NBL and 6:NBTL, Start of Yellow Natural Cycle: 65 Control Type: Actuated-Coordinated Maximum v/c Ratio: 1.06 Intersection Signal Delay: 31.7 Intersection LOS: C Intersection Capacity Utilization 75.0% ICU Level of Service D Analysis Period (min) 15 ~ Volume exceeds capacity, queue is theoretically infinite. Queue shown is maximum after two cycles. # 95th percentile volume exceeds capacity, queue may be longer. Queue shown is maximum after two cycles. Splits and Phases: 4: Glenbrook Ave & County Line Rd & Thomas Ave & Conestoga Rd AM Peak w/ Improvements Synchro 10 Report Page 6
330 Lanes, Volumes, Timings AM AM Peak Peak TWLT w/ Improvements Entire Length 4: Glenbrook Ave & County Line Rd & Thomas Ave & Conestoga Rd 02/28/2019 Lane Group NEL2 NEL NER NER2 Reduced v/c Ratio 0.55 Intersection Summary AM Peak w/ Improvements Synchro 10 Report Page 7
331 HCM Signalized Intersection Capacity Analysis AM AM Peak Peak TWLT w/ Improvements Entire Length 4: Glenbrook Ave & County Line Rd & Thomas Ave & Conestoga Rd 02/28/2019 Movement WBL2 WBL WBR WBR2 NBL NBT NBR SBL SBT SBR SER SER2 Lane Configurations Traffic Volume (vph) Future Volume (vph) Ideal Flow (vphpl) Lane Width Grade (%) 2% -1% 2% Total Lost time (s) Lane Util. Factor * Frt Flt Protected Satd. Flow (prot) Flt Permitted Satd. Flow (perm) Peak-hour factor, PHF Adj. Flow (vph) RTOR Reduction (vph) Lane Group Flow (vph) Heavy Vehicles (%) 0% 0% 6% 0% 3% 3% 8% 0% 5% 0% 2% 0% Parking (#/hr) Turn Type Perm Perm pm+pt NA Perm NA Perm Protected Phases Permitted Phases Actuated Green, G (s) Effective Green, g (s) Actuated g/c Ratio Clearance Time (s) Vehicle Extension (s) Lane Grp Cap (vph) v/s Ratio Prot c0.34 v/s Ratio Perm c0.27 v/c Ratio Uniform Delay, d Progression Factor Incremental Delay, d Delay (s) Level of Service C B A E C Approach Delay (s) Approach LOS C A E Intersection Summary HCM 2000 Control Delay 30.3 HCM 2000 Level of Service C HCM 2000 Volume to Capacity ratio 0.83 Actuated Cycle Length (s) 80.0 Sum of lost time (s) 13.0 Intersection Capacity Utilization 75.0% ICU Level of Service D Analysis Period (min) 15 c Critical Lane Group AM Peak w/ Improvements Synchro 10 Report Page 8
332 HCM Signalized Intersection Capacity Analysis AM AM Peak Peak TWLT w/ Improvements Entire Length 4: Glenbrook Ave & County Line Rd & Thomas Ave & Conestoga Rd 02/28/2019 Movement NEL2 NEL NER NER2 Lane Configurations Traffic Volume (vph) Future Volume (vph) Ideal Flow (vphpl) Lane Width Grade (%) -1% Total Lost time (s) 3.0 Lane Util. Factor 1.00 Frt 0.95 Flt Protected 0.97 Satd. Flow (prot) 1639 Flt Permitted 0.97 Satd. Flow (perm) 1639 Peak-hour factor, PHF Adj. Flow (vph) RTOR Reduction (vph) Lane Group Flow (vph) Heavy Vehicles (%) 5% 0% 0% 3% Parking (#/hr) 0 Turn Type Perm Perm Protected Phases Permitted Phases 4 4 Actuated Green, G (s) 7.9 Effective Green, g (s) 12.9 Actuated g/c Ratio 0.16 Clearance Time (s) 8.0 Vehicle Extension (s) 3.0 Lane Grp Cap (vph) 264 v/s Ratio Prot v/s Ratio Perm c0.09 v/c Ratio 0.55 Uniform Delay, d Progression Factor 1.00 Incremental Delay, d2 2.3 Delay (s) 33.2 Level of Service C Approach Delay (s) 33.2 Approach LOS C Intersection Summary AM Peak w/ Improvements Synchro 10 Report Page 9
333 Lanes, Volumes, Timings AM AM Peak Peak TWLT w/ Improvements Entire Length 8: County Line Rd & Lindsay Ave 02/28/2019 Lane Group WBL WBR NBT NBR SBL SBT Lane Configurations Traffic Volume (vph) Future Volume (vph) Ideal Flow (vphpl) Lane Width (ft) Storage Length (ft) Storage Lanes Taper Length (ft) Right Turn on Red Yes Yes Link Speed (mph) Link Distance (ft) Travel Time (s) Lane Group Flow (vph) Turn Type Prot NA Perm NA Protected Phases Permitted Phases 2 Detector Phase Switch Phase Minimum Initial (s) Minimum Split (s) Total Split (s) Total Split (%) 25.0% 75.0% 75.0% 75.0% Maximum Green (s) Yellow Time (s) All-Red Time (s) Lost Time Adjust (s) Total Lost Time (s) Lead/Lag Lead-Lag Optimize? Vehicle Extension (s) Recall Mode None C-Max C-Max C-Max Act Effct Green (s) Actuated g/c Ratio v/c Ratio Control Delay Queue Delay Total Delay LOS B A A A Approach Delay Approach LOS B A A Queue Length 50th (ft) Queue Length 95th (ft) 19 # Internal Link Dist (ft) Turn Bay Length (ft) 75 Base Capacity (vph) Starvation Cap Reductn Spillback Cap Reductn Storage Cap Reductn Reduced v/c Ratio AM Peak w/ Improvements Synchro 10 Report Page 10
334 Lanes, Volumes, Timings AM AM Peak Peak TWLT w/ Improvements Entire Length 8: County Line Rd & Lindsay Ave 02/28/2019 Intersection Summary Area Type: Other Cycle Length: 60 Actuated Cycle Length: 60 Offset: 39 (65%), Referenced to phase 2:SBTL and 6:NBT, Start of Yellow Natural Cycle: 60 Control Type: Actuated-Coordinated Maximum v/c Ratio: 0.68 Intersection Signal Delay: 5.2 Intersection LOS: A Intersection Capacity Utilization 65.6% ICU Level of Service C Analysis Period (min) 15 # 95th percentile volume exceeds capacity, queue may be longer. Queue shown is maximum after two cycles. Splits and Phases: 8: County Line Rd & Lindsay Ave AM Peak w/ Improvements Synchro 10 Report Page 11
335 HCM Signalized Intersection Capacity Analysis AM AM Peak Peak TWLT w/ Improvements Entire Length 8: County Line Rd & Lindsay Ave 02/28/2019 Movement WBL WBR NBT NBR SBL SBT Lane Configurations Traffic Volume (vph) Future Volume (vph) Ideal Flow (vphpl) Lane Width Total Lost time (s) Lane Util. Factor Frt Flt Protected Satd. Flow (prot) Flt Permitted Satd. Flow (perm) Peak-hour factor, PHF Adj. Flow (vph) RTOR Reduction (vph) Lane Group Flow (vph) Heavy Vehicles (%) 27% 25% 3% 0% 50% 4% Turn Type Prot NA Perm NA Protected Phases Permitted Phases 2 Actuated Green, G (s) Effective Green, g (s) Actuated g/c Ratio Clearance Time (s) Vehicle Extension (s) Lane Grp Cap (vph) v/s Ratio Prot c0.01 c v/s Ratio Perm 0.02 v/c Ratio Uniform Delay, d Progression Factor Incremental Delay, d Delay (s) Level of Service C A A A Approach Delay (s) Approach LOS C A A Intersection Summary HCM 2000 Control Delay 6.2 HCM 2000 Level of Service A HCM 2000 Volume to Capacity ratio 0.72 Actuated Cycle Length (s) 60.0 Sum of lost time (s) 6.0 Intersection Capacity Utilization 65.6% ICU Level of Service C Analysis Period (min) 15 c Critical Lane Group AM Peak w/ Improvements Synchro 10 Report Page 12
336 Lanes, Volumes, Timings AM AM Peak Peak TWLT w/ Improvements Entire Length 9: County Line Rd & Railroad Ave & Bryn Mawr Ave 02/28/2019 Lane Group EBL EBT EBR EBR2 WBL2 WBL WBT WBR NBL NBT NBR NBR2 Lane Configurations Traffic Volume (vph) Future Volume (vph) Ideal Flow (vphpl) Lane Width (ft) Storage Length (ft) Storage Lanes Taper Length (ft) Right Turn on Red Yes Yes Yes Link Speed (mph) Link Distance (ft) Travel Time (s) Lane Group Flow (vph) Turn Type pm+pt NA pm+pt pm+pt NA Perm pm+pt NA Protected Phases Permitted Phases Detector Phase Switch Phase Minimum Initial (s) Minimum Split (s) Total Split (s) Total Split (%) 10.0% 45.8% 10.0% 10.0% 45.8% 45.8% 10.0% 34.2% Maximum Green (s) Yellow Time (s) All-Red Time (s) Lost Time Adjust (s) Total Lost Time (s) Lead/Lag Lead Lag Lead Lead Lag Lag Lead Lag Lead-Lag Optimize? Vehicle Extension (s) Recall Mode None None None None None None None C-Max Act Effct Green (s) Actuated g/c Ratio v/c Ratio Control Delay Queue Delay Total Delay LOS C D B C A D F Approach Delay Approach LOS D C F Queue Length 50th (ft) ~1116 Queue Length 95th (ft) m85 m#1302 Internal Link Dist (ft) Turn Bay Length (ft) Base Capacity (vph) Starvation Cap Reductn Spillback Cap Reductn Storage Cap Reductn Reduced v/c Ratio AM Peak w/ Improvements Synchro 10 Report Page 13
337 Lanes, Volumes, Timings AM AM Peak Peak TWLT w/ Improvements Entire Length 9: County Line Rd & Railroad Ave & Bryn Mawr Ave 02/28/2019 Lane Group SBL2 SBL SBT SBR Lane Configurations Traffic Volume (vph) Future Volume (vph) Ideal Flow (vphpl) Lane Width (ft) Storage Length (ft) 50 0 Storage Lanes 1 0 Taper Length (ft) 25 Right Turn on Red Yes Link Speed (mph) 25 Link Distance (ft) 198 Travel Time (s) 5.4 Lane Group Flow (vph) Turn Type pm+pt pm+pt NA Protected Phases Permitted Phases Detector Phase Switch Phase Minimum Initial (s) Minimum Split (s) Total Split (s) Total Split (%) 10.0% 10.0% 34.2% Maximum Green (s) Yellow Time (s) All-Red Time (s) Lost Time Adjust (s) Total Lost Time (s) Lead/Lag Lead Lead Lag Lead-Lag Optimize? Vehicle Extension (s) Recall Mode None None C-Max Act Effct Green (s) Actuated g/c Ratio v/c Ratio Control Delay Queue Delay Total Delay LOS D D Approach Delay 43.6 Approach LOS D Queue Length 50th (ft) 22 ~129 Queue Length 95th (ft) m18 m#84 Internal Link Dist (ft) 118 Turn Bay Length (ft) 50 Base Capacity (vph) Starvation Cap Reductn Spillback Cap Reductn 0 0 Storage Cap Reductn 0 0 Reduced v/c Ratio AM Peak w/ Improvements Synchro 10 Report Page 14
338 Lanes, Volumes, Timings AM AM Peak Peak TWLT w/ Improvements Entire Length 9: County Line Rd & Railroad Ave & Bryn Mawr Ave 02/28/2019 Intersection Summary Area Type: Other Cycle Length: 120 Actuated Cycle Length: 120 Offset: 35 (29%), Referenced to phase 2:SBTL and 6:NBTL, Start of Yellow Natural Cycle: 140 Control Type: Actuated-Coordinated Maximum v/c Ratio: 1.46 Intersection Signal Delay: Intersection LOS: F Intersection Capacity Utilization 100.6% ICU Level of Service G Analysis Period (min) 15 ~ Volume exceeds capacity, queue is theoretically infinite. Queue shown is maximum after two cycles. # 95th percentile volume exceeds capacity, queue may be longer. Queue shown is maximum after two cycles. m Volume for 95th percentile queue is metered by upstream signal. Splits and Phases: 9: County Line Rd & Railroad Ave & Bryn Mawr Ave AM Peak w/ Improvements Synchro 10 Report Page 15
339 HCM Signalized Intersection Capacity Analysis AM AM Peak Peak TWLT w/ Improvements Entire Length 9: County Line Rd & Railroad Ave & Bryn Mawr Ave 02/28/2019 Movement EBL EBT EBR EBR2 WBL2 WBL WBT WBR NBL NBT NBR NBR2 Lane Configurations Traffic Volume (vph) Future Volume (vph) Ideal Flow (vphpl) Lane Width Total Lost time (s) Lane Util. Factor Frt Flt Protected Satd. Flow (prot) Flt Permitted Satd. Flow (perm) Peak-hour factor, PHF Adj. Flow (vph) RTOR Reduction (vph) Lane Group Flow (vph) Heavy Vehicles (%) 6% 2% 0% 2% 0% 0% 2% 0% 25% 3% 3% 9% Turn Type pm+pt NA pm+pt pm+pt NA Perm pm+pt NA Protected Phases Permitted Phases Actuated Green, G (s) Effective Green, g (s) Actuated g/c Ratio Clearance Time (s) Vehicle Extension (s) Lane Grp Cap (vph) v/s Ratio Prot c0.03 c c0.07 c0.61 v/s Ratio Perm v/c Ratio Uniform Delay, d Progression Factor Incremental Delay, d Delay (s) Level of Service C D C C C C F Approach Delay (s) Approach LOS D C F Intersection Summary HCM 2000 Control Delay HCM 2000 Level of Service F HCM 2000 Volume to Capacity ratio 1.15 Actuated Cycle Length (s) Sum of lost time (s) 17.0 Intersection Capacity Utilization 100.6% ICU Level of Service G Analysis Period (min) 15 c Critical Lane Group AM Peak w/ Improvements Synchro 10 Report Page 16
340 HCM Signalized Intersection Capacity Analysis AM AM Peak Peak TWLT w/ Improvements Entire Length 9: County Line Rd & Railroad Ave & Bryn Mawr Ave 02/28/2019 Movement SBL2 SBL SBT SBR Lane Configurations Traffic Volume (vph) Future Volume (vph) Ideal Flow (vphpl) Lane Width Total Lost time (s) Lane Util. Factor Frt Flt Protected Satd. Flow (prot) Flt Permitted Satd. Flow (perm) Peak-hour factor, PHF Adj. Flow (vph) RTOR Reduction (vph) Lane Group Flow (vph) Heavy Vehicles (%) 4% 5% 4% 10% Turn Type pm+pt pm+pt NA Protected Phases Permitted Phases Actuated Green, G (s) Effective Green, g (s) Actuated g/c Ratio Clearance Time (s) Vehicle Extension (s) Lane Grp Cap (vph) v/s Ratio Prot v/s Ratio Perm 0.14 v/c Ratio Uniform Delay, d Progression Factor Incremental Delay, d Delay (s) Level of Service E C Approach Delay (s) 28.0 Approach LOS C Intersection Summary AM Peak w/ Improvements Synchro 10 Report Page 17
341 Lanes, Volumes, Timings AM AM Peak Peak TWLT w/ Improvements Entire Length 11: County Line Rd & Glenbrook Ave 02/28/2019 Lane Group EBL EBR NBL NBT SBT SBR Ø3 Ø4 Ø5 Ø7 Ø8 Lane Configurations Traffic Volume (vph) Future Volume (vph) Ideal Flow (vphpl) Lane Width (ft) Storage Length (ft) Storage Lanes Taper Length (ft) Right Turn on Red Yes Yes Link Speed (mph) Link Distance (ft) Travel Time (s) Lane Group Flow (vph) Turn Type pm+pt NA NA Protected Phases Permitted Phases Detector Phase Switch Phase Minimum Initial (s) Minimum Split (s) Total Split (s) Total Split (%) 10.0% 34.2% 34.2% 10% 46% 10% 10% 46% Maximum Green (s) Yellow Time (s) All-Red Time (s) Lost Time Adjust (s) Total Lost Time (s) Lead/Lag Lead Lag Lag Lead Lag Lead Lead Lag Lead-Lag Optimize? Vehicle Extension (s) Recall Mode None C-Max C-Max None None None None None Act Effct Green (s) Actuated g/c Ratio v/c Ratio Control Delay Queue Delay Total Delay LOS C B F Approach Delay Approach LOS B F Queue Length 50th (ft) ~648 Queue Length 95th (ft) m14 m181 #883 Internal Link Dist (ft) Turn Bay Length (ft) 45 Base Capacity (vph) Starvation Cap Reductn Spillback Cap Reductn Storage Cap Reductn Reduced v/c Ratio AM Peak w/ Improvements Synchro 10 Report Page 18
342 Lanes, Volumes, Timings AM AM Peak Peak TWLT w/ Improvements Entire Length 11: County Line Rd & Glenbrook Ave 02/28/2019 Intersection Summary Area Type: Other Cycle Length: 120 Actuated Cycle Length: 120 Offset: 35 (29%), Referenced to phase 2:SBTL and 6:NBTL, Start of Yellow Natural Cycle: 140 Control Type: Actuated-Coordinated Maximum v/c Ratio: 1.46 Intersection Signal Delay: 45.4 Intersection LOS: D Intersection Capacity Utilization 60.6% ICU Level of Service B Analysis Period (min) 15 ~ Volume exceeds capacity, queue is theoretically infinite. Queue shown is maximum after two cycles. # 95th percentile volume exceeds capacity, queue may be longer. Queue shown is maximum after two cycles. m Volume for 95th percentile queue is metered by upstream signal. Splits and Phases: 11: County Line Rd & Glenbrook Ave AM Peak w/ Improvements Synchro 10 Report Page 19
343 HCM Signalized Intersection Capacity Analysis AM AM Peak Peak TWLT w/ Improvements Entire Length 11: County Line Rd & Glenbrook Ave 02/28/2019 Movement EBL EBR NBL NBT SBT SBR Lane Configurations Traffic Volume (vph) Future Volume (vph) Ideal Flow (vphpl) Lane Width Total Lost time (s) Lane Util. Factor Frt Flt Protected Satd. Flow (prot) Flt Permitted Satd. Flow (perm) Peak-hour factor, PHF Adj. Flow (vph) RTOR Reduction (vph) Lane Group Flow (vph) Heavy Vehicles (%) 2% 2% 2% 2% 4% 2% Turn Type pm+pt NA NA Protected Phases Permitted Phases Actuated Green, G (s) Effective Green, g (s) Actuated g/c Ratio Clearance Time (s) Vehicle Extension (s) Lane Grp Cap (vph) v/s Ratio Prot 0.02 c0.26 c0.41 v/s Ratio Perm v/c Ratio Uniform Delay, d Progression Factor Incremental Delay, d Delay (s) Level of Service C A F Approach Delay (s) Approach LOS A A F Intersection Summary HCM 2000 Control Delay 41.5 HCM 2000 Level of Service D HCM 2000 Volume to Capacity ratio 0.98 Actuated Cycle Length (s) Sum of lost time (s) 20.5 Intersection Capacity Utilization 60.6% ICU Level of Service B Analysis Period (min) 15 c Critical Lane Group AM Peak w/ Improvements Synchro 10 Report Page 20
344 Lanes, Volumes, Timings PM Peak TWLT Entire Length 1: County Line Road & Lancaster Ave 02/25/2019 Lane Group EBL EBT EBR WBL WBT WBR NBL NBT NBR SBL SBT SBR Lane Configurations Traffic Volume (vph) Future Volume (vph) Ideal Flow (vphpl) Lane Width (ft) Grade (%) 4% -4% 2% 3% Right Turn on Red Yes Yes Yes Yes Link Speed (mph) Link Distance (ft) Travel Time (s) Lane Group Flow (vph) Turn Type Perm NA Perm NA Split NA Split NA Protected Phases Permitted Phases 2 6 Detector Phase Switch Phase Minimum Initial (s) Minimum Split (s) Total Split (s) Total Split (%) 52.5% 52.5% 52.5% 52.5% 21.3% 21.3% 26.3% 26.3% Maximum Green (s) Yellow Time (s) All-Red Time (s) Lost Time Adjust (s) Total Lost Time (s) Lead/Lag Lead-Lag Optimize? Vehicle Extension (s) Recall Mode C-Max C-Max None None None None None None Act Effct Green (s) Actuated g/c Ratio v/c Ratio Control Delay Queue Delay Total Delay LOS C B C C C Approach Delay Approach LOS C B C C Queue Length 50th (ft) Queue Length 95th (ft) # #218 # Internal Link Dist (ft) Turn Bay Length (ft) Base Capacity (vph) Starvation Cap Reductn Spillback Cap Reductn Storage Cap Reductn Reduced v/c Ratio Intersection Summary PM Peak w/ Improvements 06/06/2018 Baseline Synchro 10 Report Page 1
345 Lanes, Volumes, Timings PM Peak TWLT Entire Length 1: County Line Road & Lancaster Ave 02/25/2019 Area Type: Other Cycle Length: 80 Actuated Cycle Length: 80 Offset: 0 (0%), Referenced to phase 2:EBTL, Start of Green Natural Cycle: 60 Control Type: Actuated-Coordinated Maximum v/c Ratio: 0.89 Intersection Signal Delay: 21.5 Intersection LOS: C Intersection Capacity Utilization 81.1% ICU Level of Service D Analysis Period (min) 15 # 95th percentile volume exceeds capacity, queue may be longer. Queue shown is maximum after two cycles. Splits and Phases: 1: County Line Road & Lancaster Ave PM Peak w/ Improvements 06/06/2018 Baseline Synchro 10 Report Page 2
346 HCM Signalized Intersection Capacity Analysis PM Peak TWLT Entire Length 1: County Line Road & Lancaster Ave 02/25/2019 Movement EBL EBT EBR WBL WBT WBR NBL NBT NBR SBL SBT SBR Lane Configurations Traffic Volume (vph) Future Volume (vph) Ideal Flow (vphpl) Lane Width Grade (%) 4% -4% 2% 3% Total Lost time (s) Lane Util. Factor Frt Flt Protected Satd. Flow (prot) Flt Permitted Satd. Flow (perm) Peak-hour factor, PHF Adj. Flow (vph) RTOR Reduction (vph) Lane Group Flow (vph) Heavy Vehicles (%) 0% 1% 1% 0% 2% 0% 1% 0% 0% 0% 0% 0% Turn Type Perm NA Perm NA Split NA Split NA Protected Phases Permitted Phases 2 6 Actuated Green, G (s) Effective Green, g (s) Actuated g/c Ratio Clearance Time (s) Vehicle Extension (s) Lane Grp Cap (vph) v/s Ratio Prot 0.17 c0.17 c0.02 v/s Ratio Perm c v/c Ratio Uniform Delay, d Progression Factor Incremental Delay, d Delay (s) Level of Service C B C C C Approach Delay (s) Approach LOS C B C C Intersection Summary HCM 2000 Control Delay 24.3 HCM 2000 Level of Service C HCM 2000 Volume to Capacity ratio 0.78 Actuated Cycle Length (s) 80.0 Sum of lost time (s) 11.0 Intersection Capacity Utilization 81.1% ICU Level of Service D Analysis Period (min) 15 c Critical Lane Group PM Peak w/ Improvements 06/06/2018 Baseline Synchro 10 Report Page 3
347 Lanes, Volumes, Timings PM Peak TWLT Entire Length 4: Glenbrook Ave & County Line Road & Thomas Ave & Conestoga Rd 02/25/2019 Lane Group WBL2 WBL WBR WBR2 NBL NBT NBR SBL SBT SBR SBR2 SER Lane Configurations Traffic Volume (vph) Future Volume (vph) Ideal Flow (vphpl) Lane Width (ft) Grade (%) 2% -1% 2% Storage Length (ft) Storage Lanes Taper Length (ft) Right Turn on Red No No No Link Speed (mph) Link Distance (ft) Travel Time (s) Lane Group Flow (vph) Turn Type Perm Perm pm+pt NA Perm NA Perm Protected Phases Permitted Phases Detector Phase Switch Phase Minimum Initial (s) Minimum Split (s) Total Split (s) Total Split (%) 16.0% 16.0% 36.0% 84.0% 48.0% 48.0% 36.0% Maximum Green (s) Yellow Time (s) All-Red Time (s) Lost Time Adjust (s) Total Lost Time (s) Lead/Lag Lead Lag Lag Lead Lead-Lag Optimize? Vehicle Extension (s) Recall Mode None None None C-Max C-Max C-Max None Act Effct Green (s) Actuated g/c Ratio v/c Ratio Control Delay Queue Delay Total Delay LOS D B A B C D Approach Delay Approach LOS D A C Queue Length 50th (ft) Queue Length 95th (ft) # m4 #468 #345 Internal Link Dist (ft) Turn Bay Length (ft) Base Capacity (vph) Starvation Cap Reductn Spillback Cap Reductn Storage Cap Reductn PM Peak w/ Improvements 06/06/2018 Baseline Synchro 10 Report Page 4
348 Lanes, Volumes, Timings PM Peak TWLT Entire Length 4: Glenbrook Ave & County Line Road & Thomas Ave & Conestoga Rd 02/25/2019 Lane Group SER2 NEL2 NEL NER NER2 Lane Configurations Traffic Volume (vph) Future Volume (vph) Ideal Flow (vphpl) Lane Width (ft) Grade (%) -1% Storage Length (ft) 0 0 Storage Lanes 1 0 Taper Length (ft) 25 Right Turn on Red No No Link Speed (mph) 25 Link Distance (ft) 393 Travel Time (s) 10.7 Lane Group Flow (vph) Turn Type Perm Perm Protected Phases Permitted Phases 4 4 Detector Phase 4 4 Switch Phase Minimum Initial (s) Minimum Split (s) Total Split (s) Total Split (%) 16.0% 16.0% Maximum Green (s) Yellow Time (s) All-Red Time (s) Lost Time Adjust (s) -5.0 Total Lost Time (s) 3.0 Lead/Lag Lead-Lag Optimize? Vehicle Extension (s) Recall Mode None None Act Effct Green (s) 9.0 Actuated g/c Ratio 0.12 v/c Ratio 0.65 Control Delay 49.1 Queue Delay 0.0 Total Delay 49.1 LOS D Approach Delay 49.1 Approach LOS D Queue Length 50th (ft) 57 Queue Length 95th (ft) #130 Internal Link Dist (ft) 313 Turn Bay Length (ft) Base Capacity (vph) 194 Starvation Cap Reductn 0 Spillback Cap Reductn 0 Storage Cap Reductn 0 PM Peak w/ Improvements 06/06/2018 Baseline Synchro 10 Report Page 5
349 Lanes, Volumes, Timings PM Peak TWLT Entire Length 4: Glenbrook Ave & County Line Road & Thomas Ave & Conestoga Rd 02/25/2019 Lane Group WBL2 WBL WBR WBR2 NBL NBT NBR SBL SBT SBR SBR2 SER Reduced v/c Ratio Intersection Summary Area Type: Other Cycle Length: 75 Actuated Cycle Length: 75 Offset: 0 (0%), Referenced to phase 2:SBTL and 6:NBTL, Start of Yellow Natural Cycle: 75 Control Type: Actuated-Coordinated Maximum v/c Ratio: 0.84 Intersection Signal Delay: 23.8 Intersection LOS: C Intersection Capacity Utilization 82.9% ICU Level of Service E Analysis Period (min) 15 # 95th percentile volume exceeds capacity, queue may be longer. Queue shown is maximum after two cycles. m Volume for 95th percentile queue is metered by upstream signal. Splits and Phases: 4: Glenbrook Ave & County Line Road & Thomas Ave & Conestoga Rd PM Peak w/ Improvements 06/06/2018 Baseline Synchro 10 Report Page 6
350 Lanes, Volumes, Timings PM Peak TWLT Entire Length 4: Glenbrook Ave & County Line Road & Thomas Ave & Conestoga Rd 02/25/2019 Lane Group SER2 NEL2 NEL NER NER2 Reduced v/c Ratio 0.65 Intersection Summary PM Peak w/ Improvements 06/06/2018 Baseline Synchro 10 Report Page 7
351 HCM Signalized Intersection Capacity Analysis PM Peak TWLT Entire Length 4: Glenbrook Ave & County Line Road & Thomas Ave & Conestoga Rd 02/25/2019 Movement WBL2 WBL WBR WBR2 NBL NBT NBR SBL SBT SBR SBR2 SER Lane Configurations Traffic Volume (vph) Future Volume (vph) Ideal Flow (vphpl) Lane Width Grade (%) 2% -1% 2% Total Lost time (s) Lane Util. Factor * Frt Flt Protected Satd. Flow (prot) Flt Permitted Satd. Flow (perm) Peak-hour factor, PHF Adj. Flow (vph) RTOR Reduction (vph) Lane Group Flow (vph) Heavy Vehicles (%) 9% 0% 0% 25% 0% 2% 4% 0% 0% 5% 0% 1% Turn Type Perm Perm pm+pt NA Perm NA Perm Protected Phases Permitted Phases Actuated Green, G (s) Effective Green, g (s) Actuated g/c Ratio Clearance Time (s) Vehicle Extension (s) Lane Grp Cap (vph) v/s Ratio Prot c0.39 v/s Ratio Perm c0.27 v/c Ratio Uniform Delay, d Progression Factor Incremental Delay, d Delay (s) Level of Service D B A B C D Approach Delay (s) Approach LOS D A C Intersection Summary HCM 2000 Control Delay 22.6 HCM 2000 Level of Service C HCM 2000 Volume to Capacity ratio 0.90 Actuated Cycle Length (s) 75.0 Sum of lost time (s) 13.0 Intersection Capacity Utilization 82.9% ICU Level of Service E Analysis Period (min) 15 c Critical Lane Group PM Peak w/ Improvements 06/06/2018 Baseline Synchro 10 Report Page 8
352 HCM Signalized Intersection Capacity Analysis PM Peak TWLT Entire Length 4: Glenbrook Ave & County Line Road & Thomas Ave & Conestoga Rd 02/25/2019 Movement SER2 NEL2 NEL NER NER2 Lane Configurations Traffic Volume (vph) Future Volume (vph) Ideal Flow (vphpl) Lane Width Grade (%) -1% Total Lost time (s) 3.0 Lane Util. Factor 1.00 Frt 0.92 Flt Protected 0.98 Satd. Flow (prot) 1621 Flt Permitted 0.98 Satd. Flow (perm) 1621 Peak-hour factor, PHF Adj. Flow (vph) RTOR Reduction (vph) Lane Group Flow (vph) Heavy Vehicles (%) 0% 0% 0% 0% 2% Turn Type Perm Perm Protected Phases Permitted Phases 4 4 Actuated Green, G (s) 3.2 Effective Green, g (s) 8.2 Actuated g/c Ratio 0.11 Clearance Time (s) 8.0 Vehicle Extension (s) 3.0 Lane Grp Cap (vph) 177 v/s Ratio Prot v/s Ratio Perm c0.08 v/c Ratio 0.71 Uniform Delay, d Progression Factor 1.00 Incremental Delay, d Delay (s) 44.9 Level of Service D Approach Delay (s) 44.9 Approach LOS D Intersection Summary PM Peak w/ Improvements 06/06/2018 Baseline Synchro 10 Report Page 9
353 Lanes, Volumes, Timings PM Peak TWLT Entire Length 8: County Line Road & Lindsay Ave 02/25/2019 Lane Group WBL WBR NBT NBR SBL SBT Lane Configurations Traffic Volume (vph) Future Volume (vph) Ideal Flow (vphpl) Lane Width (ft) Storage Length (ft) Storage Lanes Taper Length (ft) Right Turn on Red Yes Yes Link Speed (mph) Link Distance (ft) Travel Time (s) Lane Group Flow (vph) Turn Type Prot NA Perm NA Protected Phases Permitted Phases 2 Detector Phase Switch Phase Minimum Initial (s) Minimum Split (s) Total Split (s) Total Split (%) 33.3% 66.7% 66.7% 66.7% Maximum Green (s) Yellow Time (s) All-Red Time (s) Lost Time Adjust (s) Total Lost Time (s) Lead/Lag Lead-Lag Optimize? Vehicle Extension (s) Recall Mode None C-Max C-Max C-Max Act Effct Green (s) Actuated g/c Ratio v/c Ratio Control Delay Queue Delay Total Delay LOS B A A E Approach Delay Approach LOS B A E Queue Length 50th (ft) Queue Length 95th (ft) #599 Internal Link Dist (ft) Turn Bay Length (ft) 50 Base Capacity (vph) Starvation Cap Reductn Spillback Cap Reductn Storage Cap Reductn Reduced v/c Ratio PM Peak w/ Improvements 06/06/2018 Baseline Synchro 10 Report Page 10
354 Lanes, Volumes, Timings PM Peak TWLT Entire Length 8: County Line Road & Lindsay Ave 02/25/2019 Intersection Summary Area Type: Other Cycle Length: 60 Actuated Cycle Length: 60 Offset: 0 (0%), Referenced to phase 2:SBTL and 6:NBT, Start of Green Natural Cycle: 60 Control Type: Actuated-Coordinated Maximum v/c Ratio: 0.71 Intersection Signal Delay: 36.5 Intersection LOS: D Intersection Capacity Utilization 68.9% ICU Level of Service C Analysis Period (min) 15 # 95th percentile volume exceeds capacity, queue may be longer. Queue shown is maximum after two cycles. Splits and Phases: 8: County Line Road & Lindsay Ave PM Peak w/ Improvements 06/06/2018 Baseline Synchro 10 Report Page 11
355 HCM Signalized Intersection Capacity Analysis PM Peak TWLT Entire Length 8: County Line Road & Lindsay Ave 02/25/2019 Movement WBL WBR NBT NBR SBL SBT Lane Configurations Traffic Volume (vph) Future Volume (vph) Ideal Flow (vphpl) Lane Width Total Lost time (s) Lane Util. Factor Frt Flt Protected Satd. Flow (prot) Flt Permitted Satd. Flow (perm) Peak-hour factor, PHF Adj. Flow (vph) RTOR Reduction (vph) Lane Group Flow (vph) Heavy Vehicles (%) 0% 0% 2% 0% 0% 1% Turn Type Prot NA Perm NA Protected Phases Permitted Phases 2 Actuated Green, G (s) Effective Green, g (s) Actuated g/c Ratio Clearance Time (s) Vehicle Extension (s) Lane Grp Cap (vph) v/s Ratio Prot c c0.67 v/s Ratio Perm 0.00 v/c Ratio Uniform Delay, d Progression Factor Incremental Delay, d Delay (s) Level of Service C A A A Approach Delay (s) Approach LOS C A A Intersection Summary HCM 2000 Control Delay 6.3 HCM 2000 Level of Service A HCM 2000 Volume to Capacity ratio 0.74 Actuated Cycle Length (s) 60.0 Sum of lost time (s) 5.0 Intersection Capacity Utilization 68.9% ICU Level of Service C Analysis Period (min) 15 c Critical Lane Group PM Peak w/ Improvements 06/06/2018 Baseline Synchro 10 Report Page 12
356 Lanes, Volumes, Timings PM Peak TWLT Entire Length 9: County Line Road & Railroad Ave & Bryn Mawr Ave 02/25/2019 Lane Group EBL EBT EBR EBR2 WBL2 WBL WBT WBR NBL NBT NBR NBR2 Lane Configurations Traffic Volume (vph) Future Volume (vph) Ideal Flow (vphpl) Lane Width (ft) Storage Length (ft) Storage Lanes Taper Length (ft) Right Turn on Red Yes Yes Yes Link Speed (mph) Link Distance (ft) Travel Time (s) Lane Group Flow (vph) Turn Type pm+pt NA pm+pt pm+pt NA Perm pm+pt NA Protected Phases Permitted Phases Detector Phase Switch Phase Minimum Initial (s) Minimum Split (s) Total Split (s) Total Split (%) 11.7% 39.2% 11.7% 11.7% 39.2% 39.2% 10.0% 39.2% Maximum Green (s) Yellow Time (s) All-Red Time (s) Lost Time Adjust (s) Total Lost Time (s) Lead/Lag Lead Lag Lead Lead Lag Lag Lead Lag Lead-Lag Optimize? Vehicle Extension (s) Recall Mode None None None None None None None C-Max Act Effct Green (s) Actuated g/c Ratio v/c Ratio Control Delay Queue Delay Total Delay LOS C D D D A D D Approach Delay Approach LOS D D D Queue Length 50th (ft) Queue Length 95th (ft) # m100 m#687 Internal Link Dist (ft) Turn Bay Length (ft) Base Capacity (vph) Starvation Cap Reductn Spillback Cap Reductn Storage Cap Reductn Reduced v/c Ratio PM Peak w/ Improvements 06/06/2018 Baseline Synchro 10 Report Page 13
357 Lanes, Volumes, Timings PM Peak TWLT Entire Length 9: County Line Road & Railroad Ave & Bryn Mawr Ave 02/25/2019 Lane Group SBL2 SBL SBT SBR Lane Configurations Traffic Volume (vph) Future Volume (vph) Ideal Flow (vphpl) Lane Width (ft) Storage Length (ft) 50 0 Storage Lanes 1 0 Taper Length (ft) 25 Right Turn on Red Yes Link Speed (mph) 25 Link Distance (ft) 198 Travel Time (s) 5.4 Lane Group Flow (vph) Turn Type pm+pt pm+pt NA Protected Phases Permitted Phases Detector Phase Switch Phase Minimum Initial (s) Minimum Split (s) Total Split (s) Total Split (%) 10.0% 10.0% 39.2% Maximum Green (s) Yellow Time (s) All-Red Time (s) Lost Time Adjust (s) Total Lost Time (s) Lead/Lag Lead Lead Lag Lead-Lag Optimize? Vehicle Extension (s) Recall Mode None None C-Max Act Effct Green (s) Actuated g/c Ratio v/c Ratio Control Delay Queue Delay Total Delay LOS A F Approach Delay Approach LOS F Queue Length 50th (ft) 6 ~562 Queue Length 95th (ft) m4 m#86 Internal Link Dist (ft) 118 Turn Bay Length (ft) 50 Base Capacity (vph) Starvation Cap Reductn Spillback Cap Reductn Storage Cap Reductn 0 0 Reduced v/c Ratio PM Peak w/ Improvements 06/06/2018 Baseline Synchro 10 Report Page 14
358 Lanes, Volumes, Timings PM Peak TWLT Entire Length 9: County Line Road & Railroad Ave & Bryn Mawr Ave 02/25/2019 Intersection Summary Area Type: Other Cycle Length: 120 Actuated Cycle Length: 120 Offset: 41 (34%), Referenced to phase 2:SBTL and 6:NBTL, Start of Yellow Natural Cycle: 140 Control Type: Actuated-Coordinated Maximum v/c Ratio: 1.57 Intersection Signal Delay: Intersection LOS: F Intersection Capacity Utilization 112.8% ICU Level of Service H Analysis Period (min) 15 ~ Volume exceeds capacity, queue is theoretically infinite. Queue shown is maximum after two cycles. # 95th percentile volume exceeds capacity, queue may be longer. Queue shown is maximum after two cycles. m Volume for 95th percentile queue is metered by upstream signal. Splits and Phases: 9: County Line Road & Railroad Ave & Bryn Mawr Ave PM Peak w/ Improvements 06/06/2018 Baseline Synchro 10 Report Page 15
359 HCM Signalized Intersection Capacity Analysis PM Peak TWLT Entire Length 9: County Line Road & Railroad Ave & Bryn Mawr Ave 02/25/2019 Movement EBL EBT EBR EBR2 WBL2 WBL WBT WBR NBL NBT NBR NBR2 Lane Configurations Traffic Volume (vph) Future Volume (vph) Ideal Flow (vphpl) Lane Width Total Lost time (s) Lane Util. Factor Frt Flt Protected Satd. Flow (prot) Flt Permitted Satd. Flow (perm) Peak-hour factor, PHF Adj. Flow (vph) RTOR Reduction (vph) Lane Group Flow (vph) Heavy Vehicles (%) 1% 0% 2% 2% 0% 0% 0% 1% 4% 1% 1% 0% Turn Type pm+pt NA pm+pt pm+pt NA Perm pm+pt NA Protected Phases Permitted Phases Actuated Green, G (s) Effective Green, g (s) Actuated g/c Ratio Clearance Time (s) Vehicle Extension (s) Lane Grp Cap (vph) v/s Ratio Prot 0.03 c0.25 c c v/s Ratio Perm v/c Ratio Uniform Delay, d Progression Factor Incremental Delay, d Delay (s) Level of Service C D D D C D D Approach Delay (s) Approach LOS D D D Intersection Summary HCM 2000 Control Delay HCM 2000 Level of Service F HCM 2000 Volume to Capacity ratio 1.15 Actuated Cycle Length (s) Sum of lost time (s) 17.0 Intersection Capacity Utilization 112.8% ICU Level of Service H Analysis Period (min) 15 c Critical Lane Group PM Peak w/ Improvements 06/06/2018 Baseline Synchro 10 Report Page 16
360 HCM Signalized Intersection Capacity Analysis PM Peak TWLT Entire Length 9: County Line Road & Railroad Ave & Bryn Mawr Ave 02/25/2019 Movement SBL2 SBL SBT SBR Lane Configurations Traffic Volume (vph) Future Volume (vph) Ideal Flow (vphpl) Lane Width Total Lost time (s) Lane Util. Factor Frt Flt Protected Satd. Flow (prot) Flt Permitted Satd. Flow (perm) Peak-hour factor, PHF Adj. Flow (vph) RTOR Reduction (vph) Lane Group Flow (vph) Heavy Vehicles (%) 3% 0% 1% 4% Turn Type pm+pt pm+pt NA Protected Phases Permitted Phases Actuated Green, G (s) Effective Green, g (s) Actuated g/c Ratio Clearance Time (s) Vehicle Extension (s) Lane Grp Cap (vph) v/s Ratio Prot 0.02 c0.61 v/s Ratio Perm 0.11 v/c Ratio Uniform Delay, d Progression Factor Incremental Delay, d Delay (s) Level of Service B F Approach Delay (s) Approach LOS F Intersection Summary PM Peak w/ Improvements 06/06/2018 Baseline Synchro 10 Report Page 17
361 Lanes, Volumes, Timings PM Peak TWLT Entire Length 11: County Line Road & Glenbrook Ave 02/25/2019 Lane Group EBL EBR NBL NBT SBT SBR Ø3 Ø4 Ø5 Ø7 Ø8 Lane Configurations Traffic Volume (vph) Future Volume (vph) Ideal Flow (vphpl) Lane Width (ft) Storage Length (ft) Storage Lanes Taper Length (ft) Right Turn on Red Yes Yes Link Speed (mph) Link Distance (ft) Travel Time (s) Lane Group Flow (vph) Turn Type pm+pt NA NA Protected Phases Permitted Phases Detector Phase Switch Phase Minimum Initial (s) Minimum Split (s) Total Split (s) Total Split (%) 10.0% 39.2% 39.2% 12% 39% 10% 12% 39% Maximum Green (s) Yellow Time (s) All-Red Time (s) Lost Time Adjust (s) Total Lost Time (s) Lead/Lag Lead Lag Lag Lead Lag Lead Lead Lag Lead-Lag Optimize? Vehicle Extension (s) Recall Mode None C-Max C-Max None None None None None Act Effct Green (s) Actuated g/c Ratio v/c Ratio Control Delay Queue Delay Total Delay LOS B A F Approach Delay Approach LOS A F Queue Length 50th (ft) 7 0 ~1218 Queue Length 95th (ft) m12 m23 #1493 Internal Link Dist (ft) Turn Bay Length (ft) 45 Base Capacity (vph) Starvation Cap Reductn Spillback Cap Reductn Storage Cap Reductn Reduced v/c Ratio PM Peak w/ Improvements 06/06/2018 Baseline Synchro 10 Report Page 18
362 Lanes, Volumes, Timings PM Peak TWLT Entire Length 11: County Line Road & Glenbrook Ave 02/25/2019 Intersection Summary Area Type: Other Cycle Length: 120 Actuated Cycle Length: 120 Offset: 41 (34%), Referenced to phase 2:SBTL and 6:NBTL, Start of Yellow Natural Cycle: 140 Control Type: Actuated-Coordinated Maximum v/c Ratio: 1.57 Intersection Signal Delay: Intersection LOS: F Intersection Capacity Utilization 62.4% ICU Level of Service B Analysis Period (min) 15 ~ Volume exceeds capacity, queue is theoretically infinite. Queue shown is maximum after two cycles. # 95th percentile volume exceeds capacity, queue may be longer. Queue shown is maximum after two cycles. m Volume for 95th percentile queue is metered by upstream signal. Splits and Phases: 11: County Line Road & Glenbrook Ave PM Peak w/ Improvements 06/06/2018 Baseline Synchro 10 Report Page 19
363 HCM Signalized Intersection Capacity Analysis PM Peak TWLT Entire Length 11: County Line Road & Glenbrook Ave 02/25/2019 Movement EBL EBR NBL NBT SBT SBR Lane Configurations Traffic Volume (vph) Future Volume (vph) Ideal Flow (vphpl) Lane Width Total Lost time (s) Lane Util. Factor Frt Flt Protected Satd. Flow (prot) Flt Permitted Satd. Flow (perm) Peak-hour factor, PHF Adj. Flow (vph) RTOR Reduction (vph) Lane Group Flow (vph) Heavy Vehicles (%) 0% 0% 1% 2% 1% 2% Turn Type pm+pt NA NA Protected Phases Permitted Phases Actuated Green, G (s) Effective Green, g (s) Actuated g/c Ratio Clearance Time (s) Vehicle Extension (s) Lane Grp Cap (vph) v/s Ratio Prot 0.01 c0.18 c0.65 v/s Ratio Perm v/c Ratio Uniform Delay, d Progression Factor Incremental Delay, d Delay (s) Level of Service C C F Approach Delay (s) Approach LOS A C F Intersection Summary HCM 2000 Control Delay HCM 2000 Level of Service F HCM 2000 Volume to Capacity ratio 1.06 Actuated Cycle Length (s) Sum of lost time (s) 20.5 Intersection Capacity Utilization 62.4% ICU Level of Service B Analysis Period (min) 15 c Critical Lane Group PM Peak w/ Improvements 06/06/2018 Baseline Synchro 10 Report Page 20
364 Lanes, Volumes, Timings SAT SAT Peak Peak TWLT w/ Improvements Entire Length 1: County Line Rd & Lancaster Ave 02/28/2019 Lane Group EBL EBT EBR WBL WBT WBR NBL NBT NBR SBL SBT SBR Lane Configurations Traffic Volume (vph) Future Volume (vph) Ideal Flow (vphpl) Lane Width (ft) Grade (%) 4% -4% 2% 3% Right Turn on Red Yes Yes Yes Yes Link Speed (mph) Link Distance (ft) Travel Time (s) Lane Group Flow (vph) Turn Type Perm NA Perm NA Split NA Split NA Protected Phases Permitted Phases 2 6 Detector Phase Switch Phase Minimum Initial (s) Minimum Split (s) Total Split (s) Total Split (%) 52.5% 52.5% 52.5% 52.5% 21.3% 21.3% 26.3% 26.3% Maximum Green (s) Yellow Time (s) All-Red Time (s) Lost Time Adjust (s) Total Lost Time (s) Lead/Lag Lead-Lag Optimize? Vehicle Extension (s) Recall Mode C-Max C-Max None None None None None None Act Effct Green (s) Actuated g/c Ratio v/c Ratio Control Delay Queue Delay Total Delay LOS A B C C C Approach Delay Approach LOS A B C C Queue Length 50th (ft) Queue Length 95th (ft) Internal Link Dist (ft) Turn Bay Length (ft) Base Capacity (vph) Starvation Cap Reductn Spillback Cap Reductn Storage Cap Reductn Reduced v/c Ratio Intersection Summary SAT Peak w/ Improvements Synchro 10 Report Page 1
365 Lanes, Volumes, Timings SAT SAT Peak Peak TWLT w/ Improvements Entire Length 1: County Line Rd & Lancaster Ave 02/28/2019 Area Type: Other Cycle Length: 80 Actuated Cycle Length: 80 Offset: 0 (0%), Referenced to phase 2:EBTL, Start of Green Natural Cycle: 60 Control Type: Actuated-Coordinated Maximum v/c Ratio: 0.62 Intersection Signal Delay: 15.7 Intersection Capacity Utilization 72.0% Analysis Period (min) 15 Intersection LOS: B ICU Level of Service C Splits and Phases: 1: County Line Rd & Lancaster Ave SAT Peak w/ Improvements Synchro 10 Report Page 2
366 HCM Signalized Intersection Capacity Analysis SAT SAT Peak Peak TWLT w/ Improvements Entire Length 1: County Line Rd & Lancaster Ave 02/28/2019 Movement EBL EBT EBR WBL WBT WBR NBL NBT NBR SBL SBT SBR Lane Configurations Traffic Volume (vph) Future Volume (vph) Ideal Flow (vphpl) Lane Width Grade (%) 4% -4% 2% 3% Total Lost time (s) Lane Util. Factor Frt Flt Protected Satd. Flow (prot) Flt Permitted Satd. Flow (perm) Peak-hour factor, PHF Adj. Flow (vph) RTOR Reduction (vph) Lane Group Flow (vph) Heavy Vehicles (%) 2% 0% 0% 0% 0% 0% 5% 1% 1% 0% 1% 0% Turn Type Perm NA Perm NA Split NA Split NA Protected Phases Permitted Phases 2 6 Actuated Green, G (s) Effective Green, g (s) Actuated g/c Ratio Clearance Time (s) Vehicle Extension (s) Lane Grp Cap (vph) v/s Ratio Prot 0.16 c0.17 c0.02 v/s Ratio Perm c v/c Ratio Uniform Delay, d Progression Factor Incremental Delay, d Delay (s) Level of Service B B C C C Approach Delay (s) Approach LOS B B C C Intersection Summary HCM 2000 Control Delay 16.0 HCM 2000 Level of Service B HCM 2000 Volume to Capacity ratio 0.55 Actuated Cycle Length (s) 80.0 Sum of lost time (s) 10.0 Intersection Capacity Utilization 72.0% ICU Level of Service C Analysis Period (min) 15 c Critical Lane Group SAT Peak w/ Improvements Synchro 10 Report Page 3
367 Lanes, Volumes, Timings SAT SAT Peak Peak TWLT w/ Improvements Entire Length 4: Glenbrook Ave & County Line Rd & Thomas Ave & Conestoga Rd 02/28/2019 Lane Group WBL2 WBL WBR WBR2 NBL NBT NBR SBL SBT SBR SBR2 SER Lane Configurations Traffic Volume (vph) Future Volume (vph) Ideal Flow (vphpl) Lane Width (ft) Grade (%) 2% -1% 2% Storage Length (ft) Storage Lanes Taper Length (ft) Right Turn on Red No No No Link Speed (mph) Link Distance (ft) Travel Time (s) Lane Group Flow (vph) Turn Type Perm Perm pm+pt NA Perm NA Perm Protected Phases Permitted Phases Detector Phase Switch Phase Minimum Initial (s) Minimum Split (s) Total Split (s) Total Split (%) 21.3% 21.3% 40.0% 78.8% 38.8% 38.8% 40.0% Maximum Green (s) Yellow Time (s) All-Red Time (s) Lost Time Adjust (s) Total Lost Time (s) Lead/Lag Lead Lag Lag Lead Lead-Lag Optimize? Vehicle Extension (s) Recall Mode None None None C-Max C-Max C-Max None Act Effct Green (s) Actuated g/c Ratio v/c Ratio Control Delay Queue Delay Total Delay LOS C A A B B C Approach Delay Approach LOS C A B Queue Length 50th (ft) Queue Length 95th (ft) m Internal Link Dist (ft) Turn Bay Length (ft) Base Capacity (vph) Starvation Cap Reductn Spillback Cap Reductn Storage Cap Reductn SAT Peak w/ Improvements Synchro 10 Report Page 4
368 Lanes, Volumes, Timings SAT SAT Peak Peak TWLT w/ Improvements Entire Length 4: Glenbrook Ave & County Line Rd & Thomas Ave & Conestoga Rd 02/28/2019 Lane Group SER2 NEL2 NEL NER NER2 Lane Configurations Traffic Volume (vph) Future Volume (vph) Ideal Flow (vphpl) Lane Width (ft) Grade (%) -1% Storage Length (ft) 0 0 Storage Lanes 1 0 Taper Length (ft) 25 Right Turn on Red No No Link Speed (mph) 25 Link Distance (ft) 393 Travel Time (s) 10.7 Lane Group Flow (vph) Turn Type Perm Perm Protected Phases Permitted Phases 4 4 Detector Phase 4 4 Switch Phase Minimum Initial (s) Minimum Split (s) Total Split (s) Total Split (%) 21.3% 21.3% Maximum Green (s) Yellow Time (s) All-Red Time (s) Lost Time Adjust (s) -4.5 Total Lost Time (s) 2.5 Lead/Lag Lead-Lag Optimize? Vehicle Extension (s) Recall Mode None None Act Effct Green (s) 13.8 Actuated g/c Ratio 0.17 v/c Ratio 0.45 Control Delay 35.2 Queue Delay 0.0 Total Delay 35.2 LOS D Approach Delay 35.2 Approach LOS D Queue Length 50th (ft) 56 Queue Length 95th (ft) 108 Internal Link Dist (ft) 313 Turn Bay Length (ft) Base Capacity (vph) 293 Starvation Cap Reductn 0 Spillback Cap Reductn 0 Storage Cap Reductn 0 SAT Peak w/ Improvements Synchro 10 Report Page 5
369 Lanes, Volumes, Timings SAT SAT Peak Peak TWLT w/ Improvements Entire Length 4: Glenbrook Ave & County Line Rd & Thomas Ave & Conestoga Rd 02/28/2019 Lane Group WBL2 WBL WBR WBR2 NBL NBT NBR SBL SBT SBR SBR2 SER Reduced v/c Ratio Intersection Summary Area Type: Other Cycle Length: 80 Actuated Cycle Length: 80 Offset: 0 (0%), Referenced to phase 2:SBTL and 6:NBTL, Start of Yellow Natural Cycle: 65 Control Type: Actuated-Coordinated Maximum v/c Ratio: 0.60 Intersection Signal Delay: 14.6 Intersection LOS: B Intersection Capacity Utilization 68.8% ICU Level of Service C Analysis Period (min) 15 m Volume for 95th percentile queue is metered by upstream signal. Splits and Phases: 4: Glenbrook Ave & County Line Rd & Thomas Ave & Conestoga Rd SAT Peak w/ Improvements Synchro 10 Report Page 6
370 Lanes, Volumes, Timings SAT SAT Peak Peak TWLT w/ Improvements Entire Length 4: Glenbrook Ave & County Line Rd & Thomas Ave & Conestoga Rd 02/28/2019 Lane Group SER2 NEL2 NEL NER NER2 Reduced v/c Ratio 0.43 Intersection Summary SAT Peak w/ Improvements Synchro 10 Report Page 7
371 HCM Signalized Intersection Capacity Analysis SAT SAT Peak Peak TWLT w/ Improvements Entire Length 4: Glenbrook Ave & County Line Rd & Thomas Ave & Conestoga Rd 02/28/2019 Movement WBL2 WBL WBR WBR2 NBL NBT NBR SBL SBT SBR SBR2 SER Lane Configurations Traffic Volume (vph) Future Volume (vph) Ideal Flow (vphpl) Lane Width Grade (%) 2% -1% 2% Total Lost time (s) Lane Util. Factor * Frt Flt Protected Satd. Flow (prot) Flt Permitted Satd. Flow (perm) Peak-hour factor, PHF Adj. Flow (vph) RTOR Reduction (vph) Lane Group Flow (vph) Heavy Vehicles (%) 0% 33% 0% 0% 0% 2% 0% 0% 1% 0% 0% 0% Turn Type Perm Perm pm+pt NA Perm NA Perm Protected Phases Permitted Phases Actuated Green, G (s) Effective Green, g (s) Actuated g/c Ratio Clearance Time (s) Vehicle Extension (s) Lane Grp Cap (vph) v/s Ratio Prot c0.24 v/s Ratio Perm c0.20 v/c Ratio Uniform Delay, d Progression Factor Incremental Delay, d Delay (s) Level of Service C A A B B C Approach Delay (s) Approach LOS C A B Intersection Summary HCM 2000 Control Delay 13.5 HCM 2000 Level of Service B HCM 2000 Volume to Capacity ratio 0.60 Actuated Cycle Length (s) 80.0 Sum of lost time (s) 12.0 Intersection Capacity Utilization 68.8% ICU Level of Service C Analysis Period (min) 15 c Critical Lane Group SAT Peak w/ Improvements Synchro 10 Report Page 8
372 HCM Signalized Intersection Capacity Analysis SAT SAT Peak Peak TWLT w/ Improvements Entire Length 4: Glenbrook Ave & County Line Rd & Thomas Ave & Conestoga Rd 02/28/2019 Movement SER2 NEL2 NEL NER NER2 Lane Configurations Traffic Volume (vph) Future Volume (vph) Ideal Flow (vphpl) Lane Width Grade (%) -1% Total Lost time (s) 2.5 Lane Util. Factor 1.00 Frt 0.92 Flt Protected 0.98 Satd. Flow (prot) 1616 Flt Permitted 0.98 Satd. Flow (perm) 1616 Peak-hour factor, PHF Adj. Flow (vph) RTOR Reduction (vph) Lane Group Flow (vph) Heavy Vehicles (%) 0% 0% 0% 0% 2% Turn Type Perm Perm Protected Phases Permitted Phases 4 4 Actuated Green, G (s) 7.9 Effective Green, g (s) 12.4 Actuated g/c Ratio 0.16 Clearance Time (s) 7.0 Vehicle Extension (s) 3.0 Lane Grp Cap (vph) 250 v/s Ratio Prot v/s Ratio Perm c0.08 v/c Ratio 0.50 Uniform Delay, d Progression Factor 1.00 Incremental Delay, d2 1.6 Delay (s) 32.6 Level of Service C Approach Delay (s) 32.6 Approach LOS C Intersection Summary SAT Peak w/ Improvements Synchro 10 Report Page 9
373 Lanes, Volumes, Timings SAT SAT Peak Peak TWLT w/ Improvements Entire Length 8: County Line Rd & Lindsay Ave 02/28/2019 Lane Group WBL WBR NBT NBR SBL SBT Lane Configurations Traffic Volume (vph) Future Volume (vph) Ideal Flow (vphpl) Lane Width (ft) Storage Length (ft) Storage Lanes Taper Length (ft) Right Turn on Red Yes Yes Link Speed (mph) Link Distance (ft) Travel Time (s) Lane Group Flow (vph) Turn Type Prot NA Perm NA Protected Phases Permitted Phases 2 Detector Phase Switch Phase Minimum Initial (s) Minimum Split (s) Total Split (s) Total Split (%) 41.0% 59.0% 59.0% 59.0% Maximum Green (s) Yellow Time (s) All-Red Time (s) Lost Time Adjust (s) Total Lost Time (s) Lead/Lag Lead-Lag Optimize? Vehicle Extension (s) Recall Mode None C-Max C-Max C-Max Act Effct Green (s) Actuated g/c Ratio v/c Ratio Control Delay Queue Delay Total Delay LOS A A A Approach Delay Approach LOS A A Queue Length 50th (ft) Queue Length 95th (ft) Internal Link Dist (ft) Turn Bay Length (ft) 75 Base Capacity (vph) Starvation Cap Reductn Spillback Cap Reductn Storage Cap Reductn Reduced v/c Ratio SAT Peak w/ Improvements Synchro 10 Report Page 10
374 Lanes, Volumes, Timings SAT SAT Peak Peak TWLT w/ Improvements Entire Length 8: County Line Rd & Lindsay Ave 02/28/2019 Intersection Summary Area Type: Other Cycle Length: 61 Actuated Cycle Length: 61 Offset: 30 (49%), Referenced to phase 2:SBTL and 6:NBT, Start of Yellow Natural Cycle: 40 Control Type: Actuated-Coordinated Maximum v/c Ratio: 0.40 Intersection Signal Delay: 0.7 Intersection LOS: A Intersection Capacity Utilization 38.8% ICU Level of Service A Analysis Period (min) 15 Splits and Phases: 8: County Line Rd & Lindsay Ave SAT Peak w/ Improvements Synchro 10 Report Page 11
375 HCM Signalized Intersection Capacity Analysis SAT SAT Peak Peak TWLT w/ Improvements Entire Length 8: County Line Rd & Lindsay Ave 02/28/2019 Movement WBL WBR NBT NBR SBL SBT Lane Configurations Traffic Volume (vph) Future Volume (vph) Ideal Flow (vphpl) Lane Width Total Lost time (s) Lane Util. Factor Frt Flt Protected Satd. Flow (prot) Flt Permitted Satd. Flow (perm) Peak-hour factor, PHF Adj. Flow (vph) RTOR Reduction (vph) Lane Group Flow (vph) Heavy Vehicles (%) 0% 0% 1% 0% 0% 1% Turn Type Prot NA Perm NA Protected Phases Permitted Phases 2 Actuated Green, G (s) Effective Green, g (s) Actuated g/c Ratio Clearance Time (s) Vehicle Extension (s) Lane Grp Cap (vph) v/s Ratio Prot 0.39 c0.40 v/s Ratio Perm 0.00 v/c Ratio Uniform Delay, d Progression Factor Incremental Delay, d Delay (s) Level of Service A A A Approach Delay (s) Approach LOS A A A Intersection Summary HCM 2000 Control Delay 0.7 HCM 2000 Level of Service A HCM 2000 Volume to Capacity ratio 0.44 Actuated Cycle Length (s) 61.0 Sum of lost time (s) 5.0 Intersection Capacity Utilization 38.8% ICU Level of Service A Analysis Period (min) 15 c Critical Lane Group SAT Peak w/ Improvements Synchro 10 Report Page 12
376 Lanes, Volumes, Timings SAT SAT Peak Peak TWLT w/ Improvements Entire Length 9: County Line Rd & Railroad Ave & Bryn Mawr Ave 02/28/2019 Lane Group EBL EBT EBR EBR2 WBL WBT WBR NBL NBT NBR NBR2 SBL2 Lane Configurations Traffic Volume (vph) Future Volume (vph) Ideal Flow (vphpl) Lane Width (ft) Storage Length (ft) Storage Lanes Taper Length (ft) Right Turn on Red Yes Yes Yes Link Speed (mph) Link Distance (ft) Travel Time (s) Lane Group Flow (vph) Turn Type pm+pt NA pm+pt NA Perm pm+pt NA pm+pt Protected Phases Permitted Phases Detector Phase Switch Phase Minimum Initial (s) Minimum Split (s) Total Split (s) Total Split (%) 14.4% 35.6% 14.4% 35.6% 35.6% 14.4% 35.6% 14.4% Maximum Green (s) Yellow Time (s) All-Red Time (s) Lost Time Adjust (s) Total Lost Time (s) Lead/Lag Lead Lag Lead Lag Lag Lead Lag Lead Lead-Lag Optimize? Vehicle Extension (s) Recall Mode None None None None None None C-Max None Act Effct Green (s) Actuated g/c Ratio v/c Ratio Control Delay Queue Delay Total Delay LOS B C B C A B D Approach Delay Approach LOS C C D Queue Length 50th (ft) Queue Length 95th (ft) #569 Internal Link Dist (ft) Turn Bay Length (ft) Base Capacity (vph) Starvation Cap Reductn Spillback Cap Reductn Storage Cap Reductn Reduced v/c Ratio SAT Peak w/ Improvements Synchro 10 Report Page 13
377 Lanes, Volumes, Timings SAT SAT Peak Peak TWLT w/ Improvements Entire Length 9: County Line Rd & Railroad Ave & Bryn Mawr Ave 02/28/2019 Lane Group SBL SBT SBR Lane Configurations Traffic Volume (vph) Future Volume (vph) Ideal Flow (vphpl) Lane Width (ft) Storage Length (ft) 50 0 Storage Lanes 1 0 Taper Length (ft) 25 Right Turn on Red Yes Link Speed (mph) 25 Link Distance (ft) 198 Travel Time (s) 5.4 Lane Group Flow (vph) Turn Type pm+pt NA Protected Phases 5 2 Permitted Phases 2 2 Detector Phase 5 2 Switch Phase Minimum Initial (s) Minimum Split (s) Total Split (s) Total Split (%) 14.4% 35.6% Maximum Green (s) Yellow Time (s) All-Red Time (s) Lost Time Adjust (s) Total Lost Time (s) Lead/Lag Lead Lag Lead-Lag Optimize? Vehicle Extension (s) Recall Mode None C-Max Act Effct Green (s) Actuated g/c Ratio v/c Ratio Control Delay Queue Delay Total Delay LOS C B Approach Delay 20.5 Approach LOS C Queue Length 50th (ft) 13 0 Queue Length 95th (ft) m16 m#93 Internal Link Dist (ft) 118 Turn Bay Length (ft) 50 Base Capacity (vph) Starvation Cap Reductn 0 57 Spillback Cap Reductn 0 0 Storage Cap Reductn 0 0 Reduced v/c Ratio SAT Peak w/ Improvements Synchro 10 Report Page 14
378 Lanes, Volumes, Timings SAT SAT Peak Peak TWLT w/ Improvements Entire Length 9: County Line Rd & Railroad Ave & Bryn Mawr Ave 02/28/2019 Intersection Summary Area Type: Other Cycle Length: 90 Actuated Cycle Length: 90 Offset: 26 (29%), Referenced to phase 2:SBTL and 6:NBTL, Start of Yellow Natural Cycle: 70 Control Type: Actuated-Coordinated Maximum v/c Ratio: 0.94 Intersection Signal Delay: 27.2 Intersection LOS: C Intersection Capacity Utilization 76.7% ICU Level of Service D Analysis Period (min) 15 # 95th percentile volume exceeds capacity, queue may be longer. Queue shown is maximum after two cycles. m Volume for 95th percentile queue is metered by upstream signal. Splits and Phases: 9: County Line Rd & Railroad Ave & Bryn Mawr Ave SAT Peak w/ Improvements Synchro 10 Report Page 15
379 HCM Signalized Intersection Capacity Analysis SAT SAT Peak Peak TWLT w/ Improvements Entire Length 9: County Line Rd & Railroad Ave & Bryn Mawr Ave 02/28/2019 Movement EBL EBT EBR EBR2 WBL WBT WBR NBL NBT NBR NBR2 SBL2 Lane Configurations Traffic Volume (vph) Future Volume (vph) Ideal Flow (vphpl) Lane Width Total Lost time (s) Lane Util. Factor Frt Flt Protected Satd. Flow (prot) Flt Permitted Satd. Flow (perm) Peak-hour factor, PHF Adj. Flow (vph) RTOR Reduction (vph) Lane Group Flow (vph) Heavy Vehicles (%) 1% 0% 0% 0% 0% 2% 0% 2% 0% 1% 2% 2% Turn Type pm+pt NA pm+pt NA Perm pm+pt NA pm+pt Protected Phases Permitted Phases Actuated Green, G (s) Effective Green, g (s) Actuated g/c Ratio Clearance Time (s) Vehicle Extension (s) Lane Grp Cap (vph) v/s Ratio Prot c0.04 c c0.04 c0.35 v/s Ratio Perm v/c Ratio Uniform Delay, d Progression Factor Incremental Delay, d Delay (s) Level of Service B C C C C B D Approach Delay (s) Approach LOS C C D Intersection Summary HCM 2000 Control Delay 26.9 HCM 2000 Level of Service C HCM 2000 Volume to Capacity ratio 0.79 Actuated Cycle Length (s) 90.0 Sum of lost time (s) 20.5 Intersection Capacity Utilization 76.7% ICU Level of Service D Analysis Period (min) 15 c Critical Lane Group SAT Peak w/ Improvements Synchro 10 Report Page 16
380 HCM Signalized Intersection Capacity Analysis SAT SAT Peak Peak TWLT w/ Improvements Entire Length 9: County Line Rd & Railroad Ave & Bryn Mawr Ave 02/28/2019 Movement SBL SBT SBR Lane Configurations Traffic Volume (vph) Future Volume (vph) Ideal Flow (vphpl) Lane Width Total Lost time (s) Lane Util. Factor Frt Flt Protected Satd. Flow (prot) Flt Permitted Satd. Flow (perm) Peak-hour factor, PHF Adj. Flow (vph) RTOR Reduction (vph) Lane Group Flow (vph) Heavy Vehicles (%) 1% 4% 0% Turn Type pm+pt NA Protected Phases 5 2 Permitted Phases 2 2 Actuated Green, G (s) Effective Green, g (s) Actuated g/c Ratio Clearance Time (s) Vehicle Extension (s) Lane Grp Cap (vph) v/s Ratio Prot v/s Ratio Perm 0.15 v/c Ratio Uniform Delay, d Progression Factor Incremental Delay, d Delay (s) Level of Service C B Approach Delay (s) 15.6 Approach LOS B Intersection Summary SAT Peak w/ Improvements Synchro 10 Report Page 17
381 Lanes, Volumes, Timings SAT SAT Peak Peak TWLT w/ Improvements Entire Length 11: County Line Rd & Glenbrook Ave 02/28/2019 Lane Group EBL EBR NBL NBT SBT SBR Ø3 Ø4 Ø5 Ø7 Ø8 Lane Configurations Traffic Volume (vph) Future Volume (vph) Ideal Flow (vphpl) Lane Width (ft) Storage Length (ft) Storage Lanes Taper Length (ft) Right Turn on Red Yes Yes Link Speed (mph) Link Distance (ft) Travel Time (s) Lane Group Flow (vph) Turn Type pm+pt NA NA Protected Phases Permitted Phases Detector Phase Switch Phase Minimum Initial (s) Minimum Split (s) Total Split (s) Total Split (%) 14.4% 35.6% 35.6% 14% 36% 14% 14% 36% Maximum Green (s) Yellow Time (s) All-Red Time (s) Lost Time Adjust (s) Total Lost Time (s) Lead/Lag Lead Lag Lag Lead Lag Lead Lead Lag Lead-Lag Optimize? Vehicle Extension (s) Recall Mode None C-Max C-Max None None None None None Act Effct Green (s) Actuated g/c Ratio v/c Ratio Control Delay Queue Delay Total Delay LOS B A F Approach Delay Approach LOS A F Queue Length 50th (ft) 9 1 ~413 Queue Length 95th (ft) m18 m49 #660 Internal Link Dist (ft) Turn Bay Length (ft) 45 Base Capacity (vph) Starvation Cap Reductn Spillback Cap Reductn Storage Cap Reductn Reduced v/c Ratio SAT Peak w/ Improvements Synchro 10 Report Page 18
382 Lanes, Volumes, Timings SAT SAT Peak Peak TWLT w/ Improvements Entire Length 11: County Line Rd & Glenbrook Ave 02/28/2019 Intersection Summary Area Type: Other Cycle Length: 90 Actuated Cycle Length: 90 Offset: 26 (29%), Referenced to phase 2:SBTL and 6:NBTL, Start of Yellow Natural Cycle: 70 Control Type: Actuated-Coordinated Maximum v/c Ratio: 0.94 Intersection Signal Delay: 45.3 Intersection LOS: D Intersection Capacity Utilization 42.1% ICU Level of Service A Analysis Period (min) 15 ~ Volume exceeds capacity, queue is theoretically infinite. Queue shown is maximum after two cycles. # 95th percentile volume exceeds capacity, queue may be longer. Queue shown is maximum after two cycles. m Volume for 95th percentile queue is metered by upstream signal. Splits and Phases: 11: County Line Rd & Glenbrook Ave SAT Peak w/ Improvements Synchro 10 Report Page 19
383 HCM Signalized Intersection Capacity Analysis SAT SAT Peak Peak TWLT w/ Improvements Entire Length 11: County Line Rd & Glenbrook Ave 02/28/2019 Movement EBL EBR NBL NBT SBT SBR Lane Configurations Traffic Volume (vph) Future Volume (vph) Ideal Flow (vphpl) Lane Width Total Lost time (s) Lane Util. Factor Frt Flt Protected Satd. Flow (prot) Flt Permitted Satd. Flow (perm) Peak-hour factor, PHF Adj. Flow (vph) RTOR Reduction (vph) Lane Group Flow (vph) Turn Type pm+pt NA NA Protected Phases Permitted Phases Actuated Green, G (s) Effective Green, g (s) Actuated g/c Ratio Clearance Time (s) Vehicle Extension (s) Lane Grp Cap (vph) v/s Ratio Prot 0.01 c0.19 c0.39 v/s Ratio Perm v/c Ratio Uniform Delay, d Progression Factor Incremental Delay, d Delay (s) Level of Service C C E Approach Delay (s) Approach LOS A C E Intersection Summary HCM 2000 Control Delay 46.1 HCM 2000 Level of Service D HCM 2000 Volume to Capacity ratio 0.86 Actuated Cycle Length (s) 90.0 Sum of lost time (s) 21.0 Intersection Capacity Utilization 42.1% ICU Level of Service A Analysis Period (min) 15 c Critical Lane Group SAT Peak w/ Improvements Synchro 10 Report Page 20
384 Sim Traffic Travel Time Analysis
385 Arterial Level of Service Existing AM Peak - Run 1 Baseline 03/06/2019 Arterial Level of Service: NB County Line Rd Delay Travel Dist Arterial Cross Street Node (s/veh) time (s) (mi) Speed County Line Rd Railroad Ave Glenbrook Ave Lindsay Ave Mondella Ave Old Lancaster Rd S Warner Ave Thomas Ave Roberts Rd Montrose Ave Lancaster Ave Total Arterial Level of Service: SB County Line Rd Delay Travel Dist Arterial Cross Street Node (s/veh) time (s) (mi) Speed Conestoga Rd S Warner Ave Old Lancaster Rd Mondella Ave Lindsay Ave Glenbrook Ave Bryn Mawr Ave Landover Rd Total Existing AM Peak SimTraffic Report Page 1
386 Arterial Level of Service Existing AM Peak - Run 2 Baseline 03/06/2019 Arterial Level of Service: NB County Line Rd Delay Travel Dist Arterial Cross Street Node (s/veh) time (s) (mi) Speed County Line Rd Railroad Ave Glenbrook Ave Lindsay Ave Mondella Ave Old Lancaster Rd S Warner Ave Thomas Ave Roberts Rd Montrose Ave Lancaster Ave Total Arterial Level of Service: SB County Line Rd Delay Travel Dist Arterial Cross Street Node (s/veh) time (s) (mi) Speed Conestoga Rd S Warner Ave Old Lancaster Rd Mondella Ave Lindsay Ave Glenbrook Ave Bryn Mawr Ave Landover Rd Total Existing AM Peak SimTraffic Report Page 1
387 Arterial Level of Service Existing AM Peak - Run 3 Baseline 03/06/2019 Arterial Level of Service: NB County Line Rd Delay Travel Dist Arterial Cross Street Node (s/veh) time (s) (mi) Speed County Line Rd Railroad Ave Glenbrook Ave Lindsay Ave Mondella Ave Old Lancaster Rd S Warner Ave Thomas Ave Roberts Rd Montrose Ave Lancaster Ave Total Arterial Level of Service: SB County Line Rd Delay Travel Dist Arterial Cross Street Node (s/veh) time (s) (mi) Speed Conestoga Rd S Warner Ave Old Lancaster Rd Mondella Ave Lindsay Ave Glenbrook Ave Bryn Mawr Ave Landover Rd Total Existing AM Peak SimTraffic Report Page 1
388 Arterial Level of Service Existing AM Peak - Run 4 Baseline 03/06/2019 Arterial Level of Service: NB County Line Rd Delay Travel Dist Arterial Cross Street Node (s/veh) time (s) (mi) Speed County Line Rd Railroad Ave Glenbrook Ave Lindsay Ave Mondella Ave Old Lancaster Rd S Warner Ave Thomas Ave Roberts Rd Montrose Ave Lancaster Ave Total Arterial Level of Service: SB County Line Rd Delay Travel Dist Arterial Cross Street Node (s/veh) time (s) (mi) Speed Conestoga Rd S Warner Ave Old Lancaster Rd Mondella Ave Lindsay Ave Glenbrook Ave Bryn Mawr Ave Landover Rd Total Existing AM Peak SimTraffic Report Page 1
389 Arterial Level of Service Existing AM Peak - Run 5 Baseline 03/06/2019 Arterial Level of Service: NB County Line Rd Delay Travel Dist Arterial Cross Street Node (s/veh) time (s) (mi) Speed County Line Rd Railroad Ave Glenbrook Ave Lindsay Ave Mondella Ave Old Lancaster Rd S Warner Ave Thomas Ave Roberts Rd Montrose Ave Lancaster Ave Total Arterial Level of Service: SB County Line Rd Delay Travel Dist Arterial Cross Street Node (s/veh) time (s) (mi) Speed Conestoga Rd S Warner Ave Old Lancaster Rd Mondella Ave Lindsay Ave Glenbrook Ave Bryn Mawr Ave Landover Rd Total Existing AM Peak SimTraffic Report Page 1
390 Arterial Level of Service Existing PM Peak - Run 1 Baseline 03/06/2019 Arterial Level of Service: NB County Line Rd Delay Travel Dist Arterial Cross Street Node (s/veh) time (s) (mi) Speed County Line Rd Railroad Ave Glenbrook Ave Lindsay Ave Mondella Ave Old Lancaster Rd S Warner Ave Thomas Ave Roberts Rd Montrose Ave Lancaster Ave Total Arterial Level of Service: SB County Line Rd Delay Travel Dist Arterial Cross Street Node (s/veh) time (s) (mi) Speed Conestoga Rd S Warner Ave Old Lancaster Rd Mondella Ave Lindsay Ave Glenbrook Ave Bryn Mawr Ave Landover Rd Total Existing PM Peak SimTraffic Report Page 1
391 Arterial Level of Service Existing PM Peak - Run 2 Baseline 03/06/2019 Arterial Level of Service: NB County Line Rd Delay Travel Dist Arterial Cross Street Node (s/veh) time (s) (mi) Speed County Line Rd Railroad Ave Glenbrook Ave Lindsay Ave Mondella Ave Old Lancaster Rd S Warner Ave Thomas Ave Roberts Rd Montrose Ave Lancaster Ave Total Arterial Level of Service: SB County Line Rd Delay Travel Dist Arterial Cross Street Node (s/veh) time (s) (mi) Speed Conestoga Rd S Warner Ave Old Lancaster Rd Mondella Ave Lindsay Ave Glenbrook Ave Bryn Mawr Ave Landover Rd Total Existing PM Peak SimTraffic Report Page 1
392 Arterial Level of Service Existing PM Peak - Run 3 Baseline 03/06/2019 Arterial Level of Service: NB County Line Rd Delay Travel Dist Arterial Cross Street Node (s/veh) time (s) (mi) Speed County Line Rd Railroad Ave Glenbrook Ave Lindsay Ave Mondella Ave Old Lancaster Rd S Warner Ave Thomas Ave Roberts Rd Montrose Ave Lancaster Ave Total Arterial Level of Service: SB County Line Rd Delay Travel Dist Arterial Cross Street Node (s/veh) time (s) (mi) Speed Conestoga Rd S Warner Ave Old Lancaster Rd Mondella Ave Lindsay Ave Glenbrook Ave Bryn Mawr Ave Landover Rd Total Existing PM Peak SimTraffic Report Page 1
393 Arterial Level of Service Existing PM Peak - Run 4 Baseline 03/06/2019 Arterial Level of Service: NB County Line Rd Delay Travel Dist Arterial Cross Street Node (s/veh) time (s) (mi) Speed County Line Rd Railroad Ave Glenbrook Ave Lindsay Ave Mondella Ave Old Lancaster Rd S Warner Ave Thomas Ave Roberts Rd Montrose Ave Lancaster Ave Total Arterial Level of Service: SB County Line Rd Delay Travel Dist Arterial Cross Street Node (s/veh) time (s) (mi) Speed Conestoga Rd S Warner Ave Old Lancaster Rd Mondella Ave Lindsay Ave Glenbrook Ave Bryn Mawr Ave Landover Rd Total Existing PM Peak SimTraffic Report Page 1
394 Arterial Level of Service Existing PM Peak - Run 5 Baseline 03/06/2019 Arterial Level of Service: NB County Line Rd Delay Travel Dist Arterial Cross Street Node (s/veh) time (s) (mi) Speed County Line Rd Railroad Ave Glenbrook Ave Lindsay Ave Mondella Ave Old Lancaster Rd S Warner Ave Thomas Ave Roberts Rd Montrose Ave Lancaster Ave Total Arterial Level of Service: SB County Line Rd Delay Travel Dist Arterial Cross Street Node (s/veh) time (s) (mi) Speed Conestoga Rd S Warner Ave Old Lancaster Rd Mondella Ave Lindsay Ave Glenbrook Ave Bryn Mawr Ave Landover Rd Total Existing PM Peak SimTraffic Report Page 1
395 Arterial Level of Service Existing SAT Midday Peak - Run 1 Baseline 03/06/2019 Arterial Level of Service: NB County Line Rd Delay Travel Dist Arterial Cross Street Node (s/veh) time (s) (mi) Speed County Line Rd Railroad Ave Glenbrook Ave Lindsay Ave Mondella Ave Old Lancaster Rd S Warner Ave Thomas Ave Roberts Rd Montrose Ave Lancaster Ave Total Arterial Level of Service: SB County Line Rd Delay Travel Dist Arterial Cross Street Node (s/veh) time (s) (mi) Speed Conestoga Rd S Warner Ave Old Lancaster Rd Mondella Ave Lindsay Ave Glenbrook Ave Bryn Mawr Ave Landover Rd Total Existing SAT Midday Peak SimTraffic Report Page 1
396 Arterial Level of Service Existing SAT Midday Peak - Run 2 Baseline 03/06/2019 Arterial Level of Service: NB County Line Rd Delay Travel Dist Arterial Cross Street Node (s/veh) time (s) (mi) Speed County Line Rd Railroad Ave Glenbrook Ave Lindsay Ave Mondella Ave Old Lancaster Rd S Warner Ave Thomas Ave Roberts Rd Montrose Ave Lancaster Ave Total Arterial Level of Service: SB County Line Rd Delay Travel Dist Arterial Cross Street Node (s/veh) time (s) (mi) Speed Conestoga Rd S Warner Ave Old Lancaster Rd Mondella Ave Lindsay Ave Glenbrook Ave Bryn Mawr Ave Landover Rd Total Existing SAT Midday Peak SimTraffic Report Page 1
397 Arterial Level of Service Existing SAT Midday Peak - Run 3 Baseline 03/06/2019 Arterial Level of Service: NB County Line Rd Delay Travel Dist Arterial Cross Street Node (s/veh) time (s) (mi) Speed County Line Rd Railroad Ave Glenbrook Ave Lindsay Ave Mondella Ave Old Lancaster Rd S Warner Ave Thomas Ave Roberts Rd Montrose Ave Lancaster Ave Total Arterial Level of Service: SB County Line Rd Delay Travel Dist Arterial Cross Street Node (s/veh) time (s) (mi) Speed Conestoga Rd S Warner Ave Old Lancaster Rd Mondella Ave Lindsay Ave Glenbrook Ave Bryn Mawr Ave Landover Rd Total Existing SAT Midday Peak SimTraffic Report Page 1
398 Arterial Level of Service Existing SAT Midday Peak - Run 4 Baseline 03/06/2019 Arterial Level of Service: NB County Line Rd Delay Travel Dist Arterial Cross Street Node (s/veh) time (s) (mi) Speed County Line Rd Railroad Ave Glenbrook Ave Lindsay Ave Mondella Ave Old Lancaster Rd S Warner Ave Thomas Ave Roberts Rd Montrose Ave Lancaster Ave Total Arterial Level of Service: SB County Line Rd Delay Travel Dist Arterial Cross Street Node (s/veh) time (s) (mi) Speed Conestoga Rd S Warner Ave Old Lancaster Rd Mondella Ave Lindsay Ave Glenbrook Ave Bryn Mawr Ave Landover Rd Total Existing SAT Midday Peak SimTraffic Report Page 1
399 Arterial Level of Service Existing SAT Midday Peak - Run 5 Baseline 03/06/2019 Arterial Level of Service: NB County Line Rd Delay Travel Dist Arterial Cross Street Node (s/veh) time (s) (mi) Speed County Line Rd Railroad Ave Glenbrook Ave Lindsay Ave Mondella Ave Old Lancaster Rd S Warner Ave Thomas Ave Roberts Rd Montrose Ave Lancaster Ave Total Arterial Level of Service: SB County Line Rd Delay Travel Dist Arterial Cross Street Node (s/veh) time (s) (mi) Speed Conestoga Rd S Warner Ave Old Lancaster Rd Mondella Ave Lindsay Ave Glenbrook Ave Bryn Mawr Ave Landover Rd Total Existing SAT Midday Peak SimTraffic Report Page 1
400 Arterial Level of Service AM Peak w/ Improvements - Run 1 Baseline 03/06/2019 Arterial Level of Service: NB County Line Rd Delay Travel Dist Arterial Cross Street Node (s/veh) time (s) (mi) Speed County Line Rd Railroad Ave Glenbrook Ave Lindsay Ave Mondella Ave Old Lancaster Rd S Warner Ave Thomas Ave Roberts Rd Montrose Ave Lancaster Ave Total Arterial Level of Service: SB County Line Rd Delay Travel Dist Arterial Cross Street Node (s/veh) time (s) (mi) Speed Conestoga Rd S Warner Ave Old Lancaster Rd Mondella Ave Lindsay Ave Glenbrook Ave Bryn Mawr Ave Landover Rd Total AM Peak w/ Improvements SimTraffic Report Page 1
401 Arterial Level of Service AM Peak w/ Improvements - Run 2 Baseline 03/06/2019 Arterial Level of Service: NB County Line Rd Delay Travel Dist Arterial Cross Street Node (s/veh) time (s) (mi) Speed County Line Rd Railroad Ave Glenbrook Ave Lindsay Ave Mondella Ave Old Lancaster Rd S Warner Ave Thomas Ave Roberts Rd Montrose Ave Lancaster Ave Total Arterial Level of Service: SB County Line Rd Delay Travel Dist Arterial Cross Street Node (s/veh) time (s) (mi) Speed Conestoga Rd S Warner Ave Old Lancaster Rd Mondella Ave Lindsay Ave Glenbrook Ave Bryn Mawr Ave Landover Rd Total AM Peak w/ Improvements SimTraffic Report Page 1
402 Arterial Level of Service AM Peak w/ Improvements - Run 3 Baseline 03/06/2019 Arterial Level of Service: NB County Line Rd Delay Travel Dist Arterial Cross Street Node (s/veh) time (s) (mi) Speed County Line Rd Railroad Ave Glenbrook Ave Lindsay Ave Mondella Ave Old Lancaster Rd S Warner Ave Thomas Ave Roberts Rd Montrose Ave Lancaster Ave Total Arterial Level of Service: SB County Line Rd Delay Travel Dist Arterial Cross Street Node (s/veh) time (s) (mi) Speed Conestoga Rd S Warner Ave Old Lancaster Rd Mondella Ave Lindsay Ave Glenbrook Ave Bryn Mawr Ave Landover Rd Total AM Peak w/ Improvements SimTraffic Report Page 1
403 Arterial Level of Service AM Peak w/ Improvements - Run 4 Baseline 03/06/2019 Arterial Level of Service: NB County Line Rd Delay Travel Dist Arterial Cross Street Node (s/veh) time (s) (mi) Speed County Line Rd Railroad Ave Glenbrook Ave Lindsay Ave Mondella Ave Old Lancaster Rd S Warner Ave Thomas Ave Roberts Rd Montrose Ave Lancaster Ave Total Arterial Level of Service: SB County Line Rd Delay Travel Dist Arterial Cross Street Node (s/veh) time (s) (mi) Speed Conestoga Rd S Warner Ave Old Lancaster Rd Mondella Ave Lindsay Ave Glenbrook Ave Bryn Mawr Ave Landover Rd Total AM Peak w/ Improvements SimTraffic Report Page 1
404 Arterial Level of Service AM Peak w/ Improvements - Run 5 Baseline 03/06/2019 Arterial Level of Service: NB County Line Rd Delay Travel Dist Arterial Cross Street Node (s/veh) time (s) (mi) Speed County Line Rd Railroad Ave Glenbrook Ave Lindsay Ave Mondella Ave Old Lancaster Rd S Warner Ave Thomas Ave Roberts Rd Montrose Ave Lancaster Ave Total Arterial Level of Service: SB County Line Rd Delay Travel Dist Arterial Cross Street Node (s/veh) time (s) (mi) Speed Conestoga Rd S Warner Ave Old Lancaster Rd Mondella Ave Lindsay Ave Glenbrook Ave Bryn Mawr Ave Landover Rd Total AM Peak w/ Improvements SimTraffic Report Page 1
405 Arterial Level of Service PM Peak w/ Improvements - Run 1 Baseline 03/06/2019 Arterial Level of Service: NB County Line Road Delay Travel Dist Arterial Cross Street Node (s/veh) time (s) (mi) Speed County Line Rd Railroad Ave Glenbrook Ave Lindsay Ave Mondella Ave Old Lancaster Rd S Warner Ave Thomas Ave Roberts Rd Montrose Ave Lancaster Ave Total Arterial Level of Service: SB County Line Road Delay Travel Dist Arterial Cross Street Node (s/veh) time (s) (mi) Speed Conestoga Rd S Warner Ave Old Lancaster Rd Mondella Ave Lindsay Ave Glenbrook Ave Bryn Mawr Ave Landover Rd Total PM Peak w/ Improvements SimTraffic Report Page 1
406 Arterial Level of Service PM Peak w/ Improvements - Run 2 Baseline 03/06/2019 Arterial Level of Service: NB County Line Road Delay Travel Dist Arterial Cross Street Node (s/veh) time (s) (mi) Speed County Line Rd Railroad Ave Glenbrook Ave Lindsay Ave Mondella Ave Old Lancaster Rd S Warner Ave Thomas Ave Roberts Rd Montrose Ave Lancaster Ave Total Arterial Level of Service: SB County Line Road Delay Travel Dist Arterial Cross Street Node (s/veh) time (s) (mi) Speed Conestoga Rd S Warner Ave Old Lancaster Rd Mondella Ave Lindsay Ave Glenbrook Ave Bryn Mawr Ave Landover Rd Total PM Peak w/ Improvements SimTraffic Report Page 1
407 Arterial Level of Service PM Peak w/ Improvements - Run 3 Baseline 03/06/2019 Arterial Level of Service: NB County Line Road Delay Travel Dist Arterial Cross Street Node (s/veh) time (s) (mi) Speed County Line Rd Railroad Ave Glenbrook Ave Lindsay Ave Mondella Ave Old Lancaster Rd S Warner Ave Thomas Ave Roberts Rd Montrose Ave Lancaster Ave Total Arterial Level of Service: SB County Line Road Delay Travel Dist Arterial Cross Street Node (s/veh) time (s) (mi) Speed Conestoga Rd S Warner Ave Old Lancaster Rd Mondella Ave Lindsay Ave Glenbrook Ave Bryn Mawr Ave Landover Rd Total PM Peak w/ Improvements SimTraffic Report Page 1
408 Arterial Level of Service PM Peak w/ Improvements - Run 4 Baseline 03/06/2019 Arterial Level of Service: NB County Line Road Delay Travel Dist Arterial Cross Street Node (s/veh) time (s) (mi) Speed County Line Rd Railroad Ave Glenbrook Ave Lindsay Ave Mondella Ave Old Lancaster Rd S Warner Ave Thomas Ave Roberts Rd Montrose Ave Lancaster Ave Total Arterial Level of Service: SB County Line Road Delay Travel Dist Arterial Cross Street Node (s/veh) time (s) (mi) Speed Conestoga Rd S Warner Ave Old Lancaster Rd Mondella Ave Lindsay Ave Glenbrook Ave Bryn Mawr Ave Landover Rd Total PM Peak w/ Improvements SimTraffic Report Page 1
409 Arterial Level of Service PM Peak w/ Improvements - Run 5 Baseline 03/06/2019 Arterial Level of Service: NB County Line Road Delay Travel Dist Arterial Cross Street Node (s/veh) time (s) (mi) Speed County Line Rd Railroad Ave Glenbrook Ave Lindsay Ave Mondella Ave Old Lancaster Rd S Warner Ave Thomas Ave Roberts Rd Montrose Ave Lancaster Ave Total Arterial Level of Service: SB County Line Road Delay Travel Dist Arterial Cross Street Node (s/veh) time (s) (mi) Speed Conestoga Rd S Warner Ave Old Lancaster Rd Mondella Ave Lindsay Ave Glenbrook Ave Bryn Mawr Ave Landover Rd Total PM Peak w/ Improvements SimTraffic Report Page 1
410 Arterial Level of Service SAT Peak w/ Improvements - Run 1 Baseline 03/06/2019 Arterial Level of Service: NB County Line Rd Delay Travel Dist Arterial Cross Street Node (s/veh) time (s) (mi) Speed County Line Rd Railroad Ave Glenbrook Ave Lindsay Ave Mondella Ave Old Lancaster Rd S Warner Ave Thomas Ave Roberts Rd Montrose Ave Lancaster Ave Total Arterial Level of Service: SB County Line Rd Delay Travel Dist Arterial Cross Street Node (s/veh) time (s) (mi) Speed Conestoga Rd S Warner Ave Old Lancaster Rd Mondella Ave Lindsay Ave Glenbrook Ave Bryn Mawr Ave Landover Rd Total SAT Peak w/ Improvements SimTraffic Report Page 1
411 Arterial Level of Service SAT Peak w/ Improvements - Run 2 Baseline 03/06/2019 Arterial Level of Service: NB County Line Rd Delay Travel Dist Arterial Cross Street Node (s/veh) time (s) (mi) Speed County Line Rd Railroad Ave Glenbrook Ave Lindsay Ave Mondella Ave Old Lancaster Rd S Warner Ave Thomas Ave Roberts Rd Montrose Ave Lancaster Ave Total Arterial Level of Service: SB County Line Rd Delay Travel Dist Arterial Cross Street Node (s/veh) time (s) (mi) Speed Conestoga Rd S Warner Ave Old Lancaster Rd Mondella Ave Lindsay Ave Glenbrook Ave Bryn Mawr Ave Landover Rd Total SAT Peak w/ Improvements SimTraffic Report Page 1
412 Arterial Level of Service SAT Peak w/ Improvements - Run 3 Baseline 03/06/2019 Arterial Level of Service: NB County Line Rd Delay Travel Dist Arterial Cross Street Node (s/veh) time (s) (mi) Speed County Line Rd Railroad Ave Glenbrook Ave Lindsay Ave Mondella Ave Old Lancaster Rd S Warner Ave Thomas Ave Roberts Rd Montrose Ave Lancaster Ave Total Arterial Level of Service: SB County Line Rd Delay Travel Dist Arterial Cross Street Node (s/veh) time (s) (mi) Speed Conestoga Rd S Warner Ave Old Lancaster Rd Mondella Ave Lindsay Ave Glenbrook Ave Bryn Mawr Ave Landover Rd Total SAT Peak w/ Improvements SimTraffic Report Page 1
413 Arterial Level of Service SAT Peak w/ Improvements - Run 4 Baseline 03/06/2019 Arterial Level of Service: NB County Line Rd Delay Travel Dist Arterial Cross Street Node (s/veh) time (s) (mi) Speed County Line Rd Railroad Ave Glenbrook Ave Lindsay Ave Mondella Ave Old Lancaster Rd S Warner Ave Thomas Ave Roberts Rd Montrose Ave Lancaster Ave Total Arterial Level of Service: SB County Line Rd Delay Travel Dist Arterial Cross Street Node (s/veh) time (s) (mi) Speed Conestoga Rd S Warner Ave Old Lancaster Rd Mondella Ave Lindsay Ave Glenbrook Ave Bryn Mawr Ave Landover Rd Total SAT Peak w/ Improvements SimTraffic Report Page 1
414 Arterial Level of Service SAT Peak w/ Improvements - Run 5 Baseline 03/06/2019 Arterial Level of Service: NB County Line Rd Delay Travel Dist Arterial Cross Street Node (s/veh) time (s) (mi) Speed County Line Rd Railroad Ave Glenbrook Ave Lindsay Ave Mondella Ave Old Lancaster Rd S Warner Ave Thomas Ave Roberts Rd Montrose Ave Lancaster Ave Total Arterial Level of Service: SB County Line Rd Delay Travel Dist Arterial Cross Street Node (s/veh) time (s) (mi) Speed Conestoga Rd S Warner Ave Old Lancaster Rd Mondella Ave Lindsay Ave Glenbrook Ave Bryn Mawr Ave Landover Rd Total SAT Peak w/ Improvements SimTraffic Report Page 1
415 APPENDIX I Level of Service and Delay
416 Intersection AM Peak Hour LOS (seconds) Existing LOS PM Peak Hour LOS (seconds) SAT Peak Hour LOS (seconds) Existing w/ Improvements LOS AM Peak Hour LOS (seconds) PM Peak Hour LOS (seconds) SAT Peak Hour LOS (seconds) Lancaster Avenue (S.R. 0030) 2 C (20.3) C (23.0) B (16.0) C (20.4) C (24.3) B (16.0) Eastbound Thru Eastbound Thru/Right Westbound Left Westbound Thru/RIght Northbound Left C (20.8) B (15.2) C (23.9) C (25.6) B (11.0) C (27.7) B (12.5) B (10.5) C (28.0) C (21.7) B (15.8) C (22.3) C (27.6) B (11.6) C (28.1) B (12.5) B (10.5) C (28.1) Northbound Left/Thru/Right C (24.1) C (28.1) C (28.4) C (22.5) C (28.3) C (28.5) Southbound Left/Thru/Right C (34.2) C (34.2) C (34.3) C (32.2) C (32.2) C (34.3) Montrose Avenue 1/2 B (7.8) B (12.4) A (2.7) B (11.7) B (10.4) A (6.9) Eastbound Left/Thru/Right F (51.7) F (88.1) C (19.1) D (36.0) C (33.3) D (37.8) Westbound Left/Thru/Right E (38.4) F (62.0) C (17.7) C (31.6) C (29.6) D (36.5) Northbound Left/Thru A (8.5) A (9.6) A (8.2) A (7.5) A (4.6) A (0.2) Northbound Thru/Right A (0.1) A (0.2) A (0.0) A (8.0) A (1.1) A (0.8) Southbound Left/Thru A (9.1) A (8.4) A (8.6) B (10.3) A (3.7) A (2.3) Southbound Thru/Right A (0.1) A (0.1) A (0.0) A (6.2) A (9.9) A (3.4) South Roberts Road 1 B (16.2) A (3.4) A (3.0) C (26.3) A (4.3) A (3.8) Eastbound Left/Thru/Right F (109.7) D (33.2) C (19.2) F (181.8) E (44.0) D (28.6) Westbound Left/Thru/Right D (27.3) D (27.9) C (20.4) D (32.1) D (32.8) C (22.1) Northbound Left/Thru A (8.5) A (0.0) A (8.2) A (8.5) A (0.0) A (8.2) Northbound Thru/Right A (0.0) A (0.0) A (0.0) A (0.0) A (0.0) A (0.0) Southbound Left/Thru A (8.8) A (8.7) A (8.6) A (8.8) A (8.7) A (8.5) Southbound Thru/Right A (0.1) A (0.0) A (0.1) A (0.0) A (0.0) A (0.0) Conestoga Road (S.R. 1019) & Glenbrook Avenue & Thomas Avenue 2 B (15.8) B (19.1) B (13.8) B (14.3) B (17.0) B (12.1) Westbound Left/Thru/Right C (25.5) C (30.7) C (27.1) C (28.8) D (42.9) C (29.4) Northeastbound Left/Thru/Right C (28.2) C (30.9) C (29.6) C (33.2) D (44.9) C (32.6) Southeastbound Left/Thru/Right C (27.9) C (31.8) B (25.4) C (22.8) D (35.1) C (24.2) Northbound Left/Thru A (5.8) A (3.5) A (2.8) A (8.1) A (5.3) A (3.9) Northbound Thru/Right A (6.6) A (3.2) A (4.4) Southbound Left/Thru A (0.0) B (15.7) B (10.5) B (16.7) C (24.2) B (16.9) Southbound Thru/Right B (16.9) B (12.9) A (9.7) South Warner Avenue 1 A (0.1) A (0.2) A (0.1) A (0.1) A (0.2) A (0.1) Northbound Thru A (0.0) A (0.0) A (0.0) A (0.0) A (0.0) A (0.0) Northbound Thru/Right A (0.0) A (0.0) A (0.0) A (0.0) A (0.0) A (0.0) Southbound Left/Thru B (10.7) A (9.2) B (10.0) B (10.7) A (9.2) B (10.0) Southbound Thru A (0.1) A (0.2) A (0.1) A (0.1) A (0.2) A (0.1) Old Lancaster Avenue 1 A (4.4) A (3.9) A (2.4) A (3.8) A (3.9) A (2.2) Westbound Left/Thru/Right C (24.2) C (20.1) B (14.3) D (26.1) D (25.8) C (15.4) Northbound Thru Northbound Thru/Right A (0.0) A (0.0) A (0.0) A (0.0) A (0.0) A (0.0) Southbound Left/Thru B (13.0) A (9.8) A (9.7) B (13.0) A (9.7) A (9.5) Southbound Thru A (2.2) A (1.5) A (0.6) A (3.9) A (1.1) A (1.3) Mondella Avenue 1 A (0.5) A (0.4) A (0.1) A (0.4) A (0.4) A (0.3) Westbound Left/Thru/Right D (26.4) C (18.9) B (11.2) C (20.9) C (20.2) C (15.3) Northbound Thru Northbound Thru/Right A (0.0) A (0.0) A (0.0) A (0.0) A (0.0) A (0.0) Southbound Left/Thru B (10.2) A (9.0) A (8.8) B (10.2) A (9.0) A (8.8) Southbound Thru A (0.2) A (0.1) A (0.0) A (0.3) A (0.0) A (0.0)
417 Intersection AM Peak Hour LOS (seconds) Existing LOS PM Peak Hour LOS (seconds) SAT Peak Hour LOS (seconds) Existing w/ Improvements LOS AM Peak Hour LOS (seconds) PM Peak Hour LOS (seconds) SAT Peak Hour LOS (seconds) Lindsay Avenue 2 A (1.9) A (1.5) A (0.2) B (15.0) A (7.6) A (0.7) Westbound Left/Thru/Right C (26.9) C (25.6) A (0.0) C (25.7) C (25.6) A (0.0) Northbound Thru Northbound Thru/Right A (1.9) A (0.8) A (0.1) C (22.6) A (7.4) A (0.7) Southbound Left/Thru A (2.0) A (1.5) A (1.2) A (1.6) A (0.2) Southbound Thru A (3.1) A (7.5) A (0.7) S. Bryn Mawr Avenue (S.R.)& Haverford Road & W. Railroad Avenue & Glenbrook Avenue 2 C (23.1) C (22.4) B (16.7) C (28.2) C (24.1) B (18.0) Eastbound Left C (21.6) C (23.9) B (18.6) C (21.6) C (23.9) B (18.5) Eastbound Thru/Right D (41.5) D (46.2) C (30.5) D (41.5) D (46.2) C (30.4) Westbound Left C (23.8) D (40.9) C (20.0) C (23.8) D (40.9) C (20.3) Westbound Thru C (30.6) D (38.2) C (27.7) C (30.6) D (38.2) C (28.1) Westbound Right C (25.1) C (28.2) C (24.2) C (25.1) C (28.2) C (24.4) Northbound Left B (13.0) C (22.1) B (10.5) C (21.8) C (24.5) B (12.7) Northbound Thru Northbound Thru/Right Southbound Left C (24.0) C (36.6) B (16.7) A (4.4) B (18.2) B (10.6) D (37.5) C (30.5) C (21.7) A (5.9) C (21.5) B (12.5) Southbound Thru Southbound Thru/Right Glenbrook Avenue 2 A (2.9) B (11.7) A (6.5) C (22.1) A (2.9) B (10.4) A (3.7) B (11.5) A (8.0) C (20.9) A (3.7) B (10.4) Northbound Left/Thru Northbound Thru/Right Southbound Thru Southbound Thru/Right Haverford Road (S.R.)& Landover Road 2 A (0.2) C (31.3) B (16.0) A (0.2) D (36.7) B (13.7) A (0.4) C (22.7) B (10.5) A (0.4) C (30.4) C (22.8) A (0.2) C (34.6) E (56.8) A (0.3) C (22.8) B (12.8) Eastbound Left/Thru/Right D (53.5) D (41.4) D (35.5) D (53.3) D (41.4) D (35.8) Westbound Left/Thru/Right D (35.3) D (53.6) C (30.2) D (35.3) D (54.0) C (33.8) Northbound Left/Thru B (10.4) A (8.9) A (4.0) A (7.2) F (82.5) A (10.0) Northbound Thru/Right B (10.5) A (9.1) A (4.2) C (23.9) B (12.9) A (6.4) Southbound Left/Thru A (0.8) A (1.3) A (4.1) C (23.0) A (4.6) A (10.0) Southbound Thru/Right A (0.8) A (1.5) A (4.3) A (2.1) F (82.3) A (6.5) 1 Analyzed as stop controlled 2 Analyzed as signal
418 APPENDIX J 95 th Percentile Queues
419 Existing Queues Queues w/ Improvements Intersection Existing Storage Length (feet) AM Peak Hour 95th Percentile Queue (feet) PM Peak Hour 95th Percentile Queue (feet) SAT Peak Hour 95th Percentile Queue (feet) AM Peak Hour 95th Percentile Queue (feet) PM Peak Hour 95th Percentile Queue (feet) SAT Peak Hour 95th Percentile Queue (feet) Lancaster Avenue (S.R. 0030) Eastbound Thru Eastbound Thru/Right Westbound Left Westbound Thru/RIght Northbound Left * Northbounf Left/Thru/Right Southbound Left/Thru/Right Montrose Avenue Eastbound Left/Thru/Right * Westbound Left/Thru/Right * Northbound Left/Thru (75) Northbound Thru/Right * Southbound Left/Thru (75) Southbound Thru/Right * South Roberts Road Eastbound Left/Thru/Right * Westbound Left/Thru/Right * Northbound Left/Thru (75) Northbound Thru/Right * Southbound Left/Thru (75) Southbound Thru/Right * Conestoga Road (S.R. 1019) & Glenbrook Avenue & Thomas Avenue Westbound Left/Thru/Right Northeastbound Left/Thru/Right Southeastbound Left/Thru/Right * Northbound Left/Thru (170) Northbound Thru/Right Southbound Left/Thru Southbound Thru/Right South Warner Avenue * Northbound Thru Northbound Thru/Right Southbound Left/Thru Southbound Thru Old Lancaster Avenue Westbound Left/Thru/Right Northbound Thru Northbound Thru/Right Southbound Left/Thru Southbound Thru Mondella Avenue Westbound Left/Thru/Right Northbound Thru Northbound Thru/Right Southbound Left/Thru Southbound Thru Lindsay Avenue Westbound Left/Thru/Right Northbound Thru Northbound Thru/Right Southbound Left/Thru Southbound Thru * S. Bryn Mawr Avenue (S.R. ) & Haverford Road & W. Railroad Avenue & Glenbrook Avenue Eastbound Left Eastbound Thru/Right Westbound Left Westbound Thru Westbound Right Northbound Left
420 Existing Queues Queues w/ Improvements Intersection Existing Storage Length (feet) AM Peak Hour 95th Percentile Queue (feet) PM Peak Hour 95th Percentile Queue (feet) SAT Peak Hour 95th Percentile Queue (feet) AM Peak Hour 95th Percentile Queue (feet) PM Peak Hour 95th Percentile Queue (feet) SAT Peak Hour 95th Percentile Queue (feet) Northbound Thru Northbound Thru/Right Southbound Left Southbound Thru Southbound Thru/Right Glenbrook Avenue Northbound Left/Thru Northbound Thru/Right * Southbound Thru Southbound Thru/Right Haverford Road (S.R.)& Landover Road * Eastbound Left/Thru/Right Westbound Left/Thru/Right * Northbound Left/Thru (75) Northbound Thru/Right Southbound Left/Thru (75) Southbound Thru/Right * *Denotes distance to adjacent intersection
421 APPENDIX K Pedestrian and Vehicle Clearance Calculations
422 Traffic Signal Clearances Workbook Page 2 STUDY LOCATION AND ANALYSIS INFORMATION Municipality: County: PennDOT Engineering District: Radnor Township Analysis Date: 9/12/2018 Delaware County Conducted By: LAS 6 Checked By: DAD Agency/Company Name: Gilmore & Associates, Inc. Intersection Description: County Line Road (SR 1001) & Lancaster Avenue (SR 0030) VEHICLE AND PEDESTRIAN INTERVAL FINDINGS Vehicle Change and Clearance Interval Findings Approach Description SR 0030 Phase 6 SR 0030 Phase 2 Private Drive Phase 4 SB 3.4 SR 1001 Phase 8 Direction WB EB NB Calculated Yellow Change Interval, Y User Defined Yellow Change Interval, Y 4 4 Calculated All-Red Clearance Interval, AR User Defined All-Red Clearance Interval, AR To Be Implemented Y (s) AR (s) Additional Comments/Justifications: Pedestrian Interval Findings WITH PEDESTRIAN SIGNALS Description of Pedestrian Crossing Crossing of WB Lancaster Ave Crossing of EB Lancaster Ave Crossing of NB County Line Road Calculated Walk Interval, T w User Defined Walk Interval, T w Calculated Ped. Change Interval, T pc User Defined Ped. Change Interval, T pc Greater than (T w +T pc ) min? Yes Yes Yes To Be Implemented T w (s) T pc (s) WITHOUT PEDESTRIAN SIGNALS Description of Pedestrian Crossing Calculated Min. Green Interval, T p Additional Comments/Justifications: Crossing of SB Privtae Drive /19/2018 CCI Lancaster
423 Traffic Signal Clearances Workbook Page 3 VEHICLE CHANGE AND CLEARANCE INTERVALS Change and Clearance Intervals (CCI, seconds) CCI = Y + t = V = a = Deceleration rate (10 ft/s 2 ) 10 L = g = AR Perception-reaction time, s (1 second) 1 Approach speed, MPH Grade of approach, % Yellow Change Interval (Y, seconds) 1.47V Y = t + (typ. 3-6 seconds) 2a ± 64.4( g100) Assumptions and Calibration Inputs All-Red Clearance Interval (AR, seconds) ( W + L) AR = 1.47V W = Width of the intersection, ft (from the stop bar to the end of the farthest traveled lane) Length of Vehicle (20 ft) 20 V = Approach speed, MPH Calculations Through Movement Phases Approach Description Direction V g (%) W Y AR CCI SR 0030 Phase 6 WB SR 0030 Phase 2 EB Private Drive Phase 4 SB SR 1001 Phase 8 NB Comments Approach Description Direction V g (%) Left-Turn Movement Phases W Y AR CCI Comments 9/19/2018 CCI Lancaster
424 Traffic Signal Clearances Workbook Page 4 PEDESTRIAN INTERVALS Walk Interval 1 (T w, seconds) Pedestrian Change Interval (T pc, seconds) Minimum Duration ((T w +T pc ) min, seconds) 1) The walk interval should be at least 7 seconds, but where justified, a minimum 4 second interval may be used. T w = 1 2 S T = PC L w + L S ( ) ( L + 6) + T = Tw pc min 3 w 3 Assumptions and Calibration Inputs L = Pedestrian walking distance from the curb or edge of shoulder to the far edge of the traveled way, ft S w = Walking Speed, ft/s (3.5 ft/s) Minimum Green Interval 2 (T p, seconds) Pedestrian Interval Variables 2) Minimum green interval when no pedestrian signals are present or proposed T p = L S w Calculations Description of Pedestrian Crossing Crossing of WB Lancaster Ave Crossing of EB Lancaster Ave Crossing of NB County Line Road Crossing of SB Privtae Drive Ped Signal Yes Yes Yes No L T w T pc (T w +T pc ) min T p Comments N/A USE 7 SEC WALK 18 FH N/A USE 7 SEC WALK 13 FH N/A 24.9 N/A 31.0 N/A N/A 11.9 USE 7 SEC WALK 25 FH 9/19/2018 CCI Lancaster
425 Traffic Signal Clearances Workbook Page 2 STUDY LOCATION AND ANALYSIS INFORMATION Municipality: County: PennDOT Engineering District: Radnor Township Analysis Date: 9/12/2018 Delaware County Conducted By: LAS 6 Checked By: DAD Agency/Company Name: Gilmore & Associates, Inc. Intersection Description: County Line Road (S.R. 1001) & Montrose Avenue VEHICLE AND PEDESTRIAN INTERVAL FINDINGS Vehicle Change and Clearance Interval Findings Approach Description SR 1001 Phase 6 SR 1001 Phase 2 Montrose Ave Phase 8 Direction WB Calculated Yellow Change Interval, Y 3.9 Montrose Ave Phase 4 SB 3 EB NB User Defined Yellow Change Interval, Y Calculated All-Red Clearance Interval, AR User Defined All-Red Clearance Interval, AR To Be Implemented Y (s) AR (s) Additional Comments/Justifications: Pedestrian Interval Findings WITH PEDESTRIAN SIGNALS Description of Pedestrian Crossing Crossing of WB County Line Rd Crossing of EB County Line Rd Crossing of NB Montrose Ave Crossing of SB Montorse Ave Calculated Walk Interval, T w User Defined Walk Interval, T w Calculated Ped. Change Interval, T pc User Defined Ped. Change Interval, T pc Greater than (T w +T pc ) min? Yes Yes Yes Yes To Be Implemented T w (s) T pc (s) WITHOUT PEDESTRIAN SIGNALS Description of Pedestrian Crossing Calculated Min. Green Interval, T p Additional Comments/Justifications: 2/25/2019 CCI Montrose
426 Traffic Signal Clearances Workbook Page 3 VEHICLE CHANGE AND CLEARANCE INTERVALS Change and Clearance Intervals (CCI, seconds) CCI = Y + t = V = a = Deceleration rate (10 ft/s 2 ) 10 L = g = AR Perception-reaction time, s (1 second) 1 Approach speed, MPH Grade of approach, % Yellow Change Interval (Y, seconds) 1.47V Y = t + (typ. 3-6 seconds) 2a ± 64.4( g100) Assumptions and Calibration Inputs All-Red Clearance Interval (AR, seconds) ( W + L) AR = 1.47V W = Width of the intersection, ft (from the stop bar to the end of the farthest traveled lane) Length of Vehicle (20 ft) 20 V = Approach speed, MPH Calculations Through Movement Phases Approach Description Direction V g (%) W Y AR CCI SR 1001 Phase 6 WB SR 1001 Phase 2 EB Montrose Ave Phase 4 SB Montrose Ave Phase 8 NB Comments Left-Turn Movement Phases Approach Description Direction V g (%) W Y AR CCI Comments 2/25/2019 CCI Montrose
427 Traffic Signal Clearances Workbook Page 4 PEDESTRIAN INTERVALS Walk Interval 1 (T w, seconds) Pedestrian Change Interval (T pc, seconds) Minimum Duration ((T w +T pc ) min, seconds) 1) The walk interval should be at least 7 seconds, but where justified, a minimum 4 second interval may be used. T w = 1 2 S T = PC L w + L S ( ) ( L + 6) + T = Tw pc min 3 w 3 Assumptions and Calibration Inputs L = Pedestrian walking distance from the curb or edge of shoulder to the far edge of the traveled way, ft S w = Walking Speed, ft/s (3.5 ft/s) Minimum Green Interval 2 (T p, seconds) Pedestrian Interval Variables 2) Minimum green interval when no pedestrian signals are present or proposed T p = L S w Calculations Description of Pedestrian Crossing Crossing of WB County Line Rd Crossing of EB County Line Rd Crossing of NB Montrose Ave Crossing of SB Montorse Ave Ped Signal L T w T pc (T w +T pc ) min T p Comments Yes N/A USE 7 SEC WALK 16 FH Yes Yes Yes N/A N/A N/A USE 7 SEC WALK 16 FH USE 7 SEC WALK 12 FH USE 7 SEC WALK 12 FH 2/25/2019 CCI Montrose
428 Traffic Signal Clearances Workbook Page 2 STUDY LOCATION AND ANALYSIS INFORMATION Municipality: County: PennDOT Engineering District: Radnor Township Analysis Date: 9/12/2018 Delaware County Conducted By: LAS 6 Checked By: DAD Agency/Company Name: Gilmore & Associates, Inc. Intersection Description: County Line Road (SR 1001) & Roberts Road VEHICLE AND PEDESTRIAN INTERVAL FINDINGS Vehicle Change and Clearance Interval Findings Approach Description SR 1001 Phase 6 SR 1001 Phase 2 Roberts Rd Phase 4 SB 2.8 Roberts Rd Phase 8 Direction WB EB NB Calculated Yellow Change Interval, Y User Defined Yellow Change Interval, Y 4 4 Calculated All-Red Clearance Interval, AR User Defined All-Red Clearance Interval, AR To Be Implemented Y (s) AR (s) Additional Comments/Justifications: Pedestrian Interval Findings WITH PEDESTRIAN SIGNALS Description of Pedestrian Crossing Crossing of WB County Line Rd Crossing of EB County Line Rd Crossing of NB Roberts Rd Crossing of SB Roberts Rd Calculated Walk Interval, T w User Defined Walk Interval, T w Calculated Ped. Change Interval, T pc User Defined Ped. Change Interval, T pc Greater than (T w +T pc ) min? Yes Yes Yes Yes To Be Implemented T w (s) T pc (s) WITHOUT PEDESTRIAN SIGNALS Description of Pedestrian Crossing Calculated Min. Green Interval, T p Additional Comments/Justifications: 9/19/2018 CCI Roberts
429 Traffic Signal Clearances Workbook Page 3 VEHICLE CHANGE AND CLEARANCE INTERVALS Change and Clearance Intervals (CCI, seconds) CCI = Y + t = V = a = Deceleration rate (10 ft/s 2 ) 10 L = g = AR Perception-reaction time, s (1 second) 1 Approach speed, MPH Grade of approach, % Yellow Change Interval (Y, seconds) 1.47V Y = t + (typ. 3-6 seconds) 2a ± 64.4( g100) Assumptions and Calibration Inputs All-Red Clearance Interval (AR, seconds) ( W + L) AR = 1.47V W = Width of the intersection, ft (from the stop bar to the end of the farthest traveled lane) Length of Vehicle (20 ft) 20 V = Approach speed, MPH Calculations Through Movement Phases Approach Description Direction V g (%) W Y AR CCI SR 1001 Phase 6 WB SR 1001 Phase 2 EB Roberts Rd Phase 4 SB Roberts Rd Phase 8 NB Comments Approach Description Direction V g (%) Left-Turn Movement Phases W Y AR CCI Comments 9/19/2018 CCI Roberts
430 Traffic Signal Clearances Workbook Page 4 PEDESTRIAN INTERVALS Walk Interval 1 (T w, seconds) Pedestrian Change Interval (T pc, seconds) Minimum Duration ((T w +T pc ) min, seconds) 1) The walk interval should be at least 7 seconds, but where justified, a minimum 4 second interval may be used. T w = 1 2 S T = PC L w + L S ( ) ( L + 6) + T = Tw pc min 3 w 3 Assumptions and Calibration Inputs L = Pedestrian walking distance from the curb or edge of shoulder to the far edge of the traveled way, ft S w = Walking Speed, ft/s (3.5 ft/s) Minimum Green Interval 2 (T p, seconds) Pedestrian Interval Variables 2) Minimum green interval when no pedestrian signals are present or proposed T p = L S w Calculations Description of Pedestrian Crossing Crossing of WB County Line Rd Crossing of EB County Line Rd Crossing of NB Roberts Rd Crossing of SB Roberts Rd Ped Signal Yes Yes Yes L T w T pc (T w +T pc ) min T p Comments Yes N/A USE 7 SEC WALK 13 FH N/A USE 7 SEC WALK 17 FH N/A N/A USE 7 SEC WALK 12 FH 9/19/2018 CCI Roberts
431 Traffic Signal Clearances Workbook Page 2 STUDY LOCATION AND ANALYSIS INFORMATION Municipality: County: PennDOT Engineering District: Radnor Township Analysis Date: 9/12/2018 Delaware County Conducted By: LAS 6 Checked By: DAD Agency/Company Name: Gilmore & Associates, Inc. Intersection Description: County Line Road (SR 1001) & Conestoga Road (SR 1019) & Thomas Avenue & Glenbrook Avenue VEHICLE AND PEDESTRIAN INTERVAL FINDINGS Vehicle Change and Clearance Interval Findings Approach Description Conestoga Rd (SR 1019) County Line Rd (SR 1001) County Line Rd (SR 1001) SB 3.4 Thomas Ave Glenbrook Ave Direction SEB NB WB NEB Calculated Yellow Change Interval, Y User Defined Yellow Change Interval, Y 4 3 Calculated All-Red Clearance Interval, AR User Defined All-Red Clearance Interval, AR To Be Implemented Y (s) AR (s) Additional Comments/Justifications: Thomas Avenue CCI is 7.4; use Y=5 and AR=3 to meet requirements. Pedestrian Interval Findings WITH PEDESTRIAN SIGNALS Description of Pedestrian Crossing Crossing Thomas Ave Crossing NB County Line Rd Crossing Glenbrook Ave Crossing Conestoga Rd Crossing SB County Line Rd Calculated Walk Interval, T w User Defined Walk Interval, T w Calculated Ped. Change Interval, T pc User Defined Ped. Change Interval, T pc Greater than (T w +T pc ) min? Yes Yes Yes Yes Yes To Be Implemented T w (s) T pc (s) WITHOUT PEDESTRIAN SIGNALS Description of Pedestrian Crossing Calculated Min. Green Interval, T p Additional Comments/Justifications: 9/19/2018 CCI Conestoga
432 Traffic Signal Clearances Workbook Page 3 VEHICLE CHANGE AND CLEARANCE INTERVALS Change and Clearance Intervals (CCI, seconds) CCI = Y + t = V = a = Deceleration rate (10 ft/s 2 ) 10 L = g = AR Perception-reaction time, s (1 second) 1 Approach speed, MPH Grade of approach, % Yellow Change Interval (Y, seconds) 1.47V Y = t + (typ. 3-6 seconds) 2a ± 64.4( g100) Assumptions and Calibration Inputs All-Red Clearance Interval (AR, seconds) ( W + L) AR = 1.47V W = Width of the intersection, ft (from the stop bar to the end of the farthest traveled lane) Length of Vehicle (20 ft) 20 V = Approach speed, MPH Calculations Through Movement Phases Approach Description Direction V g (%) W Y AR CCI Conestoga Rd (SR 1019) SEB County Line Rd (SR 1001) NB County Line Rd (SR 1001) SB Thomas Ave WB Glenbrook Ave NEB Comments Approach Description Direction V g (%) Left-Turn Movement Phases W Y AR CCI Comments 9/19/2018 CCI Conestoga
433 Traffic Signal Clearances Workbook Page 4 PEDESTRIAN INTERVALS Walk Interval 1 (T w, seconds) Pedestrian Change Interval (T pc, seconds) Minimum Duration ((T w +T pc ) min, seconds) 1) The walk interval should be at least 7 seconds, but where justified, a minimum 4 second interval may be used. T w = 1 2 S T = PC L w + L S ( ) ( L + 6) + T = Tw pc min 3 w 3 Assumptions and Calibration Inputs L = Pedestrian walking distance from the curb or edge of shoulder to the far edge of the traveled way, ft S w = Walking Speed, ft/s (3.5 ft/s) Minimum Green Interval 2 (T p, seconds) Pedestrian Interval Variables 2) Minimum green interval when no pedestrian signals are present or proposed T p = L S w Calculations Description of Pedestrian Crossing Ped Signal Crossing Thomas Ave Yes Crossing NB County Line Rd Yes Crossing Glenbrook Ave Yes Crossing Conestoga Rd Yes L T w (T w +T pc ) min Comments N/A N/A N/A N/A Crossing SB County Line Rd Yes N/A T pc T p 9/19/2018 CCI Conestoga
434 Traffic Signal Clearances Workbook Page 2 STUDY LOCATION AND ANALYSIS INFORMATION Municipality: County: PennDOT Engineering District: Radnor Township Analysis Date: 9/12/2018 Delaware County Conducted By: LAS 6 Checked By: DAD Agency/Company Name: Gilmore & Associates, Inc. Intersection Description: County Line Road (SR 1001) & Lindsay Ave Approach Description SR 1001 Phase 6 SR 1001 Phase 2 Direction WB Lindsay Ave Phase 4 SB 2.9 EB VEHICLE AND PEDESTRIAN INTERVAL FINDINGS Calculated Yellow Change Interval, Y 3.6 Vehicle Change and Clearance Interval Findings User Defined Yellow Change Interval, Y Calculated All-Red Clearance Interval, AR User Defined All-Red Clearance Interval, AR To Be Implemented Y (s) AR (s) Additional Comments/Justifications: Pedestrian Interval Findings WITH PEDESTRIAN SIGNALS Description of Pedestrian Crossing Crossing of WB County Line Rd Crossing of Lindsay Ave Calculated Walk Interval, T w User Defined Walk Interval, T w 7 7 Calculated Ped. Change Interval, T pc User Defined Ped. Change Interval, T pc Greater than (T w +T pc ) min? Yes Yes To Be Implemented T w (s) 7 7 T pc (s) WITHOUT PEDESTRIAN SIGNALS Description of Pedestrian Crossing Calculated Min. Green Interval, T p Additional Comments/Justifications: 9/19/2018 CCI Lindsay
435 Traffic Signal Clearances Workbook Page 3 VEHICLE CHANGE AND CLEARANCE INTERVALS Change and Clearance Intervals (CCI, seconds) CCI = Y + t = V = a = Deceleration rate (10 ft/s 2 ) 10 L = g = AR Perception-reaction time, s (1 second) 1 Approach speed, MPH Grade of approach, % Yellow Change Interval (Y, seconds) 1.47V Y = t + (typ. 3-6 seconds) 2a ± 64.4( g100) Assumptions and Calibration Inputs All-Red Clearance Interval (AR, seconds) ( W + L) AR = 1.47V W = Width of the intersection, ft (from the stop bar to the end of the farthest traveled lane) Length of Vehicle (20 ft) 20 V = Approach speed, MPH Calculations Through Movement Phases Approach Description Direction V g (%) W Y AR CCI SR 1001 Phase 6 WB SR 1001 Phase 2 EB Lindsay Ave Phase 4 SB Comments Approach Description Direction V g (%) Left-Turn Movement Phases W Y AR CCI Comments 9/19/2018 CCI Lindsay
436 Traffic Signal Clearances Workbook Page 4 PEDESTRIAN INTERVALS Walk Interval 1 (T w, seconds) Pedestrian Change Interval (T pc, seconds) Minimum Duration ((T w +T pc ) min, seconds) 1) The walk interval should be at least 7 seconds, but where justified, a minimum 4 second interval may be used. T w = 1 2 S T = PC L w + L S ( ) ( L + 6) + T = Tw pc min 3 w 3 Assumptions and Calibration Inputs L = Pedestrian walking distance from the curb or edge of shoulder to the far edge of the traveled way, ft S w = Walking Speed, ft/s (3.5 ft/s) Minimum Green Interval 2 (T p, seconds) Pedestrian Interval Variables 2) Minimum green interval when no pedestrian signals are present or proposed T p = L S w Calculations Description of Pedestrian Crossing Crossing of WB County Line Rd Crossing of Lindsay Ave Ped Signal L T w T pc (T w +T pc ) min T p Comments Yes N/A USE 7 SEC WALK 12 FH Yes N/A USE 7 SEC WALK 10 FH 9/19/2018 CCI Lindsay
437 Traffic Signal Clearances Workbook Page 2 STUDY LOCATION AND ANALYSIS INFORMATION Municipality: County: PennDOT Engineering District: Radnor Township Analysis Date: 9/12/2018 Delaware County Conducted By: LAS 6 Checked By: DAD Agency/Company Name: Gilmore & Associates, Inc. Intersection Description: County Line Road (SR 1001) & Bryn Mawr Ave (SR 3038) & Railroad Ave & Haverford Road (SR 1001) VEHICLE AND PEDESTRIAN INTERVAL FINDINGS Vehicle Change and Clearance Interval Findings Approach Description SR 1001 Phase 2 SR 1001 Phase 6 SR 1032 Phase 8 NB 3.3 SR 3038 Phase 4 Direction EB WB SB Calculated Yellow Change Interval, Y User Defined Yellow Change Interval, Y 4 4 Calculated All-Red Clearance Interval, AR User Defined All-Red Clearance Interval, AR To Be Implemented Y (s) AR (s) SR 1001 Phase 1 SR 1001 Phase 5 SR 1032 Phase 3 SR 3038 Phase 7 WB EB NB SB Additional Comments/Justifications: Pedestrian Interval Findings WITH PEDESTRIAN SIGNALS Description of Pedestrian Crossing Crossing of WB County Line Rd Crossing of EB Haverford Rd Crossing of NB Bryn Mawr Ave Crossing of SB Bryn Mawr Ave Crossing of NB Glenbrook Ave Calculated Walk Interval, T w User Defined Walk Interval, T w Calculated Ped. Change Interval, T pc User Defined Ped. Change Interval, T pc Greater than (T w +T pc ) min? Yes Yes Yes Yes Yes To Be Implemented T w (s) T pc (s) WITHOUT PEDESTRIAN SIGNALS Description of Pedestrian Crossing Calculated Min. Green Interval, T p Additional Comments/Justifications: 9/19/2018 CCI Bryn Mawr
438 Traffic Signal Clearances Workbook Page 3 VEHICLE CHANGE AND CLEARANCE INTERVALS Change and Clearance Intervals (CCI, seconds) CCI = Y + t = V = a = Deceleration rate (10 ft/s 2 ) 10 L = g = AR Perception-reaction time, s (1 second) 1 Approach speed, MPH Grade of approach, % Yellow Change Interval (Y, seconds) 1.47V Y = t + (typ. 3-6 seconds) 2a ± 64.4( g100) Assumptions and Calibration Inputs All-Red Clearance Interval (AR, seconds) ( W + L) AR = 1.47V W = Width of the intersection, ft (from the stop bar to the end of the farthest traveled lane) Length of Vehicle (20 ft) 20 V = Approach speed, MPH Calculations Through Movement Phases Approach Description Direction V g (%) W Y AR CCI SR 1001 Phase 2 EB SR 1001 Phase 6 WB SR 1032 Phase 8 NB SR 3038 Phase 4 SB Comments Approach Description Direction V g (%) SR 1001 Phase 1 SR 1001 Phase 5 WB EB SR 1032 Phase 3 NB 25 0 SR 3038 Phase 7 SB 25 0 Left-Turn Movement Phases W Y AR CCI Comments 9/19/2018 CCI Bryn Mawr
439 Traffic Signal Clearances Workbook Page 4 PEDESTRIAN INTERVALS Walk Interval 1 (T w, seconds) Pedestrian Change Interval (T pc, seconds) Minimum Duration ((T w +T pc ) min, seconds) 1) The walk interval should be at least 7 seconds, but where justified, a minimum 4 second interval may be used. T w = 1 2 S T = PC L w + L S ( ) ( L + 6) + T = Tw pc min 3 w 3 Assumptions and Calibration Inputs L = Pedestrian walking distance from the curb or edge of shoulder to the far edge of the traveled way, ft S w = Walking Speed, ft/s (3.5 ft/s) Minimum Green Interval 2 (T p, seconds) Pedestrian Interval Variables 2) Minimum green interval when no pedestrian signals are present or proposed T p = L S w Calculations Description of Pedestrian Crossing Crossing of WB County Line Rd Crossing of EB Haverford Rd Ped Signal Yes Yes L T w T pc (T w +T pc ) min T p N/A N/A Comments USE 7 SEC WALK 18 FH USE 7 SEC WALK 19 FH Crossing of NB Bryn Mawr Ave Yes N/A USE 7 SEC WALK 15 FH Crossing of SB Bryn Mawr Ave Yes N/A USE 7 SEC WALK 21 FH Crossing of NB Glenbrook Ave Yes N/A USE 7 SEC WALK 8 FH 9/19/2018 CCI Bryn Mawr
440 Traffic Signal Clearances Workbook Page 2 STUDY LOCATION AND ANALYSIS INFORMATION Municipality: County: PennDOT Engineering District: Radnor Township Analysis Date: 9/12/2018 Delaware County Conducted By: LAS 6 Checked By: DAD Agency/Company Name: Gilmore & Associates, Inc. Intersection Description: County Line Road (SR 1001) & Haverford Road (Sr 1001) & Landover Road (SR 1009) VEHICLE AND PEDESTRIAN INTERVAL FINDINGS Vehicle Change and Clearance Interval Findings Approach Description SR 1001 Phase 2 SR 1001 Phase 6 SR 1009 Phase 8 NB 3.3 SR 1009 Phase 4 Direction EB WB SB Calculated Yellow Change Interval, Y User Defined Yellow Change Interval, Y 4 4 Calculated All-Red Clearance Interval, AR User Defined All-Red Clearance Interval, AR To Be Implemented Y (s) AR (s) Additional Comments/Justifications: Pedestrian Interval Findings WITH PEDESTRIAN SIGNALS Description of Pedestrian Crossing Crossing of EB Haverford Rd Crossing of WB County Line Rd Crossing of NB County Line Rd Crossing of SB Landover Rd Calculated Walk Interval, T w User Defined Walk Interval, T w Calculated Ped. Change Interval, T pc User Defined Ped. Change Interval, T pc Greater than (T w +T pc ) min? Yes Yes Yes Yes To Be Implemented T w (s) T pc (s) WITHOUT PEDESTRIAN SIGNALS Description of Pedestrian Crossing Calculated Min. Green Interval, T p Additional Comments/Justifications: 9/19/2018 CCI Landover
441 Traffic Signal Clearances Workbook Page 3 VEHICLE CHANGE AND CLEARANCE INTERVALS Change and Clearance Intervals (CCI, seconds) CCI = Y + t = V = a = Deceleration rate (10 ft/s 2 ) 10 L = g = AR Perception-reaction time, s (1 second) 1 Approach speed, MPH Grade of approach, % Yellow Change Interval (Y, seconds) 1.47V Y = t + (typ. 3-6 seconds) 2a ± 64.4( g100) Assumptions and Calibration Inputs All-Red Clearance Interval (AR, seconds) ( W + L) AR = 1.47V W = Width of the intersection, ft (from the stop bar to the end of the farthest traveled lane) Length of Vehicle (20 ft) 20 V = Approach speed, MPH Calculations Through Movement Phases Approach Description Direction V g (%) W Y AR CCI SR 1001 Phase 2 EB SR 1001 Phase 6 WB SR 1009 Phase 8 NB SR 1009 Phase 4 SB Comments Approach Description Direction V g (%) Left-Turn Movement Phases W Y AR CCI Comments 9/19/2018 CCI Landover
442 Traffic Signal Clearances Workbook Page 4 PEDESTRIAN INTERVALS Walk Interval 1 (T w, seconds) Pedestrian Change Interval (T pc, seconds) Minimum Duration ((T w +T pc ) min, seconds) 1) The walk interval should be at least 7 seconds, but where justified, a minimum 4 second interval may be used. T w = 1 2 S T = PC L w + L S ( ) ( L + 6) + T = Tw pc min 3 w 3 Assumptions and Calibration Inputs L = Pedestrian walking distance from the curb or edge of shoulder to the far edge of the traveled way, ft S w = Walking Speed, ft/s (3.5 ft/s) Minimum Green Interval 2 (T p, seconds) Pedestrian Interval Variables 2) Minimum green interval when no pedestrian signals are present or proposed T p = L S w Calculations Description of Pedestrian Crossing Crossing of EB Haverford Rd Crossing of WB County Line Rd Crossing of NB County Line Rd Crossing of SB Landover Rd Ped Signal Yes Yes Yes L T w T pc (T w +T pc ) min T p Comments Yes N/A USE 7 SEC WALK 12 FH N/A USE 7 SEC WALK 12 FH N/A N/A USE 7 SEC WALK 18 FH USE 7 SEC WALK 8 FH 9/19/2018 CCI Landover
443 APPENDIX L PennDOT Traffic Information Repository Data
?,1 2552 D1RS1., 55%5 0?3+,-). 4 A9 T=21, 54L J31K?1.*< ><*:1 5L (+,-,?H1 5#52% ><*:1 M1+3 53 ().R-,?H1 '%L#3422% ;3+=-* 0+,+ 0+,1 Z):?S1 ;3?*[ Z):?S1 ;3?*[ \ Z):?")
444 ;UD D-,1 VWXYW5 ;3+=-* U).-,)3-.R Q14)3, ()*+,-). 012*3-4,-).56" 7$8 $# $ 6 8" 98# 01,+-:2 ()*+,-). U+4 ;<41 )= >)?., ;<41 )= D-,1 D*G1H?:1 EF 2 78C1I >)?.,< C79N9C O43P Q)?, D1RS1., 55%5 0?3+,-). 4 A9 T=21, 54L J31K?1.*< ><*:1 5L (+,-,?H1 5#52% ><*:1 M ().R-,?H1 '%L#3422% ;3+=-* 0+,+ 0+,1 Z):?S1 ;3?*[ Z):?S1 ;3?*[ \ Z):?S1 ]3+4G ^)_ `ab Y`VX 45cL33 63 #2 T*, Ydb Y`VV 42c06 T*, VYb Y``X 43c%35 D14 `eb Vaad 40c3!1"""#$%###&11'
< ><):0 5K '*+,+?F0 5\"5200T ><):0 L0*2 5 '(-Q,+?F0 &$K\"343T ;2*=,) /*+* /*+0 Z2,R*2< [(:?R0 C0)(-F*2< [(:?R0 [(:?")
445 ;UC C,+0 VWXYX4 ;2*=,) U(-,+(2,-Q P03(2+ '()*+,(- /01)2,3+,(-45! 6# 78" # 9# 6 #" /0+*,:1 '()*+,(- U*3 ;<30 (= >(?-+ ;<30 (= C,+0 D9 2 78B1G >(?-+< B67M7B N43O P(? C0QR0-+ 55$5 /?2*+,(- 4 H9 S=10+ 2T55 I20J?0-)< ><):0 5K '*+,+?F0 5"5200T ><):0 L0*2 5 '(-Q,+?F0 &$K"343T ;2*=,) /*+* /*+0 Z2,R*2< [(:?R0 C0)(-F*2< [(:?R0 [(:?R0 [(:?R0 \2*3E ](^ _`a W_`b 0c25K 25c2KK 20c4T5 S)+ ``a W_`W 0c3$2 25cK34 20c053 d32 ``a W b 0cT3T 22c25T 45c$4 S)+ _Va W W 25cK5 0c3K$ 20c6T2 C03 _Va `XXb 25c43 22cK0T 42c635 1!!!"#$"""%11&
*+', 4I?9 T;0/* 2L55 J1/K=/,(: <:(8/ 5L &)*+*=G/ I5!54L33 <:(8/ M/)1 5L &',R+*=G/ %#L!34#6 91);+(.)*).")
446 UC C+*/ VVWXY3 91);+( U',+*'1+,R Q/2'1* &'()*+',./0(1+2*+',34 5$$ " !./*)+80 &'()*+', U)2 9:2/ '; <'=,* 85>?@A >B599 <'=,*: AB5N5A O43P 9:2/ '; C+*/ C(F/G=8/ DE 2 78A1H Q'=*/ 2552 C/RS/,* 5565.=1)*+', 4I?9 T;0/* 2L55 J1/K=/,(: <:(8/ 5L &)*+*=G/ I5!54L33 <:(8/ M/)1 5L &',R+*=G/ %#L!34#6 91);+(.)*).)*/ Z1+S)1: ['8=S/ C/(',G)1: ['8=S/ ['8=S/ ['8=S/ \1)2F ]'^ YW_ YW`V #a#66 6a4I4 2ba535 ]'^ Wc_ YWWd #a#33 #a#l4 2LaI6L./( WY_ YWWV 6a34# #a0#6 2ba35L 1!"#!!!$11%
TRAFFIC SIGNAL DESIGN REPORT KING OF PRUSSIA ROAD & RAIDER ROAD RADNOR TOWNSHIP PENNSYLVANIA
 TRAFFIC SIGNAL DESIGN REPORT KING OF PRUSSIA ROAD & RAIDER ROAD RADNOR TOWNSHIP PENNSYLVANIA PREPARED FOR: UNIVERSITY OF PENNSYLVANIA HEALTH SYSTEM 34 CIVIC CENTER BOULEVARD PHILADELPHIA, PA 1987 (61)
LAWRENCE TRANSIT CENTER LOCATION ANALYSIS 9 TH STREET & ROCKLEDGE ROAD / 21 ST STREET & IOWA STREET LAWRENCE, KANSAS
 LAWRENCE TRANSIT CENTER LOCATION ANALYSIS 9 TH STREET & ROCKLEDGE ROAD / 21 ST STREET & IOWA STREET LAWRENCE, KANSAS TRAFFIC IMPACT STUDY FEBRUARY 214 OA Project No. 213-542 TABLE OF CONTENTS 1. INTRODUCTION...
Traffic Engineering Study
 Traffic Engineering Study Bellaire Boulevard Prepared For: International Management District Technical Services, Inc. Texas Registered Engineering Firm F-3580 November 2009 Executive Summary has been requested
King Soopers #116 Thornton, Colorado
 Traffic Impact Study King Soopers #116 Thornton, Colorado Prepared for: Galloway & Company, Inc. T R A F F I C I M P A C T S T U D Y King Soopers #116 Thornton, Colorado Prepared for Galloway & Company
TRAFFIC IMPACT ANALYSIS
 TRAFFIC IMPACT ANALYSIS Emerald Isle Commercial Development Prepared by SEPI Engineering & Construction Prepared for Ark Consulting Group, PLLC March 2016 I. Executive Summary A. Site Location The Emerald
APPENDIX E. Traffic Analysis Report
 APPENDIX E Traffic Analysis Report THIS PAGE INTENTIONALLY BLANK EAGLE RIVER TRAFFIC MITIGATION PHASE I OLD GLENN HIGHWAY/EAGLE RIVER ROAD INTERSECTION IMPROVEMENTS TRAFFIC ANALYSIS Eagle River, Alaska
Traffic Impact Analysis West Street Garden Plots Improvements and DuPage River Park Garden Plots Development Naperville, Illinois
 Traffic Impact Analysis West Street Garden Plots Improvements and DuPage River Park Garden Plots Development Naperville, Illinois Submitted by April 9, 2009 Introduction Kenig, Lindgren, O Hara, Aboona,
Proposed location of Camp Parkway Commerce Center. Vicinity map of Camp Parkway Commerce Center Southampton County, VA
 Proposed location of Camp Parkway Commerce Center Vicinity map of Camp Parkway Commerce Center Southampton County, VA Camp Parkway Commerce Center is a proposed distribution and industrial center to be
Traffic Impact Study Speedway Gas Station Redevelopment
 Traffic Impact Study Speedway Gas Station Redevelopment Warrenville, Illinois Prepared For: Prepared By: April 11, 2018 Table of Contents 1. Introduction... 1 2. Existing Conditions... 4 Site Location...
TIMBERVINE TRANSPORTATION IMPACT STUDY FORT COLLINS, COLORADO JANUARY Prepared for:
 TIMBERVINE TRANSPORTATION IMPACT STUDY FORT COLLINS, COLORADO JANUARY 2014 Prepared for: Hartford Companies 1218 W. Ash Street Suite A Windsor, Co 80550 Prepared by: DELICH ASSOCIATES 2272 Glen Haven Drive
RTE. 1 at RTE. 637 & RTE. 639
 INTERSECTION SAFETY STUDY Prepared for: Virginia Department of Transportation Central Region Operations Traffic Engineering (UPC #81378, TO 12-092) DAVENPORT Project Number: 13-368 / /2014 RTE. 1 at RTE.
Traffic Feasibility Study
 Traffic Feasibility Study Town Center South Robbinsville Township, Mercer County, New Jersey December 19, 2017 Prepared For Robbinsville Township Department of Community Development 2298 Route 33 Robbinsville,
MEMO VIA . Ms. Amy Roth DPS Director, City of Three Rivers. To:
 MEMO To: Ms. Amy Roth DPS Director, City of Three Rivers VIA EMAIL From: Michael J. Labadie, PE Julie M. Kroll, PE, PTOE Brandon Hayes, PE, P.Eng. Fleis & VandenBrink Date: January 5, 2017 Re: Proposed
INDUSTRIAL DEVELOPMENT
 INDUSTRIAL DEVELOPMENT Traffic Impact Study Plainfield, Illinois August 2018 Prepared for: Seefried Industrial Properties, Inc. TABLE OF CONTENTS Executive Summary 2 Introduction 3 Existing Conditions
APPENDIX C1 TRAFFIC ANALYSIS DESIGN YEAR TRAFFIC ANALYSIS
 APPENDIX C1 TRAFFIC ANALYSIS DESIGN YEAR TRAFFIC ANALYSIS DESIGN YEAR TRAFFIC ANALYSIS February 2018 Highway & Bridge Project PIN 6754.12 Route 13 Connector Road Chemung County February 2018 Appendix
Table of Contents INTRODUCTION... 3 PROJECT STUDY AREA Figure 1 Vicinity Map Study Area... 4 EXISTING CONDITIONS... 5 TRAFFIC OPERATIONS...
 Crosshaven Drive Corridor Study City of Vestavia Hills, Alabama Table of Contents INTRODUCTION... 3 PROJECT STUDY AREA... 3 Figure 1 Vicinity Map Study Area... 4 EXISTING CONDITIONS... 5 TRAFFIC OPERATIONS...
Traffic Impact Study for the proposed. Town of Allegany, New York. August Project No Prepared For:
 Appendix B SRF Traffic Study (Revised November 2005) Draft Environmental Impact Statement University Commons Town of Allegany, Cattaraugus County, NY December 2005 Traffic Impact Study for the proposed
EXECUTIVE SUMMARY. The following is an outline of the traffic analysis performed by Hales Engineering for the traffic conditions of this project.
 EXECUTIVE SUMMARY This study addresses the traffic impacts associated with the proposed Shopko redevelopment located in Sugarhouse, Utah. The Shopko redevelopment project is located between 1300 East and
South Lexington Transportation Study Lexington, Massachusetts
 South Lexington Transportation Study Lexington, Massachusetts Preliminary Findings and Options for Consideration Businesses Meeting 10/10/13 Town of Lexington Engineering and Planning Departments Meeting
Figure 1 Map of intersection of SR 44 (Ravenna Rd) and Butternut Rd
 and Butternut Rd") Abbreviated Study District: 12 County: Geauga Route: SR 44 Section: 1.58 GEA 44 1.58 213 HSP # 47 (Rural Intersection) Prepared April 23, 215 By Bryan Emery Existing Conditions This study contains the
Abbreviated Study District: 12 County: Geauga Route: SR 44 Section: 1.58 GEA 44 1.58 213 HSP # 47 (Rural Intersection) Prepared April 23, 215 By Bryan Emery Existing Conditions This study contains the
Bennett Pit. Traffic Impact Study. J&T Consulting, Inc. Weld County, Colorado. March 3, 2017
 Bennett Pit Traffic Impact Study J&T Consulting, Inc. Weld County, Colorado March 3, 217 Prepared By: Sustainable Traffic Solutions, Inc. http://www.sustainabletrafficsolutions.com/ Joseph L. Henderson,
King County Metro. Columbia Street Transit Priority Improvements Alternative Analysis. Downtown Southend Transit Study. May 2014.
 King County Metro Columbia Street Transit Priority Improvements Alternative Analysis Downtown Southend Transit Study May 2014 Parametrix Table of Contents Introduction... 1 Methodology... 1 Study Area...
CHAPTER 9: VEHICULAR ACCESS CONTROL Introduction and Goals Administration Standards
 9.00 Introduction and Goals 9.01 Administration 9.02 Standards 9.1 9.00 INTRODUCTION AND GOALS City streets serve two purposes that are often in conflict moving traffic and accessing property. The higher
MINERVA PARK SITE TRAFFIC IMPACT STUDY M/I HOMES. September 2, 2015
 5500 New Albany Road Columbus, Ohio 43054 Phone: 614.775.4500 Fax: 614.775.4800 Toll Free: 1-888-775-EMHT emht.com 2015-1008 MINERVA PARK SITE TRAFFIC IMPACT STUDY M/I HOMES September 2, 2015 Engineers
Proposed Inn at Bellefield Traffic Impact Assessment
 Proposed Inn at Bellefield Traffic Impact Assessment Town of Hyde Park Dutchess County, New York Prepared for: T-Rex Hyde Park Owner LLC 500 Mamroneck Avenue, Suite 300 Harrison, NY 10528 June 21, 2017
RICHMOND OAKS HEALTH CENTRE 6265 PERTH STREET OTTAWA, ONTARIO TRANSPORTATION BRIEF. Prepared for: Guycoki (Eastern) Limited.
 Limited.") RICHMOND OAKS HEALTH CENTRE 6265 PERTH STREET OTTAWA, ONTARIO TRANSPORTATION BRIEF Prepared for: Guycoki (Eastern) Limited June 16, 2016 116-638 Brief_1.doc D. J. Halpenny & Associates Ltd. Consulting
RICHMOND OAKS HEALTH CENTRE 6265 PERTH STREET OTTAWA, ONTARIO TRANSPORTATION BRIEF Prepared for: Guycoki (Eastern) Limited June 16, 2016 116-638 Brief_1.doc D. J. Halpenny & Associates Ltd. Consulting
Date: February 7, 2017 John Doyle, Z-Best Products Robert Del Rio. T.E. Z-Best Traffic Operations and Site Access Analysis
 Memorandum Date: February 7, 07 To: From: Subject: John Doyle, Z-Best Products Robert Del Rio. T.E. Z-Best Traffic Operations and Site Access Analysis Introduction Hexagon Transportation Consultants, Inc.
2.0 Development Driveways. Movin Out June 2017
 Movin Out June 2017 1.0 Introduction The proposed Movin Out development is a mixed use development in the northeast quadrant of the intersection of West Broadway and Fayette Avenue in the City of Madison.
INTERSECTION ANALYSIS PARK AVENUE AND BRADDOCK ROAD (FROSTBURG, MD) FOR LENHART TRAFFIC CONSULTING, INC.
 FOR LENHART TRAFFIC CONSULTING, INC.") INTERSECTION ANALYSIS FOR PARK AVENUE AND BRADDOCK ROAD (FROSTBURG, MD) Prepared for: City of Frostburg, Maryland & Allegany County Commissioners Prepared by: LENHART TRAFFIC CONSULTING, INC. TRAFFIC ENGINEERING
INTERSECTION ANALYSIS FOR PARK AVENUE AND BRADDOCK ROAD (FROSTBURG, MD) Prepared for: City of Frostburg, Maryland & Allegany County Commissioners Prepared by: LENHART TRAFFIC CONSULTING, INC. TRAFFIC ENGINEERING
BARRHAVEN FELLOWSHIP CRC 3058 JOCKVALE ROAD OTTAWA, ONTARIO TRANSPORTATION BRIEF. Prepared for:
 BARRHAVEN FELLOWSHIP CRC 3058 JOCKVALE ROAD OTTAWA, ONTARIO TRANSPORTATION BRIEF Prepared for: Barrhaven Fellowship CRC 3058 Jockvale Road Ottawa, ON K2J 2W7 December 7, 2016 116-649 Report_1.doc D. J.
Traffic Impact Analysis. Alliance Cole Avenue Residential Site Dallas, Texas. Kimley-Horn and Associates, Inc. Dallas, Texas.
 Traffic Impact Analysis Alliance Cole Avenue Residential Site Dallas, Texas February 15, 2018 Kimley-Horn and Associates, Inc. Dallas, Texas Project #064524900 Registered Firm F-928 Traffic Impact Analysis
Proposed CVS/pharmacy
 Traffic Impact and Access Study Proposed CVS/pharmacy West Main Street (Route 1) at Hull Street Clinton, Connecticut PREPARED FOR Arista Development LLC 520 Providence Highway, Suite 9 Norwood, Massachusetts
Appendix C-5: Proposed Refinements Rail Operations and Maintenance Facility (ROMF) Traffic Impact Analysis. Durham-Orange Light Rail Transit Project
 Traffic Impact Analysis. Durham-Orange Light Rail Transit Project") Appendix C-5: Proposed Refinements Rail Operations and Maintenance Facility (ROMF) Traffic Impact Analysis Durham-Orange Light Rail Transit Project July 25, 218 ROMF Transportation Impact Analysis Version
Appendix C-5: Proposed Refinements Rail Operations and Maintenance Facility (ROMF) Traffic Impact Analysis Durham-Orange Light Rail Transit Project July 25, 218 ROMF Transportation Impact Analysis Version
MERIVALE PRIORITY SQUARE 2852 MERIVALE ROAD CITY OF OTTAWA TRANSPORTATION BRIEF. Prepared for: ONT Inc. 25 Winding Way Nepean, Ontario K2C 3H1
 MERIVALE PRIORITY SQUARE 2852 MERIVALE ROAD CITY OF OTTAWA TRANSPORTATION BRIEF Prepared for: 2190986ONT Inc. 25 Winding Way Nepean, Ontario K2C 3H1 October 6, 2010 110-502 Report_1.doc D. J. Halpenny
Roundabout Feasibility Study SR 44 at Grand Avenue TABLE OF CONTENTS
 Roundabout Feasibility Study SR 44 at Grand Avenue TABLE OF CONTENTS Introduction and Executive Summary... 1 Existing Conditions... 3 Intersection Volume Conditions... 5 Intersection Operations... 9 Safety
INTERSECTION CONTROL EVALUATION
 INTERSECTION CONTROL EVALUATION Trunk Highway 22 and CSAH 21 (E Hill Street/Shanaska Creek Road) Kasota, Le Sueur County, Minnesota November 2018 Trunk Highway 22 and Le Sueur CSAH 21 (E Hill Street/Shanaska
TRAFFIC IMPACT STUDY DERRY GREEN CORPORATE BUSINESS PARK MILTON SECONDARY PLAN MODIFICATION
 TRAFFIC IMPACT STUDY DERRY GREEN CORPORATE BUSINESS PARK MILTON SECONDARY PLAN MODIFICATION TRAFFIC IMPACT STUDY DERRY GREEN CORPORATE BUSINESS PARK MILTON SECONDARY PLAN MODIFICATION DECEMBER 24 UPDATED
County State Aid Highway 32 (Cliff Road) and Dodd Road Intersection Study
 and Dodd Road Intersection Study") County State Aid Highway 32 (Cliff Road) and Dodd Road Intersection Study City of Eagan, Dakota County, Minnesota Date: March 2012 Project No. 14957.000 444 Cedar Street, Suite 1500 Saint Paul, MN 55101
County State Aid Highway 32 (Cliff Road) and Dodd Road Intersection Study City of Eagan, Dakota County, Minnesota Date: March 2012 Project No. 14957.000 444 Cedar Street, Suite 1500 Saint Paul, MN 55101
L1TILE BEARS DAY CARE TRANSPORTATION IMPACT STUDY FORT COLLINS, COLORADO MAY Prepared for:
 L1TILE BEARS DAY CARE TRANSPORTATION IMPACT STUDY FORT COLLINS, COLORADO MAY 2012 Prepared for: Hillside Construction, Inc. 216 Hemlock Street, Suite B Fort Collins, CO 80534 Prepared by: DELICH ASSOCIATES
INTERCHANGE OPERTIONS STUDY Interstate 77 / Wallings Road Interchange
 INTERCHANGE OPERTIONS STUDY Interstate 77 / Wallings Road Interchange City of Broadview Heights, Cuyahoga County, Ohio Prepared For: City of Broadview Heights Department of Engineering 9543 Broadview Road
Mineola Village Green
 Traffic Impact Analysis Report Mineola Village Green 199 2 nd Street Mineola, New York Prepared for Mineola Metro LLC c/o Lalezarian Properties 1999 Marcus Avenue, Suite 310 Lake Success, NY 11042 Prepared
V. DEVELOPMENT OF CONCEPTS
 Martin Luther King, Jr. Drive Extension FINAL Feasibility Study Page 9 V. DEVELOPMENT OF CONCEPTS Throughout the study process several alternative alignments were developed and eliminated. Initial discussion
Speed measurements were taken at the following three locations on October 13 and 14, 2016 (See Location Map in Exhibit 1):
:") 2709 McGraw Drive Bloomington, Illinois 61704 p 309.663.8435 f 309.663.1571 www.f-w.com www.greennavigation.com November 4, 2016 Mr. Kevin Kothe, PE City Engineer City of Bloomington Public Works Department
2709 McGraw Drive Bloomington, Illinois 61704 p 309.663.8435 f 309.663.1571 www.f-w.com www.greennavigation.com November 4, 2016 Mr. Kevin Kothe, PE City Engineer City of Bloomington Public Works Department
Traffic Analysis for Bon Air Bridge Mitigation Magnolia Storm Water Quality Project
 Memo To: Paul DiDonato, ATI Architects and Engineers From: David Parisi, PE and Ashley Tam, EIT Date: February 23, 216 Subject: Traffic Analysis for Bon Air Bridge Mitigation Magnolia Storm Water Quality
IMPROVEMENT CONCEPTS
 IMPROVEMENT CONCEPTS for the South Novato Transit Hub Study Prepared by: January 11, 2010 DKS Associates With Wilbur Smith Associates IMPROVEMENT CONCEPTS Chapter 1: Introduction 1. INTRODUCTION The strategic
Alpine Highway to North County Boulevard Connector Study
 Alpine Highway to North County Boulevard Connector Study prepared by Avenue Consultants March 16, 2017 North County Boulevard Connector Study March 16, 2017 Table of Contents 1 Summary of Findings... 1
TRAFFIC IMPACT ANALYSIS FOR. McDONALD S RESTAURANT IN CARMICAEL Sacramento County, CA. Prepared For:
 TRAFFIC IMPACT ANALYSIS FOR McDONALD S RESTAURANT IN CARMICAEL Sacramento County, CA Prepared For: McDonald s USA, LLC Pacific Sierra Region 2999 Oak Road, Suite 900 Walnut Creek, CA 94597 Prepared By:
West Hills Shopping Centre Lowe s Expansion Traffic Impact Study
 West Hills Shopping Centre Lowe s Expansion Traffic Impact Study Prepared for: Armel Corporation January 2015 Paradigm Transportation Solutions Ltd. 22 King Street South, Suite 300 Waterloo ON N2J 1N8
DEVELOPMENT PROPERTY 1627 MAXIME STREET CITY OF OTTAWA TRANSPORTATION OVERVIEW. Prepared for: Subhas Bhargava. July 9, Overview_1.
 DEVELOPMENT PROPERTY 1627 MAXIME STREET CITY OF OTTAWA TRANSPORTATION OVERVIEW Prepared for: Subhas Bhargava July 9, 2015 115-620 Overview_1.doc D. J. Halpenny & Associates Ltd. Consulting Transportation
TRAFFIC IMPACT STUDY FOR SONIC DRIVE-IN RESTAURANT. Vallejo, CA. Prepared For:
 TRAFFIC IMPACT STUDY FOR SONIC DRIVE-IN RESTAURANT Vallejo, CA Prepared For: ELITE DRIVE-INS, INC. 2190 Meridian Park Blvd, Suite G Concord, CA 94520 Prepared By: KD Anderson & Associates 3853 Taylor Road,
Evaluation Considerations and Geometric Nuances of Reduced Conflict U-Turn Intersections (RCUTs)
") Evaluation Considerations and Geometric Nuances of Reduced Conflict U-Turn Intersections (RCUTs) 26 th Annual Transportation Research Conference Saint Paul RiverCentre May 20, 2015 Presentation Outline
Evaluation Considerations and Geometric Nuances of Reduced Conflict U-Turn Intersections (RCUTs) 26 th Annual Transportation Research Conference Saint Paul RiverCentre May 20, 2015 Presentation Outline
Safety Assessment. Intersection of Route 29 (Seminole Trail) and Ashwood Blvd (Route 1670). Albemarle County
 and Ashwood Blvd (Route 1670). Albemarle County") Safety Assessment for Intersection of Route 29 (Seminole Trail) and Ashwood Blvd (Route 1670). Albemarle County Prepared by: VIRGINIA DEPARTMENT OF TRANSPORTATION Northwestern Regional Operations - Traffic
Safety Assessment for Intersection of Route 29 (Seminole Trail) and Ashwood Blvd (Route 1670). Albemarle County Prepared by: VIRGINIA DEPARTMENT OF TRANSPORTATION Northwestern Regional Operations - Traffic
Lacey Gateway Residential Phase 1
 Lacey Gateway Residential Phase Transportation Impact Study April 23, 203 Prepared for: Gateway 850 LLC 5 Lake Bellevue Drive Suite 02 Bellevue, WA 98005 Prepared by: TENW Transportation Engineering West
Section 5.0 Traffic Information
 Section 5.0 Traffic Information 10.0 TRANSPORTATION MDM Transportation Consultants, Inc. (MDM) has prepared an evaluation of transportation impacts for the proposed evaluation for the expansion of the
County State Aid Highway 30 (Diffley Road) and Dodd Road Intersection Study
 and Dodd Road Intersection Study") County State Aid Highway 30 (Diffley Road) and Dodd Road Intersection Study City of Eagan, Dakota County, Minnesota Date: March 2012 Project No. 14957.000 444 Cedar Street, Suite 1500 Saint Paul, MN 55101
County State Aid Highway 30 (Diffley Road) and Dodd Road Intersection Study City of Eagan, Dakota County, Minnesota Date: March 2012 Project No. 14957.000 444 Cedar Street, Suite 1500 Saint Paul, MN 55101
Oakbrook Village Plaza City of Laguna Hills
 Oakbrook Village Plaza City of Laguna Hills Traffic Impact Analysis Prepared by: HDR Engineering 3230 El Camino Real, Suite 200 Irvine, CA 92602 October 2012 Revision 3 D-1 Oakbrook Village Plaza Laguna
TRAFFIC IMPACT ANALYSIS FOR THE 630/650 SOUTH STREET RETAIL DEVELOPMENT WRENTHAM, MASSACHUSETTS
 PARE PROJECT NO. 17120.00 REPORT TRAFFIC IMPACT ANALYSIS FOR THE 630/650 SOUTH STREET RETAIL DEVELOPMENT WRENTHAM, MASSACHUSETTS SUBMITTED TO: GEORGETOWN CAPITAL MANAGEMENT PO BOX 369 GEORGETOWN, MA 01833
EXCEPTION TO STANDARDS REPORT
 EXCEPTION TO STANDARDS REPORT PROJECT DESCRIPTION AND NEED The project is located in Section 6, Township 23 North, Range 9 East and Section 31 Township 24 North, Range 9 East, in the Town of Stockton,
Construction Realty Co.
 MEMORANDUM TO: FROM : Jeff Pickus Construction Realty Co. Luay R. Aboona, PE Principal 9575 West Higgins Road, Suite 400 Rosemont, Illinois 60018 p: 847-518-9990 f: 847-518-9987 DATE: May 22, 2014 SUBJECT:
Memorandum. To: Sue Polka, City Engineer, City of Arden Hills. From: Sean Delmore, PE, PTOE. Date: June 21, 2017
 Memorandum engineering planning environmental construction 701 Xenia Avenue South Suite 300 Minneapolis, MN 55416 Tel: 763-541-4800 Fax: 763-541-1700 To: Sue Polka, City Engineer, City of Arden Hills From:
886 March Road McDonald's Transportation Study
 McDonald's Restaurants of Canada Limited March 2013 886 March Road McDonald's Transportation Study Submitted by: HDR Corporation 100 York Boulevard, Suite 300 Richmond Hill, ON L4B 1J8 (905) 882-4100 www.hdrinc.com
Traffic Impact Analysis 5742 BEACH BOULEVARD MIXED USE PROJECT
 Traffic Impact Analysis 5742 BEACH BOULEVARD MIXED USE PROJECT CITY OF BUENA PARK Prepared by Project No. 14139 000 April 17 th, 2015 DKS Associates Jeffrey Heald, P.E. Rohit Itadkar, T.E. 2677 North Main
Craig Scheffler, P.E., PTOE HNTB North Carolina, P.C. HNTB Project File: Subject
 TECHNICAL MEMORANDUM To Kumar Neppalli Traffic Engineering Manager Town of Chapel Hill From Craig Scheffler, P.E., PTOE HNTB North Carolina, P.C. Cc HNTB Project File: 38435 Subject Obey Creek TIS 2022
MILLERSVILLE PARK TRAFFIC IMPACT ANALYSIS ANNE ARUNDEL COUNTY, MARYLAND
 MILLERSVILLE PARK TRAFFIC IMPACT ANALYSIS ANNE ARUNDEL COUNTY, MARYLAND Prepared for: Department of Public Works Anne Arundel County Prepared by: URS Corporation 4 North Park Drive, Suite 3 Hunt Valley,
City of Marina. Regional Roundabout Study Utilizing Caltrans Intersection Control Evaluation Section 4: Transportation Agency for Monterey County
 Regional Roundabout Study Utilizing Caltrans Intersection Control Evaluation Section 4: City of Marina Study Intersections: RESERVATION ROAD AT BEACH ROAD RESERVATION ROAD AT DEFOREST ROAD CARDOZA AVENUE
HUMC/Mountainside Hospital Redevelopment Plan
 Traffic and Parking Analysis HUMC/Mountainside Hospital Redevelopment Plan in Glen Ridge Borough and Montclair Township PREPARED FOR H2M 119 Cherry Hill Road, Suite 110 Parsippany, NJ 07054 862.207.5900
Traffic Impact Study Proposed Residential Development (Watson Parkway North - Starwood Drive Node, City of Guelph)
") Traffic Impact Study Proposed Residential Development (Watson Parkway North - Starwood Drive Node, City of Guelph) Prepared By: 332 Lorne Avenue East Stratford ON N5A 6S4 Prepared for: Paul Kemper, President
Traffic Impact Study Proposed Residential Development (Watson Parkway North - Starwood Drive Node, City of Guelph) Prepared By: 332 Lorne Avenue East Stratford ON N5A 6S4 Prepared for: Paul Kemper, President
The major roadways in the study area are State Route 166 and State Route 33, which are shown on Figure 1-1 and described below:
 3.5 TRAFFIC AND CIRCULATION 3.5.1 Existing Conditions 3.5.1.1 Street Network DRAFT ENVIRONMENTAL IMPACT REPORT The major roadways in the study area are State Route 166 and State Route 33, which are shown
TRANSPORTATION TECHNICAL REPORT
 TRANSPORTATION TECHNICAL REPORT for Sunrise Elementary School Replacement PREPARED FOR: Puyallup School District PREPARED BY: 6544 NE 61 st Street, Seattle, WA 98115 ph: (26) 523-3939 fx: (26) 523-4949
TRAFFIC IMPACT ANALYSIS. for MILTON SQUARE
 TRAFFIC IMPACT ANALYSIS for MILTON SQUARE US Route 7 Milton, Vermont March 5, 2008 LAMOUREUX & DICKINSON 14 Morse Drive Essex Junction, Vermont 05452 (802) 878-4450 Traffic Impact Assessment EXECUTIVE
Traffic Impact Statement (TIS)
") Traffic Impact Statement (TIS) Vincentian PUDA Collier County, FL 10/18/2013 Prepared for: Global Properties of Naples Prepared by: Trebilcock Consulting Solutions, PA 2614 Tamiami Trail N, Suite 615 1205
Traffic Impact Statement (TIS) Vincentian PUDA Collier County, FL 10/18/2013 Prepared for: Global Properties of Naples Prepared by: Trebilcock Consulting Solutions, PA 2614 Tamiami Trail N, Suite 615 1205
Plan Check Policies and Guidelines
 VIII. TRAFFIC SIGNING AND STRIPING PLANS A. INTRODUCTION Traffic signing and striping plans are required for all General Plan Roads and any roadway that is 56-foot wide curb-to-curb (78 R/W) or wider.
Existing Traffic Conditions
 May 14, 2014 Ms. Lorraine Weiss City of San Mateo 330 West 20 th Avenue San Mateo, CA 94403 Subject: Traffic Operational Study for the Proposed Tilton Avenue Residential Development in San Mateo, California
Highway 18 BNSF Railroad Overpass Feasibility Study Craighead County. Executive Summary
 Highway 18 BNSF Railroad Overpass Feasibility Study Craighead County Executive Summary October 2014 Highway 18 BNSF Railroad Overpass Feasibility Study Craighead County Executive Summary October 2014 Prepared
MEMORANDUM. Figure 1. Roundabout Interchange under Alternative D
 MEMORANDUM Date: To: Liz Diamond, Dokken Engineering From: Subject: Dave Stanek, Fehr & Peers Western Placerville Interchanges 2045 Analysis RS08-2639 Fehr & Peers has completed a transportation analysis
City of Lafayette Staff Report Circulation Commission
 City of Lafayette Staff Report Circulation Commission Meeting Date: September 5, 2016 Staff: Subject: James Hinkamp, Transportation Planner Consideration of a No Parking Zone on Victoria Avenue Summary
Downtown One Way Street Conversion Technical Feasibility Report
 Downtown One Way Street Conversion Technical Feasibility Report As part of the City s Transportation Master Plan, this report reviews the technical feasibility of the proposed conversion of the current
Volume 1 Traffic Impact Analysis Turtle Creek Boulevard Dallas, Texas. Kimley-Horn and Associates, Inc. Dallas, Texas.
 Volume 1 Traffic Impact Analysis 2727 Dallas, Texas June 18, 2018 Kimley-Horn and Associates, Inc. Dallas, Texas Project #064523000 Registered Firm F-928 Traffic Impact Analysis 2727 Dallas, Texas Prepared
Interstate Operations Study: Fargo-Moorhead Metropolitan Area Simulation Results
 NDSU Dept #2880 PO Box 6050 Fargo, ND 58108-6050 Tel 701-231-8058 Fax 701-231-6265 www.ugpti.org www.atacenter.org Interstate Operations Study: Fargo-Moorhead Metropolitan Area 2025 Simulation Results
Letter of Transmittal
 Letter of Transmittal To: Chris Lovell City of Richmond Hill Date: 5/2/6 Job 2582 Re: Richmond Hill-South Bryan County Transportation STudy WE ARE SENDING YOU THE FOLLOWING ITEMS ( attached) ( under separate
TRAFFIC DATA. Existing Derousse Ave./River Rd. AM LOS Analysis Existing Derousse Ave./River Rd. PM LOS Analysis
 Appendix E NJ TRANSIT Pennsauken Junction Transit Center and Park & Ride RiverLINE and Atlantic City Line Pennsauken Township, Camden County, New Jersey TRAFFIC DATA Background Traffic Information for
Per Revised Concept Plan Residential Condo/Townhouse. Proposed Land Use per TIS
 January 2, 2018 Mr. Paul DeBotton Marple Associates, L.P. 1604 Walnut Street, 4 th Floor Philadelphia, PA 19103 RE: Langford Run Road Traffic Analysis Proposed Mid County Shopping Center Marple Township,
TRAFFIC IMPACT ANALYSIS SHORTBREAD LOFTS 2009 MODIFICATION Chapel Hill, North Carolina
 TRAFFIC IMPACT ANALYSIS SHORTBREAD LOFTS 2009 MODIFICATION Chapel Hill, North Carolina Prepared for: The Town of Chapel Hill, NC Prepared by: Architects-Engineers-Planners, Inc. November 2009 Traffic Impact
TABLE OF CONTENTS 1.0 INTRODUCTION AND SUMMARY Purpose of Report and Study Objectives... 2
 TABLE OF CONTENTS 1.0 INTRODUCTION AND SUMMARY 1 1.1 Purpose of Report and Study Objectives... 2 1.2 Executive Summary... 3 1.2.1 Site Location and Study Area... 3 1.2.2 Development Description... 3 1.2.3
One Harbor Point Residential
 Residential Gig Harbor, WA Transportation Impact Analysis January 23, 2017 Prepared for: Neil Walter Company PO Box 2181 Tacoma, WA 98401 Prepared by: TENW Transportation Engineering NorthWest 11400 SE
BROWARD BOULEVARD CORRIDOR TRANSIT STUDY
 BROWARD BOULEVARD CORRIDOR TRANSIT STUDY FM # 42802411201 EXECUTIVE SUMMARY July 2012 GOBROWARD Broward Boulevard Corridor Transit Study FM # 42802411201 Executive Summary Prepared For: Ms. Khalilah Ffrench,
To: File From: Adrian Soo, P. Eng. Markham, ON File: Date: August 18, 2015
 Memo To: From: Adrian Soo, P. Eng. Markham, ON : 165620021 Date: Reference: E.C. Row Expressway, Dominion Boulevard Interchange, Dougall Avenue Interchange, and Howard 1. Review of Interchange Geometry
CUY SAFETY STUDY KINSMAN RD (US 422) AT E. 93 RD ST CLEVELAND, OHIO - ODOT DISTRICT 12. October 13, LJB Inc.
 AT E. 93 RD ST CLEVELAND, OHIO - ODOT DISTRICT 12. October 13, LJB Inc.") CUY-422-4.34 SAFETY STUDY KINSMAN RD (US 422) AT E. 93 RD ST CLEVELAND, OHIO - ODOT DISTRICT 12 October 13, 2014 PREPARED BY: LJB Inc. 2500 Newmark Drive Miamisburg, OH 45342 (937) 259-5000 Elizabeth L.
CUY-422-4.34 SAFETY STUDY KINSMAN RD (US 422) AT E. 93 RD ST CLEVELAND, OHIO - ODOT DISTRICT 12 October 13, 2014 PREPARED BY: LJB Inc. 2500 Newmark Drive Miamisburg, OH 45342 (937) 259-5000 Elizabeth L.
ZINFANDEL LANE / SILVERADO TRAIL INTERSECTION TRAFFIC ANALYSIS
 ZINFANDEL LANE / SILVERADO TRAIL INTERSECTION TRAFFIC ANALYSIS UPDATED TRAFFIC STUDY FOR THE PROPOSED RAYMOND VINEYARDS WINERY USE PERMIT MODIFICATION #P11-00156 AUGUST 5, 2014 PREPARED BY: OMNI-MEANS,
STH 60 Northern Reliever Route Feasibility Study Report
 #233087 v3 STH 60 Northern Reliever Route Feasibility Study Report Washington County Public Works Committee Meeting September 28, 2016 1 STH 60 Northern Reliever Route Feasibility Study Hartford Area Development
Proposed Hotel and Restaurant Development
 Traffic Impact Study Proposed Hotel and Restaurant Development Marbledale Road Tuckahoe, NY PREPARED FOR BILLWIN DEVELOPMENT AFFILIATES, LLC 365 WHITE PLAINS ROAD EASTCHESTER, NY. 10709 PREPARED BY Engineering
GASOLINE SERVICE STATION 1618, 1622 ROGER STEVENS DRIVE OTTAWA, ONTARIO TRANSPORTATION IMPACT ASSESSMENT. Prepared for:
 GASOLINE SERVICE STATION 1618, 1622 ROGER STEVENS DRIVE OTTAWA, ONTARIO TRANSPORTATION IMPACT ASSESSMENT Prepared for: Invecta Development (Ottawa) Corporation 758 Shanks Height Milton, ON L9T 7P7 May
Traffic Impact Analysis Farmington Center Village
 Traffic Impact Analysis Farmington Center Village Route 4 (Farmington Avenue) Farmington, Connecticut Prepared for: The Town of Farmington, CT Prepared By: BL Companies Meriden, Connecticut December 2016
State Route 1/State Route 41/ Main Street Intersection Control Evaluation (Step 2) Report. City of Morro Bay. Prepared for: Prepared by:
 Report. City of Morro Bay. Prepared for: Prepared by:") State Route 1/State Route 41/ Main Street Intersection Control Evaluation (Step 2) Report Prepared for: City of Morro Bay Prepared by: (Caltrans Project No. 0515000104, EA 0F670) State Route 1/State Route
State Route 1/State Route 41/ Main Street Intersection Control Evaluation (Step 2) Report Prepared for: City of Morro Bay Prepared by: (Caltrans Project No. 0515000104, EA 0F670) State Route 1/State Route
Plan Check Policies and Guidelines
 Plan Check Policies and Guidelines VII. A. INTRODUCTION Traffic signing and striping plans are required for all General Plan Roads and any roadway that is 56-foot wide curb-to-curb (78 R/W) or wider. Transportation
HIGHWAY 28 FUNCTIONAL DESIGN
 HIGHWAY 28 FUNCTIONAL DESIGN PUBLIC OPEN HOUSE #1 WEDNESDAY, MARCH 12, 2014 Stantec Presenters: Brad Vander Heyden, Project Engineer Neal Cormack, Project Manager Dave Parker, Project Engineer Beth Thola,
Summary of the Alcoa Highway Redevelopment Project
 Appendix B Summary of the Alcoa Highway Redevelopment Project By Marcia Finfer, October 2009 The Timberlake community, along with numerous other concerned citizen groups (including the Lakemoor Hills community)
Transportation & Traffic Engineering
 Transportation & Traffic Engineering 1) Project Description This report presents a summary of findings for a Traffic Impact Analysis (TIA) performed by A+ Engineering, Inc. for the Hill Country Family
LCPS Valley Service Center
 Traffic Impact Study LCPS Valley Service Center Loudoun County, Virginia November 4, 2015 Prepared For: Loudoun County Public Schools 21000 Education Court Ashburn, VA 20148 Prepared by: 1140 Connecticut
APPENDIX B Traffic Analysis
 APPENDIX B Traffic Analysis Rim of the World Unified School District Reconfiguration Prepared for: Rim of the World School District 27315 North Bay Road, Blue Jay, CA 92317 Prepared by: 400 Oceangate,