Roundabout Feasibility Study SR 44 at Grand Avenue TABLE OF CONTENTS
|
|
|
- Marsha McKinney
- 5 years ago
- Views:
Transcription
1
2 Roundabout Feasibility Study SR 44 at Grand Avenue TABLE OF CONTENTS Introduction and Executive Summary... 1 Existing Conditions... 3 Intersection Volume Conditions... 5 Intersection Operations... 9 Safety Considerations Conceptual Geometric Design Benefit-Cost Evaluation Findings and Recommendations References ii
3 Roundabout Feasibility Study SR 44 at Grand Avenue LIST OF FIGURES Exhibit 1: Intersection Layout and Site Vicinity... 3 Exhibit 2: Existing Intersection Approach Conditions... 4 Exhibit 3: Historical Trends on SR 44 (0.1 miles east of Grand Ave)... 6 Exhibit 4: Historical Trends on Grand Avenue (North of SR 44)... 6 Exhibit 5: Historical Trends on Grand Avenue (South of SR 44)... 6 Exhibit 6: Peak Hour Turning Movement Volumes for Existing and 2035 Analysis... 9 Exhibit 7: Crashes Types and Severities SR 44 at Grand Avenue Exhibit 8: Drainage Areas at the Study Intersection Exhibit 9: Field Observed Utilities Exhibit 10: Approximate Location of Utilities (additional utilities may be present) Exhibit 11: Conceptual Single-Lane Roundabout Exhibit 12: Conceptual Future Multilane Roundabout iii
4 Roundabout Feasibility Study SR 44 at Grand Avenue LIST OF TABLES Table 1. Existing Intersection Characteristics... 4 Table 2: Volusia County BEBR Population Growth Rates... 7 Table 3: Adopted CFRPM Growth Rates... 8 Table 4: Volume Projections for Year Table 5: Two-Way Stop Control Results Table 6: Two-Way Stop Control Results 2035 Scenario 1 (2% Annual Growth) Table 7: Signal Control Results Table 8: Signal Control Results 2035 Scenario 1 (2% Annual Growth) Table 9: Signal Control Results 2035 Scenario 2 (5% Annual Growth) Table 10: Single-Lane Roundabout Results Table 11: Single-Lane Roundabout Results 2035 Scenario 1 (2% Annual Growth) Table 12: Single-Lane Roundabout Results 2035 Scenario 2 (5% Annual Growth) Table 13: Multilane Roundabout Results 2035 Scenario 2 (5% Annual Growth) Table 14 Comparison of Signal and Roundabout 2015 Peak Hour Average Delay and LOS Table 15 Comparison of Signal and Roundabout 2035 AM Peak Hour Average Delay and LOS Table 16 Comparison of Signal and Roundabout 2035 PM Peak Hour Average Delay and LOS Table 17. Crash Summary for SR 44 at Grand Avenue (January June 2015) Table 18. Expected Annual Crash Frequency by Traffic Control Alternative Table 19: Planning-Level Costs Table 20: Monetized Life Cycle ( ) Benefit (Roundabout Compared to Traffic Signal) iv
5 Roundabout Feasibility Study SR 44 at Grand Avenue LIST OF APPENDICES Appendix A Traffic Count Data and Historical Volume Trends Appendix B BEBR Projections Appendix C CFRMP Model Plots Appendix D TWSC Operational Analyses Appendix E Signal Operational Analyses Appendix F Roundabout Operational Analyses Appendix G Crash Data Appendix H Roundabout Performance Checks for Design Vehicle and Speed Control Appendix I ROW Maps Appendix J Benefit/Cost Analysis v
6 Roundabout Feasibility Study SR 44 at Grand Avenue INTRODUCTION AND EXECUTIVE SUMMARY An evaluation of the operational and geometric feasibility of a roundabout was conducted for the intersection of SR 44 at Grand Avenue in Volusia County, Florida. The information contained in this report is intended to aid in determining the feasibility of a roundabout based on potential benefits and associated operations at the study intersection. The following represents key findings: The existing two-way stop control (TWSC) currently provides acceptable operations; however, a pattern of angle-crashes suggests a need for safety improvement. The TWSC is expected to operate at LOS F prior to the 2035 design year. The operational analysis indicates a single-lane roundabout will accommodate existing volumes and growth of at least 5% per year through A roundabout is expected to provide lower delays than the signal alternative during the peak hours, particularly for the minor street approaches. Of the 30 reported crashes from January 2010 June 2015, twenty-two (22) were angle collisions (73 percent). Fifteen (15) of the 22 angle crashes resulted in injury, one (1) resulted in a fatality, and six (6) resulted in property damage only. A roundabout is anticipated to serve as a direct countermeasure for angle crashes, reducing total crashes by 71 percent and injury crashes by up to 87%. A roundabout concept with a 160-foot inscribed circle diameter was developed to facilitate ease of expansion to a partial two-lane roundabout if SR 44 is widened in the future. The concept will accommodate a WB-62FL tractor trailer truck for all turning movements. Due to incomplete ROW information, potential ROW impacts on the south side of SR 44 require further investigation. A smaller diameter roundabout (approximately 140 foot) could be considered if ROW impacts are discovered with the current concept. However, the smaller roundabout footprint would require full reconstruction if SR 44 was widened in the future. A roundabout is expected to provide benefits for a possible future trail connection across SR 44 by reducing speeds and providing a raised median refuge for pedestrians. A roundabout is expected to provide over $8 million in life-cycle safety benefit over the existing TWSC. The roundabout is also expected to provide nearly $5 million in combined operational and safety benefit compared to the signal alternative. 1
7 Roundabout Feasibility Study SR 44 at Grand Avenue Based upon the various considerations described above, a single-lane roundabout is expected to be a feasible alternative at the study intersection. The table below provides a brief comparison of the preferred roundabout option to the signal control option. Signal Control Roundabout Operations Safety Intersection Speeds Multimodal Connectivity Aesthetics Truck Accommodation Property Access ROW Implications Overall LOS C or better through the design year 2035 with addition of NB and SB left-turn lanes. Minor Street LOS ranges from C to D in 2015 and D in all future scenarios crashes per year expected (1.02 fatal/injury and 1.97 PDO) Expected total crashes are 13% lower than the existing TWSC. A 41% reduction in injury crashes and 15% increase in PDO crashes is expected from signal implementation. Possible reduction to 45 mph posted speed associated with signal. However, higher speeds are achievable while the SR 44 through movements have a green indication. Provides opportunities for controlled (signalized) crossings. However, compared to a roundabout, pedestrians have more lanes to cross (higher exposure) and a higher-speed environment (higher chance of fatality should a crash occur). No Change. Accommodates WB-62FL design vehicle for all turn movements. No change. Potential need for ROW along Grand Avenue, south of SR 44, to accommodate a NB left-turn lane. Overall LOS C or better for single-lane roundabout through year Single-lane roundabout can accommodate at least 5% growth on all approaches before expansion to a partial two-lane roundabout is needed. LOS D or better provided for all individual approaches through year Compared to the signalized option, this generally results in lower delays, particularly for the minor street entries crashes per year expected (0.22 fatal/injury and 0.77 PDO) Directly addresses the angle-crash pattern at the existing TWSC intersection. Net life-cycle safety benefit of ~$4.4 million over signal alternative and ~$8.2 million over existing two-way stop control (no-build). Reduced speed. Roundabout designed for a maximum (fastest path) speed of 25 mph through each entry. Reduced speeds contribute to reduced crash severity and improved conditions for pedestrians. Improves multimodal safety and connectivity with reduced vehicle speeds and marked crossings. Maximum crossing distance reduced to one lane with splitter islands providing refuge. Two-stage crossing reduces pedestrian delay by allowing each direction of SR 44 to be crossed independently. Opportunities for enhanced aesthetics within the roundabout central island. Accommodates WB-62 for all vehicle turn movements. Full access maintained at BP Driveway connection to Grand Avenue. Driveway connection to SR 44 converted to right-in/right-out. Sufficient ROW (200 feet) is available along SR 44. Further investigation of ROW along Grand Avenue is required. Corner clips could be needed on the south side of SR 44 depending upon the ROW available along Grand Avenue 2
8 Roundabout Feasibility Study SR 44 at Grand Avenue EXISTING CONDITIONS The four-legged intersection is stop-controlled on the northbound and southbound approaches (Grand Avenue) and uncontrolled along the SR 44 approaches. As illustrated in Exhibit 1, there are exclusive left-turn lanes provided on SR 44. No turn lanes are provided on the stop-controlled Grand Avenue approaches. The existing approach conditions are illustrated in Exhibit 2. A BP gas station with convenience store and Subway restaurant is located in the northwest corner of the intersection. Two access points serve the uses in the northwest quadrant: (1) an entrance on SR 44 approximately 300 feet west of Grand Avenue and (2) a driveway on Grand Avenue approximately 250 feet north of the intersection. The remaining three quadrants of the intersection are currently undeveloped, wooded parcels. Although both SR 44 and Grand Avenue are classified as urban roadways by Volusia County, within the immediate intersection vicinity the area type is currently rural and generally undeveloped. The intersection is located approximately 1.5 miles west of the City of DeLand. There is potential for additional future development in the site vicinity as the urbanized area surrounding DeLand expands to the west. This includes a planned future SunRail transit station and surrounding transit-oriented development to the south of the intersection along Grand Avenue. Table 1 summarizes key intersection characteristics. Grand Avenue BP Gas Station Exhibit 1: Intersection Layout and Site Vicinity 3
 SR 44 East Approach (looking east) Exhibit 2:")


, 30 mph (South) SIS Facility No No Sidewalks None None Bike")
9 Roundabout Feasibility Study SR 44 at Grand Avenue Grand Avenue South Approach (looking north) Grand Avenue North Approach (looking south) SR 44 East Approach (looking east) Exhibit 2: Existing Intersection Approach Conditions CR 472 West Approach (looking west) Table 1. Existing Intersection Characteristics Characteristic Roadway SR 44 Grand Ave Direction East/West North/South Roadway Classification Principal Arterial - Urban Major Collector - Urban Cross-Section 2-lane undivided 2-lane undivided Turn Lanes EB and WB left-turn lanes No turn lanes Lane Widths 12 ft lanes 10 ft lanes Shoulder Widths 4 ft paved shoulder No paved shoulder Speed Limit 55 mph 35 mph (North), 30 mph (South) SIS Facility No No Sidewalks None None Bike Lanes None None Street Lighting None None 4
10 Roundabout Feasibility Study SR 44 at Grand Avenue INTERSECTION VOLUME CONDITIONS Historic traffic volume data was reviewed to identify daily volume trends at the intersection. Future growth projections from the regional travel demand model and Bureau of Economic and Business Research (BEBR) were also considered to identify the potential for volume growth. EXISTING VOLUMES Data collected as part of a recent signal warrant analysis conducted for the intersection 1 were used for this assessment. Twenty-four hour directional counts were collected on November 12, During this time period, five pedestrians and twelve bicyclists were observed crossing the intersection. The morning (7:15-8:15 a.m.) and evening (4:45-5:45 p.m.) peak hours were identified from turning movement counts collected at the intersection from 7:00-9:00 a.m., 12:00-3:00 p.m., and 4:00-7:00 p.m. on November 12, The existing count data is included in Appendix A. HISTORICAL TRENDS Historical Annual Average Daily Traffic (AADT) volumes were obtained for FDOT count stations along SR 44 near the study intersection. Historic count data for Grand Avenue was obtained from Volusia County. FDOT count station 0290 is located on SR 44, approximately 0.1 miles east of Grand Avenue. The historical AADT reports are included in Appendix A. The historical volume profile for the most recent 15-year period from 1999 through 2014 is provided in Exhibit 3. SR 44 Historical volumes along SR 44 near the study intersection remained relatively stable with minor yearto-year fluctuations in AADT between 1999 through 2014 (volumes ranged from 9,300 to 11,700 AADT). The historical volume trend between 1999 and 2014 results in a -0.71% linear annual growth rate. Exhibit 3 illustrates the historical AADT on SR 44 between 1999 and Grand Avenue Historical volumes along Grand Avenue, north of SR 44 have ranged from 1,820 AADT (Year 2012) to 2,980 (Year 2007). The historical trend between 2005 and 2014 is a -3.07% annual decrease in volume. South of SR 44, FDOT count station 7059 shows volumes, ranging from 900 AADT (Year 2012) to 1,100 AADT (Year 2009) over the six-year period from 2009 to This results in a decreasing annual trend of -2%. Historic volume data for Grand Avenue is illustrated in Exhibits 4 and 5. 1 Aspireon Consulting Group, Inc. Signal Warrant Analysis. SR 44 and Grand Avenue. April 1, Traffic Trends. Florida Department of Transportation
11 Roundabout Feasibility Study SR 44 at Grand Avenue Average Daily Traffic (Vehicles/Day) Year Exhibit 3: Historical Trends on SR 44 (0.1 miles east of Grand Ave) Average Daily Traffic (Vehicles/Day) Year Exhibit 4: Historical Trends on Grand Avenue (North of SR 44) Year Exhibit 5: Historical Trends on Grand Avenue (South of SR 44) Average Daily Traffic (Vehicles/Day) No FDOT Count Data 6
12 Roundabout Feasibility Study SR 44 at Grand Avenue BEBR POPULATION PROJECTIONS The University of Florida s Bureau of Business and Economic Research (BEBR) projections were obtained for Volusia County for 2015 to The low, medium, and high projections for 2035 are summarized in Table 2. County-wide growth rates range from approximately -0.13% percent up to 1.65% percent. The BEBR population study data is provided in Appendix B. Table 2: Volusia County BEBR Population Growth Rates Estimation Low 2014 Estimate 2035 Projection Annual Growth Rate, Growth/Year (%) 491, (-0.13%) Medium 503, ,800 3,747 (0.74%) High 670,300 8,322 (1.65%) MODEL GROWTH RATES The Central Florida Regional Planning Model (CFRPM) with a base validation year of 2005 and horizon year of 2035 was reviewed to support identification of intersection growth rates. No detailed subarea model validation and refinement was included as part of this roundabout feasibility study. Therefore, model results reflect the results from the adopted CFRPM models. Model AADT for the base year 2005 and horizon year 2035 are summarized in Table 3 along with corresponding growth rates. In comparing the base year 2005 model AADTs against the actual 2005 counts along SR 44, the model is predicting nearly double the actual volume (22,815 in the model vs 11,700 actual counts). Along Grand Avenue, the 2005 base-year model is under-predicting volumes by nearly 250% (750 AADT in the model vs 2,600 actual counts). This suggests that the adopted travel demand model is not adequately calibrated within the sub-area. If a roundabout is further advanced at this location, additional sub-area refinement to the model is suggested to further verify volume estimates. This should include additional coordination with Volusia County regarding plans for the future SunRail Area Activity Center. The model plots are provided in Appendix C. Given the error in the predicted model volumes, only the relative change between the base year and 2035 models was considered. Along SR 44, the model is estimating an annual growth rate of approximately 1% to 1.5% per year. However, the model is projecting a growth of 7,000 to 10,000 AADT along SR 44, which would equate to approximately a 70% to 100% increase when compared to existing volumes. Along Grand Avenue, the results summarized in Table 3 are for informational purposes and were not utilized in this study. The relatively low existing volumes have the potential to be heavily influenced by the timing of future SunRail Activity Center development. Limited volume growth along Grand Avenue (consistent with historical trends) is anticipated until the SunRail station is constructed. 7
13 Roundabout Feasibility Study SR 44 at Grand Avenue Table 3: Adopted CFRPM Growth Rates Segment Description 2005 AADT (FDOT Count) 2014 AADT (FDOT Count) 2005 Model AADT Model AADT 1 Model Growth Rate, AADT/year; (% growth/year) SR 44, east of Grand Ave 11,700 9,800 22,815 29, (0.98%) SR 44, west of Grand Ave NA NA 23,180 33, (1.5%) Grand Ave, north of SR 44 2,600 2, , (40.98%) Grand Ave, south of SR 44 NA 1, , (81.92%) 1 Includes application of MOCF to convert model volumes to AADT FUTURE VOLUMES The historical volume trends, BEBR population projections, and the adopted travel demand model were all considered in identifying a planning-level estimate of potential growth at the study intersection. The data sources were used to identify a linear annual growth rate that was then applied directly to the existing peak hour intersection turning movement volumes to develop a planning-level estimate of AM and PM peak-hour volumes for year Table 4 summarizes existing volumes and 2035 AADT estimates turning movement volumes are illustrated in Exhibit 6. Due to the uncertainty in possible future development activity near the study intersection, two different scenarios were evaluated: The first scenario assumes an annual growth rate of 2% on all approaches. Historical AADTs indicated a negative trend with relatively stable volumes over the past 15 years fluctuating within a range of approximately 2,000 AADT. BEBR population projections also showed a 0% to 1.65% annual growth. Therefore, a 2% annual growth rate may be conservative for estimating regional background growth. This scenario assumes that the planned SunRail station and surrounding TOD is not constructed, where regional background growth would largely dictate future intersection volumes. The second scenario assumes an annual growth rate of 5% on all approaches. Over a 20-year period, this scenario reflects volumes doubling on all approaches. This scenario assumes the addition of approximately 10,000 AADT along SR 44 (100% growth compared to existing volumes) as predicted by the model between 2005 and While a 5% annual growth reflects a relatively high rate, there is potential for the side streets to grow at an even higher rate given the low existing volumes and potential for development around the future SunRail station. The timing and intensity of the actual development of the SunRail station will have a major impact on volumes along Grand Avenue, south of SR 44. The operations analysis includes additional discussion of spare capacity for growth beyond the 5% per year assumed in Scenario 2. The 5% annual growth is expected to result in volumes near Volusia County s adopted LOS D service volume threshold of 24,200 AADT (which reflects existing uninterrupted flow conditions) where consideration may be given to a future widening to a four-lane facility along SR 44. 8
14 Roundabout Feasibility Study SR 44 at Grand Avenue Table 4: Volume Projections for Year 2035 Scenario 1 Scenario 2 Segment Description 2014 AADT Peak Hour Entering Volume Annual Growth Rate 2035 AADT Estimate Annual Growth Rate 2035 AADT Estimate SR 44, East of Grand Ave 489 9,800 SR 44, West of Grand Ave 452 Grand Avenue, North of SR 44 Grand Avenue, South of SR 44 13,720 19,600 2, % 3,200 5% 4,600 1, ,400 2,000 Exhibit 6: Peak Hour Turning Movement Volumes for Existing and 2035 Analysis 9
15 Roundabout Feasibility Study SR 44 at Grand Avenue INTERSECTION OPERATIONS Operational analyses were performed for existing volumes with the existing two-way stop control, a signal, and a roundabout. A planning-level assessment of future 2035 operations was also conducted to evaluate the ability for a signal and roundabout to accommodate forecast growth. The volumes used in the analysis are shown in Exhibit 6. TWSC OPERATIONAL ANALYSIS Operational analyses were performed for existing 2015 and future 2035 peak hour conditions with the existing intersection layout and traffic control. The analysis was conducted based upon 2010 Highway Capacity Manual (HCM) methodologies, as implemented in the HCS 2010 software. Analysis results for 2015 AM and PM peak hours are summarized in Table 5 and Table 6. The operational results are included in Appendix D. Table 5: Two-Way Stop Control Results 2015 Approach (Results reflect critical movement) V/C Ratio AM Peak Hour Average Delay (seconds) 95 th Percentile Queue (ft) 1 V/C Ratio PM Peak Hour Average Delay (seconds) 95 th Percentile Queue (ft) 1 EB SR 44 (Left) EB SR 44 (Thru) Uncontrolled (Free Flow) Movement WB SR 44 (Left) WB SR 44 (Thru) Uncontrolled (Free Flow) Movement NB Grand Ave SB Grand Ave Assumes a length of 25 feet/vehicle The stop-controlled southbound approach operates at a LOS C during the 2015 weekday AM and PM peak hours. The northbound approach operates at an LOS C during the weekday AM peak hour and LOS E during the weekday PM peak hour. Table 6: Two-Way Stop Control Results 2035 Scenario 1 (2% Annual Growth) Approach (Results reflect critical movement) V/C Ratio AM Peak Hour Average Delay (seconds) 95 th Percentile Queue (ft) 1 V/C Ratio PM Peak Hour Average Delay (seconds) 95 th Percentile Queue (ft) 1 EB SR 44 (Left) EB SR 44 (Thru) Uncontrolled (Free Flow) Movement WB SR 44 (Left) WB SR 44 (Thru) Uncontrolled (Free Flow) Movement NB Grand Ave > SB Grand Ave > Assumes a length of 25 feet/vehicle 10
16 Roundabout Feasibility Study SR 44 at Grand Avenue As summarized in Table 6, if intersection volumes grow at two percent per year through 2035 (Scenario 1), the northbound and southbound approaches are forecast to operate with delays greater than 50 seconds which results in an LOS F during the 2035 weekday PM peak hour. Therefore, additional improvements are expected to be needed by 2035 regardless of the volume scenario (Scenario 2 with 5% annual growth will have worse operations than those indicated in Table 6). Given that a signal is currently warranted at the intersection, a conversion to signal or roundabout control in the future is assumed to be necessary and therefore no additional TWSC scenarios were evaluated. SIGNAL OPERATIONAL ANALYSIS Operational analyses were performed for existing 2015 and future 2035 AM and PM peak hour conditions with signal control at the intersection. No additional turn lanes were assumed for the 2015 analysis; however, left-turn lanes were assumed on the northbound and southbound approaches under 2035 forecast conditions. The analysis was conducted based upon 2010 Highway Capacity Manual (HCM) methodologies, as implemented in the HCS 2010 software. Analysis results for 2015 and 2035 AM and PM peak hour scenarios are summarized in Tables 7, 8 and 9, respectively. The operational worksheets are provided in Appendix E. Table 7: Signal Control Results 2015 AM Peak Hour PM Peak Hour Approach V/C Ratio 1 Average Delay (seconds) 50 th Percentile Queue (ft) 2 V/C Ratio 1 Average Delay (seconds) 50 th Percentile Queue (ft) 2 EB SR WB SR NB Grand Ave SB Grand Ave Intersection Reflects critical movement 2 Assumes a length of 25 feet/vehicle Table 8: Signal Control Results 2035 Scenario 1 (2% Annual Growth) AM Peak Hour PM Peak Hour Approach V/C Ratio 1 Average Delay (seconds) 50 th Percentile Queue (ft) 2 V/C Ratio 1 Average Delay (seconds) 50 th Percentile Queue (ft) 2 EB SR WB SR NB Grand Ave SB Grand Ave Intersection Reflects critical movement 2 Assumes a length of 25 feet/vehicle 11
17 Roundabout Feasibility Study SR 44 at Grand Avenue Table 9: Signal Control Results 2035 Scenario 2 (5% Annual Growth) AM Peak Hour PM Peak Hour Approach V/C Ratio 1 Average Delay (seconds) 50 th Percentile Queue (ft) 2 V/C Ratio 1 Average Delay (seconds) 50 th Percentile Queue (ft) 2 EB SR WB SR NB Grand Ave SB Grand Ave Intersection Reflects critical movement 2 Assumes a length of 25 feet/vehicle The analysis results identify that signal control would result in LOS B operations based upon 2015 AM and PM peak hour volumes. All movements operate at a LOS D or better. With 2% annual growth, the intersection is projected to operate at a LOS A during the 2035 AM peak hour and LOS B during the 2035 PM peak hour. All movements operate under capacity with a LOS D or better. With 5% annual growth, the intersection is projected to operate at a LOS B during the 2035 AM peak hour and LOS C during the 2035 PM peak hour. All movements operate at a LOS D or better. ROUNDABOUT OPERATIONAL ANALYSES Operational analyses were performed for existing 2015 and future 2035 weekday AM and PM peak hour volume scenarios. Given the uncertainty regarding future traffic volumes, a single-lane roundabout was evaluated for both volume scenarios (with 2% and 5% annual growth). A partial multilane roundabout was also evaluated for 2035 Scenario 2 (5% annual growth) to demonstrate how a roundabout would operate assuming the widening of SR 44 to four lanes by The multilane roundabout included two-lane approaches on SR 44 (left/through lane and through/right lane) with single-lane entries and exits maintained on the Grand Avenue approaches. FHWA recently commissioned a study (TOPR 34) to collect new U.S. roundabout capacity data to update the capacity equations contained in the Highway Capacity Manual The FHWA TOPR 34 project has yet to be published; however, the field data collection has been concluded and new capacity models have been developed based upon the field-observed data. The new TOPR 34 capacity models were adopted in June 2015 by the Transportation Research Board Committee on Highway Capacity and Quality of Service for inclusion in a major update to the Highway Capacity Manual expected to be released in late 2015/early The TOPR 34 capacity models reflect the most recent data on US roundabout capacities and were utilized for the roundabout operations analysis summarized in this report. The study site also has very low minor street volumes, which is a case where the TOPR 34 model is preferred in order to avoid under-estimating the potential capacity of the major street entries. Analysis results for 2015 and 2035 AM and PM peak hour scenarios are summarized in Tables 10, 11 12, and 13, respectively. The operational worksheets are provided in Appendix F. 12
18 Roundabout Feasibility Study SR 44 at Grand Avenue Table 10: Single-Lane Roundabout Results 2015 AM Peak Hour PM Peak Hour Approach V/C Ratio Average Delay (seconds) 95 th Percentile Queue (ft) 1 V/C Ratio Average Delay (seconds) 95 th Percentile Queue (ft) 1 EB SR WB SR NB Grand SB Grand Intersection Assumes a length of 25 feet/vehicle The analysis results identify a LOS A for the intersection with a roundabout during the 2015 AM and PM peak hours. All movements operate with a v/c ratio of 0.47 or better, indicating ample spare capacity for future growth. Table 11: Single-Lane Roundabout Results 2035 Scenario 1 (2% Annual Growth) AM Peak Hour PM Peak Hour Approach V/C Ratio Average Delay (seconds) 95 th Percentile Queue (ft) 1 V/C Ratio Average Delay (seconds) 95 th Percentile Queue (ft) 1 EB SR WB SR NB Grand SB Grand Intersection Assumes a length of 25 feet/vehicle As summarized in Table 11, a single-lane roundabout is expected continue to provide acceptable operations through year 2035 with a 2% annual growth for all movements. The single-lane roundabout is expected to operate at an overall LOS A during the AM and PM peak hours. All individual movements operate at a v/c ratio of 0.61 or better and a LOS A or B. Table 12: Single-Lane Roundabout Results 2035 Scenario 2 (5% Annual Growth) AM Peak Hour PM Peak Hour Approach V/C Ratio Average Delay (seconds) 95 th Percentile Queue (ft) 1 V/C Ratio Average Delay (seconds) 95 th Percentile Queue (ft) 1 EB SR WB SR NB Grand SB Grand Intersection Assumes a length of 25 feet/vehicle 13
19 Roundabout Feasibility Study SR 44 at Grand Avenue With a 5% annual growth rate applied to all turning movements, a single-lane roundabout continues to provide acceptable operations with an overall LOS of C during both the AM and PM peak hours. However, the EB and WB approaches begin to near the desirable v/c thresholds for a single-lane roundabout as summarized in Table 12. In the AM peak hour, the EB SR 44 approach is estimated to have a v/c ratio of 0.9 and operate at an LOS D. In the 2035 PM peak, the direction reverses and the WB approach is estimated to have a v/c ratio of 0.88 with an LOS D. Both the NB and SB Grand Avenue approaches continue to provide ample spare capacity to accommodate additional growth (beyond the 5% annual growth included in the Scenario 2 projections) from a future SunRail station or associated development. The NB Grand Avenue approach operates with a 0.14 v/c ratio in both the 2035 AM and PM peak hours. As summarized in Table 4, the 5% annual growth assumed in Scenario 2 results in close to 20,000 AADT along SR 44. Volusia County currently identifies an LOS D service volume threshold of 24,200 AADT along SR 44. However, this reflects existing uninterrupted flow conditions and therefore the service volume for the existing two-lane facility is expected to decrease as the mainline becomes interrupted at key intersection such as SR 44/Grand Avenue. Therefore, the potential exists for consideration of widening to a four-lane facility by the time SR 44 reaches volumes similar to those assumed for Scenario 2. A roundabout would be compatible with a future four-lane SR 44 by adding an additional through lane entering, circulating, and exiting in the EB and WB directions. This would result in a partial twolane configuration with single-lane entries and exits remaining on the Grand Avenue approaches. The operations associated with this scenario are summarized in Table 13. Future conversion to a partial multilane roundabout configuration would result in all approaches operating with a v/c ratio of 0.46 or better. This compares to v/c ratios of 0.9 on the EB approach and 0.88 on the WB approach with a single-lane roundabout configuration. Table 13: Multilane Roundabout Results 2035 Scenario 2 (5% Annual Growth) AM Peak Hour PM Peak Hour Approach V/C Ratio Average Delay (seconds) 95 th Percentile Queue (ft) 1 V/C Ratio Average Delay (seconds) 95 th Percentile Queue (ft) 1 EB SR WB SR NB Grand NB Grand Intersection Assumes a length of 25 feet/vehicle The roundabout analysis results show that a single-lane roundabout is expected to provide adequate capacity for intersection volumes to at least double (5% annual growth over 20 years) before expansion to a multilane roundabout might be needed. With appropriate design features, the roundabout can easily be expanded in the future to tie into a future four-lane SR 44, which would provide spare capacity for additional future growth. 14
20 Roundabout Feasibility Study SR 44 at Grand Avenue OPERATIONAL COMPARISON Tables 14, 15, and 16 provide a side-by-side comparison of the operational performance of the signal alternative versus the roundabout alterative. In most cases the roundabout reduces delays compared to the signal alternative, particularly for the minor street. Table 14 Comparison of Signal and Roundabout 2015 Peak Hour Average Delay and LOS 2015 AM Peak Hour 2015 PM Peak Hour Approach Signal Roundabout 1 Signal Roundabout 1 EB SR (A) 7.7(A) 7.6(A) 6.6(A) WB SR (A) 4.8(A) 11.2(B) 7.6(A) NB Grand Ave. 39.5(D) 5.4(A) 39.1(D) 4.9(A) SB Grand Ave. 41.4(D) 4.2(A) 49.2(D) 6.6(A) Intersection Avg. 10.6(B) 6.5(A) 15.4(B) 7.0(A) Notes: Level-of-Service values are shown in brackets (#). Table 15 Comparison of Signal and Roundabout 2035 AM Peak Hour Average Delay and LOS Approach Signal Scenario 1 Signal Scenario 2 Single-Lane Roundabout Scenario 1 Single-Lane Roundabout Scenario 2 Multilane Roundabout Scenario 2 EB SR (A) 8.7(A) 10.4(B) 26.6(D) 7.6(A) WB SR (A) 5.8(A) 5.5(A) 7.4(A) 4.8(A) NB Grand Ave. 37.0(D) 36.3(D) 6.7(A) 10.5(B) 8.1(A) SB Grand Ave. 37.6(D) 37.1(D) 4.8(A) 6.5(A) 5.6(A) Intersection Avg. 8.5(A) 11.5(B) 8.4(A) 19.1(C) 6.5(A) Note: Level-of-Service values are shown in brackets (#) Table 16 Comparison of Signal and Roundabout 2035 PM Peak Hour Average Delay and LOS Approach Signal Scenario 1 Signal Scenario 2 Single-Lane Roundabout Scenario 1 Single-Lane Roundabout Scenario 2 Multilane Roundabout Scenario 2 EB SR (A) 11.1(B) 8.3(A) 14.7(B) 6.5(A) WB SR (A) 22.3(C) 10.2(B) 26.1(D) 7.8(A) NB Grand Ave. 34.7(C) 33.5(C) 5.9(A) 8.6(A) 6.9(A) SB Grand Ave. 37.6(D) 46.9(D) 8.9(A) 18.8(C) 13.2(B) Intersection Avg. 12.2(B) 21.2(C) 9.2(A) 20.0 (C) 7.7(A) Note: Level-of-Service values are shown in brackets (#) 15
21 Roundabout Feasibility Study SR 44 at Grand Avenue SAFETY CONSIDERATIONS In addition to the traffic operations, safety is an important consideration in evaluating possible intersection improvement alternatives. Roundabouts have proven to be an effective intersection treatment for improving safety particularly for reducing severe and fatal crashes. Compared to other intersection control alternatives, roundabouts typically operate with slower operating speeds that increase time for drivers to react and reduce the likelihood of an injury should a crash occur. The number of potential conflict points is also reduced when converting from a stop-controlled intersection to a roundabout. Historical crash data for the study intersection was obtained from the FDOT CARS Database and Signal Four Analytics for the 5.5-year period from January 2010 through June Table 17. Crash Summary for SR 44 at Grand Avenue (January 2010-June 2015) Collision Type * Total Rear End Angle Left-Turn Sideswipe Fixed Object/ Run Off Road Other Total Fatal Crashes Injury Crashes Property Damage Only Day Night Wet Dry *Partial year data- Reflects first 6 months from January through June As shown in Table 17, a total of 30 crashes were reported in the period from January 2010 through June Eighteen (18) of these crashes (60 percent) resulted in injury and eleven (11) crashes (37 percent) resulted in property-damage-only. One fatal angle crash occurred at this intersection in 2013 and involved a southbound vehicle that failed to yield the right-of-way to an eastbound motorcycle. The most common crash type reported at this intersection was the angle crash. Of the 30 reported crashes, twenty-two (22) were angle collisions (73 percent). Fifteen (15) of the angle crashes resulted in injury, one (1) resulted in a fatality, and six (6) resulted in property damage only. Roundabouts have been shown to reduce angle crashes and the injuries associated with them. Therefore, a roundabout is expected to be an effective countermeasure for addressing angle crash patterns at the study intersection. 16
22 Roundabout Feasibility Study SR 44 at Grand Avenue 25 Number of Crashes Fatal Injury PDO Exhibit 7: Crashes Types and Severities SR 44 at Grand Avenue Using crash prediction models identified in the Highway Safety Manual (HSM) (Reference 3), the expected annual number of crashes was predicted for the intersection under stop, signal, and roundabout control. These calculations are summarized in Table 18. To estimate the number of crashes per year that could be expected under roundabout control, a crash modification factor (CMF) from the HSM for the conversion of a stop-controlled intersection into a rural single-lane roundabout was applied to the prediction for a two-way stop controlled intersection; these predictions are summarized in Table 18. Table 18. Expected Annual Crash Frequency by Traffic Control Alternative Traffic Control Alternative Existing Traffic Control (Two-Way Stop-Control) Signal Control Single-Lane Roundabout Expected Fatal and Injury Crashes Expected Property Damage Only Crashes Total Expected Crashes per Year (41% decrease) 0.22 (87% decrease) 1.97 (15% increase) 0.77 (55% decrease) 2.99 (13% decrease) 0.99 (71% decrease) The use of roundabout control to replace the existing two-way stop controlled intersection has the potential to reduce the predicted number of total crashes by 71 percent and injury crashes by 87 percent (Reference 3). This results in a reduction of 2.44 total crashes per year, the majority of which are severe injury or fatal crashes. Estimates for expected crashes under signal control assume addition of NB and SB left-turn lanes on Grand Avenue as well as the addition of intersection lighting. 17
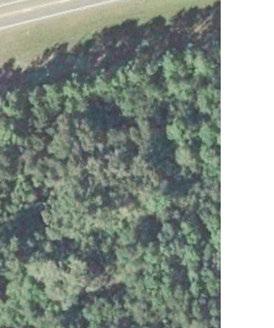
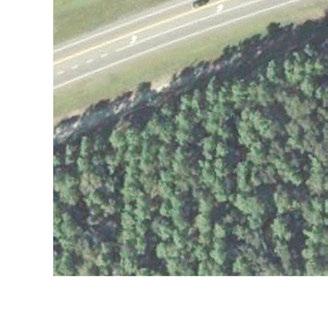
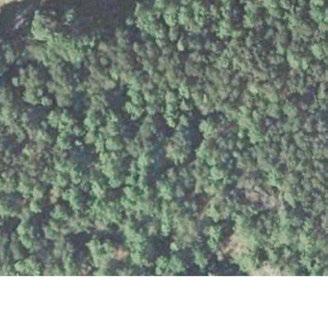
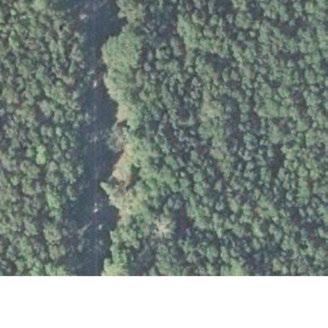
23 Roundabout Feasibility Study SR 44 at Grand Avenue CONCEPTUAL GEOMETRIC DESIGN EXISTING SITE CONDITIONS The following discussion lists important features that may impact roundabout concept development: Right-of-Way: A Right-Of-Way (ROW) map was provided by FDOT. The ROW map is dated from 1939 and indicates a total of 200 feet of ROW along SR 44. Originally, SR 44 was constructed such that the ROW line was positioned 75 feet to the north and 125 feet to the south of the roadway centerline. However, a previous bridge reconstruction over the railroad tracks west of the study intersection resulted in a re-alignment of SR 44 on the west leg of the study intersection. Therefore, the original centerline is no longer available for use in determining the position of the ROW lines. The ROW positioning was estimated based upon available information; however, more detailed ROW verification is needed prior to a project being further advanced. No ROW information was available for Grand Avenue. Pedestrian and Bicycle Considerations: There are no sidewalks or marked pedestrian crossings near the intersection. However, 5 pedestrian crossing movements and 12 bicycle crossing movements were recorded during the latest 8 hour turning movement counts. This indicates the presence of multimodal activity. Transit Considerations: There are no fixed transit routes serving the intersection. Adjacent Property Access: Roundabout placement will need to consider potential impacts to the access of the BP gas station located in the northwest quadrant of the intersection. There are existing driveway openings to the property along SR 44 (300 feet west of the intersection) and Grand Avenue (250 feet north of the intersection). Vertical Geometry and Drainage Considerations: The following list outlines observations from a field review conducted in June o SR 44 is relatively flat through the study intersection at Grand Avenue, with a slope towards the east. A crest vertical curve is located approximately 1000 feet west of the study intersection. o Swales were identified on both sides of SR 44 and Grand Avenue, shown in Exhibit 8. No drainage culverts under the SR 44 or Grand Avenue approaches were identified in the field. 18


.")

24 Roundabout Feasibility Study SR 44 at Grand Avenue Northwest Intersection Quadrant Northeast Intersection Quadrant Southwest Intersection Quadrant Southeast Intersection Quadrant Exhibit 8: Drainage Areas at the Study Intersection Adjacent Utilities: A preliminary review of above ground utilities was completed during the June 2015 field review. Photos of selected utilities are illustrated in Exhibit 9. The approximate utility locations are illustrated in Exhibit 10. Utilities that were identified include: o Underground AT&T and Bellsouth markers are located in the northwest quadrant of the study intersection (Top right image in Exhibit 9). o A fire hydrant is located in front of the gas station on the north side of SR 44, as shown in the top right image in Exhibit 9. o Above ground water valves and/or backflow devices are also present in front of the gas station, illustrated in the bottom left image of Exhibit 9. o Above ground utility lines were observed along the west side of the Grand Avenue approaches and the south side of the eastbound SR 44 approach, shown in bottom right image of Exhibit 9. o Utility poles are located in the northwest and southeast intersection quadrants. 19


25 Roundabout Feasibility Study SR 44 at Grand Avenue Exhibit 9: Field Observed Utilities Grand Avenue Water Valves and Fire Hydrant Utility Pole Underground AT & T Cable Marker Above Ground Utility Lines Utility Pole Exhibit 10: Approximate Location of Utilities (additional utilities may be present) 20
26 Roundabout Feasibility Study SR 44 at Grand Avenue ROUNDABOUT DESIGN CONSIDERATIONS In order to assess the geometric feasibility of a roundabout at the study intersection, a conceptual roundabout design was developed in Microstation to a level that would allow initial screening and discussion of potential impacts. The concept was developed in accordance with the design principles outlined in the NCHRP Report 672, Roundabouts: An Informational Guide 2 nd Edition (Reference 4). The concepts presented in this memorandum represent one possible option for the roundabout horizontal geometry. Roundabout design is based upon a set of fundamental principles which guide the design process. These principles include: (1) achieving speed control at entry, (2) providing appropriate lane numbers and arrangements, (3) appropriately aligning the natural path of vehicles, (4) accommodating the design vehicle, (5) accommodating non-motorized users, and (6) providing adequate sight distance and visibility. Alternative sizes, shapes, placement, and approach alignments may also be acceptable provided that they result in a design that meets these fundamental principles. The following bullet-point discussion summarizes the key considerations in the development of the conceptual designs. The features shown in the concept designs, and discussed below, were developed based upon an iterative process to balance the various roundabout design principles with impacts to adjacent properties. Consideration was also given to allowing flexibility for future expansion from a single-lane configuration to a partial multilane configuration with future widening of SR 44. Design Environment and Context Rural high-speed environment that is expected to transition into more of a suburban environment in the future as development expands to the west of DeLand. Emphasis on maximizing safety performance of the intersection. o Distinct pattern of angle crashes resulting in injury due to high mainline speeds. Intersection is in the vicinity of a future Sunrail commuter rail station. Planned Transit Oriented Development around the station may increase local area traffic long-term. Potential for a future trail along Grand Avenue that would cross SR 44 at the study intersection. Design features to accommodate the future trail crossing were incorporated. Speed Control Posted speed of 55 mph along SR 44. Nearest signal is approximately 1.4 miles to east. Grand Avenue has a 35 mph posted speed north of the intersection and 30 mph posted speed to the south of SR 44. Reduced vehicle speeds entering the intersection is one of the fundamental design criteria for roundabouts. The designs were developed based upon the fastest path criteria from NCHRP Report 672. The design concepts were developed to maintain fastest path speeds entering the roundabout of 25 mph or less for each of the single-lane approaches. 21
27 Roundabout Feasibility Study SR 44 at Grand Avenue Design Vehicle Considerations The roundabout design concepts are assumed to require accommodation of a WB-62FL design vehicle for all movements at the intersection. Each of the roundabout concepts developed were checked using the AutoTurn software to verify accommodation of a WB-62FL design vehicle. Along Grand Avenue, north of SR 44, trucks are prohibited. However, access for deliveries to the BP Gas Station in the NE quadrant is assumed to continue to require WB-62FL accommodation at the north entry and exit of the roundabout. Additional coordination with the gas station owner and/or collection of additional vehicle class data along Grand Avenue is recommended to verify design vehicle needs to and from Grand Avenue. If a smaller design vehicle can be determined to be appropriate for Grand Avenue, then it may be possible to further adjust the roundabout geometry to minimize impacts in the corners of the intersection. Adjacent Property Access Roundabout placement considered potential impacts to the access points of the gas station in the NW quadrant of the intersection. The concepts were developed to maintain full access onto Grand Avenue while converting the SR 44 access to right-in/right-out. Non-Motorized Users Pedestrian crossings are generally positioned one car length (20 to 25 feet) behind the yield line. Splitter island lengths and widths are designed to provide sufficient space for an appropriately sized pedestrian refuge. A future trail planned along Grand Avenue would cross SR 44 at the study intersection. The location of the crossing is currently unknown. However, the splitter islands on both the east and west legs of the intersection have been designed to accommodate connection to the future trail. The reduced roundabout speeds and crossings distances improve safety for existing pedestrians and a future trail connection. The wide splitter islands also provide a refuge for pedestrians in order to cross each direction of SR 44 traffic independently. While not required, supplemental devices such as rectangular rapid flashing beacons (RRFB s) could also be considered as an optional treatment to enhance visibility of the future trail crossing. Given the high speeds and limited shoulder width, bicyclists riding on SR 44 are expected to be more experienced riders. Bicycle ramps are sometimes considered at roundabouts to allow riders to exit onto an adjacent multiuse path to navigate around the roundabout. These ramps are generally considered optional at single-lane roundabouts. Given the expected rider experience level, relatively simple navigation through a single-lane roundabout, and the reduction in vehicle speeds (which are close to the speeds of a bicyclist) no bicycle ramps were included in these initial concepts. However, ramps could be further considered if desired by FDOT or Volusia County. 22
28 Roundabout Feasibility Study SR 44 at Grand Avenue Geometric Design Features The geometric features of the roundabout were developed based upon the design considerations outlined above. The single-lane roundabout concept is illustrated in Exhibit 11. Due to uncertainty regarding future growth, consideration was given to making the roundabout compatible with a future four-lane widening of SR 44. Exhibit 12 illustrates a roundabout concept with future outside widening to a partial two-lane configuration. A 160 foot inscribed circle diameter (ICD) was selected for the single-lane roundabout. This is larger than required for the single-lane configuration. However, it is sized to provide an appropriately sized central island and other design features for a future 180-foot diameter partial two-lane configuration. The ultimate partial two-lane roundabout concept was initially developed. Lanes were then taken away to achieve the opening-year single-lane configuration. By developing the concepts in this manner, the roundabout geometry in the opening year is set up for ease of future expansion with minimal reconstruction. The roundabout was centered within the ROW to minimize the need for additional corner clips. No ROW is expected to be needed on the north side of SR 44 for the initial single-lane roundabout. Along Grand Avenue to the south of SR 44, ROW widths appear to be relatively narrow and may require corner clips. However, ROW information is incomplete along Grand Avenue and additional investigation is required. Centering the roundabout within the ROW creates a natural offset-left approach alignment on the EB entry. Realignment of the WB SR 44 approach, as illustrated in Exhibit 11, is needed to provide adequate speed control. The roundabout is centered on the existing NB and SB Grand Avenue Centerline. Along SR 44, splitter islands approximately 500 feet in length were utilized. Longer splitter islands are desirable in higher speed environments to change the cross-section and alert drivers in advance of the upcoming intersection. A minimum length of 200 feet long is recommended in a higher speed environment. The 500-foot islands shown in Exhibits 11 and 12 provide additional length due to the vertical curve to the west and horizontal curve to the east. 500 feet is approximately equivalent to the stopping sight distance needed for a 55 mph condition. On the east leg, the splitter island length could be reduced to approximately 350 feet to avoid impacts to the residential driveway on the north side of SR 44. Along Grand Avenue, 110-foot splitter islands were utilized for the initial single-lane roundabout in order to maintain 100 foot long splitter islands in the future when the roundabout is expanded to a partial two-lane configuration. The 110 foot islands meet the desirable length identified in NCHRP Report 672 based upon the lower posted 30 and 35 mph posted speeds. Full access to the BP gas station is maintained to the north of the intersection with the splitter island taper ending prior to the BP driveway. A 20-foot circulating width is provided for the single-lane configuration. 16 to 20 feet is the typical range of circulating width for a single-lane roundabout. Lane widths flare through the entries and exits to match the 12-foot approach lanes to the circulatory roadway width. 23
29 GRAND AVE N Feet EXISTING 200' R/W (APPROX.) SR 44 BP GAS STATION SR 44 EXISTING 200' R/W (APPROX.) GRAND AVE DATE DESCRIPTION REVISIONS DATE DESCRIPTION Page 24 STATE OF FLORIDA DEPARTMENT OF TRANSPORTATION ROAD NO. COUNTY FINANCIAL PROJECT ID VOLUSIA SR 44 AT GRAND AVENUE CONCEPTUAL ROUNDABOUT SINGLE LANE CONFIGURATION EXHIBIT NO. 11


30 GRAND AVE N Feet EXISTING 200' R/W (APPROX.) SR 44 BP GAS STATION SR 44 EXISTING 200' R/W (APPROX.) GRAND AVE DATE DESCRIPTION REVISIONS DATE DESCRIPTION Page 25 STATE OF FLORIDA DEPARTMENT OF TRANSPORTATION ROAD NO. COUNTY FINANCIAL PROJECT ID VOLUSIA SR 44 AT GRAND AVENUE CONCEPTUAL ROUNDABOUT TWO LANE CONFIGURATION EXHIBIT NO. 12
31 Roundabout Feasibility Study SR 44 at Grand Avenue BENEFIT-COST EVALUATION An Opinion of Probable Cost was developed for the roundabout alternative based upon current FDOT unit costs. Concept-level costs for design and construction of the single-lane roundabout configuration (illustrated in Exhibit 11) are approximately $1.42 million, as summarized in Table 19. A traffic signal with additional NB and SB left-turn lanes and intersection lighting was assumed to cost approximately $700,000 for design, ROW, and construction. No survey information was available for use in this study and therefore all costs for vertical design elements and drainage are preliminary, with contingency applied for unknowns. Possible sub-surface utility impacts are unknown and no utility relocations were included in the cost estimate. Professional services for design plan preparation and CEI were assumed to represent 20% of the overall construction estimate. No cost was included for a PD&E phase at this location. No ROW information was available along Grand Avenue for this study. However, possible ROW impacts are anticipated. Additional details and documentation of assumptions are provided in Appendix J. Table 19: Planning-Level Costs Roundabout Alternative Signal Alternative Project Engineering and CEI $220,000 $100,000 Right-of-Way $100,000 $100,000 Construction $1,100,000 $500,000 Total $1,420,000 $700,000 As part of Step 2 of the FDOT roundabout feasibility study process, estimates of the life cycle benefits was completed for the roundabout compared to the existing stop control and a signal alternatives. The results are summarized in Table 20. Detailed calculations are provided in Appendix J. Table 20: Monetized Life Cycle ( ) Benefit (Roundabout Compared to Traffic Signal) Performance Measure Roundabout Compared to Existing Stop Control Roundabout Compared to Signal Control Safety Benefit of a Roundabout $8,178,512 $4,425,275 Delay Reduction Benefit of a Roundabout $(101,368) $286,887 Total Benefits $8,077,144 $4,712,162 Added Operations & Maintenance Costs of a Roundabout $40,913 (41,161) Added Capital Costs of a Roundabout $1,420,000 $720,000 Total Costs $1,460,913 $678,839 Life Cycle Benefit/Cost Ratio
32 Roundabout Feasibility Study SR 44 at Grand Avenue The safety analysis assumed the lower 2% annual growth through This yields a lower overall volume exposure at the intersection and thus a more conservative (low) estimate of the roundabout safety benefits versus the signal option. The roundabout is anticipated to provide $8.18 million in lifecycle safety benefit versus the existing two-way stop control. Given that there was a recent fatality at the study intersection, this estimate is again conservative (low) due to the fact that the FDOT benefit/cost tool uses a combined cost for severe (fatal and injury) crashes and therefore elimination of the higher cost of the recent fatal crash is not explicitly included in the benefit calculations. Compared to the signal option (which includes intersection lighting and construction of NB and SB left-turn lanes), the roundabout is expected to provide approximately $4.43 million in safety benefit. The roundabout is anticipated to result in a slight dis-benefit in overall intersection delay compared to the existing two-way stop control given that the mainline movement is currently uncontrolled. However, given that the TWSC is not expected to provide sufficient operations through the design year 2035, some form of change in traffic control will be needed. Compared to the signal option, the single-lane roundabout provides a lower peak-hour delay. Additional off-peak delay benefits, not quantified as part of the analysis, would also be expected with the roundabout alternative. The net benefit from the roundabout alternative compared to the stop controlled alternative is estimated to be $8.1 million and $4.7 million compared to the signal control alternative over the 20- year lifespan. Overall, the roundabout alternative results in a life-cycle benefit/cost of 5.5 compared to the existing two-way stop control (no-build) and 6.9 compared to the traffic signal alternative. This suggests that long-term benefits of a roundabout outweigh the higher initial capital costs of a signal alternative and justifies the cost of a roundabout improvement compared to the no-build alternative. 27
33 Roundabout Feasibility Study SR 44 at Grand Avenue FINDINGS AND RECOMMENDATIONS Based upon the various operational, safety, and geometric considerations documented in this report, a single-lane roundabout is expected to be a feasible alternative at the study intersection. A roundabout serves as a countermeasure to specifically address the pattern of angle crashes, which includes a recent fatal crash. A roundabout is anticipated to reduce total crashes by 71% and injury crashes by 87% compared to the existing two-way stop control. It is also expected to provide better safety performance than the signalized alternative. A single-lane roundabout is anticipated to operate at LOS A based upon existing volumes and provide capacity for volumes to at least double prior to needing expansion to a partial two lane configuration. The roundabout results in a slight increase in overall average delay compared to the existing TWSC, given that the mainline SR 44 is currently uncontrolled. However, the roundabout provides generally lower delays than the signal alternative. Over a 20-year period, a roundabout is expected to provide over $8 million in safety benefit over the existing TWSC. The roundabout is also expected to provide nearly $5 million in combined operational and safety benefit compared to the signal alternative. A roundabout is expected to result in a lifecycle benefit/cost ratio of 6.9 compared to the signal alternative and 5.5 compared to the existing two-way stop control. Based upon the various considerations documented in this report, a roundabout is recommended as the preferred alternative to be advanced for further consideration. 28
34 Roundabout Feasibility Study SR 44 at Grand Avenue REFERENCES 1. Transportation Research Board, Highway Capacity Manual, Transportation Research Board, NCHRP Report 572, Roundabouts in the United States, American Association of State Highway Transportation Officials, Highway Safety Manual, Transportation Research Board, NCHRP Report 672, Roundabouts: An Informational Guide 2 nd Edition,
35 Appendix A Traffic Count Data and Historical Volume Trends
36 STATE OF FLORIDA DEPARTMENT OF TRANSPORTATION SUMMARY OF VEHICLE MOVEMENTS Location: SR 44 & Grand Avenue Section: North/South Street: Grand Avenue MP: 2.45 East/West Street: SR 44 City: DeLand Observer(s): DG County: Volusia Weather: Sunny Date: Road Conditions: Dry Remarks: 11/12/2014 SB Street Name: R T L 1 Grand Avenue N L 1 R T 1 1 T R 1 L EB Street Name: SR 44 SR 44 1 L T R WB Street Name: NB Street Name: Grand Avenue Time Northbound Southbound Total Eastbound Westbound Total Begin/End L T R U Total L T R U Total N/S L T R U Total L T R U Total E/W Total
37 STATE OF FLORIDA DEPARTMENT OF TRANSPORTATION PEDESTRIAN VOLUME SHEET Location: SR 44 & Grand Avenue Section: North/South Street: Grand Avenue MP: East/West Street: SR 44 City: DeLand Observer(s): DG County: Volusia Weather: Sunny Date: Road Conditions: Good Remarks: 11/12/2014 SB Street Name: Grand Avenue Total N EB Street Name: SR 44 WB Street Name: SR Total Total Total NB Street Name: Grand Avenue
38 STATE OF FLORIDA DEPARTMENT OF TRANSPORTATION BICYCLE VOLUME SHEET Location: SR 44 & Grand Avenue Section: North/South Street: Grand Avenue MP: East/West Street: SR 44 City: DeLand Observer(s): DG County: Volusia Weather: Sunny Date: Road Conditions: Good Remarks: 11/12/2014 SB Street Name: Grand Avenue Total N EB Street Name: SR 44 WB Street Name: SR Total Total Total NB Street Name: Grand Avenue
39 Aspireon Consulting Group, Inc. 821 Palmetto Terrace Oviedo, FL Date: November 12, 2014 (Wednesday) City: DeLand Location: SR 44 & Grand Avenue County: Volusia Autos Trucks Turns Grand Avenue SR 44 Start Time Northbound Southbound Eastbound Westbound N/S L T R Peds TOT L T R Peds TOT TOTAL L T R Peds TOT L T R Peds TOT E/W TOTAL Grand Total 7:00 AM :15 AM :30 AM :45 AM Total :00 AM :15 AM :30 AM :45 AM Total :00 PM :15 PM :30 PM :45 PM Total :00 PM :15 PM :30 PM :45 PM Total :00 PM :15 PM :30 PM :45 PM Total :00 PM :15 PM :30 PM :45 PM Total :00 PM :15 PM :30 PM :45 PM Total :00 PM :15 PM :30 PM :45 PM Total Grand Total Approach % Total % Autos % Autos Trucks % Trucks
40 Twenty Four (24) Hour Count Summary for SR 44 and Grand Avenue Time Begin SR 44 Grand Avenue Grand Total EB Direction WB Direction E/W Total NB Direction SB Direction N/S Total 3: : : : : : : : : :00 PM : : : : : : : : : : : :00 AM : : Total 5,788 4, Directional Split 57% 43% 10,145 13% 88% ,589
41 Volusia County 2014 Average Annual Daily Traffic & Historical Counts Cycle DAILY DAILY DAILY PEAK 2Way Count Roadway Roadway on Vol. Co Station SIS Evacuation Maintaining County's Distance No. of Posted 2014 Federal Functional Allowable LOS V/C LOS LOS Road Name Limits (From - To) Number Facility Route Agency Thoroughfare (in miles) Lanes Speed Direction Facility Type Classification AADT AADT AADT AADT AADT AADT AADT AADT AADT AADT* LOS Capacity Ratio Capacity SR A1A - Ocean Shore Blvd. Westmayer Pl. to N. 17th St F Yes FDOT N+S UA_UFH_2W_2L_U_WL Principal Arterial - Other - Urban 6,700 6,100 5,600 4,900 6,000 4,800 5,000 4,700 5,200 5,700 D 24, B 2,170 SR A1A - Ocean Shore Blvd. N. 17th St. to SR F Yes FDOT N+S UA_SSAC1_2W_2L_U_WL Principal Arterial - Other - Urban 8,500 7,500 6,800 5,600 6,400 6,000 6,200 5,900 6,500 6,200 D 17, C 1,600 SR A1A - Ocean Shore Blvd. SR 100 to S. 23rd St F Yes FDOT N+S UA_SSAC2_2W_2L_U_WL Principal Arterial - Other - Urban 10,100 8,700 7,800 7,700 9,200 7,700 7,600 7,700 8,800 8,900 D 17, D 1,330 SR A1A - Ocean Shore Blvd. S. 23rd St. to Volusia Co. Line 0010-F Yes FDOT N+S UA_UFH_2W_2L_U_WL Principal Arterial - Other - Urban 7,300 6,000 5,500 4,600 6,000 5,000 4,700 4,600 5,100 5,400 D 24, B 2,170 SR A1A - Ocean Shore Blvd. Flagler Co Line to High Bridge Rd 368 Yes FDOT Yes N+S UA_UFH_2W_2L_U_WL Principal Arterial - Other - Urban 10,500 16,300 17,100 17,300 15,100 15,700 15,500 15,300 15,800 15,500 D 24, C 2,170 SR A1A - Ocean Shore Blvd. High Bridge Rd to Ormond Mall 368 Yes FDOT Yes N+S UA_UFH_2W_2L_U_WL Principal Arterial - Other - Urban 10,500 16,300 17,100 17,300 15,100 15,700 15,500 15,300 15,800 15,500 D 24, C 2,170 SR A1A - Ocean Shore Blvd. Ormond Mall to Neptune Ave 174 Yes FDOT Yes N+S UA_UFH_2W_2L_U_WL Principal Arterial - Other - Urban 17,600 16,500 16,600 17,500 16,400 15,800 18,500 15,100 15,400 15,700 D 24, C 2,170 SR A1A - Ocean Shore Blvd. Neptune Ave to SR 40 (Granada Blvd.) 5125 Yes FDOT Yes N+S UA_UFH_2W_2L_U_WL Principal Arterial - Other - Urban 17,400 18,400 18,100 17,100 17,900 16,800 15,600 12,300 14,000 16,600 D 24, C 2,170 SR A1A - Atlantic Ave. North SR 40 to Harvard Dr Yes FDOT Yes N+S UA_SSAC2_2W_4L_D_WL Principal Arterial - Other - Urban 19,700 19,100 19,800 17,700 19,500 16,500 16,600 17,600 16,400 15,600 D 39, D 2,920 SR A1A - Atlantic Ave. North Harvard Dr. to SR430/Seabreeze Blvd.) 5121 Yes FDOT Yes N+S UA_SSAC2_2W_4L_D_WL Principal Arterial - Other - Urban 21,000 20,000 24,000 20,000 18,500 17,000 17,100 16,400 17,800 18,200 D 39, D 2,920 SR A1A - Atlantic Ave. North SR 430/Seabreeze Blvd. to SR430/Oakr 5117 Yes FDOT Yes N+S UA_SSAC2_2W_4L_D_WL Principal Arterial - Other - Urban 17,700 16,700 24,300 16,600 17,900 19,800 20,800 17,100 15,200 16,300 D 39, D 2,920 SR A1A - Atlantic Ave. North SR 430/Oakridge Blvd. to US 92/ISB 5115 Yes FDOT Yes N+S UA_SSAC2_2W_4L_D_WL Principal Arterial - Other - Urban 16,000 15,400 21,500 23,500 17,400 17,800 15,200 16,500 17,300 15,300 D 39, D 2,920 SR A1A - Atlantic Ave. South US 92 to Silver Beach Ave Yes FDOT Yes N+S UA_SSAC2_2W_4L_D_WL Principal Arterial - Other - Urban 14,600 13,300 15,400 13,300 12,800 12,200 11,200 12,000 12,700 11,900 D 39, C 2,920 SR A1A - Atlantic Ave. South Silver Beach Ave. to Florida Shores 436 Yes FDOT Yes N+S UA_SSAC2_2W_4L_D_WL Principal Arterial - Other - Urban 16,000 19,500 18,900 10,500 11,400 10,100 10,700 10,400 12,500 11,900 D 39, C 2,920 SR A1A - Atlantic Ave. South Florida Shores to Van Ave Yes FDOT Yes N+S UA_SSAC2_2W_4L_D_WL Principal Arterial - Other - Urban 15,600 13,900 14,900 16,900 11,800 16,100 13,800 11,400 12,800 13,200 D 39, C 2,920 SR A1A - Atlantic Ave. South Van Ave. to SRA1A/Dunlawton Ave. 477 Yes FDOT Yes N+S UA_SSAC2_2W_4L_D_WL Principal Arterial - Other - Urban 17,400 18,800 13,000 16,700 15,800 15,500 13,700 11,200 12,500 11,800 D 39, C 2,920 SR A1A - Dunlawton Ave. SR A1A/Atlantic Ave. to US Yes FDOT Yes E+W UA_SSAC2_2W_4L_D_WL Principal Arterial - Other - Urban 28,500 29,000 29,500 30,000 27,000 24,500 27,000 26,000 26,000 28,000 D 39, D 2,920 SR 5A - Nova Rd. US 1 to Wilmette Ave. 459 Yes FDOT Yes N+S UA_SSAC1_2W_4L_D_WL Principal Arterial - Other - Urban 11,800 15,900 14,700 14,000 13,400 12,800 12,800 12,300 12,400 13,100 D 39, C 3,580 SR 5A - Nova Rd. Wilmette Ave. to SR Yes FDOT Yes N+S UA_SSAC1_2W_6L_D_WL Principal Arterial - Other - Urban 21,500 24,500 26,000 24,500 23,000 23,000 24,000 23,500 23,500 23,500 D 59, C 5,390 SR 5A - Nova Rd. SR 40 to Hand Ave. 510 Yes FDOT Yes N+S UA_SSAC1_2W_6L_D_WL Principal Arterial - Other - Urban 23,500 29,000 29,500 29,000 27,500 26,500 24,000 28,500 27,500 25,500 D 59, C 5,390 SR 5A - Nova Rd. Hand Ave. to LPGA Blvd. 528 Yes FDOT Yes N+S UA_SSAC1_2W_6L_D_WL Principal Arterial - Other - Urban 25,000 31,000 31,000 30,500 29,000 29,000 28,000 28,500 26,000 26,500 D 59, C 5,390 SR 5A - Nova Rd. LPGA Blvd. to SR 430/Mason Blvd 366 Yes FDOT Yes N+S UA_SSAC1_2W_6L_D_WL Principal Arterial - Other - Urban 32,500 31,500 31,000 32,500 30,000 29,500 27,500 27,000 25,500 26,500 D 59, C 5,390 SR 5A - Nova Rd. SR 430/Mason Ave. to US 92/ISB 5088 Yes FDOT Yes N+S UA_SSAC1_2W_6L_D_WL Principal Arterial - Other - Urban 36,000 35,000 35,000 32,000 33,500 32,000 30,000 30,000 31,000 31,500 D 59, C 5,390 SR 5A - Nova Rd. US 92/ISB to Bellevue Ave Yes FDOT Yes N+S UA_SSAC1_2W_6L_D_WL Principal Arterial - Other - Urban 41,000 38,500 38,000 38,000 34,500 35,000 32,500 32,000 33,000 32,500 D 59, C 5,390 SR 5A - Nova Rd. Bellevue Ave. to SR 400/Beville Rd. 348 Yes FDOT Yes N+S UA_SSAC1_2W_6L_D_WL Principal Arterial - Other - Urban 40,000 39,000 38,000 37,000 34,500 35,000 34,000 33,000 33,000 34,500 D 59, C 5,390 SR 5A - Nova Rd. SR 400/Beville Rd. to Big Tree 363 Yes FDOT Yes N+S UA_SSAC1_2W_6L_D_WL Principal Arterial - Other - Urban 30,000 30,000 28,500 29,000 27,500 28,500 27,000 25,500 26,500 26,500 D 59, C 5,390 SR 5A - Nova Rd. Big Tree to Madeline Ave. 363 Yes FDOT Yes N+S UA_SSAC1_2W_5L_D_WL Principal Arterial - Other - Urban 30,000 30,000 28,500 29,000 27,500 28,500 27,000 25,500 26,500 26,500 D 49, C 4,490 SR 5A - Nova Rd. Madeline Ave to SR 421/Dunlawton Ave Yes FDOT Yes N+S UA_SSAC1_2W_4L_D_WL Principal Arterial - Other - Urban 25,000 26,000 26,000 26,500 26,500 27,000 26,500 25,500 26,000 27,000 D 39, C 3,580 SR 5A - Nova Rd. SR 421/Dunlawton Ave. to Spruce Creek 1016 Yes FDOT Yes N+S UA_SSAC1_2W_4L_D_WL Principal Arterial - Other - Urban 23,500 25,500 24,500 24,500 25,000 25,500 23,500 25,000 24,500 26,000 D 39, C 3,580 SR 5A - Nova Rd. Spruce Creek Rd. to US Yes FDOT Yes N+S UA_SSAC1_2W_4L_D_WL Principal Arterial - Other - Urban 16,400 17,400 16,900 17,100 16,700 16,900 16,800 16,300 16,800 17,900 D 39, C 3,580 SR 11 CR 304 (in Flagler Co.) to SR F FDOT Yes N+S RUA_UFH_2W_2L_U_0L Principal Arterial - Other - Rural 3,100 3,000 3,200 2,600 2,400 2,200 2,000 2,200 2,100 2,400 C 6, B 590 SR 11 SR 40 to CR 15A 527 FDOT Yes N+S RUA_UFH_2W_2L_U_0L Principal Arterial - Other - Rural 3,200 3,000 3,100 2,700 2,600 2,600 2,700 2,700 2,800 2,900 C 6, B 590 SR 11 CR 15A to US 17 4 FDOT Yes N+S UA_UFH_2W_2L_U_WL Principal Arterial - Other - Urban 7,200 7,200 6,800 6,900 6,400 6,000 6,100 6,000 6,300 6,200 D 24, B 2,170 SR 15A US 17 to Glenwood Rd. 466 Yes FDOT Yes N+S UA_SSAC1_2W_4L_D_WL Principal Arterial - Other - Urban 11,600 10,900 11,400 10,600 10,800 10,700 10,300 10,200 10,600 10,500 D 37, C 3,580 SR 15A Glenwood Rd. to CR Yes FDOT Yes N+S UA_SSAC1_2W_4L_D_WL Principal Arterial - Other - Urban 15,000 13,700 15,100 13,800 14,000 13,800 13,800 13,100 13,600 13,400 D 37, C 3,580 SR 15A CR 92 to Plymouth Ave. 537 Yes Yes FDOT Yes N+S UA_SSAC1_2W_4L_D_WL Principal Arterial - Other - Urban 24,000 23,000 23,500 22,500 22,000 22,000 22,500 18,900 21,500 20,800 D 37, C 3,580 SR 15A Plymouth Ave. to SR 44/New York Ave. 463 Yes Yes FDOT Yes N+S UA_SSAC1_2W_4L_D_WL Principal Arterial - Other - Urban 26,000 27,000 26,000 26,500 25,500 23,500 21,900 23,000 23,000 25,000 D 37, C 3,580 SR 15A SR 44/New York Ave. to Beresford Ave. 474 Yes FDOT Yes N+S UA_SSAC1_2W_4L_D_WL Principal Arterial - Other - Urban 25,500 24,500 24,500 23,500 22,500 22,500 21,500 21,000 22,000 22,000 D 37, C 3,580 SR 15A Beresford Ave. to New Hampshire Ave. 6 Yes FDOT Yes N+S UA_SSAC1_2W_4L_D_WL Principal Arterial - Other - Urban 22,500 24,000 22,000 21,000 20,000 19,200 21,000 20,500 21,000 20,100 D 37, C 3,580 SR 15A New Hampshire Ave. to US 17/ Yes FDOT Yes N+S UA_SSAC1_2W_4L_D_WL Principal Arterial - Other - Urban 22,000 22,500 22,000 21,000 21,000 19,100 19,700 19,000 20,500 21,000 D 37, C 3,580 SR 40 W. of the St. Johns River 0050-L Yes Yes FDOT 2 45 E+W RDA_UFH_2W_2L_U_WL Principal Arterial - Other - Rural 8,800 8,700 8,300 7,200 7,500 7,100 6,800 6,400 7,300 8,000 C 16, B 1,550 SR 40 Lake County to Emporia Rd. 533 Yes Yes FDOT Yes E+W RDA_UFH_2W_2L_U_WL Principal Arterial - Other - Rural 7,300 7,600 8,700 7,600 7,700 6,800 7,000 6,800 6,300 6,800 C 16, B 1,550 SR 40 Emporia Rd. to US Yes Yes FDOT Yes E+W RDA_UFH_2W_2L_U_WL Principal Arterial - Other - Rural 6,900 7,500 8,300 7,200 7,000 6,500 6,500 6,600 5,900 6,200 C 16, B 1,550 SR 40 US 17 to SR Yes Yes FDOT Yes E+W RDA_UFH_2W_2L_U_WL Principal Arterial - Other - Rural 5,600 5,800 6,000 5,800 5,700 6,000 4,800 5,400 5,500 5,600 C 16, B 1,550 SR 40 SR 11 to Pinto Lane 530 Yes Yes FDOT Yes E+W RDA_UFH_2W_2L_U_WL Principal Arterial - Other - Rural 5,600 5,800 6,000 5,800 5,700 6,000 4,800 5,400 5,500 5,600 C 16, B 1,550 SR 40 Pinto Lane to Rima Ridge Rd (urban bou 523 Yes Yes FDOT Yes E+W UA_SSAC1_2W_4L_D_WL Principal Arterial - Other - Urban/Rural 13,000 13,500 11,200 10,800 10,800 10,000 10,600 9,400 9,400 10,000 D 37, C 3,580 SR 40 Rima Ridge Rd to Tymber Creek Rd. 499 Yes Yes FDOT Yes E+W UA_SSAC1_2W_4L_D_WL Principal Arterial - Other - Urban 28,500 28,000 28,500 26,500 29,000 27,000 27,000 26,500 27,000 27,000 D 37, C 3,580 SR 40 Tymber Creek Rd. to I Yes Yes FDOT Yes E+W UA_SSAC1_2W_4L_D_WL Principal Arterial - Other - Urban 28,500 28,000 28,500 26,500 29,000 27,000 27,000 26,500 27,000 27,000 D 37, C 3,580 SR 40 I-95 to Clyde Morris Blvd. 522 Yes FDOT Yes E+W UA_SSAC1_2W_4L_D_WL Principal Arterial - Other - Urban 38,500 36,500 38,000 37,500 35,500 36,000 36,000 33,000 33,500 34,500 D 39, C 3,580 SR 40 Clyde Morris Blvd. to SR 5A/Nova Rd. 489 Yes FDOT Yes E+W UA_SSAC1_2W_4L_D_WL Principal Arterial - Other - Urban 37,000 36,000 36,000 35,000 33,500 33,000 33,000 33,000 32,000 33,000 D 39, C 3,580 SR 40 SR5A/Nova Rd. to US Yes FDOT Yes E+W UA_SSAC1_2W_4L_D_WL Principal Arterial - Other - Urban 31,500 33,000 32,500 32,000 32,000 29,500 30,000 30,000 30,000 30,000 D 39, C 3,580 SR 40 US 1 to Halifax Ave. 171 Yes FDOT Yes E+W UA_SSAC2_2W_4L_D_WL Principal Arterial - Other - Urban 39,500 35,500 34,500 36,500 34,500 34,000 34,000 33,500 34,000 31,500 D 32, D 2,920 SR 40 Halifax Ave. to SR A1A 5128 Yes FDOT Yes E+W UA_SSAC2_2W_4L_D_WL Principal Arterial - Other - Urban 23,000 23,000 25,000 24,000 22,000 19,500 20,500 18,000 18,900 19,500 D 32, D 2,920 SR 44 W. of the St. Johns River 0010-L Yes FDOT 2 45 E+W RDA_UFH_2W_2L_U_WL Principal Arterial - Other - Rural 7,700 7,500 7,200 6,500 6,200 5,600 5,900 6,200 5,500 5,600 C 16, B 1,550 SR 44 Lake Co. to Shell Rd Yes FDOT Yes E+W RDA_UFH_2W_2L_U_WL Principal Arterial - Other - Rural 11,300 11,400 12,000 10,600 10,400 9,400 9,000 9,400 9,200 9,600 C 16, C 1,550 SR 44 Shell Rd. to Grand Ave Yes FDOT Yes E+W UA_UFH_2W_2L_U_WL Principal Arterial - Other - Urban 11,300 11,400 12,000 10,600 10,400 9,400 9,000 9,400 9,200 9,600 D 24, C 2,170 SR 44 Grand Ave. to Old New York/Hazen Rd. 290 Yes FDOT Yes E+W UA_UFH_2W_2L_U_WL Principal Arterial - Other - Urban 11,700 11,600 11,500 10,500 10,800 10,400 9,700 9,300 9,700 9,800 D 24, C 2,170 SR 44 Old New York/Hazen Rd. to SR 15A/Spr 274 Yes FDOT Yes E+W UA_UFH_2W_2L_U_WL Principal Arterial - Other - Urban 14,400 14,300 13,600 12,700 10,600 12,500 11,800 11,500 11,700 11,600 D 24, C 2,170 SR 44 SR 15A/Spring Garden Ave. to Stone St. 447 Yes FDOT Yes E+W UA_SSAC1_2W_2L_U_WL Principal Arterial - Other - Urban 13,400 13,300 12,500 12,000 12,000 11,400 11,300 11,300 10,600 10,800 E 18, C 1,712 SR 44 Stone St. to Clara Ave Yes FDOT Yes E+W UA_SSAC1_2W_2L_U_WL Principal Arterial - Other - Urban 13,100 12,900 12,300 12,200 12,200 10,900 11,100 10,900 10,600 10,300 E 18, C 1,712 SR 44 Clara Ave. to Amelia Ave Yes FDOT Yes E+W UA_SSAC2_2W_2L_U_WL Principal Arterial - Other - Urban 10,600 10,000 9,800 9,900 9,700 9,900 9,200 9,400 8,700 8,600 E 15, D 1,410 SR 44 Amelia Ave. to Hill Ave Yes FDOT Yes /40/45 E+W UA_SSAC1_2W_2L_U_WL Principal Arterial - Other - Urban 14,700 15,300 13,200 15,900 13,600 13,700 13,300 13,000 14,100 12,200 E 18, C 1,712 SR 44 Hill Ave. to Blue Lake Ave. 80 Yes FDOT Yes E+W UA_SSAC1_2W_2L_U_WL Principal Arterial - Other - Urban 13,200 14,600 15,600 12,600 14,500 12,300 13,300 13,000 12,600 11,900 DeLand 19, ,712 SR 44 Blue Lake Ave. to Kepler Rd. 19 Yes FDOT Yes E+W UA_SSAC1_2W_2L_U_WL Principal Arterial - Other - Urban 16,400 17,700 15,000 15,800 15,100 14,600 16,400 15,600 15,900 14,300 DeLand 20, ,712 SR 44 Kepler Rd. to Summit Ave. 259 Yes FDOT Yes E+W UA_SSAC1_2W_2L_U_WL Principal Arterial - Other - Urban 16,100 18,000 17,200 17,300 17,300 17,800 18,300 17,800 18,000 16,700 DeLand 19, ,712 SR 44 Summit Ave. to I Yes FDOT Yes E+W UA_SSAC1_2W_4L_D_WL Principal Arterial - Other - Urban 16,200 16,800 17,200 15,100 16,300 16,800 16,800 17,500 17,000 15,200 D 39, C 3,580 SR 44 I-4 to Prevatt Ave. 480 Yes FDOT Yes E+W UA_SSAC1_2W_4L_D_WL Principal Arterial - Other - Urban 17,200 14,700 15,300 16,700 17,600 17,700 16,400 17,200 19,900 18,700 D 39, C 3,580 SR 44 Prevatt Ave. to Pioneer Tr. 41 Yes FDOT Yes E+W RDA_UFH_2W_4L_D_WL Principal Arterial - Other - Rural 17,200 14,700 12,200 13,100 15,100 15,100 13,600 14,900 16,700 16,400 C 25, B 3,860 SR 44 Pioneer Tr. to SR 415/CR Yes FDOT Yes E+W RDA_UFH_2W_4L_D_WL Principal Arterial - Other - Rural 10,300 9,400 12,200 10,900 12,000 12,400 10,500 9,900 12,200 12,500 C 25, B 3,860 SR 44 SR 415/CR 415 to Samsula Dr Yes FDOT Yes E+W RDA_UFH_2W_4L_D_WL Principal Arterial - Other - Rural 14,200 14,000 14,900 15,100 16,400 17,300 15,800 13,500 15,700 17,000 C 25, B 3,860 SR 44 Samsula Dr. to Airport Rd 423 Yes FDOT Yes E+W RDA_UFH_2W_4L_D_WL Principal Arterial - Other - Urban/Rural 14,300 18,200 18,800 15,700 18,200 17,700 16,200 14,400 18,300 17,400 C 25, B 4,460 SR 44 Airport Rd. to I Yes FDOT Yes E+W UA_SSAC1_2W_4L_D_WL Principal Arterial - Other - Urban 14,300 18,200 18,800 15,700 18,200 17,700 16,200 14,400 18,300 17,400 D 39, C 3,580 SR 44 I-95 to Mission Dr 515 Yes FDOT Yes E+W UA_SSAC1_2W_4L_D_WL Principal Arterial - Other - Urban 22,000 23,000 25,500 23,500 25,500 22,500 25,000 27,500 30,000 27,500 D 39, C 3,580 SR 44 Mission Dr. to Live Oak 514 Yes FDOT Yes E+W UA_SSAC1_2W_4L_D_WL Principal Arterial - Other - Urban 18,200 19,000 20,200 19,300 22,000 22,500 17,800 18,700 19,600 18,300 D 39, C 3,580 SR 44/SR A1A/S Causeway Live Oak to Peninsula Ave. 207 Yes FDOT Yes E+W UA_SSAC1_2W_4L_D_WL Principal Arterial - Other - Urban 26,000 25,500 31,000 28,000 30,000 29,500 24,000 26,500 26,500 27,000 D 39, C 3,580 SR 44/SR A1A/S Causeway Peninsula Ave. to Saxon Dr Yes FDOT Yes E+W UA_SSAC1_2W_4L_D_WL Principal Arterial - Other - Urban 23,000 21,500 27,500 25,000 26,000 25,000 21,000 22,500 23,000 22,000 D 39, C 3,580 SR 44/SR A1A/3rd Ave/Atlantic Saxon Dr. to 6th Ave 5043 Yes FDOT Yes E+W UA_SSAC1_2W_4L_D_WL Principal Arterial - Other - Urban 13,500 13,200 16,700 16,800 18,300 17,000 14,000 15,300 14,200 14,000 D 39, C 3,580 SR 44 (Business) - Canal St. SR 44/Lytle St to Pioneer Trail 516 FDOT Yes E+W UA_SSAC1_2W_2L_U_WL Minor Arterial - Urban 12,800 13,100 14,800 12,500 12,200 11,200 11,400 10,800 11,300 10,500 D 17, C 1,600 SR 44 (Business) - Canal St. Pioneer Tr. to US FDOT Yes E+W UA_SSAC1_2W_2L_U_WL Minor Arterial - Urban 13,700 13,600 14,900 13,000 12,500 11,500 11,700 11,100 11,600 11,500 D 17, C 1,600 SR 44 (Old) - N Causeway Riverside Dr to Peninsula 421 FDOT Yes E+W UA_SSAC2_2W_2L_U_WL Minor Arterial - Urban 10,000 9,000 8,900 9,600 9,200 8,600 9,000 9,300 10,200 8,400 D 14, D 1,330 SR 46 Seminole Co. to Brevard Co B FDOT Yes E+W RUA_UFH_2W_2L_U_WL Principal Arterial - Other - Rural 6,000 5,700-5,500 8,500 5,200 5,600 6,000 5,600 5,300 C 8, C 790 SR Flagler County John Anderson Hwy (CR 201) to Lamber 1000-F Yes FDOT E+W UA_SSAC1_2W_4L_D_WL Principal Arterial - Other - Urban 18,000 17,000 16,900 16,600 17,400 16,400 16,700 16,300 17,300 18,500 D 39, C 3,580 SR Flagler County Lambert Ave. (CR 201) to SR A1A 5012-F Yes FDOT E+W UA_SSAC1_2W_4L_D_WL Principal Arterial - Other - Urban 13,600 12,500 12,200 12,400 14,000 11,500 12,100 11,200 12,900 14,100 D 39, C 3,580 SR Beville Rd. I-95 to Williamson Blvd. 501 Yes FDOT Yes E+W UA_SSAC1_2W_4L_D_WL Principal Arterial - Other - Urban 27,500 28,500 25,500 24,500 24,000 24,500 24,000 24,000 26,500 28,000 D 39, C 3,580 SR Beville Rd. Williamson Blvd. to SR 483/Clyde Morris 5189 Yes FDOT Yes E+W UA_SSAC1_2W_4L_D_WL Principal Arterial - Other - Urban 27,500 28,500 29,000 27,500 27,500 27,500 27,000 26,500 28,500 31,000 D 39, C 3,580 SR Beville Rd. SR 483/Clyde Morris Blvd. to SR 5A/Nov 511 Yes FDOT Yes E+W UA_SSAC1_2W_4L_D_WL Principal Arterial - Other - Urban 35,000 34,500 34,000 32,500 32,500 31,000 32,000 33,000 33,000 33,000 D 39, C 3,580 SR Beville Rd. SR 5A/Nova Rd. to US Yes FDOT Yes E+W UA_SSAC1_2W_4L_D_WL Principal Arterial - Other - Urban 28,500 26,000 25,000 26,000 24,500 24,500 23,000 24,000 24,500 25,500 D 39, C 3,580 SR State Count SR 44 to Acorn Lake Rd 1009 Yes FDOT Yes N+S RDA_UFH_2W_2L_U_WL Minor Arterial - Rural 9,700 9,500 10,500 9,100 9,200 7,300 8,300 7,700 9,000 9,000 C 16, C 1,550 SR State Count Acorn Lake Rd to Howland Blvd. 321 Yes FDOT Yes N+S UA_UFH_2W_2L_U_WL Minor Arterial - Urban 6,100 7,300 6,600 6,200 6,700 6,400 5,900 6,500 6,500 6,600 D 24, B 2,170 SR State Count Howland Blvd. to Enterprise-Osteen Rd. 437 Yes FDOT Yes N+S UA_UFH_2W_2L_U_WL Minor Arterial - Urban 14,200 14,000 15,700 15,200 15,300 15,100 15,100 15,200 15,200 15,400 D 24, C 2,170 SR State Count Enterprise-Osteen Rd. to Seminole Co. 25 Yes FDOT Yes N+S UA_UFH_2W_2L_U_WL Minor Arterial - Urban/Rural 17,700 17,500 19,300 18,200 17,100 17,100 16,800 16,800 16,800 17,000 D 24, C 2,170 SR State Count Volusia Co. Line to SR S Yes FDOT N+S UA_UFH_2W_2L_U_WL Minor Arterial - Rural 15,400 14,900-15,400 14,100 14,200 15,400 15,200 15,200 15,400 C 24, C 1,530 * 2014 AADT's for City of Deltona Port Orange are 2015 AADT's Page AADTs Volusia County.xlsx
42 Volusia County 2014 Average Annual Daily Traffic & Historical Counts Cycle DAILY DAILY DAILY PEAK 2Way Count Roadway Roadway on Vol. Co Station SIS Evacuation Maintaining County's Distance No. of Posted 2014 Federal Functional Allowable LOS V/C LOS LOS Road Name Limits (From - To) Number Facility Route Agency Thoroughfare (in miles) Lanes Speed Direction Facility Type Classification AADT AADT AADT AADT AADT AADT AADT AADT AADT AADT* LOS Capacity Ratio Capacity Dirksen/DeBary/Doyle US 17/92 to Sunrise Blvd. 520 County Yes E+W UA_NSSRC1_2W_2L_U_0L Minor Arterial - Urban 7,750 8,110 8,950 7,110 6,330 6,270 6,910 6,230 6,190 6,680 E 13, C 1,230 Dirksen/DeBary/Doyle Sunrise Blvd to WB I-4 Ramps 521 County Yes E+W UA_NSSRC1_2W_2L_U_0L Minor Arterial - Urban 13,370 13,170 16,300 11,510 10,980 10,720 11,180 10,690 9,980 10,660 E 13, C 1,230 Dirksen/DeBary/Doyle WB I-4 Ramps to EB I-4 Ramps 522 County Yes E+W UA_NSSRC2_2W_4L_D_WL Minor Arterial - Urban 21,200 21,670 22,930 18,940 18,470 17,940 18,660 17,850 17,380 17,850 E 30, D 2,740 Dirksen/DeBary/Doyle I-4 to Deltona Blvd. 480 County Yes E+W UA_NSSRC2_2W_4L_D_WL Minor Arterial - Urban 29,800 31,030 31,210 27,480 26,450 25,730 26,830 26,260 25,480 24,950 E 30, D 2,740 Dirksen/DeBary/Doyle Deltona Blvd. to Enterprise St. 481 County Yes E+W UA_NSSRC2_2W_4L_D_WL Minor Arterial - Urban 20,040 20,900 20,510 17,820 17,680 17,220 17,190 17,630 17,240 17,240 E 30, D 2,740 Dirksen/DeBary/Doyle Enterprise St. to Main St. 482 County Yes E+W UA_NSSRC2_2W_4L_D_WL Minor Arterial - Urban 19,650 20,070 19,980 17,150 16,970 22,090 23,180 23,030 22,400 24,130 E 30, D 2,740 Dirksen/DeBary/Doyle Main St. to Providence Blvd. 484 County Yes E+W UA_NSSRC2_2W_4L_D_WL Minor Arterial - Urban 21,940 22,160 21,930 19,300 18,560 19,280 20,230 21,260 20,460 20,600 E 30, D 2,740 Dirksen/DeBary/Doyle Providence Blvd. to Garfield Rd. 485 County Yes E+W UA_NSSRC1_2W_2L_U_0L Minor Arterial - Urban 13,910 12,340 13,250 11,660 11,570 10,670 11,700 12,400 11,890 11,950 E 13, C 1,230 Dirksen/DeBary/Doyle Garfield Rd. to Saxon Blvd. 530 County Yes E+W UA_NSSRC1_2W_2L_U_0L Minor Arterial - Urban 10,260 10,030 10,760 9,120 9,670 7,590 9,420 9,580 9,220 9,240 E 13, C 1,230 Dirksen/DeBary/Doyle Saxon Blvd. to Courtland Blvd. 531 County Yes E+W UA_NSSRC1_2W_2L_U_0L Minor Arterial - Urban 9,380 9,170 9,020 8,180 8,870 8,720 7,880 8,020 7,800 7,670 E 13, C 1,230 Dirksen/DeBary/Doyle Courtland Blvd. to SR County Yes E+W UA_NSSRC1_2W_2L_U_0L Minor Arterial - Urban 5,770 5,730 6,700 5,830 6,370 5,800 6,020 5,950 5,680 5,450 E 13, C 1,230 Dunn/George Engram/Fairview/Ma Tomoka Farms Rd. to Williamson Blvd. 716 County Yes E+W UA_NSSRC1_2W_2L_U_WL Major Collector - Urban ,220 1,660 1,800 2,350 E 17, C 1,540 Dunn/George Engram/Fairview/Ma Williamson Blvd. to Bill France Blvd. 717 County Yes E+W UA_NSSRC1_2W_2L_U_WL Minor Arterial - Urban ,140 6,150 5,910 6,530 6,760 6,940 E 17, C 1,540 Dunn/George Engram/Fairview/Ma Bill France Blvd. to Clyde Morris Blvd. 718(DB-54) County Yes E+W UA_NSSRC2_2W_2L_U_WL Minor Arterial - Urban 13,512 16,618 19,622 13,264 12,430 12,740 11,350 11,530 11,350 12,080 E 14, D 1,270 Dunn/George Engram/Fairview/Ma Clyde Morris Blvd. to Nova Rd. 719(DB-46) County Yes E+W UA_NSSRC1_2W_4L_D_WL Minor Arterial - Urban 13,440 13,190 13,780 13,770 11,410 11,590 10,550 10,400 10,150 10,730 E 37, C 3,410 Dunn/George Engram/Fairview/Ma Nova Rd. to US County Yes E+W UA_NSSRC2_2W_4L_D_WL Minor Arterial - Urban 12,210 11,760 12,880 11,330 11,790 12,090 10,430 10,310 10,230 10,830 E 30, C 2,740 Dunn/George Engram/Fairview/Ma US 1 to Beach St 631 County Yes E+W UA_NSSRC2_2W_2L_U_WL Minor Arterial - Urban 5,960 5,640 6,200 5,590 5,500 5,670 5,570 5,060 5,380 4,990 E 14, C 1,270 Dunn/George Engram/Fairview/Ma Beach St. to Peninsula Dr County Yes E+W UA_NSSRC2_2W_2L_U_WL Minor Arterial - Urban 7,530 7,080 7,650 7,050 6,220 6,710 6,980 6,330 6,560 6,190 E 14, C 1,270 Dunn/George Engram/Fairview/Ma Peninsula Dr. to SR A1A 1171 County Yes E+W UA_NSSRC2_2W_2L_U_0L Minor Arterial - Urban 6,750 6,250 6,770 6,640 5,360 5,870 6,010 5,700 5,540 5,210 E 13, C 1,020 Elkcam Blvd. (DEL) Normandy Blvd. to Ft. Smith Blvd. DLT City No E+W UA_NSSRC2_2W_2L_U_0L Major Collector - Urban 12,570-10,153 5, ,500 7,850 D 10, D 960 Elkcam Blvd. (DEL) Ft. Smith Blvd. to Providence Blvd. DLT City No E+W UA_NSSRC2_2W_2L_U_0L Major Collector - Urban 8,890-7,158 4, ,130 6,280 D 10, D 960 Elkcam Blvd. (DEL) Providence Blvd. to Montecito Ave. DLT City No E+W UA_NSSRC2_2W_2L_U_0L Major Collector - Urban 13,360-11,751 11, ,080 10,170 D 10, D 960 Elkcam Blvd. (DEL) Montecito Ave. to Howland Blvd. DLT City No E+W UA_NSSRC2_2W_2L_U_0L Major Collector - Urban 12,590-5,591 10, ,930 10,230 D 10, D 960 Elkcam Blvd. (DEL) Howland Blvd. to Lake Helen-Osteen Rd DLT City No E+W UA_NSSRC2_2W_2L_D_WL Minor Collector - Urban 13,980-6,068 13, ,530 10,750 D 13, D 1,260 Elkcam Blvd. (DEL) Lake Helen-Osteen Rd to Courtland Blvd DLT City No E+W UA_NSSRC2_2W_2L_U_0L Minor Collector - Urban 11,960-4,736 8, ,900 7,190 D 10, D 960 Elkcam Blvd. (DEL) Courtland Blvd. to Riverhead Dr. DLT City No E+W UA_NSSRC2_2W_2L_U_0L n/c D 10, C 960 Emporia Rd. SR 40 to Peterson/Blackburn 560 County Yes N+S RUA_UFH_2W_2L_U_0L Minor Collector - Rural , C 6, B 590 Emporia Rd. Peterson/Blackburn to US County Yes E+W RUA_UFH_2W_2L_U_0L Minor Collector - Rural 1,330 1,540 1,640 1,210 1,420 1,880 1,280 1,230 1,320 1,060 C 6, B 590 Enterprise Ave. (NSB) Pioneer Tr. to Halleck St. 570 County Yes E+W UA_NSSRC2_2W_2L_U_0L Major Collector - Urban 7,480 7,400 7,110 7,500 7,210 7,640 7,460 7,000 7,740 7,900 E 13, D 1,020 Enterprise Rd. US 17/92 to Harley Strickland Blvd. 586 County Yes N+S UA_NSSRC2_2W_4L_D_WL Minor Arterial - Urban 22,530 24,250 23,270 23,090 23,210 22,160 22,090 20,900 19,330 20,650 E 30, D 2,740 Enterprise Rd. Harley Strickland Blvd. to Saxon Blvd. 585 County Yes N+S UA_NSSRC1_2W_4L_D_WL Minor Arterial - Urban 23,030 24,860 25,370 24,100 25,340 23,250 23,670 22,790 20,710 22,110 E 37, C 3,410 Enterprise Rd. Saxon Blvd. to Highbanks Rd. 584 County Yes N+S UA_NSSRC1_2W_4L_D_WL Minor Arterial - Urban 21,140 20,510 23,720 23,150 24,490 23,470 23,460 23,750 21,590 23,790 E 37, C 3,410 Enterprise Rd. Highbanks Rd. to Deltona Blvd. 582 County Yes N+S UA_NSSRC2_2W_4L_D_WL Minor Arterial - Urban 14,390 14,090 15,750 14,720 14,990 12,530 15,330 14,620 14,110 15,010 E 30, D 2,740 Enterprise Rd. Deltona Blvd. to Main St. 581 County Yes N+S UA_NSSRC2_2W_2L_U_WL n/c 6,290 6,310 6,860 5,990 6,100 7,030 7,800 7,150 7,270 7,390 E 14, D 1,270 Enterprise-Osteen Rd. Providence to Garfield Rd 600 County Yes E+W UA_NSSRC2_2W_2L_U_0L Minor Collector - Urban 2,840 2,970 2,790 2,580 2,480 2,570 2,690 2,470 2,470 2,490 E 10, C 1,020 Enterprise-Osteen Rd. Garfield Rd to Reed Ellis Rd. 601 County Yes E+W UA_NSSRC2_2W_2L_U_0L Minor Collector - Urban 1,910 1,960 2,020 1,870 1,840 1,750 1,850 1,690 1,690 1,760 E 10, C 1,020 Enterprise-Osteen Rd. Reed Ellis Rd. to SR County Yes E+W UA_NSSRC2_2W_2L_U_0L Minor Collector - Urban 1,330 1,270 1,350 1,150 1,210 1,050 1,160 1,080 1,160 1,140 E 10, C 1,020 Euclid Ave. Grand to Fatio Rd. 610 County No E+W UA_NSSRC2_2W_2L_U_0L Minor Collector - Urban 1,670 1,570 1,860 1,200 1,220 1,190 1,190 1,080 1,150 1,030 E 13, C 1,020 Euclid Ave. Fatio Rd. to Woodward Ave. 611 County No E+W UA_NSSRC2_2W_2L_U_0L Minor Collector - Urban 1,770 1,640 1,950 1,370 1,380 1,340 1,360 1,270 1,330 1,220 E 13, C 1,020 Euclid Ave. Woodward Ave. to SR 15A 612 County No E+W UA_NSSRC2_2W_2L_U_0L Minor Collector - Urban 2,990 2,860 3,400 2,300 2,390 2,270 2,310 2,300 2,290 2,140 E 13, C 1,020 Euclid Ave. SR 15A to Adelle Ave. 613 County No E+W UA_NSSRC2_2W_2L_U_0L Minor Collector - Urban 3,000 2,790 3,310 2,500 2,740 2,520 2,440 2,510 2,430 2,380 E 13, C 1,020 Euclid Ave. Adelle Ave. to US 17/ County No E+W UA_NSSRC2_2W_2L_U_0L Minor Collector - Urban 2,096 1,850 2,140 2,080 1,940 2,180 2,150 2,200 2,150 2,210 E 13, C 1,020 Eustace Ave. (DEL) Catalina Blvd. to Providence Blvd DLT City No E+W UA_NSSRC2_2W_2L_U_0L n/c 4,610-3,639 4, ,480 3,770 D 10, Flagler Ave. (NSB) N. Causeway to Peninsula Ave. 640 FDOT Yes E+W UA_NSSRC2_2W_2L_U_0L Minor Arterial - Urban 5,610 8,310 7,960 8,270 8,820 9,100 8,560 9, E 13, ,020 Flagler Ave. (NSB) Peninsula Ave. to Atlantic Ave. 641 City Yes E+W UA_NSSRC2_2W_2L_U_0L Major Collector - Urban 9,420 4,740 4,500 4,740 5,120 5,420 5,050 4, E 13, ,020 Flomich St. Derbyshire Rd. to SR 5A/Nova Rd. 650 County Yes E+W UA_NSSRC2_2W_2L_U_0L Major Collector - Urban 5,520 5,600 6,210 5,890 4,980 5,520 5,450 5,570 5,430 5,140 E 13, C 1,020 Flomich St. SR 5A/Nova Rd. to US 1 City No E+W UA_NSSRC2_2W_2L_U_0L Major Collector - Urban E 13, Fort Florida Rd. Highbanks Rd. to Ft. Florida Point Rd. 661 City No N+S UA_NSSRC2_2W_2L_U_0L Minor Collector - Urban 1,080 1,190 1, , ,090 1,080 1,170 1,020 E 13, C 1,020 Fort Florida Rd. Ft. Florida Point Rd. to Barwick Rd. 662 City No N+S & E+W UA_NSSRC2_2W_2L_U_0L Minor Collector - Urban E 10, C 1,020 Fort Florida Rd. Barwick Rd. to US 17/ City No E+W UA_NSSRC2_2W_2L_U_0L Minor Collector - Urban 1,140 1,130 1,130 1, ,340 1,350 1,260 - E 10, ,020 Fort Smith Blvd. (DEL) Elkcam Blvd. to Providence Blvd DLT City No N+S UA_NSSRC2_2W_2L_U_0L Major Collector - Urban 2,910-3,160 3, ,250 3,140 D 10, C 960 Fort Smith Blvd. (DEL) Providence Blvd. to Newmark Dr. DLT City No N+S UA_NSSRC2_2W_2L_D_WL Major Collector - Urban 12,290-11,901 13, ,500 11,260 D 13, D 1,260 Fort Smith Blvd. (DEL) Newmark Dr. to Normandy Blvd DLT City No N+S UA_NSSRC2_2W_2L_D_WL Major Collector - Urban 7,470-7,576 7, ,610 8,160 D 13, D 1,260 Fort Smith Blvd. (DEL) Normandy Blvd. to India Blvd DLT City No N+S UA_NSSRC2_2W_2L_D_WL Major Collector - Urban 13,530-14,262 13, ,570 11,990 D 13, D 1,260 Fort Smith Blvd. (DEL) India Blvd. to Courtland Blvd DLT City No N+S UA_NSSRC2_2W_2L_D_WL Major Collector - Urban 6,880-7,154 7, ,260 6,610 D 13, C 1,260 Fort Smith Blvd. (DEL) Courtland Blvd. to Howland Blvd DLT City No E+W UA_NSSRC2_2W_2L_D_WL Major Collector - Urban 4,760-7,388 8, ,460 9,410 D 13, D 1,260 Fort Smith Blvd. (DEL) Howland Blvd. to SR 415 DLT City No E+W UA_NSSRC2_2W_2L_U_0L Major Collector - Urban 3,810-3,949 3, ,840 3,030 D 10, C 960 French Ave. Beginning of road to Blue Springs Park 690 County No E+W UA_NSSRC2_2W_2L_U_0L Minor Collector - Urban E 13, C 1,020 French Ave. Blue Springs Park to Lawton Ave./Hamilt 691 County No E+W UA_NSSRC2_2W_2L_U_0L Minor Collector - Urban , ,260 E 13, C 1,020 French Ave. Lawton Ave./Hamitlon to US 17/ County Yes E+W UA_NSSRC2_2W_2L_U_0L Minor Collector - Urban 6,100 6,810 7,740 5,470 5,970 5,320 5,660 5,240 4,480 4,870 E 13, C 1,020 Garfield Ave. US 92 to Plymouth Ave. 702 County Yes N+S UA_NSSRC2_2W_2L_U_0L n/c 1,930 2,150 2,700 2,390 2,230 2,240 2,310 2,220 2,100 2,280 E 13, C 1,020 Garfield Ave. Plymouth Ave. to SR County Yes N+S UA_NSSRC2_2W_2L_U_0L n/c 2,270 2,490 2,750 2,400 2,240 2,230 2,350 2,280 1,980 1,910 E 13, C 1,020 Garfield Ave. SR 44 to Beresford Ave. 698 City No N+S UA_NSSRC2_2W_2L_U_0L n/c ,330 2,140 2,100 2,300 E 13, C 1,020 Garfield Rd. Doyle Rd. to Enterprise-Osteen Rd 711 County Yes N+S UA_NSSRC1_2W_2L_U_0L Minor Collector - Urban 1,880 1,680 1,480 1,440 1,590 1,530 1,860 1,680 1,530 1,550 E 13, C 1,230 Glencoe Rd. Pioneer Tr. to SR County No N+S UA_NSSRC2_2W_2L_U_0L Minor Collector - Urban 1,550 1,730 1,680 1,550 1,380 1,370 1,670 1,820 1,930 1,870 E 13, C 1,020 Glencoe Rd. SR 44 to Paige Ave. 731 County No N+S UA_NSSRC2_2W_2L_U_0L Minor Collector - Urban 3,750 3,550 3,830 3,750 3,300 3,380 3,710 3,780 3,820 3,720 E 13, C 1,020 Glencoe Rd. Paige Ave. to Taylor Rd. 730 County No N+S UA_NSSRC1_2W_2L_U_0L Minor Collector - Urban 1,470 1,110 1,400 1,280 1,070 1,120 1,310 1,300 1,410 1,510 E 13, C 1,230 Glenwood Rd. Grand Ave. to SR 15A 741 County Yes E+W UA_NSSRC2_2W_2L_U_0L Major Collector - Urban 4,420 2,270 1,600 4,430 3,980 3,980 4,210 4,170 4,030 4,040 E 13, C 1,020 Glenwood Rd. SR 15A to US County Yes E+W UA_NSSRC2_2W_2L_U_0L Major Collector - Urban 2,420 2,230 1,330 2,580 2,260 2,190 2,140 2,140 2,050 2,000 E 13, C 1,020 Grand Av/CR 4053 Retta St. to Lemon St. 756 County Yes N+S UA_NSSRC1_2W_2L_U_0L Major Collector - Urban 2,250 1,990 2,130 1,830 1,770 1,750 1,740 1,720 1,700 1,740 E 13, C 1,230 Grand Av/CR 4053 Lemon St. to Glenwood Rd. 754 County Yes N+S UA_NSSRC2_2W_2L_D_WL Major Collector - Urban 4,360 4,180 4,330 4,060 3,790 3,720 3,700 3,630 3,550 3,550 E 14, C 1,330 Grand Av/CR 4053 Glenwood Rd. to Plymouth Ave. 752 County Yes N+S UA_NSSRC1_2W_2L_U_0L Major Collector - Urban 2,770 2,750 2,960 2,610 2,250 2,270 1,910 2,010 2,080 1,990 E 12, C 1,230 Grand Av/CR 4053 Plymouth Ave. to Minnesota Ave. 751 County Yes N+S UA_NSSRC1_2W_2L_U_0L Major Collector - Urban 1,570 1,500 1,540 1,570 1,280 1,290 1,240 1,270 1,260 1,240 E 13, C 1,230 Grand Av/CR 4053 Minnesota Ave. to SR County Yes N+S UA_NSSRC2_2W_2L_U_0L Major Collector - Urban 2,600 2,800 2,980 2,870 2,600 2,570 2,250 1,820 2,190 2,280 E 13, C 1,020 Grand Av/CR 4053 SR 44 to Old New York Ave. 748 County Yes N+S UA_NSSRC2_2W_2L_U_0L Major Collector - Urban E 13, C 1,020 Graves Av/CR 4145 US 17/92 to Leavitt Ave. 770 County Yes E+W UA_NSSRC2_2W_2L_D_WL Major Collector - Urban 7,780 7,910 7,000 7,570 6,610 6,110 6,680 6,470 5,550 5,880 E 14, C 1,330 Graves Av/CR 4145 Leavitt Ave. to Veteran's Memorial Pkwy 772 County Yes E+W UA_NSSRC2_2W_2L_U_0L Major Collector - Urban 8,250 8,320 7,590 7,850 6,450 6,770 6,780 6,520 6,510 7,060 E 13, D 1,020 Graves Av/CR 4145 Veteran's Memorial Pkwy. to Kentucky A 775 County Yes E+W UA_NSSRC1_2W_2L_D_WL Minor Arterial - Urban 18,040 15,840 16,680 17,290 16,590 16,840 17,570 17,140 16,750 17,160 E 17, E 1,620 Graves Av/CR 4145 Kentucky Ave. to Howland Blvd. 900 County Yes E+W UA_NSSRC1_2W_2L_D_WL Minor Arterial - Urban 12,970 11,560 13,740 13,250 12,660 11,530 13,790 11,840 12,970 13,640 E 17, C 1,620 Greens Dairy Rd. SR 15A to Stone St. 780 County No E+W UA_NSSRC2_2W_2L_U_0L n/c E 13, C 1,020 Halifax Dr. (OB) John Anderson Dr. to Neptune Ave. 801 City Yes N+S UA_NSSRC2_2W_2L_U_0L Major Collector - Urban 3,890 3,930 4,460 3,770 3,330 3,850 3,620 3, E 13, ,020 Halifax Dr. (OB) Neptune Ave. to SR City Yes N+S UA_NSSRC2_2W_2L_U_0L Major Collector - Urban 6,760 7,310 7,720 6,610 6,220 5,900 6,080 5, E 13, ,020 * 2014 AADT's for City of Deltona Port Orange are 2015 AADT's Page AADTs Volusia County.xlsx
43 FLORIDA DEPARTMENT OF TRANSPORTATION TRANSPORTATION STATISTICS OFFICE 2014 HISTORICAL AADT REPORT COUNTY: 79 - VOLUSIA SITE: ON SR-44, MI. E OF CR-4053 (GRAND AVE) (RVL) YEAR AADT DIRECTION 1 DIRECTION 2 *K FACTOR D FACTOR T FACTOR C E 5000 W C E 5000 W C E 4800 W C E 4900 W C E 5300 W C E 5500 W C E 5400 W C E 5900 W C E 6100 W C E 6100 W C E 5600 W C E 5800 W C E 5800 W C E 5700 W C E 5300 W C E 4800 W AADT FLAGS: C = COMPUTED; E = MANUAL ESTIMATE; F = FIRST YEAR ESTIMATE S = SECOND YEAR ESTIMATE; T = THIRD YEAR ESTIMATE; F = FOURTH YEAR ESTIMATE V = FIFTH YEAR ESTIMATE; 6 = SIXTH YEAR ESTIMATE; X = UNKNOWN *K FACTOR: STARTING WITH YEAR 2011 IS STANDARDK, PRIOR YEARS ARE K30 VALUES
44 FIN# 1234 Location 1 Traffic Trends - V3.0 SR East of Grand Avenue County: Station #: Highway: Volusia (79) 0290 SR 44 Average Daily Traffic (Vehicles/Day) Observed Count Fitted Curve Traffic (ADT/AADT) Year Count* Trend** Opening Year Trend Year 2015 N/A Mid-Year Trend 2025 N/A Design Year Trend ** Annual Trend Increase: N/A 8300 Trend R-squared: Trend Annual Historic Growth Rate: Trend Growth Rate (2014 to Design Year): Printed: 25.01% -0.71% -0.81% 26-Jul-15 TRANPLAN Forecasts/Trends Straight Line Growth Option *Axle-Adjusted
45 FLORIDA DEPARTMENT OF TRANSPORTATION TRANSPORTATION STATISTICS OFFICE 2014 HISTORICAL AADT REPORT COUNTY: 79 - VOLUSIA SITE: GRAND AVE, 0.13 MI S OF SR-44 (HPMS) YEAR AADT DIRECTION 1 DIRECTION 2 *K FACTOR D FACTOR T FACTOR C N 500 S F N 450 S C N 450 S C E 450 W C E 550 W AADT FLAGS: C = COMPUTED; E = MANUAL ESTIMATE; F = FIRST YEAR ESTIMATE S = SECOND YEAR ESTIMATE; T = THIRD YEAR ESTIMATE; F = FOURTH YEAR ESTIMATE V = FIFTH YEAR ESTIMATE; 6 = SIXTH YEAR ESTIMATE; X = UNKNOWN *K FACTOR: STARTING WITH YEAR 2011 IS STANDARDK, PRIOR YEARS ARE K30 VALUES
46 FIN# 1234 Location 1 Traffic Trends - V3.0 GRAND AVE -- South of SR 44 County: Station #: Highway: Volusia (79) 0 GRAND AVE Average Daily Traffic (Vehicles/Day) Traffic (ADT/AADT) Year Count* Trend** Opening Year Trend Year 2015 N/A Mid-Year Trend 2025 N/A Design Year Trend ** Annual Trend Increase: N/A 400 Trend R-squared: Trend Annual Historic Growth Rate: Trend Growth Rate (2014 to Design Year): Printed: 27.43% -2.00% -2.65% 26-Jul-15 TRANPLAN Forecasts/Trends Straight Line Growth Option *Axle-Adjusted
47 FIN# 1234 Location 1 Traffic Trends - V3.0 GRAND AVE -- North of SR 44 County: Station #: Highway: Volusia (79) 0 GRAND AVE Average Daily Traffic (Vehicles/Day) Traffic (ADT/AADT) Year Count* Trend** Opening Year Trend Year 2015 N/A Mid-Year Trend 2025 N/A Design Year Trend ** Annual Trend Increase: N/A 200 Trend R-squared: Trend Annual Historic Growth Rate: Trend Growth Rate (2014 to Design Year): Printed: 55.07% -3.07% -4.31% 26-Jul-15 TRANPLAN Forecasts/Trends Straight Line Growth Option *Axle-Adjusted
48 Appendix B BEBR Projections
49 Projections of Florida Population by County, , with Estimates for 2014 (continued) County Estimates Projections, April 1 and State April 1, SANTA ROSA 159,785 Low 158, , , , , ,000 Medium 163, , , , , ,300 High 169, , , , , ,800 SARASOTA 387,140 Low 378, , , , , ,100 Medium 390, , , , , ,300 High 405, , , , , ,200 SEMINOLE 437,086 Low 429, , , , , ,000 Medium 442, , , , , ,300 High 460, , , , , ,000 SUMTER 111,125 Low 112, , , , , ,700 Medium 117, , , , , ,500 High 122, , , , , ,500 SUWANNEE 44,168 Low 43,400 44,300 45,100 45,600 45,800 45,800 Medium 44,700 47,300 49,700 52,000 54,100 55,900 High 46,500 50,500 54,500 58,500 62,600 66,500 TAYLOR 22,932 Low 22,100 21,600 21,200 20,700 20,100 19,400 Medium 23,000 23,600 24,100 24,700 25,200 25,600 High 24,100 25,600 27,200 28,800 30,500 32,000 UNION 15,647 Low 15,200 15,000 14,800 14,600 14,300 13,900 Medium 15,900 16,400 16,900 17,400 17,900 18,300 High 16,700 17,800 19,000 20,300 21,600 22,800 VOLUSIA 503,851 Low 492, , , , , ,400 Medium 507, , , , , ,000 High 527, , , , , ,400 WAKULLA 31,285 Low 30,500 31,700 32,700 33,600 34,200 34,700 Medium 31,500 33,900 36,100 38,300 40,400 42,300 High 32,700 36,100 39,500 43,100 46,700 50,400 WALTON 59,793 Low 59,400 64,800 69,000 72,500 75,300 76,900 Medium 61,300 69,400 77,300 85,000 92,300 98,600 High 63,700 73,700 85,000 97, , ,300 WASHINGTON 24,959 Low 24,200 24,100 23,800 23,500 23,000 22,500 Medium 25,200 26,200 27,200 28,000 28,900 29,600 High 26,500 28,500 30,600 32,700 34,900 37,000 FLORIDA 19,507,369 Low 19,555,500 20,487,400 21,358,900 22,146,100 22,815,200 23,391,900 Medium 19,789,600 21,236,700 22,600,300 23,872,600 25,027,300 26,081,400 High 20,116,000 21,947,100 23,723,400 25,429,800 27,029,400 28,529,000 Bureau of Economic and Business Research phone (352) College of Liberal Arts and Sciences fax (352) SW 2nd Avenue, Suite 150, P.O. Box Gainesville, Florida
50 Appendix C CFRPM Model Plots
51 SR 44 at Grand Avenue - CFRPM v501 AADT Plot - Year 2005 MOCF=0.94 Legend Centroid Connector Number of Lanes = 2 Number of Lanes = 4 Number of Lanes = 6 Number of Lanes = 8 Number of Lanes > 8
52 SR 44 at Grand Avenue - CFRPM v501 AADT Plot - Year 2035 MOCF=0.94 Legend Centroid Connector Number of Lanes = 2 Number of Lanes = 4 Number of Lanes = 6 Number of Lanes = 8 Number of Lanes > 8
53 Appendix D Two-Way Stop Control Operational Analyses
54 Two-Way Stop Control file:///c:/users/cbergh/appdata/local/temp/u2k5d24.tmp Page 1 of 1 7/24/2015 General Information Analyst JXG Agency/Co. KAI Date Performed 7/21/2015 Analysis Time Period AM Peak Hour TWO-WAY STOP CONTROL SUMMARY Site Information Intersection Jurisdiction Analysis Year 2015 Project Description East/West Street: SR 44 North/South Street: Grand Ave Intersection Orientation: East-West Study Period (hrs): 0.25 Vehicle Volumes and Adjustments Major Street Eastbound Westbound Movement L T R L T R Volume (veh/h) Peak-Hour Factor, PHF Hourly Flow Rate, HFR (veh/h) Percent Heavy Vehicles Median Type Undivided RT Channelized 0 0 Lanes Configuration L TR L TR Upstream Signal 0 0 Minor Street Northbound Southbound Movement L T R L T R Volume (veh/h) Peak-Hour Factor, PHF Hourly Flow Rate, HFR (veh/h) Percent Heavy Vehicles Percent Grade (%) 0 0 Flared Approach N N Storage 0 0 RT Channelized 0 0 Lanes Configuration LTR LTR Delay, Queue Length, and Level of Service Approach Eastbound Westbound Northbound Southbound Movement Lane Configuration L L LTR LTR v (veh/h) C (m) (veh/h) v/c % queue length Control Delay (s/veh) LOS A A C C Approach Delay (s/veh) Approach LOS C C Copyright 2010 University of Florida, All Rights Reserved HCS+ TM Version 5.6 Generated: 7/24/ :59 AM
55 Two-Way Stop Control file:///c:/users/cbergh/appdata/local/temp/u2k77d9.tmp Page 1 of 1 7/24/2015 General Information Analyst Agency/Co. Date Performed 7/21/2015 Analysis Time Period TWO-WAY STOP CONTROL SUMMARY PM Peak Hour Site Information Intersection Jurisdiction Analysis Year Project Description East/West Street: SR 44 North/South Street: Grand Ave Intersection Orientation: East-West Study Period (hrs): 0.25 Vehicle Volumes and Adjustments Major Street Eastbound Westbound Movement L T R L T R Volume (veh/h) Peak-Hour Factor, PHF Hourly Flow Rate, HFR (veh/h) Percent Heavy Vehicles Median Type Undivided RT Channelized 0 0 Lanes Configuration L TR L TR Upstream Signal 0 0 Minor Street Northbound Southbound Movement L T R L T R Volume (veh/h) Peak-Hour Factor, PHF Hourly Flow Rate, HFR (veh/h) Percent Heavy Vehicles Percent Grade (%) 0 0 Flared Approach N N Storage 0 0 RT Channelized 0 0 Lanes Configuration LTR LTR Delay, Queue Length, and Level of Service Approach Eastbound Westbound Northbound Southbound Movement Lane Configuration L L LTR LTR v (veh/h) C (m) (veh/h) v/c % queue length Control Delay (s/veh) LOS A A E C Approach Delay (s/veh) Approach LOS E C Copyright 2010 University of Florida, All Rights Reserved HCS+ TM Version 5.6 Generated: 7/24/ :01 AM 2015
56 Two-Way Stop Control file:///c:/users/cbergh/appdata/local/temp/u2k5f92.tmp Page 1 of 1 7/24/2015 General Information Analyst JXG Agency/Co. KAI Date Performed 7/24/2015 Analysis Time Period % Growth AM Peak Hour TWO-WAY STOP CONTROL SUMMARY Site Information Intersection Jurisdiction Analysis Year Project Description East/West Street: SR 44 North/South Street: Grand Ave Intersection Orientation: East-West Study Period (hrs): 0.25 Vehicle Volumes and Adjustments Major Street Eastbound Westbound Movement L T R L T R Volume (veh/h) Peak-Hour Factor, PHF Hourly Flow Rate, HFR (veh/h) Percent Heavy Vehicles Median Type Undivided RT Channelized 0 0 Lanes Configuration L TR L TR Upstream Signal 0 0 Minor Street Northbound Southbound Movement L T R L T R Volume (veh/h) Peak-Hour Factor, PHF Hourly Flow Rate, HFR (veh/h) Percent Heavy Vehicles Percent Grade (%) 0 0 Flared Approach N N Storage 0 0 RT Channelized 0 0 Lanes Configuration LTR LTR Delay, Queue Length, and Level of Service Approach Eastbound Westbound Northbound Southbound Movement Lane Configuration L L LTR LTR v (veh/h) C (m) (veh/h) v/c % queue length Control Delay (s/veh) LOS A A D D Approach Delay (s/veh) Approach LOS D D Copyright 2010 University of Florida, All Rights Reserved HCS+ TM Version 5.6 Generated: 7/24/ :10 AM
57 Two-Way Stop Control file:///c:/users/cbergh/appdata/local/temp/u2kb4eb.tmp Page 1 of 1 7/24/2015 General Information Analyst JXG Agency/Co. KAI Date Performed 7/24/2015 Analysis Time Period Weekday PM Peak Hr TWO-WAY STOP CONTROL SUMMARY Site Information Intersection Jurisdiction Analysis Year Project Description East/West Street: SR 44 North/South Street: Grand Ave Intersection Orientation: East-West Study Period (hrs): w/2% growth Vehicle Volumes and Adjustments Major Street Eastbound Westbound Movement L T R L T R Volume (veh/h) Peak-Hour Factor, PHF Hourly Flow Rate, HFR (veh/h) Percent Heavy Vehicles Median Type Undivided RT Channelized 0 0 Lanes Configuration L TR L TR Upstream Signal 0 0 Minor Street Northbound Southbound Movement L T R L T R Volume (veh/h) Peak-Hour Factor, PHF Hourly Flow Rate, HFR (veh/h) Percent Heavy Vehicles Percent Grade (%) 0 0 Flared Approach N N Storage 0 0 RT Channelized 0 0 Lanes Configuration LTR LTR Delay, Queue Length, and Level of Service Approach Eastbound Westbound Northbound Southbound Movement Lane Configuration L L LTR LTR v (veh/h) C (m) (veh/h) v/c % queue length Control Delay (s/veh) LOS A A F F Approach Delay (s/veh) Approach LOS F F Copyright 2010 University of Florida, All Rights Reserved HCS+ TM Version 5.6 Generated: 7/24/2015 2:27 PM
58 Appendix E Signal Operational Analyses
59 HCS 2010 Signalized Intersection Results Summary General Information Intersection Information Agency Duration, h 0.25 Analyst Analysis Date 7/22/2015 Area Type Other Jurisdiction Time Period PHF 0.92 Intersection SR 44 & Grand Avenue Analysis Year 2015 Analysis Period 1> 7:00 File Name Signal_existing_AM.xus Project Description AM Peak Hour Demand Information EB WB NB SB Approach Movement L T R L T R L T R L T R Demand (v), veh/h Signal Information Cycle, s 80.0 Reference Phase 2 Offset, s 0 Reference Point End Uncoordinated No Simult. Gap E/W On Force Mode Fixed Simult. Gap N/S On Green Yellow Red Timer Results EBL EBT WBL WBT NBL NBT SBL SBT Assigned Phase Case Number Phase Duration, s Change Period, (Y+Rc), s Max Allow Headway (MAH), s Queue Clearance Time (gs), s Green Extension Time (ge), s Phase Call Probability Max Out Probability Movement Group Results EB WB NB SB Approach Movement L T R L T R L T R L T R Assigned Movement Adjusted Flow Rate (v), veh/h Adjusted Saturation Flow Rate (s), veh/h/ln Queue Service Time (gs), s Cycle Queue Clearance Time (gc), s Green Ratio (g/c) Capacity (c), veh/h Volume-to-Capacity Ratio (X) Available Capacity (ca), veh/h Back of Queue (Q), veh/ln (50th percentile) Queue Storage Ratio (RQ) (50th percentile) Uniform Delay (d1), s/veh Incremental Delay (d2), s/veh Initial Queue Delay (d3), s/veh Control Delay (d), s/veh Level of Service (LOS) A A A A D D Approach Delay, s/veh / LOS 6.4 A 6.1 A 39.5 D 41.4 D Intersection Delay, s/veh / LOS 10.6 B Multimodal Results EB WB NB SB Pedestrian LOS Score / LOS 2.0 B 2.1 B 2.3 B 2.3 B Bicycle LOS Score / LOS 1.5 A 0.9 A 0.5 A 0.6 A Copyright 2015 University of Florida, All Rights Reserved. HCS 2010 Streets Version 6.65 Generated: 7/24/2015 6:53:10 AM
60 HCS 2010 Signalized Intersection Results Summary General Information Intersection Information Agency Duration, h 0.25 Analyst Analysis Date 7/22/2015 Area Type Other Jurisdiction Time Period PHF 0.91 Intersection SR 44 & Grand Avenue Analysis Year 2015 Analysis Period 1> 7:00 File Name Signal_existing_PM.xus Project Description PM Peak Hour Demand Information EB WB NB SB Approach Movement L T R L T R L T R L T R Demand (v), veh/h Signal Information Cycle, s 80.0 Reference Phase 2 Offset, s 0 Reference Point End Uncoordinated No Simult. Gap E/W On Force Mode Fixed Simult. Gap N/S On Green Yellow Red Timer Results EBL EBT WBL WBT NBL NBT SBL SBT Assigned Phase Case Number Phase Duration, s Change Period, (Y+Rc), s Max Allow Headway (MAH), s Queue Clearance Time (gs), s Green Extension Time (ge), s Phase Call Probability Max Out Probability Movement Group Results EB WB NB SB Approach Movement L T R L T R L T R L T R Assigned Movement Adjusted Flow Rate (v), veh/h Adjusted Saturation Flow Rate (s), veh/h/ln Queue Service Time (gs), s Cycle Queue Clearance Time (gc), s Green Ratio (g/c) Capacity (c), veh/h Volume-to-Capacity Ratio (X) Available Capacity (ca), veh/h Back of Queue (Q), veh/ln (50th percentile) Queue Storage Ratio (RQ) (50th percentile) Uniform Delay (d1), s/veh Incremental Delay (d2), s/veh Initial Queue Delay (d3), s/veh Control Delay (d), s/veh Level of Service (LOS) A A A B D D Approach Delay, s/veh / LOS 7.6 A 11.2 B 39.1 D 49.2 D Intersection Delay, s/veh / LOS 15.4 B Multimodal Results EB WB NB SB Pedestrian LOS Score / LOS 2.1 B 2.1 B 2.3 B 2.3 B Bicycle LOS Score / LOS 1.3 A 1.4 A 0.6 A 0.7 A Copyright 2015 University of Florida, All Rights Reserved. HCS 2010 Streets Version 6.65 Generated: 7/24/ :11:11 PM
61 HCS 2010 Signalized Intersection Results Summary General Information Intersection Information Agency Duration, h 0.25 Analyst Analysis Date 7/22/2015 Area Type Other Jurisdiction Time Period PHF 1.00 Intersection SR 44 & Grand Avenue Analysis Year 2015 Analysis Period 1> 7:00 File Name Signal_2percent_AM.xus Project Description % Growth AM Peak Hour Demand Information EB WB NB SB Approach Movement L T R L T R L T R L T R Demand (v), veh/h Signal Information Cycle, s 80.0 Reference Phase 2 Offset, s 0 Reference Point End Uncoordinated No Simult. Gap E/W On Force Mode Fixed Simult. Gap N/S On Green Yellow Red Timer Results EBL EBT WBL WBT NBL NBT SBL SBT Assigned Phase Case Number Phase Duration, s Change Period, (Y+Rc), s Max Allow Headway (MAH), s Queue Clearance Time (gs), s Green Extension Time (ge), s Phase Call Probability Max Out Probability Movement Group Results EB WB NB SB Approach Movement L T R L T R L T R L T R Assigned Movement Adjusted Flow Rate (v), veh/h Adjusted Saturation Flow Rate (s), veh/h/ln Queue Service Time (gs), s Cycle Queue Clearance Time (gc), s Green Ratio (g/c) Capacity (c), veh/h Volume-to-Capacity Ratio (X) Available Capacity (ca), veh/h Back of Queue (Q), veh/ln (50th percentile) Queue Storage Ratio (RQ) (50th percentile) Uniform Delay (d1), s/veh Incremental Delay (d2), s/veh Initial Queue Delay (d3), s/veh Control Delay (d), s/veh Level of Service (LOS) A A A A D D D D Approach Delay, s/veh / LOS 4.5 A 4.1 A 37.0 D 37.6 D Intersection Delay, s/veh / LOS 8.5 A Multimodal Results EB WB NB SB Pedestrian LOS Score / LOS 2.2 B 2.2 B 2.3 B 2.3 B Bicycle LOS Score / LOS 1.7 A 1.0 A 0.6 A 0.7 A Copyright 2015 University of Florida, All Rights Reserved. HCS 2010 Streets Version 6.65 Generated: 7/24/2015 1:42:09 PM
62 HCS 2010 Signalized Intersection Results Summary General Information Intersection Information Agency Duration, h 0.25 Analyst Analysis Date 7/22/2015 Area Type Other Jurisdiction Time Period PHF 1.00 Intersection SR 44 & Grand Avenue Analysis Year 2015 Analysis Period 1> 7:00 File Name Signal_2percent_PM.xus Project Description % Growth PM Peak Hour Demand Information EB WB NB SB Approach Movement L T R L T R L T R L T R Demand (v), veh/h Signal Information Cycle, s 80.0 Reference Phase 2 Offset, s 0 Reference Point End Uncoordinated No Simult. Gap E/W On Force Mode Fixed Simult. Gap N/S On Green Yellow Red Timer Results EBL EBT WBL WBT NBL NBT SBL SBT Assigned Phase Case Number Phase Duration, s Change Period, (Y+Rc), s Max Allow Headway (MAH), s Queue Clearance Time (gs), s Green Extension Time (ge), s Phase Call Probability Max Out Probability Movement Group Results EB WB NB SB Approach Movement L T R L T R L T R L T R Assigned Movement Adjusted Flow Rate (v), veh/h Adjusted Saturation Flow Rate (s), veh/h/ln Queue Service Time (gs), s Cycle Queue Clearance Time (gc), s Green Ratio (g/c) Capacity (c), veh/h Volume-to-Capacity Ratio (X) Available Capacity (ca), veh/h Back of Queue (Q), veh/ln (50th percentile) Queue Storage Ratio (RQ) (50th percentile) Uniform Delay (d1), s/veh Incremental Delay (d2), s/veh Initial Queue Delay (d3), s/veh Control Delay (d), s/veh Level of Service (LOS) A A A A D C C D Approach Delay, s/veh / LOS 5.7 A 9.2 A 34.7 C 37.6 D Intersection Delay, s/veh / LOS 12.2 B Multimodal Results EB WB NB SB Pedestrian LOS Score / LOS 2.2 B 2.2 B 2.3 B 2.3 B Bicycle LOS Score / LOS 1.5 A 1.6 A 0.6 A 0.8 A Copyright 2015 University of Florida, All Rights Reserved. HCS 2010 Streets Version 6.65 Generated: 7/24/2015 1:38:36 PM
63 HCS 2010 Signalized Intersection Results Summary General Information Intersection Information Agency Duration, h 0.25 Analyst Analysis Date 7/22/2015 Area Type Other Jurisdiction Time Period PHF 1.00 Intersection SR 44 & Grand Avenue Analysis Year 2015 Analysis Period 1> 7:00 File Name Signal_5percent_AM.xus Project Description AM Peak Hour Demand Information EB WB NB SB Approach Movement L T R L T R L T R L T R Demand (v), veh/h Signal Information Cycle, s 80.0 Reference Phase 2 Offset, s 0 Reference Point End Uncoordinated No Simult. Gap E/W On Force Mode Fixed Simult. Gap N/S On Green Yellow Red Timer Results EBL EBT WBL WBT NBL NBT SBL SBT Assigned Phase Case Number Phase Duration, s Change Period, (Y+Rc), s Max Allow Headway (MAH), s Queue Clearance Time (gs), s Green Extension Time (ge), s Phase Call Probability Max Out Probability Movement Group Results EB WB NB SB Approach Movement L T R L T R L T R L T R Assigned Movement Adjusted Flow Rate (v), veh/h Adjusted Saturation Flow Rate (s), veh/h/ln Queue Service Time (gs), s Cycle Queue Clearance Time (gc), s Green Ratio (g/c) Capacity (c), veh/h Volume-to-Capacity Ratio (X) Available Capacity (ca), veh/h Back of Queue (Q), veh/ln (50th percentile) Queue Storage Ratio (RQ) (50th percentile) Uniform Delay (d1), s/veh Incremental Delay (d2), s/veh Initial Queue Delay (d3), s/veh Control Delay (d), s/veh Level of Service (LOS) A A A A D C D D Approach Delay, s/veh / LOS 8.7 A 5.8 A 36.3 D 37.1 D Intersection Delay, s/veh / LOS 11.5 B Multimodal Results EB WB NB SB Pedestrian LOS Score / LOS 2.2 B 2.2 B 2.3 B 2.3 B Bicycle LOS Score / LOS 2.3 B 1.3 A 0.6 A 0.8 A Copyright 2015 University of Florida, All Rights Reserved. HCS 2010 Streets Version 6.65 Generated: 7/24/2015 6:51:14 AM
64 HCS 2010 Signalized Intersection Results Summary General Information Intersection Information Agency Duration, h 0.25 Analyst Analysis Date 7/22/2015 Area Type Other Jurisdiction Time Period PHF 1.00 Intersection SR 44 & Grand Avenue Analysis Year 2015 Analysis Period 1> 7:00 File Name Signal_5percent_PM.xus Project Description PM Peak Hour Demand Information EB WB NB SB Approach Movement L T R L T R L T R L T R Demand (v), veh/h Signal Information Cycle, s 80.0 Reference Phase 2 Offset, s 0 Reference Point End Uncoordinated No Simult. Gap E/W On Force Mode Fixed Simult. Gap N/S On Green Yellow Red Timer Results EBL EBT WBL WBT NBL NBT SBL SBT Assigned Phase Case Number Phase Duration, s Change Period, (Y+Rc), s Max Allow Headway (MAH), s Queue Clearance Time (gs), s Green Extension Time (ge), s Phase Call Probability Max Out Probability Movement Group Results EB WB NB SB Approach Movement L T R L T R L T R L T R Assigned Movement Adjusted Flow Rate (v), veh/h Adjusted Saturation Flow Rate (s), veh/h/ln Queue Service Time (gs), s Cycle Queue Clearance Time (gc), s Green Ratio (g/c) Capacity (c), veh/h Volume-to-Capacity Ratio (X) Available Capacity (ca), veh/h Back of Queue (Q), veh/ln (50th percentile) Queue Storage Ratio (RQ) (50th percentile) Uniform Delay (d1), s/veh Incremental Delay (d2), s/veh Initial Queue Delay (d3), s/veh Control Delay (d), s/veh Level of Service (LOS) B B A C D C C D Approach Delay, s/veh / LOS 11.1 B 22.3 C 33.5 C 46.9 D Intersection Delay, s/veh / LOS 21.2 C Multimodal Results EB WB NB SB Pedestrian LOS Score / LOS 2.2 B 2.2 B 2.3 B 2.3 B Bicycle LOS Score / LOS 2.0 A 2.1 B 0.6 A 0.9 A Copyright 2015 University of Florida, All Rights Reserved. HCS 2010 Streets Version 6.65 Generated: 7/24/2015 6:52:05 AM
65 Appendix F Roundabout Operational Analyses
66 Parameter Roundabout Operations Analysis AM Peak Hour Approach EB (West Leg) WB (East Leg) NB (South Leg) SB (North Leg) INPUTS Lane Configuration Entry Lane(s) Configuration (Note: This assumes 4 legs.) Case: 1 Case: 1 Case: 1 Case: 1 RT bypass configuration (Note: This is in addition to the entry lane(s)) Case: 1 Case: 1 Case: 1 Case: 1 Number of conflicting circ lanes Number of conflicting exit lanes for bypass lane (if used) Vehicular Volumes U (v1u) L (v1) T (v2) R (v3) U (v4u) L (v4) T (v5) R (v6) U (v7u) L (v7) T (v8) R (v9) U (v10u) L (v10) T (v11) R (v12) Flow (veh/h) % HV PHF Pedestrian Volumes (crossing leg) n_p Constants Time period, T (h) 0.25 PCE for HV 2 SUMMARY Entry lane volume (veh/h) N/A 593 N/A N/A 264 N/A N/A 31 N/A N/A 87 N/A Entry lane capacity (veh/h) N/A 1261 N/A N/A 1236 N/A N/A 720 N/A N/A 1031 N/A x (v/c ratio) N/A 0.47 N/A N/A 0.21 N/A N/A 0.04 N/A N/A 0.08 N/A Lane control delay (s/veh) N/A 7.7 N/A N/A 4.8 N/A N/A 5.4 N/A N/A 4.2 N/A Lane LOS N/A A N/A N/A A N/A N/A A N/A N/A A N/A Approach control delay (s/veh) Approach LOS A A A A Intersection control delay (s/veh) 6.5 Intersection LOS A 95th percentile queue (veh) N/A 2.6 N/A N/A 0.8 N/A N/A 0.1 N/A N/A 0.3 N/A Notes: *Anaysis results reflect use of draft capacity models developed as part of FHWA Project TOPR 34.
67 Parameter Roundabout Operations Analysis PM Peak Hour Approach EB (West Leg) WB (East Leg) NB (South Leg) SB (North Leg) INPUTS Lane Configuration Entry Lane(s) Configuration (Note: This assumes 4 legs.) Case: 1 Case: 1 Case: 1 Case: 1 RT bypass configuration (Note: This is in addition to the entry lane(s)) Case: 1 Case: 1 Case: 1 Case: 1 Number of conflicting circ lanes Number of conflicting exit lanes for bypass lane (if used) Vehicular Volumes U (v1u) L (v1) T (v2) R (v3) U (v4u) L (v4) T (v5) R (v6) U (v7u) L (v7) T (v8) R (v9) U (v10u) L (v10) T (v11) R (v12) Flow (veh/h) % HV PHF Pedestrian Volumes (crossing leg) n_p Constants Time period, T (h) 0.25 PCE for HV 2 SUMMARY Entry lane volume (veh/h) N/A 497 N/A N/A 537 N/A N/A 42 N/A N/A 150 N/A Entry lane capacity (veh/h) N/A 1272 N/A N/A 1204 N/A N/A 816 N/A N/A 783 N/A x (v/c ratio) N/A 0.39 N/A N/A 0.45 N/A N/A 0.05 N/A N/A 0.19 N/A Lane control delay (s/veh) N/A 6.6 N/A N/A 7.6 N/A N/A 4.9 N/A N/A 6.6 N/A Lane LOS N/A A N/A N/A A N/A N/A A N/A N/A A N/A Approach control delay (s/veh) Approach LOS A A A A Intersection control delay (s/veh) 7.0 Intersection LOS A 95th percentile queue (veh) N/A 1.9 N/A N/A 2.3 N/A N/A 0.2 N/A N/A 0.7 N/A Notes: *Anaysis results reflect use of draft capacity models developed as part of FHWA Project TOPR 34.
68 Parameter Roundabout Operations Analysis AM Peak Hour (Scenario 1-2% Annual Growth) Approach EB (West Leg) WB (East Leg) NB (South Leg) SB (North Leg) INPUTS Lane Configuration Entry Lane(s) Configuration (Note: This assumes 4 legs.) Case: 1 Case: 1 Case: 1 Case: 1 RT bypass configuration (Note: This is in addition to the entry lane(s)) Case: 1 Case: 1 Case: 1 Case: 1 Number of conflicting circ lanes Number of conflicting exit lanes for bypass lane (if used) Vehicular Volumes U (v1u) L (v1) T (v2) R (v3) U (v4u) L (v4) T (v5) R (v6) U (v7u) L (v7) T (v8) R (v9) U (v10u) L (v10) T (v11) R (v12) Flow (veh/h) % HV PHF Pedestrian Volumes (crossing leg) n_p Constants Time period, T (h) 0.25 PCE for HV 2 SUMMARY Entry lane volume (veh/h) N/A 757 N/A N/A 336 N/A N/A 41 N/A N/A 111 N/A Entry lane capacity (veh/h) N/A 1243 N/A N/A 1206 N/A N/A 604 N/A N/A 954 N/A x (v/c ratio) N/A 0.61 N/A N/A 0.28 N/A N/A 0.07 N/A N/A 0.12 N/A Lane control delay (s/veh) N/A 10.4 N/A N/A 5.5 N/A N/A 6.7 N/A N/A 4.8 N/A Lane LOS N/A B N/A N/A A N/A N/A A N/A N/A A N/A Approach control delay (s/veh) Approach LOS B A A A Intersection control delay (s/veh) 8.4 Intersection LOS A 95th percentile queue (veh) N/A 4.4 N/A N/A 1.1 N/A N/A 0.2 N/A N/A 0.4 N/A Notes: *Anaysis results reflect use of draft capacity models developed as part of FHWA Project TOPR 34.
69 Parameter Roundabout Operations Analysis PM Peak Hour (Scenario 1-2% Annual Growth) Approach EB (West Leg) WB (East Leg) NB (South Leg) SB (North Leg) INPUTS Lane Configuration Entry Lane(s) Configuration (Note: This assumes 4 legs.) Case: 1 Case: 1 Case: 1 Case: 1 RT bypass configuration (Note: This is in addition to the entry lane(s)) Case: 1 Case: 1 Case: 1 Case: 1 Number of conflicting circ lanes Number of conflicting exit lanes for bypass lane (if used) Vehicular Volumes U (v1u) L (v1) T (v2) R (v3) U (v4u) L (v4) T (v5) R (v6) U (v7u) L (v7) T (v8) R (v9) U (v10u) L (v10) T (v11) R (v12) Flow (veh/h) % HV PHF Pedestrian Volumes (crossing leg) n_p Constants Time period, T (h) 0.25 PCE for HV 2 SUMMARY Entry lane volume (veh/h) N/A 634 N/A N/A 684 N/A N/A 52 N/A N/A 193 N/A Entry lane capacity (veh/h) N/A 1251 N/A N/A 1171 N/A N/A 707 N/A N/A 672 N/A x (v/c ratio) N/A 0.51 N/A N/A 0.58 N/A N/A 0.07 N/A N/A 0.29 N/A Lane control delay (s/veh) N/A 8.3 N/A N/A 10.2 N/A N/A 5.9 N/A N/A 8.9 N/A Lane LOS N/A A N/A N/A B N/A N/A A N/A N/A A N/A Approach control delay (s/veh) Approach LOS A B A A Intersection control delay (s/veh) 9.2 Intersection LOS A 95th percentile queue (veh) N/A 3.0 N/A N/A 4.0 N/A N/A 0.2 N/A N/A 1.2 N/A Notes: *Anaysis results reflect use of draft capacity models developed as part of FHWA Project TOPR 34.
70 Parameter Roundabout Operations Analysis AM Peak Hour (Scenario 2-5% Annual Growth) Approach EB (West Leg) WB (East Leg) NB (South Leg) SB (North Leg) INPUTS Lane Configuration Entry Lane(s) Configuration (Note: This assumes 4 legs.) Case: 1 Case: 1 Case: 1 Case: 1 RT bypass configuration (Note: This is in addition to the entry lane(s)) Case: 1 Case: 1 Case: 1 Case: 1 Number of conflicting circ lanes Number of conflicting exit lanes for bypass lane (if used) Vehicular Volumes U (v1u) L (v1) T (v2) R (v3) U (v4u) L (v4) T (v5) R (v6) U (v7u) L (v7) T (v8) R (v9) U (v10u) L (v10) T (v11) R (v12) Flow (veh/h) % HV PHF Pedestrian Volumes (crossing leg) n_p Constants Time period, T (h) 0.25 PCE for HV 2 SUMMARY Entry lane volume (veh/h) N/A 1083 N/A N/A 482 N/A N/A 57 N/A N/A 160 N/A Entry lane capacity (veh/h) N/A 1201 N/A N/A 1153 N/A N/A 425 N/A N/A 818 N/A x (v/c ratio) N/A 0.90 N/A N/A 0.42 N/A N/A 0.14 N/A N/A 0.20 N/A Lane control delay (s/veh) N/A 26.6 N/A N/A 7.4 N/A N/A 10.5 N/A N/A 6.5 N/A Lane LOS N/A D N/A N/A A N/A N/A B N/A N/A A N/A Approach control delay (s/veh) Approach LOS D A B A Intersection control delay (s/veh) 19.1 Intersection LOS C 95th percentile queue (veh) N/A 14.1 N/A N/A 2.1 N/A N/A 0.5 N/A N/A 0.7 N/A Notes: *Anaysis results reflect use of draft capacity models developed as part of FHWA Project TOPR 34.
71 Parameter Roundabout Operations Analysis PM Peak Hour (Scenario 2-5% Annual Growth) Approach EB (West Leg) WB (East Leg) NB (South Leg) SB (North Leg) INPUTS Lane Configuration Entry Lane(s) Configuration (Note: This assumes 4 legs.) Case: 1 Case: 1 Case: 1 Case: 1 RT bypass configuration (Note: This is in addition to the entry lane(s)) Case: 1 Case: 1 Case: 1 Case: 1 Number of conflicting circ lanes Number of conflicting exit lanes for bypass lane (if used) Vehicular Volumes U (v1u) L (v1) T (v2) R (v3) U (v4u) L (v4) T (v5) R (v6) U (v7u) L (v7) T (v8) R (v9) U (v10u) L (v10) T (v11) R (v12) Flow (veh/h) % HV PHF Pedestrian Volumes (crossing leg) n_p Constants Time period, T (h) 0.25 PCE for HV 2 SUMMARY Entry lane volume (veh/h) N/A 904 N/A N/A 978 N/A N/A 75 N/A N/A 276 N/A Entry lane capacity (veh/h) N/A 1217 N/A N/A 1105 N/A N/A 534 N/A N/A 496 N/A x (v/c ratio) N/A 0.74 N/A N/A 0.88 N/A N/A 0.14 N/A N/A 0.56 N/A Lane control delay (s/veh) N/A 14.7 N/A N/A 26.1 N/A N/A 8.6 N/A N/A 18.8 N/A Lane LOS N/A B N/A N/A D N/A N/A A N/A N/A C N/A Approach control delay (s/veh) Approach LOS B D A C Intersection control delay (s/veh) 20.0 Intersection LOS C 95th percentile queue (veh) N/A 7.3 N/A N/A 12.8 N/A N/A 0.5 N/A N/A 3.4 N/A Notes: *Anaysis results reflect use of draft capacity models developed as part of FHWA Project TOPR 34.
72 Parameter Roundabout Operations Analysis AM Peak Hour (Scenario 2-5% Annual Growth) Approach EB (West Leg) WB (East Leg) NB (South Leg) SB (North Leg) INPUTS Lane Configuration Entry Lane(s) Configuration (Note: This assumes 4 legs.) Case: 4 Case: 4 Case: 1 Case: 1 RT bypass configuration (Note: This is in addition to the entry lane(s)) Case: 1 Case: 1 Case: 1 Case: 1 Number of conflicting circ lanes Number of conflicting exit lanes for bypass lane (if used) Vehicular Volumes U (v1u) L (v1) T (v2) R (v3) U (v4u) L (v4) T (v5) R (v6) U (v7u) L (v7) T (v8) R (v9) U (v10u) L (v10) T (v11) R (v12) Flow (veh/h) % HV PHF Pedestrian Volumes (crossing leg) n_p Constants Time period, T (h) 0.25 PCE for HV 2 SUMMARY Entry lane volume (veh/h) N/A N/A N/A 57 N/A N/A 160 N/A Entry lane capacity (veh/h) N/A N/A N/A 532 N/A N/A 917 N/A x (v/c ratio) N/A N/A N/A 0.11 N/A N/A 0.17 N/A Lane control delay (s/veh) N/A N/A N/A 8.1 N/A N/A 5.6 N/A Lane LOS A A N/A A A N/A N/A A N/A N/A A N/A Approach control delay (s/veh) Approach LOS A A A A Intersection control delay (s/veh) 6.5 Intersection LOS A 95th percentile queue (veh) N/A N/A N/A 0.4 N/A N/A 0.6 N/A Notes: *Anaysis results reflect use of draft capacity models developed as part of FHWA Project TOPR 34.
73 Parameter Roundabout Operations Analysis PM Peak Hour (Scenario 2-5% Annual Growth) Approach EB (West Leg) WB (East Leg) NB (South Leg) SB (North Leg) INPUTS Lane Configuration Entry Lane(s) Configuration (Note: This assumes 4 legs.) Case: 4 Case: 4 Case: 1 Case: 1 RT bypass configuration (Note: This is in addition to the entry lane(s)) Case: 1 Case: 1 Case: 1 Case: 1 Number of conflicting circ lanes Number of conflicting exit lanes for bypass lane (if used) Vehicular Volumes U (v1u) L (v1) T (v2) R (v3) U (v4u) L (v4) T (v5) R (v6) U (v7u) L (v7) T (v8) R (v9) U (v10u) L (v10) T (v11) R (v12) Flow (veh/h) % HV PHF Pedestrian Volumes (crossing leg) n_p Constants Time period, T (h) 0.25 PCE for HV 2 SUMMARY Entry lane volume (veh/h) N/A N/A N/A 75 N/A N/A 276 N/A Entry lane capacity (veh/h) N/A N/A N/A 643 N/A N/A 604 N/A x (v/c ratio) N/A N/A N/A 0.12 N/A N/A 0.46 N/A Lane control delay (s/veh) N/A N/A N/A 6.9 N/A N/A 13.2 N/A Lane LOS A A N/A A A N/A N/A A N/A N/A B N/A Approach control delay (s/veh) Approach LOS A A A B Intersection control delay (s/veh) 7.7 Intersection LOS A 95th percentile queue (veh) N/A N/A N/A 0.4 N/A N/A 2.4 N/A Notes: *Anaysis results reflect use of draft capacity models developed as part of FHWA Project TOPR 34.
74 Appendix G Crash Data
75 CRASH_NUMBER ROADWAYID MILEPOST STATE_ROAD ADT YEAR MONTH DAY HOUR ALC_INV HARMFUL_EVENT1 LIGHTING WEATHER S 22 1 W /28/2013 6:00 AM Monday N 61 1 W /16/2010 9:00 AM Thursday N 16 1 W /7/2011 7:00 PM Friday S 23 1 W /7/ :00 PM Tuesday E 81 1 E /19/ :00 AM Thursday E /24/2012 7:00 PM Tuesday N 63 1 W /20/ :00 PM Wednesday S 33 1 W /3/ :00 PM Tuesday N 24 1 W /20/ :00 AM Sunday S 82 1 W /4/2013 2:00 PM Monday N 31 1 E /26/2013 6:00 PM Friday S 78 1 W /9/2013 6:00 PM Wednesday N 27 1 W /15/2013 2:00 PM Friday E 73 1 E /31/2012 6:00 PM Monday W /23/2013 6:00 PM Sunday /17/2013 9:00 PM Sunday /9/2011 3:25 PM Friday /25/2013 4:30 PM Thursday S 3 66 W /5/2014 1:00 PM Wednesday S E /5/ :00 PM Saturday N 3 64 W /10/2014 3:00 PM Sunday /5/2015 9:27 PM Thursday /5/2015 9:10 PM Thursday /20/2015 5:11 PM Friday /8/2015 7:30 PM Sunday /23/2015 3:29 PM Monday /31/ :32 PM Tuesday /29/2015 5:45 PM Wednesday /27/2015 8:20 AM Wednesday /14/ :30 AM Sunday RD_SURF VEH_DIR1 CONTRIB_CAUSE1 DRIV/PED_AGE1 VEH_DIR2 CONTRIB_CAUSE2 DRIV/PED_AGE2 #_OF_VEHICLES #_OF_KILLED #_OF_INJURED DATE TIME DAY OF WEEK
76 Appendix H Roundabout Performance Checks for Design Vehicle and Speed Control
77 GRAND AVE N Feet R=125 ft V=22 mph SR 44 R=175 ft V=25 mph R=155 ft V=24 mph R=175 ft V=25 mph R=105 ft V=19 mph R=80 ft R=80 ft V=17 mph V=17 mph R=90 ft V=18 mph R=165 ft V=25 mph R=135 ft V=23 mph R=175 ft V=25 mph SR 44 GRAND AVE DATE DESCRIPTION REVISIONS DATE DESCRIPTION STATE OF FLORIDA DEPARTMENT OF TRANSPORTATION ROAD NO. COUNTY FINANCIAL PROJECT ID VOLUSIA SR 44 AT GRAND AVENUE FASTEST PATH DESIGN CHECKS SINGLE LANE RDBT CONCEPT EXHIBIT NO. H-1
78 (c) 2015 Transoft Solutions, Inc. All rights reserved. (c) 2015 Transoft Solutions, Inc. All rights reserved. WB-62FL FLIDG 2007 (US) FLIDG 2007 (US) WB-62FL (c) 2015 Transoft Solutions, Inc. Al rights reserved. (c) 2015 Transoft Solutions, Inc. Al rights reserved. GRAND AVE N Feet SR 44 WB-62FL WB-62FL WB-62FL WB-62FL WB-62FL WB-62FL WB-62FL WB-62FL SR 44 GRAND AVE DATE DESCRIPTION REVISIONS DATE DESCRIPTION STATE OF FLORIDA DEPARTMENT OF TRANSPORTATION ROAD NO. COUNTY FINANCIAL PROJECT ID VOLUSIA SR 44 AT GRAND AVENUE WB62FL TRUCK PATH CHECKS SINGLE LANE RDBT CONCEPT EXHIBIT NO. H-2
79 WB-62FL (c) 2015 Transoft Solutions, Inc. All rights reserved. WB- 62FL WB-62FL WB- 62FL WB- 62FL (c) 2015 Transoft Solutions, Inc. Al rights reserved. (c) 2015 Transoft Solutions, Inc. All rights reserved. GRAND AVE N Feet WB- 62FL (c) 2015 Transoft Solutions, Inc. Al rights reserved. SR 44 WB- 62FL WB-62FL WB- 62FL WB-62FL SR 44 GRAND AVE DATE DESCRIPTION REVISIONS DATE DESCRIPTION STATE OF FLORIDA DEPARTMENT OF TRANSPORTATION ROAD NO. COUNTY FINANCIAL PROJECT ID VOLUSIA SR 44 AT GRAND AVENUE WB62FL TRUCK PATH CHECKS SINGLE LANE RDBT CONCEPT EXHIBIT NO. H-3
80 WB- 62FL (c) 2015 Transoft Solutions, Inc. Al rights reserved. WB- 62FL (c) 2015 Transoft Solutions, Inc. All rights reserved. (c) 2015 Transoft Solutions, Inc. Al rights reserved. WB- 62FL GRAND AVE N WB- 62FL (c) 2015 Transoft Solutions, Inc. Al rights reserved Feet WB- 62FL SR 44 WB- 62FL WB- 62FL SR 44 WB- 62FL WB- 62FL GRAND AVE DATE DESCRIPTION REVISIONS DATE DESCRIPTION WB- 62FL STATE OF FLORIDA DEPARTMENT OF TRANSPORTATION ROAD NO. COUNTY FINANCIAL PROJECT ID VOLUSIA SR 44 AT GRAND AVENUE WB62FL TRUCK PATH CHECKS SINGLE LANE RDBT CONCEPT EXHIBIT NO. H-4
81 (c) 2015 Transoft Solutions, Inc. Al rights reserved. (c) 2015 Transoft Solutions, Inc. All rights reserved. WB- 62FL (c) 2015 Transoft Solutions, Inc. Al rights reserved. WB- 62FL (c) 2015 Transoft Solutions, Inc. All rights reserved. FLIDG 2007 (US) (c) 2015 Transoft Solutions, Inc. All rights reserved. (c) 2015 Transoft Solutions, Inc. Al rights reserved. WB- 62FL (c) 2015 Transoft Solutions, Inc. Al rights reserved. WB- 62FL WB-62FL WB-62FL WB-62FL WB-62FL WB-62FL WB- 62FL WB-62L FL PPM 2013 (US) WB- 62L FL PPM 2013 (US) WB- 62FL WB- 62FL (c) 2015 Transoft Solutions, Inc. Al rights reserved. GRAND AVE N Feet SR 44 SR 44 GRAND AVE DATE DESCRIPTION REVISIONS DATE DESCRIPTION STATE OF FLORIDA DEPARTMENT OF TRANSPORTATION ROAD NO. COUNTY FINANCIAL PROJECT ID VOLUSIA SR 44 AT GRAND AVENUE WB62FL TRUCK PATH CHECKS SINGLE LANE RDBT CONCEPT EXHIBIT NO. H-5
82 (c) 2015 Transoft Solutions, Inc. Al rights reserved. WB- 62FL WB-62FL WB- 62FL WB- 62FL (c) 2015 Transoft Solutions, Inc. Al rights reserved. WB- 62FL (c) 2015 Transoft Solutions, Inc. All rights reserved. WB- 62FL (c) 2015 Transoft Solutions, Inc. Al rights reserved. GRAND AVE N Feet WB- 62FL SR 44 WB-62FL WB-62FL WB-62FL WB-62FL WB-62FL SR 44 GRAND AVE DATE DESCRIPTION REVISIONS DATE DESCRIPTION STATE OF FLORIDA DEPARTMENT OF TRANSPORTATION ROAD NO. COUNTY FINANCIAL PROJECT ID VOLUSIA SR 44 AT GRAND AVENUE WB62FL TRUCK PATH CHECKS SINGLE LANE RDBT CONCEPT EXHIBIT NO. H-6
83 Appendix I ROW Maps
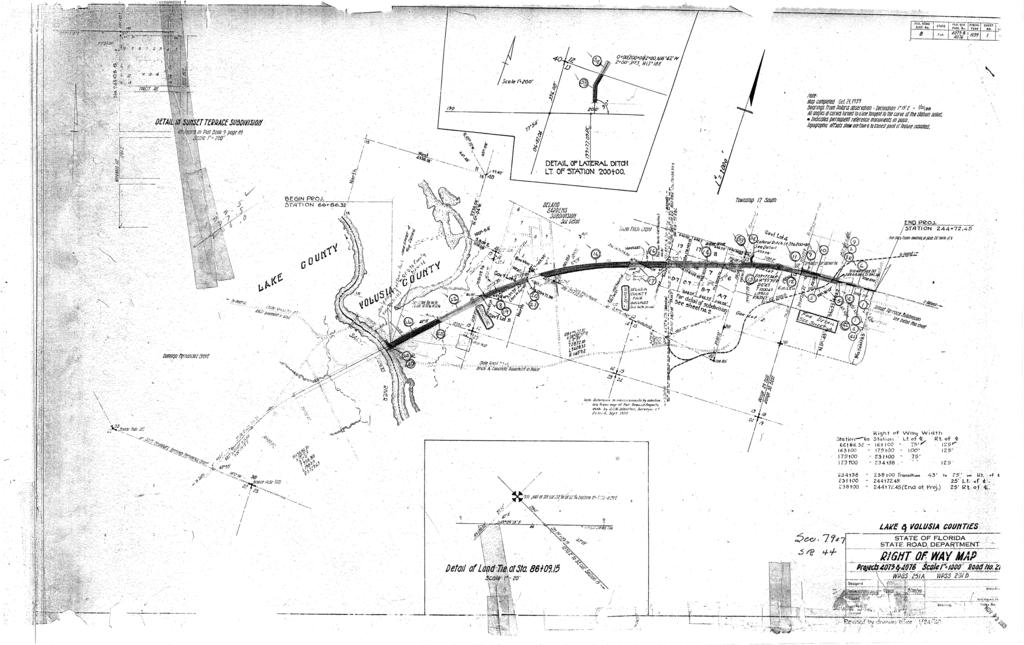
84
APPENDIX C1 TRAFFIC ANALYSIS DESIGN YEAR TRAFFIC ANALYSIS
 APPENDIX C1 TRAFFIC ANALYSIS DESIGN YEAR TRAFFIC ANALYSIS DESIGN YEAR TRAFFIC ANALYSIS February 2018 Highway & Bridge Project PIN 6754.12 Route 13 Connector Road Chemung County February 2018 Appendix
LAWRENCE TRANSIT CENTER LOCATION ANALYSIS 9 TH STREET & ROCKLEDGE ROAD / 21 ST STREET & IOWA STREET LAWRENCE, KANSAS
 LAWRENCE TRANSIT CENTER LOCATION ANALYSIS 9 TH STREET & ROCKLEDGE ROAD / 21 ST STREET & IOWA STREET LAWRENCE, KANSAS TRAFFIC IMPACT STUDY FEBRUARY 214 OA Project No. 213-542 TABLE OF CONTENTS 1. INTRODUCTION...
INTERSECTION CONTROL EVALUATION
 INTERSECTION CONTROL EVALUATION Trunk Highway 22 and CSAH 21 (E Hill Street/Shanaska Creek Road) Kasota, Le Sueur County, Minnesota November 2018 Trunk Highway 22 and Le Sueur CSAH 21 (E Hill Street/Shanaska
APPENDIX E. Traffic Analysis Report
 APPENDIX E Traffic Analysis Report THIS PAGE INTENTIONALLY BLANK EAGLE RIVER TRAFFIC MITIGATION PHASE I OLD GLENN HIGHWAY/EAGLE RIVER ROAD INTERSECTION IMPROVEMENTS TRAFFIC ANALYSIS Eagle River, Alaska
EXECUTIVE SUMMARY. The following is an outline of the traffic analysis performed by Hales Engineering for the traffic conditions of this project.
 EXECUTIVE SUMMARY This study addresses the traffic impacts associated with the proposed Shopko redevelopment located in Sugarhouse, Utah. The Shopko redevelopment project is located between 1300 East and
City of Pacific Grove
 Regional Study Utilizing Caltrans Intersection Evaluation Section 7: City of Pacific Grove s: FIRST STREET AT CENTRAL AVENUE Transportation Agency for Monterey County Prepared by Transportation Agency
BARRHAVEN FELLOWSHIP CRC 3058 JOCKVALE ROAD OTTAWA, ONTARIO TRANSPORTATION BRIEF. Prepared for:
 BARRHAVEN FELLOWSHIP CRC 3058 JOCKVALE ROAD OTTAWA, ONTARIO TRANSPORTATION BRIEF Prepared for: Barrhaven Fellowship CRC 3058 Jockvale Road Ottawa, ON K2J 2W7 December 7, 2016 116-649 Report_1.doc D. J.
Traffic Engineering Study
 Traffic Engineering Study Bellaire Boulevard Prepared For: International Management District Technical Services, Inc. Texas Registered Engineering Firm F-3580 November 2009 Executive Summary has been requested
King County Metro. Columbia Street Transit Priority Improvements Alternative Analysis. Downtown Southend Transit Study. May 2014.
 King County Metro Columbia Street Transit Priority Improvements Alternative Analysis Downtown Southend Transit Study May 2014 Parametrix Table of Contents Introduction... 1 Methodology... 1 Study Area...
City of Marina. Regional Roundabout Study Utilizing Caltrans Intersection Control Evaluation Section 4: Transportation Agency for Monterey County
 Regional Roundabout Study Utilizing Caltrans Intersection Control Evaluation Section 4: City of Marina Study Intersections: RESERVATION ROAD AT BEACH ROAD RESERVATION ROAD AT DEFOREST ROAD CARDOZA AVENUE
To: File From: Adrian Soo, P. Eng. Markham, ON File: Date: August 18, 2015
 Memo To: From: Adrian Soo, P. Eng. Markham, ON : 165620021 Date: Reference: E.C. Row Expressway, Dominion Boulevard Interchange, Dougall Avenue Interchange, and Howard 1. Review of Interchange Geometry
Traffic Impact Study Speedway Gas Station Redevelopment
 Traffic Impact Study Speedway Gas Station Redevelopment Warrenville, Illinois Prepared For: Prepared By: April 11, 2018 Table of Contents 1. Introduction... 1 2. Existing Conditions... 4 Site Location...
King Soopers #116 Thornton, Colorado
 Traffic Impact Study King Soopers #116 Thornton, Colorado Prepared for: Galloway & Company, Inc. T R A F F I C I M P A C T S T U D Y King Soopers #116 Thornton, Colorado Prepared for Galloway & Company
Traffic Impact Statement (TIS)
") Traffic Impact Statement (TIS) Vincentian PUDA Collier County, FL 10/18/2013 Prepared for: Global Properties of Naples Prepared by: Trebilcock Consulting Solutions, PA 2614 Tamiami Trail N, Suite 615 1205
Traffic Impact Statement (TIS) Vincentian PUDA Collier County, FL 10/18/2013 Prepared for: Global Properties of Naples Prepared by: Trebilcock Consulting Solutions, PA 2614 Tamiami Trail N, Suite 615 1205
TRAFFIC IMPACT ANALYSIS
 TRAFFIC IMPACT ANALYSIS Emerald Isle Commercial Development Prepared by SEPI Engineering & Construction Prepared for Ark Consulting Group, PLLC March 2016 I. Executive Summary A. Site Location The Emerald
TIMBERVINE TRANSPORTATION IMPACT STUDY FORT COLLINS, COLORADO JANUARY Prepared for:
 TIMBERVINE TRANSPORTATION IMPACT STUDY FORT COLLINS, COLORADO JANUARY 2014 Prepared for: Hartford Companies 1218 W. Ash Street Suite A Windsor, Co 80550 Prepared by: DELICH ASSOCIATES 2272 Glen Haven Drive
South Lexington Transportation Study Lexington, Massachusetts
 South Lexington Transportation Study Lexington, Massachusetts Preliminary Findings and Options for Consideration Businesses Meeting 10/10/13 Town of Lexington Engineering and Planning Departments Meeting
Date: February 7, 2017 John Doyle, Z-Best Products Robert Del Rio. T.E. Z-Best Traffic Operations and Site Access Analysis
 Memorandum Date: February 7, 07 To: From: Subject: John Doyle, Z-Best Products Robert Del Rio. T.E. Z-Best Traffic Operations and Site Access Analysis Introduction Hexagon Transportation Consultants, Inc.
2.0 Development Driveways. Movin Out June 2017
 Movin Out June 2017 1.0 Introduction The proposed Movin Out development is a mixed use development in the northeast quadrant of the intersection of West Broadway and Fayette Avenue in the City of Madison.
Section 5.0 Traffic Information
 Section 5.0 Traffic Information 10.0 TRANSPORTATION MDM Transportation Consultants, Inc. (MDM) has prepared an evaluation of transportation impacts for the proposed evaluation for the expansion of the
MEMO VIA . Ms. Amy Roth DPS Director, City of Three Rivers. To:
 MEMO To: Ms. Amy Roth DPS Director, City of Three Rivers VIA EMAIL From: Michael J. Labadie, PE Julie M. Kroll, PE, PTOE Brandon Hayes, PE, P.Eng. Fleis & VandenBrink Date: January 5, 2017 Re: Proposed
TRAFFIC SIGNAL DESIGN REPORT KING OF PRUSSIA ROAD & RAIDER ROAD RADNOR TOWNSHIP PENNSYLVANIA
 TRAFFIC SIGNAL DESIGN REPORT KING OF PRUSSIA ROAD & RAIDER ROAD RADNOR TOWNSHIP PENNSYLVANIA PREPARED FOR: UNIVERSITY OF PENNSYLVANIA HEALTH SYSTEM 34 CIVIC CENTER BOULEVARD PHILADELPHIA, PA 1987 (61)
INDUSTRIAL DEVELOPMENT
 INDUSTRIAL DEVELOPMENT Traffic Impact Study Plainfield, Illinois August 2018 Prepared for: Seefried Industrial Properties, Inc. TABLE OF CONTENTS Executive Summary 2 Introduction 3 Existing Conditions
MERIVALE PRIORITY SQUARE 2852 MERIVALE ROAD CITY OF OTTAWA TRANSPORTATION BRIEF. Prepared for: ONT Inc. 25 Winding Way Nepean, Ontario K2C 3H1
 MERIVALE PRIORITY SQUARE 2852 MERIVALE ROAD CITY OF OTTAWA TRANSPORTATION BRIEF Prepared for: 2190986ONT Inc. 25 Winding Way Nepean, Ontario K2C 3H1 October 6, 2010 110-502 Report_1.doc D. J. Halpenny
Bennett Pit. Traffic Impact Study. J&T Consulting, Inc. Weld County, Colorado. March 3, 2017
 Bennett Pit Traffic Impact Study J&T Consulting, Inc. Weld County, Colorado March 3, 217 Prepared By: Sustainable Traffic Solutions, Inc. http://www.sustainabletrafficsolutions.com/ Joseph L. Henderson,
RICHMOND OAKS HEALTH CENTRE 6265 PERTH STREET OTTAWA, ONTARIO TRANSPORTATION BRIEF. Prepared for: Guycoki (Eastern) Limited.
 Limited.") RICHMOND OAKS HEALTH CENTRE 6265 PERTH STREET OTTAWA, ONTARIO TRANSPORTATION BRIEF Prepared for: Guycoki (Eastern) Limited June 16, 2016 116-638 Brief_1.doc D. J. Halpenny & Associates Ltd. Consulting
RICHMOND OAKS HEALTH CENTRE 6265 PERTH STREET OTTAWA, ONTARIO TRANSPORTATION BRIEF Prepared for: Guycoki (Eastern) Limited June 16, 2016 116-638 Brief_1.doc D. J. Halpenny & Associates Ltd. Consulting
Downtown One Way Street Conversion Technical Feasibility Report
 Downtown One Way Street Conversion Technical Feasibility Report As part of the City s Transportation Master Plan, this report reviews the technical feasibility of the proposed conversion of the current
Alpine Highway to North County Boulevard Connector Study
 Alpine Highway to North County Boulevard Connector Study prepared by Avenue Consultants March 16, 2017 North County Boulevard Connector Study March 16, 2017 Table of Contents 1 Summary of Findings... 1
MILLERSVILLE PARK TRAFFIC IMPACT ANALYSIS ANNE ARUNDEL COUNTY, MARYLAND
 MILLERSVILLE PARK TRAFFIC IMPACT ANALYSIS ANNE ARUNDEL COUNTY, MARYLAND Prepared for: Department of Public Works Anne Arundel County Prepared by: URS Corporation 4 North Park Drive, Suite 3 Hunt Valley,
L1TILE BEARS DAY CARE TRANSPORTATION IMPACT STUDY FORT COLLINS, COLORADO MAY Prepared for:
 L1TILE BEARS DAY CARE TRANSPORTATION IMPACT STUDY FORT COLLINS, COLORADO MAY 2012 Prepared for: Hillside Construction, Inc. 216 Hemlock Street, Suite B Fort Collins, CO 80534 Prepared by: DELICH ASSOCIATES
105 Toronto Street South, Markdale Transportation Impact Study. Paradigm Transportation Solutions Limited
 105 Toronto Street South, Markdale Transportation Impact Study Paradigm Transportation Solutions Limited December 2016 Project Summary Project Number 162060 December 2016 Client Zelinka Priamo Ltd 318
V. DEVELOPMENT OF CONCEPTS
 Martin Luther King, Jr. Drive Extension FINAL Feasibility Study Page 9 V. DEVELOPMENT OF CONCEPTS Throughout the study process several alternative alignments were developed and eliminated. Initial discussion
County State Aid Highway 30 (Diffley Road) and Dodd Road Intersection Study
 and Dodd Road Intersection Study") County State Aid Highway 30 (Diffley Road) and Dodd Road Intersection Study City of Eagan, Dakota County, Minnesota Date: March 2012 Project No. 14957.000 444 Cedar Street, Suite 1500 Saint Paul, MN 55101
County State Aid Highway 30 (Diffley Road) and Dodd Road Intersection Study City of Eagan, Dakota County, Minnesota Date: March 2012 Project No. 14957.000 444 Cedar Street, Suite 1500 Saint Paul, MN 55101
Figure 1 Map of intersection of SR 44 (Ravenna Rd) and Butternut Rd
 and Butternut Rd") Abbreviated Study District: 12 County: Geauga Route: SR 44 Section: 1.58 GEA 44 1.58 213 HSP # 47 (Rural Intersection) Prepared April 23, 215 By Bryan Emery Existing Conditions This study contains the
Abbreviated Study District: 12 County: Geauga Route: SR 44 Section: 1.58 GEA 44 1.58 213 HSP # 47 (Rural Intersection) Prepared April 23, 215 By Bryan Emery Existing Conditions This study contains the
Volume 1 Traffic Impact Analysis Turtle Creek Boulevard Dallas, Texas. Kimley-Horn and Associates, Inc. Dallas, Texas.
 Volume 1 Traffic Impact Analysis 2727 Dallas, Texas June 18, 2018 Kimley-Horn and Associates, Inc. Dallas, Texas Project #064523000 Registered Firm F-928 Traffic Impact Analysis 2727 Dallas, Texas Prepared
TRAFFIC IMPACT STUDY. USD #497 Warehouse and Bus Site
 TRAFFIC IMPACT STUDY for USD #497 Warehouse and Bus Site Prepared by: Jason Hoskinson, PE, PTOE BG Project No. 16-12L July 8, 216 145 Wakarusa Drive Lawrence, Kansas 6649 T: 785.749.4474 F: 785.749.734
Evaluation Considerations and Geometric Nuances of Reduced Conflict U-Turn Intersections (RCUTs)
") Evaluation Considerations and Geometric Nuances of Reduced Conflict U-Turn Intersections (RCUTs) 26 th Annual Transportation Research Conference Saint Paul RiverCentre May 20, 2015 Presentation Outline
Evaluation Considerations and Geometric Nuances of Reduced Conflict U-Turn Intersections (RCUTs) 26 th Annual Transportation Research Conference Saint Paul RiverCentre May 20, 2015 Presentation Outline
ANDERSON PROPERTY SITE ANALYSIS
 ANDERSON PROPERTY SITE ANALYSIS Introduction The Montgomery County Department of Transportation (MCDOT) initiated a feasibility study in the fall of 2012 to evaluate the need for transit service expansion
West Hills Shopping Centre Lowe s Expansion Traffic Impact Study
 West Hills Shopping Centre Lowe s Expansion Traffic Impact Study Prepared for: Armel Corporation January 2015 Paradigm Transportation Solutions Ltd. 22 King Street South, Suite 300 Waterloo ON N2J 1N8
DEVELOPMENT PROPERTY 1627 MAXIME STREET CITY OF OTTAWA TRANSPORTATION OVERVIEW. Prepared for: Subhas Bhargava. July 9, Overview_1.
 DEVELOPMENT PROPERTY 1627 MAXIME STREET CITY OF OTTAWA TRANSPORTATION OVERVIEW Prepared for: Subhas Bhargava July 9, 2015 115-620 Overview_1.doc D. J. Halpenny & Associates Ltd. Consulting Transportation
Appendix C-5: Proposed Refinements Rail Operations and Maintenance Facility (ROMF) Traffic Impact Analysis. Durham-Orange Light Rail Transit Project
 Traffic Impact Analysis. Durham-Orange Light Rail Transit Project") Appendix C-5: Proposed Refinements Rail Operations and Maintenance Facility (ROMF) Traffic Impact Analysis Durham-Orange Light Rail Transit Project July 25, 218 ROMF Transportation Impact Analysis Version
Appendix C-5: Proposed Refinements Rail Operations and Maintenance Facility (ROMF) Traffic Impact Analysis Durham-Orange Light Rail Transit Project July 25, 218 ROMF Transportation Impact Analysis Version
County State Aid Highway 32 (Cliff Road) and Dodd Road Intersection Study
 and Dodd Road Intersection Study") County State Aid Highway 32 (Cliff Road) and Dodd Road Intersection Study City of Eagan, Dakota County, Minnesota Date: March 2012 Project No. 14957.000 444 Cedar Street, Suite 1500 Saint Paul, MN 55101
County State Aid Highway 32 (Cliff Road) and Dodd Road Intersection Study City of Eagan, Dakota County, Minnesota Date: March 2012 Project No. 14957.000 444 Cedar Street, Suite 1500 Saint Paul, MN 55101
Traffic Impact Analysis West Street Garden Plots Improvements and DuPage River Park Garden Plots Development Naperville, Illinois
 Traffic Impact Analysis West Street Garden Plots Improvements and DuPage River Park Garden Plots Development Naperville, Illinois Submitted by April 9, 2009 Introduction Kenig, Lindgren, O Hara, Aboona,
Traffic Impact Analysis. Alliance Cole Avenue Residential Site Dallas, Texas. Kimley-Horn and Associates, Inc. Dallas, Texas.
 Traffic Impact Analysis Alliance Cole Avenue Residential Site Dallas, Texas February 15, 2018 Kimley-Horn and Associates, Inc. Dallas, Texas Project #064524900 Registered Firm F-928 Traffic Impact Analysis
Speed measurements were taken at the following three locations on October 13 and 14, 2016 (See Location Map in Exhibit 1):
:") 2709 McGraw Drive Bloomington, Illinois 61704 p 309.663.8435 f 309.663.1571 www.f-w.com www.greennavigation.com November 4, 2016 Mr. Kevin Kothe, PE City Engineer City of Bloomington Public Works Department
2709 McGraw Drive Bloomington, Illinois 61704 p 309.663.8435 f 309.663.1571 www.f-w.com www.greennavigation.com November 4, 2016 Mr. Kevin Kothe, PE City Engineer City of Bloomington Public Works Department
State Route 1/State Route 41/ Main Street Intersection Control Evaluation (Step 2) Report. City of Morro Bay. Prepared for: Prepared by:
 Report. City of Morro Bay. Prepared for: Prepared by:") State Route 1/State Route 41/ Main Street Intersection Control Evaluation (Step 2) Report Prepared for: City of Morro Bay Prepared by: (Caltrans Project No. 0515000104, EA 0F670) State Route 1/State Route
State Route 1/State Route 41/ Main Street Intersection Control Evaluation (Step 2) Report Prepared for: City of Morro Bay Prepared by: (Caltrans Project No. 0515000104, EA 0F670) State Route 1/State Route
The Highway Safety Manual: Will you use your new safety powers for good or evil? April 4, 2011
 The Highway Safety Manual: Will you use your new safety powers for good or evil? April 4, 2011 Introductions Russell Brownlee, M.A. Sc., FITE, P. Eng. Specialize in road user and rail safety Transportation
Clean Harbors Canada, Inc.
 Clean Harbors Canada, Inc. Proposed Lambton Landfill Expansion Environmental Assessment Terms of Reference Transportation Assessment St. Clair Township, Ontario September 2009 itrans Consulting Inc. 260
Proposed location of Camp Parkway Commerce Center. Vicinity map of Camp Parkway Commerce Center Southampton County, VA
 Proposed location of Camp Parkway Commerce Center Vicinity map of Camp Parkway Commerce Center Southampton County, VA Camp Parkway Commerce Center is a proposed distribution and industrial center to be
Proposed CVS/pharmacy
 Traffic Impact and Access Study Proposed CVS/pharmacy West Main Street (Route 1) at Hull Street Clinton, Connecticut PREPARED FOR Arista Development LLC 520 Providence Highway, Suite 9 Norwood, Massachusetts
Mr. Kyle Zimmerman, PE, CFM, PTOE County Engineer
 Los Alamos County Engineering Division 1925 Trinity Drive, Suite B Los Alamos, NM 87544 Attention: County Engineer Dear Kyle: Re: NM 502 Transportation Corridor Study and Plan Peer Review Los Alamos, New
Table of Contents INTRODUCTION... 3 PROJECT STUDY AREA Figure 1 Vicinity Map Study Area... 4 EXISTING CONDITIONS... 5 TRAFFIC OPERATIONS...
 Crosshaven Drive Corridor Study City of Vestavia Hills, Alabama Table of Contents INTRODUCTION... 3 PROJECT STUDY AREA... 3 Figure 1 Vicinity Map Study Area... 4 EXISTING CONDITIONS... 5 TRAFFIC OPERATIONS...
RTE. 1 at RTE. 637 & RTE. 639
 INTERSECTION SAFETY STUDY Prepared for: Virginia Department of Transportation Central Region Operations Traffic Engineering (UPC #81378, TO 12-092) DAVENPORT Project Number: 13-368 / /2014 RTE. 1 at RTE.
TRAFFIC IMPACT STUDY DERRY GREEN CORPORATE BUSINESS PARK MILTON SECONDARY PLAN MODIFICATION
 TRAFFIC IMPACT STUDY DERRY GREEN CORPORATE BUSINESS PARK MILTON SECONDARY PLAN MODIFICATION TRAFFIC IMPACT STUDY DERRY GREEN CORPORATE BUSINESS PARK MILTON SECONDARY PLAN MODIFICATION DECEMBER 24 UPDATED
Craig Scheffler, P.E., PTOE HNTB North Carolina, P.C. HNTB Project File: Subject
 TECHNICAL MEMORANDUM To Kumar Neppalli Traffic Engineering Manager Town of Chapel Hill From Craig Scheffler, P.E., PTOE HNTB North Carolina, P.C. Cc HNTB Project File: 38435 Subject Obey Creek TIS 2022
Subarea Study. Manning Avenue (CSAH 15) Corridor Management and Safety Improvement Project. Final Version 1. Washington County.
 Corridor Management and Safety Improvement Project. Final Version 1. Washington County.") Subarea Study Manning Avenue (CSAH 15) Corridor Management and Safety Improvement Project Final Version 1 Washington County June 12, 214 SRF No. 138141 Table of Contents Introduction... 1 Forecast Methodology
Subarea Study Manning Avenue (CSAH 15) Corridor Management and Safety Improvement Project Final Version 1 Washington County June 12, 214 SRF No. 138141 Table of Contents Introduction... 1 Forecast Methodology
Table Existing Traffic Conditions for Arterial Segments along Construction Access Route. Daily
 5.8 TRAFFIC, ACCESS, AND CIRCULATION This section describes existing traffic conditions in the project area; summarizes applicable regulations; and analyzes the potential traffic, access, and circulation
Traffic Feasibility Study
 Traffic Feasibility Study Town Center South Robbinsville Township, Mercer County, New Jersey December 19, 2017 Prepared For Robbinsville Township Department of Community Development 2298 Route 33 Robbinsville,
2030 Multimodal Transportation Study
 2030 Multimodal Transportation Study City of Jacksonville Planning and Development Department Prepared by Ghyabi & Associates April 29,2010 Introduction Presentation Components 1. Study Basis 2. Study
Escondido Marriott Hotel and Mixed-Use Condominium Project TRAFFIC IMPACT ANALYSIS REPORT
 Escondido Marriott Hotel and Mixed-Use Condominium Project TRAFFIC IMPACT ANALYSIS REPORT Prepared for Phelps Program Management 420 Sixth Avenue, Greeley, CO 80632 Prepared by 5050 Avenida Encinas, Suite
TRAFFIC IMPACT ANALYSIS FOR. McDONALD S RESTAURANT IN CARMICAEL Sacramento County, CA. Prepared For:
 TRAFFIC IMPACT ANALYSIS FOR McDONALD S RESTAURANT IN CARMICAEL Sacramento County, CA Prepared For: McDonald s USA, LLC Pacific Sierra Region 2999 Oak Road, Suite 900 Walnut Creek, CA 94597 Prepared By:
Shirk Road at State Route 198 Interchange Analysis Tulare County, California
 Shirk Road at State Route 198 Interchange Analysis Tulare County, California DRAFT REPORT Prepared By Tulare County Association of Governments (TCAG) April 2013 Table of Contents Introduction:... 3 Project
Southern Windsor County 2016 Traffic Count Program Summary April 2017
 Southern Windsor County 2016 Traffic Count Program Summary April 2017 The Southern Windsor County Regional Planning Commission (the RPC ) has been monitoring traffic at 19 locations throughout the southern
Proposed Inn at Bellefield Traffic Impact Assessment
 Proposed Inn at Bellefield Traffic Impact Assessment Town of Hyde Park Dutchess County, New York Prepared for: T-Rex Hyde Park Owner LLC 500 Mamroneck Avenue, Suite 300 Harrison, NY 10528 June 21, 2017
December 5, Red Bank Planning Board Municipal Building 90 Monmouth Street Red Bank, NJ 07701
 Dynamic Traffic, LLC www.dynamic-traffic.com 1904 Main Street Lake Como, NJ 07719 T. 732.681.0760 December 5, 2016 Red Bank Planning Board Municipal Building 90 Monmouth Street Red Bank, NJ 07701 Re: Traffic
Interstate Operations Study: Fargo-Moorhead Metropolitan Area Simulation Output
 NDSU Dept #2880 PO Box 6050 Fargo, ND 58108-6050 Tel 701-231-8058 Fax 701-231-6265 www.ugpti.org www.atacenter.org Interstate Operations Study: Fargo-Moorhead Metropolitan Area 2015 Simulation Output Technical
Citizens Committee for Facilities
 Citizens Committee for Facilities AGENDA Thursday, December 11, 2014 City Council Chambers 305 3 rd Avenue East -Twin Falls, Idaho 11:30 A.M. AGENDA ITEMS Purpose By 1. Discussion and possible action on
Lacey Gateway Residential Phase 1
 Lacey Gateway Residential Phase Transportation Impact Study April 23, 203 Prepared for: Gateway 850 LLC 5 Lake Bellevue Drive Suite 02 Bellevue, WA 98005 Prepared by: TENW Transportation Engineering West
1. INTRODUCTION 2. PROJECT DESCRIPTION CUBES SELF-STORAGE MILL CREEK TRIP GENERATION COMPARISON
 CUBES SELF-STORAGE MILL CREEK TRIP GENERATION COMPARISON 1. INTRODUCTION This report summarizes traffic impacts of the proposed CUBES Self-Storage Mill Creek project in comparison to the traffic currently
Traffic Impact Analysis Update
 Willow Bend Traffic Impact Analysis Update TABLE OF CONTENTS Page I. INTRODUCTION -------------------------------------------------------------------------------------------- 1 II. EXISTING CONDITIONS
Memorandum. To: Sue Polka, City Engineer, City of Arden Hills. From: Sean Delmore, PE, PTOE. Date: June 21, 2017
 Memorandum engineering planning environmental construction 701 Xenia Avenue South Suite 300 Minneapolis, MN 55416 Tel: 763-541-4800 Fax: 763-541-1700 To: Sue Polka, City Engineer, City of Arden Hills From:
Appendix J Traffic Impact Study
 MRI May 2012 Appendix J Traffic Impact Study Level 2 Traffic Assessment Limited Impact Review Appendix J [This page was left blank intentionally.] www.sgm-inc.com Figure 1. Site Driveway and Trail Crossing
EXCEPTION TO STANDARDS REPORT
 EXCEPTION TO STANDARDS REPORT PROJECT DESCRIPTION AND NEED The project is located in Section 6, Township 23 North, Range 9 East and Section 31 Township 24 North, Range 9 East, in the Town of Stockton,
TALMONT TOWNHOMES MADISON KENNETH SPA TRAFFIC IMPACT STUDY. Sacramento, CA. Prepared For: MBK Homes. Prepared By:
 TALMONT TOWNHOMES MADISON KENNETH SPA TRAFFIC IMPACT STUDY Sacramento, CA Prepared For: MBK Homes Prepared By: KD Anderson & Associates 3853 Taylor Road, Suite G Loomis, California 95650 (916) 660-1555
MINERVA PARK SITE TRAFFIC IMPACT STUDY M/I HOMES. September 2, 2015
 5500 New Albany Road Columbus, Ohio 43054 Phone: 614.775.4500 Fax: 614.775.4800 Toll Free: 1-888-775-EMHT emht.com 2015-1008 MINERVA PARK SITE TRAFFIC IMPACT STUDY M/I HOMES September 2, 2015 Engineers
Transit City Etobicoke - Finch West LRT
 Delcan Corporation Transit City Etobicoke - Finch West LRT APPENDIX D Microsimulation Traffic Modeling Report March 2010 March 2010 Appendix D CONTENTS 1.0 STUDY CONTEXT... 2 Figure 1 Study Limits... 2
The major roadways in the study area are State Route 166 and State Route 33, which are shown on Figure 1-1 and described below:
 3.5 TRAFFIC AND CIRCULATION 3.5.1 Existing Conditions 3.5.1.1 Street Network DRAFT ENVIRONMENTAL IMPACT REPORT The major roadways in the study area are State Route 166 and State Route 33, which are shown
TRAFFIC IMPACT STUDY FOR SONIC DRIVE-IN RESTAURANT. Vallejo, CA. Prepared For:
 TRAFFIC IMPACT STUDY FOR SONIC DRIVE-IN RESTAURANT Vallejo, CA Prepared For: ELITE DRIVE-INS, INC. 2190 Meridian Park Blvd, Suite G Concord, CA 94520 Prepared By: KD Anderson & Associates 3853 Taylor Road,
Clearlake Road (State Road 501) Project Development & Environment (PD&E) Study
 Project Development & Environment (PD&E) Study") Clearlake Road (State Road 501) Project Development & Environment (PD&E) Study FROM MICHIGAN AVENUE TO INDUSTRY ROAD BREVARD COUNTY, FLORIDA Financial Project ID No: 433605-1-22-01 Federal Aid Project
Clearlake Road (State Road 501) Project Development & Environment (PD&E) Study FROM MICHIGAN AVENUE TO INDUSTRY ROAD BREVARD COUNTY, FLORIDA Financial Project ID No: 433605-1-22-01 Federal Aid Project
INTERSECTION ANALYSIS PARK AVENUE AND BRADDOCK ROAD (FROSTBURG, MD) FOR LENHART TRAFFIC CONSULTING, INC.
 FOR LENHART TRAFFIC CONSULTING, INC.") INTERSECTION ANALYSIS FOR PARK AVENUE AND BRADDOCK ROAD (FROSTBURG, MD) Prepared for: City of Frostburg, Maryland & Allegany County Commissioners Prepared by: LENHART TRAFFIC CONSULTING, INC. TRAFFIC ENGINEERING
INTERSECTION ANALYSIS FOR PARK AVENUE AND BRADDOCK ROAD (FROSTBURG, MD) Prepared for: City of Frostburg, Maryland & Allegany County Commissioners Prepared by: LENHART TRAFFIC CONSULTING, INC. TRAFFIC ENGINEERING
New Buck O Neil (U. S. 169) Crossing Benefit-Cost Analysis. Kansas City, Missouri
 Crossing Benefit-Cost Analysis. Kansas City, Missouri") New Buck O Neil (U. S. 169) Crossing Benefit-Cost Analysis Kansas City, Missouri New Buck O Neil (U. S. 169) Crossing Benefit-Cost Analysis prepared for Kansas City, Missouri prepared by Burns & McDonnell
New Buck O Neil (U. S. 169) Crossing Benefit-Cost Analysis Kansas City, Missouri New Buck O Neil (U. S. 169) Crossing Benefit-Cost Analysis prepared for Kansas City, Missouri prepared by Burns & McDonnell
VOA Vista Drive Residential housing Development TIA Project #13915 TABLE OF CONTENTS
 VOA Vista Drive Residential housing Development TIA Project #13915 TABLE OF CONTENTS Executive Summary... 2 Project Background... 2 Conditions... 2 Findings... 3 Recommendations... 4 Introduction... 6
Highway 18 BNSF Railroad Overpass Feasibility Study Craighead County. Executive Summary
 Highway 18 BNSF Railroad Overpass Feasibility Study Craighead County Executive Summary October 2014 Highway 18 BNSF Railroad Overpass Feasibility Study Craighead County Executive Summary October 2014 Prepared
BROWARD BOULEVARD CORRIDOR TRANSIT STUDY
 BROWARD BOULEVARD CORRIDOR TRANSIT STUDY FM # 42802411201 EXECUTIVE SUMMARY July 2012 GOBROWARD Broward Boulevard Corridor Transit Study FM # 42802411201 Executive Summary Prepared For: Ms. Khalilah Ffrench,
FINAL. Sound Transit Long-Range Plan Update. Issue Paper S.1: Tacoma Link Integration with Central Link. Prepared for: Sound Transit
 Sound Transit Long-Range Plan Update Issue Paper S.1: Tacoma Link Integration with Central Link Prepared for: Sound Transit Prepared by: Quade & Douglas, Inc. FINAL March 2005 Foreword This issue paper
Parks and Transportation System Development Charge Methodology
 City of Sandy Parks and Transportation System Development Charge Methodology March, 2016 Background In order to implement a City Council goal the City of Sandy engaged FCS Group in January of 2015 to update
Traffic Impact Study for the proposed. Town of Allegany, New York. August Project No Prepared For:
 Appendix B SRF Traffic Study (Revised November 2005) Draft Environmental Impact Statement University Commons Town of Allegany, Cattaraugus County, NY December 2005 Traffic Impact Study for the proposed
ZINFANDEL LANE / SILVERADO TRAIL INTERSECTION TRAFFIC ANALYSIS
 ZINFANDEL LANE / SILVERADO TRAIL INTERSECTION TRAFFIC ANALYSIS UPDATED TRAFFIC STUDY FOR THE PROPOSED RAYMOND VINEYARDS WINERY USE PERMIT MODIFICATION #P11-00156 AUGUST 5, 2014 PREPARED BY: OMNI-MEANS,
GASOLINE SERVICE STATION 1618, 1622 ROGER STEVENS DRIVE OTTAWA, ONTARIO TRANSPORTATION IMPACT ASSESSMENT. Prepared for:
 GASOLINE SERVICE STATION 1618, 1622 ROGER STEVENS DRIVE OTTAWA, ONTARIO TRANSPORTATION IMPACT ASSESSMENT Prepared for: Invecta Development (Ottawa) Corporation 758 Shanks Height Milton, ON L9T 7P7 May
MEMORANDUM. Figure 1. Roundabout Interchange under Alternative D
 MEMORANDUM Date: To: Liz Diamond, Dokken Engineering From: Subject: Dave Stanek, Fehr & Peers Western Placerville Interchanges 2045 Analysis RS08-2639 Fehr & Peers has completed a transportation analysis
Interstate Operations Study: Fargo-Moorhead Metropolitan Area Simulation Results
 NDSU Dept #2880 PO Box 6050 Fargo, ND 58108-6050 Tel 701-231-8058 Fax 701-231-6265 www.ugpti.org www.atacenter.org Interstate Operations Study: Fargo-Moorhead Metropolitan Area 2025 Simulation Results
Trafalgar Road & Lower Base Line Transportation Study Ontario Inc.
 Trafalgar Road & Lower Base Line Transportation Study 1255723 Ontario Inc. Trafalgar Road & Lower Base Line Transportation Study 1255723 Ontario Inc. 1465 Pickering Parkway Suite 200 Pickering ON L1V 7G7
IMPROVEMENT CONCEPTS
 IMPROVEMENT CONCEPTS for the South Novato Transit Hub Study Prepared by: January 11, 2010 DKS Associates With Wilbur Smith Associates IMPROVEMENT CONCEPTS Chapter 1: Introduction 1. INTRODUCTION The strategic
Ryan Coyne, PE City Engineer City of Rye 1051 Boston Post Road Rye, NY Boston Post Road Realignment and Roundabout Design Report
 March 6, 2015 Ryan Coyne, PE City Engineer City of Rye 1051 Boston Post Road Rye, NY 10580 RE: JMC Project 14108 Boston Post Road Roundabout Boston Post Road and Parsons Street City of Rye, NY Dear Ryan:
Task 5.1: Existing Conditions Review and Analysis
 City of Oceanside Coast Highway Corridor Task 5.1: Existing Conditions Review and Analysis Technical Memorandum August 2014 DOCUMENT CONTROL Client: Project Name: Report Title: City of Oceanside City of
2016 Congestion Report
 2016 Congestion Report Metropolitan Freeway System May 2017 2016 Congestion Report 1 Table of Contents Purpose and Need...3 Introduction...3 Methodology...4 2016 Results...5 Explanation of Percentage Miles
AASHTO Policy on Geometric Design of Highways and Streets
 AASHTO Policy on Geometric Design of Highways and Streets 2001 Highlights and Major Changes Since the 1994 Edition Jim Mills, P.E. Roadway Design Office 605 Suwannee Street MS-32 Tallahassee, FL 32399-0450
US 81 Bypass of Chickasha Environmental Assessment Public Meeting
 US 81 Bypass of Chickasha Environmental Assessment Public Meeting March 14, 2013 Introductions ODOT FHWA SAIC Meeting Purpose Present need for bypass Provide responses to 10/04/11 public meeting comments
TECHNICAL MEMORANDUM. Part A: Introduction
 TECHNICAL MEMORANDUM To: David J. Decker Decker Properties, Inc. 5950 Seminole Centre Ct. Suite 200 Madison, Wisconsin 53711 608-663-1218 Fax: 608-663-1226 www.klengineering.com From: Mike Scarmon, P.E.,
Corridor Analysis. For COUNTY LINE ROAD (S.R. 1001) CORRIDOR. located in. File No March 2019
 CORRIDOR. located in. File No March 2019") Corridor Analysis For COUNTY LINE ROAD (S.R. 1001) CORRIDOR located in Radnor Township Delaware County Lower Merion Township Montgomery County File No. 16-11060-02 March 2019 Prepared For: Radnor Township
Corridor Analysis For COUNTY LINE ROAD (S.R. 1001) CORRIDOR located in Radnor Township Delaware County Lower Merion Township Montgomery County File No. 16-11060-02 March 2019 Prepared For: Radnor Township