CUY SAFETY STUDY KINSMAN RD (US 422) AT E. 93 RD ST CLEVELAND, OHIO - ODOT DISTRICT 12. October 13, LJB Inc.
|
|
|
- Amos Carter
- 5 years ago
- Views:
Transcription


")
1 CUY SAFETY STUDY KINSMAN RD (US 422) AT E. 93 RD ST CLEVELAND, OHIO - ODOT DISTRICT 12 October 13, 2014 PREPARED BY: LJB Inc Newmark Drive Miamisburg, OH (937) Elizabeth L. Sliemers, P.E. BSliemers@LJBinc.com
2 CUY Safety Study TABLE OF CONTENTS INTRODUCTION... 1 EXISTING CONDITIONS... 4 CRASH ANALYSIS... 9 COUNTERMEASURES BENEFIT COST ANALYSIS FIGURES FIGURE 1 PROJECT LOCATION MAP... 2 FIGURE 2 STUDY AREA MAP... 3 FIGURE 3 INTERSECTION ALIGNMENT... 5 FIGURE 4 INTERSECTION FUNCTIONAL AREA... 6 FIGURE 5 EXPECTED EXCESS CRASHES FIGURE 6 SHORT TERM CONCEPT PLAN APPENDICES PROJECT DOCUMENTATION... A EXISTING CONDITIONS DIAGRAM... B TRAFFIC DATA... C CRASH DIAGRAMS... D HSM OUTPUT... E CLEARANCE INTERVAL CALCULATIONS... F CAPACITY ANALYSIS REPORTS...G STORAGE LENGTH CALCULATIONS... H COST ESTIMATE AND BENEFIT COST ANALYSIS... I SAFETY FUNDING GUIDELINES AND APPLICATION FORM...J DISCLAIMER: The contents of this report are protected in accordance with 23 USC Section 409: Discovery and Admission as Evidence of Certain Reports and Surveys. TABLE OF CONTENTS
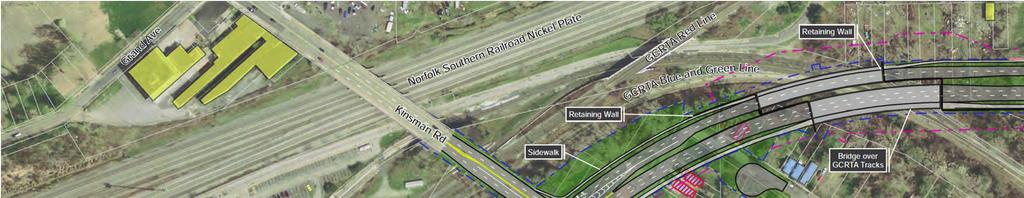
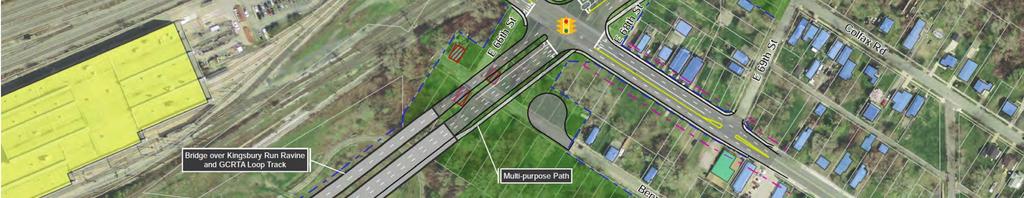
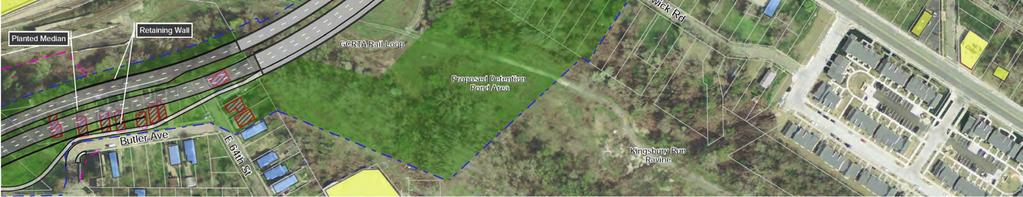
3 CUY Safety Study INTRODUCTION PURPOSE AND NEED The purpose of this study is to evaluate existing safety performance and to identify potential countermeasures to reduce traffic crashes and congestion at the intersection of US Route 422 (Kinsman Road) and E. 93 rd Street. This intersection located at SLM 4.34 is ranked 19 on the ODOT 2012 Urban Intersection Peak Searching Excess Locations list. A review of crash data provided by the Ohio Department of Transportation (ODOT) yielded a total of 88 reported crashes at the study intersection during a 3-year period between 2010 and The following crash types and conditions are over represented at the study location compared to statewide averages (shown in parenthesis). Note the statewide crash averages are based on data whereas the project data encompasses years 2010 to Total crashes: 88 total crashes Injury crashes: 35 crashes or 39.8 percent (25.4 percent) Rear end: 42 crashes or 47.7 percent (30.9 percent) Left Turn: 15 crashes or 17.0 percent (5.2 percent) Pedestrian: 6 crashes or 6.8 percent (0.8 percent) BACKGROUND US Route 422, here in referred to as Kinsman Road is an east-west route that provides connection between downtown Cleveland and IR-271. E. 93 rd Street is a north-south route between Kinsman Road and Miles Avenue. The intersection is located in the City of Cleveland. A project location map is provided in Figure 1. The study intersection is located south of Cleveland s Opportunity Corridor, a transportation and economic development project aimed at connecting I-490 to the University Circle neighborhood. The proposed boulevard extension of I-490 will form new intersections with Kinsman Road (approximately 1.25 miles west of the study intersection) and E. 93 rd Street (north of Buckeye Road). Kinsman Road is planned to be widened to a five-lane section to provide exclusive left turn lanes at the subject intersection with the Opportunity Corridor project. A Preferred Alternative map of the new Kinsman Road intersection is provided in Appendix A. A safety study was prepared for the study intersection in April 2009 and was based on crash data. There were 46 documented crashes during the analysis period which represents 48 percent fewer crashes than were reported during the analysis period being used in this current study. Recommendations from the 2009 safety study include: Short Term: Upgrade traffic signals, revise signal timing and phasing to change the protected lead phase from southbound approach to northbound approach, provide coordination with the traffic signal at E. 93 rd Street/Ramona Boulevard intersection, and install epoxy pavement marking and lane use signs at both intersections. Medium Term: Install signal actuation (preferably video detection) and coordination with the traffic signal at the E. 93 rd /Ramona Boulevard intersection. Long Term: Install left turn lanes on all four approaches of the intersection, widen roadways to accommodate 12 foot travel lanes, and update signal timing and phasing. INTRODUCTION 1

4 CUY Safety Study The City of Cleveland Capital Improvement Program (CIP) identifies the widening of E. 93 rd Street to a five-lane section from Ramona Boulevard south as a project for FY 2015/2016. Details and limits of this project were unknown at the time that this study was prepared. FIGURE 1: PROJECT LOCATION MAP INTRODUCTION 2

5 CUY Safety Study FIGURE 2: STUDY AREA MAP INTRODUCTION 3
6 CUY Safety Study EXISTING CONDITIONS ROADWAY CONDITIONS Kinsman Road intersects E. 93rd Street at a four-leg, signalized intersection. The signalized intersection of E. 93 rd Street and Ramona Boulevard is located less than 200 feet north of the Kinsman Road intersection and has been included as part of the study area. Existing roadway conditions are summarized in Table 1 and described in additional detail below. Existing conditions diagrams are provided in Appendix B. TABLE 1: EXISTING ROADWAY CONDITIONS KINSMAN ROAD (US 422) E. 93RD STREET RAMONA BLVD ODOT Functional Urban Minor Arterial Urban Minor Arterial Urban Collector Classification Federal Aid Primary? Yes No No Posted speed limit 35 MPH 35 MPH 25 MPH 2012 ADT (from NOACA) 14,160 vpd 16,740 vpd Not available Truck % (from NOACA) 3.5% Not available Not available Kinsman Road (east/west) 4-lane roadway section comprised of two travel lanes in each direction. An exclusive WB right turn lane is provided. Left turn movements are made from the shared left through lane. Pavement widths are typically 42 feet but vary between 47 feet and 55 feet at the intersection with E. 93 rd Street due to a wider curb lane width on the eastbound approach and the exclusive right turn lane on the westbound approach. Lane line markings on the east leg are not visible or are significantly worn. Note that lane lines are not visible for eastbound traffic in Figure 2. Sidewalks exist on both sides of Kinsman Road E. 93 rd Street (north/south) 4-lane roadway section comprised two travel lanes in each direction within study limits. Pavement widths at the approaches to the Kinsman Road intersection are approximately 60 feet. The northbound curb lane is 17 feet wide and the southbound curb lane is 16 feet wide. North of Ramona Boulevard, E. 93 rd Street retains a 4-lane section with a total pavement width of 44 feet. Lane line markings are not visible On-street parking is permitted north of Ramona by time of day (7 AM to 6 PM) Sidewalks exist on both sides of E. 93rd Street Overhead lighting is provided on Kinsman Road and E. 93 rd Street. Intersection level lighting is provided in the southeast, northwest and southwest quadrants. EXISTING CONDITIONS 4
 and one on E. 93 rd Street (Route 10) provide 24-hour a day transit service.")

7 CUY Safety Study Greater Cleveland RTA provides transit service in the area with bus stops located in each of the four quadrants of the Kinsman/E. 93 rd Street intersection. Two bus routes, one on Kinsman Road (Route 14) and one on E. 93 rd Street (Route 10) provide 24-hour a day transit service. Transit service operates with 13 minute to 15 minute headways from 6 AM to 6 PM on weekdays with reduced service during other time periods and weekends. INTERSECTION CONDITIONS Kinsman Road intersects E. 93rd Street at a 72 degree angle which is within acceptable limits as specific in the ODOT Location and Design Manual. An angle point in the horizontal alignment of Kinsman Road exists just prior to the intersection with E. 93 rd Street, as shown in Figure 3. The existing deflection angle is approximately four degrees which exceeds the maximum angle allowed for a 30 MPH design speed. The deflection angle results in lane offsets greater than 12 feet across the intersection which reduces intersection sight distance of opposing left turn vehicles. FIGURE 3: INTERSECTION ALIGNMENT The Kinsman Road/E. 93rd Street intersection is controlled with a mast arm design traffic signal installation. Features of the signal operation are summarized below: The southbound approach provides a protected/permissive left turn phase (lead) for turning vehicles from a shared left-through lane. The northbound approach does not feature a protected phase (i.e. left turns are permissive only). The northbound left turn volume is twice that of the southbound left turn volume in the PM peak and seven times higher during the AM peak. The leading SB left turn phase may be in place to queues from extending through the Ramona Boulevard intersection. The E. 93 rd Street through phases end concurrently (i.e. the onset of the yellow change interval occurs at the same time). The onset of the red clearance interval at the Ramona Boulevard intersection begins 1.0 second earlier than at Kinsman Road intersection. The clearance interval times are 4.0 Yellow/2.0 All Red on E. 93 rd Street at Kinsman Road and 3.0 Yellow/2.0 All Red at Ramona Boulevard. The southbound approach features a 5-section and a 3-section signal head. All other approaches feature two 3-section signal heads. The traffic signals at Kinsman Road/E. 93 rd Street and E. 93 rd Street/Ramona Blvd. are coordinated for north/south progression. EXISTING CONDITIONS 5
8 CUY Safety Study A red light running (RLR) camera was installed on the westbound Kinsman Road approach in December Crosswalks, pedestrian signal heads and pushbuttons are provided for all four crossings. Pedestrian phases recalled. The existing pedestrian clearance times meet or exceed the calculated timings based on current industry standards and are in conformance with OMUTCD guidance. Some congestion issues and multi-cycle vehicle queues were noted at the Kinsman Road/E. 93 rd Street intersection. Individual movements experienced long queues including the westbound and northbound approaches during the AM peak and the eastbound approach during the PM peak. LAND USE AND PROPERTY ACCESS Land uses along Kinsman Road are a combination of neighborhood commercial business and single family residential. The four quadrants of the Kinsman Road/E. 93 rd Street intersection are comprised of the following land uses: NE quadrant: Cleveland 4 th District Police Station NW quadrant: Shell service station SE quadrant: vacant commercial building SW quadrant: vacant lot and Kinsman Square Party Center & Lounge as well as other vacant store fronts The functional area of an intersection is defined as the area beyond the physical intersection of two roadways as shown in Figure 4. The functional area for a leg of an intersection includes two components: one upstream of the physical area of the intersection and one downstream. The upstream (or intersection approach) includes additional length for decision-making, maneuvering, and required vehicle storage. The downstream area consists of a conflict overlap distance that allows a through vehicle to clear the intersection in addition to downstream conflict points FIGURE 4: INTERSECTION FUNCTIONAL AREA Downstream Upstream Access locations within the influence area of the Kinsman Road/E. 93 rd Street intersection and the E. 93 rd Street/Ramona Boulevard intersection are shown as red circles in Figure 2. Driver attention required to process potential conflicts with vehicles entering or leaving these access points is diverted from the navigation task at the signalized intersection. Access control is almost non-existent for the properties in EXISTING CONDITIONS 6

9 CUY Safety Study the northwest quadrant, resulting in a high number of access points within the functional area of the intersections. The Shell service station located on the northwest quadrant of the intersection is accessed from four locations, two on Kinsman Road and two on E. 93rd Street, all within 200 feet of the intersection. The access points nearest to the Kinsman Road/E. 93 rd Street intersection are located directly behind the curb return of the intersecting street, approximately 30 feet from the edge of the intersection roadway. The McDonald s located immediately west of the Shell site is accessed from three locations, two on Kinsman Road and one on E. 93rd Street. The access point on E. 93 rd street is within the functional area of the Ramona Boulevard intersection. DATA COLLECTION Manual turning movement counts were conducted at the Kinsman Road/E. 93rd Street intersection on November 21, 2013 from 7-11 AM and from 2-6 PM. Peak traffic volumes occur between 7:30 and 8:30 AM (morning peak hour) and between 4:30 and 5:30 PM (evening peak hour). Hourly volumes are summarized in Graph 1. Manual count data was submitted to NOACA with a request for design year growth rates. Growth rates supplied by NOACA indicate zero growth on the roadways in this area. Therefore, 2013 counted traffic is representative of the 2035 design year traffic used to prepare technical analyses as part of this study. Manual count data and a traffic projection worksheet are provided in Appendix C. Of additional note is a comparison of 2009 count data included in the 2009 safety study referenced in the Background section. Peak hour traffic volumes collected in 2013 are between 9 and 17 percent higher than the 2009 counts, as shown in Graph 1. GRAPH 1: TRAFFIC VOLUMES BY HOUR (WEEKDAY) EXISTING CONDITIONS 7
10 CUY Safety Study INTERSECTION CAPACITY Intersection capacity was evaluated to assess existing operating conditions and to identify critical deficiencies that may contribute to safety issues. Analyses were prepared using existing (2013) peak hour traffic volumes and existing signal timing and phasing. Existing levels of service and vehicle delay are summarized in Table 2. Analysis methodology and detailed output reports are included in Appendix G. Results indicate that under current conditions, there are capacity deficiencies at the Kinsman Road/E. 93 rd Street intersection during the AM peak hour, specifically for the NB approach. The volume to capacity ratio of the NB approach is 1.26 during the AM peak, which is 26% over capacity. TABLE 2: EXISTING INTERSECTION CAPACITY SUMMARY EB Approach WB APPROACH NB APPROACH SB APPROACH INTERSECTION Kinsman Road/E. 93rd Street 2013 AM D/41.5 D/45.5 F/154.5 C/20.2 E/ PM D/35.0 C/22.1 D/41.7 C/21.4 C/29.9 E. 93rd Street/Ramona Blvd 2013 AM C/33.1 D/40.0 A/4.1 A/3.8 A/ PM D/35.6 D/45.6 A/1.1 A/3.4 A/6.7 Note: Letter/Number - Level of Service/Average Delay per Vehicle EXISTING CONDITIONS 8
11 CUY Safety Study CRASH ANALYSIS CRASH DATA Crash data was furnished by the Ohio Department of Transportation for Kinsman Road/E. 93rd Street intersection, encompassing a three-year study period between 2010 and The crash data included crashes at the E. 93 rd Street/Ramona Boulevard intersection due to its close proximity to the study intersection. The OH-1 report for each documented crash was reviewed to confirm accuracy and to locate crashes properly within the study limits. Crash diagrams are provided in Appendix D. Noteworthy crash statistics for the three-year period are summarized below and shown graphically in Graphs 2 and 3. Statewide averages for crashes on state system, non-freeway locations are shown in parentheses based on data for years 2008 through Total crashes: 88 total crashes Injury: 35 crashes or 39.8 percent (25.4 percent) Rear end: 42 crashes or 47.7 percent (30.9 percent) Left Turn: 15 crashes or 17.0 percent (5.2 percent) Angle: 14 crashes or 15.9 percent (15.6 percent) Pedestrian: 6 crashes or 6.8 percent (0.8 percent) Rear end, left turn and angle crashes represent the top 3 crash types observed at the intersection, accounting for over 80 percent of the total crashes. GRAPH 2: FREQUENCY OF CRASHES BY CRASH TYPE CRASH ANALYSIS 9

12 CUY Safety Study GRAPH 3: FREQUENCY OF CRASHES BY TIME OF DAY HIGHWAY SAFETY MANUAL The predictive method described in Part C of the Highway Safety Manual provides steps to estimate the expected average crash frequency of a site for a given time period, geometric design, traffic control features, and traffic volumes. The expected average crash frequency (N expected ) is estimated using a predictive model estimate of crash frequency for a specific site type (N predicted ) together with observed crash frequency (where available). Predicted average crash frequency: This step involves determination of the predicted crash frequency which reflects how a site would be expected to perform relative to 1,000 similar sites. Calculation of predicted crash frequency utilizes Safety Performance Functions (SPF) for a base condition. Crash Modification Factors (CMF) are applied to account for specific site characteristics that differ from the base condition. A state-level calibration factor is then applied to normalize the base condition to localized conditions. The resulting value is the Predicted Crash Frequency (N predicted ) Expected average crash frequency: The next step involves calculation of the expected average crash frequency which reflects average performance of the site over an extended period of time based on actual crash history. This step incorporates the Empirical Bayes (EB) method which combines actual (observed) crash history of the study site with predicted average crash frequency. These values are weighted based on an over-dispersion parameter (k) that is the measure of the strength of the model (safety performance factors). The resulting value is the expected average crash frequency (N expected ) EXPECTED EXCESS CRASH RESULTS The difference between the predicted and expected average crash frequencies is termed the Expected Excess Crashes for the site, as shown in Figure 5. If the expected average crash frequency is greater than CRASH ANALYSIS 10

13 CUY Safety Study the predicted average crash frequency, then the site has potential for safety improvement. If expected frequency is less than predicted frequency, then the site is expected to experience fewer crashes per year on average than its peers. FIGURE 5: EXPECTED EXCESS CRASHES The HSM predictive method for urban/suburban arterials was applied to the Kinsman Road/E. 93 rd Street intersection to determine the potential for safety improvement. A single intersection element was included in the evaluation. Results presented in Table 3 conclude that the expected crash frequency is greater than the predicted crash frequency, suggesting that the site experiences on more crashes per year than its peers and that there is potential for safety improvements. A detailed explanation of HSM methodology as well as HSM output reports are provided in Appendix E. TABLE 3: HSM RESULTS FOR EXISTING CONDITIONS Intersection: Kinsman Road/ E. 93 rd street Predicted Average Crash Frequency 18.2 (Npredicted) Expected Average Crash Frequency Existing Conditions 21.2 (Nexpected,existing) Expected Excess Crashes 2.9 Potential for Safety Improvement? Yes CRASH ANALYSIS 11
14 CUY Safety Study OBSERVED CRASH HISTORY A review of observed and documented crash history in the Kinsman Road/E. 93 rd street intersection area suggests patterns that are consistent with urban/suburban intersections. The most prevalent crash types reported were rear end, angle, left turn, sideswipe passing, and pedestrian crashes accounting for 94 percent of the total crashes. The top five crash types were distributed within the intersection as summarized in Table 4. TABLE 4: CRASH SUMMARY CRASH EASTBOUND WESTBOUND NORTHBOUND SOUTHBOUND TOTAL CRASHES TYPE (INJURY CRASHES) Rear End 12 (Approach) 6 (approach) 4 (receiving) 10 (approach) 8 (approach) 2 (receiving) 42 (15) Left Turn 2 (intersection) 3 (intersection) 3 (intersection) 4 (driveway) 1 (driveway) 2 (intersection) 15 (9) Angle 2 (intersection) 1 (intersection) 3 (intersection) 4 (Intersection) 1 (driveway) 1 (driveway) 2 (driveway) 14 (5) Sideswipe Passing 4 (approach) 1 (approach) 1 (departure) 0 6 (0) Pedestrian 3 (south x-ing) 1 (north x-ing) 2 (east x-ing) 0 6 (4) Rear End Crashes A total of 42 rear end crashes were reported at the study intersection with 36 percent resulting in injury. A review of crashes by hour of day indicates that rear end crash patterns peak between 10AM and 12PM and between 4PM and 6PM. Fifty percent of the rear end crashes occurred during these four hours. Left turn crashes Fifteen left turn crashes were reported at the study intersection with 60 percent resulting in injury. Ten of the left turn crashes occurred within the intersection with the remaining five crashes occurring at adjacent driveways within the influence area of the intersection. All the driveway related left turn crashes occurred at driveways to the Shell site in the northwest quadrant (four on Kinsman Road and one on E. 93 rd street). Angle Crashes Fourteen angle crashes were reported at the study intersection. Ten of the angle crashes occurred within the intersection. Four occurred at adjacent driveways within the influence area of the intersection. The majority of right turn angle crashes were attributed to red light violations or vehicles clearing the intersection through the yellow change/all red clearance phases. Pedestrian Crashes Six pedestrian crashes were reported at the intersection: 3 on the south leg of E. 93 rd Street, 2 on the east leg of Kinsman, and 1 on the west leg of Kinsman. All crashes involved non-fatal injuries to the pedestrian involved. Pedestrian crashes are summarized below. West leg of Kinsman Road (southbound through phase): One pedestrian crash was reported on the west leg within the three year analysis period. This crash occurred on Tuesday, April 6, 2010 at 2 PM. The pedestrian began southbound across Kinsman Road. The driver of the involved vehicle attempted a southbound right turn and failed to see the pedestrian. Both parties indicate that the pedestrian WALK phase was active. No citation was issued. East leg of Kinsman Road (northbound through phase): Two pedestrian crashes were reported on the east leg within the three year analysis period. CRASH ANALYSIS 12
15 CUY Safety Study One crash occurred on Friday, August 6, 2010 at an unreported time. A pedestrian attempted to cross Kinsman Road to catch a public bus during the DO NOT WALK phase. The driver of the involved vehicle intended to travel westbound through the intersection on Kinsman when the pedestrian entered the road. No citation was issued. One crash occurred on Tuesday, September 12, 2010 at 2 PM. A pedestrian attempted to cross Kinsman Road heading northbound. The driver of the involved vehicle intended to travel westbound through the intersection on Kinsman Road when the pedestrian entered the road. Right-of-way was not indicated. No citation was issued. South leg of E. 93 rd Street (eastbound through phase): Three pedestrian crashes were reported on the south leg within the three year analysis period. One crash occurred on Tuesday, January 26, 2010 at 10 AM. The driver of the vehicle involved stopped for a red light travelling northbound on E. 93 rd Street. Upon stopping, the vehicle extended over the marked stop line and into the intersection. At that time, two pedestrians began to cross E. 93 rd (travelling westbound) outside of the marked crosswalk and behind the stopped vehicle. The driver backed his vehicle out of the intersection and struck the pedestrian crossing behind him. No citation was issued. One crash occurred on Thursday, August 25, 2011 at 5 PM. A pedestrian attempted to cross East 93 rd Street (travelling eastbound). The driver of the involved vehicle attempted an eastbound right turn from Kinsman Road to E. 93 rd when she saw the pedestrian in the crosswalk and failed to brake in time. No citation was issued. One crash occurred on Monday, November 19, 2012 at 12 PM. A pedestrian attempted to cross E. 93 rd Street (travelling eastbound) outside of the marked crosswalk and during a DO NOT WALK phase. The driver of the involved vehicle was travelling southbound through the intersection when the pedestrian entered the vehicles path. No citation was issued. CRASH ANALYSIS 13
16 CUY Safety Study COUNTERMEASURES The following section addresses contributing factors associated with the prevalent crashes patterns at the Kinsman Road/E. 93 rd Street intersection and possible countermeasures to mitigate those crashes. Additional countermeasures are recommended to minimize potential safety issues that may not be directly attributed to historical crash trends. Detailed technical analyses including intersection capacity reports, clearance interval calculations and turn lane sizing calculations are summarized in Appendix F, G and H. The following are key factors that contribute to the most prevalent crash patterns observed at the Kinsman Road/E. 93th Street intersection: Countermeasure recommendations are intended to address these factors. Substandard horizontal alignment on Kinsman Road: Intersection-related crashes occurring upstream or downstream of the physical intersection can be attributed to the substandard horizontal alignment on Kinsman Road which reduces intersection sight distance of opposing left turn vehicles. Absence of left turn lanes: There are no exclusive left turn lanes at the intersection. Exclusive turn lanes (right or left) allow separation of slower moving turning vehicles from the through traffic and provide a dedicated space for turning vehicle to wait before executing the desired movements. Turn lane reduce the need for a through vehicle to slow or stop to avoid a rear end crash with a turning vehicle and thereby can be used to mitigate rear end crashes. In cases where left turn demand is high, the inside shared left-through lane becomes a default left turn lane, forcing all through traffic to the curb lane. Concentration of through traffic to a single lane can negatively impact capacity of the intersection, result in increased delay and queue lengths which increase crash potential. The absence of left turn lanes on E. 93 rd Street influences vehicle stacking in the 100 feet that separates Kinsman Road and Ramona Boulevard. Southbound vehicle queues are currently managed by providing a leading protected SB phase that clears vehicles out of the short distance between intersections before the NB movements are permitted. This leading phase allocates green time to low volumes movements (i.e. the SB left turn) which increases delay and queues in more critical movements such as the NB right turn and WB left turn. Uncontrolled property access: A contributing factor of some left turn and angle crashes is the uncontrolled access points serving the properties in the northwest quadrant of the intersection. These access points are in close proximity to the physical intersection and left turn movements to and from the Shell and McDonald s sites conflict with traffic traversing the intersection. Deteriorating pavement markings: The absence of clear pavement markings make lane differentiation difficult for motorists. Worn pavement markings were noted throughout the study area. Low expectancy of the traffic signal: Rear end crashes are concentrated on the eastbound Kinsman Road approach 16 of the total 42 rear end crashes) with the majority of those crashes being intersection related as opposed to driveway related. The closest upstream signal on Kinsman Road is approximately 0.60 miles west of the E. 93 rd Street intersection. With travel speeds observed to be in excess of the 35 MPH posted speed limit, motorists approaching the E 93 rd Street intersection may not be expecting a traffic signal and are unprepared to stop on the approach. The minimum sight distance for signal visibility at 45 MPH is 460 feet which is satisfied on Kinsman Road. COUNTERMEASURES 14
17 CUY Safety Study ALL CRASHES 88 CRASHES The following countermeasures are recommended to mitigate all crashes at the Kinsman Road/E. 93 rd Street intersection. Upgrade clearance intervals: Modification of the yellow change and all red clearance times is recommended. Calculations have been prepared in accordance with the ODOT Traffic Engineering Manual and ITE recommended practices, as summarized in Appendix F. Standardize clearance intervals along E. 93 rd Street for both intersections. The recommended clearance intervals reflect not offset between intersections to discourage red light running in either direction. Upgrade pavement markings on Kinsman Road and E. 93 rd Street: Pavement marking upgrades are recommended to improve visibility and lane delineation at the intersection. Pavement markings changes will accompany changes in the horizontal alignment on Kinsman Road and lane use on E. 93 rd Street, as described below. Correct horizontal alignment on Kinsman Road: Horizontal alignment changes are recommended on Kinsman Road to eliminate the angle points. This can be achieved within the existing curb lines by eliminating the westbound right turn lane as shown in Figure 6. Demand for the westbound right turn is a low with 50 vehicles or less during the peak hours. Good levels of service area expected to be maintained. Increase capacity for northbound and southbound left turn movements on E. 93 rd Street: In the existing condition, the NB 93 rd Street approach is operating over capacity with a volume to capacity ratio of 1.26 during the AM peak hour. This is due in part to the leading phase currently provided for the SB approach, which has significantly less left turn volume than the NB left turn movement (AM: NBLT=208 vph, SBLT=28 vph, PM: NBLT=137 vph, SBLT=66 vph). The following options were evaluated to increase capacity for the NB left turn movement while managing queue spillback on E. 93 rd Street between Kinsman Road and Ramona Boulevard. Capacity analysis results for each option are summarized in Table 5. Short term Option 1 - Change N/S signal phasing: The first option to manage left turn movements and capacity deficiencies at the Kinsman Road/E. 93 rd Street intersection is to change the north/south signal phasing. This change would involve adding a leading protected/permissive left turn phase for the northbound approach and eliminating the protected/permissive phase on the southbound approach. Capacity results show that this option decreases the v/c ratio for the NB approach from 1.26 to 0.94, a 34 percent reduction. The advantages to this option are improved signal operation and ease of implementation. The disadvantage of this option is that it does not secure exclusive left turn lanes on E. 93 rd Street Short term Option 2 Add N/S left turn lanes with asymmetric lane section: The second option is exclusive left turn lanes on E. 93 rd Street within the existing curb lines with an asymmetric lane configuration described below and shown in Figure 6.» NB lane configuration: L-T-R this change reduces the NB approach to a single through lane which then requires only one NB receiving lane (between Kinsman and Ramona). The existing pavement width on the south leg is approximately 60 feet, which provides sufficient width for a NB right turn lane. A NB right turn lane provides additional capacity for the approach with the added benefit of providing space for bus stops without blocking through traffic. COUNTERMEASURES 15
18 CUY Safety Study» SB lane configuration: L-T-TR Converts the one of the NB through lanes at the Ramona Boulevard intersection to a SB left turn lane at Kinsman. This change results in only one NB lane (shared through-right turn lane) at the Ramona Boulevard intersection. The advantage to this option is that it provides exclusive left turn lanes on E. 93 rd Street without pavement widening. The disadvantage to this option is the reduction in NB travel lanes on E. 93 rd Street which results in a v/c ratio of 1.0 for the NB approach. Long term Option 1 Widen E. 93 rd Street to a five-lane section: A long term option is to widen E. 93 rd Street to a five-lane section with two through lanes in each direction and exclusive left turn lanes at the Kinsman Road intersection. This option provides the best overall levels of service but would involve pavement widening and property acquisition. Since both Short Term Option 1 and Option 2 provide the needed operational improvements with low cost and easily implemented countermeasures, the long term option of widening 93 rd Street is not the preferred safety countermeasure at this time. Long term Option 2 Widen Kinsman Road to a five-lane section: A second long term option is to widen Kinsman Drive to a five-lane section with two through lanes in each direction and exclusive left turn lanes at the E. 93 rd Street intersection. Since the left turn volumes on Kinsman Road are low relative to E. 93 rd Street, this countermeasure alone does not mitigate the identified NB capacity deficiencies, but it could provide some mitigation to rear end and angle crashes involving vehicles turning to and from the access driveway on the NW quadrant. Since this countermeasure alone does not mitigate NB capacity deficiencies and access management improvements recommended in this report have the potential to mitigate rear end and angle crashes, the long term option of widening Kinsman Road is not the preferred safety countermeasure at this time. COUNTERMEASURES 16
19 CUY Safety Study TABLE 5: CAPACITY ANALYSIS RESULTS FOR SHORT AND LONG TERM COUNTERMEASURES EB Approach WB APPROACH NB APPROACH SB APPROACH INTERSECTION Kinsman Road at E. 93rd Street 2013 AM D/41.5 D/45.5 F/154.5 C/20.2 E/ AM - Change N/S Phasing D/39.5 D/44.1 D/35.4 B/18.6 D/ AM - Add N/S Turn Lanes D/36.8 D/48.4 D/47.3 C/29.0 D/ AM - Widen N/S to 5 lanes C/22.6 C/27.6 C/22.6 D/35.1 C/ AM - Widen E/W to 5 lanes 1 C/27.2 D/42.2 F/84.4 B/17.9 D/ PM D/35.0 C/22.1 D/41.7 C/21.4 C/ PM - Change N/S Phasing D/36.6 C/20.3 C/21.3 C/23.8 C/ PM - Add N/S Turn Lanes C/32.1 B/19.7 C/22.3 C/34.6 C/ PM - Widen N/S to 5 lanes C/32.1 B/19.7 B/18.1 C/34.5 C/ PM - Widen E/W to 5 lanes 1 C/22.2 B/19.4 D/38.5 C/26.2 C/25.9 E. 93rd Street at Ramona Blvd AM C/33.1 D/40.0 A/4.1 A/3.8 A/ AM - Change N/S Phasing C/32.7 D/41.0 A/2.2 A/4.3 A/ AM - Add N/S Turn Lanes C/33.3 D/43.8 A/4.5 A/4.1 A/ AM - Widen N/S to 5 lanes C/32.7 D/41.0 A/1.6 A/4.3 A/ AM - Widen E/W to 5 lanes C/32.7 D/38.8 A/2.6 A/3.9 A/ PM D/35.6 D/45.6 A/1.1 A/3.4 A/ PM - Change N/S Phasing C/32.7 D/41.0 A/3.2 A/4.3 A/ PM - Add N/S Turn Lanes C/33.3 D/43.8 A/7.0 A/4.1 B/ PM - Widen N/S to 5 lanes C/32.7 D/41.0 A/3.7 A/4.3 A/ PM - Widen E/W to 5 lanes D/35.6 D/45.6 A/7.6 A/3.4 A/9.3 Note: Letter/Number - Level of Service/Average Delay per Vehicle 1 Analysis of this scenario assumes no changes to NB/SB movements on E. 93rd Street LEFT TURN AND ANGLE CRASHES 8 CRASHES The following access management improvements are recommended to mitigate driveway-related angle and left turn crashes on Kinsman Road and E. 93 rd Street. Install a bollard median design at the following locations to control left turn movements to and from the Shell access driveways nearest to the Kinsman Road/E. 93 rd Street intersection. A bollard style design similar to what is shown in Photo 1 is a low cost option for controlling turning movements at access points. A higher cost solution is a raised median (4ft width plus 1 ft minimum shoulder width) that could be considered as a long term countermeasure if a five-lane section is pursued on E. 93 rd Street. The north leg of E. 93 rd Street for a distance of approximately 85 feet to control left turn movements to and from the Shell access driveway nearest to Kinsman Road. The west leg of Kinsman Road for a distance of approximately 150 feet to control left turn movements to and from the Shell access driveways. COUNTERMEASURES 17

20 CUY Safety Study PHOTO1: BOLLARD MEDIAN TREATMENT REAR END CRASHES 42 CRASHES The following countermeasures are recommended for further mitigation of rear end crashes. Upgrade traffic signal installation at Kinsman Road and E. 93 rd Street: The following upgrades to the traffic signal are recommended to mitigate rear end crashes and improve overall safety in conjunction with the proposed capacity improvements discussed above. This recommendation includes the following components: Replace all signal heads and install new heads with reflective back plates Relocate stop lines on E. 93 rd Street at Ramona Boulevard: Relocation of the stop line on the E. 93 rd Street southbound approach to Ramona Boulevard is recommended. The existing stop line is positioned such that SB vehicles do not block the access driveway to McDonald s, effectively creating an unsignalized approach within a signalized intersection. Advancing the stop line gives priority to traffic on the public street rather than to traffic accessing an uncontrolled access driveway. Additionally, relocation of the stop bar will reduce all red clearance time for the through movements on E. 93 rd Street. Install Signal Ahead sign on Kinsman Road: Installation of a Signal Ahead (W3-3) warning sign is recommended on the eastbound Kinsman Road approach to E. 93 rd Street to improve driver expectancy. The OMUTCD states that advance traffic control signs may be used for additional emphasis of the primary traffic control device, even when the visibility distance to the device is satisfactory, as is the case on Kinsman Road. COUNTERMEASURES 18
21 McDonald's Kinsman Express Liquor Shell Line Ups Barber Salon Queen Esther Hall Ramona Blvd. Harris Avenue E 93th Street E 93th Street Carton Avenue Proposed R3-8b Proposed R3-7L E 94th Street Kinsman Road 4th District Police Station E 94th Street > CUY-422 Concept Plan FIGURE 6 Improving the Quality of Life TM
22 CUY Safety Study BENEFIT COST ANALYSIS Benefit cost analysis is a tool to determine the financial benefits of a project by comparing the net present value (NPV) of a project to NPV of the safety benefit provided by that project. Benefit cost values greater than one indicate a positive return on the original investment. Preferred countermeasures are those having the highest NPV of safety benefits. BENEFIT COST FOR SHORT TERM COUNTERMEASURES A benefit cost analysis was prepared using the ODOT ECAT analysis tool. Crash modification factors were applied for the following improvements. This does not account for all recommended improvements, rather only those countermeasures that have CMF values. Modify change plus clearance intervals: A CMF of 0.91 was applied to all crashes. This is a standard CMF offering in the ODOT ECAT tool. Install a left turn lane: A CMF of 0.79 was applied to all crashes. This CMF was obtained from the FHWA Crash Modification Factor Clearinghouse and has a 3 star rating. Provide raised median: A CMF value of was applied to driveway related crashes on the west leg of Kinsman and the north leg of E. 93 rd Street. This CMF was obtained from the FHWA Crash Modification Factor Clearinghouse and has a 3 star quality rating. Project costs were estimated for all short term countermeasures listed in the Countermeasures section including pavement mill and overlay for new pavement markings, traffic signal upgrade, signing upgrades, and bollard medians. Construction cost estimates assume the following: 35 percent design risk 17.5 percent inflation rate for an estimated 2017 construction year. No right of way impact anticipated for short term countermeasures Cost estimates and benefit cost analysis reports from the ECAT tool are included in Appendix I. Table 6 provides summarizes the benefit cost analysis results. TABLE 6: SHORT TERM BENEFIT COST ANALYSIS FOR BROADVIEW ROAD AND BROOKPARK ROAD Modify change plus clearance intervals Countermeasures with CMF Install left-turn lane values used in ECAT Tool Provide raised median Expected annual crash adjustment Net present value of project $367,000 Net present value of safety benefit Benefit / Cost Ratio 9.67 $3, BENEFIT COST ANALYSIS 20
23 APPENDIX A PROJECT DOCUMENTATION


24 DGL Consulting Engineers, LLC Experience that matters! Founded 1926 ODOT SAFETY STUDY CUY-US HCLIS #195 OHIO DEPARTMENT OF TRANSPORTATION DISTRICT TWELVE PREPARED BY: DGL CONSULTING ENGINEERS DATE: APRIL Briarfield Blvd Suite E Maumee, Ohio (419) Fax: (419)
25 ODOT Safety Study CUY TABLE OF CONTENTS PAGE EXECUTIVE SUMMARY PURPOSE AND NEED... 1 BACKGROUND ANALYSES CRASH DATA CAPACITY ANALYSIS POSSIBLE CAUSES SUMMARY OF RECOMMENDATIONS RECOMMENDED COUNTERMEASURES AND COST RATE OF RETURN ANALYSES FIGURES, TABLES AND APPENDICES PAGE TABLE 1 - US 422 & E. 93 RD STREET TRAFFIC DATA... 1 TABLE 2 - THREE YEAR CRASH DATA...3 TABLE 3 - INTERSECTION CRASH RATES... 3 TABLE 4 - US 422 & E. 93 RD STREET 2009 EXISTING TIMINGS CAPACITY ANALYSIS RESULTS.. 6 TABLE 5 - US 422 & E. 93 RD STREET 2009 REVISED TIMINGS CAPACITY ANALYSIS RESULTS... 6 TABLE 6 US 422 & E. 93 RD STREET 2030 CAPACITY ANALYSIS RESULTS... 6 TABLE 7 - US 422 & E. 93 RD STREET 2030 REVISED TIMINGS CAPACITY ANALYSIS RESULTS... 6 TABLE 8 - US 422 & RAMONA CAPACITY ANALYSIS RESULTS... 7 TABLE 9 - RATE OF RETURN ANALYSIS FIGURE 1 - EXISTING CONDITIONS DIAGRAM (1 OF 3) FIGURE 2 - EXISTING CONDITIONS DIAGRAM (2 OF 3) FIGURE 3 - EXISTING CONDITIONS DIAGRAM (3 OF 3) FIGURE 4 - COLLISION DIAGRAM FIGURE 5 - CONCEPUTAL PLAN LONG TERM APPENDIX A TRAFFIC DATA APPENDIX B PHOTO LOG APPENDIX C CRASH ANALYSIS MODULE (CAMTOOL) OUTPUT APPENDIX D COUNTERMEASURE ANALYSIS i
26 ODOT Safety Study CUY EXECUTIVE SUMMARY Purpose and Need US Route 422 at the intersection with East 93 rd Street in Cuyahoga County was selected for safety analysis due to a documented high crash frequency. Within the study area from 2005 to 2007, 46 crashes occurred at the US 422 and E. 93 rd Street intersection. Due to this documented high crash frequency, ODOT s Highway Safety Program ranked the intersection, mile post 4.34, number 195 on the 2007 list of High Crash locations. The purpose of this study is to identify potential countermeasures to reduce the number and severity of crashes on the corridor. Figure 1 shows an aerial view of the corridor. Background Within the study area US 422 (Kinsman Road) is a four lane urban minor arterial with a posted speed limit of 35 MPH. The study area includes the signalized intersection of US 422 and E. 93 rd Street. E. 93 rd Street is a four-lane urban minor arterial with a posted speed limit of 35 miles per hour. The 2007 annual average daily traffic (AADT) for US 422 at E. 93 rd Street is approximately 16,360 vehicles per day with 2.6 percent trucks based on historical data from ODOT s Travel Survey Report. Traffic counts taken in January 2009 result in the volumes shown in Table 1. Approach 2009 ADT K Value 2009 DHV 2030 ADT East Leg US , ,485 18,050 West Leg US , ,730 21,000 North Leg E 93rd St 12, ,300 15,780 South Leg E 93rd St 13, ,360 16,550 Table 1 US 422 & E. 93 rd Street Traffic Data A total of 29,310 vehicles per day enter the intersection based on 2009 counts. Based on ODOT historical data from 1980 through 2007, the growth rate from 2007 to 2030 is projected to be approximately 1.03 percent. A total of approximately 35,690 vehicles per day are projected to enter the intersection in the design year of US 422 (Kinsman) was reconstructed several years ago from the bridge west of the E. 93 rd intersection to the city limits on the east. Concrete pavement was installed as a part of the project. The concrete pavement extends on E. 93 rd approximately 70 feet north of the intersection and 55 feet south of the intersection. 1
27 ODOT Safety Study CUY A right turn lane is provided westbound on US 422, but all remaining approaches operate with right-through and left-through lanes. Street lighting is present at the intersection. The intersection of E. 93 rd and Ramona was reconfigured with the project. The E. 93 rd Street/Ramona Boulevard signalized intersection is located less than 150 feet north of the US 422 (Kinsman)/E. 93 rd intersection with Ramona running east from the intersection. Across from the Ramona approach is a driveway to the Shell station and a driveway to McDonalds offset 50 foot to the north. The southbound E. 93 rd Street stop bar is located north of the McDonalds drive, thus making the driveway part of the intersection. The signal at E. 93 rd Street and Ramona Boulevard does not provide signal control for these two drives. Figures 1-3 depict the Existing Conditions. All traffic data including traffic counts, K factors, and growth rates can be found in Appendix A. See Appendix B for a Photo Log of the intersection. 2
28 ODOT Safety Study CUY ANALYSES Crash Data From 2005 to 2007, 46 crashes occurred in the vicinity of the intersection of US 422 and E. 93 rd Street. Sixteen crashes (26.1%) occurred in 2005, 16 crashes (34.8%) occurred in 2006, and 18 crashes (39.1%) occurred in There were no fatal crashes in this area over the three year study period. No crash data was provided for the E. 93 rd and Ramona Boulevard intersection. Table 2 shows general crash information. Appendix C contains the complete Crash Analysis Module CAM Tool output. % CRASH TYPE % CONTRIBUTING FACTORS* 43.5 Rear End 20.8 Following to Close 17.4 Angle 14.6 Failure to Yield 15.2 Left Turn 14.6 Driver Inattention 15.2 Sideswipe - Passing 12.5 Ran Red Light 4.3 Pedestrian 12.5 Other Driver Error 2.2 Backing 8.3 Failure to Control 2.2 Fixed Object 4.2 Improper Turning 4.2 Improper Lane Change 4.2 View Obstructed % SEVERITY 2.1 Improper Backing 60.9 Property Damage Only 2.1 Improper Start from Parked Position 39.1 Injury % PAVEMENT CONDITIONS 76.1 Dry % SPEED 19.6 Wet and Under 4.4 Slush / Ice % TIME OF DAY and Over 69.6 Day 10.9 Unknown 26.1 Night Table 2 Three Year Crash Data The crash rate for the intersection was calculated and compared to other intersections around the state with the following results: Intersection Crash Rate I-J-K Statewide # of Crashes Entering Vehicles (ACC/MEV) Statistics 46 29, Table 3 Intersection Crash Rates Average crash rates are not computed for intersections due to the different types of intersections around the state. However, the I-J-K Statewide Statistics give a comparison of how an intersection crash rate compares in relation to similar intersections around the state. ODOT s I-J-K Statewide Statistics from was used for comparison purposes. The statewide crash rate for a four lane urban 3
29 ODOT Safety Study CUY signalized intersection is ACC/MEV (Crashes per Million Entering Vehicles). The US 422 and E. 93rd Street intersection crash rate is above the statewide statistical average. Observations from the crash data are as noted: Twenty crashes (43.5 percent) were of the rear end type on the approaches. Seven rear end crashes occurred on the westbound and northbound approaches each, with three on the southbound, two on the eastbound, and one eastbound past the intersection. A majority of rear end crashes were the result of vehicles crashing into vehicles stopping or already stopped at a red light. Only four crashes were directly attributable to vehicles turning left from a shared movement lane. Another trend was vehicles accelerating at a green light too quickly and rear ending the vehicle ahead. Eight crashes (17.4 percent) at the intersection were angle crashes. Seven of the angle crashes occurred in the intersection with one occurring at the driveway to KFC. Of the seven intersection angle crashes, six can be attributed to red-light running. Seven crashes (15.2 percent) were left turning crashes, with four eastbound when turning left, two westbound when turning left, and one southbound when turning left. Sideswipe-passing crashes also made up 15.2 percent of crashes, distributed evenly throughout the approaches. Collision Diagrams for the discussed US 422 corridor is depicted in Figure 4. Capacity Analysis The lane configurations for the intersections are shown in Figure 1-3 Existing Conditions Diagrams. Due to the number of rear end, angle, and left turning crashes at the intersections, the intersection capacity was analyzed using the methods and procedures presented in the 2000 Highway Capacity Manual (HCM). The results define the traffic flow conditions and are expressed in terms of level of service (LOS). Level of service is a quality measure describing conditions within a traffic stream, generally in terms of service measures such as speed, travel time, freedom to maneuver, traffic interruptions, comfort, and convenience (Highway Capacity Manual 2000). LOS designations range from A to F; LOS A describes near-ideal traffic operations, LOS F is characterized by heavy congestion and long delays. For signalized intersections, the performance measure is control delay for the entire intersection. Control delay includes the time consumed by initial deceleration, queue move up, stopped traffic, and final acceleration that would not occur in the absence of traffic control. The intersection was analyzed under 2009 existing conditions, as well as with revised timings and phasing. The US 422 and E. 93 rd Street intersection currently operates with a leading southbound phase and permitted left turns only for the remaining three 4
30 ODOT Safety Study CUY approaches. Existing signal timings and phasings for the intersection were provided by the City of Cleveland. Table 4 shows the results of the 2009 Capacity Analysis. Capacity analysis calculation output is included in Appendix D. Approach AM Peak LOS(Delay in sec/veh) PM Peak LOS(Delay in sec/veh) Eastbound C (22.6) C (31.7) Westbound C (24.9) C (20.9) Northbound C (31.9) C (24.0) Southbound B (14.6) B (16.4) Intersection C (24.8) C (24.3) Table 4 US 422 & E. 93rd Street 2009 Existing Timings Capacity Analysis Results Based on the results of the capacity analysis, the intersection performs adequately during the AM and PM peaks with the existing signal timing. Revisions in the timing of the existing phasing failed to significantly improve operations. However, because the southbound left turn volume is considerably less than the northbound left turn volume and slightly less than the westbound left turn volume as well, an alternate phasing allowing instead for a northbound leading phase was analyzed. Approach AM Peak LOS(Delay in sec/veh) PM Peak LOS(Delay in sec/veh) Eastbound B (16.0) C (26.4) Westbound C (21.0) B (15.8) Northbound B (17.1) B (14.1) Southbound C (21.0) C (29.9) Intersection B (18.5) C (22.4) Table Revised Phasing Capacity Analysis Results By switching the protected left turn phase to the higher volume northbound movement a delay improvement of 14.8 seconds per vehicle on the northbound approach, which experienced the most rear end accidents, is possible during the AM peak. During the PM peak however the northbound left turn volume is still slightly greater but the overall approach volume is lower than southbound, therefore due to the increase in through volume capacity with leading phase, little difference is observed in total intersection efficiency. 5
31 ODOT Safety Study CUY The intersection was then analyzed for the design year 2030 with existing timings and phasings. The results are shown in Table Capacity Analysis Results. Approach AM Peak LOS(Delay in sec/veh) PM Peak LOS(Delay in sec/veh) Eastbound C (27.5) F (80.6) Westbound C (29.6) C (23.9) Northbound E (57.8) C (27.4) Southbound B (16.5) B (19.0) Intersection D (35.3) D (44.4) Table 6 US 422 & E. 93rd Street 2030 Capacity Analysis Results Based on the results, the intersection fails with LOS E or F under the existing timing plan. Revisions to the timing and phasing were made and the results are shown in Table 7. Approach AM Peak LOS(Delay in sec/veh) Revised Revised Timing Phasing PM Peak LOS(Delay in sec/veh) Revised Revised Timing Phasing Eastbound C (34.3) C (21.2) D (35.7) D (40.3) Westbound D (36.1) C (24.3) B (17.5) C (21.9) Northbound D (39.5) C (21.9) D (36.5) C (25.4) Southbound B (14.8) C (25.6) C (22.7) D (41.0) Intersection C (33.1) C (23.2) C (29.0) C (34.3) Table 7 US 422 & E. 93rd Street 2030 Revised Timing Capacity Analysis Results With changes to timings, an acceptable LOS can be achieved. Even better LOS can be achieved by moving the protected left turn phase to the northbound movement, giving an improvement of 10 sec/veh during the AM peak. However, with growth in traffic the through volumes approach 450 vehicles per lane, the suggested maximum per the Location & Design Manual. Although the capacity analysis shows adequate LOS can be achieved, timing revisions are necessary. With volumes approaching lane capacity, optimal efficiency will become critical, therefore revisions in the timings should be able to be made for each cycle via actuation. It is unclear if the signal is currently capable of functioning as actuated; however in the design year the entire signal should operate as coordinated-actuated to optimize capacity. 6

 2030 LOS(Delay in sec/veh) AM Peak PM Peak AM Peak PM Peak Westbound C (31.2) C (31.7) C (32.1) C (32.9) Northbound A (6.3) A (5.9) A (6.8) A (6.2) Southbound A (5.")
32 ODOT Safety Study CUY Due to its proximity to the US 422 and E. 93 rd Street intersection, the E. 93 rd Street and Ramona intersection was also analyzed for capacity problems which may affect the US 422/E. 93 rd intersection. It was found that the signal operates very well with the existing timing on the E. 93 rd Street approaches and adequately on the low volume minor approach of Ramona Boulevard. Approach 2009 LOS(Delay in sec/veh) 2030 LOS(Delay in sec/veh) AM Peak PM Peak AM Peak PM Peak Westbound C (31.2) C (31.7) C (32.1) C (32.9) Northbound A (6.3) A (5.9) A (6.8) A (6.2) Southbound A (5.5) A (6.2) A (5.7) A (6.7) Intersection A (7.9) A (8.0) A (8.4) A (8.5) Table 8 E. 93rd Street & Ramona Capacity Analysis Results Possible Causes Probable causes for crashes along this corridor include: Signals With 19 rear end crashes and seven angle crashes at or approaching the intersection including six red light runs, overall signal visibility may be an issue. In addition, the signal at the Ramona intersection is easily visible from the E. 93 rd Street northbound approach to US 422. This approach experienced a high number of rear end accidents. While appearing to be coordinated, the signal indications have been observed to be at different phases simultaneously. The proximity of the two intersections permits drivers to see both sets of signal indications while traveling north and south. Visibility of Both Signals - Northbound 600 feet from intersection Simultaneous NB Red at US 422 Red and Green at Ramona Blvd 7
33 ODOT Safety Study CUY Left turns Only the southbound left turn movement has a protected phase, yet has the second lowest left turning volume. With 15.2 percent left turn crashes at the intersection, through volumes of up to 743 vehicles per hour, and shared lanes, it is likely that drivers are attempting to clear the intersection with inadequate gaps. The inability to make left turns also causes through vehicles to either shift to the right lane or stop, which can attribute to rear end crashes. By the design year 2030 the shared through lane volumes on US 422 will be above 450 vehicles per lane, the suggested maximum per Location & Design Manual. While capacity analysis predicts adequate LOS with permitted phasing and shared lanes, the 4-Lane Highway Left Turn Lane Warrant graph warrants left turn lanes for all directions. While intended for unsignalized intersections, such intersections operate the same as the permitted green phase of a signal, thus further displaying the need for turn lanes at the intersection. Signing and Striping Existing pavement markings appear to be worn or nonexistent. No lane use signing or lane use arrows are used at the intersection. Lane lines are not present on US 422. These deficiencies likely play a key factor in the number of sideswipe crashes. Lane Widths With the exception of the northbound approach and part of the southbound approach, the lanes on the approaches to the intersection are ten feet wide. Narrow lanes may directly contribute to the number of sideswiping crashes, as well as other crash types as narrow lane widths adversely affect capacity. 8
34 ODOT Safety Study CUY SUMMARY OF RECOMMENDATIONS Recommended Countermeasure and Cost From the analyses it was determined the best solutions for the US 422 corridor are to adjust signal visibility, optimize signal timing and phasing with actuation and coordination, construct left turn lanes, and widen to 12 foot lanes. See Appendix D for a complete breakdown of countermeasures. Short Term 1. Install optical signal lenses at the Ramona Boulevard intersection to reduce the signal s visibility from the northbound approach at the US 422/E. 93 rd intersection. 2. Ensure signals are coordinated such that the E. 93 rd Street green time at the US 422 intersection overlaps completely with green time at the Ramona Boulevard intersection. 3. Install backplates at the US 422/E. 93 rd Street intersection to improve visibility. 4. A five section head should be installed for the northbound movement at the US 422/E. 93 rd intersection to allow the protected lead phase to be shifted to the northbound movement during the AM peak. The signal should be retimed accordingly. 5. The intersection and approaches should be restriped with epoxy pavement markings. Lane lines should be added on US 422, as well as lane use signs and pavement marking arrows added on all multilane approaches at both intersections. The total cost of implementing the proposed short term countermeasures is approximately $30,985 with a total rate of return of %. Table 9 summarizes the proposed countermeasures, estimated costs, and rates of return for each short term countermeasure separately. Medium Term 1. If not currently equipped for actuation, a video detection system should be installed. Computerized coordination with the Ramona Street signal would then be necessary. The total cost of implementing the proposed medium term countermeasures is approximately $ with a total rate of return of %. Table 9 summarizes the proposed countermeasures, estimated costs, and rates of return for each medium term countermeasure separately. Long Term 1. US 422 should be widened to accommodate left turn lanes on each approach along with 12 foot lanes in all directions. All widening should be done to the south and east of the intersection due to the availability of land. The existing right turn lane on the east approach will be removed with the widening as traffic 9
35 ODOT Safety Study CUY volumes dictate that it is not needed. Turn lane calculations are based on 2030 Design Year volumes and can be found in Appendix D. The turn lanes lengths including tapers are as follows. West approach 150 foot left turn lane East approach 100 foot left turn lane North approach 75 foot left turn lane. 150 feet is required by calculation, however due to the proximity of the E. 93 rd /Ramona intersection, this is not possible. South approach 230 foot left turn lane 2. Install new mast arm signal installations at the US 422/E. 93 rd and E. 93 rd /Ramona intersections. 3. Retiming and re-phasing of the signals. With the addition of turn lanes, signal timing should accommodate left turn phases. The total cost of implementing the proposed long term countermeasures is approximately $1,468,119 with a total rate of return of 15.77%. Table 9 summarizes the proposed countermeasures, estimated costs, and rates of return for each medium term countermeasure separately. Long term improvements can be seen in Figure 5 Conceptual Plan Long Term. Rate of Return Analyses The implementation costs and rate of return analyses are summarized below and detailed in Appendix D. Typically, short term improvements seek to implement low cost solutions in a short time frame. Medium term solutions seek to implement improvements that are higher in cost and would occur over a several year time frame. Long term solutions are typically high cost and need many years for implementation. All cost estimate prices were determined from ODOT s 2008 Summary of Contracts Awarded or ODOT s Estimator program version 2.5a, with updated prices as of September 24, The cost estimates are included in Appendix D. 10

36 ODOT Safety Study CUY Table 9 Rate of Return Analyses 11
37 Counter: 01 & 02 Counted By: DGL Weather: Cold, Snow Date: 1/8/09 File Name : US 422 (Kinsman Rd) & E 93rd Street - Raw Site Code : Start Date : 1/8/2009 Page No : 1 Groups Printed- Cars - Trucks E 93rd Street Southbound US 422 (Kinsman Rd) Westbound E 93rd Street Northbound US 422 (Kinsman Rd) Eastbound Start Time Left Thru Right Peds App. Total Left Thru Right Peds App. Total Left Thru Right Peds App. Total Left Thru Right Peds App. Total Int. Total 07:00 AM :15 AM :30 AM :45 AM Total :00 AM :15 AM :30 AM :45 AM Total :00 AM :15 AM :30 AM :45 AM Total :00 AM :15 AM :30 AM :45 AM Total :00 PM :15 PM :30 PM :45 PM Total
38 Counter: 01 & 02 Counted By: DGL Weather: Cold, Snow Date: 1/8/09 File Name : US 422 (Kinsman Rd) & E 93rd Street - Raw Site Code : Start Date : 1/8/2009 Page No : 2 Groups Printed- Cars - Trucks E 93rd Street Southbound US 422 (Kinsman Rd) Westbound E 93rd Street Northbound US 422 (Kinsman Rd) Eastbound Start Time Left Thru Right Peds App. Total Left Thru Right Peds App. Total Left Thru Right Peds App. Total Left Thru Right Peds App. Total Int. Total 03:00 PM :15 PM :30 PM :45 PM Total :00 PM :15 PM :30 PM :45 PM Total :00 PM :15 PM :30 PM :45 PM Total Grand Total Apprch % Total % Cars % Cars Trucks % Trucks
39 Counter: 02 Counted By: DGL Weather: Cold, Snow Date: 1/7/09 File Name : 93rd Street & Ramona Blvd - Raw Site Code : Start Date : 1/7/2009 Page No : 1 Groups Printed- Cars - Trucks E 93rd Street Southbound Ramona Blvd. Westbound E 93rd Street Northbound Start Time Left Thru Peds App. Total Left Right Peds App. Total Thru Right Peds App. Total Int. Total 07:00 AM :15 AM :30 AM :45 AM Total :00 AM :15 AM :30 AM :45 AM Total :00 AM :15 AM :30 AM :45 AM Total :00 AM :15 AM :30 AM :45 AM Total
40 Counter: 02 Counted By: DGL Weather: Cold, Snow Date: 1/7/09 File Name : 93rd Street & Ramona Blvd - Raw Site Code : Start Date : 1/7/2009 Page No : 2 Groups Printed- Cars - Trucks E 93rd Street Southbound Ramona Blvd. Westbound E 93rd Street Northbound Start Time Left Thru Peds App. Total Left Right Peds App. Total Thru Right Peds App. Total Int. Total 12:00 PM :15 PM :30 PM :45 PM Total :00 PM :15 PM :30 PM :45 PM Total :00 PM :15 PM :30 PM :45 PM Total :00 PM :15 PM :30 PM :45 PM Total Grand Total Apprch % Total % Cars % Cars

41 Counter: 02 Counted By: DGL Weather: Cold, Snow Date: 1/7/09 File Name : 93rd Street & Ramona Blvd - Raw Site Code : Start Date : 1/7/2009 Page No : 3 Groups Printed- Cars - Trucks E 93rd Street Southbound Ramona Blvd. Westbound E 93rd Street Northbound Left Thru Peds App. Total Left Right Peds App. Total Thru Right Peds App. Total Int. Total Trucks % Trucks
42 Plan Countermeasure Description of Countermeasure Type of Crashes Estimated Cost Rate of Return Install optical signal lenses Install signal backplates Revise signal timing and phasing Intersection Countermeasures: US 422 & E. 93rd Street Replace signal lenses with optical signal lenses on the northbound E. 93rd Street approach to Ramona Boulevard to reduce visibility from the approach to US 422. Install backplates on all signal heads at the US 422 and E. 93rd Street intersection to increase signal All visbility. Signal timing and phasing should be revised to allow the protected lead phase to be shifted to the northbound movement. A five section head would need to be installed for the northbound All movement. Timing and phasing should be optimized for the peak periods. Clearance times including yellow and all red phase should be recalculated. All $20, % Short Term Coordinate signals Ensure the US 422 and Ramona Blvd signals are coordinated such that the E. 93rd Street green time at the US 422 intersection is simultaneous with green time at the Ramona Boulevard intersection. All Install epoxy pavement markings Install epoxy pavement markings at the intersection. Pavement markings includes lane lines, intersection channelization, centerlines, crosswalks, and stopbars. Lane lines should be added on US 422, as well as lane use pavement marking arrows added on all multilane approaches at both intersections. All $10, % Install lane use signs Add lane use signs to complement lane use pavement markings at all multilane approaches at both intersections. Sideswipe; Rear End Medium Term Install signal actuation If not currently equipped for actuation, a video vehicle detection system should be installed. Computerized coordination with the Ramona Street signal would then be necessary. All $42, % Long Term Add left turn lanes at all four approaches to the E. 93rd Street corridor: 150 foot eastbound, 100 foot Install left turn lanes All westbound, 150 foot southbound, and 230 foot northbound. Widen roadways Widen both US 422 and E. 93rd Street to allow 12 foot lanes. All $1,101, % Revise signal timing and phasing Retime, re-allocate phasing, and re-coordinate to accommodate left turn phases. All $366, %
43 Projects By Funding Source 2014 Five Year Capital Improvement Program 31 Department Project ! " #! $ % % & # ' ( ) $ % * )! " +, *! & - #. / $ - * # 0 $ & # $ & -! " # 1 5 $ & & 0 2 *! " & 2 * * # ), + $ 2 * * # &. $ 0 2 * * #, +. / $ 0 Funding Source: Potential General Obligation Bonds or Comparable Local Funding Sources Tuesday, February 04, CAPITAL IMPROVEMENT PROGRAM - CITY OF CLEVELAND

44

45 APPENDIX B EXISTING CONDITIONS DIAGRAM
46 STOPPING NO TO AIM INSPECTION CENTER 7AM 9:30AM LEFT TURN YIELD ONGREEN N Q:\ODOT_OP\ A.00 - VAR-STW-Safety Studies 2013\006 District 12\CUY 422\Drawings\Civil\EC001.dgn 2/14/2014 9:32:12 AM m stygles CALCULATED MLS CHECKED ELS HORIZONTAL SCALE IN FEET 40 E. 91 KINSMAN SPEED LIMIT 35 STOPPING NO BUS STOP 10' 10' 10.5' 11.5' TO 6:30PM 4PM NO STOPPING EMERGENCY SNO W STREET NO PARKING WHEN SNOW EXCEEDS 2 IN. NO STOPPING 7AM 9:30AM TO KINSMAN RD. DRIVEWAY BLOCK DONOT TO 6:30PM 4PM STOPPING NO BUS STOP NO STOPPING 12.5' 10' 10' 15' E. 93 St STOP BUS NO STOPPING TO CROSS STREET PUSHBUTTON WAIT FOR GREEN LIGHT GREEN LIGHT TO CROSS STREET WAIT FOR PUSH BUTTON PUSH BUTTON WAIT FOR STREET GREEN LIGHT TO CROSS KINSMAN MATCHLINE SEE SHEET 3 PARKING TIME ANY NO 12' 18' 16.5' 12.5' E. 93RD ST. 12' KINSMAN GREEN LIGHT WAIT FOR PUSH BUTTON 15.5' 13.5' 17.5' STREET TO CROSS TO CROSS STREET PUSHBUTTON WAIT FOR GREENLIGHT MATCHLINE SEE SHEET 4 RIGHT LANE MUST TURN RIGHT TO CROSS STREET PUSHBUTTON WAIT FOR GREENLIGHT NO 11' 11' 9.5'9.5' 14' STOPPING BUS STOP E. 93 St MATCH LINE SEE SHEET 2 EXISTING C O NDITIO NS DIA G RA M KINSM A N RD. / E. 93RD ST. C UY SA FETY STUD Y 1 4
47 TO 4PM TO 6:30PM TO 4PM NO OUTLET NO OUTLET NO PARKING ANY TIME 4PM 6:30PM 8 6:30PM TO NO STOPPING TO 7AM 7AM 9:30AM 9:30AM NO STOPPING NO STOPPING N CALCULATED MLS CHECKED ELS 0 20 Q:\ODOT_OP\ A.00 - VAR-STW-Safety Studies 2013\006 District 12\CUY 422\Drawings\Civil\EC002.dgn 2/14/2014 9:32:14 AM m stygles 10 HORIZONTAL SCALE IN FEET 40 MATCH LINE SEE SHEET 1 NO STOPPING STOP BUS SOUTH 24 EAST STOP BUS RIGHT LANE MUST TURN RIGHT NO STOPPING KINSMANRD. KINSMAN E. 94 STOP BUS STOPPING NO E. 94TH ST. SPEED LIMIT 35 11' 11' 10.5'10.5' STOP STOPPING NO NO STOPPING EXISTING C O NDITIO NS DIA G RA M KINSM A N RD. / E. 93RD ST. C UY SA FETY STUD Y 2 4
48 11' 11' 11' 11' TO CROSS STREET PUSH BUTTON WAIT FOR GREEN LIGHT INTERSECTION TO CROSS STREET PUSH BUTTON WAIT FOR GREEN LIGHT ANY PARKING NO TIME N NO ANY PARKING TIME Q:\ODOT_OP\ A.00 - VAR-STW-Safety Studies 2013\006 District 12\CUY 422\Drawings\Civil\EC003.dgn 2/14/2014 9:32:15 AM m stygles 4PM TO 6:30PM STOPPING NO ONE HOUR PARKING 7AM TO 6PM 4PM TO 6:30PM STOPPING NO ANY TIME STOPPING NO NO PARKING ON SIDEWALK OR TREELAWN ONE HOUR PARKING 7AM TO 6PM RAMONA HORIZONTAL SCALE IN FEET 40 15' 30' CALCULATED MLS CHECKED ELS RAMONA BLVD. E. 93RD ST. ANY TIME STOPPING NO BUS STOP NO STOPPING BLOCK DONOT TO CROSS STREET PUSH BUTTON WAIT FOR GREEN LIGHT BUS STOP NO STOPPING E. 93 ST RAMONA CENTER WAIT FOR GREEN LIGHT INSPECTION PUSH BUTTON AIM TO CROSS STREET BUS STOP NO STOPPING MATCH LINE SEE SHEET 1 EXISTING C O NDITIO NS DIA G RA M KINSM A N RD. / E. 93RD ST. C UY SA FETY STUD Y 3 4
49 NO STOP BUS SPEED LIMIT 35 HARRIS E. 93 NO NO STOP BUS STOP BUS N CALCULATED MLS CHECKED ELS HORIZONTAL SCALE IN FEET Q:\ODOT_OP\ A.00 - VAR-STW-Safety Studies 2013\006 District 12\CUY 422\Drawings\Civil\EC004.dgn 2/14/2014 9:32:16 AM m stygles 40 MATCH LINE SEE SHEET 1 TIME NO PARKING ANY STOPPING AIM INSPECTION CENTER STOPPING E. 93RD ST. 17' 11.5' 12' 16' HARRIS AVE. STOP STOPPING EXISTING C O NDITIO NS DIA G RA M KINSM A N RD. / E. 93RD ST. C UY SA FETY STUD Y 4 4
50 APPENDIX C TRAFFIC DATA
51 DESIGN YEAR TRAFFIC VOLUME CALCULATIONS CUY Kinsman Road (US-422) & East 93rd Street Street Name E. 93rd St. Southbound Kinsman Rd. (US-422) Westbound E. 93rd St. Northbound Kinsman Rd. (US-422) Eastbound Start Time Right Thru Left Peds Right Thru Left Peds Right Thru Left Peds Right Thru Left Peds 7:30 AM :45 AM :00 AM :15 AM AM Peak Counted Volumes AM Peak Adjusted Volumes Calculated PHF Calculated % Trucks NOACA Growth Rate 0.00% 0.00% 0.00% 0.00% 2035 AM Peak Design Hour Volumes :30 PM :45 PM :00 PM :15 PM PM Peak Counted Volumes PM Peak Adjusted Volumes Calculated PHF Calculated % Trucks NOACA Growth Rate 0.00% 0.00% 0.00% 0.00% 2035 PM Peak Design Hour Volumes Note: Volumes were adjusted to balance volumes due to a relatively high percentage of traffic using access points
52 DESIGN YEAR TRAFFIC VOLUME CALCULATIONS CUY Ramona Boulevard & East 93rd Street Street Name E. 93rd St. Southbound Ramona Blvd. Westbound E. 93rd St. Northbound Access Drive Eastbound Start Time Right Thru Left Peds Right Thru Left Peds Right Thru Left Peds Right Thru Left Peds 7:15 AM :30 AM :45 AM :00 AM AM Peak Counted Volumes AM Peak Adjusted Volumes Calculated PHF Calculated % Trucks NOACA Growth Rate 0.00% 0.00% 0.00% 0.00% 2035 AM Peak Design Hour Volumes :30 PM :45 PM :00 PM :15 PM PM Peak Counted Volumes PM Peak Adjusted Volumes Calculated PHF Calculated % Trucks NOACA Growth Rate 0.00% 0.00% 0.00% 0.00% 2035 PM Peak Design Hour Volumes Note: Volumes were adjusted to balance volumes due to a relatively high percentage of traffic using access points
53 LJB Inc Newmark Drive Miamisburg, OH CUY ODOT District 12 Safety Study Kinsman Road E. 93rd St. Total Volume File Name : 93-Kinsman Site Code : Start Date : 11/20/2013 Page No : 1 E. 93rd Street From North Groups Printed- Passenger - Trucks - Semis Kinsman Road (US-422) From East E. 93rd Street From South Kinsman Road (US-422) From West Start Time Right Thru Left Peds App. Total Right Thru Left Peds App. Total Right Thru Left Peds App. Total Right Thru Left Peds App. Total Int. Total 07:00 AM :15 AM :30 AM :45 AM Total :00 AM :15 AM :30 AM :45 AM Total :00 AM :15 AM :30 AM :45 AM Total :00 AM :15 AM :30 AM :45 AM Total *** BREAK *** 02:00 PM :15 PM :30 PM :45 PM Total :00 PM :15 PM :30 PM :45 PM Total :00 PM :15 PM
54 LJB Inc Newmark Drive Miamisburg, OH CUY ODOT District 12 Safety Study Kinsman Road E. 93rd St. Total Volume File Name : 93-Kinsman Site Code : Start Date : 11/20/2013 Page No : 2 E. 93rd Street From North Groups Printed- Passenger - Trucks - Semis Kinsman Road (US-422) From East E. 93rd Street From South Kinsman Road (US-422) From West Start Time Right Thru Left Peds App. Total Right Thru Left Peds App. Total Right Thru Left Peds App. Total Right Thru Left Peds App. Total Int. Total 04:30 PM :45 PM Total :00 PM :15 PM :30 PM :45 PM Total Grand Total Apprch % Total % Passenger % Passenger Trucks % Trucks Semis % Semis
55 LJB Inc Newmark Drive Miamisburg, OH CUY ODOT District 12 Safety Study Kinsman Road E. 93rd St. Total Truck Volume File Name : 93-Kinsman Site Code : Start Date : 11/20/2013 Page No : 1 E. 93rd Street From North Kinsman Road (US-422) From East Groups Printed- Trucks - Semis E. 93rd Street From South Kinsman Road (US-422) From West Start Time Right Thru Left Peds App. Total Right Thru Left Peds App. Total Right Thru Left Peds App. Total Right Thru Left Peds App. Total Int. Total 07:00 AM :15 AM :30 AM :45 AM Total :00 AM :15 AM :30 AM :45 AM Total :00 AM :15 AM :30 AM :45 AM Total :00 AM :15 AM :30 AM :45 AM Total *** BREAK *** 02:00 PM :15 PM :30 PM :45 PM Total :00 PM :15 PM :30 PM :45 PM Total :00 PM :15 PM
56 LJB Inc Newmark Drive Miamisburg, OH CUY ODOT District 12 Safety Study Kinsman Road E. 93rd St. Total Truck Volume File Name : 93-Kinsman Site Code : Start Date : 11/20/2013 Page No : 2 E. 93rd Street From North Kinsman Road (US-422) From East Groups Printed- Trucks - Semis E. 93rd Street From South Kinsman Road (US-422) From West Start Time Right Thru Left Peds App. Total Right Thru Left Peds App. Total Right Thru Left Peds App. Total Right Thru Left Peds App. Total Int. Total 04:30 PM :45 PM Total :00 PM *** BREAK *** Total Grand Total Apprch % Total % Trucks % Trucks Semis % Semis
57 LJB Inc Newmark Drive Miamisburg, OH CUY ODOT District 12 Safety Study E. 93rd Ramona Blvd. Total Volume File Name : 93-Ramona Site Code : Start Date : 11/20/2013 Page No : 1 E. 93rd Street From North Groups Printed- Passenger - Trucks - Semis Ramona Blvd From East E. 93rd Street From South Driveway (uncontrolled) From West Start Time Right Thru Left Peds App. Total Right Thru Left Peds App. Total Right Thru Left Peds App. Total Right Thru Left Peds App. Total Int. Total 07:00 AM :15 AM :30 AM :45 AM Total :00 AM :15 AM :30 AM :45 AM Total :00 AM :15 AM :30 AM :45 AM Total :00 AM :15 AM :30 AM :45 AM Total *** BREAK *** 01:00 PM :15 PM *** BREAK *** Total :00 PM :15 PM :30 PM :45 PM Total :00 PM :15 PM :30 PM
58 LJB Inc Newmark Drive Miamisburg, OH CUY ODOT District 12 Safety Study E. 93rd Ramona Blvd. Total Volume File Name : 93-Ramona Site Code : Start Date : 11/20/2013 Page No : 2 E. 93rd Street From North Groups Printed- Passenger - Trucks - Semis Ramona Blvd From East E. 93rd Street From South Driveway (uncontrolled) From West Start Time Right Thru Left Peds App. Total Right Thru Left Peds App. Total Right Thru Left Peds App. Total Right Thru Left Peds App. Total Int. Total 03:45 PM Total :00 PM :15 PM :30 PM :45 PM Total :00 PM :15 PM :30 PM :45 PM Total Grand Total Apprch % Total % Passenger % Passenger Trucks % Trucks Semis % Semis
59 LJB Inc Newmark Drive Miamisburg, OH CUY ODOT District 12 Safety Study E. 93rd Ramona Blvd. Total Truck Volume File Name : 93-Ramona Site Code : Start Date : 11/20/2013 Page No : 1 E. 93rd Street From North Ramona Blvd From East Groups Printed- Trucks - Semis E. 93rd Street From South Driveway (uncontrolled) From West Start Time Right Thru Left Peds App. Total Right Thru Left Peds App. Total Right Thru Left Peds App. Total Right Thru Left Peds App. Total Int. Total 07:00 AM :15 AM :30 AM :45 AM Total :00 AM :15 AM :30 AM :45 AM Total :00 AM :15 AM :30 AM :45 AM Total :00 AM :15 AM :30 AM :45 AM Total *** BREAK *** 01:00 PM :15 PM *** BREAK *** Total :00 PM :15 PM :30 PM :45 PM Total :00 PM :15 PM :30 PM
60 LJB Inc Newmark Drive Miamisburg, OH CUY ODOT District 12 Safety Study E. 93rd Ramona Blvd. Total Truck Volume File Name : 93-Ramona Site Code : Start Date : 11/20/2013 Page No : 2 E. 93rd Street From North Ramona Blvd From East Groups Printed- Trucks - Semis E. 93rd Street From South Driveway (uncontrolled) From West Start Time Right Thru Left Peds App. Total Right Thru Left Peds App. Total Right Thru Left Peds App. Total Right Thru Left Peds App. Total Int. Total 03:45 PM Total :00 PM :15 PM :30 PM :45 PM Total :00 PM :15 PM :30 PM :45 PM Total Grand Total Apprch % Total % Trucks % Trucks Semis % Semis
61 file:///c:/users/vmadineni.ljbinc/appdata/local/temp/notes256c9a/~web6864.htm Page 1 of 5 12/30/2013 RE: District 12 growth rate request Mahmoud Al-lozi to: SKnebel@LJBinc.com 12/27/ :29 AM Cc: "VMadineni@Ljbinc.com", "Brian.Blayney@dot.state.oh.us" Hide Details From: Mahmoud Al-lozi <MAl-lozi@mpo.noaca.org> To: "SKnebel@LJBinc.com" <SKnebel@LJBinc.com>, Cc: "VMadineni@Ljbinc.com" <VMadineni@Ljbinc.com>, "Brian.Blayney@dot.state.oh.us" <Brian.Blayney@dot.state.oh.us> Sorry I missed the name of SR 306, should be Broadmoor not Reynolds Road. Nothing changes just the name Here is the corrected table Safety Studies Forecasts Traffic adjustment factors 2012 to 2035 using NOACA regional model inputs Traffic adjustment factors from 2012 to SR-84 and Broadmoor Road 2035 Broadmoor Road from South 1.09 Broadmoor Road from North 1.11 SR 84 From East 1.09 SR 84 from West 1.05 E.93rd and Kinsman Road E.93rd from North 1.00 E.93rd from South 1.00 Kinsman Road from East 1.00 Kinsman Road from West 1.00 Brookpark Road and Broadview Broadview from North 1.00 Broadview (SR 176) from South 1.00 Brookpark Road from west 1.00 Brookpark Road from east 1.00 W.117th and Lorain Intersection Lorain from east 1.00 Lorain from west 1.00 W117th from north 1.00 W117th from south 1.00 W.150th and Lorain W150th from north 1.00 W150th from south 1.00 Lorain from east 1.00 Lorain from west 1.00
62 file:///c:/users/vmadineni.ljbinc/appdata/local/temp/notes256c9a/~web6864.htm Page 2 of 5 12/30/2013 From: Mahmoud Al-lozi Sent: Friday, December 27, :00 AM To: 'SKnebel@LJBinc.com' Cc: VMadineni@Ljbinc.com; Brian.Blayney@dot.state.oh.us Subject: RE: District 12 growth rate request Hello Scott Enclosed please find the growth rates based on the Regional Model inputs for the requested locations. Please note that the rates are for the 2012 to 2035 projects. The model is showing traffic decrease on all intersections except the SR 306 / SR 84 intersection in Lake County. In general when the forecast traffic is less than existing traffic you can do the analysis based on existing year 2012 traffic. If you need a copy of the raw model numbers please let me know. Let me know if you need additional information. Sorry for the delay and HAPPY HOLIDAYS. Mahmoud Al-Lozi Principal Planning Engineer NOACA 1299 Superior Ave Cleveland, Ohio ext 270 Direct Safety Studies Forecasts Traffic adjustment factors 2012 to 2035 using NOACA regional model inputs Traffic adjustment factors from 2012 to SR-84 and Reynolds Road 2035 Reynolds Road from South 1.09 Reynolds Road from North 1.11 SR 84 From East 1.09 SR 84 from West 1.05 E.93rd and Kinsman Road E.93rd from North 1.00 E.93rd from South 1.00 Kinsman Road from East 1.00 Kinsman Road from West 1.00 Brookpark Road and Broadview Broadview from North 1.00 Broadview (SR 176) from south 1.00 Brookpark Road from west 1.00 Brookpark Road from east 1.00 W.117th and Lorain Intersection Lorain from east 1.00 Lorain from west 1.00
63 file:///c:/users/vmadineni.ljbinc/appdata/local/temp/notes256c9a/~web6864.htm Page 3 of 5 12/30/2013 W117th from north 1.00 W117th from south 1.00 W.150th and Lorain W150th from north 1.00 W150th from south 1.00 Lorain from east 1.00 Lorain from west 1.00 From: SKnebel@LJBinc.com [mailto:sknebel@ljbinc.com] Sent: Sunday, November 24, :16 PM To: Mahmoud Al-lozi Cc: VMadineni@Ljbinc.com; Brian.Blayney@dot.state.oh.us Subject: District 12 growth rate request Mahmound LJB is working with District 12 on several safety study locations. Attached is current traffic data for these locations. 1. CUY (Lorain Road (SR 10) at W. 150 th Street) 2. CUY (Lorain Road (SR 10) at W. 117 th Street) 3. CUY (Brookpark Road (SR 17) at Broadview Road (SR 176)) 4. CUY (Kinsman Road (US 422) at E. 93rd Street) 5. LAK (Johnnycake Ridge Road (SR 84) at Broadmoor Road (SR 306)) Typically planning level growth rates are sufficient for use on a safety study. I am interested in a 20 year horizon. Please advise when you are able to generate these numbers? Thank you Scott Scott Knebel, P.E. Managing Principal (937) (937) cell **NEW NUMBER** SKnebel@LJBinc.com Improving the quality of life Please consider the environment before printing this . From: "Blayney, Brian" <Brian.Blayney@dot.state.oh.us> To: "sknebel@ljbinc.com" <sknebel@ljbinc.com> Date: 11/21/ :47 PM Subject: FW: Lorain Avenue Traffic Counts
64 APPENDIX D CRASH DIAGRAMS


65 E 08 / :00 WED 09/01/ :00 THU 06/03/ :00 SAT 08/28/2010 0:00 SUN 05/08/2011 0/ 16:00 THU 09/16/ :00 FRI 08/19/ :00 SUN 06/20/2010 /10/2012 /201 1 /2011 /20 WE T 11 WED 0 21:00 FRI 08/20/ :00 THU 01/28/2010 ICE 5/02/ :00 F R I 10 18:00 /19 8:00 TUE 10 TOTAL CRASHES 12 W ET 0:00 SUN 10/31/2010 8/ 20 19:00 0:00 F SUN 05/15 RI 08/0 /2011 6/201 0 WET DUS 13:00 K TUE 9:00 09/21 23:00 TUE / /1 MON 6/20 02/07 10 / :00 8:00 M WET TUE 1 ON 01 1 /2 /0 3/201 1/ : :00 TUE 03/23/2010 WET THU 07/01 15:00 /2010 SAT 3:00 MO 11/03 N 04/04/ / :00 FRI 0 9/17/ :00 MON 08/06/ /0 19:00 MON 09/12/2011 INJURY OR FATAL Ø :00 T HU 1 0/28/2 20: TUE 06/19 / :00 FR I 0 7/09/ :00 TUE 01/26/2010 WET Ø PROPERTY DAMAGE ONLY U 01 Ø 44 MOVING VEHICLE BACKING VEHICLE NON-INVOLVED VEH. PEDESTRIAN PARKED VEHICLE FIXED OBJECT FATAL CRASH INJURY CRASH /2010 NUMBER OF CRASHES TH 17 /2 23:00 SUN 02/27/2011 WET WED 10/19 / SAT 19:00 06/11 WET T HU / /12 :0 1 2:0 0 MO / SA N 03/2 T 04 9/201 /02/ /14/2 11 :0 0 SYMBOLS 11 / 5 5/1 09/10 SA T 7:00 WED 12/15/2010 WET N0 13:00 12:0 0 SAT 0 15:00 TUE 05/11/2010 WET SU 11:00 6: 0 2:00 FRI 01/01/2010 SNOW 1/11 /20 23:00 WED 09/14/2011 WET 01/2 oad 3:00 MON 05/30/2011 WE D an R 17:00 FRI 09/23/2011 UE 0 10 WET 11 S 09/12/20 NOW 1:00 SUN 22:00 M ON 2 7/20 06/11 9:00 0:00 10 /201 SUN THU 2 04/1 01/1 17:0 0/20 0 FR 9/20 9 :00 F 11 I 10/2 12 S RI 11 11:0 8/20 NOW /16/2 0 SA 11 D 012 T 02 USK /11/2 18: FR SNO I 09 17:0 W /16/ 0 WE 2011 D 08 /24/ :0 17:0 0 MO 0 MO N 08 N 07 /01/2 /04/ :0 0 MO N 08 /15/ :00 14:00 THU 09/13/2012 8:00 T 14:00 WED 02/16/2011 5:00 WED 09/07/2011 WET Kins m 10/1 8/ :0 KEY MAP THU 05/3 1/2 10 S N OW 12:00 TUE 06/28/2011 3:00 SAT 02/13/2010 SNOW 6:00 FRI 05/25/ :0 0 M ON 01/2 8/20 14:00 WED 08/10/ :0 0 THU 17:00 THU 08/25/2011 W ET 10 11: :00 TUE 04/06/20 N 06 /06/2 6:00 SU 19:00 THU 05 ET 11:00 MON 11/19/2012 6/ /2 2/20 10 W THU 0 Ø M ON 23:0 0 AT 0 5/29 /2 Ramona Blvd. E. 90th Street TU 4:00 S 12:0 0 0 :0 E. 93rd Street 12 Source: Esri, DigitalGlobe, GeoEye, i-cubed, USDA, USGS, AEX, Getmapping, Aerogrid, IGN, IGP, and the GIS User Community TYPES OF COLLISIONS SHOW FOR EACH CRASH COLLISION DIAGRAM REAR END RIGHT ANGLE SIDE SWIPE OUT OF CONTROL LEFT TURN HEAD ON 1. TIME, DAY, DATE 2. WEATHER AND ROAD SURFACE IF UNUSUAL CONDITION EXISTED 3. NITE - IF BETWEEN DUSK AND DAWN Kinsman Rd (US-422) INTERSECTION PERIOD CITY 3 YEAR FROM Cleveland, OH ( ODOT District 12) E. 93rd Street (CR-396) AT 2010 ROUTE NUMBER TO 2012 US-422 (LUC ) DATE: 12/19/13 PAGE: 01 of 02


66 SYMBOLS Ø Ø 4 INJURY OR FATAL 13 TOTAL CRASHES Ø PROPERTY DAMAGE ONLY MOVING VEHICLE BACKING VEHICLE NON-INVOLVED VEH. PEDESTRIAN PARKED VEHICLE FIXED OBJECT FATAL CRASH INJURY CRASH 0:00 SUN 10/31/2010 7:00 WED 12/15/2010 WET ET 23:00 WED 09/14/2011 WET W 14:00 THU 09/13/ :00 MON 05/30/ / 17:00 TUE 08/30/ :00 TUE 06/28/2011 3:00 SAT 02/13/2010 SNOW 6:00 FRI 05/25/ :00 MON 11/19 03 / 21:00 TUE 03/23/ :00 3:00 MO N 04/04 TH U UE 11 07/01 /01/2 8:00 M 011 /2010 / :0 0 10:00 ON 0 1/23/ W ET SAT 11/0 3/20 12 FR I 0 9/ 17 / 2010 Kins m an R oad 12:00 FRI 04/09/ :00 MON 08/06/ :00 SAT 02/27/2010 WET 21:00 FRI 07/16/ :00 SAT 09/01/ :00 MON 09/12/ :00 TUE 01/26/2010 WET 10:00 WED 12/12/ :00 SAT 07/16/2011 7:00 FRI 01/27/2012 SNOW E. 93rd Street NUMBER OF CRASHES 9 U 11:00 T KEY MAP TH 17:00 THU 0 00 E 10/19/ : Source: Esri, DigitalGlobe, GeoEye, i-cubed, USDA, USGS, TYPES OF COLLISIONS SHOW FOR EACH CRASH COLLISION DIAGRAM REAR END RIGHT ANGLE SIDE SWIPE OUT OF CONTROL LEFT TURN HEAD ON 1. TIME, DAY, DATE 2. WEATHER AND ROAD SURFACE IF UNUSUAL CONDITION EXISTED 3. NITE - IF BETWEEN DUSK AND DAWN Kinsman Rd (US-422) INTERSECTION PERIOD CITY 3 YEAR FROM Cleveland, OH ( ODOT District 12) E. 93rd Street (CR-396) AT 2010 ROUTE NUMBER TO 2012 US-422 (LUC ) DATE: 12/19/13 PAGE: 02 of 02 Ø
67 APPENDIX E HSM OUTPUT
68 HIGHWAY SAFETY MANUAL METHODOLOGY The Highway Safety Manual (HSM) provides tools to conduct quantitative safety analyses with the primary goal of predicting crash frequency and severity as a function of alternative roadway and intersection designs. Prior to publication of the HSM in 2010, there was no industry-accepted resource available to quantify future safety performance of a transportation facility. The HSM fills this need by providing a science-based technical approach to safety analysis to predict expected average crash frequency the long-term average crash frequency of a site. A primary reason for incorporating techniques of the Highway Safety Manual into the crash analysis process is to overcome the short-term year-to-year variability in observed crash frequencies and the effects of regression to the mean bias. Regression-to-the-mean (RTM) is the natural variation in crash data. Crash occurrences at a given site are random events that tend to fluctuate up and down over the course of time. Year-to-year variability in crash frequencies as shown in Figure D1 adversely affects crash estimation based on crash data collected over short periods (i.e. 3 years as is customary). The randomness of crash occurrences indicates that short-term crash frequencies alone are not a reliable estimator of long-term crash frequency. Crash fluctuations over time make it difficult to determine whether changes in the observed crash frequency are due to changes in site conditions or are due to natural fluctuations. When a period of high crash frequency is observed, it is statistically probable that the following period will have a comparatively low crash frequency. Similarly, there is a high probability that a low crash frequency period will be followed by a high crash frequency period. This tendency is known as regression-to-the-mean (RTM). Failure to account for the effects of RTM introduces the potential for RTM bias or selection bias. This occurs when sites are selected for treatment based on short-term trends in observed crash frequency. RTM bias can also result in over or under estimation of effectiveness of a treatment (change in average crash frequency) without accounting for RTM bias, it is not possible to know if an observed reduction in crashes is due to the treatment or if it would have occurred without the modification. Figure D1: Variation in short-term observed crash frequency Years Figure D2 shows the effect of RTM and RTM bias. In this example, a site is selected for treatment based on its short term crash frequency trend over three years (during upward trend). Due to RTM, it is probable that the observed crash frequency will decrease toward the expected average crash frequency without any APPENDIX D - HIGHWAY SAFETY MANUAL 1
, rendering the perceived effectiveness of the treatment to be greater than its actual effectiveness.")
69 treatment. A treatment is applied which results in a reduction of crashes and become the perceived effectiveness of treatment. However, some of this reduction would have occurred regardless of the treatment (due to RTM), rendering the perceived effectiveness of the treatment to be greater than its actual effectiveness. Figure D2: Regression to the mean The predictive method described in Part C of the Highway Safety Manual provides steps to estimate the expected average crash frequency of a site for a given time period, geometric design, traffic control features, and traffic volumes. The expected average crash frequency (N expected ) is estimated using a predictive model estimate of crash frequency for a specific site type (N predicted ) together with observed crash frequency (where available), as described in the following sections. The predictive method is applicable for the following facility types: Rural Two-Lane Two-Way Roads, Rural Multilane Highways, and Urban/Suburban Arterials. PREDICTED CRASH FREQUENCY Predicted model estimate of crash frequency (Equation 1): This step involves determination of the predicted crash frequency which reflects how a site would be expected to perform relative to 1,000 similar sites. Calculation of predicted crash frequency utilizes Safety Performance Functions (SPF) for a base condition. Crash Modification Factors (CMF) are then applied to account for specific site characteristics that differ from the base condition. A state-level calibration factor is then applied to normalize the base condition to localized conditions. The resulting value is the Predicted Crash Frequency (N predicted ) =SPF x CMF 1 x CMF 2 x x C Equation 1 EXPECTED CRASH FREQUENCY Expected average crash frequency (Equations 2 and 3): The next step involves calculation of the expected average crash frequency which reflects average performance of the site over an extended period of time based on actual crash history. This step incorporates the Empirical Bayes (EB) method which combines actual (observed) crash history of the study site with predicted average crash frequency. These values are weighted based on an over-dispersion parameter (k) that is the measure of the strength of the model (safety performance factors). The resulting value is the expected average crash frequency (N expected ) = x x Equation 2 Where Weighted Adjustment (w): =1/[1+ x ] Equation 3 Where k = over dispersion parameter from the associated SPF. APPENDIX D - HIGHWAY SAFETY MANUAL 2
70 Existing Conditions: General Information and Data for Urban And Suburban Arterial Intersection General Information Location Information Analyst VM Route US422 Agency or Company LJB Inc Logpoint 4.34 Date Performed 02/14/14 Common Name Kinsman Road/E. 93rd street Intersection US422; 4.34 Analysis Year 2012 Signalized/Unsignalized Signalized Input Data Existing Conditions HSM Base Conditions Intersection type (3ST, 3SG, 4ST, 4SG) 4SG -- AADT major (veh/day) (total entering on major approaches)* AADT MAX = 67,700 (veh/day) 14, AADT minor (veh/day) (total entering on minor approaches)* AADT MAX = 33,400 (veh/day) 16, Intersection lighting (present/not present) Present Not Present Calibration factor, C i Data for unsignalized intersections only: Number of major-road approaches with left-turn lanes 0 Number of major-road approaches with right-turn lanes 0 Data for signalized intersections only: Number of approaches with left-turn lanes 0 0 Number of approaches with right-turn lanes 1 0 Number of approaches with left-turn signal phasing 1 -- Type of left-turn signal phasing for Leg #1 Protected/Permissive Permissive Type of left-turn signal phasing for Leg #2 Permissive -- Type of left-turn signal phasing for Leg #3 Permissive -- Type of left-turn signal phasing for Leg #4 Permissive -- Number of approaches with right-turn-on-red prohibited 0 0 Intersection red light cameras (present/not present) Not Present Not Present Sum of all pedestrian crossing volumes (PedVol) Maximum number of lanes crossed by a pedestrian (n lanesx ) 5 -- Number of bus stops within 300 m (1,000 ft) of the intersection 3 or more 0 Schools within 300 m (1,000 ft) of the intersection (present/not present) Not Present Not Present Number of alcohol sales establishments within 300 m (1,000 ft) of the intersection 1 to 8 0 Locality: State System NOTES: * AADT: It is important to remember that the AADT(major) = AADT(major approach1) + AADT(minor approach2) (refer to p.12-8 in Part C of the HSM) 1
71 Proposed Conditions: Data for Urban And Suburban Arterial Intersection Input Data Proposed Conditions Existing Conditions Intersection type (3ST, 3SG, 4ST, 4SG) 4SG 4SG AADT major (veh/day) (total entering on major approaches)* AADT MAX = 67,700 (veh/day) 14, AADT minor (veh/day) (total entering on minor approaches)* AADT MAX = 33,400 (veh/day) 16, Intersection lighting (present/not present) Present Present Calibration factor, C i Data for unsignalized intersections only: 0 Number of major-road approaches with left-turn lanes 0 0 Number of major-road approaches with right-turn lanes 0 0 Data for signalized intersections only: 0 Number of approaches with left-turn lanes 0 0 Number of approaches with right-turn lanes 1 1 Number of approaches with left-turn signal phasing 1 1 Type of left-turn signal phasing for Leg #1 Protected/Permissive Protected/Permissive Type of left-turn signal phasing for Leg #2 Permissive Permissive Type of left-turn signal phasing for Leg #3 Permissive Permissive Type of left-turn signal phasing for Leg #4 Permissive Permissive Number of approaches with right-turn-on-red prohibited 0 0 Intersection red light cameras (present/not present) Not Present Not Present Sum of all pedestrian crossing volumes (PedVol) Maximum number of lanes crossed by a pedestrian (n lanesx ) 5 5 Number of bus stops within 300 m (1,000 ft) of the intersection 3 or more 3 or more Schools within 300 m (1,000 ft) of the intersection (present/not present) Not Present Not Present Number of alcohol sales establishments within 300 m (1,000 ft) of the intersection 1 to 8 1 to 8 Locality: State System State System NOTES: * AADT: It is important to remember that the AADT(major) = AADT(major approach1) + AADT(minor approach2) (refer to p.12-8 in Part C of the HSM) 2


72 Project Safety Performance Report General Information Project Name Project Description CUY Safety Study Kinsman Rd/E.93rd Street safety study Contact Contact Phone Reference Number Analyst Agency/Company Task 6 VM LJB Inc Date Performed Analysis Year 2/14/ Summary of Anticipated Safety Performance of the Project (average crashes/year) Existing Conditions Predicted Average Crash Frequency Existing Conditions Expected Average Crash Frequency KA B -0.2 C O Total Existing Condtions Potential for Safety Improvement Proposed Conditions Expected Average Crash Frequency N predicted - Existing Conditions N expected - Existing Conditions N potential for improvement - Existing Conditions N expected - Proposed Conditions Project Summary Results (Without Animal Crashes) KA B C O Total Created by the Office of Systems Planning and Program Management
73 APPENDIX F CLEARANCE INTERVAL CALCULATIONS
74 CLEARANCE INTERVALS The National Cooperative Highway Research Program (NCHRP) Report 731: Guidelines for Timing Yellow and All-Red Intervals at Signalized Intersections was published July A number of conclusions were reached as a result of the comprehensive study that is important to the safety performance of signalized intersections. > The Institute of Transportation Engineers (ITE) Proposed Recommended Practice for the calculation of yellow change intervals and all-red clearance intervals is the methodology used by the highest percentage of state and local agencies. > Drivers were documented to decelerate when turning at an intersection. The NCHRP Report 731 recommended using a design speed of 20 mile per hour for the calculation of all red timing. Research conducted by the North Carolina Department of Transportation published by the ITE Journal determined that the average operating speed for left turning traffic is 17 miles per hour. > Using the current ITE guidelines to calculate the duration of yellow change and red clearance intervals has been shown to reduce total crashes between 8 and 14 percent while reducing injury crashes by approximately 12 percent. > Using the current ITE guidelines to calculate the duration of yellow change and red clearance intervals has been shown to reduce red light running occurrences between 36 and 50 percent. Vehicular clearance times were calculated for each study area intersection based on guidelines published in the Ohio Manual of Uniform Traffic Control Devices and the ITE Proposed Recommended Practice. The following posted speeds were used to calculate clearance intervals for through phases: Kinsman Road/E. 93 rd Street: 35 MPH Ramona Blvd 25 MPH A 25 MPH speed was used to calculate clearance intervals for all leading left turn phases. Calculated clearance intervals were included in the Synchro models for the proposed conditions, as described in the following section. A summary of the calculated clearance intervals for the two signalized intersections is listed below in Table F1 and the calculations are appended at the end of this section. CLEARANCE INTERVALS 1
75 TABLE F1: PROPOSED CLEARANCE INTERVALS Existing PHASE Kinsman Road at E. 93 rd Street Phase 2: EB Through Proposed Yellow/ TOTAL Yellow/ TOTAL All Red 4.1 sec./ 2.0 sec 6.1 SEC. Phase 3: NB Left - - Phase 4: SB Through Phase 6: WB Through Phase 7: SB Left Phase 8: NB Through E. 93 rd Street at Ramona Blvd. Phase 2: East/West Phase 4: North/South 4.0 sec./ 2.0 sec 4.1 sec./ 2.0 sec 3.0 sec./ 1.0 sec 4.0 sec./ 2.0 sec 3.0 sec./ 2.0 sec 3.0 sec./ 2.0 sec 6.0 SEC. 6.1 SEC. All Red 3.9 sec./ 2.0 sec 3.0 sec./ 3.0 sec 3.9 sec./ 1.8 sec 3.9 sec./ 2.0 sec 5.9 SEC. 6.0 SEC. 5.7 SEC. 5.9 SEC. 4.0 SEC SEC. 5.0 SEC. 5.0 SEC. 3.9 sec./ 1.8 sec 3.0 sec./ 2.6 sec 3.9 sec./ 1.5 sec 5.7 SEC. 5.6 SEC. 5.4 SEC. Note: The maximum all-red clearance time set at 3 seconds. Calculated values may be longer than 3 seconds. CLEARANCE INTERVALS 2
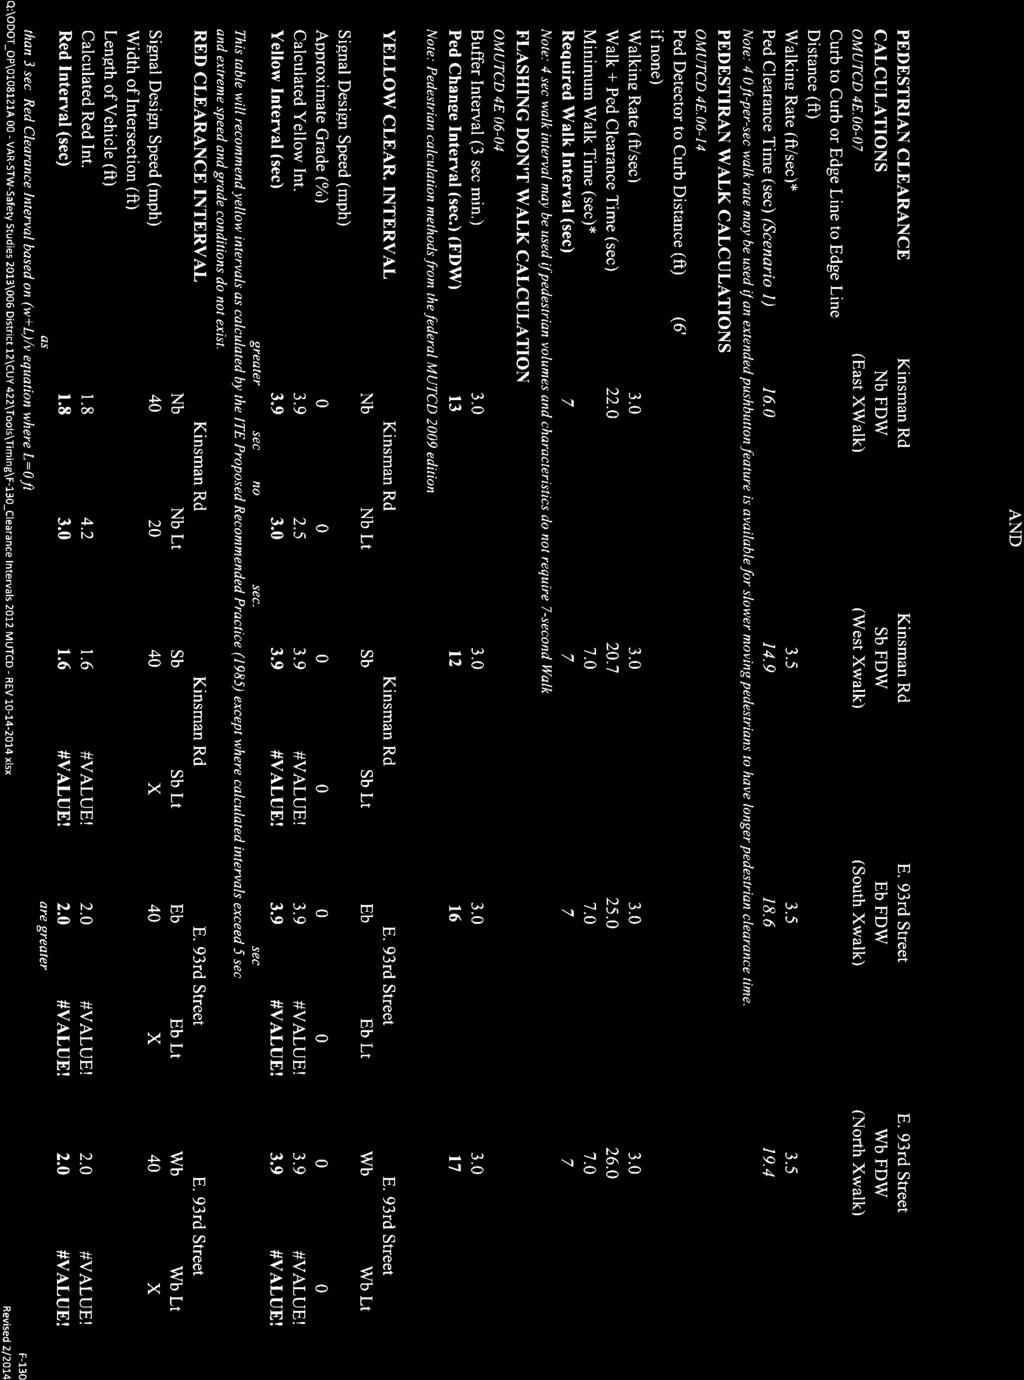
76

77
78 APPENDIX G CAPACITY ANALYSIS REPORTS
79 CAPACITY ANALYSIS Capacity analysis was conducted for existing and various Build conditions at the Kinsman Road/E. 93 rd Street and E. 93 rd Street/Ramona Boulevard intersection. Signalized intersection analysis was performed with the assistance of Synchro traffic simulation software (version 8) with output reflective of HCS 2000 algorithms. HCS2010 algorithms were not used as they do not accurately reflect shared lane conditions, as is the case on Kinsman Road. The following analysis scenarios were evaluated. Traffic volumes for all scenarios reflect 2013 counts since the NOACA supplied growth rate was zero for these intersections. Capacity analysis results are summarized in Table G2 with Synchro output reports appended to this section. > Existing Conditions AM and PM peak hours Existing lane use Existing signal timing and signal phasing (SB leading protected phase) > Build Short Term Option 1: Change N/S signal phasing Existing lane use Optimized splits and calculated vehicle clearance times Add protected NB phase, remove protected SB phase > Build Short Term Option 2: Add N/S left turn lanes with asymmetric lane configuration Modified lane use on E. 93 rd Street at Kinsman Road: NB (L-TR), SB (L-T-TR) Modified lane use on E. 93 rd Street at Ramona Blvd: NB (LTR) Optimized splits and calculated vehicle clearance times NB left turns are protected/permissive, SB left turns are permissive only > Build Long Term Option 1: Add N/S left turn lanes by widening on E. 93 rd Street to a fivelane section Modified lane use on E. 93 rd Street at Kinsman Road: NB (L-T-TR), SB (L-T-TR) Modified lane use on E. 93 rd Street at Ramona Blvd: NB (LT-TR) Optimized splits and calculated vehicle clearance times NB left turns are protected/permissive, SB left turns are permissive only > Build Long Term Option 2: Add N/S left turn lanes on Kinsman Road by widening to a fivelane section Modified lane use on Kinsman Road at E. 93 rd Street: EB (L-T-TR), WB (L-T-TR) Existing conditions retained on E. 93 rd Street Optimized splits and calculated vehicle clearance times EB and WB left turn permissive only Intersections are graded using a level of service (LOS) designation expressed in terms of letter grades. Level of service is a quality measure describing operational conditions with a traffic stream with LOS A representing the highest quality traffic flow and minimal delay, and LOS F representing poor traffic CAPACITY ANALYSIS 1
80 operations, significant delay, and substantial queuing. Level of service is defined in terms of vehicle delay, as published in the Highway Capacity Manual (Transportation Research Board, 2010). Levels of service thresholds for signalized intersections have been summarized in Table E1. TABLE G1 LEVELS OF SERVICE THRESHOLDS FOR SIGNALIZED INTERSECTIONS Level of Service Control Delay (sec/veh) A 10 B > 10 and 20 C > 20 and 35 D > 35 and 55 E > 55 and 80 F > 80 TABLE G2: CAPACITY ANALYSIS RESULTS EB Approach WB APPROACH NB APPROACH SB APPROACH INTERSECTION Kinsman Road at E. 93rd Street 2013 AM D/41.5 D/45.5 F/154.5 C/20.2 E/ AM - Change N/S Phasing D/39.5 D/44.1 D/35.4 B/18.6 D/ AM - Add N/S Turn Lanes D/36.8 D/48.4 D/47.3 C/29.0 D/ AM - Widen N/S to 5 lanes C/22.6 C/27.6 C/22.6 D/35.1 C/ AM - Widen E/W to 5 lanes 1 C/27.2 D/42.2 F/84.4 B/17.9 D/ PM D/35.0 C/22.1 D/41.7 C/21.4 C/ PM - Change N/S Phasing D/36.6 C/20.3 C/21.3 C/23.8 C/ PM - Add N/S Turn Lanes C/32.1 B/19.7 C/22.3 C/34.6 C/ PM - Widen N/S to 5 lanes C/32.1 B/19.7 B/18.1 C/34.5 C/ PM - Widen E/W to 5 lanes 1 C/22.2 B/19.4 D/38.5 C/26.2 C/25.9 E. 93rd Street at Ramona Blvd AM C/33.1 D/40.0 A/4.1 A/3.8 A/ AM - Change N/S Phasing C/32.7 D/41.0 A/2.2 A/4.3 A/ AM - Add N/S Turn Lanes C/33.3 D/43.8 A/4.5 A/4.1 A/ AM - Widen N/S to 5 lanes C/32.7 D/41.0 A/1.6 A/4.3 A/ AM - Widen E/W to 5 lanes C/32.7 D/38.8 A/2.6 A/3.9 A/ PM D/35.6 D/45.6 A/1.1 A/3.4 A/ PM - Change N/S Phasing C/32.7 D/41.0 A/3.2 A/4.3 A/ PM - Add N/S Turn Lanes C/33.3 D/43.8 A/7.0 A/4.1 B/ PM - Widen N/S to 5 lanes C/32.7 D/41.0 A/3.7 A/4.3 A/ PM - Widen E/W to 5 lanes D/35.6 D/45.6 A/7.6 A/3.4 A/9.3 Note: Letter/Number - Level of Service/Average Delay per Vehicle 1 Analysis of this scenario assumes no changes to NB/SB movements on E. 93rd Street CAPACITY ANALYSIS 2
81
82
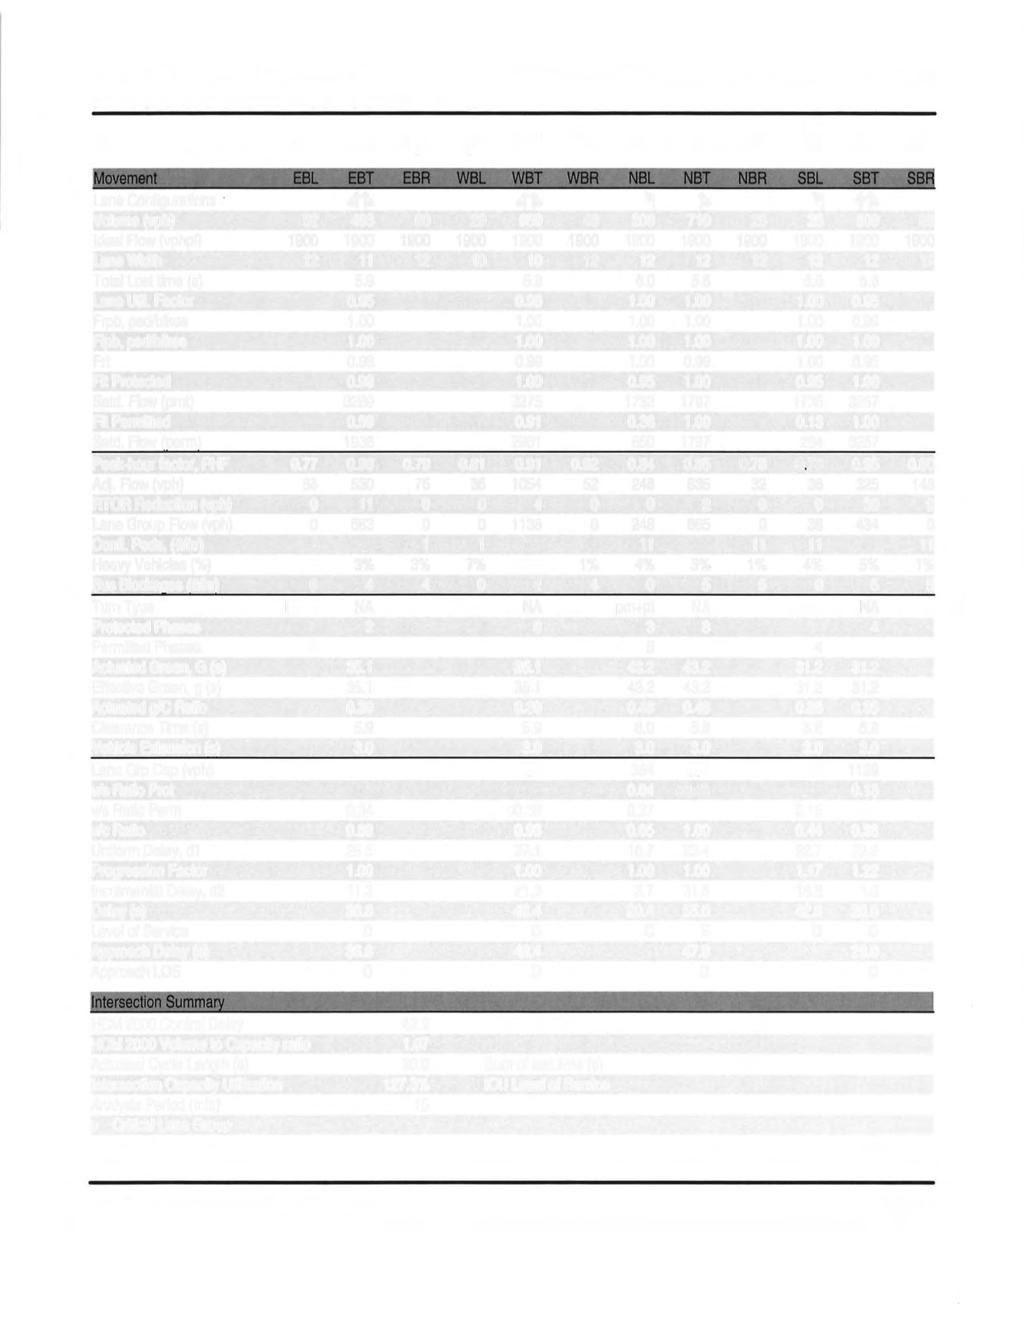
83
84
85
86
87
88
89
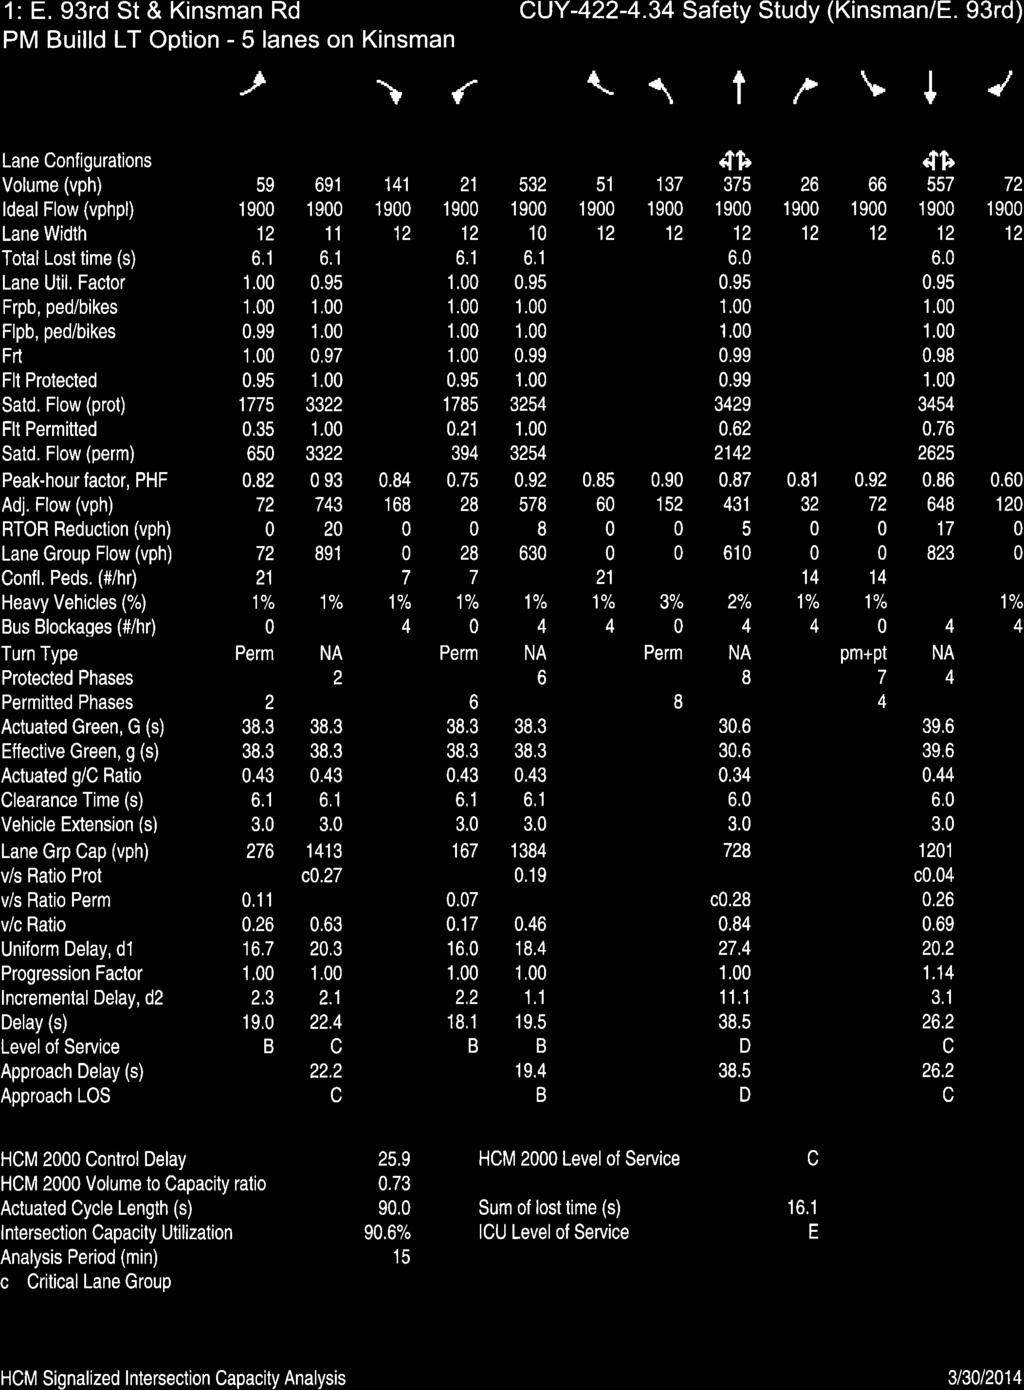
90
91
92
93
94
95
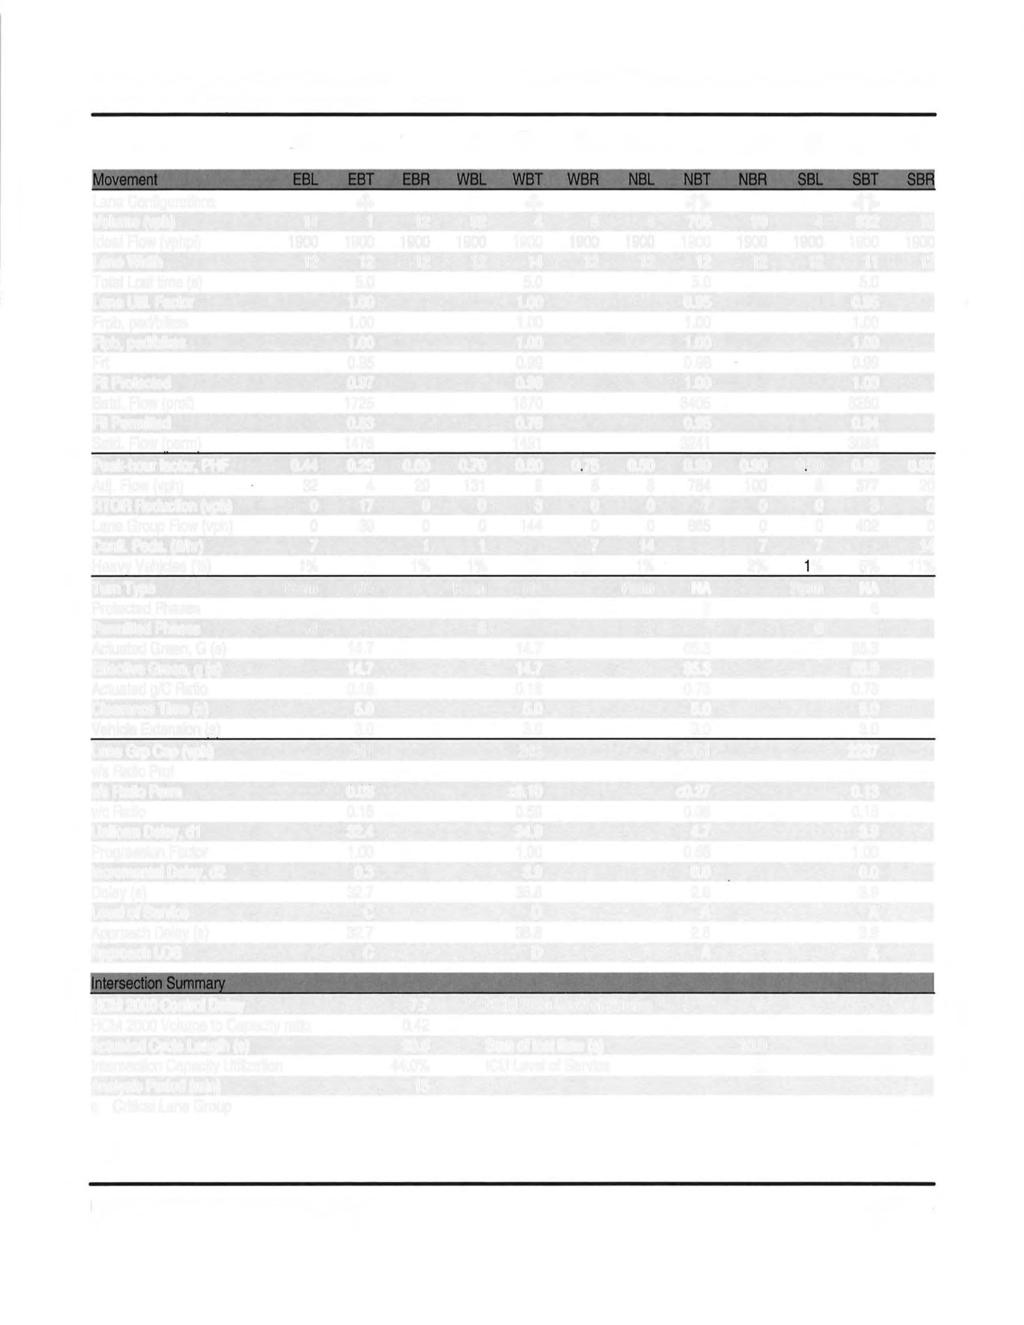
96
97
98
99
100
101 APPENDIX H STORAGE LENGTH CALCULATIONS
102 STORAGE LANE LENGTHS Storage lane lengths were calculated for the Kinsman Road/E. 93 rd Street intersection using guidelines specified in the Location and Design Manual Section 401 (Ohio Department of Transportation). Lane lengths based on the ODOT s standard criteria assume design speed limits and include vehicle storage and a 50 foot diverging taper. A summary of the lane sizing comparison is shown in Table H1 with lane sizing calculations attached to this section. Turn lane lengths were calculated using the following parameters: > 2013 AM and PM traffic volumes (no growth forecasted for design year) > 40 MPH design speed for Kinsman Road and E. 93 rd street > 90 second cycle length > Lengths rounded up in 5-foot increments TABLE H1: STORAGE LENGTH SUMMARY Movement Existing Storage Length (with taper) Turn Lane Sizing (feet) ODOT Calculated* Calculated Length No Block Length NB Left Turn None SB Left Turn None EB Left Turn None WB Left Turn None * Length includes vehicle storage and diverging taper, rounded to neares t 5 ft. ** Values rounded to nearest 5 ft. STORAGE LANE LENGTHS 1
103 MOVEMENT: EBLT CUY Safety Study Turn Lane Length Calculations Kinsman Road & E. 93rd Street MOVEMENT: WBLT 2013 counted volumes 2013 counted volumes Analysis Period AM Peak PM Peak Analysis Period AM Peak PM Peak Design Speed mph Design Speed mph Cycle Length seconds Cycle Length seconds Control (Stop or Signal) Signal Signal Control (Stop or Signal) Signal Signal Through Volume (T-TR) vph Through Volume vph Number of Through Lanes 2 2 Number of Through Lanes 2 2 Turning Volume vph Turning Volume vph Number of Turning Lanes 1 1 Number of Turning Lanes 1 1 Design Condition C C A, B, or C Design Condition C C A, B, or C Turning Percentage 10% 8% Turning Percentage 3% 4% Vehicles Per Cycle Vehicles Per Cycle Storage Length feet Storage Length feet Deceleration/Taper feet Deceleration/Taper feet Calculated Turn Lane Length feet Calculated Turn Lane Length feet No Block Distance feet No Block Distance feet No Block Turn Lane Length feet No Block Turn Lane Length feet MOVEMENT: NBLT MOVEMENT: SBLT 2013 counted volumes 2013 counted volumes Analysis Period AM Peak PM Peak Analysis Period AM Peak PM Peak Design Speed mph Design Speed mph Cycle Length seconds Cycle Length seconds Control (Stop or Signal) Signal Signal Control (Stop or Signal) Signal Signal Through Volume (T-TR) vph Through Volume vph Number of Through Lanes 2 2 Number of Through Lanes 2 2 Turning Volume vph Turning Volume vph Number of Turning Lanes 1 1 Number of Turning Lanes 1 1 Design Condition C C A, B, or C Design Condition C C A, B, or C Turning Percentage 23% 27% Turning Percentage 22% 11% Vehicles Per Cycle Vehicles Per Cycle Storage Length feet Storage Length feet Deceleration/Taper feet Deceleration/Taper feet Calculated Turn Lane Length feet Calculated Turn Lane Length feet No Block Distance feet No Block Distance feet No Block Turn Lane Length feet No Block Turn Lane Length feet
104 APPENDIX I COST ESTIMATE AND BENEFIT COST ANALYSIS


 Site Characteristic ents (i.")

 CMF 2 - Provide raised median CMF 3 - Install")
105 Safety Benefit - Cost Analysis Project Name Project Description Reference Number Analyst Agency/Company CUY Safety Study Kinsman Rd/E.93rd Street safety study Task 6 VM LJB Inc General Information Contact Contact Phone Date Performed Analysis Year /14/ Select Site Types to be used in Benefit-Cost Analysis: All Sites Countermeasure Service Lives, Costs, and Safety Benefits Countermeasures Site Characteristic Improvements (i.e. Lane widening) Service Life (Years) Initial Cost of Countermeasure Annual Maintenance & Energy Costs Salvage Value Net Present Value of Project Total Cost of Countermeasures $0.00 $0.00 $0.00 Summary of Annual Crash Modifications Net Present Value of Safety Benefits Site Characteristic Improvements (i.e. Lighting) Site Characteristic Improvements (i.e. Signal Phasing) $0.00 $0.00 $0.00 $0.00 $0.00 $ $1,633,994 Site Characteristic Improvements (i.e. Added Right Turn Lane) $0.00 $0.00 $0.00 CMF 1 - Modify change plus clearance interval to ITE 1985 Proposed Recommended Practice (4-leg signalized) CMF 2 - Provide raised median CMF 3 - Install left-turn lane 10 $25, $50, $62, $85, $16, $16, $16, $414, $301, $301, $301, $1,413,957 $0.00 $0.00 $ $0 $0.00 $0.00 $ $0 $0.00 $0.00 $ $0 $0.00 $0.00 $ $0 $0.00 $0.00 $ $0 $0.00 $0.00 $ $0 $0.00 $0.00 $ $0 Totals $342, $0.00 $0.00 $367, $379, $3,547,942

106 Safety Benefit - Cost Analysis Project Name Project Description Reference Number Analyst Agency/Company CUY Safety Study Kinsman Rd/E.93rd Street safety study Task 6 VM LJB Inc General Information Contact Contact Phone Date Performed Analysis Year /14/
, CLEVELAND OHIO, ODOT DISTRICT 12 PRELIMINARY CONSTRUCTION ESTIMATE - APRIL 1, 2014 ITEM DESCRIPTION QUANTITY UNIT COST TOTAL COST 201 CLEARING AND GRUBBING 1 LS")
107 CUY SAFETY STUDY KINSMAN ROAD (SR 422), CLEVELAND OHIO, ODOT DISTRICT 12 PRELIMINARY CONSTRUCTION ESTIMATE - APRIL 1, 2014 ITEM DESCRIPTION QUANTITY UNIT COST TOTAL COST 201 CLEARING AND GRUBBING 1 LS $ 1,000 $ 1, PAVEMENT PLANING 8000 SY $ 4 $ 32, TACK COAT 100 GAL $ 5 $ ASPHALT CONCRETE SURFACE COURSE, TYPE 1, PG64-22 (3") 660 CY $ 175 $ 115, SIGNING 1 LS $ 1,000 $ 1, TRAFFIC SIGNAL MODIFICATIONS 1 LS $ 25,000 $ 25, PAVEMENT MARKINGS 1 LS $ 6,000 $ 6,000 SPEC KWIK KURB 240 LF $ 65 $ 15,600 Subtotal $ 197, MAINTAINING TRAFFIC 1 LS $ 3,000 $ 3, FIELD OFFICE, TYPE B 2 MN $ 1,500 $ 3, CONSTRUCTION LAYOUT STAKES 1 LS $ 1,500 $ 1, MOBILIZATION 1 LS $ 10,000 $ 10, Subtotal $ 215,000 Design Risk (35%) $ 76,000 Subtotal $ 291,000 Inflation Cost (17.5%) $ 51,000 Total $ 342,000 Notes: 1 Right of way is not anticipated 2 Existing pavement is assumed to be asphalt 3 Private utility relocation not included 4 Inflation base upon construction in 2017
Figure 1 Map of intersection of SR 44 (Ravenna Rd) and Butternut Rd
 and Butternut Rd") Abbreviated Study District: 12 County: Geauga Route: SR 44 Section: 1.58 GEA 44 1.58 213 HSP # 47 (Rural Intersection) Prepared April 23, 215 By Bryan Emery Existing Conditions This study contains the
Abbreviated Study District: 12 County: Geauga Route: SR 44 Section: 1.58 GEA 44 1.58 213 HSP # 47 (Rural Intersection) Prepared April 23, 215 By Bryan Emery Existing Conditions This study contains the
Table of Contents INTRODUCTION... 3 PROJECT STUDY AREA Figure 1 Vicinity Map Study Area... 4 EXISTING CONDITIONS... 5 TRAFFIC OPERATIONS...
 Crosshaven Drive Corridor Study City of Vestavia Hills, Alabama Table of Contents INTRODUCTION... 3 PROJECT STUDY AREA... 3 Figure 1 Vicinity Map Study Area... 4 EXISTING CONDITIONS... 5 TRAFFIC OPERATIONS...
Traffic Engineering Study
 Traffic Engineering Study Bellaire Boulevard Prepared For: International Management District Technical Services, Inc. Texas Registered Engineering Firm F-3580 November 2009 Executive Summary has been requested
CUY Safety Study Final Report
 CUY-175-7.30 Safety Study Final Report Beachwood/Lyndhurst, OH Urban Non-Freeway Intersection Ranking #26 ODOT District 12 5500 Transportation Boulevard Garfield Heights, OH 44125 March 18, 2016 6612 Singletree
LAWRENCE TRANSIT CENTER LOCATION ANALYSIS 9 TH STREET & ROCKLEDGE ROAD / 21 ST STREET & IOWA STREET LAWRENCE, KANSAS
 LAWRENCE TRANSIT CENTER LOCATION ANALYSIS 9 TH STREET & ROCKLEDGE ROAD / 21 ST STREET & IOWA STREET LAWRENCE, KANSAS TRAFFIC IMPACT STUDY FEBRUARY 214 OA Project No. 213-542 TABLE OF CONTENTS 1. INTRODUCTION...
Traffic Impact Study Speedway Gas Station Redevelopment
 Traffic Impact Study Speedway Gas Station Redevelopment Warrenville, Illinois Prepared For: Prepared By: April 11, 2018 Table of Contents 1. Introduction... 1 2. Existing Conditions... 4 Site Location...
INTERSECTION CONTROL EVALUATION
 INTERSECTION CONTROL EVALUATION Trunk Highway 22 and CSAH 21 (E Hill Street/Shanaska Creek Road) Kasota, Le Sueur County, Minnesota November 2018 Trunk Highway 22 and Le Sueur CSAH 21 (E Hill Street/Shanaska
APPENDIX C1 TRAFFIC ANALYSIS DESIGN YEAR TRAFFIC ANALYSIS
 APPENDIX C1 TRAFFIC ANALYSIS DESIGN YEAR TRAFFIC ANALYSIS DESIGN YEAR TRAFFIC ANALYSIS February 2018 Highway & Bridge Project PIN 6754.12 Route 13 Connector Road Chemung County February 2018 Appendix
L1TILE BEARS DAY CARE TRANSPORTATION IMPACT STUDY FORT COLLINS, COLORADO MAY Prepared for:
 L1TILE BEARS DAY CARE TRANSPORTATION IMPACT STUDY FORT COLLINS, COLORADO MAY 2012 Prepared for: Hillside Construction, Inc. 216 Hemlock Street, Suite B Fort Collins, CO 80534 Prepared by: DELICH ASSOCIATES
King County Metro. Columbia Street Transit Priority Improvements Alternative Analysis. Downtown Southend Transit Study. May 2014.
 King County Metro Columbia Street Transit Priority Improvements Alternative Analysis Downtown Southend Transit Study May 2014 Parametrix Table of Contents Introduction... 1 Methodology... 1 Study Area...
EXECUTIVE SUMMARY. The following is an outline of the traffic analysis performed by Hales Engineering for the traffic conditions of this project.
 EXECUTIVE SUMMARY This study addresses the traffic impacts associated with the proposed Shopko redevelopment located in Sugarhouse, Utah. The Shopko redevelopment project is located between 1300 East and
BARRHAVEN FELLOWSHIP CRC 3058 JOCKVALE ROAD OTTAWA, ONTARIO TRANSPORTATION BRIEF. Prepared for:
 BARRHAVEN FELLOWSHIP CRC 3058 JOCKVALE ROAD OTTAWA, ONTARIO TRANSPORTATION BRIEF Prepared for: Barrhaven Fellowship CRC 3058 Jockvale Road Ottawa, ON K2J 2W7 December 7, 2016 116-649 Report_1.doc D. J.
TIMBERVINE TRANSPORTATION IMPACT STUDY FORT COLLINS, COLORADO JANUARY Prepared for:
 TIMBERVINE TRANSPORTATION IMPACT STUDY FORT COLLINS, COLORADO JANUARY 2014 Prepared for: Hartford Companies 1218 W. Ash Street Suite A Windsor, Co 80550 Prepared by: DELICH ASSOCIATES 2272 Glen Haven Drive
V. DEVELOPMENT OF CONCEPTS
 Martin Luther King, Jr. Drive Extension FINAL Feasibility Study Page 9 V. DEVELOPMENT OF CONCEPTS Throughout the study process several alternative alignments were developed and eliminated. Initial discussion
MEMO VIA . Ms. Amy Roth DPS Director, City of Three Rivers. To:
 MEMO To: Ms. Amy Roth DPS Director, City of Three Rivers VIA EMAIL From: Michael J. Labadie, PE Julie M. Kroll, PE, PTOE Brandon Hayes, PE, P.Eng. Fleis & VandenBrink Date: January 5, 2017 Re: Proposed
Downtown One Way Street Conversion Technical Feasibility Report
 Downtown One Way Street Conversion Technical Feasibility Report As part of the City s Transportation Master Plan, this report reviews the technical feasibility of the proposed conversion of the current
RTE. 1 at RTE. 637 & RTE. 639
 INTERSECTION SAFETY STUDY Prepared for: Virginia Department of Transportation Central Region Operations Traffic Engineering (UPC #81378, TO 12-092) DAVENPORT Project Number: 13-368 / /2014 RTE. 1 at RTE.
INTERSECTION ANALYSIS PARK AVENUE AND BRADDOCK ROAD (FROSTBURG, MD) FOR LENHART TRAFFIC CONSULTING, INC.
 FOR LENHART TRAFFIC CONSULTING, INC.") INTERSECTION ANALYSIS FOR PARK AVENUE AND BRADDOCK ROAD (FROSTBURG, MD) Prepared for: City of Frostburg, Maryland & Allegany County Commissioners Prepared by: LENHART TRAFFIC CONSULTING, INC. TRAFFIC ENGINEERING
INTERSECTION ANALYSIS FOR PARK AVENUE AND BRADDOCK ROAD (FROSTBURG, MD) Prepared for: City of Frostburg, Maryland & Allegany County Commissioners Prepared by: LENHART TRAFFIC CONSULTING, INC. TRAFFIC ENGINEERING
To: File From: Adrian Soo, P. Eng. Markham, ON File: Date: August 18, 2015
 Memo To: From: Adrian Soo, P. Eng. Markham, ON : 165620021 Date: Reference: E.C. Row Expressway, Dominion Boulevard Interchange, Dougall Avenue Interchange, and Howard 1. Review of Interchange Geometry
Section 5.0 Traffic Information
 Section 5.0 Traffic Information 10.0 TRANSPORTATION MDM Transportation Consultants, Inc. (MDM) has prepared an evaluation of transportation impacts for the proposed evaluation for the expansion of the
MERIVALE PRIORITY SQUARE 2852 MERIVALE ROAD CITY OF OTTAWA TRANSPORTATION BRIEF. Prepared for: ONT Inc. 25 Winding Way Nepean, Ontario K2C 3H1
 MERIVALE PRIORITY SQUARE 2852 MERIVALE ROAD CITY OF OTTAWA TRANSPORTATION BRIEF Prepared for: 2190986ONT Inc. 25 Winding Way Nepean, Ontario K2C 3H1 October 6, 2010 110-502 Report_1.doc D. J. Halpenny
TRAFFIC IMPACT ANALYSIS
 TRAFFIC IMPACT ANALYSIS Emerald Isle Commercial Development Prepared by SEPI Engineering & Construction Prepared for Ark Consulting Group, PLLC March 2016 I. Executive Summary A. Site Location The Emerald
INTERCHANGE OPERTIONS STUDY Interstate 77 / Wallings Road Interchange
 INTERCHANGE OPERTIONS STUDY Interstate 77 / Wallings Road Interchange City of Broadview Heights, Cuyahoga County, Ohio Prepared For: City of Broadview Heights Department of Engineering 9543 Broadview Road
Transit City Etobicoke - Finch West LRT
 Delcan Corporation Transit City Etobicoke - Finch West LRT APPENDIX D Microsimulation Traffic Modeling Report March 2010 March 2010 Appendix D CONTENTS 1.0 STUDY CONTEXT... 2 Figure 1 Study Limits... 2
West Hills Shopping Centre Lowe s Expansion Traffic Impact Study
 West Hills Shopping Centre Lowe s Expansion Traffic Impact Study Prepared for: Armel Corporation January 2015 Paradigm Transportation Solutions Ltd. 22 King Street South, Suite 300 Waterloo ON N2J 1N8
Proposed location of Camp Parkway Commerce Center. Vicinity map of Camp Parkway Commerce Center Southampton County, VA
 Proposed location of Camp Parkway Commerce Center Vicinity map of Camp Parkway Commerce Center Southampton County, VA Camp Parkway Commerce Center is a proposed distribution and industrial center to be
APPENDIX E. Traffic Analysis Report
 APPENDIX E Traffic Analysis Report THIS PAGE INTENTIONALLY BLANK EAGLE RIVER TRAFFIC MITIGATION PHASE I OLD GLENN HIGHWAY/EAGLE RIVER ROAD INTERSECTION IMPROVEMENTS TRAFFIC ANALYSIS Eagle River, Alaska
INDUSTRIAL DEVELOPMENT
 INDUSTRIAL DEVELOPMENT Traffic Impact Study Plainfield, Illinois August 2018 Prepared for: Seefried Industrial Properties, Inc. TABLE OF CONTENTS Executive Summary 2 Introduction 3 Existing Conditions
Traffic Feasibility Study
 Traffic Feasibility Study Town Center South Robbinsville Township, Mercer County, New Jersey December 19, 2017 Prepared For Robbinsville Township Department of Community Development 2298 Route 33 Robbinsville,
Roundabout Feasibility Study SR 44 at Grand Avenue TABLE OF CONTENTS
 Roundabout Feasibility Study SR 44 at Grand Avenue TABLE OF CONTENTS Introduction and Executive Summary... 1 Existing Conditions... 3 Intersection Volume Conditions... 5 Intersection Operations... 9 Safety
RICHMOND OAKS HEALTH CENTRE 6265 PERTH STREET OTTAWA, ONTARIO TRANSPORTATION BRIEF. Prepared for: Guycoki (Eastern) Limited.
 Limited.") RICHMOND OAKS HEALTH CENTRE 6265 PERTH STREET OTTAWA, ONTARIO TRANSPORTATION BRIEF Prepared for: Guycoki (Eastern) Limited June 16, 2016 116-638 Brief_1.doc D. J. Halpenny & Associates Ltd. Consulting
RICHMOND OAKS HEALTH CENTRE 6265 PERTH STREET OTTAWA, ONTARIO TRANSPORTATION BRIEF Prepared for: Guycoki (Eastern) Limited June 16, 2016 116-638 Brief_1.doc D. J. Halpenny & Associates Ltd. Consulting
County State Aid Highway 32 (Cliff Road) and Dodd Road Intersection Study
 and Dodd Road Intersection Study") County State Aid Highway 32 (Cliff Road) and Dodd Road Intersection Study City of Eagan, Dakota County, Minnesota Date: March 2012 Project No. 14957.000 444 Cedar Street, Suite 1500 Saint Paul, MN 55101
County State Aid Highway 32 (Cliff Road) and Dodd Road Intersection Study City of Eagan, Dakota County, Minnesota Date: March 2012 Project No. 14957.000 444 Cedar Street, Suite 1500 Saint Paul, MN 55101
Lacey Gateway Residential Phase 1
 Lacey Gateway Residential Phase Transportation Impact Study April 23, 203 Prepared for: Gateway 850 LLC 5 Lake Bellevue Drive Suite 02 Bellevue, WA 98005 Prepared by: TENW Transportation Engineering West
TRAFFIC DATA. Existing Derousse Ave./River Rd. AM LOS Analysis Existing Derousse Ave./River Rd. PM LOS Analysis
 Appendix E NJ TRANSIT Pennsauken Junction Transit Center and Park & Ride RiverLINE and Atlantic City Line Pennsauken Township, Camden County, New Jersey TRAFFIC DATA Background Traffic Information for
TRAFFIC IMPACT ANALYSIS. for MILTON SQUARE
 TRAFFIC IMPACT ANALYSIS for MILTON SQUARE US Route 7 Milton, Vermont March 5, 2008 LAMOUREUX & DICKINSON 14 Morse Drive Essex Junction, Vermont 05452 (802) 878-4450 Traffic Impact Assessment EXECUTIVE
Traffic Impact Analysis West Street Garden Plots Improvements and DuPage River Park Garden Plots Development Naperville, Illinois
 Traffic Impact Analysis West Street Garden Plots Improvements and DuPage River Park Garden Plots Development Naperville, Illinois Submitted by April 9, 2009 Introduction Kenig, Lindgren, O Hara, Aboona,
County State Aid Highway 30 (Diffley Road) and Dodd Road Intersection Study
 and Dodd Road Intersection Study") County State Aid Highway 30 (Diffley Road) and Dodd Road Intersection Study City of Eagan, Dakota County, Minnesota Date: March 2012 Project No. 14957.000 444 Cedar Street, Suite 1500 Saint Paul, MN 55101
County State Aid Highway 30 (Diffley Road) and Dodd Road Intersection Study City of Eagan, Dakota County, Minnesota Date: March 2012 Project No. 14957.000 444 Cedar Street, Suite 1500 Saint Paul, MN 55101
MINERVA PARK SITE TRAFFIC IMPACT STUDY M/I HOMES. September 2, 2015
 5500 New Albany Road Columbus, Ohio 43054 Phone: 614.775.4500 Fax: 614.775.4800 Toll Free: 1-888-775-EMHT emht.com 2015-1008 MINERVA PARK SITE TRAFFIC IMPACT STUDY M/I HOMES September 2, 2015 Engineers
MILLERSVILLE PARK TRAFFIC IMPACT ANALYSIS ANNE ARUNDEL COUNTY, MARYLAND
 MILLERSVILLE PARK TRAFFIC IMPACT ANALYSIS ANNE ARUNDEL COUNTY, MARYLAND Prepared for: Department of Public Works Anne Arundel County Prepared by: URS Corporation 4 North Park Drive, Suite 3 Hunt Valley,
Highway 18 BNSF Railroad Overpass Feasibility Study Craighead County. Executive Summary
 Highway 18 BNSF Railroad Overpass Feasibility Study Craighead County Executive Summary October 2014 Highway 18 BNSF Railroad Overpass Feasibility Study Craighead County Executive Summary October 2014 Prepared
King Soopers #116 Thornton, Colorado
 Traffic Impact Study King Soopers #116 Thornton, Colorado Prepared for: Galloway & Company, Inc. T R A F F I C I M P A C T S T U D Y King Soopers #116 Thornton, Colorado Prepared for Galloway & Company
Proposed CVS/pharmacy
 Traffic Impact and Access Study Proposed CVS/pharmacy West Main Street (Route 1) at Hull Street Clinton, Connecticut PREPARED FOR Arista Development LLC 520 Providence Highway, Suite 9 Norwood, Massachusetts
Re: Addendum No. 4 Transportation Overview 146 Mountshannon Drive Ottawa, Ontario
 April 18 th, 2017 Mr. Kevin Yemm Vice President, Land Development Richraft Group of Companies 2280 St. Laurent Boulevard, Suite 201 Ottawa, Ontario (Tel: 613.739.7111 / e-mail: keviny@richcraft.com) Re:
Craig Scheffler, P.E., PTOE HNTB North Carolina, P.C. HNTB Project File: Subject
 TECHNICAL MEMORANDUM To Kumar Neppalli Traffic Engineering Manager Town of Chapel Hill From Craig Scheffler, P.E., PTOE HNTB North Carolina, P.C. Cc HNTB Project File: 38435 Subject Obey Creek TIS 2022
Volume 1 Traffic Impact Analysis Turtle Creek Boulevard Dallas, Texas. Kimley-Horn and Associates, Inc. Dallas, Texas.
 Volume 1 Traffic Impact Analysis 2727 Dallas, Texas June 18, 2018 Kimley-Horn and Associates, Inc. Dallas, Texas Project #064523000 Registered Firm F-928 Traffic Impact Analysis 2727 Dallas, Texas Prepared
TRAFFIC SIGNAL DESIGN REPORT KING OF PRUSSIA ROAD & RAIDER ROAD RADNOR TOWNSHIP PENNSYLVANIA
 TRAFFIC SIGNAL DESIGN REPORT KING OF PRUSSIA ROAD & RAIDER ROAD RADNOR TOWNSHIP PENNSYLVANIA PREPARED FOR: UNIVERSITY OF PENNSYLVANIA HEALTH SYSTEM 34 CIVIC CENTER BOULEVARD PHILADELPHIA, PA 1987 (61)
2.0 Development Driveways. Movin Out June 2017
 Movin Out June 2017 1.0 Introduction The proposed Movin Out development is a mixed use development in the northeast quadrant of the intersection of West Broadway and Fayette Avenue in the City of Madison.
US 81 Bypass of Chickasha Environmental Assessment Public Meeting
 US 81 Bypass of Chickasha Environmental Assessment Public Meeting March 14, 2013 Introductions ODOT FHWA SAIC Meeting Purpose Present need for bypass Provide responses to 10/04/11 public meeting comments
IMPROVEMENT CONCEPTS
 IMPROVEMENT CONCEPTS for the South Novato Transit Hub Study Prepared by: January 11, 2010 DKS Associates With Wilbur Smith Associates IMPROVEMENT CONCEPTS Chapter 1: Introduction 1. INTRODUCTION The strategic
One Harbor Point Residential
 Residential Gig Harbor, WA Transportation Impact Analysis January 23, 2017 Prepared for: Neil Walter Company PO Box 2181 Tacoma, WA 98401 Prepared by: TENW Transportation Engineering NorthWest 11400 SE
Study Area and Location District PSA Ward ANC Phase Description C Planned Suitland Parkway Westbound at Stanton Road Southeast
 Speed Limit and Safety Nexus Studies for Automated Enforcement Locations in the District of Columbia Suitland Parkway at Stanton Road SE Study Area and Location District PSA Ward ANC Phase Description
Bennett Pit. Traffic Impact Study. J&T Consulting, Inc. Weld County, Colorado. March 3, 2017
 Bennett Pit Traffic Impact Study J&T Consulting, Inc. Weld County, Colorado March 3, 217 Prepared By: Sustainable Traffic Solutions, Inc. http://www.sustainabletrafficsolutions.com/ Joseph L. Henderson,
Traffic Impact Analysis. Alliance Cole Avenue Residential Site Dallas, Texas. Kimley-Horn and Associates, Inc. Dallas, Texas.
 Traffic Impact Analysis Alliance Cole Avenue Residential Site Dallas, Texas February 15, 2018 Kimley-Horn and Associates, Inc. Dallas, Texas Project #064524900 Registered Firm F-928 Traffic Impact Analysis
EXCEPTION TO STANDARDS REPORT
 EXCEPTION TO STANDARDS REPORT PROJECT DESCRIPTION AND NEED The project is located in Section 6, Township 23 North, Range 9 East and Section 31 Township 24 North, Range 9 East, in the Town of Stockton,
APPENDIX C ROADWAY BEFORE-AND-AFTER STUDY
 APPENDIX C ROADWAY BEFORE-AND-AFTER STUDY The benefits to pedestrians and bus patrons are numerous when a bus bay is replaced with a bus bulb. Buses should operate more efficiently at the stop when not
MEMORANDUM. Figure 1. Roundabout Interchange under Alternative D
 MEMORANDUM Date: To: Liz Diamond, Dokken Engineering From: Subject: Dave Stanek, Fehr & Peers Western Placerville Interchanges 2045 Analysis RS08-2639 Fehr & Peers has completed a transportation analysis
Technical Feasibility Report
 Prepared For: Bow Concord I-93 Improvements Project Bow and Concord, NH Prepared By: 53 Regional Drive Concord, NH 03301 NHDOT Project # 13742 Federal Project #T-A000(018) September 2018 TABLE OF CONTENTS
Speed Limit and Safety Nexus Studies for Automated Enforcement Locations in the District of Columbia 400 Block 14th Street SW
 Speed Limit and Safety Nexus Studies for Automated Enforcement Locations in the District of Columbia 4 Block 4th Street SW Study Area and Location District PSA Ward ANC Phase Description 27 6 6D Existing
Interstate Operations Study: Fargo-Moorhead Metropolitan Area Simulation Results
 NDSU Dept #2880 PO Box 6050 Fargo, ND 58108-6050 Tel 701-231-8058 Fax 701-231-6265 www.ugpti.org www.atacenter.org Interstate Operations Study: Fargo-Moorhead Metropolitan Area 2025 Simulation Results
BROWARD BOULEVARD CORRIDOR TRANSIT STUDY
 BROWARD BOULEVARD CORRIDOR TRANSIT STUDY FM # 42802411201 EXECUTIVE SUMMARY July 2012 GOBROWARD Broward Boulevard Corridor Transit Study FM # 42802411201 Executive Summary Prepared For: Ms. Khalilah Ffrench,
City of Marina. Regional Roundabout Study Utilizing Caltrans Intersection Control Evaluation Section 4: Transportation Agency for Monterey County
 Regional Roundabout Study Utilizing Caltrans Intersection Control Evaluation Section 4: City of Marina Study Intersections: RESERVATION ROAD AT BEACH ROAD RESERVATION ROAD AT DEFOREST ROAD CARDOZA AVENUE
DEVELOPMENT PROPERTY 1627 MAXIME STREET CITY OF OTTAWA TRANSPORTATION OVERVIEW. Prepared for: Subhas Bhargava. July 9, Overview_1.
 DEVELOPMENT PROPERTY 1627 MAXIME STREET CITY OF OTTAWA TRANSPORTATION OVERVIEW Prepared for: Subhas Bhargava July 9, 2015 115-620 Overview_1.doc D. J. Halpenny & Associates Ltd. Consulting Transportation
TRAFFIC IMPACT STUDY DERRY GREEN CORPORATE BUSINESS PARK MILTON SECONDARY PLAN MODIFICATION
 TRAFFIC IMPACT STUDY DERRY GREEN CORPORATE BUSINESS PARK MILTON SECONDARY PLAN MODIFICATION TRAFFIC IMPACT STUDY DERRY GREEN CORPORATE BUSINESS PARK MILTON SECONDARY PLAN MODIFICATION DECEMBER 24 UPDATED
Table of Contents. Traffic Impact Analysis Capital One Building at Schilling Place
 Traffic Impact Analysis Capital One Building at Schilling Place Table of Contents Executive Summary... 1 1. Introduction... 4 2. Project Description... 4 3. Background Information... 4 4. Study Scope...
TALMONT TOWNHOMES MADISON KENNETH SPA TRAFFIC IMPACT STUDY. Sacramento, CA. Prepared For: MBK Homes. Prepared By:
 TALMONT TOWNHOMES MADISON KENNETH SPA TRAFFIC IMPACT STUDY Sacramento, CA Prepared For: MBK Homes Prepared By: KD Anderson & Associates 3853 Taylor Road, Suite G Loomis, California 95650 (916) 660-1555
Shirk Road at State Route 198 Interchange Analysis Tulare County, California
 Shirk Road at State Route 198 Interchange Analysis Tulare County, California DRAFT REPORT Prepared By Tulare County Association of Governments (TCAG) April 2013 Table of Contents Introduction:... 3 Project
TRAFFIC IMPACT STUDY FOR SONIC DRIVE-IN RESTAURANT. Vallejo, CA. Prepared For:
 TRAFFIC IMPACT STUDY FOR SONIC DRIVE-IN RESTAURANT Vallejo, CA Prepared For: ELITE DRIVE-INS, INC. 2190 Meridian Park Blvd, Suite G Concord, CA 94520 Prepared By: KD Anderson & Associates 3853 Taylor Road,
Appendix J Traffic Impact Study
 MRI May 2012 Appendix J Traffic Impact Study Level 2 Traffic Assessment Limited Impact Review Appendix J [This page was left blank intentionally.] www.sgm-inc.com Figure 1. Site Driveway and Trail Crossing
TRAFFIC IMPACT ANALYSIS FOR. McDONALD S RESTAURANT IN CARMICAEL Sacramento County, CA. Prepared For:
 TRAFFIC IMPACT ANALYSIS FOR McDONALD S RESTAURANT IN CARMICAEL Sacramento County, CA Prepared For: McDonald s USA, LLC Pacific Sierra Region 2999 Oak Road, Suite 900 Walnut Creek, CA 94597 Prepared By:
Traffic Impact Statement (TIS)
") Traffic Impact Statement (TIS) Vincentian PUDA Collier County, FL 10/18/2013 Prepared for: Global Properties of Naples Prepared by: Trebilcock Consulting Solutions, PA 2614 Tamiami Trail N, Suite 615 1205
Traffic Impact Statement (TIS) Vincentian PUDA Collier County, FL 10/18/2013 Prepared for: Global Properties of Naples Prepared by: Trebilcock Consulting Solutions, PA 2614 Tamiami Trail N, Suite 615 1205
APPENDIX B Traffic Analysis
 APPENDIX B Traffic Analysis Rim of the World Unified School District Reconfiguration Prepared for: Rim of the World School District 27315 North Bay Road, Blue Jay, CA 92317 Prepared by: 400 Oceangate,
Escondido Marriott Hotel and Mixed-Use Condominium Project TRAFFIC IMPACT ANALYSIS REPORT
 Escondido Marriott Hotel and Mixed-Use Condominium Project TRAFFIC IMPACT ANALYSIS REPORT Prepared for Phelps Program Management 420 Sixth Avenue, Greeley, CO 80632 Prepared by 5050 Avenida Encinas, Suite
TRAFFIC IMPACT ANALYSIS FOR THE 630/650 SOUTH STREET RETAIL DEVELOPMENT WRENTHAM, MASSACHUSETTS
 PARE PROJECT NO. 17120.00 REPORT TRAFFIC IMPACT ANALYSIS FOR THE 630/650 SOUTH STREET RETAIL DEVELOPMENT WRENTHAM, MASSACHUSETTS SUBMITTED TO: GEORGETOWN CAPITAL MANAGEMENT PO BOX 369 GEORGETOWN, MA 01833
I-820 (East) Project Description. Fort Worth District. Reconstruct Southern I-820/SH 121 Interchange
 Project Description. Fort Worth District. Reconstruct Southern I-820/SH 121 Interchange") I-820 (East) Project Description Fort Worth District Reconstruct Southern I-820/SH 121 Interchange I-820 from approximately 2,000 feet north of Pipeline Road/Glenview Drive to approximately 3,200 feet
I-820 (East) Project Description Fort Worth District Reconstruct Southern I-820/SH 121 Interchange I-820 from approximately 2,000 feet north of Pipeline Road/Glenview Drive to approximately 3,200 feet
105 Toronto Street South, Markdale Transportation Impact Study. Paradigm Transportation Solutions Limited
 105 Toronto Street South, Markdale Transportation Impact Study Paradigm Transportation Solutions Limited December 2016 Project Summary Project Number 162060 December 2016 Client Zelinka Priamo Ltd 318
City of Pacific Grove
 Regional Study Utilizing Caltrans Intersection Evaluation Section 7: City of Pacific Grove s: FIRST STREET AT CENTRAL AVENUE Transportation Agency for Monterey County Prepared by Transportation Agency
 Traffic Analysis For Approved Uses within the St. Lucie West DRI Aldi Port St. Lucie, FL Prepared for: Bohler Engineering, LLC 1000 Corporate Drive Suite 250 Fort Lauderdale, FL 33334 Prepared by: 10795
HUMC/Mountainside Hospital Redevelopment Plan
 Traffic and Parking Analysis HUMC/Mountainside Hospital Redevelopment Plan in Glen Ridge Borough and Montclair Township PREPARED FOR H2M 119 Cherry Hill Road, Suite 110 Parsippany, NJ 07054 862.207.5900
PROJECT: Wilkinson Road Corridor Improvement Traffic Management Planning Project SUBJECT: Traffic Analysis
 TECHNICAL MEMORANDUM DATE: September 10, 2014 PROJECT 5861.03 NO: PROJECT: Wilkinson Road Corridor Improvement Traffic Management Planning Project SUBJECT: Traffic Analysis TO: Steve Holroyd - District
RE: A Traffic Impact Statement for a proposed development on Quinpool Road
 James J. Copeland, P.Eng. GRIFFIN transportation group inc. 30 Bonny View Drive Fall River, NS B2T 1R2 May 31, 2018 Ellen O Hara, P.Eng. Project Engineer DesignPoint Engineering & Surveying Ltd. 200 Waterfront
The Highway Safety Manual: Will you use your new safety powers for good or evil? April 4, 2011
 The Highway Safety Manual: Will you use your new safety powers for good or evil? April 4, 2011 Introductions Russell Brownlee, M.A. Sc., FITE, P. Eng. Specialize in road user and rail safety Transportation
Speed Limit and Safety Nexus Studies for Automated Enforcement Locations in the District of Columbia 3rd Street Tunnel at Massachusetts Avenue Exit
 Speed Limit and Safety Nexus Studies for Automated Enforcement Locations in the District of Columbia 3rd Street Tunnel at Massachusetts Avenue Exit Study Area and Location District PSA Ward ANC Phase Description
DLZ OHIO, US 322 #10 ODOT SAFETY ANALYST 2010 REPORT OCTOBER 2012
 DLZ OHIO, INC. CUY-322-13.60-14.20 SAFETY STUDY US 322 #10 ODOT SAFETY ANALYST 2010 REPORT OCTOBER 2012 Cuyahoga Study Location Prepared for: The Ohio Department of Transportation District 12 5500 Transportation
Safety Assessment. Intersection of Route 29 (Seminole Trail) and Ashwood Blvd (Route 1670). Albemarle County
 and Ashwood Blvd (Route 1670). Albemarle County") Safety Assessment for Intersection of Route 29 (Seminole Trail) and Ashwood Blvd (Route 1670). Albemarle County Prepared by: VIRGINIA DEPARTMENT OF TRANSPORTATION Northwestern Regional Operations - Traffic
Safety Assessment for Intersection of Route 29 (Seminole Trail) and Ashwood Blvd (Route 1670). Albemarle County Prepared by: VIRGINIA DEPARTMENT OF TRANSPORTATION Northwestern Regional Operations - Traffic
Proposed Inn at Bellefield Traffic Impact Assessment
 Proposed Inn at Bellefield Traffic Impact Assessment Town of Hyde Park Dutchess County, New York Prepared for: T-Rex Hyde Park Owner LLC 500 Mamroneck Avenue, Suite 300 Harrison, NY 10528 June 21, 2017
TRAFFIC IMPACT STUDY. USD #497 Warehouse and Bus Site
 TRAFFIC IMPACT STUDY for USD #497 Warehouse and Bus Site Prepared by: Jason Hoskinson, PE, PTOE BG Project No. 16-12L July 8, 216 145 Wakarusa Drive Lawrence, Kansas 6649 T: 785.749.4474 F: 785.749.734
Existing Traffic Conditions
 May 14, 2014 Ms. Lorraine Weiss City of San Mateo 330 West 20 th Avenue San Mateo, CA 94403 Subject: Traffic Operational Study for the Proposed Tilton Avenue Residential Development in San Mateo, California
New Buck O Neil (U. S. 169) Crossing Benefit-Cost Analysis. Kansas City, Missouri
 Crossing Benefit-Cost Analysis. Kansas City, Missouri") New Buck O Neil (U. S. 169) Crossing Benefit-Cost Analysis Kansas City, Missouri New Buck O Neil (U. S. 169) Crossing Benefit-Cost Analysis prepared for Kansas City, Missouri prepared by Burns & McDonnell
New Buck O Neil (U. S. 169) Crossing Benefit-Cost Analysis Kansas City, Missouri New Buck O Neil (U. S. 169) Crossing Benefit-Cost Analysis prepared for Kansas City, Missouri prepared by Burns & McDonnell
Introduction and Background Study Purpose
 Introduction and Background The Brent Spence Bridge on I-71/75 across the Ohio River is arguably the single most important piece of transportation infrastructure the Ohio-Kentucky-Indiana (OKI) region.
Study Area and Location District PSA Ward ANC Phase Description B Existing 600 Block New York Avenue Northeast Westbound
 Speed Limit and Safety Nexus Studies for Automated Enforcement Locations in the District of Columbia 6 Block New York Avenue NE Study Area and Location District PSA Ward ANC Phase Description 5 55 5 5B
Traffic Impact Study for the proposed. Town of Allegany, New York. August Project No Prepared For:
 Appendix B SRF Traffic Study (Revised November 2005) Draft Environmental Impact Statement University Commons Town of Allegany, Cattaraugus County, NY December 2005 Traffic Impact Study for the proposed
Lakeside Terrace Development
 Lakeside Terrace Development City of Barrie, County of Simcoe Traffic Brief for: Type of Document: Final Report Project Number: JDE 1617 Date Submitted: April 29 th, 216 4/29/16 John Northcote, P.Eng.
Trafalgar Road & Lower Base Line Transportation Study Ontario Inc.
 Trafalgar Road & Lower Base Line Transportation Study 1255723 Ontario Inc. Trafalgar Road & Lower Base Line Transportation Study 1255723 Ontario Inc. 1465 Pickering Parkway Suite 200 Pickering ON L1V 7G7
ZINFANDEL LANE / SILVERADO TRAIL INTERSECTION TRAFFIC ANALYSIS
 ZINFANDEL LANE / SILVERADO TRAIL INTERSECTION TRAFFIC ANALYSIS UPDATED TRAFFIC STUDY FOR THE PROPOSED RAYMOND VINEYARDS WINERY USE PERMIT MODIFICATION #P11-00156 AUGUST 5, 2014 PREPARED BY: OMNI-MEANS,
2016 Congestion Report
 2016 Congestion Report Metropolitan Freeway System May 2017 2016 Congestion Report 1 Table of Contents Purpose and Need...3 Introduction...3 Methodology...4 2016 Results...5 Explanation of Percentage Miles
Southern Windsor County 2016 Traffic Count Program Summary April 2017
 Southern Windsor County 2016 Traffic Count Program Summary April 2017 The Southern Windsor County Regional Planning Commission (the RPC ) has been monitoring traffic at 19 locations throughout the southern
TRAFFIC IMPACT ANALYSIS RIZZO CONFERENCE CENTER EXPANSION FINAL REPORT
 TRAFFIC IMPACT ANALYSIS RIZZO CONFERENCE CENTER EXPANSION Chapel Hill, North Carolina FINAL REPORT Prepared for: The Town of Chapel Hill, NC Prepared by: Architects-Engineers-Planners, Inc. December 2010
Oakbrook Village Plaza City of Laguna Hills
 Oakbrook Village Plaza City of Laguna Hills Traffic Impact Analysis Prepared by: HDR Engineering 3230 El Camino Real, Suite 200 Irvine, CA 92602 October 2012 Revision 3 D-1 Oakbrook Village Plaza Laguna
Metropolitan Freeway System 2013 Congestion Report
 Metropolitan Freeway System 2013 Congestion Report Metro District Office of Operations and Maintenance Regional Transportation Management Center May 2014 Table of Contents PURPOSE AND NEED... 1 INTRODUCTION...
Interstate Operations Study: Fargo-Moorhead Metropolitan Area Simulation Output
 NDSU Dept #2880 PO Box 6050 Fargo, ND 58108-6050 Tel 701-231-8058 Fax 701-231-6265 www.ugpti.org www.atacenter.org Interstate Operations Study: Fargo-Moorhead Metropolitan Area 2015 Simulation Output Technical