Draft US Corridor Study Traffic Analysis Report
|
|
|
- Arlene Shaw
- 5 years ago
- Views:
Transcription
1 Draft US Corridor Study Traffic Analysis Report US from NC 54 to US 64 Year Prepared for: North Carolina Department of Transportation Prepared by: Stantec Consulting Services, Inc. 801 Jones Franklin Road, Suite 300 Raleigh, NC August 8, 2014
2 DRAFT US CORRIDOR STUDY TRAFFIC ANALYSIS REPORT Table of Contents 1. INTRODUCTION STUDY AREA PURPOSE OF PROJECT STUDY SCENARIOS TRAFFIC ANALYSIS TRAFFIC ANALYSIS EXISITNG ANALYSIS (2013) FUTURE STANDARD INTERSECTION ANALYSIS FUTURE STANDARD ANALYSIS TRAFFIC ANALYSIS FUTURE SUPERSTREET ANALYSIS FUTURE SUPERSTREET ANALYSIS TRAFFIC ANALYSIS GUIDING PRINCIPLES CONCLUSION APPENDIX APPENDIX A i
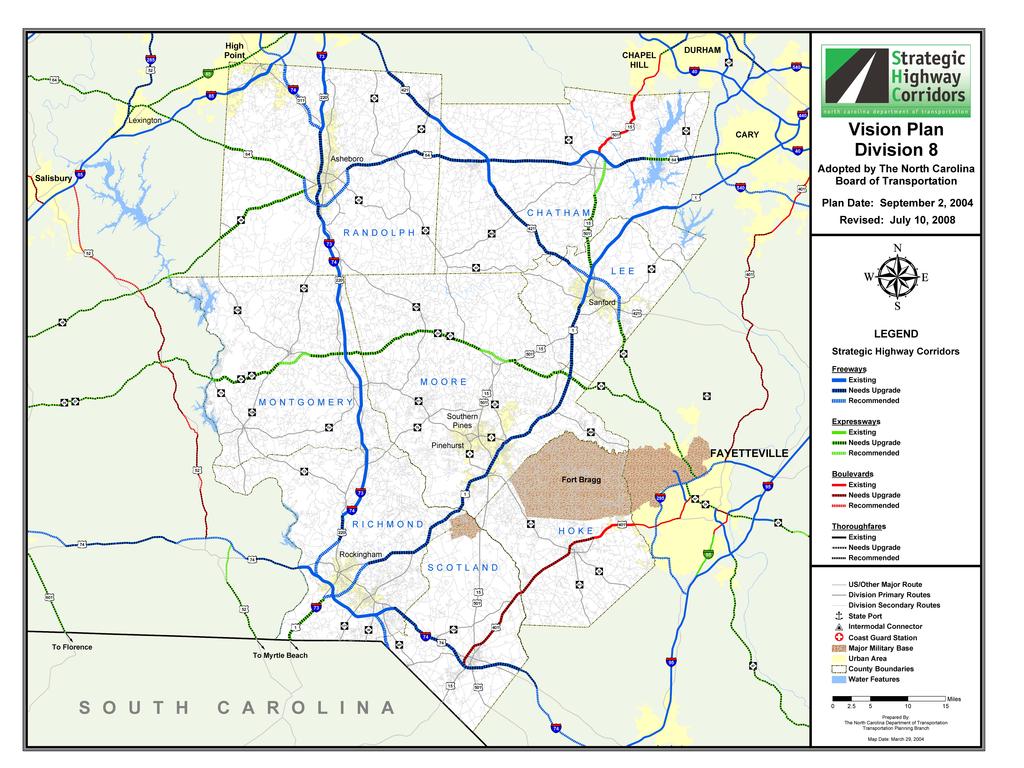
3 DRAFT US CORRIDOR STUDY TRAFFIC ANALYSIS REPORT 1. Introduction 1.1 STUDY AREA The US corridor is functionally classified as a north-south principal arterial which serves the inter-county travel demands between Chatham and Orange Counties. US is considered a Strategic Corridor between the growing towns of Pittsboro and Chapel Hill and is classified as a Boulevard in the NCDOT Strategic Highway Corridors Vision Plan (July 2008). The corridor has recently seen an increase in retail and residential development serving individuals working in nearby commercial, high-tech, medical, and research centers. US serves many different land uses such as: residential, retail, and office. The fifteen mile study area on US begins with the NC 54 interchange in Orange County and continues to the US 64 interchange in Chatham County as illustrated in Figure 1. There are 25 intersections in the project study area; 15 are signalized and 10 are unsignalized. 1

4 DRAFT US CORRIDOR STUDY TRAFFIC ANALYSIS REPORT Figure 1 Project Location 1.2 PURPOSE OF PROJECT As development interest in the US corridor from NC 54 to US 64 grows, so does the need to preserve the current operations along the roadway. NCDOT contracted with Stantec to study the existing (2013) and future year (2040) operations, to determine if current infrastructure 2
5 DRAFT US CORRIDOR STUDY TRAFFIC ANALYSIS REPORT could support the future growth. Additionally, NCDOT wanted to evaluate the implementation of superstreets along US In a collaborative effort, staff from NCDOT Divisions 7 &8 and NCDOT Congestion Management worked with staff from Chatham and Orange counties, and the Towns of Chapel Hill and Pittsboro to create a clear picture of the existing conditions along the corridor and a vision of what was on the horizon for this area. NCDOT also sought to provide guiding principles for the US corridor for the future that may be adopted by local councils and governments. 1.3 STUDY SCENARIOS There were five scenarios for this study. The first scenario, Existing Scenario 1, evaluated the AM and PM peak hours for existing volumes. Counts taken in April 2013 were used for volumes. The remaining four scenarios studied the future year of The first three, Future Scenarios 1A 1C analyzed standard intersections along US Future Scenario 2 analyzed superstreets along the US corridor. These five scenarios are described in further detail below: Existing Scenario Existing Conditions The laneage used in the existing scenario was taken from 2013 field visits and 2013 Google aerials. Current signal plans and timing, provided by the Town of Chapel Hill and NCDOT, were used for this analysis. Future Scenario 1A With Improved Traditional Intersections This scenario evaluates the corridor with the existing 2013 geometry at the NC 54 interchange. The study intersections along US were analyzed as standard intersections with some geometric improvements, such as turn lanes, and the signals were optimized. Future Scenario 1B With Improved Traditional Intersections and Upgraded NC 54 / US Interchange Interchange improvements were recommended for the US / NC 54 interchange as part of the Obey s Creek TIA performed by HNTB. This study recommends that the NC 54 westbound ramp be reconfigured to add a loop ramp to the western side of the interchange. At the time of this report, this improvement was not funded. An illustration 3
6 DRAFT US CORRIDOR STUDY TRAFFIC ANALYSIS REPORT of these improvements is displayed in Figure 2.. The laneage in the remainder of the corridor matches Future Scenario 1A. Future Scenario 1C With Improved Traditional Intersections, Widening along Northern Section of US , and Upgraded NC 54 / US Interchange This scenario uses the same NC 54 interchange modifications as the previous scenario, Future Scenario 1B. Additionally, this scenario evaluates widening US to six lanes from the NC 54 interchange to the Mann s Chapel Rd/ Plaza Rd intersection. The laneage in the remainder of the corridor matches Future Scenario 1A. Future Scenario with Superstreets and Upgraded NC 54 / US Interchange This scenario evaluates the use of superstreets along the corridor. Superstreet configurations limit movements and signal phases at the intersection. In this study, what can be referred to as standard superstreet configurations, were used. The standard superstreets used in this study remove the left turn and through movements from the side streets. U-turn locations are positioned downstream and upstream from the main intersection, and can be signalized or unsignalized. Left turns off of US onto the side streets are permitted. All signals run with two phase signal timing plans. An illustration of an example superstreet intersection is shown in Figure 3. Some of the intersections in the vicinity of the Polks Landing Development utilize different types of superstreet intersections, but they still utilize the concept of minimizing traffic movements and reducing the number of signal phases. Laneage and volume figures for all scenarios are included in Appendix A 4

7 DRAFT US CORRIDOR STUDY TRAFFIC ANALYSIS REPORT Figure 2- Concept of NC 54 Improvements recommended by HNTB in the Obey s Creek TIA 5

8 DRAFT US CORRIDOR STUDY TRAFFIC ANALYSIS REPORT Figure 3- Concept of Standard Superstreet Intersection 6
9 DRAFT US CORRIDOR STUDY TRAFFIC ANALYSIS REPORT 2. Traffic Analysis 2.1 TRAFFIC ANALYSIS Capacity analyses were performed for the roadway network in the project study area. The traffic analysis program Synchro Version 7 was used to analyze all intersections according to methods put forth by the Transportation Research Board s Highway Capacity Manual (HCM). The Highway Capacity Manual defines capacity as the maximum rate of flow at which persons or vehicles can be reasonably expected to traverse a point or uniform section of a lane or roadway during a specified time period under prevailing roadway, traffic, and control conditions, usually expressed as vehicles per lane per hour. Level-of-service (LOS) is a term used to describe different traffic conditions and is defined as a qualitative measure describing operational conditions within a traffic stream, and their perception by motorists/ or passengers. LOS varies from Level A, representing free flow, to Level F where traffic breakdown conditions are evident. Traffic conditions with LOS of E or F are deemed unacceptable and represent significant travel delay, increased accident potential, and inefficient motor vehicle operation. At an unsignalized intersection, the primary traffic on the main roadway is virtually uninterrupted. Therefore, the overall delay for the intersection is usually less than what is calculated for the minor street movements. The overall intersection delay and the delay for the intersection s minor street(s) are reported in the summary tables of this report. Generally, LOS D is acceptable for signalized intersections in suburban areas during peak periods. With the current method of reporting LOS for unsignalized intersections, it is not uncommon for some of the minor street movements to be operating at a LOS F during peak hour conditions. 7
10 DRAFT US CORRIDOR STUDY TRAFFIC ANALYSIS REPORT Tables 1 and 2 present the criteria of each LOS as indicated in the Highway Capacity Manual. Table 1: Level-of-Service Criteria - Signalized Intersections Level-of-Service Criteria Signalized Intersections Level-of-Service Stopped Delay per Vehicle (sec) A 10.0 B >10.0 and 20.0 C >20.0 and 35.0 D >35.0 and 55.0 E >55.0 and 80.0 F >80.0 Table 2: Level-of-Service Criteria - Unsignalized Intersections Level-of-Service Criteria Unsignalized Intersections Level-of-Service Stopped Delay per Vehicle (sec) A 10.0 B >10.0 and 15 C >15 and 25 D >25 and 35 E >35 and 50 F > EXISITNG ANALYSIS (2013) The 15 mile section of US between NC 54 and US 64 is currently a four-lane divided roadway. Many access management principles are currently being implemented along this roadway: There is a 8
11 DRAFT US CORRIDOR STUDY TRAFFIC ANALYSIS REPORT median throughout, driveway connections are limited, full movement access intersections are limited. Also, u-turns are located at intersections along the corridor to accommodate turning vehicles, and there is currently good spacing between signalized intersections. For the existing conditions analysis, turning movement counts at the 25 study area intersections were taken on April 23 rd and 24 th, 2013 for the AM (7-9) and PM (4-6) peak hours. The existing volumes and laneage figures are illustrated in Appendix A. The existing analysis shows that intersections along the US corridor are operating at overall acceptable levels of service. The only exception is at the Mount Carmel Church Road / Culbreth Road intersection at US which is operating at LOS F during the PM peak hour. Side street operations at some of the intersections are operating at unacceptable levels of service; however, the overall intersection operates at an acceptable level of service. This demonstrates how good access management can maintain an acceptable level of service along a high volume corridor. Proposed median breaks and additional new signals should be limited along this corridor in the future. Additionally, existing signals should be evaluated for phase reduction where possible as additional parcels develop. Many of the approved TIA s in this area demonstrate good access management as a part of their proposed site plans which should aid to further preserve levels of service along the US corridor. An example of this is shown in Appendix A The existing levels of service for the study intersections are shown in Table 3. 9

12 DRAFT US CORRIDOR STUDY TRAFFIC ANALYSIS REPORT 10
13 DRAFT US CORRIDOR STUDY TRAFFIC ANALYSIS REPORT 3. Future Standard Intersection Analysis 3.1 FUTURE STANDARD ANALYSIS The traffic volumes for 2040 were taken from the US Corridor Study Traffic Forecast completed by Stantec on March 4, 2014 in concordance with this project. The AM and PM peakhour turning movement volumes for the studied access drives and intersections were then analyzed in Synchro for the Build Out year. The 2040 traffic volume figures are included in Appendix A. Additional geometric improvements in future scenarios were recommended in order to maintain acceptable LOS along the corridor. Improvements included turn lanes and signals; while the overall four-lane divided cross-section was maintained. Volume and laneage figures for each scenario are shown in Appendix A. 3.2 TRAFFIC ANALYSIS Future Scenario 1A with Improved Traditional Intersections This scenario evaluates the corridor with the existing 2013 geometry at the US / NC 54 interchange. In 2040, with standard intersections along US , the intersections surrounding the NC 54 interchange are not expected to perform at acceptable level of service. The study intersections along US were analyzed as standard intersections with some geometric improvements, such as turn lanes, and the signals were optimized. The intersections along the corridor, south of the NC 54 interchange are predicted to operate at an overall acceptable level of service but will have failing movements and significant queuing on the side streets. Future Scenario 1B with Improved Traditional Intersections and Upgraded NC 54 / US Interchange Interchange improvements were recommended for the US / NC 54 interchange as part of the Obey s Creek TIA performed by HNTB. This study recommends that the NC 54 westbound ramp be reconfigured to add a loop ramp to the western side of the interchange. At the time of this report, this improvement was not funded. According to the Synchro analysis, this improvement is predicted to significantly improve operations at the interchange. Additional 11
14 DRAFT US CORRIDOR STUDY TRAFFIC ANALYSIS REPORT turning lanes were added to the Mount Carmel Church Road / Culbreth Road intersection, which improved operations at this intersection as well. Future Scenario 1C with Improved Traditional Intersections, Widening along Northern Section of US , and Upgraded NC 54 / US Interchange Widening US to six lanes from the NC 54 interchange to the Mann s Chapel Rd/ Plaza Rd intersection brings the overall LOS for all study intersections to acceptable levels. However, there are unacceptable delays predicted for several side street movements. Table 4, shown on the next page, displays the LOS and delay in seconds for the standard intersection scenarios. 12
15 DRAFT US CORRIDOR STUDY TRAFFIC ANALYSIS REPORT Table Standard Intersection Conditions Level-of-Service Summary Overall LOS (Delay in Seconds) Intersection Future Scenario 1A with Improved Traditional Intersections Future Scenario 1B with Improved Traditional Intersections and Upgraded NC 54 / US Interchange Future Scenario 1C 2040 with Improved Traditional Intersections, Widening along Northern Section of US , and Upgraded NC 54 / US Interchange AM PM AM PM AM PM US at NC 54 WB Ramps E (66.0)* F (160.2)* A (7.5) E (67.7)* A (7.9) B (15.6) US at NC 54 EB Ramps D (54.9)* F (106.5)* D (35.6)* E (61.9)* D (33.7)* B (19.5) US at Mt. Carmel Church Rd. / Culbreth Rd. US at Bennett Rd. / Arlen Park Dr. F (214.2)* E (61.3)* F (53.4)* D (50.8)* D (45.3)* D (36.5)* D (25.2)* C (21.0)* C (23.4)* C (17.6)* US at Market St. E (59.2)* D (50.7)* D (37.8)* D (45.4)* US at Dogwood Acres Dr. A (5.4)* A (4.4)* A (5.0)* A (4.1)* US at Smith Level Rd. D (44.1)* D (44.1)* D (39.5) D (41.5) US at Old Lystra Rd. B (11.6)* D (53.9)* A (8.6)* D (47.7)* US at Manns Chapel Rd. / Plaza Dr. US at Holly Ridge Rd. Ext. / Center Driveway. US at Polks Landing Rd. / South Driveway E (79.2)* E (71.5)* D (55.0)* D (53.3)* A (6.1) A (6.6) B (15.3) B (17.2) US at Lystra Rd. C (24.6)* B (18.7) US at Vickers Rd. / Briar Chapel Pkwy. C (21.4)* D (35.2)* US at Jack Bennett Rd. B (17.2)* B (12.5)* US at Taylor Rd. C (27.4) C (34.2) US at Andrews Store Rd. US at Village Way / Morris Rd. US at Weathersfield Rd. US at Mt. Gilead Church Rd. US at East Cotton Rd. / Hamlet Chapel Rd. C (18.3) C (27.7)* D (50.7)* D (42.4)* B (12.8)* B (12.3) D (41.7)* C (22.6) C (29.5)* C (29.1)* US at Bynum Rd. A (7.0) A (7.6) US at Moore Mountain Rd. / Durham Eubanks Rd. US at Russell Chapel Church Rd. / Proposed Chatham, Park Dr US at Northwood High School Rd. / Russet Run US at US 64 Bypass WB Ramps US at US 64 Bypass EB Ramps C (23.3) C (28.2)* D (46.0)* D (50.2)* D (42.7)* D (35.9)* C (28.7) D (40.3)* B (16.3) B (18.3) * Indicates that an intersection leg is predicted to operate at an undesirable Level of Service 13
16 DRAFT US CORRIDOR STUDY TRAFFIC ANALYSIS REPORT 4. Future Superstreet Analysis 4.1 FUTURE SUPERSTREET ANALYSIS Traffic volumes were taken from the 2040 Standard Intersection Analyses and distributed to match superstreet movements. The AM and PM peak-hour turning movement volumes for the studied access drives and intersections were then calculated and analyzed for the Build Out year. The 2040 Build Out superstreet traffic volume figures are illustrated in Appendix A. 4.2 TRAFFIC ANALYSIS Future Scenario with Superstreets and Upgraded NC 54 / US Interchange Future Scenario 2 incorporates the suggested NC 54 interchange improvements from the Obey s Creek TIA. Given the close proximity of the Mt. Carmel Church Rd/ Culbreth Rd intersection to the NC 54 interchange, a superstreet configuration would not geometrically fit. Therefore, the intersection was kept with a standard configuration. Additionally, the TIA for Williams Corner and Polks Landing suggested lane configurations at the Polks Landing Road and Lystra Road intersections. These were altered slightly to operate optimally with the superstreet intersections. A majority of the superstreet intersections operate at an acceptable LOS. A few intersections are predicted to have unacceptable side street movement delays. These intersections can be investigated in detail as development requiring changes in the intersection operations occurs. The overall levels of service and delay in seconds for this scenario are displayed in Table 5. 14
17 DRAFT US CORRIDOR STUDY TRAFFIC ANALYSIS REPORT Table 5 - Future Scenario with Superstreets and Upgraded NC 54 / US Interchange Overall LOS (Delay in Seconds) Intersection 2040 Superstreet AM 2040 Superstreet PM Intersection U-Turn Intersection U-Turn US at NC 54 WB Ramps A (7.4) - D (48.3)* - US at NC 54 EB Ramps C (33.9)* - D (42.9)* - US at Culbreth Rd. / Mt. Carmel Church Rd D (48.7)* - D (40.6)* - US at Bennett Rd. C (20.9)* B (13.9) A (6.7) B (13.0) US at Arlen Park Dr. B (11.3) B (11.8) B (12.3) B (7.7) US at Proposed Obey s Creek Driveway C (27.8) A (5.5) C (18.0) A (7.8) US at Market St. B (12.3) B (16.8) C (25.5) B (17.7) US at Dogwood Acres Dr. A (8.1) # (1.1) A (6.6) # (1.1) US at Wal-Mart Driveway. B (19.8) B (18.1) B (19.3) B (17.8) US at Smith Level Rd. C (25.1) B (15.6) D (49.1)* B (10.0) US at Old Lystra Rd. B (11.8) A (8.3) B (19.0) C (24.4) US at Plaza Dr. D (41.3)* B (11.0) B (13.3) B (13.3) US at Manns Chapel Rd. B (19.6) C (26.3)* D (36.3)* B (14.8) US at Holly Ridge Rd Ext. / Center Driveway. A (4.3) - A (8.3) - US at Polks Landing Rd. A (9.5) - B (10.3) - US at South Driveway. A (7.3) - B (10.7) - US at Lystra Rd. A (8.4) B (11.4) B (11.0) B (10.7) US at Vickers Rd. A (4.9) # (0.4) A (5.4) # (0.5) US at Briar Chapel Pkwy. B (10.9) # (1.9) B (13.4) # (1.5) US at Jack Bennett Rd. A (9.8) # (1.8) A (8.5) # (2.0) US at Taylor Rd. B (17.9) B (10.2)* B (18.7) A (4.6) US at Andrews Store Rd. C (21.0) C (20.7) C (22.8) A (9.8) US at Village Way B (11.8) A (5.7) B (10.8) A (8.4) US at Morris Rd. B (11.5) B (13.7) B (10.7) A (4.0) US at Weathersfield Rd. A (9.0) A (5.2) A (4.3) B (15.9) US at Mt. Gilead Church Rd. B (16.9) A (5.2) B (11.0) A (8.9)* US at East Cotton Rd. A (1.7) # (0.2) A (2.1) # (0.2) US at Hamlet Chapel Rd. B (15.5) A (5.3) B (16.9) A (3.3) US at Bynum Rd. A (4.5) # (0.4) A (4.7) # (0.4) US at Durham Eubanks Rd. A (1.0) # (1.3) A (7.5) # (0.8) US at Moore Mountain Rd. A (4.6) # (0.9) A (6.8) # (0.5) US at Russell Chapel Church Rd. US at Proposed Chatham Park Driveway C (20.9) # (1.6) B (13.2) # (1.0) C (20.9) B (11.0) B (17.9) A (7.4) US at Russet Run B (11.5) B (12.2) B (13.1) B (14.3) US at Northwood High School Rd. US at US 64 Bypass WB Ramps B (14.1) B (14.6) B (14.9) A (7.2) C (22.3) - C (29.7) - *- US at US 64 Bypass EB Ramps B (14.5) - B (13.9) - Indicates that an intersection leg is predicted to operate at an undesirable Level of Service 15
18 DRAFT US CORRIDOR STUDY TRAFFIC ANALYSIS REPORT 5. Guiding Principles US in Orange and Chatham counties, is identified as a Boulevard in the NCDOT Strategic Highway Corridor Vision Plan prepared by the Transportation Planning Branch in July 2008 ( s/strategic%20highway%20corridors%20vision%20plan.pdf). Information on the Strategic Highway Corridor initiative across the state can be found on NCDOT s website at: ( NCDOT provides recommendations for the control of access for strategic boulevards in their Strategic Highway Corridors Concept Development Report from October ( ategic%20highway%20corridors%20concept%20development%20report.pdf). Relative excerpts from these reports are included in Appendix A. The Concept Development Report recommends partial control of access. This can include, but is not limited to: one driveway connection per parcel, consolidated/shared driveways, limited access to connecting and service roads, and right in/right out restrictions. For any proposed superstreet configurations, it is recommended by NCDOT Congestion Management that the minimum spacing requirements for u-turns begin at 600 from the intersection and do not exceed 1,000. Special circumstances will be accounted for on a case by case basis. Figure 4 illustrates the preferred progression for conversion of current intersections. 16

19 DRAFT US CORRIDOR STUDY TRAFFIC ANALYSIS REPORT Figure 4- Recommended Progression Sequence 17
20 DRAFT US CORRIDOR STUDY TRAFFIC ANALYSIS REPORT 6. Conclusion The Existing Analysis (2013) demonstrates that the corridor intersections are operating at acceptable levels of service. If standard intersections are maintained through 2040, with geometric and signal improvements, the corridor is predicted to operate with unacceptable levels of service around the NC 54 interchange. The other intersections will operate at acceptable levels of service but will have failing side street movements and significant queuing on the side streets. With the proposed improvements to the NC 54 interchange from the Obey s Creek TIA, operations improve at the interchange. The standard intersections along the corridor see the most improvement when US is widened to six lanes from NC 54 to Mann s Chapel Rd. However, Synchro predicts that there will be significant delay and queuing along the side streets along the corridor. The 2040 Superstreet Analysis resulted in acceptable overall levels of service for all intersections. There were a few intersections with unacceptable delay on the side streets. Overall, superstreet intersections serve both the main-line and the side streets efficiently, and most effectively maintain the current operations with future growth. Maintaining the use of access management that already exists along the corridor will help ensure that operations stay highly functional. Incorporating geometric improvements and reducing signal phases at existing and proposed intersections as developments and redevelopments occur will help transition the US corridor. Access management and alternative intersections will be the key to keeping US operating efficiently both now and in the future. 18
21 DRAFT US CORRIDOR STUDY TRAFFIC ANALYSIS REPORT 7. Appendix 7.1 APPENDIX A A1 Existing Scenario 1 Laneage A2 Existing Scenario 1 Traffic Volumes A3 Future Scenario 1A Laneage A4 -- Future Scenario 1B Laneage A5 Future Scenario 1C Laneage A6 Future Scenario 1A 1C Traffic Volumes A7 Future Scenario 2 Laneage A8 Future Scenario 2 Traffic Volumes A9 Strategic Corridor Documentation A10 Approved Development Concept Map 19
22 Fordham Blvd NB Ramp (NC 54) Fordham Blvd SB Ramp (NC 54) Culbreth Rd Mt Carmel Church Rd Arlen Park Dr Bennett Rd Market St Dogwood Acres Dr Smith Level Rd Smith Level Rd Old Lystra Rd Manns Chapel Rd Plaza Dr MATCH LINE A Appendix A1: Existing Scenario 1 Laneage
23 US MATCH LINE A Polks Landing Rd Lystra Rd Briar Chapel Pkwy Vickers Rd Jack Bennett Rd Taylor Rd Andrews Store Rd Morris Rd Village Way Weathersfield Rd Mt. Gilead Church Rd MATCH LINE B Appendix A1: Existing Scenario 1 Laneage
24 MATCH LINE B Hamlet Chapel Rd East Cotton Rd Bynum Rd Moore Mountain Rd Durham Eubanks Rd Russell Chapel Church Rd Northwood High School Rd Channelized US 64 Bypass WB On-Ramp US 64 Bypass WB Off-Ramp Channelized US 64 Bypass EB Off-Ramp US 64 Bypass EB On-Ramp Appendix A1: Existing Scenario 1 Laneage
25 Fordham Blvd WB Ramp (NC 54) 118 (168) 281 (481) 56 (45) 2 (3) 526 (1102) Fordham Blvd EB Ramp (NC 54) 734 (1527) 47 (56) 1 (0) 300 (290) 1130 (269) 417 (108) Culbreth Rd 0 (5) 269 (283) 111 (205) 697 (1147) 220 (458) 1012 (451) 1058 (824) 514 (292) 128 (87) 18 (18) Mt Carmel Church Rd 177 (111) 70 (85) 59 (59) 60 (57) 1379 (872) 9 (21) Arlen Park Dr 71 (123) 691 (1092) 10 (9) 4 (2) 12 (14) 96 (51) Bennett Rd 118 (94) 14 (18) 5 (6) 332 (218) 439 (933) 22 (3) 5 (4) 1324 (854) 60 (94) Market St 286 (382) 46 (77) 26 (87) 428 (973) 1 (5) 16 (14) 115 (96) 1082 (572) Dogwood Acres Dr 61 (64) 4(15) 1 (0) 4 (14) 1175 (613) Smith Level Rd 14 (58) 409 (891) 6 (0) 10 (11) 0 (5) 2 (1) 3 (1) 1 (0) Smith Level Rd 64 (33) 1 (0) 243 (384) 3 (2) 277 (254) 1084 (570) 5 (1) 569 (1238) 59 (33) 0 (1) 24 (67) 40 (176) Old Lystra Rd 0 (1) 1320 (749) 108 (55) Manns Chapel Rd 56 (220) 419 (913) 45 (166) 1 (2) 51 (49) 7 (73) 59 (159) Plaza Dr 310 (117) XX AM Peak Hour Traffic Volumes 50 (61) 94 (58) 4 (28) 46 (152) 1066 (597) 68 (44) (XX) PM Peak Hour Traffic Volumes MATCH LINE A Appendix A2: Existing Scenario 1 Traffic Volumes
26 US MATCH LINE A 22 (36) 580 (1094) 6 (13) Polks Landing Rd 39 (19) 21 (13) 432 (889) 131 (218) 6 (22) 1165 (746) 133 (176) 62 (91) Lystra Rd Briar Chapel Pkwy 44 (76) 455 (917) 24 (10) 2 (2) 9 (31) 1038 (592) 46 (26) 24 (16) 0 (0) 6 (10) Vickers Rd 84 (45) 0 (0) 38 (21) 463 (940) 45 (65) 0 (2) 0 (1) 22 (29) 1014 (598) 7 (11) 63 (45) 192 (162) Jack Bennett Rd 0 (1) 973 (542) 202 (109) Taylor Rd 11 (17) 1170 (647) 3 (7) 652 (1116) 5 (5) 17 (15) Andrews Store Rd 2 (5) 134 (68) 944 (552) 246 (159) 423 (972) 237 (112) 114 (83) Morris Rd 5 (16) 511 (908) 36 (132) 2 (4) 118 (136) 1 (3) 28 (30) Village Way 0 (1) 15 (5) 2 (1) 9 (7) 2 (7) 945 (480) 24 (31) 509 (939) 29 (41) 25 (51) 24 (54) Weathersfield Rd XX (XX) AM Peak Hour Traffic Volumes PM Peak Hour Traffic Volumes 947 (483) 37 (44) 142 (80) 16 (25) Mt. Gilead Church Rd 1 (3) 842 (447) 21 (17) 470 (870) 63 (123) MATCH LINE B Appendix A2: Existing Scenario 1 Traffic Volumes
27 MATCH LINE B Hamlet Chapel Rd 39 (29) 458 (853) 1 (3) 0 (7) 0 (3) 2 (3) East Cotton Rd 35 (19) 0 (3) 52 (36) 4 (12) 66 (40) 811 (438) 2 (7) 490 (836) 15 (33) 2 (10) 31 (22) 13 (12) Bynum Rd 0 (1) 851 (462) 8 (5) Moore Mountain Rd 9 (6) 495 (870) 1 (4) 5 (2) 3 (2) 8 (9) Durham Eubanks Rd 6 (7) 3 (3) 114 (42) 1 (1) 63 (78) 835 (477) 4 (15) Russell Chapel Church Rd 2 (1) 27 (47) 631 (905) 1 (0) 78 (32) 72 (43) 19 (32) 843 (546) Northwood High School Rd 238 (52) 489 (883) 8 (2) 5 (1) 52 (0) 4 (1) Russet Run 125 (53) 1 (0) 166 (95) 1 (1) 281 (73) 756 (530) 57 (2) US 64 Bypass WB On-Ramp 144 (194) 516 (786) 147 (51) 0 (2) 47 (61) US 64 Bypass WB Off-Ramp 77 (42) 487 (806) 1 (1) 48 (81) 948 (555) US 64 Bypass EB Off-Ramp US 64 Bypass EB On-Ramp 237 (114) 0 (1) 113 (77) 760 (523) 67 (70) XX (XX) AM Peak Hour Traffic Volumes PM Peak Hour Traffic Volumes Appendix A2: Existing Scenario 1 Traffic Volumes
28 US Fordham Blvd (NC 54) Fordham Blvd (NC 54) Culbreth Rd Mt Carmel Church Rd SR 1994 SR 1008 Arlen Park Dr Bennett Rd SR 1913 SR 1913 MATCH LINE A Appendix A3 : Future Scenario 1A Laneage
29 US US MATCH LINE A Market St Proposed Obey s Creek Driveway Dogwood Acres Dr SR 1962 Smith Level Road SR 1919 Walmart Driveway Smith Level Road Old Lystra Rd SR 1724 MATCH LINE B Appendix A3 : Future Scenario 1A Laneage
30 US MATCH LINE B Manns Chapel Rd SR 1532 Plaza Dr Holly Ridge Rd. Extension Williams Corner Driveway Center Driveway Polks Landing Rd Williams Corner SR 1530 Sneeden Rd Lystra Rd SR 1721 MATCH LINE C Appendix A3 : Future Scenario 1A Laneage
31 US MATCH LINE C Briar Chapel Pkwy Vickers Rd SR 1719 Jack Bennett Rd SR 1717 Taylor Rd SR 1529 Andrews Store Rd SR 1528 MATCH LINE D Appendix A3 : Future Scenario 1A Laneage
32 MATCH LINE D Morris Rd SR 1527 Village Way Weathersfield Rd SR 1807 Mt. Gilead Church Rd SR 1700 Hamlet Chapel Rd SR 1525 East Cotton Rd MATCH LINE E Appendix A3 : Future Scenario 1A Laneage
33 MATCH LINE E Bynum Ridge Rd SR 1713 Moore Mountain Rd Durham Eubanks Rd SR 1524 SR SR 1708 Russell Chapel Church Rd SR 1520 Proposed Chatham Park Driveway MATCH LINE F Appendix A3 : Future Scenario 1A Laneage
34 MATCH LINE F Northwood High School Rd Russet Run SR 1599 SR 1658 US 64 US 64 Appendix A3 : Future Scenario 1A Laneage
35 US Fordham Blvd (NC 54) Fordham Blvd (NC 54) Culbreth Rd Mt Carmel Church Rd SR 1994 SR 1008 *Laneage Matches Appendix A3 from this Point to US 64 Appendix A4: Future Scenario 1B Laneage
36 US Fordham Blvd (NC 54) Fordham Blvd (NC 54) Culbreth Rd Mt Carmel Church Rd SR 1994 SR 1008 Arlen Park Dr Bennett Rd SR 1913 SR 1913 MATCH LINE A Appendix A5: Future Scenario 1C Laneage
37 US US MATCH LINE A Market St Proposed Obey s Creek Driveway Dogwood Acres Dr SR 1962 Smith Level Road SR 1919 Walmart Driveway Smith Level Road Old Lystra Rd SR 1724 Manns Chapel Rd SR 1532 Plaza Dr *Laneage Matches Appendix A3 from this Point to US 64 Appendix A5: Future Scenario 1C Laneage
38 US (24) 2182 (1492) 90 (167) 75 (86) 2170 (1346) 200 (216) 1707 (874) 1455 (1044) 189 (400) 580 (1057) 99 (76) 1044 (1355) Fordham Blvd (NC 54) 388 (443) 1914 (561) Fordham Blvd (NC 54) 1548 (2263) 76 (149) (130) 595 (561) 448 Culbreth Rd 157 (232) 1341 (1849) 498 (743) Mt Carmel Church Rd SR 1994 SR (162) 168 (157) 86 (94) 743 (410) 158 (167) 216 (199) Arlen Park Dr 132 (202) 1488 (1879) 23 (61) Bennett Rd SR 1913 SR (132) 23 (39) 23 (22) 61 (24) 39 (23) 168 (90) XX (XX) AM Peak Hour Volume PM Peak Hour Volume MATCH LINE A Appendix A6: Future Scenario 1A - 1C Traffic Volumes
39 US US (118) 1576 (1251) 84 (108) 0 (2) 2035 (1450) 272 (108) 2 (0) 17 (19) 1697 (1041) 964 (640) 1056 (764) 106 (156) MATCH LINE A Market St 492 (367) 952 (1687) 235 (147) 387 (235) 10 (25) 108 (84) Obey s Creek Driveway 367 (492) 10 (10) 118 (203) 81 (120) 1125 (1682) 2 (8) Dogwood Acres Dr SR (83) 10 (19) Smith Level Road 249 (370) 812 (1213) 144 (251) 16 (11) 247 (80) 120 (73) 200 (153) Walmart Driveway SR (249) 55 (125) 700 (933) 1514 (2158) 103 (62) 0 (2) 61 (111) 108 (292) Old Lystra Rd SR 1724 XX (XX) AM Peak Hour Volume PM Peak Hour Volume MATCH LINE B Appendix A6: Future Scenario 1A - 1C Traffic Volumes
40 US (1080) 130 (66) 7 (28) 300 (185) 1727 (1060) 154 (139) 98 (66) 2051 (1291) 47 (26) 2080 (1334) 75 (49) MATCH LINE B Mann s Chapel Rd 422 (319) 1081 (1624) 110 (182) 2 (4) 162 (110) 173 (108) 139 (237) Plaza Rd SR (393) 88 (173) 185 (331) Holly Ridge Extension Driveway 126 (70) 10 (10) 25 (35) 24 (96) 1317 (2025) 65 (64) 10 (10) 50 (74) Williams Corner Driveway 46 (65) 1299 (1985) 47 (182) 11 (23) Polks Landing Rd 39 (48) Williams Corner SR (82) Polks Landing Rd 1088 (1861) 288 (253) 223 (278) 92 (176) Lystra Rd SR 1721 XX AM Peak Hour Volume (XX) PM Peak Hour Volume MATCH LINE C Appendix A6: Future Scenario 1A - 1C Traffic Volumes
41 US (2) 1947 (1137) 214 (153) 0 (2) 106 (95) 1914 (1057) 23 (75) 0 (0) 319 (292) 1777 (1115) 238 (244) 2028(1209) MATCH LINE C Briar Chapel Pkwy 163 (151) 970 (1782) 21 (52) 4 (4) 33 (41) 10 (10) 23 (25) Vickers Rd 131 (163) 10 (10) 55 (206) SR (1915) 88 (96) 0 (4) 96 (88) 153 (234) Jack Bennett Rd SR (133) 1030 (2018) Taylor Rd SR (83) 245 (238) 338 (489) 937 (1767) Andrews Store Rd SR (338) 292 (319) XX (XX) AM Peak Hour Volume PM Peak Hour Volume MATCH LINE D Appendix A6: Future Scenario 1A - 1C Traffic Volumes
42 0 (6) 1635 (949) 89 (67) 1844 (1106) 90 (49) 45 (62) 1793 (158) 99 (92) 163 (148) 1573 (935) 10 (8) MATCH LINE D Morris Rd 61 (129) 1045 (1775) 123 (174) 174 (214) 4 (7) 92 (121) Village Way SR (112) 7 (4) 62 (76) 1099 (1878) 100 (94) 93 (100) 49 (89) Weathersfield Rd SR (1668) 206 (299) 299 (206) 67 (89) Mt. Gilead Church Rd SR 1700 Hamlet Chapel Rd 79 (138) 922 (1612) 8 (13) 2 (0) 13 (8) 6 (6) 8 (10) East Cotton Rd SR (79) 6 (6) 148 (163) XX (XX) AM Peak Hour Volume PM Peak Hour Volume MATCH LINE E Appendix A6: Future Scenario 1A - 1C Traffic Volumes
43 0 (2) 1693 (1046) 24 (26) 4 (2) 88 (138) 1418 (913) 166 (106) 2 (2) 86 (110) 1615 (1027) 54 (85) MATCH LINE E 1052 (1732) 26 (57) 4 (20) 53 (48) 30 (35) Bynum Ridge Rd SR 1713 Moore Mountain Rd 29 (58) 1035 (1667) 18 (44) 2 (0) Durham Eubanks Rd SR 1524 SR SR (29) 7 (8) 180 (86) 44 (18) 8 (6) 85 (54) Russell Chapel Church Rd SR (73) 87 (98) 66 (99) 1006 (1710) 238 (288) 238 (238) 106 (166) Proposed Chatham Park Driveway XX (XX) AM Peak Hour Volume PM Peak Hour Volume MATCH LINE F Appendix A6: Future Scenario 1A - 1C Traffic Volumes
44 300 (145) 1264 (918) 197 (220) 850 (783) 513 (261) MATCH LINE F Northwood High School Rd 234 (125) 740 (1186) 145 (332) Russet Run SR 1599 SR (96) 50 (10) 175 (194) 258 (145) 10 (10) 220 (196) 280 (648) 855 (930) 570 (432) 339 (613) 307 (287) 1191 (853) US 64 US (947) 408 (596) (357) 648 (307) 287 XX (XX) AM Peak Hour Volume PM Peak Hour Volume Appendix A6: Future Scenario 1A - 1C Traffic Volumes
45 US Fordham Blvd (NC 54) Fordham Blvd (NC 54) Culbreth Rd Mt Carmel Church Rd SR 1994 SR 1008 Arlen Park Dr Bennett Rd SR 1913 SR 1913 MATCH LINE A Appendix A7 : Future Scenario 2 Laneage
46 US US MATCH LINE A Market St Obey s Creek Driveway Dogwood Acres Dr SR 1962 Smith Level Road SR 1919 Walmart Driveway Smith Level Road Old Lystra Rd SR 1724 MATCH LINE B Appendix A7 : Future Scenario 2 Laneage
47 US MATCH LINE B Manns Chapel Rd SR 1532 Plaza Dr Holly Ridge Rd Extension Center Driveway Polks Landing Rd SR 1530 South Driveway Polks Landing Rd Lystra Rd SR 1721 MATCH LINE C Appendix A7 : Future Scenario 2 Laneage
48 US MATCH LINE C Briar Chapel Pkwy SR 1634 Vickers Rd SR 1719 Jack Bennett Rd SR 1717 Taylor Rd SR 1529 Andrews Store Rd SR 1528 MATCH LINE D Appendix A7 : Future Scenario 2 Laneage
49 MATCH LINE D Morris Rd SR 1527 Village Way Weathersfield Rd SR 1807 Mt. Gilead Church Rd SR 1700 Hamlet Chapel Rd E. Cotton Rd SR 1525 SR 1525 MATCH LINE E Appendix A7 : Future Scenario 2 Laneage
50 MATCH LINE E Bynum Ridge Rd SR 1713 Moore Mountain Rd Durham Eubanks Rd SR 1524 SR SR 1708 Russell Chapel Church Rd SR 1520 Proposed Chatham Park Driveway MATCH LINE F Appendix A7 : Future Scenario 2 Laneage
51 MATCH LINE F Northwood HS Russet Run SR 1599 SR 1658 US 64 US 64 Appendix A7 : Future Scenario 2 Laneage
52 US (400) 580 (1057) 99 (76) Fordham Blvd (NC 54) 1044 (1355) 388 (443) 1914 (561) Fordham Blvd (NC 54) 1548 (2263) 76 (149) (130) 595 (561) (874) 1455 (1044) 374 (366) 3162(1918) 315 (399) 1557 (2048) 498 (743) Culbreth Rd (413) (776) Mt Carmel Church Rd SR 1994 SR (2142) 417 (319) 75 (86) 2419 (1508) 368 (373) 171 (225) 1656 (1969) 23 (61) 207 (113) 2445 (1648) Arlen Park Dr 268 (137) Bennett Rd SR 1913 (193) 248 SR (1991) 225 (171) 22 (24) 2384 (1624) 113 (206) XX (XX) AM Peak Hour Volume PM Peak Hour Volume 118 (131) 2330 (1978) MATCH LINE A Appendix A8 : Future Scenario 2 Traffic Volumes
53 US US MATCH LINE A 502 (392) 1060 (1793) 235 (147) Market St (705) (344) Obey s Creek Driveway 203 (118) 1943 (1765) 94 (118) 1178 (1996) 377 (502) 81 (120) 1125 (1682) Dogwood Acres Dr SR 1962 (102) (1701) 75 (83) 17 (19) 1772 (1124) 320 (226) 1683 (1093) 369 (443) 1012 (1366) 144 (251) Smith Level Road SR 1919 (1307) (306) Walmart Driveway 1712 (2299) 435 (374) 964 (640) 1436 (1013) 161 (281) 108 (292) 2096 (1561) 1622 (2450) 103 (62) 169 (403) Old Lystra Rd SR (1450) 272 (108) XX (XX) AM Peak Hour Volume PM Peak Hour Volume MATCH LINE B Appendix A8 : Future Scenario 2 Traffic Volumes
54 1100 (2013) US MATCH LINE B 319 (345) 2309 (1563) 595 (427) 1229 (1861) 110 (182) Mann s Chapel Rd 474 (455) Plaza Rd SR 1532 (897) (185) 2154 (1453) 242 (312) 1412 (2192) 508 (566) Holly Ridge Rd Extension 24 (96) 1317 (2146) 65 (64) 50 (74) Center Driveway 126 (70) 35 (25) 1900 (1250) 75 (49) 46 (65) 1245 (2008) 111 (172) Polks Landing Rd 39 (105) Williams Corner SR 1530 (82) 51 Polks Landing Rd 98 (41) 2026 (1251) 47 (66) 288 (253) 1296 (2090) 1948 (1080) 418 (319) 223 (278) 92 (176) Lystra Rd SR 1721 XX (XX) AM Peak Hour Volume PM Peak Hour Volume MATCH LINE C Appendix A8 : Future Scenario 2 Traffic Volumes
55 US (292) 2266 (1453) 238 (244) 2161 (1292) 1947 (1137) 214 (153) 153 (234) 2043 (1225) 1048 (2013) 145 (173) 106 (95) 2049 (1220) 33 (85) 33 (35) 2082 (1261) MATCH LINE C 173 (161) 997 (1807) 21 (53) Briar Chapel Pkwy 66 (76) Vickers Rd (379) 196 SR (2149) 88 (96) 249 (322) Jack Bennett Rd SR (133) 1030 (2018) Taylor Rd SR 1529 (321) (2256) 133 (83) 338 (489) 937 (1767) Andrews Store Rd SR 1528 (657) (2086) 489 (338) XX (XX) AM Peak Hour Volume PM Peak Hour Volume MATCH LINE D Appendix A8 : Future Scenario 2 Traffic Volumes
56 163 (148) 1713 (1014) 16 (14) 14 (16) 1726 (1022) 1635 (949) 89 (67) 67 (89) 1934 (1155) 1844 (1106) 90 (49) 49 (89) 1937 (1206) 45 (62) 1922 (1170) 106 (96) 96 (128) 2096 (1384) MATCH LINE D 65 (136) 1137 (1896) 123(174) Morris Rd SR 1527 (192) (342) Village Way 1199 (1972) 136 (116) 1148 (1967) 100 (94) 142 (189) Weathersfield Rd SR (1757) 206 (299) 366 (295) Mt. Gilead Church Rd SR (144) 932 (1622) 8 (13) Hamlet Chapel Rd SR 1525 (248) (24) E Cotton Rd SR 1525 XX (XX) AM Peak Hour Volume PM Peak Hour Volume 1078 (1785) 146 (85) MATCH LINE E Appendix A8 : Future Scenario 2 Traffic Volumes
57 86 (110) 1675 (1056) 61 (93) 93 (60) 1719 (1074) 1693 (1046) 24 (26) 30 (35) 1746 (1094) US (138) 1519 (988) 166 (106) 106 (166) 1757 (1226) MATCH LINE E 1082 (1767) 26 (57) 83 (83) Bynum Ridge Rd SR (64) 1122 (1721) 18 (44) Moore Mountain Rd 137 (78) Durham Eubanks Rd SR 1524 (123) 245 SR SR (1807) 67 (37) Russell Chapel Church Rd SR 1520 (171) (99) 1114 (1588) 238 (288) 344 (404) Park Driveway Proposed Chatham 1199 (1686) 101 (73) XX (XX) AM Peak Hour Volume PM Peak Hour Volume MATCH LINE F Appendix A8 : Future Scenario 2 Traffic Volumes
58 850 (783) 513 (261) 300 (145) 1414 (1041) 247 (230) 230 (206) 1672 (1159) MATCH LINE F 244 (135) 960 (1382) 145 (332) Northwood HS 488 (351) Russet Run SR 1599 (300) 375 SR (1576) 200 (106) 280 (648) 855 (930) 570 (432) 339 (613) 307 (287) 1191 (853) US 64 US (596) 786 (947) (357) 648 (307) 287 XX (XX) AM Peak Hour Volume PM Peak Hour Volume Appendix A8 : Future Scenario 2 Traffic Volumes
59 A9 Strategic Corridor Documentation
60
61 NORTH CAROLINA DEPARTMENT OF TRANSPORTATION FACILITY TYPES Listed in Order of Mobility Function Adopted by the North Carolina Board of Transportation September 2, 2004 Boulevards Functional Purpose: Moderate Mobility, Low to Moderate Access AASHTO Design Classification: Arterial or Collector Posted Speed Limit: 30 mph to 55 mph US 70 east of Clayton NC 24 (Harris Boulevard) in Charlotte Control of Access: Limited, Partial, or None Traffic Signals: Allowed Driveways: Limited Control of Access - Not Allowed Partial Control of Access - One Driveway Connection per Parcel; Consolidate and/or Share Driveways and Limit Access to Connecting Streets or Service Roads; Restrict to Right-in/Right-out Cross-Section: Minimum 2 Lanes with a Median Connections: At-Grade Intersections for Major and Minor Cross Streets (Occasional Interchange at Major Crossing); Use of Acceleration and Deceleration Lanes US 74 near Ranger Cary Parkway Median Crossovers: Allowed; Minimum Spacing between All-Movement Crossovers is 2000 feet (posted speed limit of greater than 45 mph) or 1200 feet (posted speed limit of 45 mph or less) Examples: US 70 between Clayton and Smithfield, NC 55 (Holly Springs Bypass), NC 11 (Kenansville Bypass), NC 87 (Elizabethtown Bypass), US 158 (Murfreesboro Bypass), US 70 near Havelock, NC 24 (Harris Boulevard) in Charlotte, US 1 (Capital Blvd) in Raleigh, US 74 through Monroe, US 117 south of Goldsboro, US 70 east of Goldsboro, Cary Parkway, NC 132 (College Road) in Wilmington, Lochmere Drive in Cary, US 74 in Ranger
62 A10 Approved Development Concept Map
63
V. DEVELOPMENT OF CONCEPTS
 Martin Luther King, Jr. Drive Extension FINAL Feasibility Study Page 9 V. DEVELOPMENT OF CONCEPTS Throughout the study process several alternative alignments were developed and eliminated. Initial discussion
Craig Scheffler, P.E., PTOE HNTB North Carolina, P.C. HNTB Project File: Subject
 TECHNICAL MEMORANDUM To Kumar Neppalli Traffic Engineering Manager Town of Chapel Hill From Craig Scheffler, P.E., PTOE HNTB North Carolina, P.C. Cc HNTB Project File: 38435 Subject Obey Creek TIS 2022
APPENDIX E. Traffic Analysis Report
 APPENDIX E Traffic Analysis Report THIS PAGE INTENTIONALLY BLANK EAGLE RIVER TRAFFIC MITIGATION PHASE I OLD GLENN HIGHWAY/EAGLE RIVER ROAD INTERSECTION IMPROVEMENTS TRAFFIC ANALYSIS Eagle River, Alaska
APPENDIX C1 TRAFFIC ANALYSIS DESIGN YEAR TRAFFIC ANALYSIS
 APPENDIX C1 TRAFFIC ANALYSIS DESIGN YEAR TRAFFIC ANALYSIS DESIGN YEAR TRAFFIC ANALYSIS February 2018 Highway & Bridge Project PIN 6754.12 Route 13 Connector Road Chemung County February 2018 Appendix
TRAFFIC IMPACT ANALYSIS
 TRAFFIC IMPACT ANALYSIS Emerald Isle Commercial Development Prepared by SEPI Engineering & Construction Prepared for Ark Consulting Group, PLLC March 2016 I. Executive Summary A. Site Location The Emerald
LAWRENCE TRANSIT CENTER LOCATION ANALYSIS 9 TH STREET & ROCKLEDGE ROAD / 21 ST STREET & IOWA STREET LAWRENCE, KANSAS
 LAWRENCE TRANSIT CENTER LOCATION ANALYSIS 9 TH STREET & ROCKLEDGE ROAD / 21 ST STREET & IOWA STREET LAWRENCE, KANSAS TRAFFIC IMPACT STUDY FEBRUARY 214 OA Project No. 213-542 TABLE OF CONTENTS 1. INTRODUCTION...
TIMBERVINE TRANSPORTATION IMPACT STUDY FORT COLLINS, COLORADO JANUARY Prepared for:
 TIMBERVINE TRANSPORTATION IMPACT STUDY FORT COLLINS, COLORADO JANUARY 2014 Prepared for: Hartford Companies 1218 W. Ash Street Suite A Windsor, Co 80550 Prepared by: DELICH ASSOCIATES 2272 Glen Haven Drive
To: File From: Adrian Soo, P. Eng. Markham, ON File: Date: August 18, 2015
 Memo To: From: Adrian Soo, P. Eng. Markham, ON : 165620021 Date: Reference: E.C. Row Expressway, Dominion Boulevard Interchange, Dougall Avenue Interchange, and Howard 1. Review of Interchange Geometry
Traffic Engineering Study
 Traffic Engineering Study Bellaire Boulevard Prepared For: International Management District Technical Services, Inc. Texas Registered Engineering Firm F-3580 November 2009 Executive Summary has been requested
Table of Contents INTRODUCTION... 3 PROJECT STUDY AREA Figure 1 Vicinity Map Study Area... 4 EXISTING CONDITIONS... 5 TRAFFIC OPERATIONS...
 Crosshaven Drive Corridor Study City of Vestavia Hills, Alabama Table of Contents INTRODUCTION... 3 PROJECT STUDY AREA... 3 Figure 1 Vicinity Map Study Area... 4 EXISTING CONDITIONS... 5 TRAFFIC OPERATIONS...
EXECUTIVE SUMMARY. The following is an outline of the traffic analysis performed by Hales Engineering for the traffic conditions of this project.
 EXECUTIVE SUMMARY This study addresses the traffic impacts associated with the proposed Shopko redevelopment located in Sugarhouse, Utah. The Shopko redevelopment project is located between 1300 East and
Appendix C-5: Proposed Refinements Rail Operations and Maintenance Facility (ROMF) Traffic Impact Analysis. Durham-Orange Light Rail Transit Project
 Traffic Impact Analysis. Durham-Orange Light Rail Transit Project") Appendix C-5: Proposed Refinements Rail Operations and Maintenance Facility (ROMF) Traffic Impact Analysis Durham-Orange Light Rail Transit Project July 25, 218 ROMF Transportation Impact Analysis Version
Appendix C-5: Proposed Refinements Rail Operations and Maintenance Facility (ROMF) Traffic Impact Analysis Durham-Orange Light Rail Transit Project July 25, 218 ROMF Transportation Impact Analysis Version
INDUSTRIAL DEVELOPMENT
 INDUSTRIAL DEVELOPMENT Traffic Impact Study Plainfield, Illinois August 2018 Prepared for: Seefried Industrial Properties, Inc. TABLE OF CONTENTS Executive Summary 2 Introduction 3 Existing Conditions
Traffic Feasibility Study
 Traffic Feasibility Study Town Center South Robbinsville Township, Mercer County, New Jersey December 19, 2017 Prepared For Robbinsville Township Department of Community Development 2298 Route 33 Robbinsville,
Interstate 85 Widening Phase III Interchange Modification Report Exit 106 E. Cherokee Street. Cherokee County, SC
 Interstate 85 Widening Phase III Interchange Modification Report Exit 16 E. Cherokee Street Cherokee County, SC Prepared for: South Carolina Department of Transportation Prepared by: Stantec Consulting
Signal System Timing and Phasing Program SAMPLE. Figure 1: General Location Map. Second St.
 I. Overview Consultant A was retained by the Ohio Department of Transportation to conduct traffic signal timing analyses on approximately one mile of roadway on between the Main Street and the Fourth Street
Traffic Impact Analysis 5742 BEACH BOULEVARD MIXED USE PROJECT
 Traffic Impact Analysis 5742 BEACH BOULEVARD MIXED USE PROJECT CITY OF BUENA PARK Prepared by Project No. 14139 000 April 17 th, 2015 DKS Associates Jeffrey Heald, P.E. Rohit Itadkar, T.E. 2677 North Main
Lacey Gateway Residential Phase 1
 Lacey Gateway Residential Phase Transportation Impact Study April 23, 203 Prepared for: Gateway 850 LLC 5 Lake Bellevue Drive Suite 02 Bellevue, WA 98005 Prepared by: TENW Transportation Engineering West
Proposed location of Camp Parkway Commerce Center. Vicinity map of Camp Parkway Commerce Center Southampton County, VA
 Proposed location of Camp Parkway Commerce Center Vicinity map of Camp Parkway Commerce Center Southampton County, VA Camp Parkway Commerce Center is a proposed distribution and industrial center to be
TRAFFIC IMPACT STUDY DERRY GREEN CORPORATE BUSINESS PARK MILTON SECONDARY PLAN MODIFICATION
 TRAFFIC IMPACT STUDY DERRY GREEN CORPORATE BUSINESS PARK MILTON SECONDARY PLAN MODIFICATION TRAFFIC IMPACT STUDY DERRY GREEN CORPORATE BUSINESS PARK MILTON SECONDARY PLAN MODIFICATION DECEMBER 24 UPDATED
Traffic Impact Analysis West Street Garden Plots Improvements and DuPage River Park Garden Plots Development Naperville, Illinois
 Traffic Impact Analysis West Street Garden Plots Improvements and DuPage River Park Garden Plots Development Naperville, Illinois Submitted by April 9, 2009 Introduction Kenig, Lindgren, O Hara, Aboona,
Bennett Pit. Traffic Impact Study. J&T Consulting, Inc. Weld County, Colorado. March 3, 2017
 Bennett Pit Traffic Impact Study J&T Consulting, Inc. Weld County, Colorado March 3, 217 Prepared By: Sustainable Traffic Solutions, Inc. http://www.sustainabletrafficsolutions.com/ Joseph L. Henderson,
Traffic Impact Analysis Update
 Willow Bend Traffic Impact Analysis Update TABLE OF CONTENTS Page I. INTRODUCTION -------------------------------------------------------------------------------------------- 1 II. EXISTING CONDITIONS
Shirk Road at State Route 198 Interchange Analysis Tulare County, California
 Shirk Road at State Route 198 Interchange Analysis Tulare County, California DRAFT REPORT Prepared By Tulare County Association of Governments (TCAG) April 2013 Table of Contents Introduction:... 3 Project
Letter of Transmittal
 Letter of Transmittal To: Chris Lovell City of Richmond Hill Date: 5/2/6 Job 2582 Re: Richmond Hill-South Bryan County Transportation STudy WE ARE SENDING YOU THE FOLLOWING ITEMS ( attached) ( under separate
Alpine Highway to North County Boulevard Connector Study
 Alpine Highway to North County Boulevard Connector Study prepared by Avenue Consultants March 16, 2017 North County Boulevard Connector Study March 16, 2017 Table of Contents 1 Summary of Findings... 1
King Soopers #116 Thornton, Colorado
 Traffic Impact Study King Soopers #116 Thornton, Colorado Prepared for: Galloway & Company, Inc. T R A F F I C I M P A C T S T U D Y King Soopers #116 Thornton, Colorado Prepared for Galloway & Company
Traffic Impact Statement (TIS)
") Traffic Impact Statement (TIS) Vincentian PUDA Collier County, FL 10/18/2013 Prepared for: Global Properties of Naples Prepared by: Trebilcock Consulting Solutions, PA 2614 Tamiami Trail N, Suite 615 1205
Traffic Impact Statement (TIS) Vincentian PUDA Collier County, FL 10/18/2013 Prepared for: Global Properties of Naples Prepared by: Trebilcock Consulting Solutions, PA 2614 Tamiami Trail N, Suite 615 1205
Traffic Impact Analysis. Yelm East Gateway Planned Action
 Traffic Impact Analysis Planned Action Yelm, Washington November 2014 Traffic Impact Analysis Project Information Project: Prepared for: Evergreen Pacific Fund, LLC Steve Guidinger 2724 Alki Avenue SW,
Escondido Marriott Hotel and Mixed-Use Condominium Project TRAFFIC IMPACT ANALYSIS REPORT
 Escondido Marriott Hotel and Mixed-Use Condominium Project TRAFFIC IMPACT ANALYSIS REPORT Prepared for Phelps Program Management 420 Sixth Avenue, Greeley, CO 80632 Prepared by 5050 Avenida Encinas, Suite
MEMORANDUM. Figure 1. Roundabout Interchange under Alternative D
 MEMORANDUM Date: To: Liz Diamond, Dokken Engineering From: Subject: Dave Stanek, Fehr & Peers Western Placerville Interchanges 2045 Analysis RS08-2639 Fehr & Peers has completed a transportation analysis
TRAFFIC CALMING PROGRAM
 TRAFFIC CALMING PROGRAM PROGRAM BASICS Mount Pleasant Transportation Department 100 Ann Edwards Lane Mt. Pleasant, SC 29465 Tel: 843-856-3080 www.tompsc.com The Town of Mount Pleasant has adopted a traffic
Evaluation Considerations and Geometric Nuances of Reduced Conflict U-Turn Intersections (RCUTs)
") Evaluation Considerations and Geometric Nuances of Reduced Conflict U-Turn Intersections (RCUTs) 26 th Annual Transportation Research Conference Saint Paul RiverCentre May 20, 2015 Presentation Outline
Evaluation Considerations and Geometric Nuances of Reduced Conflict U-Turn Intersections (RCUTs) 26 th Annual Transportation Research Conference Saint Paul RiverCentre May 20, 2015 Presentation Outline
MILLERSVILLE PARK TRAFFIC IMPACT ANALYSIS ANNE ARUNDEL COUNTY, MARYLAND
 MILLERSVILLE PARK TRAFFIC IMPACT ANALYSIS ANNE ARUNDEL COUNTY, MARYLAND Prepared for: Department of Public Works Anne Arundel County Prepared by: URS Corporation 4 North Park Drive, Suite 3 Hunt Valley,
TRAFFIC IMPACT ANALYSIS SHORTBREAD LOFTS 2009 MODIFICATION Chapel Hill, North Carolina
 TRAFFIC IMPACT ANALYSIS SHORTBREAD LOFTS 2009 MODIFICATION Chapel Hill, North Carolina Prepared for: The Town of Chapel Hill, NC Prepared by: Architects-Engineers-Planners, Inc. November 2009 Traffic Impact
Town of Londonderry, New Hampshire NH Route 28 Western Segment Traffic Impact Fee Methodology
 Town of Londonderry, New Hampshire NH Route 28 Western Segment Traffic Impact Fee Methodology Prepared by the Londonderry Community Development Department Planning & Economic Development Division Based
Environmental Assessment Derry Road and Argentia Road Intersection
 Air and Noise Study Environmental Assessment Derry Road and Argentia Road Intersection Project 11-4295 City of Mississauga, Region of Peel October 17, 2014 1 Region of Peel Environmental Assessment for
Transportation & Traffic Engineering
 Transportation & Traffic Engineering 1) Project Description This report presents a summary of findings for a Traffic Impact Analysis (TIA) performed by A+ Engineering, Inc. for the Hill Country Family
TRAFFIC IMPACT STUDY FOR SONIC DRIVE-IN RESTAURANT. Vallejo, CA. Prepared For:
 TRAFFIC IMPACT STUDY FOR SONIC DRIVE-IN RESTAURANT Vallejo, CA Prepared For: ELITE DRIVE-INS, INC. 2190 Meridian Park Blvd, Suite G Concord, CA 94520 Prepared By: KD Anderson & Associates 3853 Taylor Road,
2016 Traffic Signal System Performance Metrics Update Kumar Neppalli, Traffic Engineering, Public Works John Richardson, Planning and Sustainability
 2016 Traffic Signal System Performance Metrics Update Kumar Neppalli, Traffic Engineering, Public Works John Richardson, Planning and Sustainability Executive Summary: The purpose of this biennial report
Table of Contents. Traffic Impact Analysis Capital One Building at Schilling Place
 Traffic Impact Analysis Capital One Building at Schilling Place Table of Contents Executive Summary... 1 1. Introduction... 4 2. Project Description... 4 3. Background Information... 4 4. Study Scope...
MINERVA PARK SITE TRAFFIC IMPACT STUDY M/I HOMES. September 2, 2015
 5500 New Albany Road Columbus, Ohio 43054 Phone: 614.775.4500 Fax: 614.775.4800 Toll Free: 1-888-775-EMHT emht.com 2015-1008 MINERVA PARK SITE TRAFFIC IMPACT STUDY M/I HOMES September 2, 2015 Engineers
TRANSPORTATION MASTER PLAN AND TRANSPORTATION IMPACT ASSESSMENT FOR THREE SISTERS MOUNTAIN VILLAGE RESORT CENTRE ASP
 TRANSPORTATION MASTER PLAN AND TRANSPORTATION IMPACT ASSESSMENT FOR THREE SISTERS MOUNTAIN VILLAGE RESORT CENTRE ASP OCTOBER 2016 STANDARD LIMITATIONS This report was prepared by MMM Group Limited, a WSP
Date: February 7, 2017 John Doyle, Z-Best Products Robert Del Rio. T.E. Z-Best Traffic Operations and Site Access Analysis
 Memorandum Date: February 7, 07 To: From: Subject: John Doyle, Z-Best Products Robert Del Rio. T.E. Z-Best Traffic Operations and Site Access Analysis Introduction Hexagon Transportation Consultants, Inc.
BROWARD BOULEVARD CORRIDOR TRANSIT STUDY
 BROWARD BOULEVARD CORRIDOR TRANSIT STUDY FM # 42802411201 EXECUTIVE SUMMARY July 2012 GOBROWARD Broward Boulevard Corridor Transit Study FM # 42802411201 Executive Summary Prepared For: Ms. Khalilah Ffrench,
Tongaat Hullette Developments - Cornubia Phase 2. Technical Note 02 - N2/M41 AIMSUN Micro-simulation Analysis
 Technical Note 02 - N2/M41 AIMSUN Micro-simulation Tongaat Hullette Developments Cornubia Phase 2 Technical Note 02 - N2/M41 AIMSUN Micro-simulation Analysis Prepared by: 18/11/14 Justin Janki Date Approvals
L1TILE BEARS DAY CARE TRANSPORTATION IMPACT STUDY FORT COLLINS, COLORADO MAY Prepared for:
 L1TILE BEARS DAY CARE TRANSPORTATION IMPACT STUDY FORT COLLINS, COLORADO MAY 2012 Prepared for: Hillside Construction, Inc. 216 Hemlock Street, Suite B Fort Collins, CO 80534 Prepared by: DELICH ASSOCIATES
NEWCASTLE MIDDLE SCHOOL Traffic Impact Analysis
 Gibson Traffic Consultants 2802 Wetmore Avenue Suite 220 Everett, WA 98201 425.339.8266 NEWCASTLE MIDDLE SCHOOL Traffic Impact Analysis Prepared for: Renton School District Jurisdiction: City of Newcastle
Creditview Road Schedule C Class Environmental Assessment Traffic Operations Analysis Final Report
 Capability City of Mississauga Creditview Road Schedule C Class Environmental Assessment Traffic Operations Analysis Final Report Prepared by: AECOM 5080 Commerce Boulevard 905 238 0007 tel Mississauga,
TRAFFIC IMPACT STUDY DERRY GREEN CORPORATE BUSINESS PARK MILTON SECONDARY PLAN MODIFICATION
 TRAFFIC IMPACT STUDY DERRY GREEN CORPORATE BUSINESS PARK MILTON SECONDARY PLAN MODIFICATION TRAFFIC IMPACT STUDY DERRY GREEN CORPORATE BUSINESS PARK MILTON SECONDARY PLAN MODIFICATION DECEMBER 2014 UPDATED
Mineola Village Green
 Traffic Impact Analysis Report Mineola Village Green 199 2 nd Street Mineola, New York Prepared for Mineola Metro LLC c/o Lalezarian Properties 1999 Marcus Avenue, Suite 310 Lake Success, NY 11042 Prepared
Dulles Corridor Air Rights Study Investigation
 Dulles Corridor Air Rights Study Investigation Fairfax County Board of Supervisors Transportation Committee September 17, 2013 1 On March 19, 2013 the Fairfax County Board of Supervisors asked FCDOT staff
TRAFFIC IMPACT ANALYSIS RIZZO CONFERENCE CENTER EXPANSION FINAL REPORT
 TRAFFIC IMPACT ANALYSIS RIZZO CONFERENCE CENTER EXPANSION Chapel Hill, North Carolina FINAL REPORT Prepared for: The Town of Chapel Hill, NC Prepared by: Architects-Engineers-Planners, Inc. December 2010
4.14 TRANSPORTATION AND CIRCULATION
 4.14 TRANSPORTATION AND CIRCULATION 4.14.1 Summary Table 4.14-1 summarizes the identified environmental impacts, proposed mitigation measures, and residual impacts of the proposed project with regard to
RICHMOND OAKS HEALTH CENTRE 6265 PERTH STREET OTTAWA, ONTARIO TRANSPORTATION BRIEF. Prepared for: Guycoki (Eastern) Limited.
 Limited.") RICHMOND OAKS HEALTH CENTRE 6265 PERTH STREET OTTAWA, ONTARIO TRANSPORTATION BRIEF Prepared for: Guycoki (Eastern) Limited June 16, 2016 116-638 Brief_1.doc D. J. Halpenny & Associates Ltd. Consulting
RICHMOND OAKS HEALTH CENTRE 6265 PERTH STREET OTTAWA, ONTARIO TRANSPORTATION BRIEF Prepared for: Guycoki (Eastern) Limited June 16, 2016 116-638 Brief_1.doc D. J. Halpenny & Associates Ltd. Consulting
APPENDIX B Traffic Analysis
 APPENDIX B Traffic Analysis Rim of the World Unified School District Reconfiguration Prepared for: Rim of the World School District 27315 North Bay Road, Blue Jay, CA 92317 Prepared by: 400 Oceangate,
HIGHWAY 28 FUNCTIONAL DESIGN
 HIGHWAY 28 FUNCTIONAL DESIGN PUBLIC OPEN HOUSE #1 WEDNESDAY, MARCH 12, 2014 Stantec Presenters: Brad Vander Heyden, Project Engineer Neal Cormack, Project Manager Dave Parker, Project Engineer Beth Thola,
RTID Travel Demand Modeling: Assumptions and Method of Analysis
 RTID Travel Demand Modeling: Assumptions and Method of Analysis Overall Model and Scenario Assumptions The Puget Sound Regional Council s (PSRC) regional travel demand model was used to forecast travel
US 70 Corridor Planning for the Future
 New Bern/James City Area - Work Session US 70 Corridor Planning for the Future Brinson Elementary School Thursday, January 31, 2008 Agenda Sign-in, in, View Maps, Talk to Project Team Public Q & A Session
Southern Windsor County 2016 Traffic Count Program Summary April 2017
 Southern Windsor County 2016 Traffic Count Program Summary April 2017 The Southern Windsor County Regional Planning Commission (the RPC ) has been monitoring traffic at 19 locations throughout the southern
I-820 (East) Project Description. Fort Worth District. Reconstruct Southern I-820/SH 121 Interchange
 Project Description. Fort Worth District. Reconstruct Southern I-820/SH 121 Interchange") I-820 (East) Project Description Fort Worth District Reconstruct Southern I-820/SH 121 Interchange I-820 from approximately 2,000 feet north of Pipeline Road/Glenview Drive to approximately 3,200 feet
I-820 (East) Project Description Fort Worth District Reconstruct Southern I-820/SH 121 Interchange I-820 from approximately 2,000 feet north of Pipeline Road/Glenview Drive to approximately 3,200 feet
TALMONT TOWNHOMES MADISON KENNETH SPA TRAFFIC IMPACT STUDY. Sacramento, CA. Prepared For: MBK Homes. Prepared By:
 TALMONT TOWNHOMES MADISON KENNETH SPA TRAFFIC IMPACT STUDY Sacramento, CA Prepared For: MBK Homes Prepared By: KD Anderson & Associates 3853 Taylor Road, Suite G Loomis, California 95650 (916) 660-1555
Section 5.0 ENVIRONMENTAL ANALYSIS
 Section 5.0 ENVIRONMENTAL ANALYSIS 5.2 TRANSPORTATION/CIRCULATION/PARKING This section evaluates potential traffic-related and parking impacts associated with the proposed project. The following discussion
Brigham City 1200 West Box Elder Creek Bridge - Widening Project Type Reconstruction
 Brigham City 1200 West Box Elder Creek Bridge - Widening Project Type Reconstruction 550 North to 650 North $ 1,750,000 $ 1,582,113 To widen an existing bridge on 1200 West over Box Elder Creek that will
Quantitative analyses of weekday a.m. and p.m. commuter hour conditions have been conducted for the following five scenarios:
 6.1 TRANSPORTATION AND CIRCULATION 6.1.1 INTRODUCTION This section of the EIR presents the results of TJKM s traffic impact analysis of the proposed Greenbriar Development. The analysis includes consideration
D & B COMMERCIAL TRAFFIC IMPACT ANALYSIS
 D & B COMMERCIAL TRAFFIC IMPACT ANALYSIS TABLE OF CONTENTS I. Introduction...3 II. Project Description...3 III. Existing Conditions...3 IV. Future Traffic Conditions...8 V. Conclusions and Mitigation...14
Oakbrook Village Plaza City of Laguna Hills
 Oakbrook Village Plaza City of Laguna Hills Traffic Impact Analysis Prepared by: HDR Engineering 3230 El Camino Real, Suite 200 Irvine, CA 92602 October 2012 Revision 3 D-1 Oakbrook Village Plaza Laguna
RTE. 1 at RTE. 637 & RTE. 639
 INTERSECTION SAFETY STUDY Prepared for: Virginia Department of Transportation Central Region Operations Traffic Engineering (UPC #81378, TO 12-092) DAVENPORT Project Number: 13-368 / /2014 RTE. 1 at RTE.
Traffic Impact Study Speedway Gas Station Redevelopment
 Traffic Impact Study Speedway Gas Station Redevelopment Warrenville, Illinois Prepared For: Prepared By: April 11, 2018 Table of Contents 1. Introduction... 1 2. Existing Conditions... 4 Site Location...
TABLE OF CONTENTS EXECUTIVE SUMMARY...1 INTRODUCTION...3 PROJECTED FUTURE GROWTH...3 ROADWAY IMPROVEMENT PROJECTS...4 POTENTIAL FUNDING SOURCES...
 Transportation Impact Fee Study September 2014 TABLE OF CONTENTS EXECUTIVE SUMMARY...1 INTRODUCTION...3 PROJECTED FUTURE GROWTH...3 ROADWAY IMPROVEMENT PROJECTS......4 POTENTIAL FUNDING SOURCES...7 PROPOSED
TABLE OF CONTENTS SECTION PAGE. Executive Summary... xii
 TABLE OF CONTENTS SECTION PAGE Executive Summary... xii 1.0 Introduction... 1 1.1 Study Area... 2 1.2 Traffic Impact Analysis Scenarios... 4 1.3 Study Area - City of Orange... 4 2.0 Project Description
City of Pacific Grove
 Regional Study Utilizing Caltrans Intersection Evaluation Section 7: City of Pacific Grove s: FIRST STREET AT CENTRAL AVENUE Transportation Agency for Monterey County Prepared by Transportation Agency
Traffic Impact Study for the proposed. Town of Allegany, New York. August Project No Prepared For:
 Appendix B SRF Traffic Study (Revised November 2005) Draft Environmental Impact Statement University Commons Town of Allegany, Cattaraugus County, NY December 2005 Traffic Impact Study for the proposed
Section 5.0 Traffic Information
 Section 5.0 Traffic Information 10.0 TRANSPORTATION MDM Transportation Consultants, Inc. (MDM) has prepared an evaluation of transportation impacts for the proposed evaluation for the expansion of the
INTERSECTION CONTROL EVALUATION
 INTERSECTION CONTROL EVALUATION Trunk Highway 22 and CSAH 21 (E Hill Street/Shanaska Creek Road) Kasota, Le Sueur County, Minnesota November 2018 Trunk Highway 22 and Le Sueur CSAH 21 (E Hill Street/Shanaska
Final Traffic Technical Memorandum
 SR 54 Project Development and Environment (PD&E) Study From CR 577 (Curley Road) to CR 579/CR 54 (Morris Bridge Road) Final Traffic Technical Memorandum WPI Segment No: 416561-1 Pasco County Prepared for
TRAFFIC SIGNAL DESIGN REPORT KING OF PRUSSIA ROAD & RAIDER ROAD RADNOR TOWNSHIP PENNSYLVANIA
 TRAFFIC SIGNAL DESIGN REPORT KING OF PRUSSIA ROAD & RAIDER ROAD RADNOR TOWNSHIP PENNSYLVANIA PREPARED FOR: UNIVERSITY OF PENNSYLVANIA HEALTH SYSTEM 34 CIVIC CENTER BOULEVARD PHILADELPHIA, PA 1987 (61)
Clearlake Road (State Road 501) Project Development & Environment (PD&E) Study
 Project Development & Environment (PD&E) Study") Clearlake Road (State Road 501) Project Development & Environment (PD&E) Study FROM MICHIGAN AVENUE TO INDUSTRY ROAD BREVARD COUNTY, FLORIDA Financial Project ID No: 433605-1-22-01 Federal Aid Project
Clearlake Road (State Road 501) Project Development & Environment (PD&E) Study FROM MICHIGAN AVENUE TO INDUSTRY ROAD BREVARD COUNTY, FLORIDA Financial Project ID No: 433605-1-22-01 Federal Aid Project
Major Widening/New Roadway
 Revised Evaluation s Major Widening/New Roadway This page provides a summary of any revisions made to the draft scores presented at the October th Attributable Funds Committee meeting. The information
CHAPTER 9: VEHICULAR ACCESS CONTROL Introduction and Goals Administration Standards
 9.00 Introduction and Goals 9.01 Administration 9.02 Standards 9.1 9.00 INTRODUCTION AND GOALS City streets serve two purposes that are often in conflict moving traffic and accessing property. The higher
2.0 Development Driveways. Movin Out June 2017
 Movin Out June 2017 1.0 Introduction The proposed Movin Out development is a mixed use development in the northeast quadrant of the intersection of West Broadway and Fayette Avenue in the City of Madison.
LATSON INTERCHANGE DEVELOPMENT TRAFFIC STUDIES. Genoa Township, Livingston County, MI
 LATSON INTERCHANGE DEVELOPMENT TRAFFIC STUDIES Genoa Township, Livingston County, MI DRAFT TRAFFIC STUDY FOR I-96 AT LATSON RD INTERCHANGE Livingston County CS 47065 JN 101622C Submitted to: Michigan Department
Table Existing Traffic Conditions for Arterial Segments along Construction Access Route. Daily
 5.8 TRAFFIC, ACCESS, AND CIRCULATION This section describes existing traffic conditions in the project area; summarizes applicable regulations; and analyzes the potential traffic, access, and circulation
Volume 1 Traffic Impact Analysis Turtle Creek Boulevard Dallas, Texas. Kimley-Horn and Associates, Inc. Dallas, Texas.
 Volume 1 Traffic Impact Analysis 2727 Dallas, Texas June 18, 2018 Kimley-Horn and Associates, Inc. Dallas, Texas Project #064523000 Registered Firm F-928 Traffic Impact Analysis 2727 Dallas, Texas Prepared
Proposed CVS/pharmacy
 Traffic Impact and Access Study Proposed CVS/pharmacy West Main Street (Route 1) at Hull Street Clinton, Connecticut PREPARED FOR Arista Development LLC 520 Providence Highway, Suite 9 Norwood, Massachusetts
Mr. Kyle Zimmerman, PE, CFM, PTOE County Engineer
 Los Alamos County Engineering Division 1925 Trinity Drive, Suite B Los Alamos, NM 87544 Attention: County Engineer Dear Kyle: Re: NM 502 Transportation Corridor Study and Plan Peer Review Los Alamos, New
ARVADA TRIANGLE REDEVELOPMENT TRAFFIC IMPACT ANALYSIS
 ARVADA TRIANGLE REDEVELOPMENT TRAFFIC IMPACT ANALYSIS Prepared for: Arvada Urban Renewal Authority 5601 Olde Wadsworth Boulevard, Suite 210 Arvada, Colorado 80002 (720) 898-7062 Prepared by: Felsburg Holt
Final Technical Report US 17 Corridor Study Update (Market Street Road Diet)
") Market Street Road Diet Wilmington, NC 2016 Final Technical Report US 17 Corridor Study Update (Market Street Road Diet) Wilmington, NC Parsons Brinckerhoff January 2016 FINAL TECHNICAL REPORT US 17 Corridor
Market Street Road Diet Wilmington, NC 2016 Final Technical Report US 17 Corridor Study Update (Market Street Road Diet) Wilmington, NC Parsons Brinckerhoff January 2016 FINAL TECHNICAL REPORT US 17 Corridor
US 81 Bypass of Chickasha Environmental Assessment Public Meeting
 US 81 Bypass of Chickasha Environmental Assessment Public Meeting March 14, 2013 Introductions ODOT FHWA SAIC Meeting Purpose Present need for bypass Provide responses to 10/04/11 public meeting comments
The key roadways in the project vicinity are described below. Exhibit displays the existing number of lanes on the study roadways.
 4.2 TRAFFIC AND CIRCULATION This section presents the key assumptions, methods, and results of analysis for the transportation and circulation impacts of the proposed project. This section is based on
Summary of the Alcoa Highway Redevelopment Project
 Appendix B Summary of the Alcoa Highway Redevelopment Project By Marcia Finfer, October 2009 The Timberlake community, along with numerous other concerned citizen groups (including the Lakemoor Hills community)
MANHATTAN VILLAGE ENHANCEMENT PROJECT
 MANHATTAN VILLAGE ENHANCEMENT PROJECT Traffic & Parking Analysis Manhattan Beach City Council September 2013 Study Area and Analyzed Intersections Intersection LOS Results Project Improvements Dedicate
TRAFFIC IMPACT ANALYSIS SAFARI HIGHLANDS RANCH
 TRAFFIC IMPACT ANALYSIS SAFARI HIGHLANDS RANCH, California November 11, 2016 LLG Ref. 3-14-2334 EXECUTIVE SUMMARY The Project proposes the development of 550 luxury residential dwelling units, public trails,
VIRGINIA RAILWAY EXPRESS MANASSAS PARK STATION PARKING EXPANSION. Site Evaluation & Recommendation. October 18, 2016
 MANASSAS PARK STATION PARKING EXPANSION Site Evaluation & Recommendation October 18, 2016 1 INFORMATION ITEM Project Overview Parking Demand Site Evaluation VRE Recommended Preferred Alternative Next Steps
Triangle Mobility Action Partnership (Tri-MAP) Friday, July 18, 2014 RDU Airport Authority
 Friday, July 18, 2014 RDU Airport Authority") Triangle Mobility Action Partnership (Tri-MAP) Friday, July 18, 2014 RDU Airport Authority Strategic Transportation Investments Prioritization Mark Ahrendsen Durham-Chapel Hill-Carrboro MPO Alex Rickard
Triangle Mobility Action Partnership (Tri-MAP) Friday, July 18, 2014 RDU Airport Authority Strategic Transportation Investments Prioritization Mark Ahrendsen Durham-Chapel Hill-Carrboro MPO Alex Rickard
West Rosslyn Development
 Traffic Impact Study and Transportation Management Plan West Rosslyn Development Arlington County, VA Revised: January 11, 2017 May 10, 2016 Prepared for: Penzance 2400 N Street, NW, Suite 600 Washington,
LCPS Valley Service Center
 Traffic Impact Study LCPS Valley Service Center Loudoun County, Virginia November 4, 2015 Prepared For: Loudoun County Public Schools 21000 Education Court Ashburn, VA 20148 Prepared by: 1140 Connecticut
Traffic Impact Analysis. Alliance Cole Avenue Residential Site Dallas, Texas. Kimley-Horn and Associates, Inc. Dallas, Texas.
 Traffic Impact Analysis Alliance Cole Avenue Residential Site Dallas, Texas February 15, 2018 Kimley-Horn and Associates, Inc. Dallas, Texas Project #064524900 Registered Firm F-928 Traffic Impact Analysis
Interstate Operations Study: Fargo-Moorhead Metropolitan Area Simulation Output
 NDSU Dept #2880 PO Box 6050 Fargo, ND 58108-6050 Tel 701-231-8058 Fax 701-231-6265 www.ugpti.org www.atacenter.org Interstate Operations Study: Fargo-Moorhead Metropolitan Area 2015 Simulation Output Technical
TABLE OF CONTENTS 1.0 INTRODUCTION AND SUMMARY Purpose of Report and Study Objectives... 2
 TABLE OF CONTENTS 1.0 INTRODUCTION AND SUMMARY 1 1.1 Purpose of Report and Study Objectives... 2 1.2 Executive Summary... 3 1.2.1 Site Location and Study Area... 3 1.2.2 Development Description... 3 1.2.3