Creditview Road Schedule C Class Environmental Assessment Traffic Operations Analysis Final Report
|
|
|
- Bethany Goodman
- 5 years ago
- Views:
Transcription
1 Capability City of Mississauga Creditview Road Schedule C Class Environmental Assessment Traffic Operations Analysis Final Report Prepared by: AECOM 5080 Commerce Boulevard tel Mississauga, ON, Canada L4W 4P fax Project Number: Date: November 2015
2 AECOM 5600 Cancross Court, Suite A tel Mississauga, ON, Canada L5R 3E fax November 9, 2015 Ms. Dana Glofcheskie, P.Eng Project Manager City of Mississauga 201 City Centre Drive, Suite 800 Mississauga, ON L5B 2T4 Dear Ms. Dana Glofcheskie, Project No: Regarding: Municipal Class Environmental Assessment Study for Creditview Road Traffic Operations Analysis Report AECOM CanadD/WGZDVUHWDLQHGE\WKH&LW\RI0LVVLVVDXJDWRXQGHUWDNHD6FKHGXOHµ& &ODVV Environmental Assessment (EA) Study for improvements to Creditview Road. The limits of the study area extend Bancroft Drive to Old Creditview Road, in the City of Mississauga. Please find enclosed the Traffic Operations Analysis Report as part of the Municipal Class EA process. Should you have any questions or comments regarding this report, please do not hesitate to contact the undersigned. Sincerely, AECOM Canada Ltd. Pranav Dave, P.Eng., PTOE Senior Traffic Engineer, Transportation (Transit & Rail) PD Encl. cc: RPT-Creditview EA Traffic Report _Final Docx
3 AECOM City of Mississauga Creditview Road EA, Traffic Report ± Final Report 'LVWULEXWLRQ/LVW # of Hard Copies PDF Required Association / Company Name 5HYLVLRQ/RJ Revision # Revised By Date Issue / Revision Description 1 RN September 29, 2015 Addressed comments raised by the City 2 RN November 4, 2015 Addressed comments raised by the City $(&206LJQDWXUHV Report Prepared By: Reza Noroozi, M.Sc. Transportation Planner Report Reviewed By: Pranav Dave, P. Eng.,PTOE, Senior Traffic Engineer RPT-Creditview EA Traffic Report _Final Docx i
4 AECOM City of Mississauga Creditview Road EA, Traffic Report Final Report TABLE OF CONTENTS Letter of Transmittal Distribution List P age 1. Introduction Background Purpose of the Study Environmental Assessment Process Study Scope Existing Conditions Existing Road Network Road Characteristics Existing Traffic Conditions Average Daily Traffic (ADT) Data Data Collection and Signal Timing Traffic Operations Analysis Future Conditions Future Traffic Growth Projections Future Total Traffic Volumes Traffic Operations Analysis Do Nothing Alternatives Assessment Interim Design Alternatives Alternative 1: Signalized Design Concept Alternative 2: Roundabout/Signalized Design Concept Alternative 3: Roundabout Design Concept (Preferred Alternative) Ultimate Design Alternatives Alternative 4: Signalized Design Concept Alternative 5: Roundabout Design Concept (Long-term Solution) Future Improvements Preferred Alternative (Interim Roundabout Design Concept) Long-term Solution (Ultimate Roundabout Design Concept) Summary of Conclusions and Recommendations LIST OF FIGURES Figure 1- Municipal Class Environmental Assessment Process... 3 Figure 2- Study Area... 5 Figure 3- Existing Lane Configurations... 9 Figure 4- Existing Traffic Volumes Unbalanced Figure 5- Existing Traffic Volumes Balanced Figure 6- Future 2021 Traffic Volumes (No Widening) Figure 7- Future 2031 Traffic Volumes (No Widening) Figure 8- Future 2021 Traffic Volumes (4-lane Creditview Road Widening) RPT-Creditview EA Traffic Report _Final Docx
5 AECOM City of Mississauga Creditview Road EA, Traffic Report Final Report Figure 9- Future 2031 Traffic Volumes (4-lane Creditview Road Widening) Figure 10- Interim Signalized Design Concept (Alternative 1) Figure 11 - Interim Roundabout/Signalized Design Concept (Alternative 2) Figure 12 - Interim Roundabout Design Concept (Alternative 3) Figure 13 - Ultimate Signalized Design Concept (Alternative 4) Figure 14 - Ultimate Roundabout Design Concept (Alternative 5) Figure 15- Recommended Lane Configurations for the Interim Solution Figure 16- Recommended Lane Configurations for the Long-term Solution LIST OF TABLES Table 1- Turning Movement Counts Inventory... 7 Table 2- Level of Service Descriptions Table 3- Existing Traffic Condition Analysis Table 4- Future Forecast Creditview Road Table 5- Year 2021 Traffic Analysis Do Nothing Table 6- Year 2031 Traffic Analysis Do Nothing Table 7- Year 2021 Traffic Analysis Alternative Table 8- Year 2031 Traffic Analysis Alternative Table 9- Year 2021 Traffic Analysis Alternative Table 10- Year 2031 Traffic Analysis Alternative Table 11- Year 2021 Traffic Analysis Alternative Table 12- Year 2031 Traffic Analysis Alternative Table 13- Future Queuing Summary Year 2031 Alternative Table 14- Year 2031 Traffic Analysis Alternative Table 15 - Analysis Results for the Ultimate Roundabout Design (2031) Table 16- Future Queuing Summary Year 2031 Alternative APPENDICES Appendix A ~ Existing Average Daily Traffic (ADT) Data Appendix B ~ Existing turning movement counts/signal Timings Appendix C ~ Existing Traffic Operation, Synchro Output Sheets Appendix D ~ Future Growth Rate Projections Appendix E ~ Future Traffic Operation and Queuing Analysis RPT-Creditview EA Traffic Report _Final Docx
6 AECOM City of Mississauga Creditview Road EA, Traffic Report Final Report 1. Introduction 1.1 Background AECOM Canada Ltd. was retained by the City of Mississauga to undertake a Schedule C Class Environmental Assessment (EA) Study to examine the opportunity to improve traffic flow, enhance safety and increase roadway capacity on Creditview Road between Bancroft Drive to Old Creditview Road, in the City of Mississauga. The traffic study report assesses the existing traffic conditions at the intersections along Creditview Road between Bancroft Drive and Old Creditview Road; estimates and examines the traffic growth and expected future traffic volumes; analyzes the traffic impacts from the introduction of the projected traffic volumes; and finally proposes infrastructure improvements to address the deficiencies in safety and operations for the 10 year and 20 year future horizon years. 1.2 Purpose of the Study This Class EA study is being undertaken to investigate the need for additional north-south capacity and traffic management improvements along this section of Creditview Road, taking into consideration the road s identification as a part of the City s cultural heritage landscape. The study also considers the future Active Transportation corridor, including a future multi-use trail with connections to other neighbourhoods. Using a Context Sensitive Design approach, this study follows a comprehensive and sound planning process that will recognize the multimodal transportation needs while protecting established parks, recreational areas, communities and businesses, as well as its cultural value. 1.3 Environmental Assessment Process To address the need for improvements to Creditview Road, the City of Mississauga must comply with the requirements of the Municipal Engineers Association (MEA) Municipal Class Environmental Assessment (EA) document (October 2000, as amended in 2011). Approved under the Ontario Environmental Assessment Act, the Municipal Class EA process incorporates the following key principles of EA planning: Consultation with affected parties early in and throughout the process, such that the planning process is a cooperative venture; Consideration of a reasonable range of alternatives, both the functionally different alternatives to and the alternative methods of implementing the solution; Identification and consideration of the effects of each alternative on all aspects of the environment; Systematic evaluation of alternatives in terms of their advantages and disadvantages, to determine their net environmental effects; Provision of clear and complete documentation of the planning process followed, to allow traceability of decision-making with respect to the project. As illustrated in Figure 1, the Municipal Class EA document outlines a five (5) phase planning and design process. Each phase is summarized below: Phase 1 Phase 2 Identify the problem and/or opportunity to be addressed. Identify alternative solutions to address the problem or opportunity by taking into consideration the existing environment, and determine the preferred solution taking into account public and regulatory agency input. RPT-Creditview EA Traffic Report _Final Docx 1
7 AECOM City of Mississauga Creditview Road EA, Traffic Report Final Report Phase 3 Phase 4 Phase 5 Examine alternative methods of implementing the preferred solution, taking into account the existing environment, public and regulatory agency input, anticipated environmental impacts, and methods of minimizing negative impacts and maximizing positive impacts. Document, in an Environmental Study Report (ESR), a summary of the rationale and the planning, design and consultation process undertaken through Phases 1 to 3. The ESR is made available for public and agency review and comment. Complete contract drawings and documents, and proceed to construction and operation. Monitor construction and operation where necessary for adherence to environmental provisions and mitigation. Phase 5 is not part of this study. This phase will be undertaken immediately prior to construction. RPT-Creditview EA Traffic Report _Final Docx 2
8 AECOM City of Mississauga Creditview Road EA, Traffic Report Final Report Figure 1- Municipal Class Environmental Assessment Process Phase 1: Problem or Opportunity Identify and describe the problem or opportunity Problem/Opportunity Statement Phase 2: Alternative Solutions Identify alternative solutions to the problem or opportunity Create an inventory of the natural, social and economic environment existing conditions Evaluate alternative solutions and identify a recommended solution Select the preferred solution Preferred Solution Phase 3: Alternative Design Concepts for Preferred Solution Identify alternative design concepts for the preferred solution Assess impacts of the alternatives on the environment and identify mitigation measures Evaluate alternative designs and identify a recommended design Select the preferred design Preferred Design Phase 4: Environmental Study Report Prepare an Environmental Study Report (ESR) documenting Phases 1-3 Place the ESR on public record 30-day review with opportunity for Part II Order Request Environmental Study Report Phase 5: Implementation Complete drawings and documents Construction and operation Monitor for environmental commitments RPT-Creditview EA Traffic Report _Final Docx 3
9 AECOM City of Mississauga Creditview Road EA, Traffic Report Final Report In addition, the Municipal Class EA document classifies transportation improvements as either Schedule A, A+, B or C projects based on the anticipated level of impact. Each schedule is described as follows: Schedule A Schedule A+ Schedule B Schedule C Projects are limited in scale, have minimal adverse environmental impacts, and require no public notification or documentation. Projects are limited in scale, have minimal adverse environmental impacts, and require no documentation; however, the public is to be advised of the project prior to implementation. Projects have the potential for some adverse environmental impacts. The proponent is required to undertake a screening process, involving mandatory contact with the directly affected public and regulatory agencies, to ensure that they are aware of the project and that their concerns are addressed. Schedule B projects require that a Project File be prepared and made available for public review. Projects have the potential for significant environmental impacts and must proceed under the full planning and documentation procedures of the Municipal Class EA document. Schedule C projects require that an ESR be prepared and filed on the public record for review by the public and regulatory agencies. This study is classified as a Schedule C project, which involves completion of Phases 1 through 4 of the planning and design process (Phase 5 will be completed prior to construction). This Traffic Operation Analysis Report forms Phases 1, 2, and 3 of the project, and the full process will be documented within an ESR. 1.4 Study Scope The site area is shown in Figure 2. This report summarizes the following: Traffic data review, including turning movement counts (TMC), annual average daily traffic volumes (AADT) and relevant traffic study reports; An assessment of the existing traffic operations/conditions at the study area intersections on Creditview Road between Bancroft Drive and Old Creditview Road inclusive for weekday AM and PM peak hours; Identification of deficiencies (if any), which are contributing to the poor existing traffic operations; Projections of the future traffic growth to horizon year 2021 and 2031; The analysis of the traffic impacts resulting from the introduction of the future traffic volumes to the road network (future operational conditions) and 2031 horizon years were used for future forecasts and traffic operations analysis; Assembly of a list of mitigation measures required to address any safety issues and to improve traffic operations in the study area; Evaluation of different design concepts, and discussions about preferred alternative design solution; Discussion of findings, conclusions and remedial measures with City of Mississauga traffic staff; and Documentation and submittal of our findings and recommendations in a report to the City of Mississauga. RPT-Creditview EA Traffic Report _Final Docx 4
10 AECOM City of Mississauga Creditview Road EA, Traffic Report Final Report Figure 2- Study Area RPT-Creditview EA Traffic Report _Final Docx 5
11 AECOM City of Mississauga Creditview Road EA, Traffic Report Final Report 2. Existing Conditions 2.1 Existing Road Network Creditview Road is designated as a Major Collector in the City of Mississauga Official Plan (OP). It is under the jurisdiction of City of Mississauga. It has a posted speed of 60 km/h within the study area. It runs between Derry Road West (northern terminus) and Burnhamthorpe Road West (southern terminus). According to the OP, Major Collectors in neighbourhoods are designed to accommodate moderate volumes of traffic and will be the focus of active transportation facilities. Vehicular access will be designed to minimize conflicts with active transportation modes. In Employment Areas, major collectors are designed to serve a moderate volume of business and goods movement traffic. Vehicular access will be designed to support the efficient flow of goods movement traffic. Where possible, consolidation of access will be encouraged in neighbourhoods and employment areas. Creditview Road has a four (4) lane cross-section for the majority of segments between north of Burnhamthorpe Road West to Derry Road West except the study area i.e. between Bancroft Drive and Old Creditview Road which has two (2) lane cross-section. This two (2) lane cross-section of Creditview Road through the study area represents a major discontinuity in the transportation network. Network continuity is an important aspect of transportation networks and leads to more efficient and adaptable corridors. Improving network continuity supports the key goal of optimizing the existing transportation system Road Characteristics The Creditview Road corridor between Bancroft Drive and Creditview Road is a two (2) lane Major Collector with a posted speed of 60 km/h. The 2011 City of Mississauga Official Plan identifies Creditview Road as having a 30 m designated road allowance in this section. The corridor within the study area has four (4) signalized intersections at Bancroft Drive/Sir Monty s Drive, Kenninghall Boulevard, Argentia Road and Old Creditview Road as well as three (3) unsignalized intersections at Velebit Court, Falconer Drive and Rivergate Place. Side streets crossing Creditview Road within the study area fall into different categories. Velebit Court, Kenninghall Crescent, and Sir Monty Drive are local roads. Rivergate Place is a private driveway, and the rest of the side streets are designated as Minor Collector Road under the jurisdiction of City of Mississauga except for Argentia Road, which is designated as Major Collector Road. The posted speed limit is 60 km/h on all Major Collector roads and 50 km/h for other road categories in the vicinity of Creditview Road in the study area. RPT-Creditview EA Traffic Report _Final Docx 6
12 AECOM City of Mississauga Creditview Road EA, Traffic Report Final Report 2.2 Existing Traffic Conditions Traffic analysis was conducted to determine existing conditions along Creditview Road, including Level of Service (LOS), volume to capacity ratio (v/c). The study area extends on Creditview Road between Old Creditview Road to the north and Sir Monty s/bancroft Drive to the south. The traffic analysis considered the following key study area intersections. Figure 3 shows study area intersections lane configurations. Creditview Road/Bancroft Drive/Sir Monty s Drive (Signalized) Creditview Road/Velebit Court (Unsignalized) Creditview Road/Kenninghall Crescent (Signalized) Creditview Road /Rivergate Place (Unsignalized) Creditview Road/Falconer Drive (Unsignalized) Creditview Road/Argentia Road (Signalized) Creditview Road/Old Creditview Road (Signalized) Average Daily Traffic (ADT) Data The ADT data for the following locations in the study area were provided by the City of Mississauga: Creditview Road between Old Creditview Road and Highway 401 (collected on May 30, 2013) Creditview Road between Velebit Court and Bancroft Drive (collected on May 11, 2010) The AM and PM peak periods for both locations are 7:00-10:00AM and 4:00-7:00PM, respectively. Traffic volume along Creditview Road during mid-day peak period (11:00AM-1:00PM) is significantly lower than the AM and PM peak periods. Detailed ADT data is provided in Appendix A Data Collection and Signal Timing Turning movement counts (TMC) and signal timings for the study area were provided by the City of Mississauga. All the TMCs were recorded on weekdays of Fall 2012 (October and November) or late Winter 2013 (March 19th). Table 1 provides a list of the traffic volume inventory utilized for the existing condition analyses. Detailed TMC are provided in Appendix B. Table 1- Turning Movement Counts Inventory No. Location Intersection Control Date (Month, Day, Yr) Source 1 Creditview Road/Old Creditview Road Signalized March 19, 2013 City of Mississauga 2 Creditview Road/Argentia Road Signalized November 6, 2012 City of Mississauga 3 Creditview Road/Kenninghall Blvd Signalized October 25, 2012 City of Mississauga 4 Creditview Road /Rivergate Place Unsignalized - Calculated 1 5 Creditview Road/Falconer Drive Unsignalized October 24, 2012 City of Mississauga 6 Creditview Road/Velebit Court Unsignalized - Calculated 1 7 Creditview Road/Bancroft Drive/Sir Monty s Drive Signalized March 19, 2013 City of Mississauga Note: 1 Peak hour traffic volumes were generated based on Institute if Transportation Engineers (ITE) trip rates for Single Family Detached Housing located on Velebit Court and Townhouses located on Rivergate Place. The heavy vehicle percentages for the weekday AM and PM peak hours were calculated based on the turning movement counts. Since the existing data was collected on different days, there was an inconsistency between RPT-Creditview EA Traffic Report _Final Docx 7
13 AECOM City of Mississauga Creditview Road EA, Traffic Report Final Report volumes leaving an intersection with volumes arriving to the next intersection. This required a balancing process among the available counts to balance traffic flow. During the balancing process, the observed traffic volumes were further adjusted to maintain the traffic flow conservation i.e. total vehicles entering a location on the network should be equal to those exiting that location. The base unbalanced counts at signalized intersections were computed based on the average of the turning movement counts for the year 2005 and the newer information provided by the City. Volumes at Rivergate Place and Velebit Court were estimated based on ITE trip rates. The volume balancing was then conducted based on review of turning movement counts at the intersections of the study area. Figure 4 and Figure 5 illustrate traffic volumes before and after balancing for AM and PM peak hours. RPT-Creditview EA Traffic Report _Final Docx 8
14 Creditview Road Driveway Old Creditview Road Argentia Road Falconer Drive Former Harris Park Rivergate Place Credit Meadows Park Kenninghall Boulevard Kenninghall Crescent Velebit Court Riverun Park Sir Monty s Drive Bancroft Drive LEGEND Lane Configuration Signalized Intersection Not to Scale Stop Sign Control Project: Creditview Road Environmental Assessment Title: Existing Lane Configuration Figure 3
15 Driveway (16) 3 (5) 0 (18) 4 8 (5) 579 (777) 137 (146) Creditview Road 165 (242) 604 (514) 12 (3) 129 (215) 2 (1) 224 (215) Old Creditview Road Argentia Road Falconer Drive 10 (16) 1064 (1290) 12(14) 12 (31) 1027 (1320) 380 (244) 506 (774) Kenninghall Boulevard (409) 225 (526) 441 (13) 15 (55) (457) 474 (387) 1195 (832) 41 (112) 39 (12) 21 (8) 31 (14) Rivergate Place 2 (8) 1 (8) 9 (3) 8 (4) Credit Meadows Park Kenninghall Crescent Former Harris Park Riverun Park (1) 5 (2) 6 1 (3) 2 (3) Sir Monty s Drive (19) 30 (7) 2 (118) 172 Velebit Court 10 (31) 1057 (1037) 10 (90) 6 (24) 1159 (917) 34 (222) 86 (179) 17 (58) 92 (110) Not to Scale Project: Creditview Road Environmental Assessment (20) 34 (16) 79 (13) 62 Title: 126 (105) 848 (809) 23 (71) Bancroft Drive LEGEND Turn Movements Existing Traffic Volumes - Unbalanced Signalized Intersection Stop Sign Control XX (XX) AM (PM )Peak Hour Turn Volumes Figure 4
16 Driveway (16) 3 (5) 0 (18) 4 8 (5) 713 (785) 137 (146) Creditview Road 165 (242) 814 (621) 12 (3) 129 (215) 2 (1) 224 (215) Old Creditview Road Argentia Road Falconer Drive 10 (16) 1064 (1290) (14) 12 (31) 990 (1269) 380 (244) 561 (774) Kenninghall Boulevard (409) 225 (526) 441 (13) 15 (55) (457) 474 (387) 1195 (831) 41 (112) 39 (12) 21 (8) 31 (14) Rivergate Place 2 (8) 1 (8) 9 (3) 8 (4) Credit Meadows Park Kenninghall Crescent Former Harris Park Riverun Park (1) 5 (2) 6 1 (3) 2 (3) Sir Monty s Drive (19) 30 (7) 2 (118) 172 Velebit Court 10 (31) 1252 (1300) 10 (90) 6 (24) 1159 (917) 34 (222) 86 (179) 17 (58) 92 (110) Not to Scale Project: Creditview Road Environmental Assessment (20) 34 (16) 79 (13) 62 Title: 126 (105) 1076 (966) 23 (71) Bancroft Drive Existing Traffic Volumes - Balanced LEGEND Turn Movements Signalized Intersection Stop Sign Control XX (XX) AM (PM )Peak Hour Turn Volumes Figure 5
17 AECOM City of Mississauga Creditview Road EA, Traffic Report Final Report Traffic Operations Analysis Traffic operations for all the intersections within the study area were analyzed using the Synchro 7.0 software package. The Synchro software is developed based on the Highway Capacity Manual (HCM 2000) methodologies and provides a detailed assessment of traffic operations including levels of service (LOS), delays and volume to capacity ratios (V/C) for overall, approaches, as well as individual movements of unsignalized and signalized intersections. LOS describes the driver experience on a transportation facility, with each LOS associated with the average delay each driver would experience at an intersection (see Table 2). Table 2- Level of Service Descriptions LOS A B C D E F Signalized Intersections Unsignalized Intersections Description Delay Description Delay Very seldom does a vehicle wait longer than one red light. The approach appears open, turns are easily made and drivers have freedom of operation. An occasional green light is fully used and many greens approach full use. Many drivers begin to feel somewhat restricted within groups of vehicles approaching the intersection. Intersection operation is stable but often has fully used greens. Drivers feel more restricted and occasionally may wait more than one red light. Queues may develop behind turning vehicles. Drivers experience increasing restriction and instability of traffic flow. There are substantial delays to vehicles during short peaks within the peak hour, but there is enough time with lower demand to permit occasional clearing of queues and prevent excessive backups. The capacity of the road is reached. There are long queues of vehicles waiting upstream of the intersection and delays to vehicles may extend to several signal cycles. Vehicle demand exceeds the available capacity and delays extending through the peak hour are experienced. 10 sec 20 sec 35 sec 55 sec 80 sec >80 sec Little or no traffic delay occurs. Approaches appear open, turning movements are easily made, and drivers have freedom of operation. Short traffic delays occur. Many drivers begin to feel somewhat restricted in terms of freedom of operation. Average traffic delays occur. Operations are generally stable, but drivers emerging from the minor street may experience difficulty in completing their movement. This may occasionally impact on the stability of flow on the major street. Long traffic delays occur. Drivers emerging from minor streets experience significant restriction and frustration. Drivers on the major street will experience congestion and delay. Very long traffic delays occur. Operations approach the capacity of the intersection. Vehicle demand exceeds the available capacity. Very long traffic delays occur frequently. 10 sec 15 sec 25 sec 35 sec 50 sec >50 sec The v/c ratio represents how full a road or intersection movement is, based on actual volumes versus the maximum number of vehicles that can travel. A v/c between 0.00 and 0.49 means that less than half the capacity is being used by vehicles; this is generally associated with good operating conditions. As the v/c approaches 1.00, traffic conditions worsen and at 1.00 the theoretical maximum number of vehicles is reached RPT-Creditview EA Traffic Report _Final Docx 12
18 AECOM City of Mississauga Creditview Road EA, Traffic Report Final Report and operations are generally very poor. The V/C can exceed 1.00, indicating very bad operations and extended traffic delays. The critical movements identified in the capacity analyses summary tables are those having an LOS of E or F and/or a V/C ratio of 0.85 or greater for signalized intersections, and for unsignalized intersections an LOS of E or F. Since the analysis is based on actual volumes, V/C > 1.00 indicates that the counted traffic volumes exceeded the capacity calculated by the analysis procedure/software. Individual movements at intersections with calculated V/C > 1.00 are operating essentially above capacity and can be expected to experience severe recurring queuing and congestion during both the AM and PM peak periods. The existing traffic volumes (Figure 5) were analyzed based on the existing lane configurations (Figure 3) and signal timings provided by the City of Mississauga. The traffic operational analysis results of the study area signalized and unsignalized intersections are summarized in Table 3. Detailed Synchro outputs are provided in Appendix C. All the critical individual movements with respect to levels of service and volumes to capacity ratios are shown in red in the table. Table 3- Existing Traffic Condition Analysis Intersection Creditview Road/Old Creditview Road (Signalized) Creditview Road/Argentia Road (Signalized) Creditview Road/Kenninghall Blvd (Signalized) Weekday AM Peak Hour Weekday PM Peak Hour Delay Delay Movement (sec) LOS V/C (sec) LOS V/C Left 8.6 A A 0.36 SB Thru 12.1 B B 0.63 Right 6.1 A A 0.00 NB Left 11.0 B B 0.01 Thru-Right 17.6 B C 0.43 EB Left-Thru 34.9 C D 0.08 Right 34.7 C C 0.01 WB Left-Thru 60.2 E E 0.79 Right 35.5 D D 0.14 Overall Intersection 20.6 C C 0.66 EB Left 56.7 E F 1.05 Right 33.2 C C 0.71 NB Left 16.2 B F 0.97 Thru 4.8 A A 0.37 SB Thru 14.9 B D 0.95 Right 6.5 A B 0.20 Overall Intersection 17.6 B E 0.95 EB Left-Thru-Right 50.3 D D 0.29 WB Left-Thru-Right F D 0.32 NB Left 2.9 A F 0.96 Thru-Right 6.4 A A 0.62 SB Left 4.2 A A 0.06 Thru-Right 8.2 A E 1.01 Overall Intersection 15.9 B D 0.94 RPT-Creditview EA Traffic Report _Final Docx 13
19 AECOM City of Mississauga Creditview Road EA, Traffic Report Final Report Intersection Creditview Road/Bancroft Drive/Sir Monty s (Signalized) Creditview Road/Falconer Drive (Unsignalized) Creditview Road/Velebit Court(Unsignalized) Creditview Road/Rivergate Place (Unsignalized) EB WB NB SB Movement Weekday AM Peak Hour Delay (sec) LOS V/C Weekday PM Peak Hour Delay (sec) LOS V/C Left 44.6 D D 0.29 Thru-Right 48.4 D D 0.08 Left 58.0 E D 0.61 Thru-Right 43.6 D D 0.58 Left 4.1 A A 0.29 Thru 11.5 B A 0.69 Right 3.5 A A 0.07 Left 9.0 A A 0.30 Thru-Right 8.0 A A 0.50 Overall Intersection 14.4 B B 0.68 EB Left F F 0.45 Right 24.1 C E 0.37 NB Left 11.3 B C 0.31 EB Left-Right >1000 F >2.00 >1000 F 1.17 NB Left 19.4 C D 0.02 SB Left 17.6 C B 0.01 WB Left-Right >1000 F > F 0.21 Note: Critical movements were shown in red in the table with V/C ratios 0.85 and or LOS E or worse Based on the intersection capacity analyses results presented in Table 3, we found that half of the signalized (during the PM peak hour only) and all of the unsignalized intersections (during both the AM and PM peak hours) within the study area are operating at or above capacity with significant delays. The following individual movements are operating at LOS E or worse: AM Peak Hour Creditview Road at Old Creditview Road westbound left-thru Creditview Road at Argentia Road eastbound left Creditview Road at Kenninghall Blvd westbound left-thru-right Creditview Road at Bancroft Drive westbound left Creditview Road at Falconer Drive eastbound left Creditview Road at Velebit Court eastbound left/right Creditview Road at Rivergate Place westbound left/right RPT-Creditview EA Traffic Report _Final Docx 14
20 AECOM City of Mississauga Creditview Road EA, Traffic Report Final Report PM Peak Hour Creditview Road at Old Creditview Road southbound left-thru Creditview Road at Argentia Road northbound left, eastbound left, and southbound thru Creditview Road at Kenninghall Blvd northbound left and southbound thru-right Creditview Road at Falconer Drive eastbound left and eastbound right Creditview Road at Velebit Court eastbound left/right Creditview Road at Rivergate Place westbound left/right The unsignalized intersections within the study area experience significant delay while exiting on to Creditview Road during both the peak hours. Since traffic volumes are heavier compared to the available capacity on Creditview Road during the peak hours, very minimal gap is available for vehicles exiting from the stop controlled side streets. Also with respect to the individual movements, southbound through movements on Creditview Road operate at or above capacity in the peak direction during the PM peak hour. RPT-Creditview EA Traffic Report _Final Docx 15
21 AECOM City of Mississauga Creditview Road EA, Traffic Report Final Report 3. Future Conditions 3.1 Future Traffic Growth Projections According to City of Mississauga Official Plan (OP) it is vital to preserve the capacity of the road system to meet the needs of Mississauga s population and employment growth. City of Mississauga s latest growth forecasts published in November 2013 provides population, housing units and employment forecasts for the period 2011 to Continued growth within north-west portion of the City will increase the use of Creditview Road. Based on the anticipated growth values for the City, traffic operations for Creditview Road within the study area between Bancroft Drive and Old Creditview Road would operate beyond capacity. For the purposes of this EA study, the updated growth forecasts and transportation model results provided by the City of Mississauga Transportation Planning Group were utilized to forecast future growth and demand on the Creditview Road corridor. Future forecast results were provided for the two following cases: No-widening The existing cross-section will be maintained on Creditview Road Widening Creditview Road will be widened to a four lane cross-section Based on the growth rate provided by the City, Table 4 shows future growth rates applied to the north-south traffic volumes on Creditview Road for horizon year 2021 and year Table 4- Future Forecast Creditview Road Creditview Road Cross-Section No-widening Widening Direction Horizon Year 2021 Traffic Growth Horizon Year 2031 Northbound 7 % 16 % Southbound 11 % 18 % Northbound 45 % 61 % Southbound 29 % 42 % These total growth rates were applied to the link volumes at Creditview Road and distributed as per prevailing traffic conditions. Detailed traffic forecasts results provided by the City are provided in Appendix D. 3.2 Future Total Traffic Volumes Figure 6 and Figure 7 illustrate future traffic volumes with no widening for horizon year 2021 and year 2031 respectively. Figure 8 and Figure 9 illustrate future traffic volumes for widening Creditview Road to a four-lane cross-section for horizon year 2021 and year 2031 respectively. RPT-Creditview EA Traffic Report _Final Docx 16
22 Driveway (16) 3 (5) 0 (18) 4 9 (6) 791 (871) 152 (162) Creditview Road 177 (259) 871 (664) 13 (3) 129 (215) 2 (1) 224 (215) Old Creditview Road Argentia Road 13 (34) 1099 (1409) 11 (18) 1181 (1432) 13 (16) 422 (271) 623 (859) (409) 225 (526) (489) 507 (414) Former Harris Park Falconer Drive (13) 15 (55) (889) 44 (120) 2 (8) 1 (8) 9 (3) 8 (4) Kenninghall Boulevard Rivergate Place 39 (12) 21 (8) 31 (14) Credit Meadows Park Kenninghall Crescent Riverun Park (1) 5 (2) 6 1 (3) 2 (3) Sir Monty s Drive Velebit Court (19) 30 (7) 2 (118) (34) 1390 (1443) 11 (100) 6 (26) 1240 (981) 36 (238) 86 (179) 17 (58) 92 (110) Not to Scale Project: Creditview Road Environmental Assessment (20) 34 (16) 79 (13) 62 Title: 135 (112) 1151 (1034) 25 (76) Bancroft Drive LEGEND Turn Movements Signalized Intersection Stop Sign Control Future 2021 Traffic Volumes - (No Widening) XX (XX) AM (PM )Peak Hour Turn Volumes Figure 6
23 Driveway (16) 3 (5) 0 (18) 4 9 (6) 841 (926) 162 (172) Creditview Road 191(281) 944(720) 14(3) 129 (215) 2 (1) 224 (215) Old Creditview Road Argentia Road 14 (37) 1168 (1497) 12 (19) 1256 (1522) 14 (17) 448 (288) 662 (913) (409) 225 (526) (530) 550 (449) Former Harris Park Falconer Drive (13) 15 (55) (964) 48 (130) 2 (8) 1 (8) 9 (3) 8 (4) Kenninghall Boulevard Rivergate Place 39 (12) 21 (8) 31 (14) Credit Meadows Park Kenninghall Crescent Riverun Park (1) 5 (2) 6 1 (3) 2 (3) Sir Monty s Drive (19) 30 (7) 2 (118) 172 Velebit Court 12 (37) 1477 (1534) 12 (106) 7 (28) 1344 (1064) 39 (258) 86 (179) 17 (58) 92 (110) Not to Scale Project: Creditview Road Environmental Assessment (20) 34 (16) 79 (13) 62 Title: 146 (122) 1248 (1121) 27 (82) Bancroft Drive LEGEND Turn Movements Signalized Intersection Stop Sign Control Future 2031 Traffic Volumes (No Widening) XX (XX) AM (PM )Peak Hour Turn Volumes Figure 7
24 Driveway (16) 3 (5) 0 (18) 4 10 (6) 920 (1013) 177(188) Creditview Road 239 (351) 1180 (900) 17 (4) 129 (215) 2 (1) 224 (215) Old Creditview Road Argentia Road 5 (21) 1373 (1664) 15 (18) 490 (315) 724 (998) (409) 225 (526) (40) 1277 (1637) 1067 (663) 687 (561) Former Harris Park Falconer Drive (13) 15 (55) (1205) 59 (162) 2 (8) 1 (8) 9 (3) 8 (4) Kenninghall Boulevard Rivergate Place 39 (12) 21 (8) 31 (14) Credit Meadows Park Kenninghall Crescent Riverun Park (1) 5 (2) 6 1 (1) 2 (2) Sir Monty s Drive (19) 30 (7) 2 (118) 172 Velebit Court 13 (40) 1615 (1677) 13 (116) 9 (35) 1681 (1330) 49 (322) 86 (179) 17 (58) 92 (110) Not to Scale Project: Creditview Road Environmental Assessment (20) 34 (16) 79 (13) 62 Title: 183 (152) 1560 (1401) 33 (103) Bancroft Drive Future 2021 Traffic Volumes (4- Lane Creditview Road Widening) LEGEND Turn Movements Signalized Intersection Stop Sign Control XX (XX) AM (PM )Peak Hour Turn Volumes Figure 8
25 Driveway (16) 3 (5) 0 (18) 4 11 (7) 1012 (1115) 195 (207) Creditview Road 266 (390) 1311 (1000) 19 (5) 129 (215) 2 (1) 224 (215) Old Creditview Road Argentia Road 17 (44) 1406(1802) 14 (23) 1511 (1832) 17 (20) 540 (346) 797 (1099) (409) 225 (526) (736) 763 (623) Former Harris Park Falconer Drive (13) 15 (55) (1338) 66 (180) 2 (8) 1 (8) 9 (3) 8 (4) Kenninghall Boulevard Rivergate Place 39 (12) 21 (8) 31 (14) Credit Meadows Park Kenninghall Crescent Riverun Park (5) 5 (6) 6 1 (1) 2 (2) Sir Monty s Drive (19) 30 (7) 2 (118) 172 Velebit Court 14 (44) 1778 (1846) 14 (128) 10 (39) 1866 (1476) 55 (357) 86 (179) 17 (58) 92 (110) Not to Scale Project: Creditview Road Environmental Assessment (20) 34 (16) 79 (13) 62 Title: 203 (169) 1732 (1555) 37 (114) Bancroft Drive Future 2031 Traffic Volumes (4-lane Creditview Road Widening) LEGEND Turn Movements Signalized Intersection Stop Sign Control XX (XX) AM (PM )Peak Hour Turn Volumes Figure 9
26 AECOM City of Mississauga Creditview Road EA, Traffic Report Final Report 3.3 Traffic Operations Analysis The traffic operations for all the intersections within the study area were analyzed using the Synchro 7.0 software package for future traffic volumes. The critical movements identified in the capacity analyses summary tables are those having an LOS of E or F and/or a V/C ratio of 0.85 or greater for signalized intersections, and for unsignalized intersections an LOS of E, or F. Since the analysis is based on actual volumes, V/C > 1.00 indicates that the counted traffic volumes exceeded the capacity calculated by the analysis procedure/software. Individual movements at intersections with calculated V/C > 1.00 are operating above capacity and can be expected to experience severe recurring queuing and congestion during both the AM and PM peak periods Do Nothing Horizon year 2021 The future traffic volumes under no-widening conditions were analysed for horizon year 2021 (Figure 6) using existing lane configuration (Figure 3) and signal timings provided by the City of Mississauga. The traffic operational analysis results for the study area signalized and unsignalized intersections for horizon year 2021 are summarized in Table 5. Detailed Synchro outputs are provided in Appendix E. Table 5- Year 2021 Traffic Analysis Do Nothing Intersection Creditview Road/Old Creditview Road (Signalized) Creditview Road/Argentia Road (Signalized) Creditview Road/Kenninghall Blvd (Signalized) Approach/Movement SB NB EB WB Weekday AM Peak Hour Weekday PM Peak Hour Delay (sec) LOS V/C Delay (sec) LOS V/C Left 9.5 A A 0.42 Thru 13.5 B B 0.69 Right 6.1 A A 0.00 Left 11.2 B B 0.01 Thru-Right 18.2 B C 0.47 Left-Thru 34.9 C D 0.08 Right 34.7 C C 0.01 Left-Thru 60.2 E E 0.79 Right 35.5 D D 0.14 Overall Intersection 21.0 C C 0.72 EB NB SB Left 56.7 E F 1.05 Right 33.1 C D 0.78 Left 17.9 B C 0.88 Thru 4.9 A A 0.40 Thru 18.1 B E 0.99 Right 10.3 B B 0.23 Overall Intersection 18.6 B E 0.99 EB Left-Thru- Right 52.8 D D 0.29 WB Left-Thru- Right 79.4 E D 0.32 NB Left 4.2 A F 1.03 Thru-Right 8.8 A A 0.67 SB Left 6.6 A A 0.08 Thru-Right 11.7 B F 1.12 Overall Intersection 15.6 B F 1.04 RPT-Creditview EA Traffic Report _Final Docx 21
27 AECOM City of Mississauga Creditview Road EA, Traffic Report Final Report Intersection Creditview Road/Bancroft Drive/Sir Monty s Drive (Signalized) Creditview Road/Falconer Drive (Unsignalized) Creditview Road/Velebit Court (Unsignalized) Creditview Road/Rivergate Place (Unsignalized) Approach/Movement EB WB NB SB Weekday AM Peak Hour Weekday PM Peak Hour Delay (sec) LOS V/C Delay (sec) LOS V/C Left 44.6 D D 0.29 Thru-Right 48.4 D D 0.08 Left 58.0 E D 0.61 Thru-Right 43.6 D D 0.58 Left 4.7 A A 0.37 Thru 13.7 B B 0.74 Right 3.5 A A 0.07 Left 8.6 A A 0.38 Thru-Right 8.1 A B 0.55 Overall Intersection 14.9 B B 0.72 EB Left F F 0.69 Right 31.4 D F 0.55 NB Left 12.6 B D 0.44 EB Left-Right >1000 F >2.0 >1000 F >2.0 NB Left 27.9 D E 0.03 SB Left 21.7 C B 0.01 WB Left-Right >1000 F > F 0.56 Note: Critical movements were shown in red in the table with V/C ratios 0.85 and or LOS E or worse Based on the intersection capacity analyses results presented in Table 5, we found that all signalized and unsignalized intersections within the study area expected to operate at or above capacity with significant delays during both the AM and PM peak hours during horizon year 2021 without any improvements. The following individual movements are operating at LOS E or worse: AM Peak Hour Creditview Road at Old Creditview Road westbound left-thru Creditview Road at Argentia Road northbound left and eastbound left Creditview Road at Kenninghall Blvd westbound left-thru-right and northbound thru-right Creditview Road at Bancroft Drive westbound left Creditview Road at Falconer Drive eastbound left Creditview Road at Velebit Court eastbound left/right Creditview Road and Rivergate Place westbound left/right RPT-Creditview EA Traffic Report _Final Docx 22
28 AECOM City of Mississauga Creditview Road EA, Traffic Report Final Report PM Peak Hour Creditview Road at Old Creditview Road westbound left-thru Creditview Road at Argentia Road northbound left, eastbound left, and southbound thru Creditview Road at Kenninghall Blvd northbound left and southbound thru-right Creditview Road at Falconer Drive eastbound left and eastbound right Creditview Road at Velebit Court eastbound left/right and northbound left Creditview Road and Rivergate Place westbound left/right Horizon year 2031 The future traffic volumes under no-widening conditions were analysed for horizon year 2031 (Figure 7) using existing lane configuration (Figure 3) and signal timings provided by the City of Mississauga. The traffic operational analysis results for the study area signalized and unsignalized intersections for horizon year 2031 are summarized in Table 6. Detailed Synchro outputs are provided in Appendix E. Table 6- Year 2031 Traffic Analysis Do Nothing Intersection Creditview Road/Old Creditview Road (Signalized) Creditview Road/Argentia Road (Signalized) Creditview Road/Kenninghall Blvd (Signalized) Creditview Road/Bancroft Drive/Sir Monty s Drive Approach/Movement Weekday AM Peak Hour Weekday PM Peak Hour Delay (sec) LOS V/C Delay (sec) LOS V/C Left 10.8 B A 0.48 SB Thru 14.5 B B 0.74 Right 6.1 A A 0.00 NB Left 11.4 B B 0.01 Thru-Right 19.1 B C 0.51 EB Left-Thru 34.9 C D 0.08 Right 34.7 C C 0.01 WB Left-Thru 60.2 E E 0.79 Right 35.5 D D 0.14 Overall Intersection 21.5 C C 0.75 EB Left 56.7 E F 1.05 Right 32.4 C C 0.74 NB Left 21.0 C F 1.12 Thru 5.0 A A 0.43 SB Thru 21.0 C F 1.12 Right 12.8 B B 0.27 Overall Intersection 19.7 B F 1.05 EB Left-Thru- Right 53.0 D D 0.29 WB Left-Thru- Right 61.2 E D 0.32 NB Left 8.3 A F 1.12 Thru-Right 17.5 B A 0.72 SB Left 23.4 C A 0.10 Thru-Right 16.6 B F 1.19 Overall Intersection 20.8 C F 1.11 Left 44.6 D D 0.25 EB Thru-Right 48.4 D D 0.08 RPT-Creditview EA Traffic Report _Final Docx 23
29 AECOM City of Mississauga Creditview Road EA, Traffic Report Final Report Intersection (Signalized) Creditview Road/Falconer Drive (Unsignalized) Creditview Road/Velebit Court (Unsignalized) Creditview Road/Rivergate Place (Unsignalized) Approach/Movement WB NB SB Weekday AM Peak Hour Weekday PM Peak Hour Delay (sec) LOS V/C Delay (sec) LOS V/C Left 58.0 E D 0.59 Thru-Right 43.7 D D 0.65 Left 5.2 A B 0.47 Thru 18.7 B B 0.81 Right 3.6 A A 0.08 Left 8.4 A A 0.55 Thru-Right 7.9 A B 0.59 Overall Intersection 16.4 B B 0.78 EB Left >1000 F F 0.57 Right 39.4 E F 0.65 NB Left 13.8 B E 0.53 EB Left-Right >1000 F >2.00 >1000 F >2.00 NB Left 35.4 E E 0.04 SB Left 29.1 D B 0.02 WB Left-Right >1000 F >2.00 >1000 F >2.00 Note: Critical movements were shown in red in the table with V/C ratios 0.85 and or LOS E or worse Based on the intersection capacity analyses results presented in Table 6, we found that all signalized and unsignalized intersections within the study area will continue to operate at or above capacity with significant delays during both the AM and PM peak hours during horizon year 2031 without any improvements. The following individual movements are operating at LOS E or worse: AM Peak Hour Creditview Road at Old Creditview Road westbound left-thru Creditview Road at Argentia Road northbound left Creditview Road at Kenninghall Blvd westbound left-thru-right and northbound thru-right Creditview Road at Bancroft Drive westbound left Creditview Road at Falconer Drive eastbound left Creditview Road at Velebit Court eastbound left/right and northbound left Creditview Road and Rivergate Place westbound left/right Creditview Road and Sir Monty s Drive/Bancroft Drive westbound left and northbound thru PM Peak Hour Creditview Road at Old Creditview Road westbound left-thru Creditview Road at Argentia Road northbound left, eastbound left, and southbound thru Creditview Road at Kenninghall Blvd northbound left and southbound thru-right Creditview Road at Falconer Drive eastbound left, eastbound right, and northbound left Creditview Road at Velebit Court eastbound left/right and northbound left Creditview Road and Rivergate Place westbound left/right As shown in Table 5 and Table 6, all signalized and unsignalized intersections are expected to operate above capacity with significant delays during future horizon years without any improvements. Therefore, Creditview Road needs intersection improvements and/or additional lanes in order to address present and future traffic operational deficiencies. RPT-Creditview EA Traffic Report _Final Docx 24
30 AECOM City of Mississauga Creditview Road EA, Traffic Report Final Report Alternatives Assessment Two groups of alternatives were defined and assessed for the study area: interim and ultimate design solutions. Under the ultimate solutions, the cross-section would be 4-lanes from Old Creditview Road to Bancroft Drive; however, a 2-lane cross-section from Argentia Road to Bancroft Drive is considered for interim solutions. Both roundabout and signalized intersection concepts were analyzed for interim and ultimate alternatives. The change in geometry and traffic control of the following three intersections have been assessed under different design alternatives while the geometry for rest of the intersections remain unchanged between interim and ultimate conditions. Creditview Road/Argentia Road intersection Creditview Road/Kenninghall Blvd intersection Creditview Road/Falconer Drive intersection The intersections in the study area were analysed using Synchro version 7 for the signalized and unsignalized intersections and Sidra version 6 software for roundabout analysis. Signalized intersections can be analyzed in Sidra software; however, the analysis may yield slightly different results when compared to the results from Synchro software due to differences in the algorithms of the two software packages. The analysis results include level of service (LOS) for each approach and the overall intersection. LOS is defined in terms of average control delay per vehicle, according to the criteria of the Highway Capacity Manual (HCM). The LOS criteria for signalized intersections as shown in Table 2 were also used to assess the LOS of roundabouts. To investigate the adequacy of the proposed storage length, queueing analyses were conducted for the preferred interim and long-term design solutions (as presented for Alternative 3 and 5). The 50 th and 95 th percentile queue were estimated, and compared to the proposed storage capacity Interim Design Alternatives Alternative 1: Signalized Design Concept Alternative 1 has traffic signals at Argentia Road, a stop sign at Falconer Drive and traffic signals at Kenninghall Boulevard as shown in Figure 10. The cross-section is 4-lanes from Old Creditview Road to Argentia Road and 2-lanes from Argentia Road to Bancroft Drive. The intersections in the study area were analysed using Synchro version 7. Horizon year 2021 The future traffic volumes under no-widening conditions were analysed for horizon year 2021 (Figure 6). The traffic operational analysis results for the study area signalized and unsignalized intersections are summarized in Table 7. Detailed Synchro outputs are provided in Appendix E. The signalized intersection at Kenninghall Boulevard will not have sufficient capacity for the expected traffic volumes in The intersection is expected to operate at LOS F in the PM peak period and with a V/C ratio greater than Having a V/C greater than 0.85 indicates that there is an increased possibility of vehicle delay and queuing at the intersection. The eastbound left turn movement at the Falconer Drive intersection is expected to operate at LOS F in the AM and PM peak periods. In addition, the eastbound right turn movement is expected to operate at LOS F in the PM peak period. RPT-Creditview EA Traffic Report _Final Docx 25
31 Driveway Old Creditview Road Intersection Improvement Argentia Road Intersection Improvement Creditview Road Falconer Drive Intersection Improvement Kenninghall Boulevard Intersection Improvement Credit Meadows Park Riverun Park No Intersection Improvement Sir Monty s Drive Bancroft Drive LEGEND Lane Configuration Signalized Intersection Not to Scale Stop Sign Control Project: Creditview Road Environmental Assessment Title: Interim Signalized Design Concept (Alternative 1) Figure 10
32 AECOM City of Mississauga Creditview Road EA, Traffic Report Final Report Table 7- Year 2021 Traffic Analysis Alternative 1 Intersection Creditview Road/Old Creditview Road (Signalized) Creditview Road/Argentia Road (Signalized) Creditview Road/Kenninghall Blvd (Signalized) Creditview Road/Bancroft Drive/Sir Monty s Drive (Signalized) Weekday AM Peak Hour Weekday PM Peak Hour Approach/Movement Delay Delay (sec) LOS V/C LOS V/C (sec) Left 8.2 A A 0.33 SB Thru-Right 8.3 A A 0.37 NB EB WB Left 11.9 B B 0.01 Thru 15.9 B B 0.33 Right 18.0 B C 0.16 Left-Thru 34.9 C D 0.08 Right 34.7 C C 0.1 Left-Thru 60.2 E E 0.79 Right 35.5 D D 0.14 Overall Intersection 18.3 B B 0.47 EB NB SB Left-Left 48.4 D D 0.71 Right 35.5 D D 0.88 Left-Left 52.9 D D 0.71 Thru 2.8 A A 0.19 Thru 11.1 B B 0.48 Right 4.0 A A 0.17 Overall Intersection 21.4 C C 0.61 EB WB NB SB Left 46.3 D D 0.19 Thru-Right 49.7 D D 0.14 Left 50.4 D D 0.2 Thru-Right 46.3 D D 0.08 Left 3.6 A F 1.03 Thru-Right 7.4 A A 0.66 Left 5.5 A A 0.08 Thru-Right 12.8 B F 1.11 Overall Intersection 14.1 B F 1.03 EB WB NB SB Left 44.6 D D 0.29 Thru-Right 48.4 D D 0.08 Left 58.0 E D 0.61 Thru-Right 43.6 D D 0.58 Left 4.7 A A 0.37 Thru 13.7 B B 0.74 Right 3.5 A A 0.07 Left 9.4 A A 0.38 Thru-Right 8.6 A B 0.55 Overall Intersection 15.1 B B 0.72 RPT-Creditview EA Traffic Report _Final Docx 27
33 AECOM City of Mississauga Creditview Road EA, Traffic Report Final Report Intersection Creditview Road/Falconer Drive (Unsignalized) Creditview Road/Velebit Court (Unsignalized) Creditview Road/Rivergate Place (Unsignalized) Approach/Movement EB Weekday AM Peak Hour Delay (sec) LOS V/C Weekday PM Peak Hour Delay LOS V/C (sec) Left >1000 F > F 0.55 Right 30.3 D F 0.49 NB Left 24.4 C C 0.39 EB Left-Right >1000 F >2.0 >1000 F >2.0 NB Left 29.0 D E 0.03 SB Left 22.1 C B 0.01 WB Left-Right >1000 F > F 0.53 Note: Critical movements were shown in red in the table with V/C ratios 0.85 and or LOS E or worse The following individual movements are operating at LOS E or worse: AM Peak Hour Creditview Road at Old Creditview Road westbound left-thru Creditview Road at Bancroft Drive westbound left Creditview Road at Falconer Drive eastbound left Creditview Road at Velebit Court eastbound left/right Creditview Road and Rivergate Place westbound left/right PM Peak Hour Creditview Road at Old Creditview Road westbound left-thru Creditview Road at Argentia Road eastbound right Creditview Road at Kenninghall Blvd northbound thru-right Creditview Road at Falconer Drive eastbound left and right Creditview Road at Velebit Court eastbound left/right and northbound left Creditview Road and Rivergate Place westbound left/right Horizon year 2031 The future traffic volumes under no-widening conditions were analysed for horizon year 2031 (Figure 7). The traffic operational analysis results for the study area signalized and unsignalized intersections are summarized in Table 8. Detailed Synchro outputs are provided in Appendix E. The signalized intersection at Kenninghall Boulevard is projected to have insufficient capacity for the expected traffic volumes in The intersection is expected to operate at a LOS F in the PM peak period with a V/C ratio greater than 0.85 in both the AM and PM peak periods. The eastbound left turn movement at the Falconer Drive intersection is expected to operate with a LOS F in the AM and PM peak periods. In addition, the eastbound right turn movement is expected to operate with a LOS F in the PM peak period. RPT-Creditview EA Traffic Report _Final Docx 28
34 AECOM City of Mississauga Creditview Road EA, Traffic Report Final Report Table 8- Year 2031 Traffic Analysis Alternative 1 Intersection Creditview Road/Old Creditview Road (Signalized) Creditview Road/Argentia Road (Signalized) Creditview Road/Kenninghall Blvd (Signalized) Creditview Road/Bancroft Drive/Sir Monty s Drive (Signalized) Creditview Road/Falconer Drive (Unsignalized) Weekday AM Peak Hour Weekday PM Peak Hour Approach/Movement Delay (sec) LOS V/C Delay (sec) LOS V/C SB Left 8.8 A A 0.37 Thru-Right 8.5 A A 0.39 NB EB WB Left 12.4 B B 0.01 Thru 16.8 B B 0.36 Right 17.6 B C 0.18 Left-Thru 34.9 C D 0.08 Right 34.7 C C 0.01 Left-Thru 60.2 E E 0.79 Right 35.5 D D 0.14 Overall Intersection 18.4 B B 0.49 Left-Left 48.4 D D 0.71 EB Right 34.7 C D 0.87 NB SB Left-Left 51.1 D D 0.74 Thru 3 A A 0.21 Thru 11.9 B B 0.51 Right 4.1 A A 0.18 Overall Intersection 20.9 C C 0.63 Left 45.5 D D 0.19 EB Thru-Right 50.9 D D 0.14 WB NB SB Left 48.6 D D 0.20 Thru-Right 45.6 D D 0.08 Left 5.5 A F 1.12 Thru-Right 12.3 B A 0.72 Left 21.3 C A 0.09 Thru-Right 16.9 B F 1.18 Overall Intersection 17.9 B F 1.09 EB WB NB SB Left 44.6 D D 0.25 Thru-Right 48.4 D D 0.08 Left 58.0 E D 0.59 Thru-Right 43.7 D D 0.65 Left 5.2 A B 0.47 Thru 18.7 B B 0.81 Right 3.6 A A 0.08 Left 5.7 A A 0.55 Thru-Right 8.5 A B 0.59 Overall Intersection 16.6 B B 0.78 EB Left >1000 F > F 0.65 Right 36.7 E F 0.67 NB Left 13.1 B E 0.54 RPT-Creditview EA Traffic Report _Final Docx 29
35 AECOM City of Mississauga Creditview Road EA, Traffic Report Final Report Intersection Creditview Road/Velebit Court (Unsignalized) Creditview Road/Rivergate Place (Unsignalized) Approach/Movement Weekday AM Peak Hour Weekday PM Peak Hour Delay (sec) LOS V/C Delay (sec) LOS V/C EB Left/Right >1000 F >2.0 >1000 F >2.0 NB Left 37.9 E F 0.04 SB Left 30.4 D C 0.02 WB Left/Right >1000 F >2.0 >1000 F >2.0 Note: Critical movements were shown in red in the table with V/C ratios 0.85 and or LOS E or worse The following individual movements are operating at LOS E or worse and/or with V/C greater than 0.85: AM Peak Hour Creditview Road at Old Creditview Road westbound left-thru Creditview Road at Kenninghall Blvd northbound thru-right Creditview Road at Bancroft Drive westbound left, northbound thru Creditview Road at Falconer Drive eastbound left and right Creditview Road at Velebit Court eastbound left/right and northbound left Creditview Road and Rivergate Place westbound left/right Creditview Road and Sir Monty s Drive/Bancroft Drive westbound left and northbound thru PM Peak Hour Creditview Road at Old Creditview Road westbound left-thru Creditview Road at Argentia Road eastbound right Creditview Road at Kenninghall Blvd northbound left and southbound thru-right Creditview Road at Falconer Drive eastbound left and right and northbound left Creditview Road at Velebit Court eastbound left/right and northbound left Creditview Road and Rivergate Place westbound left/right Alternative 2: Roundabout/Signalized Design Concept Alternative 2 shown in Figure 11 has a 2-lane roundabout at Argentia Road, a stop sign at Falconer Drive, and a traffic signal at Kenninghall Boulevard. The cross-section is 4-lanes from Old Creditview Road to Argentia Road and 2-lanes from Argentia Road to Bancroft Drive. As described earlier, the three key study area intersections were analysed using Sidra version 6. RPT-Creditview EA Traffic Report _Final Docx 30
36 Driveway Old Creditview Road Intersection Improvement Argentia Road Intersection Improvement Creditview Road Falconer Drive Intersection Improvement Kenninghall Boulevard Intersection Improvement Credit Meadows Park Riverun Park No Intersection Improvement Sir Monty s Drive Bancroft Drive LEGEND Lane configuration Signalized Intersection Stop Sign Control Not to Scale Project: Creditview Road Environmental Assessment Title: Interim Roundabout/Signalized Design Concept (Alternative 2) Two Lane Roundabout Figure 11
37 AECOM City of Mississauga Creditview Road EA, Traffic Report Final Report Horizon year 2021 The future traffic volumes under no-widening conditions were analysed for horizon year 2021 (Figure 6). The traffic operational analysis results are summarized in Table 9. Detailed Sidra outputs are provided in Appendix E. Many of the Kenninghall Boulevard intersection turning movements operate with a LOS E or a V/C ratio greater than 0.85 indicating longer delays and queuing. The northbound through movement operates with a LOS B in the AM peak period, but has a V/C ratio greater than This means that northbound traffic is flowing well, but that demand is approaching the available capacity. In both the peak hours, the eastbound movement at Falconer Drive is predicted to have very long delays. In the PM peak hour, the northbound and southbound through movements operate with an LOS A, indicating that vehicles are progressing through the intersection with little delay. However, the southbound through movement v/c ratio is approaching 1.0, indicating that the demand is approaching the available capacity. Horizon year 2031 The future traffic volumes under no-widening conditions were analysed for horizon year 2031 (Figure 7). The traffic operational analysis results are summarized in Table 10. Detailed Sidra outputs are provided in Appendix E. The Kenninghall Boulevard intersection is expected to operate with an overall LOS C in both peak periods. However, most of the turning movements operate with a LOS E or a v/c ratio greater than 0.85 indicating long delays and queuing. At the Falconer Drive intersection, most turning movements operate with a LOS F in the PM peak period, indicating that vehicles at this intersection experience significant delay and queuing. RPT-Creditview EA Traffic Report _Final Docx 32
38 AECOM City of Mississauga Creditview Road EA, Traffic Report Final Report Table 9- Year 2021 Traffic Analysis Alternative 2 Intersection Creditview Road/Argentia Road (2-lane roundabout) Creditview Road/Kenninghall Blvd (Signalized) Creditview Road/Falconer Drive (Unsignalized) Weekday AM Peak Hour Weekday PM Peak Hour Delay Delay Approach/Movement (sec) LOS V/C (sec) LOS V/C Left 11.6 B B 0.64 EB Right 6.5 A B 0.70 NB SB Left 9.9 A B 0.42 Thru 4.5 A A 0.42 Thru 6.3 A A 0.72 Right 6.2 A A 0.33 Overall Intersection 6.9 A A 0.72 Left 56.3 E E 0.16 EB WB NB SB Thru 54.5 D E 0.92 Right 60.1 E E 0.92 Left 64.9 E E 0.19 Thru 47.7 D D 0.14 Right 53.3 D E 0.14 Left 27.0 C F 0.97 Thru 8.8 A A 0.63 Right 14.4 B A 0.63 Left 32.1 C B 0.05 Thru 7.6 A D 0.96 Right 13.2 B D 0.96 Overall Intersection 14.1 B D 0.97 Left >1000 F >2.0 >1000 F >2.0 EB Right >1000 F >2.0 >1000 F >2.0 NB SB Left 15.2 C F 0.99 Thru 0.1 A A 0.45 Thru 0.1 A A 0.99 Right 5.6 A A 0.99 Note: Critical movements were shown in red in the table with V/C ratios 0.85 and or LOS E or worse The following individual movements are operating at LOS E or worse and/or with V/C greater than 0.85: AM Peak Hour Creditview Road at Kenninghall Blvd eastbound left and right and westbound left Creditview Road at Falconer Drive eastbound left and right PM Peak Hour Creditview Road at Kenninghall Blvd eastbound left, thru, and right, westbound left and right, and southbound thru and right Creditview Road at Falconer Drive eastbound left and right, northbound left, and southbound thru and right RPT-Creditview EA Traffic Report _Final Docx 33
39 AECOM City of Mississauga Creditview Road EA, Traffic Report Final Report Table 10- Year 2031 Traffic Analysis Alternative 2 Intersection Creditview Road/Argentia Road (2-lane roundabout) Creditview Road/Kenninghall Blvd (Signalized) Creditview Road/Falconer Drive (Unsignalized) Weekday AM Peak Hour Weekday PM Peak Hour Delay Delay Approach/Movement (sec) LOS V/C (sec) LOS V/C Left 11.9 B C 0.72 EB Right 6.9 A B 0.77 NB SB Left 10.0 A B 0.45 Thru 4.6 A A 0.45 Thru 7.1 A A 0.78 Right 6.8 A A 0.36 Overall Intersection 7.2 A B 0.78 Left 57.5 E E 0.18 EB WB NB SB Thru 58.5 E E 0.92 Right 64.0 E E 0.92 Left 66.6 E E 0.19 Thru 48.9 D D 0.16 Right 54.5 D E 0.16 Left 30.0 C F 0.95 Thru 13.1 B A 0.78 Right 18.6 B B 0.78 Left 40.0 D C 0.07 Thru 7.8 A D 0.94 Right 13.3 B D 0.94 Overall Intersection 16.2 B C 0.95 Left >1000 F >2.0 >1000 F >2.0 EB Right >1000 F >2.0 >1000 F >2.0 NB SB Left 17.4 B 0.16 >1000 F 1.67 Thru 0.1 A A 0.52 Thru 0.1 A F >2.0 Right 5.6 A F >2.0 Note: Critical movements were shown in red in the table with V/C ratios 0.85 and or LOS E or worse The following individual movements are operating at LOS E or worse and/or with V/C greater than 0.85: AM Peak Hour Creditview Road at Kenninghall Blvd eastbound left, thru, and right, westbound left, thru, and right, and northbound thru and right Creditview Road at Falconer Drive eastbound left and right PM Peak Hour Creditview Road at Kenninghall Blvd eastbound left, thru, and right, westbound left, thru, and right, northbound left, and southbound thru and right Creditview Road at Falconer Drive eastbound left and right, northbound left, and southbound thru and right RPT-Creditview EA Traffic Report _Final Docx 34
40 AECOM City of Mississauga Creditview Road EA, Traffic Report Final Report Alternative 3: Roundabout Design Concept (Preferred Alternative) Alternative 3 is shown in Figure 12 and has a 2-lane roundabout at Argentia Road and a single lane roundabout at both Falconer Drive and Kenninghall Boulevard. The cross-section is 4-lanes from Old Creditview Road to Argentia Road and 2-lanes from Argentia Road to Bancroft Drive. The intersections in the study area were analysed using Sidra version 6. Horizon year 2021 The future traffic volumes under no-widening conditions were analysed for horizon year 2021 (Figure 6). The traffic operational analysis results are summarized in Table 11. Detailed Sidra outputs are provided in Appendix E. The existing southbound traffic volume of 1320 vehicles in the PM peak hour at Kenninghall Boulevard is at the limit of the capacity of the single lane road. This alternative will function adequately during the PM peak hour under the existing southbound traffic volumes. However, the projected increase in the traffic volumes during the PM peak hour in the future cannot be accommodated. Due to these capacity constraints, not all vehicles will be able to travel through the Kenninghall Boulevard roundabout in the PM peak hour in 2021, and the southbound queue will fill the space between the Kenninghall Boulevard intersection and the Argentia Road intersection. The capacity of this intersection is also exceeded in the 2021 interim scenario with traffic signals (Alternative 1). The high traffic volumes along Creditview Road will encourage drivers to adjust their time of travel, which will result in the spreading of the peak period of travel over a greater length of time. Horizon year 2031 The future traffic volumes under no-widening conditions were analysed for horizon year 2031 (Figure 7). The traffic operational analysis results are summarized in Table 12. Detailed Sidra outputs are provided in Appendix E. In 2031, all intersections and turning movements are expected to operate with a LOS C or better. However, similar to the horizon year 2021 results, Kenninghall Boulevard is at the limit of the capacity of the single lane road and the projected increase in the traffic volumes during the PM peak hour in the future will only exacerbate the congestion problems. The high traffic volumes in 2031 along Creditview Road will likely encourage drivers to adjust their time of travel. This will result in spreading of the peak period of travel over a greater length of time. Traffic conditions under interim roundabout design concept (Alternative 3) is predicted to be less congested when compared to interim signalized design concept (Alternative 1). Level of service is predicted to be satisfactory during the AM peak hour for both 2021 and The only operation issues would be along the southbound direction at Kenninghall Boulevard and Falconer Drive during the PM peak hour. It should be noted that these two intersections are predicted to operate poorly under Alternative 1 during both AM and PM peak hour. RPT-Creditview EA Traffic Report _Final Docx 35
41 Driveway Old Creditview Road Intersection Improvement Argentia Road Intersection Improvement Creditview Road Falconer Drive Intersection Improvement Kenninghall Boulevard Intersection Improvement Credit Meadows Park Riverun Park No Intersection Improvement Sir Monty s Drive Bancroft Drive LEGEND Lane Configuration Signalized Intersection Single Lane Roundabout Not to Scale Two Lane Roundabout Project: Creditview Road Environmental Assessment Title: Interim Roundabout Design Concept (Alternative 3) Figure 12
42 AECOM City of Mississauga Creditview Road EA, Traffic Report Final Report Table 11- Year 2021 Traffic Analysis Alternative 3 Intersection Creditview Road/Argentia Road (2-lane roundabout) Creditview Road/Kenninghall Blvd (Single lane roundabout) Creditview Road/Falconer Drive (Single lane roundabout) Weekday AM Peak Hour Weekday PM Peak Hour Delay Delay Approach/Movement (sec) LOS V/C (sec) LOS V/C Left 11.7 B B 0.61 EB Right 6.1 A B 0.66 NB SB Left 10.0 B B 0.41 Thru 4.3 A A 0.41 Thru 5.9 A A 0.69 Right 5.9 A A 0.32 Overall Intersection 6.6 A A 0.69 Left 22.7 C C 0.50 EB WB NB SB Thru 16.7 B C 0.50 Right 16.9 B C 0.50 Left 22.2 C B 0.07 Thru 16.2 B B 0.07 Right 16.4 B B 0.07 Left 9.6 A A 0.76 Thru 3.6 A A 0.76 Right 3.8 A A 0.76 Left 9.9 A C 0.98 Thru 4.0 A C 0.98 Right 4.1 A C 0.98 Overall Intersection 5.4 A B 0.98 Left 16.6 B C 0.30 EB Right 10.8 B C 0.30 NB SB Left 9.3 A A 0.58 Thru 3.3 A A 0.58 Thru 3.5 A A 0.95 Right 3.6 A A 0.95 Overall Intersection 3.8 A A 0.95 Note: Critical movements were shown in red in the table with V/C ratios 0.85 and or LOS E or worse The following individual movements are operating at LOS E or worse and/or with V/C greater than 0.85: AM Peak Hour No movement is predicted to be critical PM Peak Hour Creditview Road at Kenninghall Blvd southbound left, thru and right Creditview Road at Falconer Drive southbound thru and right RPT-Creditview EA Traffic Report _Final Docx 37
43 AECOM City of Mississauga Creditview Road EA, Traffic Report Final Report Table 12- Year 2031 Traffic Analysis Alternative 3 Intersection Creditview Road/Argentia Road (2-lane roundabout) Creditview Road/Kenninghall Blvd (Single lane roundabout) Creditview Road/Falconer Drive (Single lane roundabout) Weekday AM Weekday PM Delay Delay Approach/Movement (sec) LOS V/C (sec) LOS V/C Left 11.9 B C 0.68 EB Right 6.9 A B 0.74 NB SB Left 9.8 A B 0.37 Thru 4.5 A A 0.37 Thru 6.1 A A 0.73 Right 6.0 A A 0.34 Overall Intersection 6.8 A B 0.74 Left 30.0 C D 0.53 EB WB NB SB Thru 24.0 C C 0.53 Right 24.2 C C 0.53 Left 18.1 B B 0.05 Thru 12.1 B A 0.05 Right 12.3 B A 0.05 Left 9.5 A A 0.66 Thru 3.5 A A 0.66 Right 3.7 A A 0.66 Left 10.0 B C 0.97 Thru 4.0 A B 0.97 Right 4.2 A B 0.97 Overall Intersection 5.8 A B 0.97 Left 18.1 B D 0.39 EB Right 12.3 B C 0.39 NB SB Left 9.3 A A 0.51 Thru 3.3 A A 0.51 Thru 3.5 A A 0.99 Right 3.6 A B 0.99 Overall Intersection 3.9 A A 0.99 Note: Critical movements were shown in red in the table with V/C ratios 0.85 and or LOS E or worse The following individual movements are operating at LOS E or worse and/or with V/C greater than 0.85: AM Peak Hour No movement is predicted to be critical PM Peak Hour Creditview Road at Kenninghall Blvd southbound left, thru and right Creditview Road at Falconer Drive southbound thru and right RPT-Creditview EA Traffic Report _Final Docx 38
44 AECOM City of Mississauga Creditview Road EA, Traffic Report Final Report Future Traffic Queuing Analysis For the preferred interim solution (Alternative 3), the queue length analyses were also conducted to investigate the adequacy of the proposed storage capacity. The 50 th and 95 th percentile queue were estimated and compared to the available storage capacity. The queuing analyses were conducted using 2031 future traffic volumes. Table 13 summarizes the queuing results for the intersections of the study area. The 95 th queue is expected to exceed to the upstream intersection in the southbound approach of Creditview Road/ Kenninghall Boulevard due to the capacity constraints discussed earlier. Detailed Sidra outputs are provided in Appendix E. The 4-lane cross section along Creditview Road reduces to two lanes south of Argentia Road. The queue length at the location of the lane drop was also assessed using Synchro version 7 for the PM peak hour, and is provided in Table 13. The 95 th percentile queue is predicted to remain well below the available storage length in year Detailed Synchro outputs are provided in Appendix E. Table 13- Future Queuing Summary Year 2031 Alternative 3 Location Creditview Road/Old Creditview Road Creditview Road/Argentia Road Creditview Road/Falconer Drive Creditview Road/Kenninghall Blvd Creditview Road/Sir Monty s Drive/Bancroft Drive Lane drop south of Argentia Road Approach/ Movement NBL NBR SBL NBLT/NBT SBT/SBR EBL/EBR NBLT SBTR EBLR NBLTR WBLTR SBLTR EBLTR NBL SBL EBL WBL 95 th Percentile Queue (m) /20 25/15 10/ * AM Peak Hour 50 th Percentile Queue (m) /5 10/5 5/ PM Peak Hour 95 th Percentile Queue (m) 0 50* 25 15/20 55/10 45/ * th Percentile Queue (m) /5 25/5 20/ Existing Storage Length (m) Proposed Storage Length (m) SBT * The movement/lane is expected to be intermittently blocked during the peak hour Note: 1- for continuous lanes at roundabouts, the existing storage length is estimated based on the distance from the upstream intersection. 2- Queue lengths are rounded to the closest 5 meter * RPT-Creditview EA Traffic Report _Final Docx 39
45 AECOM City of Mississauga Creditview Road EA, Traffic Report Final Report Ultimate Design Alternatives Alternative 4: Signalized Design Concept The ultimate signalized design concept (Alternative 4), as shown in Figure 13, has traffic signals at Argentia Road, a stop sign at Falconer Drive, and traffic signals at Kenninghall Boulevard. The cross-section is 4-lanes from Old Creditview Road to Bancroft Drive. The intersections in the study area were analysed for horizon year 2031 using Synchro version 7. Horizon year 2031 The widening future traffic volumes were analysed for horizon year 2031 (Figure 9). Cycle lengths for all the study area signalized intersections were kept the same as existing but signal timings were optimized for future conditions. The traffic operational analysis results for the study area signalized and unsignalized intersections for horizon year 2031 are summarized in Table 14. Detailed Synchro outputs are provided in Appendix E. RPT-Creditview EA Traffic Report _Final Docx 40
46 Driveway Old Creditview Road Intersection Improvement Argentia Road Intersection Improvement Creditview Road Falconer Drive Intersection Improvement Kenninghall Boulevard Intersection Improvement Credit Meadows Park Riverun Park No Intersection Improvement Sir Monty s Drive Bancroft Drive LEGEND Lane Configuration Signalized Intersection Stop Sign Control Not to Scale Project: Creditview Road Environmental Assessment Title: Ultimate Signalized Design Concept (Alternative 4) Figure 13
47 AECOM City of Mississauga Creditview Road EA, Traffic Report Final Report Table 14- Year 2031 Traffic Analysis Alternative 4 Intersection Creditview Road/Old Creditview Road (Signalized) Creditview Road/Argentia Road (Signalized) Creditview Road/Kenninghall Blvd (Signalized) Creditview Road/Bancroft Drive/Sir Monty s Drive (Signalized) Creditview Road/Falconer Drive (Unsignalized) Creditview Road/Velebit Court (Unsignalized) Creditview Road/Rivergate Place (Unsignalized) Weekday AM Peak Hour Weekday PM Peak Hour Delay Delay Approach/Movement (sec) LOS V/C (sec) LOS V/C Left 20.2 C B 0.58 SB Thru-Right 9.1 A A 0.47 NB EB WB Left 11.0 B B 0.02 Thru 20.1 C C 0.50 Right 15.2 B D 0.27 Left-Thru 35.2 D D 0.08 Right 35.1 D C 0.01 Left-Thru 63.2 E E 0.79 Right 35.8 D D 0.16 Overall Intersection 19.8 B C 0.60 EB Left/Left 48.4 D D 0.71 Right 29.8 C D 0.82 NB Left/Left 49.7 D D 0.8 Thru/Thru 4.3 A B 0.29 SB Thru/Thru 17.8 B C 0.72 Right 5.1 A B 0.24 Overall Intersection 21.3 C C 0.75 Left 43.2 D D 0.19 EB Thru-Right 51.9 D D 0.14 WB NB Left 44.8 D D 0.2 Thru-Right 44.2 D D 0.08 Left 3.7 A E 0.93 Thru/Thru-Right 2 A A 0.52 Left 10.7 B B 0.18 SB Thru/Thru-Right 4.6 A B 0.85 Overall Intersection 6.7 A B 0.85 Left 44.6 D D 0.29 EB Thru-Right 48.4 D D 0.08 WB NB SB Left 58.0 E D 0.61 Thru-Right 43.6 D D 0.58 Left 10.2 B C 0.57 Thru/Thru-Right 12.9 B B 0.77 Left 4.3 A B 0.55 Thru/Thru-Right 13.8 B C 0.82 Overall Intersection 16.5 B C 0.74 Left 61.3 F 0.19 >1000 F 1.19 EB Right 12.5 B B 0.09 NB Left 13.0 B D 0.52 EB Left-Right F F 0.84 NB Left 15.2 C C 0.01 SB Left 17.0 C B 0.02 WB Left-Right F F 0.17 Note: Critical movements were shown in red in the table with V/C ratios 0.85 and or LOS E or worse RPT-Creditview EA Traffic Report _Final Docx 42
48 AECOM City of Mississauga Creditview Road EA, Traffic Report Final Report Based on the intersection capacity analyses results presented in Table 13, we found that all signalized intersections within the study area are expected to operate at acceptable overall levels of service C or better in both the AM and PM peak hours. With respect to overall V/C ratio, all signalized intersection are expected to operate at V/C ratio of 0.85 or better in AM peak hour and 0.90 or better in PM peak hour. With respect to individual movements, all movements will operate at a level of service D or better with V/C 0.85 or lower with exception of following: AM Peak Hour Creditview Road at Old Creditview Road westbound left-thru Creditview Road at Bancroft Drive westbound left Creditview Road at Falconer Drive eastbound left Creditview Road at Velebit Court eastbound left-right Creditview Road at Rivergate Place westbound left-right PM Peak Hour Creditview Road at Old Creditview Road westbound left-thru Creditview Road at Kenninghall Blvd northbound left Creditview Road at Falconer Drive eastbound left Creditview Road at Velebit Court eastbound left-right Creditview Road at Rivergate Place westbound left-right With the projected 2031 future traffic volumes and proposed improvements for Creditview Road corridor, all signalized intersections within the study area will continue to operate at overall satisfactory levels of service LOS C or better. All individual movements will operate below capacity with level of service E or better. It is noted that with four lane cross-section on Creditview Road, unsignalized intersections of Velebit Court and Rivergate Place are anticipated to experience significant delays due to minimal gaps available in north-south traffic on Creditview Road Alternative 5: Roundabout Design Concept (Long-term Solution) The ultimate roundabout design concept as shown in Figure 14 has 2-lane roundabouts at Argentia Road, Falconer Drive and Kenninghall Boulevard. The cross-section is 4-lanes from Old Creditview Road to Bancroft Drive. The intersections in the study area were analysed using Sidra version 6. Horizon year 2031 The widening future traffic volumes were analysed for horizon year 2031 (Figure 9). The traffic operational analysis results for horizon year 2031 are summarized in Table 15. Detailed Sidra outputs are provided in Appendix E. In 2031, with a widened Creditview Road, the two-lane roundabouts will operate with little delay. All intersections will operate with a LOS A for both peak hours. All individual movements will operate at LOS B or better with a V/C ratio less than RPT-Creditview EA Traffic Report _Final Docx 43
49 Driveway Old Creditview Road Intersection Improvement Argentia Road Intersection Improvement Creditview Road Falconer Drive Intersection Improvement Kenninghall Boulevard Intersection Improvement Credit Meadows Park Riverun Park No Intersection Improvement Sir Monty s Drive Bancroft Drive LEGEND Lane Configuration Signalized Intersection Not to Scale Project: Creditview Road Environmental Assessment Title: Ultimate Roundabout Design Concept (Alternative 5) Two Lane Roundabout Figure 14
50 AECOM City of Mississauga Creditview Road EA, Traffic Report Final Report Table 15 - Analysis Results for the Ultimate Roundabout Design (2031) Intersection Creditview Road/Argentia Road (2-lane roundabout) Creditview Road/Kenninghall Blvd (2-lane roundabout) Creditview Road/Falconer Drive (2-lane roundabout) Weekday AM Weekday PM Delay Delay Approach/Movement (sec) LOS V/C (sec) LOS V/C Left 11.1 B B 0.60 EB Right 6.1 A A 0.62 NB SB Left 11.1 B B 0.61 Thru 5.5 A A 0.61 Thru 14.9 B B 0.76 Right 14.3 B B 0.76 Overall Intersection 10.1 B A 0.76 Left 12.9 B B 0.32 EB WB NB SB Thru 7.7 A A 0.32 Right 7.5 A A 0.32 Left 14.1 B B 0.05 Thru 9.0 A A 0.05 Right 8.9 A A 0.05 Left 9.2 A A 0.61 Thru 4.0 A A 0.61 Right 4.2 A A 0.61 Left 9.5 A B 0.79 Thru 4.3 A A 0.79 Right 4.4 A A 0.79 Overall Intersection 4.6 A A 0.79 Left 12.0 B B 0.12 EB Right 6.7 A A 0.12 NB SB Left 9.1 A A 0.47 Thru 3.9 A A 0.47 Thru 4.1 A A 0.67 Right 4.2 A A 0.67 Overall Intersection 4.2 A A 0.67 RPT-Creditview EA Traffic Report _Final Docx 45
51 AECOM City of Mississauga Creditview Road EA, Traffic Report Final Report Future Traffic Queuing Analysis For the preferred long-term solution (Alternative 5), the queue length analyses were also conducted to investigate the adequacy of the proposed storage capacity. The 50 th and 95 th percentile queue were estimated and compared to the available storage capacity. The queuing analyses were conducted using 2031 future traffic volumes. Table 16 summarizes the queuing results for the intersections of the study area. The queue length on northbound left turn lane at Creditview Road/Old Creditview Road and westbound left turn lane at Creditview Road/Sir Mounty s may intermittently exceed the available storage capacity; however, the 95 th percentile queue is well below the available storage length for all other movements. Detailed Sidra outputs are provided in Appendix E. Table 16- Future Queuing Summary Year 2031 Alternative 5 Location Approach/Movem ent 95 th Percentile Queue (m) AM Peak Hour PM Peak Hour Existing 50 th Percentile Queue (m) 95 th Percentile Queue (m) 50 th Percentile Queue (m) Storage Length (m) Proposed Storage Length (m) Creditview Road/Old Creditview Road Creditview Road/Argentia Road Creditview Road/Falconer Drive Creditview Road/Kenninghall Blvd Creditview Road/Sir Monty s Drive/Bancroft Drive NBL NBR SBL NBLT/NBT SBT/SBTR EBL/EBR NBLT/NBT SBT/SBTR EBLR NBLT/NBTR WBLTR SBLT/SBTR EBLTR NBL SBL EBL WBL 5 60* 35 50/55 70/80 10/20 35/35 15/ / / * /20 30/30 5/10 15/15 5/5 0 15/ /10 5 * The movement/lane is expected to be intermittently blocked during the peak hour 0 100* 40 35/35 60/65 25/30 25/25 35/ / / * 25 15/15 25/25 10/15 10/10 15/ / /25 5 Note: 1- for continuous lanes at roundabouts, the existing storage length is estimated based on the distance from the upstream intersection. 2- Queue lengths are rounded to the closest 5 meter * RPT-Creditview EA Traffic Report _Final Docx 46
52 AECOM City of Mississauga Creditview Road EA, Traffic Report Final Report 4. Future Improvements Based on the foregoing traffic analysis for different design alternatives along Creditview Road corridor within the study area, two design concepts are recommended as interim and ultimate solutions. 4.1 Preferred Alternative (Interim Roundabout Design Concept) The following improvements are recommended for the preferred alternative: Widening the Creditview Road to a four lane cross-section between Old Creditview Road and south of Argentia Road intersection including the underpass at Highway 401; Introduction of northbound right turn lane at Creditview Road/Old Creditview Road intersection; Introduction of a two-lane roundabout at Creditview/Argentia Road intersection; Introduction of a one-lane roundabout at Creditview Road/Falconer Drive intersection; and, Introduction of a one-lane roundabout at Creditview Road/Kenninghall Blvd intersection. Figure 15 shows the recommended lane configuration for the preferred alternative. The preferred alternative drawings for interim solutions are provided in Appendix F. 4.2 Long-term Solution (Ultimate Roundabout Design Concept) The following improvements are recommended for the preferred alternative: Widening the Creditview Road to a four lane cross-section within the study area between Old Creditview Road and Bancroft Drive. Introduction of northbound right turn lane at Creditview Road/Old Creditview Road intersection; Introduction of a two-lane roundabout at Creditview/Argentia Road intersection; Introduction of a two-lane roundabout at Creditview Road/Falconer Drive intersection; and, Introduction of a two-lane roundabout at Creditview Road/Kenninghall Blvd intersection. Figure 16 shows the recommended lane configuration for the long-term solution. The preferred long-term solution drawings are provided in Appendix G. RPT-Creditview EA Traffic Report _Final Docx 47
53 Driveway Creditview Road Old Creditview Road Argentia Road Rivergate Place Former Harris Park Falconer Drive Credit Meadows Park Kenninghall Boulevard Kenninghall Crescent Velebit Court Riverun Park LEGEND Lane Configuration Sir Monty s Drive Signalized Intersection Bancroft Drive Stop Sign Control Single-Lane Roundabout Two- Lane Roundabout Not to Scale Project: Creditview Road Environmental Assessment Title: Recommended Lane Configuration For the Interim Solution Figure 15
54 Driveway Creditview Road Old Creditview Road Argentia Road Rivergate Place Former Harris Park Falconer Drive Credit Meadows Park Kenninghall Boulevard Kenninghall Crescent Velebit Court Riverun Park LEGEND Lane Configuration Sir Monty s Drive Signalized Intersection Bancroft Drive Stop Sign Control Single-Lane Roundabout Two-Lane Roundabout Not to Scale Project: Creditview Road Environmental Assessment Title: Recommended Lane Configuration For the Long- term Solution Figure 16
55 AECOM City of Mississauga Creditview Road EA, Traffic Report Final Report 5. Summary of Conclusions and Recommendations The traffic analyses presented in the report provide the following conclusions: Existing Traffic Conditions 1. Based on the Synchro analysis, weekday PM peak hour is the governing peak hour under existing conditions. Argentia Road, Kenninghall Road and Bancroft Drive intersections with Creditview Road are key intersections in the study area. 2. Based on the existing conditions capacity analysis it is found that all signalized and unsignalized intersections within the study area operate at or above capacity with significant delays during both the AM and PM peak hours. Also with respect to the individual movements, northbound/southbound thru movements on Creditview Road operate above capacity in the peak direction during the weekday AM or PM peak hours. 3. Based on the review of the existing turning movement counts within the study area it is noted that Creditview Road currently carries approximately 1200 to 1400 vehicles in a single lane in the peak direction during the weekday AM or PM peak hours. Typically a single lane can carry approximately 900 to 1,200 vehicles per hour, therefore, Creditview Road is already at capacity under existing conditions. 4. It is concluded from the existing traffic conditions that Creditview Road needs intersection improvements and/or additional lanes in order to address present and future traffic operational deficiencies. Future Traffic Conditions 5. City of Mississauga has provided the latest growth forecasts for the Creditview Road study area for year 2021 and year Future forecast results were provided for the two following cases: No-Widening: The existing cross-section will be maintained on Creditview Road Widening: Creditview Road widened to a four lane cross-section The overall growth rates were applied to the north-south traffic volumes on Creditview Road. The overall growth ranges between 7% to 18% for No-Widening and 29% to 61% for Widening conditions for northbound and southbound directions. 6. Under future traffic conditions in horizon years 2021 and 2031 for no-widening conditions, all study area signalized and unsignalized intersections are expected to operate above capacity with significant delays during both the future horizon years without any improvements. Therefore, Creditview Road needs intersection improvements and/or additional lanes in order to address present and future traffic operational deficiencies. Recommended Geometric Improvements Interim Design 7. Three interim design alternatives were defined to assess signalized and roundabout concepts. Under the interim design alternatives, the Creditview Road cross-section is 4-lanes from Old Creditview Road to Argentia Road and 2-lanes from Argentia Road to Bancroft Drive. 8. Based on the foregoing traffic analysis along Creditview Road corridor within the study area, the following improvements are recommended: RPT-Creditview EA Traffic Report _Final Docx 50
56 AECOM City of Mississauga Creditview Road EA, Traffic Report Final Report Widening the Creditview Road to a four lane cross-section between Old Creditview Road and south of Argentia Road intersection including the underpass at Highway 401 Introduction of northbound right turn lane at Creditview Road/Old Creditview Road intersection Introduction of a two-lane roundabout at Creditview/Argentia Road intersection Introduction of a one-lane roundabout at Creditview Road/Falconer Drive intersection. Introduction of a one-lane roundabout at Creditview Road/Kenninghall Blvd intersection. 9. Under future conditions with recommended improvements on Creditview Road all signalized intersections and roundabouts within the study area will operate at overall level of service C or better with volume to capacity ratio below 1; however, southbound direction of Creditview Road/Kenninghall Blvd is predicted to operate over capacity. The high future traffic volumes along Creditview Road will likely encourage drivers to adjust their time of travel. This will result in spreading of the peak period of travel over a greater length of time. Recommended Geometric Improvements Ultimate Design 10. Two ultimate design alternatives were defined to assess signalized and roundabout concepts. Under the ultimate design alternatives, the Creditview Road cross-section is 4-lanes from Old Creditview Road to Bancroft Drive. 11. Based on the foregoing traffic analysis along Creditview Road corridor within the study area, the following improvements are recommended: Widening the Creditview Road to a four lane cross-section within the study area; Introduction of northbound right turn lane at Creditview Road/Old Creditview Road intersection; Introduction of a two-lane roundabout at Creditview/Argentia Road intersection; Introduction of a two-lane roundabout at Creditview Road/Falconer Drive intersection; and, Introduction of a two-lane roundabout at Creditview Road/Kenninghall Blvd intersection. 12. Under future conditions with recommended improvements on Creditview Road all signalized intersections and roundabouts within the study area will operate at overall satisfactory levels of service LOS C or better. All individual movements are predicted operate below capacity with level of service LOS D or better except a few individual movements for signalized intersection are predicted to operate at LOS E but well below capacity. RPT-Creditview EA Traffic Report _Final Docx 51
57 AECOM City of Mississauga Creditview Road EA, Traffic Report Final Report APPENDICES
58 AECOM City of Mississauga Creditview Road EA, Traffic Report Final Report APPENDIX A Existing Average Daily Traffic (ADT) Data
59 Creditview NB and SB (Bancroft-Velecit) Traffic (Vehicle/ Hour) May Creditview NB (Bancroft- Velecit) May Creditview SB (Bancroft- Velecit) 0 0:00-1:00 1:00-2:00 2:00-3:00 3:00-4:00 4:00-5:00 5:00-6:00 6:00-7:00 7:00-8:00 8:00-9:00 9:00-10:00 10:00-11:00 11:00-12:00 12:00-13:00 13:00-14:00 14:00-15:00 15:00-16:00 16:00-17:00 17:00-18:00 18:00-19:00 19:00-20:00 20:00-21:00 21:00-22:00 22:00-23:00 23:00-24:00
60 900 Creditview NB and SB (401-Old Creditview) 800 Traffic (Vehicle/ Hour) May Creditview NB (401-Old Creditview) May Creditview SB (401-Old Creditview) :00-1:00 1:00-2:00 2:00-3:00 3:00-4:00 4:00-5:00 5:00-6:00 6:00-7:00 7:00-8:00 8:00-9:00 9:00-10:00 10:00-11:00 11:00-12:00 12:00-13:00 13:00-14:00 14:00-15:00 15:00-16:00 16:00-17:00 17:00-18:00 18:00-19:00 19:00-20:00 20:00-21:00 21:00-22:00 22:00-23:00 23:00-24:00
61 AECOM City of Mississauga Creditview Road EA, Traffic Report Final Report APPENDIX B Existing Turning Movement Counts/Signal Timings
62
63
64
65
66
67
68
69
70
71
72
73
74
75
76
77
78
79
80 AECOM City of Mississauga Creditview Road EA, Traffic Report Final Report APPENDIX C Existing Intersections Capacity Analysis
81 Timings Creditview Road EA - Exisitng Conditions 3: Creditview Road & Old Creditview Road AM Peak Hour Lane Group EBL EBT EBR WBL WBT NBL NBT NBR SBL SBT SBR Lane Configurations Volume (vph) Turn Type pm+pt Perm Perm Perm Perm Perm Perm Protected Phases Permitted Phases Detector Phase Switch Phase Minimum Initial (s) Minimum Split (s) Total Split (s) Total Split (%) 12.7% 68.2% 68.2% 55.5% 55.5% 31.8% 31.8% 31.8% 31.8% 31.8% 31.8% Yellow Time (s) All-Red Time (s) Lost Time Adjust (s) Total Lost Time (s) Lead/Lag Lead Lag Lag Lead-Lag Optimize? Yes Yes Yes Recall Mode None C-Max C-Max C-Max C-Max None None None None None None Act Effct Green (s) Actuated g/c Ratio v/c Ratio Control Delay Queue Delay Total Delay LOS A B A B B C B E A Approach Delay Approach LOS B B C D Intersection Summary Cycle Length: 110 Actuated Cycle Length: 110 Offset: 79 (72%), Referenced to phase 2:EBTL and 6:WBTL, Start of Green Natural Cycle: 80 Control Type: Actuated-Coordinated Maximum v/c Ratio: 0.81 Intersection Signal Delay: 20.5 Intersection LOS: C Intersection Capacity Utilization 77.5% ICU Level of Service D Analysis Period (min) 60 Splits and Phases: 3: Creditview Road & Old Creditview Road 04/10/2014 Synchro 7 - Report Page 1
82 Timings Creditview Road EA - Exisitng Conditions 5: Argentia Road & Creditview Road AM Peak Hour Lane Group EBL EBR NBL NBT SBT SBR Lane Configurations Volume (vph) Turn Type pm+ov pm+pt Perm Protected Phases Permitted Phases Detector Phase Switch Phase Minimum Initial (s) Minimum Split (s) Total Split (s) Total Split (%) 26.4% 22.7% 22.7% 73.6% 50.9% 50.9% Yellow Time (s) All-Red Time (s) Lost Time Adjust (s) Total Lost Time (s) Lead/Lag Lead Lead Lag Lag Lead-Lag Optimize? Yes Yes Yes Yes Recall Mode None None None C-Max C-Max C-Max Act Effct Green (s) Actuated g/c Ratio v/c Ratio Control Delay Queue Delay Total Delay LOS E B B A B A Approach Delay Approach LOS C B B Intersection Summary Cycle Length: 110 Actuated Cycle Length: 110 Offset: 0 (0%), Referenced to phase 2:NBTL and 6:SBT, Start of Green, Master Intersection Natural Cycle: 75 Control Type: Actuated-Coordinated Maximum v/c Ratio: 0.79 Intersection Signal Delay: 15.5 Intersection LOS: B Intersection Capacity Utilization 83.3% ICU Level of Service E Analysis Period (min) 60 Splits and Phases: 5: Argentia Road & Creditview Road 04/10/2014 Synchro 7 - Report Page 2
83 Timings Creditview Road EA - Exisitng Conditions 9: Kenninghall Blvd & Creditview Road AM Peak Hour Lane Group EBL EBT WBL WBT NBL NBT SBL SBT Lane Configurations Volume (vph) Turn Type Perm Perm Perm Perm Protected Phases Permitted Phases Detector Phase Switch Phase Minimum Initial (s) Minimum Split (s) Total Split (s) Total Split (%) 29.1% 29.1% 29.1% 29.1% 70.9% 70.9% 70.9% 70.9% Yellow Time (s) All-Red Time (s) Lost Time Adjust (s) Total Lost Time (s) Lead/Lag Lead-Lag Optimize? Recall Mode None None None None C-Max C-Max C-Max C-Max Act Effct Green (s) Actuated g/c Ratio v/c Ratio Control Delay Queue Delay Total Delay LOS C F A A A A Approach Delay Approach LOS C F A A Intersection Summary Cycle Length: 110 Actuated Cycle Length: 110 Offset: 42 (38%), Referenced to phase 2:NBTL and 6:SBTL, Start of Green Natural Cycle: 90 Control Type: Actuated-Coordinated Maximum v/c Ratio: 0.92 Intersection Signal Delay: 15.5 Intersection LOS: B Intersection Capacity Utilization 84.9% ICU Level of Service E Analysis Period (min) 60 Splits and Phases: 9: Kenninghall Blvd & Creditview Road 04/10/2014 Synchro 7 - Report Page 3
84 Timings Creditview Road EA - Exisitng Conditions 12: Sir Monty's Drive & Creditview Road AM Peak Hour Lane Group EBL EBT WBL WBT NBL NBT NBR SBL SBT Lane Configurations Volume (vph) Turn Type Perm Perm Perm Perm Perm Protected Phases Permitted Phases Detector Phase Switch Phase Minimum Initial (s) Minimum Split (s) Total Split (s) Total Split (%) 30.0% 30.0% 30.0% 30.0% 70.0% 70.0% 70.0% 70.0% 70.0% Yellow Time (s) All-Red Time (s) Lost Time Adjust (s) Total Lost Time (s) Lead/Lag Lead-Lag Optimize? Recall Mode None None None None C-Max C-Max C-Max C-Max C-Max Act Effct Green (s) Actuated g/c Ratio v/c Ratio Control Delay Queue Delay Total Delay LOS D D E B A B A B A Approach Delay Approach LOS D D B A Intersection Summary Cycle Length: 110 Actuated Cycle Length: 110 Offset: 6 (5%), Referenced to phase 2:NBTL and 6:SBTL, Start of Green Natural Cycle: 90 Control Type: Actuated-Coordinated Maximum v/c Ratio: 0.76 Intersection Signal Delay: 14.6 Intersection LOS: B Intersection Capacity Utilization 86.3% ICU Level of Service E Analysis Period (min) 60 Splits and Phases: 12: Sir Monty's Drive & Creditview Road 04/10/2014 Synchro 7 - Report Page 4
85 HCM Signalized Intersection Capacity Analysis Creditview Road EA - Exisitng Conditions 3: Creditview Road & Old Creditview Road AM Peak Hour Movement EBL EBT EBR WBL WBT WBR NBL NBT NBR SBL SBT SBR Lane Configurations Volume (vph) Ideal Flow (vphpl) Total Lost time (s) Lane Util. Factor Frt Flt Protected Satd. Flow (prot) Flt Permitted Satd. Flow (perm) Peak-hour factor, PHF Adj. Flow (vph) RTOR Reduction (vph) Lane Group Flow (vph) Heavy Vehicles (%) 4% 4% 7% 0% 4% 8% 0% 0% 0% 2% 0% 6% Turn Type pm+pt Perm Perm Perm Perm Perm Perm Protected Phases Permitted Phases Actuated Green, G (s) Effective Green, g (s) Actuated g/c Ratio Clearance Time (s) Vehicle Extension (s) Lane Grp Cap (vph) v/s Ratio Prot 0.03 c v/s Ratio Perm c v/c Ratio Uniform Delay, d Progression Factor Incremental Delay, d Delay (s) Level of Service A B A B B C C E D Approach Delay (s) Approach LOS B B C D Intersection Summary HCM Average Control Delay 20.6 HCM Level of Service C HCM Volume to Capacity ratio 0.64 Actuated Cycle Length (s) Sum of lost time (s) 14.0 Intersection Capacity Utilization 77.5% ICU Level of Service D Analysis Period (min) 60 c Critical Lane Group 04/10/2014 Synchro 7 - Report Page 1
86 HCM Signalized Intersection Capacity Analysis Creditview Road EA - Exisitng Conditions 5: Argentia Road & Creditview Road AM Peak Hour Movement EBL EBR NBL NBT SBT SBR Lane Configurations Volume (vph) Ideal Flow (vphpl) Total Lost time (s) Lane Util. Factor Frt Flt Protected Satd. Flow (prot) Flt Permitted Satd. Flow (perm) Peak-hour factor, PHF Adj. Flow (vph) RTOR Reduction (vph) Lane Group Flow (vph) Heavy Vehicles (%) 5% 3% 2% 3% 5% 2% Turn Type pm+ov pm+pt Perm Protected Phases Permitted Phases Actuated Green, G (s) Effective Green, g (s) Actuated g/c Ratio Clearance Time (s) Vehicle Extension (s) Lane Grp Cap (vph) v/s Ratio Prot c c v/s Ratio Perm 0.10 c v/c Ratio Uniform Delay, d Progression Factor Incremental Delay, d Delay (s) Level of Service E C B A B A Approach Delay (s) Approach LOS D A B Intersection Summary HCM Average Control Delay 17.6 HCM Level of Service B HCM Volume to Capacity ratio 0.78 Actuated Cycle Length (s) Sum of lost time (s) 10.0 Intersection Capacity Utilization 83.3% ICU Level of Service E Analysis Period (min) 60 c Critical Lane Group 04/10/2014 Synchro 7 - Report Page 2
87 HCM Unsignalized Intersection Capacity Analysis Creditview Road EA - Exisitng Conditions 7: Falconer Drive & Creditview Road AM Peak Hour Movement EBL EBR NBL NBT SBT SBR Lane Configurations Volume (veh/h) Sign Control Stop Free Free Grade 0% 0% 0% Peak Hour Factor Hourly flow rate (vph) Pedestrians Lane Width (m) Walking Speed (m/s) Percent Blockage Right turn flare (veh) Median type None None Median storage veh) Upstream signal (m) px, platoon unblocked vc, conflicting volume vc1, stage 1 conf vol vc2, stage 2 conf vol vcu, unblocked vol tc, single (s) tc, 2 stage (s) tf (s) p0 queue free % cm capacity (veh/h) Direction, Lane # EB 1 EB 2 NB 1 NB 2 SB 1 Volume Total Volume Left Volume Right csh Volume to Capacity Queue Length 95th (m) Control Delay (s) Lane LOS F C B Approach Delay (s) Approach LOS F Intersection Summary Average Delay 5.4 Intersection Capacity Utilization 72.9% ICU Level of Service C Analysis Period (min) 60 04/10/2014 Synchro 7 - Report Page 3
88 HCM Signalized Intersection Capacity Analysis Creditview Road EA - Exisitng Conditions 9: Kenninghall Blvd & Creditview Road AM Peak Hour Movement EBL EBT EBR WBL WBT WBR NBL NBT NBR SBL SBT SBR Lane Configurations Volume (vph) Ideal Flow (vphpl) Total Lost time (s) Lane Util. Factor Frt Flt Protected Satd. Flow (prot) Flt Permitted Satd. Flow (perm) Peak-hour factor, PHF Adj. Flow (vph) RTOR Reduction (vph) Lane Group Flow (vph) Heavy Vehicles (%) 0% 0% 0% 0% 20% 61% 11% 2% 60% 75% 2% 0% Turn Type Perm Perm Perm Perm Protected Phases Permitted Phases Actuated Green, G (s) Effective Green, g (s) Actuated g/c Ratio Clearance Time (s) Vehicle Extension (s) Lane Grp Cap (vph) v/s Ratio Prot c v/s Ratio Perm 0.06 c v/c Ratio Uniform Delay, d Progression Factor Incremental Delay, d Delay (s) Level of Service D F A A A A Approach Delay (s) Approach LOS D F A A Intersection Summary HCM Average Control Delay 15.9 HCM Level of Service B HCM Volume to Capacity ratio 0.81 Actuated Cycle Length (s) Sum of lost time (s) 12.0 Intersection Capacity Utilization 84.9% ICU Level of Service E Analysis Period (min) 60 c Critical Lane Group 04/10/2014 Synchro 7 - Report Page 4
89 HCM Signalized Intersection Capacity Analysis Creditview Road EA - Exisitng Conditions 12: Sir Monty's Drive & Creditview Road AM Peak Hour Movement EBL EBT EBR WBL WBT WBR NBL NBT NBR SBL SBT SBR Lane Configurations Volume (vph) Ideal Flow (vphpl) Total Lost time (s) Lane Util. Factor Frt Flt Protected Satd. Flow (prot) Flt Permitted Satd. Flow (perm) Peak-hour factor, PHF Adj. Flow (vph) RTOR Reduction (vph) Lane Group Flow (vph) Heavy Vehicles (%) 13% 6% 6% 1% 13% 7% 13% 2% 2% 38% 2% 36% Turn Type Perm Perm Perm Perm Perm Protected Phases Permitted Phases Actuated Green, G (s) Effective Green, g (s) Actuated g/c Ratio Clearance Time (s) Vehicle Extension (s) Lane Grp Cap (vph) v/s Ratio Prot c v/s Ratio Perm 0.03 c v/c Ratio Uniform Delay, d Progression Factor Incremental Delay, d Delay (s) Level of Service D D E D A B A A A Approach Delay (s) Approach LOS D D B A Intersection Summary HCM Average Control Delay 14.4 HCM Level of Service B HCM Volume to Capacity ratio 0.75 Actuated Cycle Length (s) Sum of lost time (s) 13.0 Intersection Capacity Utilization 86.3% ICU Level of Service E Analysis Period (min) 60 c Critical Lane Group 04/10/2014 Synchro 7 - Report Page 5
90 HCM Unsignalized Intersection Capacity Analysis Creditview Road EA - Exisitng Conditions 19: Creditview Road & Velebit Court AM Peak Hour Movement SET SER NWL NWT NEL NER Lane Configurations Volume (veh/h) Sign Control Free Free Stop Grade 0% 0% 0% Peak Hour Factor Hourly flow rate (vph) Pedestrians Lane Width (m) Walking Speed (m/s) Percent Blockage Right turn flare (veh) Median type None None Median storage veh) Upstream signal (m) 204 px, platoon unblocked vc, conflicting volume vc1, stage 1 conf vol vc2, stage 2 conf vol vcu, unblocked vol tc, single (s) 4.1 *5.3 *5.3 tc, 2 stage (s) tf (s) p0 queue free % cm capacity (veh/h) Direction, Lane # SE 1 NW 1 NW 2 NE 1 Volume Total Volume Left Volume Right csh Volume to Capacity Queue Length 95th (m) Err Control Delay (s) Err Lane LOS C F Approach Delay (s) Err Approach LOS F Intersection Summary Average Delay 44.5 Intersection Capacity Utilization 76.7% ICU Level of Service D Analysis Period (min) 60 * User Entered Value 04/10/2014 Synchro 7 - Report Page 6
91 HCM Unsignalized Intersection Capacity Analysis Creditview Road EA - Exisitng Conditions 20: Creditview Road & Rivergate Place AM Peak Hour Movement SEL SET NWT NWR SWL SWR Lane Configurations Volume (veh/h) Sign Control Free Free Stop Grade 0% 0% 0% Peak Hour Factor Hourly flow rate (vph) Pedestrians Lane Width (m) Walking Speed (m/s) Percent Blockage Right turn flare (veh) Median type None None Median storage veh) Upstream signal (m) 241 px, platoon unblocked vc, conflicting volume vc1, stage 1 conf vol vc2, stage 2 conf vol vcu, unblocked vol tc, single (s) 4.1 *5.4 *5.4 tc, 2 stage (s) tf (s) p0 queue free % cm capacity (veh/h) Direction, Lane # SE 1 SE 2 NW 1 SW 1 Volume Total Volume Left Volume Right csh Volume to Capacity Queue Length 95th (m) Err Control Delay (s) Err Lane LOS C F Approach Delay (s) Err Approach LOS F Intersection Summary Average Delay 73.1 Intersection Capacity Utilization 74.6% ICU Level of Service D Analysis Period (min) 60 * User Entered Value 04/10/2014 Synchro 7 - Report Page 7
92 Timings Creditview Road EA -Existing Conditions 3: Creditview Road & Old Creditview Road PM Peak Hour Lane Group EBL EBT EBR WBL WBT NBL NBT NBR SBL SBT SBR Lane Configurations Volume (vph) Turn Type pm+pt Perm Perm Perm Perm Perm Perm Protected Phases Permitted Phases Detector Phase Switch Phase Minimum Initial (s) Minimum Split (s) Total Split (s) Total Split (%) 11.8% 66.4% 66.4% 54.5% 54.5% 33.6% 33.6% 33.6% 33.6% 33.6% 33.6% Yellow Time (s) All-Red Time (s) Lost Time Adjust (s) Total Lost Time (s) Lead/Lag Lead Lag Lag Lead-Lag Optimize? Recall Mode None C-Max C-Max C-Max C-Max None None None None None None Act Effct Green (s) Actuated g/c Ratio v/c Ratio Control Delay Queue Delay Total Delay LOS A B A C C C B E A Approach Delay Approach LOS B C C D Intersection Summary Cycle Length: 110 Actuated Cycle Length: 110 Offset: 54 (49%), Referenced to phase 2:EBTL and 6:WBTL, Start of Green Natural Cycle: 80 Control Type: Actuated-Coordinated Maximum v/c Ratio: 0.79 Intersection Signal Delay: 22.5 Intersection LOS: C Intersection Capacity Utilization 80.8% ICU Level of Service D Analysis Period (min) 60 Splits and Phases: 3: Creditview Road & Old Creditview Road 04/10/2014 Synchro 7 - Report AECOM Page 1
93 Timings Creditview Road EA -Existing Conditions 5: Argentia Road & Creditview Road PM Peak Hour Lane Group EBL EBR NBL NBT SBT SBR Lane Configurations Volume (vph) Turn Type pm+ov pm+pt Perm Protected Phases Permitted Phases Detector Phase Switch Phase Minimum Initial (s) Minimum Split (s) Total Split (s) Total Split (%) 28.2% 21.8% 21.8% 71.8% 50.0% 50.0% Yellow Time (s) All-Red Time (s) Lost Time Adjust (s) Total Lost Time (s) Lead/Lag Lead Lead Lag Lag Lead-Lag Optimize? Yes Yes Yes Yes Recall Mode None None None C-Max C-Max C-Max Act Effct Green (s) Actuated g/c Ratio v/c Ratio Control Delay Queue Delay Total Delay LOS F C F A D A Approach Delay Approach LOS F D D Intersection Summary Cycle Length: 110 Actuated Cycle Length: 110 Offset: 0 (0%), Referenced to phase 2:NBTL and 6:SBT, Start of Green, Master Intersection Natural Cycle: 90 Control Type: Actuated-Coordinated Maximum v/c Ratio: 1.05 Intersection Signal Delay: 60.6 Intersection LOS: E Intersection Capacity Utilization 99.8% ICU Level of Service F Analysis Period (min) 60 Splits and Phases: 5: Argentia Road & Creditview Road 04/10/2014 Synchro 7 - Report AECOM Page 2
94 Timings Creditview Road EA -Existing Conditions 9: Kenninghall Blvd & Creditview Road PM Peak Hour Lane Group EBL EBT WBL WBT NBL NBT SBL SBT Lane Configurations Volume (vph) Turn Type Perm Perm pm+pt Perm Protected Phases Permitted Phases Detector Phase Switch Phase Minimum Initial (s) Minimum Split (s) Total Split (s) Total Split (%) 27.3% 27.3% 27.3% 27.3% 11.8% 72.7% 60.9% 60.9% Yellow Time (s) All-Red Time (s) Lost Time Adjust (s) Total Lost Time (s) Lead/Lag Lead Lag Lag Lead-Lag Optimize? Yes Yes Yes Recall Mode None None None None None C-Max C-Max C-Max Act Effct Green (s) Actuated g/c Ratio v/c Ratio Control Delay Queue Delay Total Delay LOS C D F A A E Approach Delay Approach LOS C D C E Intersection Summary Cycle Length: 110 Actuated Cycle Length: 110 Offset: 32 (29%), Referenced to phase 2:NBTL and 6:SBTL, Start of Green Natural Cycle: 150 Control Type: Actuated-Coordinated Maximum v/c Ratio: 1.01 Intersection Signal Delay: 43.0 Intersection LOS: D Intersection Capacity Utilization 103.6% ICU Level of Service G Analysis Period (min) 60 Splits and Phases: 9: Kenninghall Blvd & Creditview Road 04/10/2014 Synchro 7 - Report AECOM Page 3
95 Timings Creditview Road EA -Existing Conditions 12: Sir Monty's Drive & Creditview Road PM Peak Hour Lane Group EBL EBT WBL WBT NBL NBT NBR SBL SBT Lane Configurations Volume (vph) Turn Type Perm Perm Perm Perm Perm Protected Phases Permitted Phases Detector Phase Switch Phase Minimum Initial (s) Minimum Split (s) Total Split (s) Total Split (%) 30.0% 30.0% 30.0% 30.0% 70.0% 70.0% 70.0% 70.0% 70.0% Yellow Time (s) All-Red Time (s) Lost Time Adjust (s) Total Lost Time (s) Lead/Lag Lead-Lag Optimize? Recall Mode None None None None C-Max C-Max C-Max C-Max C-Max Act Effct Green (s) Actuated g/c Ratio v/c Ratio Control Delay Queue Delay Total Delay LOS D C E C A B A B A Approach Delay Approach LOS D D B A Intersection Summary Cycle Length: 110 Actuated Cycle Length: 110 Offset: 21 (19%), Referenced to phase 2:NBTL and 6:SBTL, Start of Green Natural Cycle: 90 Control Type: Actuated-Coordinated Maximum v/c Ratio: 0.72 Intersection Signal Delay: 14.2 Intersection LOS: B Intersection Capacity Utilization 88.3% ICU Level of Service E Analysis Period (min) 60 Splits and Phases: 12: Sir Monty's Drive & Creditview Road 04/10/2014 Synchro 7 - Report AECOM Page 4
96 HCM Signalized Intersection Capacity Analysis Creditview Road EA -Existing Conditions 3: Creditview Road & Old Creditview Road PM Peak Hour Movement EBL EBT EBR WBL WBT WBR NBL NBT NBR SBL SBT SBR Lane Configurations Volume (vph) Ideal Flow (vphpl) Total Lost time (s) Lane Util. Factor Frt Flt Protected Satd. Flow (prot) Flt Permitted Satd. Flow (perm) Peak-hour factor, PHF Adj. Flow (vph) RTOR Reduction (vph) Lane Group Flow (vph) Heavy Vehicles (%) 8% 1% 8% 0% 1% 2% 6% 0% 0% 1% 0% 4% Turn Type pm+pt Perm Perm Perm Perm Perm Perm Protected Phases Permitted Phases Actuated Green, G (s) Effective Green, g (s) Actuated g/c Ratio Clearance Time (s) Vehicle Extension (s) Lane Grp Cap (vph) v/s Ratio Prot 0.03 c v/s Ratio Perm c v/c Ratio Uniform Delay, d Progression Factor Incremental Delay, d Delay (s) Level of Service A B A B C D C E D Approach Delay (s) Approach LOS B C D D Intersection Summary HCM Average Control Delay 24.1 HCM Level of Service C HCM Volume to Capacity ratio 0.66 Actuated Cycle Length (s) Sum of lost time (s) 14.0 Intersection Capacity Utilization 80.8% ICU Level of Service D Analysis Period (min) 60 c Critical Lane Group 04/10/2014 Synchro 7 - Report AECOM Page 1
97 HCM Signalized Intersection Capacity Analysis Creditview Road EA -Existing Conditions 5: Argentia Road & Creditview Road PM Peak Hour Movement EBL EBR NBL NBT SBT SBR Lane Configurations Volume (vph) Ideal Flow (vphpl) Total Lost time (s) Lane Util. Factor Frt Flt Protected Satd. Flow (prot) Flt Permitted Satd. Flow (perm) Peak-hour factor, PHF Adj. Flow (vph) RTOR Reduction (vph) Lane Group Flow (vph) Heavy Vehicles (%) 1% 1% 3% 1% 2% 0% Turn Type pm+ov pm+pt Perm Protected Phases Permitted Phases Actuated Green, G (s) Effective Green, g (s) Actuated g/c Ratio Clearance Time (s) Vehicle Extension (s) Lane Grp Cap (vph) v/s Ratio Prot c c v/s Ratio Perm 0.16 c v/c Ratio Uniform Delay, d Progression Factor Incremental Delay, d Delay (s) Level of Service F C F A D B Approach Delay (s) Approach LOS F D D Intersection Summary HCM Average Control Delay 64.3 HCM Level of Service E HCM Volume to Capacity ratio 0.95 Actuated Cycle Length (s) Sum of lost time (s) 10.0 Intersection Capacity Utilization 99.8% ICU Level of Service F Analysis Period (min) 60 c Critical Lane Group 04/10/2014 Synchro 7 - Report AECOM Page 2
98 HCM Unsignalized Intersection Capacity Analysis Creditview Road EA -Existing Conditions 7: Falconer Drive & Creditview Road PM Peak Hour Movement EBL EBR NBL NBT SBT SBR Lane Configurations Volume (veh/h) Sign Control Stop Free Free Grade 0% 0% 0% Peak Hour Factor Hourly flow rate (vph) Pedestrians Lane Width (m) Walking Speed (m/s) Percent Blockage Right turn flare (veh) Median type None None Median storage veh) Upstream signal (m) px, platoon unblocked vc, conflicting volume vc1, stage 1 conf vol vc2, stage 2 conf vol vcu, unblocked vol tc, single (s) tc, 2 stage (s) tf (s) p0 queue free % cm capacity (veh/h) Direction, Lane # EB 1 EB 2 NB 1 NB 2 SB 1 Volume Total Volume Left Volume Right csh Volume to Capacity Queue Length 95th (m) Control Delay (s) Lane LOS F E C Approach Delay (s) Approach LOS F Intersection Summary Average Delay 3.3 Intersection Capacity Utilization 96.5% ICU Level of Service F Analysis Period (min) 60 04/10/2014 Synchro 7 - Report AECOM Page 3
99 HCM Signalized Intersection Capacity Analysis Creditview Road EA -Existing Conditions 9: Kenninghall Blvd & Creditview Road PM Peak Hour Movement EBL EBT EBR WBL WBT WBR NBL NBT NBR SBL SBT SBR Lane Configurations Volume (vph) Ideal Flow (vphpl) Total Lost time (s) Lane Util. Factor Frt Flt Protected Satd. Flow (prot) Flt Permitted Satd. Flow (perm) Peak-hour factor, PHF Adj. Flow (vph) RTOR Reduction (vph) Lane Group Flow (vph) Heavy Vehicles (%) 0% 0% 1% 0% 11% 0% 1% 2% 0% 75% 2% 0% Turn Type Perm Perm pm+pt Perm Protected Phases Permitted Phases Actuated Green, G (s) Effective Green, g (s) Actuated g/c Ratio Clearance Time (s) Vehicle Extension (s) Lane Grp Cap (vph) v/s Ratio Prot c c0.70 v/s Ratio Perm 0.02 c v/c Ratio Uniform Delay, d Progression Factor Incremental Delay, d Delay (s) Level of Service D D F A A E Approach Delay (s) Approach LOS D D C E Intersection Summary HCM Average Control Delay 43.3 HCM Level of Service D HCM Volume to Capacity ratio 0.94 Actuated Cycle Length (s) Sum of lost time (s) 15.0 Intersection Capacity Utilization 103.6% ICU Level of Service G Analysis Period (min) 60 c Critical Lane Group 04/10/2014 Synchro 7 - Report AECOM Page 4
100 HCM Signalized Intersection Capacity Analysis Creditview Road EA -Existing Conditions 12: Sir Monty's Drive & Creditview Road PM Peak Hour Movement EBL EBT EBR WBL WBT WBR NBL NBT NBR SBL SBT SBR Lane Configurations Volume (vph) Ideal Flow (vphpl) Total Lost time (s) Lane Util. Factor Frt Flt Protected Satd. Flow (prot) Flt Permitted Satd. Flow (perm) Peak-hour factor, PHF Adj. Flow (vph) RTOR Reduction (vph) Lane Group Flow (vph) Heavy Vehicles (%) 0% 0% 5% 1% 0% 4% 2% 2% 1% 1% 1% 0% Turn Type Perm Perm Perm Perm Perm Protected Phases Permitted Phases Actuated Green, G (s) Effective Green, g (s) Actuated g/c Ratio Clearance Time (s) Vehicle Extension (s) Lane Grp Cap (vph) v/s Ratio Prot c v/s Ratio Perm 0.04 c v/c Ratio Uniform Delay, d Progression Factor Incremental Delay, d Delay (s) Level of Service D D D D A A A A A Approach Delay (s) Approach LOS D D A A Intersection Summary HCM Average Control Delay 14.3 HCM Level of Service B HCM Volume to Capacity ratio 0.68 Actuated Cycle Length (s) Sum of lost time (s) 13.0 Intersection Capacity Utilization 88.3% ICU Level of Service E Analysis Period (min) 60 c Critical Lane Group 04/10/2014 Synchro 7 - Report AECOM Page 5
101 HCM Unsignalized Intersection Capacity Analysis Creditview Road EA -Existing Conditions 19: Creditview Road & Velebit Court PM Peak Hour Movement SET SER NWL NWT NEL NER Lane Configurations Volume (veh/h) Sign Control Free Free Stop Grade 0% 0% 0% Peak Hour Factor Hourly flow rate (vph) Pedestrians Lane Width (m) Walking Speed (m/s) Percent Blockage Right turn flare (veh) Median type None None Median storage veh) Upstream signal (m) 209 px, platoon unblocked vc, conflicting volume vc1, stage 1 conf vol vc2, stage 2 conf vol vcu, unblocked vol tc, single (s) 4.1 *5.4 *5.4 tc, 2 stage (s) tf (s) p0 queue free % cm capacity (veh/h) Direction, Lane # SE 1 NW 1 NW 2 NE 1 Volume Total Volume Left Volume Right csh Volume to Capacity Queue Length 95th (m) Control Delay (s) Lane LOS D F Approach Delay (s) Approach LOS F Intersection Summary Average Delay 3.9 Intersection Capacity Utilization 84.9% ICU Level of Service E Analysis Period (min) 60 * User Entered Value 04/10/2014 Synchro 7 - Report AECOM Page 6
102 HCM Unsignalized Intersection Capacity Analysis Creditview Road EA -Existing Conditions 20: Creditview Road & Rivergate Place PM Peak Hour Movement SEL SET NWT NWR SWL SWR Lane Configurations Volume (veh/h) Sign Control Free Free Stop Grade 0% 0% 0% Peak Hour Factor Hourly flow rate (vph) Pedestrians Lane Width (m) Walking Speed (m/s) Percent Blockage Right turn flare (veh) Median type None None Median storage veh) Upstream signal (m) 241 px, platoon unblocked vc, conflicting volume vc1, stage 1 conf vol vc2, stage 2 conf vol vcu, unblocked vol tc, single (s) tc, 2 stage (s) tf (s) p0 queue free % cm capacity (veh/h) Direction, Lane # SE 1 SE 2 NW 1 SW 1 Volume Total Volume Left Volume Right csh Volume to Capacity Queue Length 95th (m) Control Delay (s) Lane LOS B F Approach Delay (s) Approach LOS F Intersection Summary Average Delay 0.5 Intersection Capacity Utilization 79.3% ICU Level of Service D Analysis Period (min) 60 04/10/2014 Synchro 7 - Report AECOM Page 7
103 AECOM City of Mississauga Creditview Road EA, Traffic Report Final Report APPENDIX D Future Growth Rate Projections
104 5.0 Results The results of the strategic model analysis for the Creditview Rd EA to be passed on to AECOM are as follows: Table Growth on Creditview Rd Forecast Year BAU Scenario NB 7.0% 16.0% SB 11.0% 18.0% Forecast Year Scenario including the NB 45.0% 61.0% widening of Creditview Rd SB 29.0% 42.0% *This table shows the growth on Creditview Rd from the existing scenario for both forecast years, 2021 and For each forecast year, two scenarios are shown. The first row shows growth in the BAU scenarios from the existing scenario and the second row shows growth in the forecast year scenarios including the widening of Creditview Rd to a 4 lane cross section from the existing scenario. Table Impact of Removing Second Line West Structure in 2016 BAU Scenario Creditview Rd not widened Creditview Rd widened Mississauga Rd Creditview Rd NB 1.0% 1.0% SB 0.5% 0.0% NB 3.0% 2.5% SB 3.0% 1.0% NB 3.0% 3.0% Mavis Rd SB 13.0% 13.0% *This table shows the traffic growth on Mississauga Rd, Creditview Rd, and Mavis Rd should the Second Ln W structure over Hwy 401 be removed. Two separate scenarios are shown. The first column assumes Creditview Rd is not widened, ie. 2 lane cross section. The second column assumes Creditview Rd is widened, ie. 4 lane cross section. The network assumptions made in each forecast year are shown in Figures 5.0.1, Figure 5.0.2, and Figure below. pg. 13
105 Figure 5.0.1: Network Changes from Existing to 2016 BAU Figure 5.0.2: Network Changes from to 2016 BAU to 2021 BAU pg. 14
106 Figure 5.0.3: Network Changes from to 2021 BAU to 2031 BAU pg. 15
107 AECOM City of Mississauga Creditview Road EA, Traffic Report Final Report APPENDIX E Future Traffic Operation and Queuing Analysis
108 Do-Nothing
109 Lanes, Volumes, Timings Creditview Road EA - Future 2021 Without 2nd Line W 3: Office Entrance & Creditview Road AM Peak Hour- No Improvements Lane Group EBL EBT EBR WBL WBT WBR NBL NBT NBR SBL SBT SBR Lane Configurations Volume (vph) Ideal Flow (vphpl) Storage Length (m) Storage Lanes Taper Length (m) Right Turn on Red Yes Yes Yes Yes Link Speed (k/h) Link Distance (m) Travel Time (s) Peak Hour Factor Growth Factor 100% 100% 100% 100% 100% 100% 107% 107% 107% 111% 111% 111% Heavy Vehicles (%) 0% 0% 0% 2% 0% 6% 0% 4% 8% 4% 4% 7% Shared Lane Traffic (%) Turn Type Perm Perm Perm Perm Perm pm+pt Perm Protected Phases Permitted Phases Detector Phase Switch Phase Minimum Initial (s) Minimum Split (s) Total Split (s) Total Split (%) 31.8% 31.8% 31.8% 31.8% 31.8% 31.8% 55.5% 55.5% 0.0% 12.7% 68.2% 68.2% Yellow Time (s) All-Red Time (s) Lost Time Adjust (s) Total Lost Time (s) Lead/Lag Lag Lag Lead Lead-Lag Optimize? Yes Yes Yes Recall Mode None None None None None None C-Max C-Max None C-Max C-Max Intersection Summary Area Type: Other Cycle Length: 110 Actuated Cycle Length: 110 Offset: 79 (72%), Referenced to phase 2:SBTL and 6:NBTL, Start of Green Natural Cycle: 80 Control Type: Actuated-Coordinated Splits and Phases: 3: Office Entrance & Creditview Road 11/4/2015 Synchro 7 Report AECOM Page 1
110 HCM Signalized Intersection Capacity Analysis Creditview Road EA - Future 2021 Without 2nd Line W 3: Office Entrance & Creditview Road AM Peak Hour- No Improvements Movement EBL EBT EBR WBL WBT WBR NBL NBT NBR SBL SBT SBR Lane Configurations Volume (vph) Ideal Flow (vphpl) Total Lost time (s) Lane Util. Factor Frt Flt Protected Satd. Flow (prot) Flt Permitted Satd. Flow (perm) Peak-hour factor, PHF Growth Factor (vph) 100% 100% 100% 100% 100% 100% 107% 107% 107% 111% 111% 111% Adj. Flow (vph) RTOR Reduction (vph) Lane Group Flow (vph) Heavy Vehicles (%) 0% 0% 0% 2% 0% 6% 0% 4% 8% 4% 4% 7% Turn Type Perm Perm Perm Perm Perm pm+pt Perm Protected Phases Permitted Phases Actuated Green, G (s) Effective Green, g (s) Actuated g/c Ratio Clearance Time (s) Vehicle Extension (s) Lane Grp Cap (vph) v/s Ratio Prot c0.43 v/s Ratio Perm c v/c Ratio Uniform Delay, d Progression Factor Incremental Delay, d Delay (s) Level of Service C C E D B B A B A Approach Delay (s) Approach LOS C D B B Intersection Summary HCM Average Control Delay 21.0 HCM Level of Service C HCM Volume to Capacity ratio 0.69 Actuated Cycle Length (s) Sum of lost time (s) 14.0 Intersection Capacity Utilization 81.7% ICU Level of Service D Analysis Period (min) 60 c Critical Lane Group 11/4/2015 Synchro 7 Report AECOM Page 2
111 Lanes, Volumes, Timings Creditview Road EA - Future 2021 Without 2nd Line W 5: Argentia Road & Creditview Road AM Peak Hour- No Improvements Lane Group EBL EBR NBL NBT SBT SBR Lane Configurations Volume (vph) Ideal Flow (vphpl) Storage Length (m) Storage Lanes Taper Length (m) Right Turn on Red Yes Yes Link Speed (k/h) Link Distance (m) Travel Time (s) Peak Hour Factor Growth Factor 100% 100% 107% 107% 111% 111% Heavy Vehicles (%) 5% 3% 2% 3% 5% 2% Shared Lane Traffic (%) Turn Type pm+ov pm+pt Perm Protected Phases Permitted Phases Detector Phase Switch Phase Minimum Initial (s) Minimum Split (s) Total Split (s) Total Split (%) 26.4% 22.7% 22.7% 73.6% 50.9% 50.9% Yellow Time (s) All-Red Time (s) Lost Time Adjust (s) Total Lost Time (s) Lead/Lag Lead Lead Lag Lag Lead-Lag Optimize? Yes Yes Yes Yes Recall Mode None None None C-Max C-Max C-Max Intersection Summary Area Type: Other Cycle Length: 110 Actuated Cycle Length: 110 Offset: 0 (0%), Referenced to phase 2:NBTL and 6:SBT, Start of Green, Master Intersection Natural Cycle: 80 Control Type: Actuated-Coordinated Splits and Phases: 5: Argentia Road & Creditview Road 11/4/2015 Synchro 7 Report AECOM Page 3
112 HCM Signalized Intersection Capacity Analysis Creditview Road EA - Future 2021 Without 2nd Line W 5: Argentia Road & Creditview Road AM Peak Hour- No Improvements Movement EBL EBR NBL NBT SBT SBR Lane Configurations Volume (vph) Ideal Flow (vphpl) Total Lost time (s) Lane Util. Factor Frt Flt Protected Satd. Flow (prot) Flt Permitted Satd. Flow (perm) Peak-hour factor, PHF Growth Factor (vph) 100% 100% 107% 107% 111% 111% Adj. Flow (vph) RTOR Reduction (vph) Lane Group Flow (vph) Heavy Vehicles (%) 5% 3% 2% 3% 5% 2% Turn Type pm+ov pm+pt Perm Protected Phases Permitted Phases Actuated Green, G (s) Effective Green, g (s) Actuated g/c Ratio Clearance Time (s) Vehicle Extension (s) Lane Grp Cap (vph) v/s Ratio Prot c c v/s Ratio Perm 0.11 c v/c Ratio Uniform Delay, d Progression Factor Incremental Delay, d Delay (s) Level of Service E C B A B B Approach Delay (s) Approach LOS D A B Intersection Summary HCM Average Control Delay 18.6 HCM Level of Service B HCM Volume to Capacity ratio 0.80 Actuated Cycle Length (s) Sum of lost time (s) 10.0 Intersection Capacity Utilization 88.3% ICU Level of Service E Analysis Period (min) 60 c Critical Lane Group 11/4/2015 Synchro 7 Report AECOM Page 4
113 Lanes, Volumes, Timings Creditview Road EA - Future 2021 Without 2nd Line W 7: Falconer Drive & Creditview Road AM Peak Hour- No Improvements Lane Group EBL EBR NBL NBT SBT SBR Lane Configurations Volume (vph) Ideal Flow (vphpl) Storage Length (m) Storage Lanes Taper Length (m) Link Speed (k/h) Link Distance (m) Travel Time (s) Peak Hour Factor Growth Factor 100% 100% 107% 107% 111% 111% Heavy Vehicles (%) 7% 3% 2% 2% 3% 25% Shared Lane Traffic (%) Sign Control Stop Free Free Intersection Summary Area Type: Other Control Type: Unsignalized 11/4/2015 Synchro 7 Report AECOM Page 5
114 HCM Unsignalized Intersection Capacity Creditview Analysis Road EA - Future 2021 Without 2nd Line W 7: Falconer Drive & Creditview Road AM Peak Hour- No Improvements Movement EBL EBR NBL NBT SBT SBR Lane Configurations Volume (veh/h) Sign Control Stop Free Free Grade 0% 0% 0% Peak Hour Factor Hourly flow rate (vph) Pedestrians Lane Width (m) Walking Speed (m/s) Percent Blockage Right turn flare (veh) Median type None None Median storage veh) Upstream signal (m) px, platoon unblocked vc, conflicting volume vc1, stage 1 conf vol vc2, stage 2 conf vol vcu, unblocked vol tc, single (s) tc, 2 stage (s) tf (s) p0 queue free % cm capacity (veh/h) Direction, Lane # EB 1 EB 2 NB 1 NB 2 SB 1 Volume Total Volume Left Volume Right csh Volume to Capacity Queue Length 95th (m) Control Delay (s) Lane LOS F D B Approach Delay (s) Approach LOS F Intersection Summary Average Delay 6.2 Intersection Capacity Utilization 77.3% ICU Level of Service D Analysis Period (min) 60 11/4/2015 Synchro 7 Report AECOM Page 6
115 Lanes, Volumes, Timings Creditview Road EA - Future 2021 Without 2nd Line W 9: Kenninghall Blvd & Creditview Road AM Peak Hour- No Improvements Lane Group EBL EBT EBR WBL WBT WBR NBL NBT NBR SBL SBT SBR Lane Configurations Volume (vph) Ideal Flow (vphpl) Storage Length (m) Storage Lanes Taper Length (m) Right Turn on Red Yes Yes Yes Yes Link Speed (k/h) Link Distance (m) Travel Time (s) Peak Hour Factor Growth Factor 100% 100% 100% 100% 100% 100% 107% 107% 107% 111% 111% 111% Heavy Vehicles (%) 0% 0% 0% 0% 20% 61% 11% 2% 60% 75% 2% 0% Shared Lane Traffic (%) Turn Type Perm Perm Perm Perm Protected Phases Permitted Phases Detector Phase Switch Phase Minimum Initial (s) Minimum Split (s) Total Split (s) Total Split (%) 29.1% 29.1% 0.0% 29.1% 29.1% 0.0% 70.9% 70.9% 0.0% 70.9% 70.9% 0.0% Yellow Time (s) All-Red Time (s) Lost Time Adjust (s) Total Lost Time (s) Lead/Lag Lead-Lag Optimize? Recall Mode None None None None C-Max C-Max C-Max C-Max Intersection Summary Area Type: Other Cycle Length: 110 Actuated Cycle Length: 110 Offset: 42 (38%), Referenced to phase 2:NBTL and 6:SBTL, Start of Green Natural Cycle: 110 Control Type: Actuated-Coordinated Splits and Phases: 9: Kenninghall Blvd & Creditview Road 11/4/2015 Synchro 7 Report AECOM Page 7
116 HCM Signalized Intersection Capacity Analysis Creditview Road EA - Future 2021 Without 2nd Line W 9: Kenninghall Blvd & Creditview Road AM Peak Hour- No Improvements Movement EBL EBT EBR WBL WBT WBR NBL NBT NBR SBL SBT SBR Lane Configurations Volume (vph) Ideal Flow (vphpl) Total Lost time (s) Lane Util. Factor Frt Flt Protected Satd. Flow (prot) Flt Permitted Satd. Flow (perm) Peak-hour factor, PHF Growth Factor (vph) 100% 100% 100% 100% 100% 100% 107% 107% 107% 111% 111% 111% Adj. Flow (vph) RTOR Reduction (vph) Lane Group Flow (vph) Heavy Vehicles (%) 0% 0% 0% 0% 20% 61% 11% 2% 60% 75% 2% 0% Turn Type Perm Perm Perm Perm Protected Phases Permitted Phases Actuated Green, G (s) Effective Green, g (s) Actuated g/c Ratio Clearance Time (s) Vehicle Extension (s) Lane Grp Cap (vph) v/s Ratio Prot c v/s Ratio Perm 0.07 c v/c Ratio Uniform Delay, d Progression Factor Incremental Delay, d Delay (s) Level of Service D E A A A B Approach Delay (s) Approach LOS D E A B Intersection Summary HCM Average Control Delay 15.6 HCM Level of Service B HCM Volume to Capacity ratio 0.85 Actuated Cycle Length (s) Sum of lost time (s) 12.0 Intersection Capacity Utilization 89.2% ICU Level of Service E Analysis Period (min) 60 c Critical Lane Group 11/4/2015 Synchro 7 Report AECOM Page 8
117 Lanes, Volumes, Timings Creditview Road EA - Future 2021 Without 2nd Line W 12: Sir Monty's Drive & Creditview Road AM Peak Hour- No Improvements Lane Group EBL EBT EBR WBL WBT WBR NBL NBT NBR SBL SBT SBR Lane Configurations Volume (vph) Ideal Flow (vphpl) Storage Length (m) Storage Lanes Taper Length (m) Right Turn on Red Yes Yes Yes Yes Link Speed (k/h) Link Distance (m) Travel Time (s) Peak Hour Factor Growth Factor 100% 100% 100% 100% 100% 100% 107% 107% 107% 111% 111% 111% Heavy Vehicles (%) 13% 6% 6% 1% 13% 7% 13% 2% 2% 38% 2% 36% Shared Lane Traffic (%) Turn Type Perm Perm Perm Perm Perm Protected Phases Permitted Phases Detector Phase Switch Phase Minimum Initial (s) Minimum Split (s) Total Split (s) Total Split (%) 30.0% 30.0% 0.0% 30.0% 30.0% 0.0% 70.0% 70.0% 70.0% 70.0% 70.0% 0.0% Yellow Time (s) All-Red Time (s) Lost Time Adjust (s) Total Lost Time (s) Lead/Lag Lead-Lag Optimize? Recall Mode None None None None C-Max C-Max C-Max C-Max C-Max Intersection Summary Area Type: Other Cycle Length: 110 Actuated Cycle Length: 110 Offset: 6 (5%), Referenced to phase 2:NBTL and 6:SBTL, Start of Green Natural Cycle: 90 Control Type: Actuated-Coordinated Splits and Phases: 12: Sir Monty's Drive & Creditview Road 11/4/2015 Synchro 7 Report AECOM Page 9
118 HCM Signalized Intersection Capacity Analysis Creditview Road EA - Future 2021 Without 2nd Line W 12: Sir Monty's Drive & Creditview Road AM Peak Hour- No Improvements Movement EBL EBT EBR WBL WBT WBR NBL NBT NBR SBL SBT SBR Lane Configurations Volume (vph) Ideal Flow (vphpl) Total Lost time (s) Lane Util. Factor Frt Flt Protected Satd. Flow (prot) Flt Permitted Satd. Flow (perm) Peak-hour factor, PHF Growth Factor (vph) 100% 100% 100% 100% 100% 100% 107% 107% 107% 111% 111% 111% Adj. Flow (vph) RTOR Reduction (vph) Lane Group Flow (vph) Heavy Vehicles (%) 13% 6% 6% 1% 13% 7% 13% 2% 2% 38% 2% 36% Turn Type Perm Perm Perm Perm Perm Protected Phases Permitted Phases Actuated Green, G (s) Effective Green, g (s) Actuated g/c Ratio Clearance Time (s) Vehicle Extension (s) Lane Grp Cap (vph) v/s Ratio Prot c v/s Ratio Perm 0.03 c v/c Ratio Uniform Delay, d Progression Factor Incremental Delay, d Delay (s) Level of Service D D E D A B A A A Approach Delay (s) Approach LOS D D B A Intersection Summary HCM Average Control Delay 14.9 HCM Level of Service B HCM Volume to Capacity ratio 0.79 Actuated Cycle Length (s) Sum of lost time (s) 13.0 Intersection Capacity Utilization 90.3% ICU Level of Service E Analysis Period (min) 60 c Critical Lane Group 11/4/2015 Synchro 7 Report AECOM Page 10
119 Lanes, Volumes, Timings Creditview Road EA - Future 2021 Without 2nd Line W 17: Rivergate Place & Creditview Road AM Peak Hour- No Improvements Lane Group WBL WBR NBT NBR SBL SBT Lane Configurations Volume (vph) Ideal Flow (vphpl) Storage Length (m) Storage Lanes Taper Length (m) Link Speed (k/h) Link Distance (m) Travel Time (s) Peak Hour Factor Growth Factor 100% 100% 107% 100% 100% 111% Shared Lane Traffic (%) Sign Control Stop Free Free Intersection Summary Area Type: Other Control Type: Unsignalized 11/4/2015 Synchro 7 Report AECOM Page 11
120 HCM Unsignalized Intersection Capacity Creditview Analysis Road EA - Future 2021 Without 2nd Line W 17: Rivergate Place & Creditview Road AM Peak Hour- No Improvements Movement WBL WBR NBT NBR SBL SBT Lane Configurations Volume (veh/h) Sign Control Stop Free Free Grade 0% 0% 0% Peak Hour Factor Hourly flow rate (vph) Pedestrians Lane Width (m) Walking Speed (m/s) Percent Blockage Right turn flare (veh) Median type None None Median storage veh) Upstream signal (m) 242 px, platoon unblocked vc, conflicting volume vc1, stage 1 conf vol vc2, stage 2 conf vol vcu, unblocked vol tc, single (s) tc, 2 stage (s) tf (s) p0 queue free % cm capacity (veh/h) Direction, Lane # WB 1 NB 1 SB 1 SB 2 Volume Total Volume Left Volume Right csh Volume to Capacity Queue Length 95th (m) Err Control Delay (s) Err Lane LOS F C Approach Delay (s) Err Approach LOS F Intersection Summary Average Delay 67.2 Intersection Capacity Utilization 79.2% ICU Level of Service D Analysis Period (min) 60 11/4/2015 Synchro 7 Report AECOM Page 12
121 Lanes, Volumes, Timings Creditview Road EA - Future 2021 Without 2nd Line W 21: Creditview Road & Velebit Court AM Peak Hour- No Improvements Lane Group SET SER NWL NWT NEL NER Lane Configurations Volume (vph) Ideal Flow (vphpl) Storage Length (m) Storage Lanes Taper Length (m) Link Speed (k/h) Link Distance (m) Travel Time (s) Peak Hour Factor Growth Factor 111% 100% 100% 107% 100% 100% Shared Lane Traffic (%) Sign Control Free Free Stop Intersection Summary Area Type: Other Control Type: Unsignalized 11/4/2015 Synchro 7 Report AECOM Page 13
122 HCM Unsignalized Intersection Capacity Creditview Analysis Road EA - Future 2021 Without 2nd Line W 21: Creditview Road & Velebit Court AM Peak Hour- No Improvements Movement SET SER NWL NWT NEL NER Lane Configurations Volume (veh/h) Sign Control Free Free Stop Grade 0% 0% 0% Peak Hour Factor Hourly flow rate (vph) Pedestrians Lane Width (m) Walking Speed (m/s) Percent Blockage Right turn flare (veh) Median type None None Median storage veh) Upstream signal (m) 204 px, platoon unblocked vc, conflicting volume vc1, stage 1 conf vol vc2, stage 2 conf vol vcu, unblocked vol tc, single (s) 4.1 *5.3 *5.3 tc, 2 stage (s) tf (s) p0 queue free % cm capacity (veh/h) Direction, Lane # SE 1 NW 1 NW 2 NE 1 Volume Total Volume Left Volume Right csh Volume to Capacity Queue Length 95th (m) Err Control Delay (s) Err Lane LOS D F Approach Delay (s) Err Approach LOS F Intersection Summary Average Delay 40.8 Intersection Capacity Utilization 84.0% ICU Level of Service E Analysis Period (min) 60 * User Entered Value 11/4/2015 Synchro 7 Report AECOM Page 14
123 Lanes, Volumes, Timings Creditview Road EA -Future 2021 without 2nd Line W 3: Office Entrance & Creditview Road 2021 PM Peak Hour- No improvements Lane Group EBL EBT EBR WBL WBT WBR NBL NBT NBR SBL SBT SBR Lane Configurations Volume (vph) Ideal Flow (vphpl) Lane Width (m) Grade (%) 0% 0% 0% 0% Storage Length (m) Storage Lanes Taper Length (m) Right Turn on Red Yes Yes Yes Yes Link Speed (k/h) Link Distance (m) Travel Time (s) Confl. Peds. (#/hr) Confl. Bikes (#/hr) Peak Hour Factor Growth Factor 100% 100% 100% 100% 100% 100% 107% 107% 107% 111% 111% 111% Heavy Vehicles (%) 6% 0% 0% 1% 0% 4% 0% 1% 2% 8% 1% 8% Bus Blockages (#/hr) Parking (#/hr) Mid-Block Traffic (%) 0% 0% 0% 0% Shared Lane Traffic (%) Turn Type Perm Perm Perm Perm Perm pm+pt Perm Protected Phases Permitted Phases Detector Phase Switch Phase Minimum Initial (s) Minimum Split (s) Total Split (s) Total Split (%) 33.6% 33.6% 33.6% 33.6% 33.6% 33.6% 54.5% 54.5% 0.0% 11.8% 66.4% 66.4% Yellow Time (s) All-Red Time (s) Lost Time Adjust (s) Total Lost Time (s) Lead/Lag Lag Lag Lead Lead-Lag Optimize? Recall Mode None None None None None None C-Max C-Max None C-Max C-Max Intersection Summary Area Type: Other Cycle Length: 110 Actuated Cycle Length: 110 Offset: 54 (49%), Referenced to phase 2:SBTL and 6:NBTL, Start of Green Natural Cycle: 90 Control Type: Actuated-Coordinated 11/4/2015 Synchro 7 - Report AECOM Page 1
124 Lanes, Volumes, Timings Creditview Road EA -Future 2021 without 2nd Line W 3: Office Entrance & Creditview Road 2021 PM Peak Hour- No improvements Splits and Phases: 3: Office Entrance & Creditview Road 11/4/2015 Synchro 7 - Report AECOM Page 2
125 HCM Signalized Intersection Capacity Analysis Creditview Road EA -Future 2021 without 2nd Line W 3: Office Entrance & Creditview Road 2021 PM Peak Hour- No improvements Movement EBL EBT EBR WBL WBT WBR NBL NBT NBR SBL SBT SBR Lane Configurations Volume (vph) Ideal Flow (vphpl) Total Lost time (s) Lane Util. Factor Frt Flt Protected Satd. Flow (prot) Flt Permitted Satd. Flow (perm) Peak-hour factor, PHF Growth Factor (vph) 100% 100% 100% 100% 100% 100% 107% 107% 107% 111% 111% 111% Adj. Flow (vph) RTOR Reduction (vph) Lane Group Flow (vph) Heavy Vehicles (%) 6% 0% 0% 1% 0% 4% 0% 1% 2% 8% 1% 8% Turn Type Perm Perm Perm Perm Perm pm+pt Perm Protected Phases Permitted Phases Actuated Green, G (s) Effective Green, g (s) Actuated g/c Ratio Clearance Time (s) Vehicle Extension (s) Lane Grp Cap (vph) v/s Ratio Prot c0.46 v/s Ratio Perm c v/c Ratio Uniform Delay, d Progression Factor Incremental Delay, d Delay (s) Level of Service D C E D B C A B A Approach Delay (s) Approach LOS D D C B Intersection Summary HCM Average Control Delay 24.2 HCM Level of Service C HCM Volume to Capacity ratio 0.72 Actuated Cycle Length (s) Sum of lost time (s) 14.0 Intersection Capacity Utilization 85.3% ICU Level of Service E Analysis Period (min) 60 c Critical Lane Group 11/4/2015 Synchro 7 - Report AECOM Page 3
126 Lanes, Volumes, Timings Creditview Road EA -Future 2021 without 2nd Line W 5: Argentia Road & Creditview Road 2021 PM Peak Hour- No improvements Lane Group EBL EBR NBL NBT SBT SBR Lane Configurations Volume (vph) Ideal Flow (vphpl) Lane Width (m) Grade (%) 0% 0% 0% Storage Length (m) Storage Lanes Taper Length (m) Right Turn on Red Yes Yes Link Speed (k/h) Link Distance (m) Travel Time (s) Confl. Peds. (#/hr) Confl. Bikes (#/hr) Peak Hour Factor Growth Factor 100% 100% 107% 107% 111% 111% Heavy Vehicles (%) 1% 1% 3% 1% 2% 0% Bus Blockages (#/hr) Parking (#/hr) Mid-Block Traffic (%) 0% 0% 0% Shared Lane Traffic (%) Turn Type pm+ov pm+pt Perm Protected Phases Permitted Phases Detector Phase Switch Phase Minimum Initial (s) Minimum Split (s) Total Split (s) Total Split (%) 28.2% 21.8% 21.8% 71.8% 50.0% 50.0% Yellow Time (s) All-Red Time (s) Lost Time Adjust (s) Total Lost Time (s) Lead/Lag Lead Lead Lag Lag Lead-Lag Optimize? Yes Yes Yes Yes Recall Mode None None None C-Max C-Max C-Max Intersection Summary Area Type: Other Cycle Length: 110 Actuated Cycle Length: 110 Offset: 0 (0%), Referenced to phase 2:NBTL and 6:SBT, Start of Green, Master Intersection Natural Cycle: 90 Control Type: Actuated-Coordinated 11/4/2015 Synchro 7 - Report AECOM Page 4
127 Lanes, Volumes, Timings Creditview Road EA -Future 2021 without 2nd Line W 5: Argentia Road & Creditview Road 2021 PM Peak Hour- No improvements Splits and Phases: 5: Argentia Road & Creditview Road 11/4/2015 Synchro 7 - Report AECOM Page 5
128 HCM Signalized Intersection Capacity Analysis Creditview Road EA -Future 2021 without 2nd Line W 5: Argentia Road & Creditview Road 2021 PM Peak Hour- No improvements Movement EBL EBR NBL NBT SBT SBR Lane Configurations Volume (vph) Ideal Flow (vphpl) Total Lost time (s) Lane Util. Factor Frt Flt Protected Satd. Flow (prot) Flt Permitted Satd. Flow (perm) Peak-hour factor, PHF Growth Factor (vph) 100% 100% 107% 107% 111% 111% Adj. Flow (vph) RTOR Reduction (vph) Lane Group Flow (vph) Heavy Vehicles (%) 1% 1% 3% 1% 2% 0% Turn Type pm+ov pm+pt Perm Protected Phases Permitted Phases Actuated Green, G (s) Effective Green, g (s) Actuated g/c Ratio Clearance Time (s) Vehicle Extension (s) Lane Grp Cap (vph) v/s Ratio Prot c c c0.46 v/s Ratio Perm v/c Ratio Uniform Delay, d Progression Factor Incremental Delay, d Delay (s) Level of Service F D C A E B Approach Delay (s) Approach LOS F B E Intersection Summary HCM Average Control Delay 61.1 HCM Level of Service E HCM Volume to Capacity ratio 0.99 Actuated Cycle Length (s) Sum of lost time (s) 17.0 Intersection Capacity Utilization 105.8% ICU Level of Service G Analysis Period (min) 60 c Critical Lane Group 11/4/2015 Synchro 7 - Report AECOM Page 6
129 Lanes, Volumes, Timings Creditview Road EA -Future 2021 without 2nd Line W 7: Falconer Drive & Creditview Road 2021 PM Peak Hour- No improvements Lane Group EBL EBR NBL NBT SBT SBR Lane Configurations Volume (vph) Ideal Flow (vphpl) Lane Width (m) Grade (%) 0% 0% 0% Storage Length (m) Storage Lanes Taper Length (m) Link Speed (k/h) Link Distance (m) Travel Time (s) Confl. Peds. (#/hr) Confl. Bikes (#/hr) Peak Hour Factor Growth Factor 100% 100% 107% 107% 111% 111% Heavy Vehicles (%) 0% 0% 1% 2% 1% 0% Bus Blockages (#/hr) Parking (#/hr) Mid-Block Traffic (%) 0% 0% 0% Shared Lane Traffic (%) Sign Control Stop Free Free Intersection Summary Area Type: CBD Control Type: Unsignalized 11/4/2015 Synchro 7 - Report AECOM Page 7
130 HCM Unsignalized Intersection Capacity Creditview Analysis Road EA -Future 2021 without 2nd Line W 7: Falconer Drive & Creditview Road 2021 PM Peak Hour- No improvements Movement EBL EBR NBL NBT SBT SBR Lane Configurations Volume (veh/h) Sign Control Stop Free Free Grade 0% 0% 0% Peak Hour Factor Hourly flow rate (vph) Pedestrians Lane Width (m) Walking Speed (m/s) Percent Blockage Right turn flare (veh) Median type None None Median storage veh) Upstream signal (m) px, platoon unblocked vc, conflicting volume vc1, stage 1 conf vol vc2, stage 2 conf vol vcu, unblocked vol tc, single (s) tc, 2 stage (s) tf (s) p0 queue free % cm capacity (veh/h) Direction, Lane # EB 1 EB 2 NB 1 NB 2 SB 1 Volume Total Volume Left Volume Right csh Volume to Capacity Queue Length 95th (m) Control Delay (s) Lane LOS F F D Approach Delay (s) Approach LOS F Intersection Summary Average Delay 5.6 Intersection Capacity Utilization 105.4% ICU Level of Service G Analysis Period (min) 60 11/4/2015 Synchro 7 - Report AECOM Page 8
131 Lanes, Volumes, Timings Creditview Road EA -Future 2021 without 2nd Line W 9: Kenninghall Blvd & Creditview Road 2021 PM Peak Hour- No improvements Lane Group EBL EBT EBR WBL WBT WBR NBL NBT NBR SBL SBT SBR Lane Configurations Volume (vph) Ideal Flow (vphpl) Lane Width (m) Grade (%) 0% 0% 0% 0% Storage Length (m) Storage Lanes Taper Length (m) Right Turn on Red Yes Yes Yes Yes Link Speed (k/h) Link Distance (m) Travel Time (s) Confl. Peds. (#/hr) Confl. Bikes (#/hr) Peak Hour Factor Growth Factor 100% 100% 100% 100% 100% 100% 107% 107% 107% 111% 111% 111% Heavy Vehicles (%) 0% 0% 1% 0% 11% 0% 1% 2% 0% 75% 2% 0% Bus Blockages (#/hr) Parking (#/hr) Mid-Block Traffic (%) 0% 0% 0% 0% Shared Lane Traffic (%) Turn Type Perm Perm pm+pt Perm Protected Phases Permitted Phases Detector Phase Switch Phase Minimum Initial (s) Minimum Split (s) Total Split (s) Total Split (%) 27.3% 27.3% 0.0% 27.3% 27.3% 0.0% 11.8% 72.7% 0.0% 60.9% 60.9% 0.0% Yellow Time (s) All-Red Time (s) Lost Time Adjust (s) Total Lost Time (s) Lead/Lag Lead Lag Lag Lead-Lag Optimize? Yes Yes Yes Recall Mode None None None None None C-Max C-Max C-Max Intersection Summary Area Type: Other Cycle Length: 110 Actuated Cycle Length: 110 Offset: 32 (29%), Referenced to phase 2:NBTL and 6:SBTL, Start of Green Natural Cycle: 150 Control Type: Actuated-Coordinated 11/4/2015 Synchro 7 - Report AECOM Page 9
132 Lanes, Volumes, Timings Creditview Road EA -Future 2021 without 2nd Line W 9: Kenninghall Blvd & Creditview Road 2021 PM Peak Hour- No improvements Splits and Phases: 9: Kenninghall Blvd & Creditview Road 11/4/2015 Synchro 7 - Report AECOM Page 10
133 HCM Signalized Intersection Capacity Analysis Creditview Road EA -Future 2021 without 2nd Line W 9: Kenninghall Blvd & Creditview Road 2021 PM Peak Hour- No improvements Movement EBL EBT EBR WBL WBT WBR NBL NBT NBR SBL SBT SBR Lane Configurations Volume (vph) Ideal Flow (vphpl) Total Lost time (s) Lane Util. Factor Frt Flt Protected Satd. Flow (prot) Flt Permitted Satd. Flow (perm) Peak-hour factor, PHF Growth Factor (vph) 100% 100% 100% 100% 100% 100% 107% 107% 107% 111% 111% 111% Adj. Flow (vph) RTOR Reduction (vph) Lane Group Flow (vph) Heavy Vehicles (%) 0% 0% 1% 0% 11% 0% 1% 2% 0% 75% 2% 0% Turn Type Perm Perm pm+pt Perm Protected Phases Permitted Phases Actuated Green, G (s) Effective Green, g (s) Actuated g/c Ratio Clearance Time (s) Vehicle Extension (s) Lane Grp Cap (vph) v/s Ratio Prot c c0.78 v/s Ratio Perm 0.02 c v/c Ratio Uniform Delay, d Progression Factor Incremental Delay, d Delay (s) Level of Service D D F A A F Approach Delay (s) Approach LOS D D D F Intersection Summary HCM Average Control Delay HCM Level of Service F HCM Volume to Capacity ratio 1.04 Actuated Cycle Length (s) Sum of lost time (s) 15.0 Intersection Capacity Utilization 112.0% ICU Level of Service H Analysis Period (min) 60 c Critical Lane Group 11/4/2015 Synchro 7 - Report AECOM Page 11
134 Lanes, Volumes, Timings Creditview Road EA -Future 2021 without 2nd Line W 12: Sir Monty's Drive & Creditview Road 2021 PM Peak Hour- No improvements Lane Group EBL EBT EBR WBL WBT WBR NBL NBT NBR SBL SBT SBR Lane Configurations Volume (vph) Ideal Flow (vphpl) Lane Width (m) Grade (%) 0% 0% 0% 0% Storage Length (m) Storage Lanes Taper Length (m) Right Turn on Red Yes Yes Yes Yes Link Speed (k/h) Link Distance (m) Travel Time (s) Confl. Peds. (#/hr) Confl. Bikes (#/hr) Peak Hour Factor Growth Factor 100% 100% 100% 100% 100% 100% 107% 107% 107% 111% 111% 111% Heavy Vehicles (%) 0% 0% 5% 1% 0% 4% 2% 2% 1% 1% 1% 0% Bus Blockages (#/hr) Parking (#/hr) Mid-Block Traffic (%) 0% 0% 0% 0% Shared Lane Traffic (%) Turn Type Perm Perm Perm Perm Perm Protected Phases Permitted Phases Detector Phase Switch Phase Minimum Initial (s) Minimum Split (s) Total Split (s) Total Split (%) 30.0% 30.0% 0.0% 30.0% 30.0% 0.0% 70.0% 70.0% 70.0% 70.0% 70.0% 0.0% Yellow Time (s) All-Red Time (s) Lost Time Adjust (s) Total Lost Time (s) Lead/Lag Lead-Lag Optimize? Recall Mode None None None None C-Max C-Max C-Max C-Max C-Max Intersection Summary Area Type: Other Cycle Length: 110 Actuated Cycle Length: 110 Offset: 21 (19%), Referenced to phase 2:NBTL and 6:SBTL, Start of Green Natural Cycle: 90 Control Type: Actuated-Coordinated 11/4/2015 Synchro 7 - Report AECOM Page 12
135 Lanes, Volumes, Timings Creditview Road EA -Future 2021 without 2nd Line W 12: Sir Monty's Drive & Creditview Road 2021 PM Peak Hour- No improvements Splits and Phases: 12: Sir Monty's Drive & Creditview Road 11/4/2015 Synchro 7 - Report AECOM Page 13
136 HCM Signalized Intersection Capacity Analysis Creditview Road EA -Future 2021 without 2nd Line W 12: Sir Monty's Drive & Creditview Road 2021 PM Peak Hour- No improvements Movement EBL EBT EBR WBL WBT WBR NBL NBT NBR SBL SBT SBR Lane Configurations Volume (vph) Ideal Flow (vphpl) Total Lost time (s) Lane Util. Factor Frt Flt Protected Satd. Flow (prot) Flt Permitted Satd. Flow (perm) Peak-hour factor, PHF Growth Factor (vph) 100% 100% 100% 100% 100% 100% 107% 107% 107% 111% 111% 111% Adj. Flow (vph) RTOR Reduction (vph) Lane Group Flow (vph) Heavy Vehicles (%) 0% 0% 5% 1% 0% 4% 2% 2% 1% 1% 1% 0% Turn Type Perm Perm Perm Perm Perm Protected Phases Permitted Phases Actuated Green, G (s) Effective Green, g (s) Actuated g/c Ratio Clearance Time (s) Vehicle Extension (s) Lane Grp Cap (vph) v/s Ratio Prot c v/s Ratio Perm 0.04 c v/c Ratio Uniform Delay, d Progression Factor Incremental Delay, d Delay (s) Level of Service D D D D A B A A B Approach Delay (s) Approach LOS D D B A Intersection Summary HCM Average Control Delay 15.0 HCM Level of Service B HCM Volume to Capacity ratio 0.72 Actuated Cycle Length (s) Sum of lost time (s) 13.0 Intersection Capacity Utilization 92.4% ICU Level of Service F Analysis Period (min) 60 c Critical Lane Group 11/4/2015 Synchro 7 - Report AECOM Page 14
137 Lanes, Volumes, Timings Creditview Road EA -Future 2021 without 2nd Line W 17: Rivergate Place & Creditview Road 2021 PM Peak Hour- No improvements Lane Group WBL WBR NBT NBR SBL SBT Lane Configurations Volume (vph) Ideal Flow (vphpl) Lane Width (m) Grade (%) 0% 0% 0% Storage Length (m) Storage Lanes Taper Length (m) Link Speed (k/h) Link Distance (m) Travel Time (s) Confl. Peds. (#/hr) Confl. Bikes (#/hr) Peak Hour Factor Growth Factor 100% 100% 107% 100% 100% 111% Heavy Vehicles (%) 2% 2% 2% 2% 2% 2% Bus Blockages (#/hr) Parking (#/hr) Mid-Block Traffic (%) 0% 0% 0% Shared Lane Traffic (%) Sign Control Stop Free Free Intersection Summary Area Type: Other Control Type: Unsignalized 11/4/2015 Synchro 7 - Report AECOM Page 15
138 HCM Unsignalized Intersection Capacity Creditview Analysis Road EA -Future 2021 without 2nd Line W 17: Rivergate Place & Creditview Road 2021 PM Peak Hour- No improvements Movement WBL WBR NBT NBR SBL SBT Lane Configurations Volume (veh/h) Sign Control Stop Free Free Grade 0% 0% 0% Peak Hour Factor Hourly flow rate (vph) Pedestrians Lane Width (m) Walking Speed (m/s) Percent Blockage Right turn flare (veh) Median type None None Median storage veh) Upstream signal (m) 241 px, platoon unblocked vc, conflicting volume vc1, stage 1 conf vol vc2, stage 2 conf vol vcu, unblocked vol tc, single (s) tc, 2 stage (s) tf (s) p0 queue free % cm capacity (veh/h) Direction, Lane # WB 1 NB 1 SB 1 SB 2 Volume Total Volume Left Volume Right csh Volume to Capacity Queue Length 95th (m) Control Delay (s) Lane LOS F B Approach Delay (s) Approach LOS F Intersection Summary Average Delay 1.6 Intersection Capacity Utilization 86.9% ICU Level of Service E Analysis Period (min) 60 11/4/2015 Synchro 7 - Report AECOM Page 16
139 Lanes, Volumes, Timings Creditview Road EA -Future 2021 without 2nd Line W 21: Creditview Road & Velebit Court 2021 PM Peak Hour- No improvements Lane Group SET SER NWL NWT NEL NER Lane Configurations Volume (vph) Ideal Flow (vphpl) Lane Width (m) Grade (%) 0% 0% 0% Storage Length (m) Storage Lanes Taper Length (m) Link Speed (k/h) Link Distance (m) Travel Time (s) Confl. Peds. (#/hr) Confl. Bikes (#/hr) Peak Hour Factor Growth Factor 111% 100% 100% 107% 100% 100% Heavy Vehicles (%) 2% 2% 2% 2% 2% 2% Bus Blockages (#/hr) Parking (#/hr) Mid-Block Traffic (%) 0% 0% 0% Shared Lane Traffic (%) Sign Control Free Free Stop Intersection Summary Area Type: Other Control Type: Unsignalized 11/4/2015 Synchro 7 - Report AECOM Page 17
140 HCM Unsignalized Intersection Capacity Creditview Analysis Road EA -Future 2021 without 2nd Line W 21: Creditview Road & Velebit Court 2021 PM Peak Hour- No improvements Movement SET SER NWL NWT NEL NER Lane Configurations Volume (veh/h) Sign Control Free Free Stop Grade 0% 0% 0% Peak Hour Factor Hourly flow rate (vph) Pedestrians Lane Width (m) Walking Speed (m/s) Percent Blockage Right turn flare (veh) Median type None None Median storage veh) Upstream signal (m) 204 px, platoon unblocked vc, conflicting volume vc1, stage 1 conf vol vc2, stage 2 conf vol vcu, unblocked vol tc, single (s) 4.1 *5.3 *5.3 tc, 2 stage (s) tf (s) p0 queue free % cm capacity (veh/h) Direction, Lane # SE 1 NW 1 NW 2 NE 1 Volume Total Volume Left Volume Right csh Volume to Capacity Queue Length 95th (m) Control Delay (s) Lane LOS E F Approach Delay (s) Approach LOS F Intersection Summary Average Delay 9.9 Intersection Capacity Utilization 93.1% ICU Level of Service F Analysis Period (min) 60 * User Entered Value 11/4/2015 Synchro 7 - Report AECOM Page 18
141 Lanes, Volumes, Timings Creditview Road EA Do-nothing 3: Office Entrance & Creditview Road AM Peak Hour Lane Group EBL EBT EBR WBL WBT WBR NBL NBT NBR SBL SBT SBR Lane Configurations Volume (vph) Ideal Flow (vphpl) Storage Length (m) Storage Lanes Taper Length (m) Right Turn on Red Yes Yes Yes Yes Link Speed (k/h) Link Distance (m) Travel Time (s) Peak Hour Factor Growth Factor 100% 100% 100% 100% 100% 100% 116% 116% 116% 118% 118% 118% Heavy Vehicles (%) 0% 0% 0% 2% 0% 6% 0% 4% 8% 4% 4% 7% Shared Lane Traffic (%) Turn Type Perm Perm Perm Perm Perm pm+pt Perm Protected Phases Permitted Phases Detector Phase Switch Phase Minimum Initial (s) Minimum Split (s) Total Split (s) Total Split (%) 31.8% 31.8% 31.8% 31.8% 31.8% 31.8% 55.5% 55.5% 0.0% 12.7% 68.2% 68.2% Yellow Time (s) All-Red Time (s) Lost Time Adjust (s) Total Lost Time (s) Lead/Lag Lag Lag Lead Lead-Lag Optimize? Yes Yes Yes Recall Mode None None None None None None C-Max C-Max None C-Max C-Max Intersection Summary Area Type: Other Cycle Length: 110 Actuated Cycle Length: 110 Offset: 79 (72%), Referenced to phase 2:SBTL and 6:NBTL, Start of Green Natural Cycle: 80 Control Type: Actuated-Coordinated Splits and Phases: 3: Office Entrance & Creditview Road 11/4/2015 Synchro 7 Report Page 1
142 HCM Signalized Intersection Capacity Analysis Creditview Road EA Do-nothing 3: Office Entrance & Creditview Road AM Peak Hour Movement EBL EBT EBR WBL WBT WBR NBL NBT NBR SBL SBT SBR Lane Configurations Volume (vph) Ideal Flow (vphpl) Total Lost time (s) Lane Util. Factor Frt Flt Protected Satd. Flow (prot) Flt Permitted Satd. Flow (perm) Peak-hour factor, PHF Growth Factor (vph) 100% 100% 100% 100% 100% 100% 116% 116% 116% 118% 118% 118% Adj. Flow (vph) RTOR Reduction (vph) Lane Group Flow (vph) Heavy Vehicles (%) 0% 0% 0% 2% 0% 6% 0% 4% 8% 4% 4% 7% Turn Type Perm Perm Perm Perm Perm pm+pt Perm Protected Phases Permitted Phases Actuated Green, G (s) Effective Green, g (s) Actuated g/c Ratio Clearance Time (s) Vehicle Extension (s) Lane Grp Cap (vph) v/s Ratio Prot c0.46 v/s Ratio Perm c v/c Ratio Uniform Delay, d Progression Factor Incremental Delay, d Delay (s) Level of Service C C E D B B B B A Approach Delay (s) Approach LOS C D B B Intersection Summary HCM Average Control Delay 21.5 HCM Level of Service C HCM Volume to Capacity ratio 0.72 Actuated Cycle Length (s) Sum of lost time (s) 14.0 Intersection Capacity Utilization 84.3% ICU Level of Service E Analysis Period (min) 60 c Critical Lane Group 11/4/2015 Synchro 7 Report Page 2
143 Lanes, Volumes, Timings Creditview Road EA Do-nothing 5: Argentia Road & Creditview Road AM Peak Hour Lane Group EBL EBR NBL NBT SBT SBR Lane Configurations Volume (vph) Ideal Flow (vphpl) Storage Length (m) Storage Lanes Taper Length (m) Right Turn on Red Yes Yes Link Speed (k/h) Link Distance (m) Travel Time (s) Peak Hour Factor Growth Factor 100% 100% 116% 116% 118% 118% Heavy Vehicles (%) 5% 3% 2% 3% 5% 2% Shared Lane Traffic (%) Turn Type pm+ov pm+pt Perm Protected Phases Permitted Phases Detector Phase Switch Phase Minimum Initial (s) Minimum Split (s) Total Split (s) Total Split (%) 26.4% 22.7% 22.7% 73.6% 50.9% 50.9% Yellow Time (s) All-Red Time (s) Lost Time Adjust (s) Total Lost Time (s) Lead/Lag Lead Lead Lag Lag Lead-Lag Optimize? Yes Yes Yes Yes Recall Mode None None None C-Max C-Max C-Max Intersection Summary Area Type: Other Cycle Length: 110 Actuated Cycle Length: 110 Offset: 0 (0%), Referenced to phase 2:NBTL and 6:SBT, Start of Green, Master Intersection Natural Cycle: 90 Control Type: Actuated-Coordinated Splits and Phases: 5: Argentia Road & Creditview Road 11/4/2015 Synchro 7 Report Page 3
144 HCM Signalized Intersection Capacity Analysis Creditview Road EA Do-nothing 5: Argentia Road & Creditview Road AM Peak Hour Movement EBL EBR NBL NBT SBT SBR Lane Configurations Volume (vph) Ideal Flow (vphpl) Total Lost time (s) Lane Util. Factor Frt Flt Protected Satd. Flow (prot) Flt Permitted Satd. Flow (perm) Peak-hour factor, PHF Growth Factor (vph) 100% 100% 116% 116% 118% 118% Adj. Flow (vph) RTOR Reduction (vph) Lane Group Flow (vph) Heavy Vehicles (%) 5% 3% 2% 3% 5% 2% Turn Type pm+ov pm+pt Perm Protected Phases Permitted Phases Actuated Green, G (s) Effective Green, g (s) Actuated g/c Ratio Clearance Time (s) Vehicle Extension (s) Lane Grp Cap (vph) v/s Ratio Prot c c v/s Ratio Perm 0.11 c v/c Ratio Uniform Delay, d Progression Factor Incremental Delay, d Delay (s) Level of Service E C C A C B Approach Delay (s) Approach LOS D B B Intersection Summary HCM Average Control Delay 19.7 HCM Level of Service B HCM Volume to Capacity ratio 0.84 Actuated Cycle Length (s) Sum of lost time (s) 10.0 Intersection Capacity Utilization 92.8% ICU Level of Service F Analysis Period (min) 60 c Critical Lane Group 11/4/2015 Synchro 7 Report Page 4
145 Lanes, Volumes, Timings Creditview Road EA Do-nothing 7: Falconer Drive & Creditview Road AM Peak Hour Lane Group EBL EBR NBL NBT SBT SBR Lane Configurations Volume (vph) Ideal Flow (vphpl) Storage Length (m) Storage Lanes Taper Length (m) Link Speed (k/h) Link Distance (m) Travel Time (s) Peak Hour Factor Growth Factor 100% 100% 116% 116% 118% 118% Heavy Vehicles (%) 7% 3% 2% 2% 3% 25% Shared Lane Traffic (%) Sign Control Stop Free Free Intersection Summary Area Type: Other Control Type: Unsignalized 11/4/2015 Synchro 7 Report Page 5
146 HCM Unsignalized Intersection Capacity Analysis Creditview Road EA Do-nothing 7: Falconer Drive & Creditview Road AM Peak Hour Movement EBL EBR NBL NBT SBT SBR Lane Configurations Volume (veh/h) Sign Control Stop Free Free Grade 0% 0% 0% Peak Hour Factor Hourly flow rate (vph) Pedestrians Lane Width (m) Walking Speed (m/s) Percent Blockage Right turn flare (veh) Median type None None Median storage veh) Upstream signal (m) px, platoon unblocked vc, conflicting volume vc1, stage 1 conf vol vc2, stage 2 conf vol vcu, unblocked vol tc, single (s) tc, 2 stage (s) tf (s) p0 queue free % cm capacity (veh/h) Direction, Lane # EB 1 EB 2 NB 1 NB 2 SB 1 Volume Total Volume Left Volume Right csh Volume to Capacity Queue Length 95th (m) Control Delay (s) Lane LOS F E B Approach Delay (s) Approach LOS F Intersection Summary Average Delay 8.8 Intersection Capacity Utilization 83.0% ICU Level of Service E Analysis Period (min) 60 11/4/2015 Synchro 7 Report Page 6
147 Lanes, Volumes, Timings Creditview Road EA Do-nothing 9: Kenninghall Blvd & Creditview Road AM Peak Hour Lane Group EBL EBT EBR WBL WBT WBR NBL NBT NBR SBL SBT SBR Lane Configurations Volume (vph) Ideal Flow (vphpl) Storage Length (m) Storage Lanes Taper Length (m) Right Turn on Red Yes Yes Yes Yes Link Speed (k/h) Link Distance (m) Travel Time (s) Peak Hour Factor Growth Factor 100% 100% 100% 100% 100% 100% 116% 116% 116% 118% 118% 118% Heavy Vehicles (%) 0% 0% 0% 0% 20% 61% 11% 2% 60% 75% 2% 0% Shared Lane Traffic (%) Turn Type Perm Perm Perm Perm Protected Phases Permitted Phases Detector Phase Switch Phase Minimum Initial (s) Minimum Split (s) Total Split (s) Total Split (%) 29.1% 29.1% 0.0% 29.1% 29.1% 0.0% 70.9% 70.9% 0.0% 70.9% 70.9% 0.0% Yellow Time (s) All-Red Time (s) Lost Time Adjust (s) Total Lost Time (s) Lead/Lag Lead-Lag Optimize? Recall Mode None None None None C-Max C-Max C-Max C-Max Intersection Summary Area Type: Other Cycle Length: 110 Actuated Cycle Length: 110 Offset: 42 (38%), Referenced to phase 2:NBTL and 6:SBTL, Start of Green Natural Cycle: 130 Control Type: Actuated-Coordinated Splits and Phases: 9: Kenninghall Blvd & Creditview Road 11/4/2015 Synchro 7 Report Page 7
148 HCM Signalized Intersection Capacity Analysis Creditview Road EA Do-nothing 9: Kenninghall Blvd & Creditview Road AM Peak Hour Movement EBL EBT EBR WBL WBT WBR NBL NBT NBR SBL SBT SBR Lane Configurations Volume (vph) Ideal Flow (vphpl) Total Lost time (s) Lane Util. Factor Frt Flt Protected Satd. Flow (prot) Flt Permitted Satd. Flow (perm) Peak-hour factor, PHF Growth Factor (vph) 100% 100% 100% 100% 100% 100% 116% 116% 116% 118% 118% 118% Adj. Flow (vph) RTOR Reduction (vph) Lane Group Flow (vph) Heavy Vehicles (%) 0% 0% 0% 0% 20% 61% 11% 2% 60% 75% 2% 0% Turn Type Perm Perm Perm Perm Protected Phases Permitted Phases Actuated Green, G (s) Effective Green, g (s) Actuated g/c Ratio Clearance Time (s) Vehicle Extension (s) Lane Grp Cap (vph) v/s Ratio Prot c v/s Ratio Perm c v/c Ratio Uniform Delay, d Progression Factor Incremental Delay, d Delay (s) Level of Service D E A B C B Approach Delay (s) Approach LOS D E B B Intersection Summary HCM Average Control Delay 20.8 HCM Level of Service C HCM Volume to Capacity ratio 0.91 Actuated Cycle Length (s) Sum of lost time (s) 12.0 Intersection Capacity Utilization 94.7% ICU Level of Service F Analysis Period (min) 60 c Critical Lane Group 11/4/2015 Synchro 7 Report Page 8
149 Lanes, Volumes, Timings Creditview Road EA Do-nothing 12: Sir Monty's Drive & Creditview Road AM Peak Hour Lane Group EBL EBT EBR WBL WBT WBR NBL NBT NBR SBL SBT SBR Lane Configurations Volume (vph) Ideal Flow (vphpl) Storage Length (m) Storage Lanes Taper Length (m) Right Turn on Red Yes Yes Yes Yes Link Speed (k/h) Link Distance (m) Travel Time (s) Peak Hour Factor Growth Factor 100% 100% 100% 100% 100% 100% 116% 116% 116% 118% 118% 118% Heavy Vehicles (%) 13% 6% 6% 1% 13% 7% 13% 2% 2% 38% 2% 36% Shared Lane Traffic (%) Turn Type Perm Perm Perm Perm Perm Protected Phases Permitted Phases Detector Phase Switch Phase Minimum Initial (s) Minimum Split (s) Total Split (s) Total Split (%) 30.0% 30.0% 0.0% 30.0% 30.0% 0.0% 70.0% 70.0% 70.0% 70.0% 70.0% 0.0% Yellow Time (s) All-Red Time (s) Lost Time Adjust (s) Total Lost Time (s) Lead/Lag Lead-Lag Optimize? Recall Mode None None None None C-Max C-Max C-Max C-Max C-Max Intersection Summary Area Type: Other Cycle Length: 110 Actuated Cycle Length: 110 Offset: 6 (5%), Referenced to phase 2:NBTL and 6:SBTL, Start of Green Natural Cycle: 100 Control Type: Actuated-Coordinated Splits and Phases: 12: Sir Monty's Drive & Creditview Road 11/4/2015 Synchro 7 Report Page 9
150 HCM Signalized Intersection Capacity Analysis Creditview Road EA Do-nothing 12: Sir Monty's Drive & Creditview Road AM Peak Hour Movement EBL EBT EBR WBL WBT WBR NBL NBT NBR SBL SBT SBR Lane Configurations Volume (vph) Ideal Flow (vphpl) Total Lost time (s) Lane Util. Factor Frt Flt Protected Satd. Flow (prot) Flt Permitted Satd. Flow (perm) Peak-hour factor, PHF Growth Factor (vph) 100% 100% 100% 100% 100% 100% 116% 116% 116% 118% 118% 118% Adj. Flow (vph) RTOR Reduction (vph) Lane Group Flow (vph) Heavy Vehicles (%) 13% 6% 6% 1% 13% 7% 13% 2% 2% 38% 2% 36% Turn Type Perm Perm Perm Perm Perm Protected Phases Permitted Phases Actuated Green, G (s) Effective Green, g (s) Actuated g/c Ratio Clearance Time (s) Vehicle Extension (s) Lane Grp Cap (vph) v/s Ratio Prot c v/s Ratio Perm 0.03 c v/c Ratio Uniform Delay, d Progression Factor Incremental Delay, d Delay (s) Level of Service D D E D A B A A A Approach Delay (s) Approach LOS D D B A Intersection Summary HCM Average Control Delay 16.4 HCM Level of Service B HCM Volume to Capacity ratio 0.85 Actuated Cycle Length (s) Sum of lost time (s) 13.0 Intersection Capacity Utilization 95.4% ICU Level of Service F Analysis Period (min) 60 c Critical Lane Group 11/4/2015 Synchro 7 Report Page 10
151 Lanes, Volumes, Timings Creditview Road EA Do-nothing 19: Creditview Road & Velebit Court AM Peak Hour Lane Group SET SER NWL NWT NEL NER Lane Configurations Volume (vph) Ideal Flow (vphpl) Storage Length (m) Storage Lanes Taper Length (m) Link Speed (k/h) Link Distance (m) Travel Time (s) Peak Hour Factor Growth Factor 118% 100% 100% 116% 100% 100% Shared Lane Traffic (%) Sign Control Free Free Stop Intersection Summary Area Type: Other Control Type: Unsignalized 11/4/2015 Synchro 7 Report Page 11
152 HCM Unsignalized Intersection Capacity Analysis Creditview Road EA Do-nothing 19: Creditview Road & Velebit Court AM Peak Hour Movement SET SER NWL NWT NEL NER Lane Configurations Volume (veh/h) Sign Control Free Free Stop Grade 0% 0% 0% Peak Hour Factor Hourly flow rate (vph) Pedestrians Lane Width (m) Walking Speed (m/s) Percent Blockage Right turn flare (veh) Median type None None Median storage veh) Upstream signal (m) 204 px, platoon unblocked vc, conflicting volume vc1, stage 1 conf vol vc2, stage 2 conf vol vcu, unblocked vol tc, single (s) 4.1 *5.3 *5.3 tc, 2 stage (s) tf (s) p0 queue free % cm capacity (veh/h) Direction, Lane # SE 1 NW 1 NW 2 NE 1 Volume Total Volume Left Volume Right csh Volume to Capacity Queue Length 95th (m) Err Control Delay (s) Err Lane LOS E F Approach Delay (s) Err Approach LOS F Intersection Summary Average Delay 38.0 Intersection Capacity Utilization 88.7% ICU Level of Service E Analysis Period (min) 60 * User Entered Value 11/4/2015 Synchro 7 Report Page 12
153 Lanes, Volumes, Timings Creditview Road EA Do-nothing 20: Creditview Road & Rivergate Place AM Peak Hour Lane Group SEL SET NWT NWR SWL SWR Lane Configurations Volume (vph) Ideal Flow (vphpl) Storage Length (m) Storage Lanes Taper Length (m) Link Speed (k/h) Link Distance (m) Travel Time (s) Peak Hour Factor Growth Factor 100% 118% 116% 100% 100% 100% Shared Lane Traffic (%) Sign Control Free Free Stop Intersection Summary Area Type: Other Control Type: Unsignalized 11/4/2015 Synchro 7 Report Page 13
154 HCM Unsignalized Intersection Capacity Analysis Creditview Road EA Do-nothing 20: Creditview Road & Rivergate Place AM Peak Hour Movement SEL SET NWT NWR SWL SWR Lane Configurations Volume (veh/h) Sign Control Free Free Stop Grade 0% 0% 0% Peak Hour Factor Hourly flow rate (vph) Pedestrians Lane Width (m) Walking Speed (m/s) Percent Blockage Right turn flare (veh) Median type None None Median storage veh) Upstream signal (m) 241 px, platoon unblocked vc, conflicting volume vc1, stage 1 conf vol vc2, stage 2 conf vol vcu, unblocked vol tc, single (s) tc, 2 stage (s) tf (s) p0 queue free % cm capacity (veh/h) Direction, Lane # SE 1 SE 2 NW 1 SW 1 Volume Total Volume Left Volume Right csh Volume to Capacity Queue Length 95th (m) Err Control Delay (s) Err Lane LOS D F Approach Delay (s) Err Approach LOS F Intersection Summary Average Delay 62.6 Intersection Capacity Utilization 85.0% ICU Level of Service E Analysis Period (min) 60 11/4/2015 Synchro 7 Report Page 14
155 Lanes, Volumes, Timings Creditview Road EA Do-nothing 3: Office Entrance & Creditview Road PM Peak Hour Lane Group EBL EBT EBR WBL WBT WBR NBL NBT NBR SBL SBT SBR Lane Configurations Volume (vph) Ideal Flow (vphpl) Lane Width (m) Grade (%) 0% 0% 0% 0% Storage Length (m) Storage Lanes Taper Length (m) Right Turn on Red Yes Yes Yes Yes Link Speed (k/h) Link Distance (m) Travel Time (s) Confl. Peds. (#/hr) Confl. Bikes (#/hr) Peak Hour Factor Growth Factor 100% 100% 100% 100% 100% 100% 116% 116% 116% 118% 118% 118% Heavy Vehicles (%) 6% 0% 0% 1% 0% 4% 0% 1% 2% 8% 1% 8% Bus Blockages (#/hr) Parking (#/hr) Mid-Block Traffic (%) 0% 0% 0% 0% Shared Lane Traffic (%) Turn Type Perm Perm Perm Perm Perm pm+pt Perm Protected Phases Permitted Phases Detector Phase Switch Phase Minimum Initial (s) Minimum Split (s) Total Split (s) Total Split (%) 33.6% 33.6% 33.6% 33.6% 33.6% 33.6% 54.5% 54.5% 0.0% 11.8% 66.4% 66.4% Yellow Time (s) All-Red Time (s) Lost Time Adjust (s) Total Lost Time (s) Lead/Lag Lag Lag Lead Lead-Lag Optimize? Recall Mode None None None None None None C-Max C-Max None C-Max C-Max Intersection Summary Area Type: Other Cycle Length: 110 Actuated Cycle Length: 110 Offset: 54 (49%), Referenced to phase 2:SBTL and 6:NBTL, Start of Green Natural Cycle: 90 Control Type: Actuated-Coordinated 11/4/2015 Synchro 7 - Report AECOM Page 1
156 Lanes, Volumes, Timings Creditview Road EA Do-nothing 3: Office Entrance & Creditview Road PM Peak Hour Splits and Phases: 3: Office Entrance & Creditview Road 11/4/2015 Synchro 7 - Report AECOM Page 2
157 HCM Signalized Intersection Capacity Analysis Creditview Road EA Do-nothing 3: Office Entrance & Creditview Road PM Peak Hour Movement EBL EBT EBR WBL WBT WBR NBL NBT NBR SBL SBT SBR Lane Configurations Volume (vph) Ideal Flow (vphpl) Total Lost time (s) Lane Util. Factor Frt Flt Protected Satd. Flow (prot) Flt Permitted Satd. Flow (perm) Peak-hour factor, PHF Growth Factor (vph) 100% 100% 100% 100% 100% 100% 116% 116% 116% 118% 118% 118% Adj. Flow (vph) RTOR Reduction (vph) Lane Group Flow (vph) Heavy Vehicles (%) 6% 0% 0% 1% 0% 4% 0% 1% 2% 8% 1% 8% Turn Type Perm Perm Perm Perm Perm pm+pt Perm Protected Phases Permitted Phases Actuated Green, G (s) Effective Green, g (s) Actuated g/c Ratio Clearance Time (s) Vehicle Extension (s) Lane Grp Cap (vph) v/s Ratio Prot c0.49 v/s Ratio Perm c v/c Ratio Uniform Delay, d Progression Factor Incremental Delay, d Delay (s) Level of Service D C E D B C A B A Approach Delay (s) Approach LOS D D C B Intersection Summary HCM Average Control Delay 24.4 HCM Level of Service C HCM Volume to Capacity ratio 0.75 Actuated Cycle Length (s) Sum of lost time (s) 14.0 Intersection Capacity Utilization 88.2% ICU Level of Service E Analysis Period (min) 60 c Critical Lane Group 11/4/2015 Synchro 7 - Report AECOM Page 3
158 Lanes, Volumes, Timings Creditview Road EA Do-nothing 5: Argentia Road & Creditview Road PM Peak Hour Lane Group EBL EBR NBL NBT SBT SBR Lane Configurations Volume (vph) Ideal Flow (vphpl) Lane Width (m) Grade (%) 0% 0% 0% Storage Length (m) Storage Lanes Taper Length (m) Right Turn on Red Yes Yes Link Speed (k/h) Link Distance (m) Travel Time (s) Confl. Peds. (#/hr) Confl. Bikes (#/hr) Peak Hour Factor Growth Factor 100% 100% 116% 116% 118% 118% Heavy Vehicles (%) 1% 1% 3% 1% 2% 0% Bus Blockages (#/hr) Parking (#/hr) Mid-Block Traffic (%) 0% 0% 0% Shared Lane Traffic (%) Turn Type pm+ov pm+pt Perm Protected Phases Permitted Phases Detector Phase Switch Phase Minimum Initial (s) Minimum Split (s) Total Split (s) Total Split (%) 28.2% 21.8% 21.8% 71.8% 50.0% 50.0% Yellow Time (s) All-Red Time (s) Lost Time Adjust (s) Total Lost Time (s) Lead/Lag Lead Lead Lag Lag Lead-Lag Optimize? Yes Yes Yes Yes Recall Mode None None None C-Max C-Max C-Max Intersection Summary Area Type: Other Cycle Length: 110 Actuated Cycle Length: 110 Offset: 0 (0%), Referenced to phase 2:NBTL and 6:SBT, Start of Green, Master Intersection Natural Cycle: 150 Control Type: Actuated-Coordinated 11/4/2015 Synchro 7 - Report AECOM Page 4
159 Lanes, Volumes, Timings Creditview Road EA Do-nothing 5: Argentia Road & Creditview Road PM Peak Hour Splits and Phases: 5: Argentia Road & Creditview Road 11/4/2015 Synchro 7 - Report AECOM Page 5
160 HCM Signalized Intersection Capacity Analysis Creditview Road EA Do-nothing 5: Argentia Road & Creditview Road PM Peak Hour Movement EBL EBR NBL NBT SBT SBR Lane Configurations Volume (vph) Ideal Flow (vphpl) Total Lost time (s) Lane Util. Factor Frt Flt Protected Satd. Flow (prot) Flt Permitted Satd. Flow (perm) Peak-hour factor, PHF Growth Factor (vph) 100% 100% 116% 116% 118% 118% Adj. Flow (vph) RTOR Reduction (vph) Lane Group Flow (vph) Heavy Vehicles (%) 1% 1% 3% 1% 2% 0% Turn Type pm+ov pm+pt Perm Protected Phases Permitted Phases Actuated Green, G (s) Effective Green, g (s) Actuated g/c Ratio Clearance Time (s) Vehicle Extension (s) Lane Grp Cap (vph) v/s Ratio Prot c c v/s Ratio Perm 0.16 c v/c Ratio Uniform Delay, d Progression Factor Incremental Delay, d Delay (s) Level of Service F C F A F B Approach Delay (s) Approach LOS F F F Intersection Summary HCM Average Control Delay HCM Level of Service F HCM Volume to Capacity ratio 1.05 Actuated Cycle Length (s) Sum of lost time (s) 10.0 Intersection Capacity Utilization 110.6% ICU Level of Service H Analysis Period (min) 60 c Critical Lane Group 11/4/2015 Synchro 7 - Report AECOM Page 6
161 Lanes, Volumes, Timings Creditview Road EA Do-nothing 7: Falconer Drive & Creditview Road PM Peak Hour Lane Group EBL EBR NBL NBT SBT SBR Lane Configurations Volume (vph) Ideal Flow (vphpl) Lane Width (m) Grade (%) 0% 0% 0% Storage Length (m) Storage Lanes Taper Length (m) Link Speed (k/h) Link Distance (m) Travel Time (s) Confl. Peds. (#/hr) Confl. Bikes (#/hr) Peak Hour Factor Growth Factor 100% 100% 116% 116% 118% 118% Heavy Vehicles (%) 0% 0% 1% 2% 1% 0% Bus Blockages (#/hr) Parking (#/hr) Mid-Block Traffic (%) 0% 0% 0% Shared Lane Traffic (%) Sign Control Stop Free Free Intersection Summary Area Type: CBD Control Type: Unsignalized 11/4/2015 Synchro 7 - Report AECOM Page 7
162 HCM Unsignalized Intersection Capacity Analysis Creditview Road EA Do-nothing 7: Falconer Drive & Creditview Road PM Peak Hour Movement EBL EBR NBL NBT SBT SBR Lane Configurations Volume (veh/h) Sign Control Stop Free Free Grade 0% 0% 0% Peak Hour Factor Hourly flow rate (vph) Pedestrians Lane Width (m) Walking Speed (m/s) Percent Blockage Right turn flare (veh) Median type None None Median storage veh) Upstream signal (m) px, platoon unblocked vc, conflicting volume vc1, stage 1 conf vol vc2, stage 2 conf vol vcu, unblocked vol tc, single (s) tc, 2 stage (s) tf (s) p0 queue free % cm capacity (veh/h) Direction, Lane # EB 1 EB 2 NB 1 NB 2 SB 1 Volume Total Volume Left Volume Right csh Volume to Capacity Queue Length 95th (m) Control Delay (s) Lane LOS F F E Approach Delay (s) Approach LOS F Intersection Summary Average Delay 5.8 Intersection Capacity Utilization 111.4% ICU Level of Service H Analysis Period (min) 60 11/4/2015 Synchro 7 - Report AECOM Page 8
163 Lanes, Volumes, Timings Creditview Road EA Do-nothing 9: Kenninghall Blvd & Creditview Road PM Peak Hour Lane Group EBL EBT EBR WBL WBT WBR NBL NBT NBR SBL SBT SBR Lane Configurations Volume (vph) Ideal Flow (vphpl) Lane Width (m) Grade (%) 0% 0% 0% 0% Storage Length (m) Storage Lanes Taper Length (m) Right Turn on Red Yes Yes Yes Yes Link Speed (k/h) Link Distance (m) Travel Time (s) Confl. Peds. (#/hr) Confl. Bikes (#/hr) Peak Hour Factor Growth Factor 100% 100% 100% 100% 100% 100% 116% 116% 116% 118% 118% 118% Heavy Vehicles (%) 0% 0% 1% 0% 11% 0% 1% 2% 0% 75% 2% 0% Bus Blockages (#/hr) Parking (#/hr) Mid-Block Traffic (%) 0% 0% 0% 0% Shared Lane Traffic (%) Turn Type Perm Perm pm+pt Perm Protected Phases Permitted Phases Detector Phase Switch Phase Minimum Initial (s) Minimum Split (s) Total Split (s) Total Split (%) 27.3% 27.3% 0.0% 27.3% 27.3% 0.0% 11.8% 72.7% 0.0% 60.9% 60.9% 0.0% Yellow Time (s) All-Red Time (s) Lost Time Adjust (s) Total Lost Time (s) Lead/Lag Lead Lag Lag Lead-Lag Optimize? Yes Yes Yes Recall Mode None None None None None C-Max C-Max C-Max Intersection Summary Area Type: Other Cycle Length: 110 Actuated Cycle Length: 110 Offset: 32 (29%), Referenced to phase 2:NBTL and 6:SBTL, Start of Green Natural Cycle: 150 Control Type: Actuated-Coordinated 11/4/2015 Synchro 7 - Report AECOM Page 9
164 Lanes, Volumes, Timings Creditview Road EA Do-nothing 9: Kenninghall Blvd & Creditview Road PM Peak Hour Splits and Phases: 9: Kenninghall Blvd & Creditview Road 11/4/2015 Synchro 7 - Report AECOM Page 10
165 HCM Signalized Intersection Capacity Analysis Creditview Road EA Do-nothing 9: Kenninghall Blvd & Creditview Road PM Peak Hour Movement EBL EBT EBR WBL WBT WBR NBL NBT NBR SBL SBT SBR Lane Configurations Volume (vph) Ideal Flow (vphpl) Total Lost time (s) Lane Util. Factor Frt Flt Protected Satd. Flow (prot) Flt Permitted Satd. Flow (perm) Peak-hour factor, PHF Growth Factor (vph) 100% 100% 100% 100% 100% 100% 116% 116% 116% 118% 118% 118% Adj. Flow (vph) RTOR Reduction (vph) Lane Group Flow (vph) Heavy Vehicles (%) 0% 0% 1% 0% 11% 0% 1% 2% 0% 75% 2% 0% Turn Type Perm Perm pm+pt Perm Protected Phases Permitted Phases Actuated Green, G (s) Effective Green, g (s) Actuated g/c Ratio Clearance Time (s) Vehicle Extension (s) Lane Grp Cap (vph) v/s Ratio Prot c c0.83 v/s Ratio Perm 0.02 c v/c Ratio Uniform Delay, d Progression Factor Incremental Delay, d Delay (s) Level of Service D D F A A F Approach Delay (s) Approach LOS D D E F Intersection Summary HCM Average Control Delay HCM Level of Service F HCM Volume to Capacity ratio 1.11 Actuated Cycle Length (s) Sum of lost time (s) 15.0 Intersection Capacity Utilization 117.9% ICU Level of Service H Analysis Period (min) 60 c Critical Lane Group 11/4/2015 Synchro 7 - Report AECOM Page 11
166 Lanes, Volumes, Timings Creditview Road EA Do-nothing 12: Sir Monty's Drive & Creditview Road PM Peak Hour Lane Group EBL EBT EBR WBL WBT WBR NBL NBT NBR SBL SBT SBR Lane Configurations Volume (vph) Ideal Flow (vphpl) Lane Width (m) Grade (%) 0% 0% 0% 0% Storage Length (m) Storage Lanes Taper Length (m) Right Turn on Red Yes Yes Yes Yes Link Speed (k/h) Link Distance (m) Travel Time (s) Confl. Peds. (#/hr) Confl. Bikes (#/hr) Peak Hour Factor Growth Factor 100% 100% 100% 100% 100% 100% 116% 116% 116% 118% 118% 118% Heavy Vehicles (%) 0% 0% 5% 1% 0% 4% 2% 2% 1% 1% 1% 0% Bus Blockages (#/hr) Parking (#/hr) Mid-Block Traffic (%) 0% 0% 0% 0% Shared Lane Traffic (%) Turn Type Perm Perm Perm Perm Perm Protected Phases Permitted Phases Detector Phase Switch Phase Minimum Initial (s) Minimum Split (s) Total Split (s) Total Split (%) 30.0% 30.0% 0.0% 30.0% 30.0% 0.0% 70.0% 70.0% 70.0% 70.0% 70.0% 0.0% Yellow Time (s) All-Red Time (s) Lost Time Adjust (s) Total Lost Time (s) Lead/Lag Lead-Lag Optimize? Recall Mode None None None None C-Max C-Max C-Max C-Max C-Max Intersection Summary Area Type: Other Cycle Length: 110 Actuated Cycle Length: 110 Offset: 21 (19%), Referenced to phase 2:NBTL and 6:SBTL, Start of Green Natural Cycle: 110 Control Type: Actuated-Coordinated 11/4/2015 Synchro 7 - Report AECOM Page 12
167 Lanes, Volumes, Timings Creditview Road EA Do-nothing 12: Sir Monty's Drive & Creditview Road PM Peak Hour Splits and Phases: 12: Sir Monty's Drive & Creditview Road 11/4/2015 Synchro 7 - Report AECOM Page 13
168 HCM Signalized Intersection Capacity Analysis Creditview Road EA Do-nothing 12: Sir Monty's Drive & Creditview Road PM Peak Hour Movement EBL EBT EBR WBL WBT WBR NBL NBT NBR SBL SBT SBR Lane Configurations Volume (vph) Ideal Flow (vphpl) Total Lost time (s) Lane Util. Factor Frt Flt Protected Satd. Flow (prot) Flt Permitted Satd. Flow (perm) Peak-hour factor, PHF Growth Factor (vph) 100% 100% 100% 100% 100% 100% 116% 116% 116% 118% 118% 118% Adj. Flow (vph) RTOR Reduction (vph) Lane Group Flow (vph) Heavy Vehicles (%) 0% 0% 5% 1% 0% 4% 2% 2% 1% 1% 1% 0% Turn Type Perm Perm Perm Perm Perm Protected Phases Permitted Phases Actuated Green, G (s) Effective Green, g (s) Actuated g/c Ratio Clearance Time (s) Vehicle Extension (s) Lane Grp Cap (vph) v/s Ratio Prot 0.01 c0.09 c v/s Ratio Perm v/c Ratio Uniform Delay, d Progression Factor Incremental Delay, d Delay (s) Level of Service D D D D B B A A B Approach Delay (s) Approach LOS D D B B Intersection Summary HCM Average Control Delay 16.2 HCM Level of Service B HCM Volume to Capacity ratio 0.78 Actuated Cycle Length (s) Sum of lost time (s) 13.0 Intersection Capacity Utilization 97.3% ICU Level of Service F Analysis Period (min) 60 c Critical Lane Group 11/4/2015 Synchro 7 - Report AECOM Page 14
169 Lanes, Volumes, Timings Creditview Road EA Do-nothing 19: Creditview Road & Velebit Court PM Peak Hour Lane Group SET SER NWL NWT NEL NER Lane Configurations Volume (vph) Ideal Flow (vphpl) Lane Width (m) Grade (%) 0% 0% 0% Storage Length (m) Storage Lanes Taper Length (m) Link Speed (k/h) Link Distance (m) Travel Time (s) Confl. Peds. (#/hr) Confl. Bikes (#/hr) Peak Hour Factor Growth Factor 118% 100% 100% 116% 100% 100% Heavy Vehicles (%) 2% 2% 2% 2% 2% 2% Bus Blockages (#/hr) Parking (#/hr) Mid-Block Traffic (%) 0% 0% 0% Shared Lane Traffic (%) Sign Control Free Free Stop Intersection Summary Area Type: Other Control Type: Unsignalized 11/4/2015 Synchro 7 - Report AECOM Page 15
170 HCM Unsignalized Intersection Capacity Analysis Creditview Road EA Do-nothing 19: Creditview Road & Velebit Court PM Peak Hour Movement SET SER NWL NWT NEL NER Lane Configurations Volume (veh/h) Sign Control Free Free Stop Grade 0% 0% 0% Peak Hour Factor Hourly flow rate (vph) Pedestrians Lane Width (m) Walking Speed (m/s) Percent Blockage Right turn flare (veh) Median type None None Median storage veh) Upstream signal (m) 209 px, platoon unblocked vc, conflicting volume vc1, stage 1 conf vol vc2, stage 2 conf vol vcu, unblocked vol tc, single (s) tc, 2 stage (s) tf (s) p0 queue free % cm capacity (veh/h) Direction, Lane # SE 1 NW 1 NW 2 NE 1 Volume Total Volume Left Volume Right csh Volume to Capacity Queue Length 95th (m) Err Control Delay (s) Err Lane LOS E F Approach Delay (s) Err Approach LOS F Intersection Summary Average Delay 9.9 Intersection Capacity Utilization 98.3% ICU Level of Service F Analysis Period (min) 60 11/4/2015 Synchro 7 - Report AECOM Page 16
171 Lanes, Volumes, Timings Creditview Road EA Do-nothing 20: Creditview Road & Rivergate Place PM Peak Hour Lane Group SEL SET NWT NWR SWL SWR Lane Configurations Volume (vph) Ideal Flow (vphpl) Lane Width (m) Grade (%) 0% 0% 0% Storage Length (m) Storage Lanes Taper Length (m) Link Speed (k/h) Link Distance (m) Travel Time (s) Confl. Peds. (#/hr) Confl. Bikes (#/hr) Peak Hour Factor Growth Factor 100% 118% 116% 100% 100% 100% Heavy Vehicles (%) 2% 2% 2% 2% 2% 2% Bus Blockages (#/hr) Parking (#/hr) Mid-Block Traffic (%) 0% 0% 0% Shared Lane Traffic (%) Sign Control Free Free Stop Intersection Summary Area Type: Other Control Type: Unsignalized 11/4/2015 Synchro 7 - Report AECOM Page 17
172 HCM Unsignalized Intersection Capacity Analysis Creditview Road EA Do-nothing 20: Creditview Road & Rivergate Place PM Peak Hour Movement SEL SET NWT NWR SWL SWR Lane Configurations Volume (veh/h) Sign Control Free Free Stop Grade 0% 0% 0% Peak Hour Factor Hourly flow rate (vph) Pedestrians Lane Width (m) Walking Speed (m/s) Percent Blockage Right turn flare (veh) Median type None None Median storage veh) Upstream signal (m) 241 px, platoon unblocked vc, conflicting volume vc1, stage 1 conf vol vc2, stage 2 conf vol vcu, unblocked vol tc, single (s) tc, 2 stage (s) tf (s) p0 queue free % cm capacity (veh/h) Direction, Lane # SE 1 SE 2 NW 1 SW 1 Volume Total Volume Left Volume Right csh Volume to Capacity Queue Length 95th (m) Err Control Delay (s) Err Lane LOS B F Approach Delay (s) Err Approach LOS F Intersection Summary Average Delay 26.3 Intersection Capacity Utilization 91.7% ICU Level of Service F Analysis Period (min) 60 11/4/2015 Synchro 7 - Report AECOM Page 18
173 Alternative 1
174 Lanes, Volumes, Timings Creditview -Future Interim Signal Concept 1 3: Office Entrance & Creditview Road AM Peak Hour 2 Lane C-S to Argentia Lane Group EBL EBT EBR WBL WBT WBR NBL NBT NBR SBL SBT SBR Lane Configurations Volume (vph) Ideal Flow (vphpl) Lane Width (m) Grade (%) 0% 0% 0% 0% Storage Length (m) Storage Lanes Taper Length (m) Right Turn on Red Yes Yes Yes Yes Link Speed (k/h) Link Distance (m) Travel Time (s) Confl. Peds. (#/hr) Confl. Bikes (#/hr) Peak Hour Factor Growth Factor 100% 100% 100% 100% 100% 100% 107% 107% 107% 111% 111% 111% Heavy Vehicles (%) 0% 0% 0% 2% 0% 6% 0% 4% 8% 4% 4% 7% Bus Blockages (#/hr) Parking (#/hr) Mid-Block Traffic (%) 0% 0% 0% 0% Shared Lane Traffic (%) Turn Type Perm Perm Perm Perm Perm Perm pm+pt Protected Phases Permitted Phases Detector Phase Switch Phase Minimum Initial (s) Minimum Split (s) Total Split (s) Total Split (%) 31.8% 31.8% 31.8% 31.8% 31.8% 31.8% 55.5% 55.5% 55.5% 12.7% 68.2% 0.0% Yellow Time (s) All-Red Time (s) Lost Time Adjust (s) Total Lost Time (s) Lead/Lag Lag Lag Lag Lead Lead-Lag Optimize? Yes Yes Yes Yes Recall Mode None None None None None None C-Max C-Max C-Max None C-Max Intersection Summary Area Type: Other Cycle Length: 110 Actuated Cycle Length: 110 Offset: 79 (72%), Referenced to phase 2:SBTL and 6:NBTL, Start of Green Natural Cycle: 80 Control Type: Actuated-Coordinated 11/4/2015 Synchro 7 Report AECOM Page 1
175 Lanes, Volumes, Timings Creditview -Future Interim Signal Concept 1 3: Office Entrance & Creditview Road AM Peak Hour 2 Lane C-S to Argentia Splits and Phases: 3: Office Entrance & Creditview Road 11/4/2015 Synchro 7 Report AECOM Page 2
176 HCM Signalized Intersection Capacity Analysis Creditview -Future Interim Signal Concept 1 3: Office Entrance & Creditview Road AM Peak Hour 2 Lane C-S to Argentia Movement EBL EBT EBR WBL WBT WBR NBL NBT NBR SBL SBT SBR Lane Configurations Volume (vph) Ideal Flow (vphpl) Total Lost time (s) Lane Util. Factor Frt Flt Protected Satd. Flow (prot) Flt Permitted Satd. Flow (perm) Peak-hour factor, PHF Growth Factor (vph) 100% 100% 100% 100% 100% 100% 107% 107% 107% 111% 111% 111% Adj. Flow (vph) RTOR Reduction (vph) Lane Group Flow (vph) Heavy Vehicles (%) 0% 0% 0% 2% 0% 6% 0% 4% 8% 4% 4% 7% Turn Type Perm Perm Perm Perm Perm Perm pm+pt Protected Phases Permitted Phases Actuated Green, G (s) Effective Green, g (s) Actuated g/c Ratio Clearance Time (s) Vehicle Extension (s) Lane Grp Cap (vph) v/s Ratio Prot c0.25 c v/s Ratio Perm c v/c Ratio Uniform Delay, d Progression Factor Incremental Delay, d Delay (s) Level of Service C C E D B B B A A Approach Delay (s) Approach LOS C D B A Intersection Summary HCM Average Control Delay 18.3 HCM Level of Service B HCM Volume to Capacity ratio 0.53 Actuated Cycle Length (s) Sum of lost time (s) 17.0 Intersection Capacity Utilization 66.7% ICU Level of Service C Analysis Period (min) 60 c Critical Lane Group 11/4/2015 Synchro 7 Report AECOM Page 3
177 Lanes, Volumes, Timings Creditview -Future Interim Signal Concept 1 5: Argentia Road & Creditview Road AM Peak Hour 2 Lane C-S to Argentia Lane Group EBL EBR NBL NBT SBT SBR Lane Configurations Volume (vph) Ideal Flow (vphpl) Lane Width (m) Grade (%) 0% 0% 0% Storage Length (m) Storage Lanes Taper Length (m) Right Turn on Red Yes Yes Link Speed (k/h) Link Distance (m) Travel Time (s) Confl. Peds. (#/hr) Confl. Bikes (#/hr) Peak Hour Factor Growth Factor 100% 100% 107% 107% 111% 111% Heavy Vehicles (%) 5% 3% 2% 3% 5% 2% Bus Blockages (#/hr) Parking (#/hr) Mid-Block Traffic (%) 0% 0% 0% Shared Lane Traffic (%) Turn Type pm+ov Prot Perm Protected Phases Permitted Phases 4 6 Detector Phase Switch Phase Minimum Initial (s) Minimum Split (s) Total Split (s) Total Split (%) 26.4% 22.7% 22.7% 73.6% 50.9% 50.9% Yellow Time (s) All-Red Time (s) Lost Time Adjust (s) Total Lost Time (s) Lead/Lag Lead Lead Lag Lag Lead-Lag Optimize? Yes Yes Yes Yes Recall Mode None None None C-Max C-Max C-Max Intersection Summary Area Type: Other Cycle Length: 110 Actuated Cycle Length: 110 Offset: 0 (0%), Referenced to phase 2:NBT and 6:SBT, Start of Green, Master Intersection Natural Cycle: 70 Control Type: Actuated-Coordinated 11/4/2015 Synchro 7 Report AECOM Page 4
178 Lanes, Volumes, Timings Creditview -Future Interim Signal Concept 1 5: Argentia Road & Creditview Road AM Peak Hour 2 Lane C-S to Argentia Splits and Phases: 5: Argentia Road & Creditview Road 11/4/2015 Synchro 7 Report AECOM Page 5
179 HCM Signalized Intersection Capacity Analysis Creditview -Future Interim Signal Concept 1 5: Argentia Road & Creditview Road AM Peak Hour 2 Lane C-S to Argentia Movement EBL EBR NBL NBT SBT SBR Lane Configurations Volume (vph) Ideal Flow (vphpl) Total Lost time (s) Lane Util. Factor Frt Flt Protected Satd. Flow (prot) Flt Permitted Satd. Flow (perm) Peak-hour factor, PHF Growth Factor (vph) 100% 100% 107% 107% 111% 111% Adj. Flow (vph) RTOR Reduction (vph) Lane Group Flow (vph) Heavy Vehicles (%) 5% 3% 2% 3% 5% 2% Turn Type pm+ov Prot Perm Protected Phases Permitted Phases 4 6 Actuated Green, G (s) Effective Green, g (s) Actuated g/c Ratio Clearance Time (s) Vehicle Extension (s) Lane Grp Cap (vph) v/s Ratio Prot 0.07 c0.13 c c0.18 v/s Ratio Perm v/c Ratio Uniform Delay, d Progression Factor Incremental Delay, d Delay (s) Level of Service D D D A B A Approach Delay (s) Approach LOS D C A Intersection Summary HCM Average Control Delay 21.4 HCM Level of Service C HCM Volume to Capacity ratio 0.46 Actuated Cycle Length (s) Sum of lost time (s) 13.0 Intersection Capacity Utilization 53.7% ICU Level of Service A Analysis Period (min) 60 c Critical Lane Group 11/4/2015 Synchro 7 Report AECOM Page 6
180 Lanes, Volumes, Timings Creditview -Future Interim Signal Concept 1 7: Falconer Drive & Creditview Road AM Peak Hour 2 Lane C-S to Argentia Lane Group EBL EBR NBL NBT SBT SBR Lane Configurations Volume (vph) Ideal Flow (vphpl) Lane Width (m) Grade (%) 0% 0% 0% Storage Length (m) Storage Lanes Taper Length (m) Link Speed (k/h) Link Distance (m) Travel Time (s) Confl. Peds. (#/hr) Confl. Bikes (#/hr) Peak Hour Factor Growth Factor 100% 100% 107% 107% 111% 111% Heavy Vehicles (%) 7% 3% 2% 2% 3% 25% Bus Blockages (#/hr) Parking (#/hr) Mid-Block Traffic (%) 0% 0% 0% Shared Lane Traffic (%) Sign Control Stop Free Free Intersection Summary Area Type: Other Control Type: Unsignalized 11/4/2015 Synchro 7 Report AECOM Page 7
181 HCM Unsignalized Intersection Capacity AnalysisCreditview -Future Interim Signal Concept 1 7: Falconer Drive & Creditview Road AM Peak Hour 2 Lane C-S to Argentia Movement EBL EBR NBL NBT SBT SBR Lane Configurations Volume (veh/h) Sign Control Stop Free Free Grade 0% 0% 0% Peak Hour Factor Hourly flow rate (vph) Pedestrians Lane Width (m) Walking Speed (m/s) Percent Blockage Right turn flare (veh) Median type None None Median storage veh) Upstream signal (m) px, platoon unblocked vc, conflicting volume vc1, stage 1 conf vol vc2, stage 2 conf vol vcu, unblocked vol tc, single (s) tc, 2 stage (s) tf (s) p0 queue free % cm capacity (veh/h) Direction, Lane # EB 1 EB 2 NB 1 NB 2 SB 1 Volume Total Volume Left Volume Right csh Volume to Capacity Queue Length 95th (m) Control Delay (s) Lane LOS F D B Approach Delay (s) Approach LOS F Intersection Summary Average Delay 22.7 Intersection Capacity Utilization 77.3% ICU Level of Service D Analysis Period (min) 60 11/4/2015 Synchro 7 Report AECOM Page 8
182 Lanes, Volumes, Timings Creditview -Future Interim Signal Concept 1 9: Kenninghall Blvd & Creditview Road AM Peak Hour 2 Lane C-S to Argentia Lane Group EBL EBT EBR WBL WBT WBR NBL NBT NBR SBL SBT SBR Lane Configurations Volume (vph) Ideal Flow (vphpl) Lane Width (m) Grade (%) 0% 0% 0% 0% Storage Length (m) Storage Lanes Taper Length (m) Right Turn on Red Yes Yes Yes Yes Link Speed (k/h) Link Distance (m) Travel Time (s) Confl. Peds. (#/hr) Confl. Bikes (#/hr) Peak Hour Factor Growth Factor 100% 100% 100% 100% 100% 100% 107% 107% 107% 111% 111% 111% Heavy Vehicles (%) 0% 0% 0% 0% 20% 61% 11% 2% 60% 75% 2% 0% Bus Blockages (#/hr) Parking (#/hr) Mid-Block Traffic (%) 0% 0% 0% 0% Shared Lane Traffic (%) Turn Type Perm Perm Perm Perm Protected Phases Permitted Phases Detector Phase Switch Phase Minimum Initial (s) Minimum Split (s) Total Split (s) Total Split (%) 29.1% 29.1% 0.0% 29.1% 29.1% 0.0% 70.9% 70.9% 0.0% 70.9% 70.9% 0.0% Yellow Time (s) All-Red Time (s) Lost Time Adjust (s) Total Lost Time (s) Lead/Lag Lead-Lag Optimize? Recall Mode None None None None C-Max C-Max C-Max C-Max Intersection Summary Area Type: Other Cycle Length: 110 Actuated Cycle Length: 110 Offset: 42 (38%), Referenced to phase 2:NBTL and 6:SBTL, Start of Green Natural Cycle: 110 Control Type: Actuated-Coordinated 11/4/2015 Synchro 7 Report AECOM Page 9
183 Lanes, Volumes, Timings Creditview -Future Interim Signal Concept 1 9: Kenninghall Blvd & Creditview Road AM Peak Hour 2 Lane C-S to Argentia Splits and Phases: 9: Kenninghall Blvd & Creditview Road 11/4/2015 Synchro 7 Report AECOM Page 10
184 HCM Signalized Intersection Capacity Analysis Creditview -Future Interim Signal Concept 1 9: Kenninghall Blvd & Creditview Road AM Peak Hour 2 Lane C-S to Argentia Movement EBL EBT EBR WBL WBT WBR NBL NBT NBR SBL SBT SBR Lane Configurations Volume (vph) Ideal Flow (vphpl) Total Lost time (s) Lane Util. Factor Frt Flt Protected Satd. Flow (prot) Flt Permitted Satd. Flow (perm) Peak-hour factor, PHF Growth Factor (vph) 100% 100% 100% 100% 100% 100% 107% 107% 107% 111% 111% 111% Adj. Flow (vph) RTOR Reduction (vph) Lane Group Flow (vph) Heavy Vehicles (%) 0% 0% 0% 0% 20% 61% 11% 2% 60% 75% 2% 0% Turn Type Perm Perm Perm Perm Protected Phases Permitted Phases Actuated Green, G (s) Effective Green, g (s) Actuated g/c Ratio Clearance Time (s) Vehicle Extension (s) Lane Grp Cap (vph) v/s Ratio Prot c c v/s Ratio Perm v/c Ratio Uniform Delay, d Progression Factor Incremental Delay, d Delay (s) Level of Service D D D D A A A B Approach Delay (s) Approach LOS D D A B Intersection Summary HCM Average Control Delay 14.1 HCM Level of Service B HCM Volume to Capacity ratio 0.81 Actuated Cycle Length (s) Sum of lost time (s) 12.0 Intersection Capacity Utilization 94.7% ICU Level of Service F Analysis Period (min) 60 c Critical Lane Group 11/4/2015 Synchro 7 Report AECOM Page 11
185 Lanes, Volumes, Timings Creditview -Future Interim Signal Concept 1 12: Sir Monty's Drive & Creditview Road AM Peak Hour 2 Lane C-S to Argentia Lane Group EBL EBT EBR WBL WBT WBR NBL NBT NBR SBL SBT SBR Lane Configurations Volume (vph) Ideal Flow (vphpl) Lane Width (m) Grade (%) 0% 0% 0% 0% Storage Length (m) Storage Lanes Taper Length (m) Right Turn on Red Yes Yes Yes Yes Link Speed (k/h) Link Distance (m) Travel Time (s) Confl. Peds. (#/hr) Confl. Bikes (#/hr) Peak Hour Factor Growth Factor 100% 100% 100% 100% 100% 100% 107% 107% 107% 111% 111% 111% Heavy Vehicles (%) 13% 6% 6% 1% 13% 7% 13% 2% 2% 38% 2% 36% Bus Blockages (#/hr) Parking (#/hr) Mid-Block Traffic (%) 0% 0% 0% 0% Shared Lane Traffic (%) Turn Type Perm Perm Perm Perm Perm Protected Phases Permitted Phases Detector Phase Switch Phase Minimum Initial (s) Minimum Split (s) Total Split (s) Total Split (%) 30.0% 30.0% 0.0% 30.0% 30.0% 0.0% 70.0% 70.0% 70.0% 70.0% 70.0% 0.0% Yellow Time (s) All-Red Time (s) Lost Time Adjust (s) Total Lost Time (s) Lead/Lag Lead-Lag Optimize? Recall Mode None None None None C-Max C-Max C-Max C-Max C-Max Intersection Summary Area Type: Other Cycle Length: 110 Actuated Cycle Length: 110 Offset: 6 (5%), Referenced to phase 2:NBTL and 6:SBTL, Start of Green Natural Cycle: 90 Control Type: Actuated-Coordinated 11/4/2015 Synchro 7 Report AECOM Page 12
186 Lanes, Volumes, Timings Creditview -Future Interim Signal Concept 1 12: Sir Monty's Drive & Creditview Road AM Peak Hour 2 Lane C-S to Argentia Splits and Phases: 12: Sir Monty's Drive & Creditview Road 11/4/2015 Synchro 7 Report AECOM Page 13
187 HCM Signalized Intersection Capacity Analysis Creditview -Future Interim Signal Concept 1 12: Sir Monty's Drive & Creditview Road AM Peak Hour 2 Lane C-S to Argentia Movement EBL EBT EBR WBL WBT WBR NBL NBT NBR SBL SBT SBR Lane Configurations Volume (vph) Ideal Flow (vphpl) Total Lost time (s) Lane Util. Factor Frt Flt Protected Satd. Flow (prot) Flt Permitted Satd. Flow (perm) Peak-hour factor, PHF Growth Factor (vph) 100% 100% 100% 100% 100% 100% 107% 107% 107% 111% 111% 111% Adj. Flow (vph) RTOR Reduction (vph) Lane Group Flow (vph) Heavy Vehicles (%) 13% 6% 6% 1% 13% 7% 13% 2% 2% 38% 2% 36% Turn Type Perm Perm Perm Perm Perm Protected Phases Permitted Phases Actuated Green, G (s) Effective Green, g (s) Actuated g/c Ratio Clearance Time (s) Vehicle Extension (s) Lane Grp Cap (vph) v/s Ratio Prot c v/s Ratio Perm 0.03 c v/c Ratio Uniform Delay, d Progression Factor Incremental Delay, d Delay (s) Level of Service D D E D A B A A A Approach Delay (s) Approach LOS D D B A Intersection Summary HCM Average Control Delay 15.1 HCM Level of Service B HCM Volume to Capacity ratio 0.79 Actuated Cycle Length (s) Sum of lost time (s) 13.0 Intersection Capacity Utilization 90.3% ICU Level of Service E Analysis Period (min) 60 c Critical Lane Group 11/4/2015 Synchro 7 Report AECOM Page 14
188 Lanes, Volumes, Timings Creditview -Future Interim Signal Concept 1 17: Rivergate Place & Creditview Road AM Peak Hour 2 Lane C-S to Argentia Lane Group WBL WBR NBT NBR SBL SBT Lane Configurations Volume (vph) Ideal Flow (vphpl) Lane Width (m) Grade (%) 0% 0% 0% Storage Length (m) Storage Lanes Taper Length (m) Link Speed (k/h) Link Distance (m) Travel Time (s) Confl. Peds. (#/hr) Confl. Bikes (#/hr) Peak Hour Factor Growth Factor 100% 100% 107% 100% 100% 111% Heavy Vehicles (%) 2% 2% 2% 2% 2% 2% Bus Blockages (#/hr) Parking (#/hr) Mid-Block Traffic (%) 0% 0% 0% Shared Lane Traffic (%) Sign Control Stop Free Free Intersection Summary Area Type: Other Control Type: Unsignalized 11/4/2015 Synchro 7 Report AECOM Page 15
189 HCM Unsignalized Intersection Capacity AnalysisCreditview -Future Interim Signal Concept 1 17: Rivergate Place & Creditview Road AM Peak Hour 2 Lane C-S to Argentia Movement WBL WBR NBT NBR SBL SBT Lane Configurations Volume (veh/h) Sign Control Stop Free Free Grade 0% 0% 0% Peak Hour Factor Hourly flow rate (vph) Pedestrians Lane Width (m) Walking Speed (m/s) Percent Blockage Right turn flare (veh) Median type None None Median storage veh) Upstream signal (m) 242 px, platoon unblocked vc, conflicting volume vc1, stage 1 conf vol vc2, stage 2 conf vol vcu, unblocked vol tc, single (s) tc, 2 stage (s) tf (s) p0 queue free % cm capacity (veh/h) Direction, Lane # WB 1 NB 1 SB 1 SB 2 Volume Total Volume Left Volume Right csh Volume to Capacity Queue Length 95th (m) Err Control Delay (s) Err Lane LOS F C Approach Delay (s) Err Approach LOS F Intersection Summary Average Delay 67.2 Intersection Capacity Utilization 79.2% ICU Level of Service D Analysis Period (min) 60 11/4/2015 Synchro 7 Report AECOM Page 16
190 Lanes, Volumes, Timings Creditview -Future Interim Signal Concept 1 23: Creditview Road & Velibit Court AM Peak Hour 2 Lane C-S to Argentia Lane Group SET SER NWL NWT NEL NER Lane Configurations Volume (vph) Ideal Flow (vphpl) Lane Width (m) Grade (%) 0% 0% 0% Storage Length (m) Storage Lanes Taper Length (m) Link Speed (k/h) Link Distance (m) Travel Time (s) Confl. Peds. (#/hr) Confl. Bikes (#/hr) Peak Hour Factor Growth Factor 111% 100% 100% 107% 100% 100% Heavy Vehicles (%) 2% 2% 2% 2% 2% 2% Bus Blockages (#/hr) Parking (#/hr) Mid-Block Traffic (%) 0% 0% 0% Shared Lane Traffic (%) Sign Control Free Free Stop Intersection Summary Area Type: Other Control Type: Unsignalized 11/4/2015 Synchro 7 Report AECOM Page 17
191 Lanes, Volumes, Timings Creditview-Future Interim Signal Concept 1 3: Office Entrance & Creditview Road 2021 PM Peak Hour- 2 Lane C-S Argentia Lane Group EBL EBT EBR WBL WBT WBR NBL NBT NBR SBL SBT SBR Lane Configurations Volume (vph) Ideal Flow (vphpl) Lane Width (m) Grade (%) 0% 0% 0% 0% Storage Length (m) Storage Lanes Taper Length (m) Right Turn on Red Yes Yes Yes Yes Link Speed (k/h) Link Distance (m) Travel Time (s) Confl. Peds. (#/hr) Confl. Bikes (#/hr) Peak Hour Factor Growth Factor 100% 100% 100% 100% 100% 100% 107% 107% 107% 111% 111% 111% Heavy Vehicles (%) 6% 0% 0% 1% 0% 4% 0% 1% 2% 8% 1% 8% Bus Blockages (#/hr) Parking (#/hr) Mid-Block Traffic (%) 0% 0% 0% 0% Shared Lane Traffic (%) Turn Type Perm Perm Perm Perm Perm Perm pm+pt Protected Phases Permitted Phases Detector Phase Switch Phase Minimum Initial (s) Minimum Split (s) Total Split (s) Total Split (%) 33.6% 33.6% 33.6% 33.6% 33.6% 33.6% 54.5% 54.5% 54.5% 11.8% 66.4% 0.0% Yellow Time (s) All-Red Time (s) Lost Time Adjust (s) Total Lost Time (s) Lead/Lag Lag Lag Lag Lead Lead-Lag Optimize? Recall Mode None None None None None None C-Max C-Max C-Max None C-Max Intersection Summary Area Type: Other Cycle Length: 110 Actuated Cycle Length: 110 Offset: 82 (75%), Referenced to phase 2:SBTL and 6:NBTL, Start of Green Natural Cycle: 80 Control Type: Actuated-Coordinated 11/4/2015 Synchro 7 - Report AECOM Page 1
192 Lanes, Volumes, Timings Creditview-Future Interim Signal Concept 1 3: Office Entrance & Creditview Road 2021 PM Peak Hour- 2 Lane C-S Argentia Splits and Phases: 3: Office Entrance & Creditview Road 11/4/2015 Synchro 7 - Report AECOM Page 2
193 HCM Signalized Intersection Capacity Analysis Creditview-Future Interim Signal Concept 1 3: Office Entrance & Creditview Road 2021 PM Peak Hour- 2 Lane C-S Argentia Movement EBL EBT EBR WBL WBT WBR NBL NBT NBR SBL SBT SBR Lane Configurations Volume (vph) Ideal Flow (vphpl) Total Lost time (s) Lane Util. Factor Frt Flt Protected Satd. Flow (prot) Flt Permitted Satd. Flow (perm) Peak-hour factor, PHF Growth Factor (vph) 100% 100% 100% 100% 100% 100% 107% 107% 107% 111% 111% 111% Adj. Flow (vph) RTOR Reduction (vph) Lane Group Flow (vph) Heavy Vehicles (%) 6% 0% 0% 1% 0% 4% 0% 1% 2% 8% 1% 8% Turn Type Perm Perm Perm Perm Perm Perm pm+pt Protected Phases Permitted Phases Actuated Green, G (s) Effective Green, g (s) Actuated g/c Ratio Clearance Time (s) Vehicle Extension (s) Lane Grp Cap (vph) v/s Ratio Prot c0.25 v/s Ratio Perm c v/c Ratio Uniform Delay, d Progression Factor Incremental Delay, d Delay (s) Level of Service D C E D B B C A A Approach Delay (s) Approach LOS D D B A Intersection Summary HCM Average Control Delay 18.3 HCM Level of Service B HCM Volume to Capacity ratio 0.47 Actuated Cycle Length (s) Sum of lost time (s) 14.0 Intersection Capacity Utilization 63.7% ICU Level of Service B Analysis Period (min) 60 c Critical Lane Group 11/4/2015 Synchro 7 - Report AECOM Page 3
194 Lanes, Volumes, Timings Creditview-Future Interim Signal Concept 1 5: Argentia Road & Creditview Road 2021 PM Peak Hour- 2 Lane C-S Argentia Lane Group EBL EBR NBL NBT SBT SBR Lane Configurations Volume (vph) Ideal Flow (vphpl) Lane Width (m) Grade (%) 0% 0% 0% Storage Length (m) Storage Lanes Taper Length (m) Right Turn on Red Yes Yes Link Speed (k/h) Link Distance (m) Travel Time (s) Confl. Peds. (#/hr) Confl. Bikes (#/hr) Peak Hour Factor Growth Factor 100% 100% 107% 107% 111% 111% Heavy Vehicles (%) 1% 1% 3% 1% 2% 0% Bus Blockages (#/hr) Parking (#/hr) Mid-Block Traffic (%) 0% 0% 0% Shared Lane Traffic (%) Turn Type pm+ov Prot Perm Protected Phases Permitted Phases 4 6 Detector Phase Switch Phase Minimum Initial (s) Minimum Split (s) Total Split (s) Total Split (%) 28.2% 21.8% 21.8% 71.8% 50.0% 50.0% Yellow Time (s) All-Red Time (s) Lost Time Adjust (s) Total Lost Time (s) Lead/Lag Lead Lead Lag Lag Lead-Lag Optimize? Yes Yes Yes Yes Recall Mode None None None C-Max C-Max C-Max Intersection Summary Area Type: Other Cycle Length: 110 Actuated Cycle Length: 110 Offset: 0 (0%), Referenced to phase 2:NBT and 6:SBT, Start of Green, Master Intersection Natural Cycle: 70 Control Type: Actuated-Coordinated 11/4/2015 Synchro 7 - Report AECOM Page 4
195 Lanes, Volumes, Timings Creditview-Future Interim Signal Concept 1 5: Argentia Road & Creditview Road 2021 PM Peak Hour- 2 Lane C-S Argentia Splits and Phases: 5: Argentia Road & Creditview Road 11/4/2015 Synchro 7 - Report AECOM Page 5
196 HCM Signalized Intersection Capacity Analysis Creditview-Future Interim Signal Concept 1 5: Argentia Road & Creditview Road 2021 PM Peak Hour- 2 Lane C-S Argentia Movement EBL EBR NBL NBT SBT SBR Lane Configurations Volume (vph) Ideal Flow (vphpl) Total Lost time (s) Lane Util. Factor Frt Flt Protected Satd. Flow (prot) Flt Permitted Satd. Flow (perm) Peak-hour factor, PHF Growth Factor (vph) 100% 100% 107% 107% 111% 111% Adj. Flow (vph) RTOR Reduction (vph) Lane Group Flow (vph) Heavy Vehicles (%) 1% 1% 3% 1% 2% 0% Turn Type pm+ov Prot Perm Protected Phases Permitted Phases 4 6 Actuated Green, G (s) Effective Green, g (s) Actuated g/c Ratio Clearance Time (s) Vehicle Extension (s) Lane Grp Cap (vph) v/s Ratio Prot 0.12 c c0.24 v/s Ratio Perm v/c Ratio Uniform Delay, d Progression Factor Incremental Delay, d Delay (s) Level of Service D D D A B A Approach Delay (s) Approach LOS D C B Intersection Summary HCM Average Control Delay 26.7 HCM Level of Service C HCM Volume to Capacity ratio 0.61 Actuated Cycle Length (s) Sum of lost time (s) 13.0 Intersection Capacity Utilization 65.5% ICU Level of Service C Analysis Period (min) 60 c Critical Lane Group 11/4/2015 Synchro 7 - Report AECOM Page 6
197 Lanes, Volumes, Timings Creditview-Future Interim Signal Concept 1 7: Falconer Drive & Creditview Road 2021 PM Peak Hour- 2 Lane C-S Argentia Lane Group EBL EBR NBL NBT SBT SBR Lane Configurations Volume (vph) Ideal Flow (vphpl) Lane Width (m) Grade (%) 0% 0% 0% Storage Length (m) Storage Lanes Taper Length (m) Link Speed (k/h) Link Distance (m) Travel Time (s) Confl. Peds. (#/hr) Confl. Bikes (#/hr) Peak Hour Factor Growth Factor 100% 100% 107% 107% 111% 111% Heavy Vehicles (%) 0% 0% 1% 2% 1% 0% Bus Blockages (#/hr) Parking (#/hr) Mid-Block Traffic (%) 0% 0% 0% Shared Lane Traffic (%) Sign Control Stop Free Free Intersection Summary Area Type: CBD Control Type: Unsignalized 11/4/2015 Synchro 7 - Report AECOM Page 7
198 HCM Unsignalized Intersection Capacity Analysis Creditview-Future Interim Signal Concept 1 7: Falconer Drive & Creditview Road 2021 PM Peak Hour- 2 Lane C-S Argentia Movement EBL EBR NBL NBT SBT SBR Lane Configurations Volume (veh/h) Sign Control Stop Free Free Grade 0% 0% 0% Peak Hour Factor Hourly flow rate (vph) Pedestrians Lane Width (m) Walking Speed (m/s) Percent Blockage Right turn flare (veh) Median type None None Median storage veh) Upstream signal (m) px, platoon unblocked vc, conflicting volume vc1, stage 1 conf vol vc2, stage 2 conf vol vcu, unblocked vol tc, single (s) tc, 2 stage (s) tf (s) p0 queue free % cm capacity (veh/h) Direction, Lane # EB 1 EB 2 NB 1 NB 2 SB 1 Volume Total Volume Left Volume Right csh Volume to Capacity Queue Length 95th (m) Control Delay (s) Lane LOS F F C Approach Delay (s) Approach LOS F Intersection Summary Average Delay 4.3 Intersection Capacity Utilization 105.4% ICU Level of Service G Analysis Period (min) 60 11/4/2015 Synchro 7 - Report AECOM Page 8
199 Lanes, Volumes, Timings Creditview-Future Interim Signal Concept 1 9: Kenninghall Blvd & Creditview Road 2021 PM Peak Hour- 2 Lane C-S Argentia Lane Group EBL EBT EBR WBL WBT WBR NBL NBT NBR SBL SBT SBR Lane Configurations Volume (vph) Ideal Flow (vphpl) Lane Width (m) Grade (%) 0% 0% 0% 0% Storage Length (m) Storage Lanes Taper Length (m) Right Turn on Red Yes Yes Yes Yes Link Speed (k/h) Link Distance (m) Travel Time (s) Confl. Peds. (#/hr) Confl. Bikes (#/hr) Peak Hour Factor Growth Factor 100% 100% 100% 100% 100% 100% 107% 107% 107% 111% 111% 111% Heavy Vehicles (%) 0% 0% 1% 0% 11% 0% 1% 2% 0% 75% 2% 0% Bus Blockages (#/hr) Parking (#/hr) Mid-Block Traffic (%) 0% 0% 0% 0% Shared Lane Traffic (%) Turn Type Perm Perm pm+pt Perm Protected Phases Permitted Phases Detector Phase Switch Phase Minimum Initial (s) Minimum Split (s) Total Split (s) Total Split (%) 27.3% 27.3% 0.0% 27.3% 27.3% 0.0% 11.8% 72.7% 0.0% 60.9% 60.9% 0.0% Yellow Time (s) All-Red Time (s) Lost Time Adjust (s) Total Lost Time (s) Lead/Lag Lead Lag Lag Lead-Lag Optimize? Yes Yes Yes Recall Mode None None None None None C-Max C-Max C-Max Intersection Summary Area Type: Other Cycle Length: 110 Actuated Cycle Length: 110 Offset: 32 (29%), Referenced to phase 2:NBTL and 6:SBTL, Start of Green Natural Cycle: 150 Control Type: Actuated-Coordinated 11/4/2015 Synchro 7 - Report AECOM Page 9
200 Lanes, Volumes, Timings Creditview-Future Interim Signal Concept 1 9: Kenninghall Blvd & Creditview Road 2021 PM Peak Hour- 2 Lane C-S Argentia Splits and Phases: 9: Kenninghall Blvd & Creditview Road 11/4/2015 Synchro 7 - Report AECOM Page 10
201 HCM Signalized Intersection Capacity Analysis Creditview-Future Interim Signal Concept 1 9: Kenninghall Blvd & Creditview Road 2021 PM Peak Hour- 2 Lane C-S Argentia Movement EBL EBT EBR WBL WBT WBR NBL NBT NBR SBL SBT SBR Lane Configurations Volume (vph) Ideal Flow (vphpl) Total Lost time (s) Lane Util. Factor Frt Flt Protected Satd. Flow (prot) Flt Permitted Satd. Flow (perm) Peak-hour factor, PHF Growth Factor (vph) 100% 100% 100% 100% 100% 100% 107% 107% 107% 111% 111% 111% Adj. Flow (vph) RTOR Reduction (vph) Lane Group Flow (vph) Heavy Vehicles (%) 0% 0% 1% 0% 11% 0% 1% 2% 0% 75% 2% 0% Turn Type Perm Perm pm+pt Perm Protected Phases Permitted Phases Actuated Green, G (s) Effective Green, g (s) Actuated g/c Ratio Clearance Time (s) Vehicle Extension (s) Lane Grp Cap (vph) v/s Ratio Prot c c0.78 v/s Ratio Perm 0.01 c v/c Ratio Uniform Delay, d Progression Factor Incremental Delay, d Delay (s) Level of Service D D D D F A A F Approach Delay (s) Approach LOS D D D F Intersection Summary HCM Average Control Delay HCM Level of Service F HCM Volume to Capacity ratio 1.03 Actuated Cycle Length (s) Sum of lost time (s) 15.0 Intersection Capacity Utilization 114.6% ICU Level of Service H Analysis Period (min) 60 c Critical Lane Group 11/4/2015 Synchro 7 - Report AECOM Page 11
202 Lanes, Volumes, Timings Creditview-Future Interim Signal Concept 1 12: Sir Monty's Drive & Creditview Road 2021 PM Peak Hour- 2 Lane C-S Argentia Lane Group EBL EBT EBR WBL WBT WBR NBL NBT NBR SBL SBT SBR Lane Configurations Volume (vph) Ideal Flow (vphpl) Lane Width (m) Grade (%) 0% 0% 0% 0% Storage Length (m) Storage Lanes Taper Length (m) Right Turn on Red Yes Yes Yes Yes Link Speed (k/h) Link Distance (m) Travel Time (s) Confl. Peds. (#/hr) Confl. Bikes (#/hr) Peak Hour Factor Growth Factor 100% 100% 100% 100% 100% 100% 107% 107% 107% 111% 111% 111% Heavy Vehicles (%) 0% 0% 5% 1% 0% 4% 2% 2% 1% 1% 1% 0% Bus Blockages (#/hr) Parking (#/hr) Mid-Block Traffic (%) 0% 0% 0% 0% Shared Lane Traffic (%) Turn Type Perm Perm Perm Perm Perm Protected Phases Permitted Phases Detector Phase Switch Phase Minimum Initial (s) Minimum Split (s) Total Split (s) Total Split (%) 30.0% 30.0% 0.0% 30.0% 30.0% 0.0% 70.0% 70.0% 70.0% 70.0% 70.0% 0.0% Yellow Time (s) All-Red Time (s) Lost Time Adjust (s) Total Lost Time (s) Lead/Lag Lead-Lag Optimize? Recall Mode None None None None C-Max C-Max C-Max C-Max C-Max Intersection Summary Area Type: Other Cycle Length: 110 Actuated Cycle Length: 110 Offset: 21 (19%), Referenced to phase 2:NBTL and 6:SBTL, Start of Green Natural Cycle: 90 Control Type: Actuated-Coordinated 11/4/2015 Synchro 7 - Report AECOM Page 12
203 Lanes, Volumes, Timings Creditview-Future Interim Signal Concept 1 12: Sir Monty's Drive & Creditview Road 2021 PM Peak Hour- 2 Lane C-S Argentia Splits and Phases: 12: Sir Monty's Drive & Creditview Road 11/4/2015 Synchro 7 - Report AECOM Page 13
204 HCM Signalized Intersection Capacity Analysis Creditview-Future Interim Signal Concept 1 12: Sir Monty's Drive & Creditview Road 2021 PM Peak Hour- 2 Lane C-S Argentia Movement EBL EBT EBR WBL WBT WBR NBL NBT NBR SBL SBT SBR Lane Configurations Volume (vph) Ideal Flow (vphpl) Total Lost time (s) Lane Util. Factor Frt Flt Protected Satd. Flow (prot) Flt Permitted Satd. Flow (perm) Peak-hour factor, PHF Growth Factor (vph) 100% 100% 100% 100% 100% 100% 107% 107% 107% 111% 111% 111% Adj. Flow (vph) RTOR Reduction (vph) Lane Group Flow (vph) Heavy Vehicles (%) 0% 0% 5% 1% 0% 4% 2% 2% 1% 1% 1% 0% Turn Type Perm Perm Perm Perm Perm Protected Phases Permitted Phases Actuated Green, G (s) Effective Green, g (s) Actuated g/c Ratio Clearance Time (s) Vehicle Extension (s) Lane Grp Cap (vph) v/s Ratio Prot c v/s Ratio Perm 0.04 c v/c Ratio Uniform Delay, d Progression Factor Incremental Delay, d Delay (s) Level of Service D D D D A B A A B Approach Delay (s) Approach LOS D D B A Intersection Summary HCM Average Control Delay 14.9 HCM Level of Service B HCM Volume to Capacity ratio 0.72 Actuated Cycle Length (s) Sum of lost time (s) 13.0 Intersection Capacity Utilization 92.4% ICU Level of Service F Analysis Period (min) 60 c Critical Lane Group 11/4/2015 Synchro 7 - Report AECOM Page 14
205 Lanes, Volumes, Timings Creditview-Future Interim Signal Concept 1 17: Rivergate Place & Creditview Road 2021 PM Peak Hour- 2 Lane C-S Argentia Lane Group WBL WBR NBT NBR SBL SBT Lane Configurations Volume (vph) Ideal Flow (vphpl) Lane Width (m) Grade (%) 0% 0% 0% Storage Length (m) Storage Lanes Taper Length (m) Link Speed (k/h) Link Distance (m) Travel Time (s) Confl. Peds. (#/hr) Confl. Bikes (#/hr) Peak Hour Factor Growth Factor 100% 100% 107% 100% 100% 111% Heavy Vehicles (%) 2% 2% 2% 2% 2% 2% Bus Blockages (#/hr) Parking (#/hr) Mid-Block Traffic (%) 0% 0% 0% Shared Lane Traffic (%) Sign Control Stop Free Free Intersection Summary Area Type: Other Control Type: Unsignalized 11/4/2015 Synchro 7 - Report AECOM Page 15
206 HCM Unsignalized Intersection Capacity Analysis Creditview-Future Interim Signal Concept 1 17: Rivergate Place & Creditview Road 2021 PM Peak Hour- 2 Lane C-S Argentia Movement WBL WBR NBT NBR SBL SBT Lane Configurations Volume (veh/h) Sign Control Stop Free Free Grade 0% 0% 0% Peak Hour Factor Hourly flow rate (vph) Pedestrians Lane Width (m) Walking Speed (m/s) Percent Blockage Right turn flare (veh) Median type None None Median storage veh) Upstream signal (m) 241 px, platoon unblocked vc, conflicting volume vc1, stage 1 conf vol vc2, stage 2 conf vol vcu, unblocked vol tc, single (s) tc, 2 stage (s) tf (s) p0 queue free % cm capacity (veh/h) Direction, Lane # WB 1 NB 1 SB 1 SB 2 Volume Total Volume Left Volume Right csh Volume to Capacity Queue Length 95th (m) Control Delay (s) Lane LOS F B Approach Delay (s) Approach LOS F Intersection Summary Average Delay 1.5 Intersection Capacity Utilization 86.9% ICU Level of Service E Analysis Period (min) 60 11/4/2015 Synchro 7 - Report AECOM Page 16
207 Lanes, Volumes, Timings Creditview-Future Interim Signal Concept 1 22: Creditview Road & Velebit Court 2021 PM Peak Hour- 2 Lane C-S Argentia Lane Group SET SER NWL NWT NEL NER Lane Configurations Volume (vph) Ideal Flow (vphpl) Lane Width (m) Grade (%) 0% 0% 0% Storage Length (m) Storage Lanes Taper Length (m) Link Speed (k/h) Link Distance (m) Travel Time (s) Confl. Peds. (#/hr) Confl. Bikes (#/hr) Peak Hour Factor Growth Factor 111% 100% 100% 107% 100% 100% Heavy Vehicles (%) 2% 2% 2% 2% 2% 2% Bus Blockages (#/hr) Parking (#/hr) Mid-Block Traffic (%) 0% 0% 0% Shared Lane Traffic (%) Sign Control Free Free Stop Intersection Summary Area Type: Other Control Type: Unsignalized 11/4/2015 Synchro 7 - Report AECOM Page 17
208 HCM Unsignalized Intersection Capacity Analysis Creditview-Future Interim Signal Concept 1 22: Creditview Road & Velebit Court 2021 PM Peak Hour- 2 Lane C-S Argentia Movement SET SER NWL NWT NEL NER Lane Configurations Volume (veh/h) Sign Control Free Free Stop Grade 0% 0% 0% Peak Hour Factor Hourly flow rate (vph) Pedestrians Lane Width (m) Walking Speed (m/s) Percent Blockage Right turn flare (veh) Median type None None Median storage veh) Upstream signal (m) 204 px, platoon unblocked vc, conflicting volume vc1, stage 1 conf vol vc2, stage 2 conf vol vcu, unblocked vol tc, single (s) 4.1 *5.3 *5.3 tc, 2 stage (s) tf (s) p0 queue free % cm capacity (veh/h) Direction, Lane # SE 1 NW 1 NW 2 NE 1 Volume Total Volume Left Volume Right csh Volume to Capacity Queue Length 95th (m) Err Control Delay (s) Err Lane LOS E F Approach Delay (s) Err Approach LOS F Intersection Summary Average Delay 10.7 Intersection Capacity Utilization 93.1% ICU Level of Service F Analysis Period (min) 60 * User Entered Value 11/4/2015 Synchro 7 - Report AECOM Page 18
209 HCM Unsignalized Intersection Capacity AnalysisCreditview -Future Interim Signal Concept 1 23: Creditview Road & Velibit Court AM Peak Hour 2 Lane C-S to Argentia Movement SET SER NWL NWT NEL NER Lane Configurations Volume (veh/h) Sign Control Free Free Stop Grade 0% 0% 0% Peak Hour Factor Hourly flow rate (vph) Pedestrians Lane Width (m) Walking Speed (m/s) Percent Blockage Right turn flare (veh) Median type None None Median storage veh) Upstream signal (m) 204 px, platoon unblocked vc, conflicting volume vc1, stage 1 conf vol vc2, stage 2 conf vol vcu, unblocked vol tc, single (s) 4.1 *5.3 *5.3 tc, 2 stage (s) tf (s) p0 queue free % cm capacity (veh/h) Direction, Lane # SE 1 NW 1 NW 2 NE 1 Volume Total Volume Left Volume Right csh Volume to Capacity Queue Length 95th (m) Err Control Delay (s) Err Lane LOS D F Approach Delay (s) Err Approach LOS F Intersection Summary Average Delay 40.8 Intersection Capacity Utilization 84.0% ICU Level of Service E Analysis Period (min) 60 * User Entered Value 11/4/2015 Synchro 7 Report AECOM Page 18
210 Lanes, Volumes, Timings Creditview Future Interim Design Concept 1 3: Office Entrance & Creditview Road 2031 AM Peak Hour- 2 Lane C-S to Argentia Lane Group EBL EBT EBR WBL WBT WBR NBL NBT NBR SBL SBT SBR Lane Configurations Volume (vph) Ideal Flow (vphpl) Lane Width (m) Grade (%) 0% 0% 0% 0% Storage Length (m) Storage Lanes Taper Length (m) Right Turn on Red Yes Yes Yes Yes Link Speed (k/h) Link Distance (m) Travel Time (s) Confl. Peds. (#/hr) Confl. Bikes (#/hr) Peak Hour Factor Growth Factor 100% 100% 100% 100% 100% 100% 116% 116% 116% 118% 118% 118% Heavy Vehicles (%) 0% 0% 0% 2% 0% 6% 0% 4% 8% 4% 4% 7% Bus Blockages (#/hr) Parking (#/hr) Mid-Block Traffic (%) 0% 0% 0% 0% Shared Lane Traffic (%) Turn Type Perm Perm Perm Perm Perm Perm pm+pt Protected Phases Permitted Phases Detector Phase Switch Phase Minimum Initial (s) Minimum Split (s) Total Split (s) Total Split (%) 31.8% 31.8% 31.8% 31.8% 31.8% 31.8% 55.5% 55.5% 55.5% 12.7% 68.2% 0.0% Yellow Time (s) All-Red Time (s) Lost Time Adjust (s) Total Lost Time (s) Lead/Lag Lag Lag Lag Lead Lead-Lag Optimize? Yes Yes Yes Yes Recall Mode None None None None None None C-Max C-Max C-Max None C-Max Intersection Summary Area Type: Other Cycle Length: 110 Actuated Cycle Length: 110 Offset: 79 (72%), Referenced to phase 2:SBTL and 6:NBTL, Start of Green Natural Cycle: 80 Control Type: Actuated-Coordinated 11/4/2015 Synchro 7 - Report AECOM Page 1
211 Lanes, Volumes, Timings Creditview Future Interim Design Concept 1 3: Office Entrance & Creditview Road 2031 AM Peak Hour- 2 Lane C-S to Argentia Splits and Phases: 3: Office Entrance & Creditview Road 11/4/2015 Synchro 7 - Report AECOM Page 2
212 HCM Signalized Intersection Capacity Analysis Creditview Future Interim Design Concept 1 3: Office Entrance & Creditview Road 2031 AM Peak Hour- 2 Lane C-S to Argentia Movement EBL EBT EBR WBL WBT WBR NBL NBT NBR SBL SBT SBR Lane Configurations Volume (vph) Ideal Flow (vphpl) Total Lost time (s) Lane Util. Factor Frt Flt Protected Satd. Flow (prot) Flt Permitted Satd. Flow (perm) Peak-hour factor, PHF Growth Factor (vph) 100% 100% 100% 100% 100% 100% 116% 116% 116% 118% 118% 118% Adj. Flow (vph) RTOR Reduction (vph) Lane Group Flow (vph) Heavy Vehicles (%) 0% 0% 0% 2% 0% 6% 0% 4% 8% 4% 4% 7% Turn Type Perm Perm Perm Perm Perm Perm pm+pt Protected Phases Permitted Phases Actuated Green, G (s) Effective Green, g (s) Actuated g/c Ratio Clearance Time (s) Vehicle Extension (s) Lane Grp Cap (vph) v/s Ratio Prot c0.27 c v/s Ratio Perm c v/c Ratio Uniform Delay, d Progression Factor Incremental Delay, d Delay (s) Level of Service C C E D B B B A A Approach Delay (s) Approach LOS C D B A Intersection Summary HCM Average Control Delay 18.4 HCM Level of Service B HCM Volume to Capacity ratio 0.56 Actuated Cycle Length (s) Sum of lost time (s) 17.0 Intersection Capacity Utilization 69.2% ICU Level of Service C Analysis Period (min) 60 c Critical Lane Group 11/4/2015 Synchro 7 - Report AECOM Page 3
213 Lanes, Volumes, Timings Creditview Future Interim Design Concept 1 5: Argentia Road & Creditview Road 2031 AM Peak Hour- 2 Lane C-S to Argentia Lane Group EBL EBR NBL NBT SBT SBR Lane Configurations Volume (vph) Ideal Flow (vphpl) Lane Width (m) Grade (%) 0% 0% 0% Storage Length (m) Storage Lanes Taper Length (m) Right Turn on Red Yes Yes Link Speed (k/h) Link Distance (m) Travel Time (s) Confl. Peds. (#/hr) Confl. Bikes (#/hr) Peak Hour Factor Growth Factor 100% 100% 116% 116% 118% 118% Heavy Vehicles (%) 5% 3% 2% 3% 5% 2% Bus Blockages (#/hr) Parking (#/hr) Mid-Block Traffic (%) 0% 0% 0% Shared Lane Traffic (%) Turn Type pm+ov Prot Perm Protected Phases Permitted Phases 4 6 Detector Phase Switch Phase Minimum Initial (s) Minimum Split (s) Total Split (s) Total Split (%) 26.4% 22.7% 22.7% 73.6% 50.9% 50.9% Yellow Time (s) All-Red Time (s) Lost Time Adjust (s) Total Lost Time (s) Lead/Lag Lead Lead Lag Lag Lead-Lag Optimize? Yes Yes Yes Yes Recall Mode None None None C-Max C-Max C-Max Intersection Summary Area Type: Other Cycle Length: 110 Actuated Cycle Length: 110 Offset: 0 (0%), Referenced to phase 2:NBT and 6:SBT, Start of Green, Master Intersection Natural Cycle: 70 Control Type: Actuated-Coordinated 11/4/2015 Synchro 7 - Report AECOM Page 4
214 Lanes, Volumes, Timings Creditview Future Interim Design Concept 1 5: Argentia Road & Creditview Road 2031 AM Peak Hour- 2 Lane C-S to Argentia Splits and Phases: 5: Argentia Road & Creditview Road 11/4/2015 Synchro 7 - Report AECOM Page 5
215 HCM Signalized Intersection Capacity Analysis Creditview Future Interim Design Concept 1 5: Argentia Road & Creditview Road 2031 AM Peak Hour- 2 Lane C-S to Argentia Movement EBL EBR NBL NBT SBT SBR Lane Configurations Volume (vph) Ideal Flow (vphpl) Total Lost time (s) Lane Util. Factor Frt Flt Protected Satd. Flow (prot) Flt Permitted Satd. Flow (perm) Peak-hour factor, PHF Growth Factor (vph) 100% 100% 116% 116% 118% 118% Adj. Flow (vph) RTOR Reduction (vph) Lane Group Flow (vph) Heavy Vehicles (%) 5% 3% 2% 3% 5% 2% Turn Type pm+ov Prot Perm Protected Phases Permitted Phases 4 6 Actuated Green, G (s) Effective Green, g (s) Actuated g/c Ratio Clearance Time (s) Vehicle Extension (s) Lane Grp Cap (vph) v/s Ratio Prot 0.07 c0.14 c c0.19 v/s Ratio Perm v/c Ratio Uniform Delay, d Progression Factor Incremental Delay, d Delay (s) Level of Service D C D A B A Approach Delay (s) Approach LOS D C A Intersection Summary HCM Average Control Delay 20.9 HCM Level of Service C HCM Volume to Capacity ratio 0.49 Actuated Cycle Length (s) Sum of lost time (s) 13.0 Intersection Capacity Utilization 55.4% ICU Level of Service B Analysis Period (min) 60 c Critical Lane Group 11/4/2015 Synchro 7 - Report AECOM Page 6
216 Lanes, Volumes, Timings Creditview Future Interim Design Concept 1 7: Falconer Drive & Creditview Road 2031 AM Peak Hour- 2 Lane C-S to Argentia Lane Group EBL EBR NBL NBT SBT SBR Lane Configurations Volume (vph) Ideal Flow (vphpl) Lane Width (m) Grade (%) 0% 0% 0% Storage Length (m) Storage Lanes Taper Length (m) Link Speed (k/h) Link Distance (m) Travel Time (s) Confl. Peds. (#/hr) Confl. Bikes (#/hr) Peak Hour Factor Growth Factor 100% 100% 116% 116% 118% 118% Heavy Vehicles (%) 7% 3% 2% 2% 3% 25% Bus Blockages (#/hr) Parking (#/hr) Mid-Block Traffic (%) 0% 0% 0% Shared Lane Traffic (%) Sign Control Stop Free Free Intersection Summary Area Type: Other Control Type: Unsignalized 11/4/2015 Synchro 7 - Report AECOM Page 7
217 HCM Unsignalized Intersection Capacity Analysis Creditview Future Interim Design Concept 1 7: Falconer Drive & Creditview Road 2031 AM Peak Hour- 2 Lane C-S to Argentia Movement EBL EBR NBL NBT SBT SBR Lane Configurations Volume (veh/h) Sign Control Stop Free Free Grade 0% 0% 0% Peak Hour Factor Hourly flow rate (vph) Pedestrians Lane Width (m) Walking Speed (m/s) Percent Blockage Right turn flare (veh) Median type None None Median storage veh) Upstream signal (m) px, platoon unblocked vc, conflicting volume vc1, stage 1 conf vol vc2, stage 2 conf vol vcu, unblocked vol tc, single (s) tc, 2 stage (s) tf (s) p0 queue free % cm capacity (veh/h) Direction, Lane # EB 1 EB 2 NB 1 NB 2 SB 1 Volume Total Volume Left Volume Right csh Volume to Capacity Queue Length 95th (m) Err Control Delay (s) Err Lane LOS F E B Approach Delay (s) Approach LOS F Intersection Summary Average Delay 56.6 Intersection Capacity Utilization 83.0% ICU Level of Service E Analysis Period (min) 60 11/4/2015 Synchro 7 - Report AECOM Page 8
218 Lanes, Volumes, Timings Creditview Future Interim Design Concept 1 9: Kenninghall Blvd & Creditview Road 2031 AM Peak Hour- 2 Lane C-S to Argentia Lane Group EBL EBT EBR WBL WBT WBR NBL NBT NBR SBL SBT SBR Lane Configurations Volume (vph) Ideal Flow (vphpl) Lane Width (m) Grade (%) 0% 0% 0% 0% Storage Length (m) Storage Lanes Taper Length (m) Right Turn on Red Yes Yes Yes Yes Link Speed (k/h) Link Distance (m) Travel Time (s) Confl. Peds. (#/hr) Confl. Bikes (#/hr) Peak Hour Factor Growth Factor 100% 100% 100% 100% 100% 100% 116% 116% 116% 118% 118% 118% Heavy Vehicles (%) 0% 0% 0% 0% 20% 61% 11% 2% 60% 75% 2% 0% Bus Blockages (#/hr) Parking (#/hr) Mid-Block Traffic (%) 0% 0% 0% 0% Shared Lane Traffic (%) Turn Type Perm Perm Perm Perm Protected Phases Permitted Phases Detector Phase Switch Phase Minimum Initial (s) Minimum Split (s) Total Split (s) Total Split (%) 29.1% 29.1% 0.0% 29.1% 29.1% 0.0% 70.9% 70.9% 0.0% 70.9% 70.9% 0.0% Yellow Time (s) All-Red Time (s) Lost Time Adjust (s) Total Lost Time (s) Lead/Lag Lead-Lag Optimize? Recall Mode None None None None C-Max C-Max C-Max C-Max Intersection Summary Area Type: Other Cycle Length: 110 Actuated Cycle Length: 110 Offset: 42 (38%), Referenced to phase 2:NBTL and 6:SBTL, Start of Green Natural Cycle: 130 Control Type: Actuated-Coordinated 11/4/2015 Synchro 7 - Report AECOM Page 9
219 Lanes, Volumes, Timings Creditview Future Interim Design Concept 1 9: Kenninghall Blvd & Creditview Road 2031 AM Peak Hour- 2 Lane C-S to Argentia Splits and Phases: 9: Kenninghall Blvd & Creditview Road 11/4/2015 Synchro 7 - Report AECOM Page 10
220 HCM Signalized Intersection Capacity Analysis Creditview Future Interim Design Concept 1 9: Kenninghall Blvd & Creditview Road 2031 AM Peak Hour- 2 Lane C-S to Argentia Movement EBL EBT EBR WBL WBT WBR NBL NBT NBR SBL SBT SBR Lane Configurations Volume (vph) Ideal Flow (vphpl) Total Lost time (s) Lane Util. Factor Frt Flt Protected Satd. Flow (prot) Flt Permitted Satd. Flow (perm) Peak-hour factor, PHF Growth Factor (vph) 100% 100% 100% 100% 100% 100% 116% 116% 116% 118% 118% 118% Adj. Flow (vph) RTOR Reduction (vph) Lane Group Flow (vph) Heavy Vehicles (%) 0% 0% 0% 0% 20% 61% 11% 2% 60% 75% 2% 0% Turn Type Perm Perm Perm Perm Protected Phases Permitted Phases Actuated Green, G (s) Effective Green, g (s) Actuated g/c Ratio Clearance Time (s) Vehicle Extension (s) Lane Grp Cap (vph) v/s Ratio Prot c c v/s Ratio Perm v/c Ratio Uniform Delay, d Progression Factor Incremental Delay, d Delay (s) Level of Service D D D D A B C B Approach Delay (s) Approach LOS D D B B Intersection Summary HCM Average Control Delay 17.9 HCM Level of Service B HCM Volume to Capacity ratio 0.89 Actuated Cycle Length (s) Sum of lost time (s) 12.0 Intersection Capacity Utilization 100.3% ICU Level of Service G Analysis Period (min) 60 c Critical Lane Group 11/4/2015 Synchro 7 - Report AECOM Page 11
221 Lanes, Volumes, Timings Creditview Future Interim Design Concept 1 12: Sir Monty's Drive & Creditview Road 2031 AM Peak Hour- 2 Lane C-S to Argentia Lane Group EBL EBT EBR WBL WBT WBR NBL NBT NBR SBL SBT SBR Lane Configurations Volume (vph) Ideal Flow (vphpl) Lane Width (m) Grade (%) 0% 0% 0% 0% Storage Length (m) Storage Lanes Taper Length (m) Right Turn on Red Yes Yes Yes Yes Link Speed (k/h) Link Distance (m) Travel Time (s) Confl. Peds. (#/hr) Confl. Bikes (#/hr) Peak Hour Factor Growth Factor 100% 100% 100% 100% 100% 100% 116% 116% 116% 118% 118% 118% Heavy Vehicles (%) 13% 6% 6% 1% 13% 7% 13% 2% 2% 38% 2% 36% Bus Blockages (#/hr) Parking (#/hr) Mid-Block Traffic (%) 0% 0% 0% 0% Shared Lane Traffic (%) Turn Type Perm Perm Perm Perm Perm Protected Phases Permitted Phases Detector Phase Switch Phase Minimum Initial (s) Minimum Split (s) Total Split (s) Total Split (%) 30.0% 30.0% 0.0% 30.0% 30.0% 0.0% 70.0% 70.0% 70.0% 70.0% 70.0% 0.0% Yellow Time (s) All-Red Time (s) Lost Time Adjust (s) Total Lost Time (s) Lead/Lag Lead-Lag Optimize? Recall Mode None None None None C-Max C-Max C-Max C-Max C-Max Intersection Summary Area Type: Other Cycle Length: 110 Actuated Cycle Length: 110 Offset: 6 (5%), Referenced to phase 2:NBTL and 6:SBTL, Start of Green Natural Cycle: 100 Control Type: Actuated-Coordinated 11/4/2015 Synchro 7 - Report AECOM Page 12
222 Lanes, Volumes, Timings Creditview Future Interim Design Concept 1 12: Sir Monty's Drive & Creditview Road 2031 AM Peak Hour- 2 Lane C-S to Argentia Splits and Phases: 12: Sir Monty's Drive & Creditview Road 11/4/2015 Synchro 7 - Report AECOM Page 13
223 HCM Signalized Intersection Capacity Analysis Creditview Future Interim Design Concept 1 12: Sir Monty's Drive & Creditview Road 2031 AM Peak Hour- 2 Lane C-S to Argentia Movement EBL EBT EBR WBL WBT WBR NBL NBT NBR SBL SBT SBR Lane Configurations Volume (vph) Ideal Flow (vphpl) Total Lost time (s) Lane Util. Factor Frt Flt Protected Satd. Flow (prot) Flt Permitted Satd. Flow (perm) Peak-hour factor, PHF Growth Factor (vph) 100% 100% 100% 100% 100% 100% 116% 116% 116% 118% 118% 118% Adj. Flow (vph) RTOR Reduction (vph) Lane Group Flow (vph) Heavy Vehicles (%) 13% 6% 6% 1% 13% 7% 13% 2% 2% 38% 2% 36% Turn Type Perm Perm Perm Perm Perm Protected Phases Permitted Phases Actuated Green, G (s) Effective Green, g (s) Actuated g/c Ratio Clearance Time (s) Vehicle Extension (s) Lane Grp Cap (vph) v/s Ratio Prot c v/s Ratio Perm 0.03 c v/c Ratio Uniform Delay, d Progression Factor Incremental Delay, d Delay (s) Level of Service D D E D A B A A A Approach Delay (s) Approach LOS D D B A Intersection Summary HCM Average Control Delay 16.6 HCM Level of Service B HCM Volume to Capacity ratio 0.85 Actuated Cycle Length (s) Sum of lost time (s) 13.0 Intersection Capacity Utilization 95.4% ICU Level of Service F Analysis Period (min) 60 c Critical Lane Group 11/4/2015 Synchro 7 - Report AECOM Page 14
224 Lanes, Volumes, Timings Creditview Future Interim Design Concept 1 19: Creditview Road & Velebit Court 2031 AM Peak Hour- 2 Lane C-S to Argentia Lane Group SET SER NWL NWT NEL NER Lane Configurations Volume (vph) Ideal Flow (vphpl) Lane Width (m) Grade (%) 0% 0% 0% Storage Length (m) Storage Lanes Taper Length (m) Link Speed (k/h) Link Distance (m) Travel Time (s) Confl. Peds. (#/hr) Confl. Bikes (#/hr) Peak Hour Factor Growth Factor 118% 100% 100% 116% 100% 100% Heavy Vehicles (%) 2% 2% 2% 2% 2% 2% Bus Blockages (#/hr) Parking (#/hr) Mid-Block Traffic (%) 0% 0% 0% Shared Lane Traffic (%) Sign Control Free Free Stop Intersection Summary Area Type: Other Control Type: Unsignalized 11/4/2015 Synchro 7 - Report AECOM Page 15
225 HCM Unsignalized Intersection Capacity Analysis Creditview Future Interim Design Concept 1 19: Creditview Road & Velebit Court 2031 AM Peak Hour- 2 Lane C-S to Argentia Movement SET SER NWL NWT NEL NER Lane Configurations Volume (veh/h) Sign Control Free Free Stop Grade 0% 0% 0% Peak Hour Factor Hourly flow rate (vph) Pedestrians Lane Width (m) Walking Speed (m/s) Percent Blockage Right turn flare (veh) Median type None None Median storage veh) Upstream signal (m) 204 px, platoon unblocked vc, conflicting volume vc1, stage 1 conf vol vc2, stage 2 conf vol vcu, unblocked vol tc, single (s) 4.1 *5.3 *5.3 tc, 2 stage (s) tf (s) p0 queue free % cm capacity (veh/h) Direction, Lane # SE 1 NW 1 NW 2 NE 1 Volume Total Volume Left Volume Right csh Volume to Capacity Queue Length 95th (m) Err Control Delay (s) Err Lane LOS E F Approach Delay (s) Err Approach LOS F Intersection Summary Average Delay 38.0 Intersection Capacity Utilization 88.7% ICU Level of Service E Analysis Period (min) 60 * User Entered Value 11/4/2015 Synchro 7 - Report AECOM Page 16
226 Lanes, Volumes, Timings Creditview Future Interim Design Concept 1 20: Creditview Road & Rivergate Place 2031 AM Peak Hour- 2 Lane C-S to Argentia Lane Group SEL SET NWT NWR SWL SWR Lane Configurations Volume (vph) Ideal Flow (vphpl) Lane Width (m) Grade (%) 0% 0% 0% Storage Length (m) Storage Lanes Taper Length (m) Link Speed (k/h) Link Distance (m) Travel Time (s) Confl. Peds. (#/hr) Confl. Bikes (#/hr) Peak Hour Factor Growth Factor 100% 118% 116% 100% 100% 100% Heavy Vehicles (%) 2% 2% 2% 2% 2% 2% Bus Blockages (#/hr) Parking (#/hr) Mid-Block Traffic (%) 0% 0% 0% Shared Lane Traffic (%) Sign Control Free Free Stop Intersection Summary Area Type: Other Control Type: Unsignalized 11/4/2015 Synchro 7 - Report AECOM Page 17
227 HCM Unsignalized Intersection Capacity Analysis Creditview Future Interim Design Concept 1 20: Creditview Road & Rivergate Place 2031 AM Peak Hour- 2 Lane C-S to Argentia Movement SEL SET NWT NWR SWL SWR Lane Configurations Volume (veh/h) Sign Control Free Free Stop Grade 0% 0% 0% Peak Hour Factor Hourly flow rate (vph) Pedestrians Lane Width (m) Walking Speed (m/s) Percent Blockage Right turn flare (veh) Median type None None Median storage veh) Upstream signal (m) 241 px, platoon unblocked vc, conflicting volume vc1, stage 1 conf vol vc2, stage 2 conf vol vcu, unblocked vol tc, single (s) 4.1 *5.4 *5.4 tc, 2 stage (s) tf (s) p0 queue free % cm capacity (veh/h) Direction, Lane # SE 1 SE 2 NW 1 SW 1 Volume Total Volume Left Volume Right csh Volume to Capacity Queue Length 95th (m) Err Control Delay (s) Err Lane LOS D F Approach Delay (s) Err Approach LOS F Intersection Summary Average Delay 62.6 Intersection Capacity Utilization 85.0% ICU Level of Service E Analysis Period (min) 60 * User Entered Value 11/4/2015 Synchro 7 - Report AECOM Page 18
228 Timings Creditview Future Interim Signla Concept 1 3: Office Entrance & Creditview Road 2031 PM Peak Hour- 2 Lane C-S to Argentia Lane Group EBL EBT EBR WBL WBT WBR NBL NBT NBR SBL SBT Lane Configurations Volume (vph) Turn Type Perm Perm Perm Perm Perm Perm pm+pt Protected Phases Permitted Phases Detector Phase Switch Phase Minimum Initial (s) Minimum Split (s) Total Split (s) Total Split (%) 33.6% 33.6% 33.6% 33.6% 33.6% 33.6% 54.5% 54.5% 54.5% 11.8% 66.4% Yellow Time (s) All-Red Time (s) Lost Time Adjust (s) Total Lost Time (s) Lead/Lag Lag Lag Lag Lead Lead-Lag Optimize? Recall Mode None None None None None None C-Max C-Max C-Max None C-Max Act Effct Green (s) Actuated g/c Ratio v/c Ratio Control Delay Queue Delay Total Delay LOS C B E A B B A A A Approach Delay Approach LOS C D B A Intersection Summary Cycle Length: 110 Actuated Cycle Length: 110 Offset: 82 (75%), Referenced to phase 2:SBTL and 6:NBTL, Start of Green Natural Cycle: 80 Control Type: Actuated-Coordinated Maximum v/c Ratio: 0.79 Intersection Signal Delay: 15.1 Intersection LOS: B Intersection Capacity Utilization 65.3% ICU Level of Service C Analysis Period (min) 60 Splits and Phases: 3: Office Entrance & Creditview Road AECOM Synchro 7 Report 11/6/2015 Page 1
229 HCM Signalized Intersection Capacity Analysis Creditview Future Interim Signla Concept 1 3: Office Entrance & Creditview Road 2031 PM Peak Hour- 2 Lane C-S to Argentia Movement EBL EBT EBR WBL WBT WBR NBL NBT NBR SBL SBT SBR Lane Configurations Volume (vph) Ideal Flow (vphpl) Total Lost time (s) Lane Util. Factor Frt Flt Protected Satd. Flow (prot) Flt Permitted Satd. Flow (perm) Peak-hour factor, PHF Growth Factor (vph) 100% 100% 100% 100% 100% 100% 116% 116% 116% 118% 118% 118% Adj. Flow (vph) RTOR Reduction (vph) Lane Group Flow (vph) Heavy Vehicles (%) 6% 0% 0% 1% 0% 4% 0% 1% 2% 8% 1% 8% Turn Type Perm Perm Perm Perm Perm Perm pm+pt Protected Phases Permitted Phases Actuated Green, G (s) Effective Green, g (s) Actuated g/c Ratio Clearance Time (s) Vehicle Extension (s) Lane Grp Cap (vph) v/s Ratio Prot c0.26 v/s Ratio Perm c v/c Ratio Uniform Delay, d Progression Factor Incremental Delay, d Delay (s) Level of Service D C E D B B C A A Approach Delay (s) Approach LOS D D B A Intersection Summary HCM Average Control Delay 18.7 HCM Level of Service B HCM Volume to Capacity ratio 0.48 Actuated Cycle Length (s) Sum of lost time (s) 14.0 Intersection Capacity Utilization 65.3% ICU Level of Service C Analysis Period (min) 60 c Critical Lane Group AECOM Synchro 7 Report 11/6/2015 Page 2
230 Lanes, Volumes, Timings Creditview Future Interim Signla Concept 1 5: Argentia Road & Creditview Road 2031 PM Peak Hour- 2 Lane C-S to Argentia Lane Group EBL EBR NBL NBT SBT SBR Lane Configurations Volume (vph) Ideal Flow (vphpl) Lane Width (m) Grade (%) 0% 0% 0% Storage Length (m) Storage Lanes Taper Length (m) Right Turn on Red Yes Yes Link Speed (k/h) Link Distance (m) Travel Time (s) Confl. Peds. (#/hr) Confl. Bikes (#/hr) Peak Hour Factor Growth Factor 100% 100% 116% 116% 118% 118% Heavy Vehicles (%) 1% 1% 3% 1% 2% 0% Bus Blockages (#/hr) Parking (#/hr) Mid-Block Traffic (%) 0% 0% 0% Shared Lane Traffic (%) Turn Type pm+ov Prot Perm Protected Phases Permitted Phases 4 6 Detector Phase Switch Phase Minimum Initial (s) Minimum Split (s) Total Split (s) Total Split (%) 28.2% 21.8% 21.8% 71.8% 50.0% 50.0% Yellow Time (s) All-Red Time (s) Lost Time Adjust (s) Total Lost Time (s) Lead/Lag Lead Lead Lag Lag Lead-Lag Optimize? Yes Yes Yes Yes Recall Mode None None None C-Max C-Max C-Max Intersection Summary Area Type: Other Cycle Length: 110 Actuated Cycle Length: 110 Offset: 0 (0%), Referenced to phase 2:NBT and 6:SBT, Start of Green, Master Intersection Natural Cycle: 70 Control Type: Actuated-Coordinated 11/4/2015 Synchro 7 Report AECOM Page 4
231 Lanes, Volumes, Timings Creditview Future Interim Signla Concept 1 5: Argentia Road & Creditview Road 2031 PM Peak Hour- 2 Lane C-S to Argentia Splits and Phases: 5: Argentia Road & Creditview Road 11/4/2015 Synchro 7 Report AECOM Page 5
232 HCM Signalized Intersection Capacity Analysis Creditview Future Interim Signla Concept 1 5: Argentia Road & Creditview Road 2031 PM Peak Hour- 2 Lane C-S to Argentia Movement EBL EBR NBL NBT SBT SBR Lane Configurations Volume (vph) Ideal Flow (vphpl) Total Lost time (s) Lane Util. Factor Frt Flt Protected Satd. Flow (prot) Flt Permitted Satd. Flow (perm) Peak-hour factor, PHF Growth Factor (vph) 100% 100% 116% 116% 118% 118% Adj. Flow (vph) RTOR Reduction (vph) Lane Group Flow (vph) Heavy Vehicles (%) 1% 1% 3% 1% 2% 0% Turn Type pm+ov Prot Perm Protected Phases Permitted Phases 4 6 Actuated Green, G (s) Effective Green, g (s) Actuated g/c Ratio Clearance Time (s) Vehicle Extension (s) Lane Grp Cap (vph) v/s Ratio Prot 0.12 c c0.26 v/s Ratio Perm v/c Ratio Uniform Delay, d Progression Factor Incremental Delay, d Delay (s) Level of Service D D D A B A Approach Delay (s) Approach LOS D C B Intersection Summary HCM Average Control Delay 26.2 HCM Level of Service C HCM Volume to Capacity ratio 0.63 Actuated Cycle Length (s) Sum of lost time (s) 13.0 Intersection Capacity Utilization 67.0% ICU Level of Service C Analysis Period (min) 60 c Critical Lane Group 11/4/2015 Synchro 7 Report AECOM Page 6
233 Lanes, Volumes, Timings Creditview Future Interim Signla Concept 1 7: Falconer Drive & Creditview Road 2031 PM Peak Hour- 2 Lane C-S to Argentia Lane Group EBL EBR NBL NBT SBT SBR Lane Configurations Volume (vph) Ideal Flow (vphpl) Lane Width (m) Grade (%) 0% 0% 0% Storage Length (m) Storage Lanes Taper Length (m) Link Speed (k/h) Link Distance (m) Travel Time (s) Confl. Peds. (#/hr) Confl. Bikes (#/hr) Peak Hour Factor Growth Factor 100% 100% 116% 116% 118% 118% Heavy Vehicles (%) 0% 0% 1% 2% 1% 0% Bus Blockages (#/hr) Parking (#/hr) Mid-Block Traffic (%) 0% 0% 0% Shared Lane Traffic (%) Sign Control Stop Free Free Intersection Summary Area Type: CBD Control Type: Unsignalized 11/4/2015 Synchro 7 Report AECOM Page 7
234 HCM Unsignalized Intersection Capacity Analysis Creditview Future Interim Signla Concept 1 7: Falconer Drive & Creditview Road 2031 PM Peak Hour- 2 Lane C-S to Argentia Movement EBL EBR NBL NBT SBT SBR Lane Configurations Volume (veh/h) Sign Control Stop Free Free Grade 0% 0% 0% Peak Hour Factor Hourly flow rate (vph) Pedestrians Lane Width (m) Walking Speed (m/s) Percent Blockage Right turn flare (veh) Median type None None Median storage veh) Upstream signal (m) px, platoon unblocked vc, conflicting volume vc1, stage 1 conf vol vc2, stage 2 conf vol vcu, unblocked vol tc, single (s) tc, 2 stage (s) tf (s) p0 queue free % cm capacity (veh/h) Direction, Lane # EB 1 EB 2 NB 1 NB 2 SB 1 Volume Total Volume Left Volume Right csh Volume to Capacity Queue Length 95th (m) Control Delay (s) Lane LOS F F E Approach Delay (s) Approach LOS F Intersection Summary Average Delay 6.5 Intersection Capacity Utilization 111.4% ICU Level of Service H Analysis Period (min) 60 11/4/2015 Synchro 7 Report AECOM Page 8
235 Lanes, Volumes, Timings Creditview Future Interim Signla Concept 1 9: Kenninghall Blvd & Creditview Road 2031 PM Peak Hour- 2 Lane C-S to Argentia Lane Group EBL EBT EBR WBL WBT WBR NBL NBT NBR SBL SBT SBR Lane Configurations Volume (vph) Ideal Flow (vphpl) Lane Width (m) Grade (%) 0% 0% 0% 0% Storage Length (m) Storage Lanes Taper Length (m) Right Turn on Red Yes Yes Yes Yes Link Speed (k/h) Link Distance (m) Travel Time (s) Confl. Peds. (#/hr) Confl. Bikes (#/hr) Peak Hour Factor Growth Factor 100% 100% 100% 100% 100% 100% 116% 116% 116% 118% 118% 118% Heavy Vehicles (%) 0% 0% 1% 0% 11% 0% 1% 2% 0% 75% 2% 0% Bus Blockages (#/hr) Parking (#/hr) Mid-Block Traffic (%) 0% 0% 0% 0% Shared Lane Traffic (%) Turn Type Perm Perm pm+pt Perm Protected Phases Permitted Phases Detector Phase Switch Phase Minimum Initial (s) Minimum Split (s) Total Split (s) Total Split (%) 27.3% 27.3% 0.0% 27.3% 27.3% 0.0% 11.8% 72.7% 0.0% 60.9% 60.9% 0.0% Yellow Time (s) All-Red Time (s) Lost Time Adjust (s) Total Lost Time (s) Lead/Lag Lead Lag Lag Lead-Lag Optimize? Yes Yes Yes Recall Mode None None None None None C-Max C-Max C-Max Intersection Summary Area Type: Other Cycle Length: 110 Actuated Cycle Length: 110 Offset: 32 (29%), Referenced to phase 2:NBTL and 6:SBTL, Start of Green Natural Cycle: 150 Control Type: Actuated-Coordinated 11/4/2015 Synchro 7 Report AECOM Page 9
236 Lanes, Volumes, Timings Creditview Future Interim Signla Concept 1 9: Kenninghall Blvd & Creditview Road 2031 PM Peak Hour- 2 Lane C-S to Argentia Splits and Phases: 9: Kenninghall Blvd & Creditview Road 11/4/2015 Synchro 7 Report AECOM Page 10
237 HCM Signalized Intersection Capacity Analysis Creditview Future Interim Signla Concept 1 9: Kenninghall Blvd & Creditview Road 2031 PM Peak Hour- 2 Lane C-S to Argentia Movement EBL EBT EBR WBL WBT WBR NBL NBT NBR SBL SBT SBR Lane Configurations Volume (vph) Ideal Flow (vphpl) Total Lost time (s) Lane Util. Factor Frt Flt Protected Satd. Flow (prot) Flt Permitted Satd. Flow (perm) Peak-hour factor, PHF Growth Factor (vph) 100% 100% 100% 100% 100% 100% 116% 116% 116% 118% 118% 118% Adj. Flow (vph) RTOR Reduction (vph) Lane Group Flow (vph) Heavy Vehicles (%) 0% 0% 1% 0% 11% 0% 1% 2% 0% 75% 2% 0% Turn Type Perm Perm pm+pt Perm Protected Phases Permitted Phases Actuated Green, G (s) Effective Green, g (s) Actuated g/c Ratio Clearance Time (s) Vehicle Extension (s) Lane Grp Cap (vph) v/s Ratio Prot c c0.83 v/s Ratio Perm 0.01 c v/c Ratio Uniform Delay, d Progression Factor Incremental Delay, d Delay (s) Level of Service D D D D F A A F Approach Delay (s) Approach LOS D D E F Intersection Summary HCM Average Control Delay HCM Level of Service F HCM Volume to Capacity ratio 1.09 Actuated Cycle Length (s) Sum of lost time (s) 15.0 Intersection Capacity Utilization 120.5% ICU Level of Service H Analysis Period (min) 60 c Critical Lane Group 11/4/2015 Synchro 7 Report AECOM Page 11
238 Lanes, Volumes, Timings Creditview Future Interim Signla Concept 1 12: Sir Monty's Drive & Creditview Road 2031 PM Peak Hour- 2 Lane C-S to Argentia Lane Group EBL EBT EBR WBL WBT WBR NBL NBT NBR SBL SBT SBR Lane Configurations Volume (vph) Ideal Flow (vphpl) Lane Width (m) Grade (%) 0% 0% 0% 0% Storage Length (m) Storage Lanes Taper Length (m) Right Turn on Red Yes Yes Yes Yes Link Speed (k/h) Link Distance (m) Travel Time (s) Confl. Peds. (#/hr) Confl. Bikes (#/hr) Peak Hour Factor Growth Factor 100% 100% 100% 100% 100% 100% 116% 116% 116% 118% 118% 118% Heavy Vehicles (%) 0% 0% 5% 1% 0% 4% 2% 2% 1% 1% 1% 0% Bus Blockages (#/hr) Parking (#/hr) Mid-Block Traffic (%) 0% 0% 0% 0% Shared Lane Traffic (%) Turn Type Perm Perm Perm Perm Perm Protected Phases Permitted Phases Detector Phase Switch Phase Minimum Initial (s) Minimum Split (s) Total Split (s) Total Split (%) 30.0% 30.0% 0.0% 30.0% 30.0% 0.0% 70.0% 70.0% 70.0% 70.0% 70.0% 0.0% Yellow Time (s) All-Red Time (s) Lost Time Adjust (s) Total Lost Time (s) Lead/Lag Lead-Lag Optimize? Recall Mode None None None None C-Max C-Max C-Max C-Max C-Max Intersection Summary Area Type: Other Cycle Length: 110 Actuated Cycle Length: 110 Offset: 21 (19%), Referenced to phase 2:NBTL and 6:SBTL, Start of Green Natural Cycle: 110 Control Type: Actuated-Coordinated 11/4/2015 Synchro 7 Report AECOM Page 12
239 Lanes, Volumes, Timings Creditview Future Interim Signla Concept 1 12: Sir Monty's Drive & Creditview Road 2031 PM Peak Hour- 2 Lane C-S to Argentia Splits and Phases: 12: Sir Monty's Drive & Creditview Road 11/4/2015 Synchro 7 Report AECOM Page 13
240 HCM Signalized Intersection Capacity Analysis Creditview Future Interim Signla Concept 1 12: Sir Monty's Drive & Creditview Road 2031 PM Peak Hour- 2 Lane C-S to Argentia Movement EBL EBT EBR WBL WBT WBR NBL NBT NBR SBL SBT SBR Lane Configurations Volume (vph) Ideal Flow (vphpl) Total Lost time (s) Lane Util. Factor Frt Flt Protected Satd. Flow (prot) Flt Permitted Satd. Flow (perm) Peak-hour factor, PHF Growth Factor (vph) 100% 100% 100% 100% 100% 100% 116% 116% 116% 118% 118% 118% Adj. Flow (vph) RTOR Reduction (vph) Lane Group Flow (vph) Heavy Vehicles (%) 0% 0% 5% 1% 0% 4% 2% 2% 1% 1% 1% 0% Turn Type Perm Perm Perm Perm Perm Protected Phases Permitted Phases Actuated Green, G (s) Effective Green, g (s) Actuated g/c Ratio Clearance Time (s) Vehicle Extension (s) Lane Grp Cap (vph) v/s Ratio Prot 0.01 c0.09 c v/s Ratio Perm v/c Ratio Uniform Delay, d Progression Factor Incremental Delay, d Delay (s) Level of Service D D D D B B A A B Approach Delay (s) Approach LOS D D B B Intersection Summary HCM Average Control Delay 16.3 HCM Level of Service B HCM Volume to Capacity ratio 0.78 Actuated Cycle Length (s) Sum of lost time (s) 13.0 Intersection Capacity Utilization 97.3% ICU Level of Service F Analysis Period (min) 60 c Critical Lane Group 11/4/2015 Synchro 7 Report AECOM Page 14
241 Lanes, Volumes, Timings Creditview Future Interim Signla Concept 1 19: Creditview Road & Velebit Court 2031 PM Peak Hour- 2 Lane C-S to Argentia Lane Group SET SER NWL NWT NEL NER Lane Configurations Volume (vph) Ideal Flow (vphpl) Lane Width (m) Grade (%) 0% 0% 0% Storage Length (m) Storage Lanes Taper Length (m) Link Speed (k/h) Link Distance (m) Travel Time (s) Confl. Peds. (#/hr) Confl. Bikes (#/hr) Peak Hour Factor Growth Factor 118% 100% 100% 116% 100% 100% Heavy Vehicles (%) 2% 2% 2% 2% 2% 2% Bus Blockages (#/hr) Parking (#/hr) Mid-Block Traffic (%) 0% 0% 0% Shared Lane Traffic (%) Sign Control Free Free Stop Intersection Summary Area Type: Other Control Type: Unsignalized 11/4/2015 Synchro 7 Report AECOM Page 15
242 HCM Unsignalized Intersection Capacity Analysis Creditview Future Interim Signla Concept 1 19: Creditview Road & Velebit Court 2031 PM Peak Hour- 2 Lane C-S to Argentia Movement SET SER NWL NWT NEL NER Lane Configurations Volume (veh/h) Sign Control Free Free Stop Grade 0% 0% 0% Peak Hour Factor Hourly flow rate (vph) Pedestrians Lane Width (m) Walking Speed (m/s) Percent Blockage Right turn flare (veh) Median type None None Median storage veh) Upstream signal (m) 209 px, platoon unblocked vc, conflicting volume vc1, stage 1 conf vol vc2, stage 2 conf vol vcu, unblocked vol tc, single (s) 4.1 *5.4 *5.4 tc, 2 stage (s) tf (s) p0 queue free % cm capacity (veh/h) Direction, Lane # SE 1 NW 1 NW 2 NE 1 Volume Total Volume Left Volume Right csh Volume to Capacity Queue Length 95th (m) Err Control Delay (s) Err Lane LOS F F Approach Delay (s) Err Approach LOS F Intersection Summary Average Delay 9.9 Intersection Capacity Utilization 98.3% ICU Level of Service F Analysis Period (min) 60 * User Entered Value 11/4/2015 Synchro 7 Report AECOM Page 16
243 Lanes, Volumes, Timings Creditview Future Interim Signla Concept 1 20: Creditview Road & Rivergate Place 2031 PM Peak Hour- 2 Lane C-S to Argentia Lane Group SEL SET NWT NWR SWL SWR Lane Configurations Volume (vph) Ideal Flow (vphpl) Lane Width (m) Grade (%) 0% 0% 0% Storage Length (m) Storage Lanes Taper Length (m) Link Speed (k/h) Link Distance (m) Travel Time (s) Confl. Peds. (#/hr) Confl. Bikes (#/hr) Peak Hour Factor Growth Factor 100% 118% 116% 100% 100% 100% Heavy Vehicles (%) 2% 2% 2% 2% 2% 2% Bus Blockages (#/hr) Parking (#/hr) Mid-Block Traffic (%) 0% 0% 0% Shared Lane Traffic (%) Sign Control Free Free Stop Intersection Summary Area Type: Other Control Type: Unsignalized 11/4/2015 Synchro 7 Report AECOM Page 17
244 HCM Unsignalized Intersection Capacity Analysis Creditview Future Interim Signla Concept 1 20: Creditview Road & Rivergate Place 2031 PM Peak Hour- 2 Lane C-S to Argentia Movement SEL SET NWT NWR SWL SWR Lane Configurations Volume (veh/h) Sign Control Free Free Stop Grade 0% 0% 0% Peak Hour Factor Hourly flow rate (vph) Pedestrians Lane Width (m) Walking Speed (m/s) Percent Blockage Right turn flare (veh) Median type None None Median storage veh) Upstream signal (m) 241 px, platoon unblocked vc, conflicting volume vc1, stage 1 conf vol vc2, stage 2 conf vol vcu, unblocked vol tc, single (s) tc, 2 stage (s) tf (s) p0 queue free % cm capacity (veh/h) Direction, Lane # SE 1 SE 2 NW 1 SW 1 Volume Total Volume Left Volume Right csh Volume to Capacity Queue Length 95th (m) Err Control Delay (s) Err Lane LOS C F Approach Delay (s) Err Approach LOS F Intersection Summary Average Delay 26.3 Intersection Capacity Utilization 91.7% ICU Level of Service F Analysis Period (min) 60 11/4/2015 Synchro 7 Report AECOM Page 18
245 Alternative 2
246 MOVEMENT SUMMARY Site: Argentia two-lane 2021 AM New Site Roundabout Network: combined AM Movement Performance - Vehicles Mov OD Demand Flows Arrival Flows Deg. Average Level of 95% Back of Queue Prop. Effective Average ID Mov Total HV Total HV Satn Delay Service Vehicles Distance Queued Stop Rate Speed veh/h % veh/h % v/c sec veh m per veh km/h South: Creditview 1 L LOS A T LOS A Approach N LOS A North: Creditview 8 T LOS A R LOS A Approach LOS A West: Argentia 10 L LOS B R LOS A Approach LOS A All Vehicles N LOS A Level of Service (LOS) Method: Delay (HCM 2000). Roundabout LOS Method: Same as Signalised Intersections. Vehicle movement LOS values are based on average delay per movement Intersection and Approach LOS values are based on average delay for all vehicle movements. Roundabout Capacity Model: SIDRA Standard. SIDRA Standard Delay Model is used. Control Delay includes Geometric Delay. Gap-Acceptance Capacity: SIDRA Standard (Akçelik M3D). HV (%) values are calculated for All Movement Classes of All Heavy Vehicle Model Designation. N1 Arrival Flow value is reduced due to capacity constraint at oversaturated upstream lanes. Processed: Thursday, May 14, :47:29 PM Copyright Akcelik and Associates Pty Ltd SIDRA INTERSECTION Project: P:\ \400-Technical\402 Traffic analysis\sidra models\creditview single lane combined signal.sip , , AECOM CANADA LTD (ONTARIO), NETWORK / 1PC
247 MOVEMENT SUMMARY Site: Kenninghall single-lane 2021 AM - Conversion New Site Signals - Fixed Time Cycle Time = 110 seconds (User-Given Cycle Time) Network: combined AM Movement Performance - Vehicles Mov OD Demand Flows Arrival Flows Deg. Average Level of 95% Back of Queue Prop. Effective Average ID Mov Total HV Total HV Satn Delay Service Vehicles Distance Queued Stop Rate Speed veh/h % veh/h % v/c sec veh m per veh km/h South: Creditview 1 L LOS C T LOS A R LOS B Approach LOS A East: Kenninghall 4 L LOS E T LOS D R LOS D Approach LOS E North: Creditview 7 L LOS C T LOS A R LOS B Approach N LOS A West: Kenninghall 10 L LOS E T LOS D R LOS E Approach LOS E All Vehicles N LOS B Level of Service (LOS) Method: Delay (HCM 2000). Vehicle movement LOS values are based on average delay per movement Intersection and Approach LOS values are based on average delay for all vehicle movements. SIDRA Standard Delay Model is used. Control Delay includes Geometric Delay. Gap-Acceptance Capacity: SIDRA Standard (Akçelik M3D). HV (%) values are calculated for All Movement Classes of All Heavy Vehicle Model Designation. N1 Arrival Flow value is reduced due to capacity constraint at oversaturated upstream lanes. Processed: Wednesday, September 30, :19:40 AM Copyright Akcelik and Associates Pty Ltd SIDRA INTERSECTION Project: P:\ \400-Technical\402 Traffic analysis\sidra models\creditview single lane combined signal 2021.sip , , AECOM CANADA LTD (ONTARIO), NETWORK / 1PC
248 MOVEMENT SUMMARY Site: Falconer single-lane 2021 AM - Conversion New Site Stop (Two-Way) Network: combined AM Movement Performance - Vehicles Mov OD Demand Flows Arrival Flows Deg. Average Level of 95% Back of Queue Prop. Effective Average ID Mov Total HV Total HV Satn Delay Service Vehicles Distance Queued Stop Rate Speed veh/h % veh/h % v/c sec veh m per veh km/h South: Creditview 1 L LOS C T LOS A Approach NA North: Creditview 8 T LOS A R LOS A Approach NA West: Falconer 10 L LOS F R LOS F Approach LOS F All Vehicles NA Level of Service (LOS) Method: Delay (HCM 2000). Vehicle movement LOS values are based on average delay per movement Minor Road Approach LOS values are based on average delay for all vehicle movements. NA: Intersection LOS and Major Road Approach LOS values are Not Applicable for two-way sign control since the average delay is not a good LOS measure due to zero delays associated with major road movements. SIDRA Standard Delay Model is used. Control Delay includes Geometric Delay. Gap-Acceptance Capacity: SIDRA Standard (Akçelik M3D). HV (%) values are calculated for All Movement Classes of All Heavy Vehicle Model Designation. Processed: Thursday, May 14, :47:29 PM Copyright Akcelik and Associates Pty Ltd SIDRA INTERSECTION Project: P:\ \400-Technical\402 Traffic analysis\sidra models\creditview single lane combined signal.sip , , AECOM CANADA LTD (ONTARIO), NETWORK / 1PC
249 MOVEMENT SUMMARY Site: Argentia two-lane 2021 PM New Site Roundabout Network: Combined PM Movement Performance - Vehicles Mov OD Demand Flows Arrival Flows Deg. Average Level of 95% Back of Queue Prop. Effective Average ID Mov Total HV Total HV Satn Delay Service Vehicles Distance Queued Stop Rate Speed veh/h % veh/h % v/c sec veh m per veh km/h South: Creditview 1 L LOS B T LOS A Approach N LOS A North: Creditview 8 T LOS A R LOS A Approach LOS A West: Argentia 10 L LOS B R LOS B Approach LOS B All Vehicles N LOS A Level of Service (LOS) Method: Delay (HCM 2000). Roundabout LOS Method: Same as Signalised Intersections. Vehicle movement LOS values are based on average delay per movement Intersection and Approach LOS values are based on average delay for all vehicle movements. Roundabout Capacity Model: SIDRA Standard. SIDRA Standard Delay Model is used. Control Delay includes Geometric Delay. Gap-Acceptance Capacity: SIDRA Standard (Akçelik M3D). HV (%) values are calculated for All Movement Classes of All Heavy Vehicle Model Designation. N1 Arrival Flow value is reduced due to capacity constraint at oversaturated upstream lanes. Processed: Thursday, May 14, :12:00 PM Copyright Akcelik and Associates Pty Ltd SIDRA INTERSECTION Project: P:\ \400-Technical\402 Traffic analysis\sidra models\creditview single lane combined signal.sip , , AECOM CANADA LTD (ONTARIO), NETWORK / 1PC
250 MOVEMENT SUMMARY Site: Kenninghall single-lane 2021 PM - Conversion New Site Signals - Fixed Time Cycle Time = 110 seconds (User-Given Cycle Time) Network: Combined PM Movement Performance - Vehicles Mov OD Demand Flows Arrival Flows Deg. Average Level of 95% Back of Queue Prop. Effective Average ID Mov Total HV Total HV Satn Delay Service Vehicles Distance Queued Stop Rate Speed veh/h % veh/h % v/c sec veh m per veh km/h South: Creditview 1 L LOS F T LOS A R LOS A Approach LOS C East: Kenninghall 4 L LOS E T LOS D R LOS E Approach LOS E North: Creditview 7 L LOS B T LOS D R LOS D Approach N LOS D West: Kenninghall 10 L LOS E T LOS E R LOS E Approach LOS E All Vehicles N LOS D Level of Service (LOS) Method: Delay (HCM 2000). Vehicle movement LOS values are based on average delay per movement Intersection and Approach LOS values are based on average delay for all vehicle movements. SIDRA Standard Delay Model is used. Control Delay includes Geometric Delay. Gap-Acceptance Capacity: SIDRA Standard (Akçelik M3D). HV (%) values are calculated for All Movement Classes of All Heavy Vehicle Model Designation. N1 Arrival Flow value is reduced due to capacity constraint at oversaturated upstream lanes. Processed: Wednesday, September 30, :31:25 AM Copyright Akcelik and Associates Pty Ltd SIDRA INTERSECTION Project: P:\ \400-Technical\402 Traffic analysis\sidra models\creditview single lane combined signal 2021.sip , , AECOM CANADA LTD (ONTARIO), NETWORK / 1PC
251 MOVEMENT SUMMARY Site: Falconer single-lane 2021 PM - Conversion New Site Stop (Two-Way) Network: Combined PM Movement Performance - Vehicles Mov OD Demand Flows Arrival Flows Deg. Average Level of 95% Back of Queue Prop. Effective Average ID Mov Total HV Total HV Satn Delay Service Vehicles Distance Queued Stop Rate Speed veh/h % veh/h % v/c sec veh m per veh km/h South: Creditview 1 L LOS F T LOS A Approach NA North: Creditview 8 T LOS A R LOS A Approach NA West: Falconer 10 L LOS F R LOS F Approach LOS F All Vehicles NA Level of Service (LOS) Method: Delay (HCM 2000). Vehicle movement LOS values are based on average delay per movement Minor Road Approach LOS values are based on average delay for all vehicle movements. NA: Intersection LOS and Major Road Approach LOS values are Not Applicable for two-way sign control since the average delay is not a good LOS measure due to zero delays associated with major road movements. SIDRA Standard Delay Model is used. Control Delay includes Geometric Delay. Gap-Acceptance Capacity: SIDRA Standard (Akçelik M3D). HV (%) values are calculated for All Movement Classes of All Heavy Vehicle Model Designation. Processed: Thursday, May 14, :12:00 PM Copyright Akcelik and Associates Pty Ltd SIDRA INTERSECTION Project: P:\ \400-Technical\402 Traffic analysis\sidra models\creditview single lane combined signal.sip , , AECOM CANADA LTD (ONTARIO), NETWORK / 1PC
252 MOVEMENT SUMMARY Site: Argentia double 2031 AM New Site Roundabout Network: 2031 AM Combined single lane Movement Performance - Vehicles Mov OD Demand Flows Arrival Flows Deg. Average Level of 95% Back of Queue Prop. Effective Average ID Mov Total HV Total HV Satn Delay Service Vehicles Distance Queued Stop Rate Speed veh/h % veh/h % v/c sec veh m per veh km/h South: Creditview 1 L LOS A T LOS A Approach N LOS A North: Creditview 8 T LOS A R LOS A Approach LOS A West: Argentia 10 L LOS B R LOS A Approach LOS A All Vehicles N LOS A Level of Service (LOS) Method: Delay (HCM 2000). Roundabout LOS Method: Same as Signalised Intersections. Vehicle movement LOS values are based on average delay per movement Intersection and Approach LOS values are based on average delay for all vehicle movements. Roundabout Capacity Model: SIDRA Standard. SIDRA Standard Delay Model is used. Control Delay includes Geometric Delay. Gap-Acceptance Capacity: SIDRA Standard (Akçelik M3D). HV (%) values are calculated for All Movement Classes of All Heavy Vehicle Model Designation. N1 Arrival Flow value is reduced due to capacity constraint at oversaturated upstream lanes. Processed: Thursday, November 05, :33:41 AM Copyright Akcelik and Associates Pty Ltd SIDRA INTERSECTION Project: C:\Users\skeltonv\Desktop\Creditview\400-Technical\402 Traffic analysis\sidra models\creditview single lane combined signal 2031.sip , , AECOM CANADA LTD (ONTARIO), NETWORK / 1PC
253 MOVEMENT SUMMARY Site: Falconer single-lane 2031 AM - Conversion New Site Stop (Two-Way) Network: 2031 AM Combined single lane Movement Performance - Vehicles Mov OD Demand Flows Arrival Flows Deg. Average Level of 95% Back of Queue Prop. Effective Average ID Mov Total HV Total HV Satn Delay Service Vehicles Distance Queued Stop Rate Speed veh/h % veh/h % v/c sec veh m per veh km/h South: Creditview 1 L LOS C T LOS A Approach NA North: Creditview 8 T LOS A R LOS A Approach NA West: Falconer 10 L LOS F R LOS F Approach LOS F All Vehicles NA Level of Service (LOS) Method: Delay (HCM 2000). Vehicle movement LOS values are based on average delay per movement Minor Road Approach LOS values are based on average delay for all vehicle movements. NA: Intersection LOS and Major Road Approach LOS values are Not Applicable for two-way sign control since the average delay is not a good LOS measure due to zero delays associated with major road movements. SIDRA Standard Delay Model is used. Control Delay includes Geometric Delay. Gap-Acceptance Capacity: SIDRA Standard (Akçelik M3D). HV (%) values are calculated for All Movement Classes of All Heavy Vehicle Model Designation. Processed: Thursday, November 05, :33:41 AM Copyright Akcelik and Associates Pty Ltd SIDRA INTERSECTION Project: C:\Users\skeltonv\Desktop\Creditview\400-Technical\402 Traffic analysis\sidra models\creditview single lane combined signal 2031.sip , , AECOM CANADA LTD (ONTARIO), NETWORK / 1PC
254 MOVEMENT SUMMARY Site: Kenninghall single-lane 2031 AM New Site Signals - Fixed Time Cycle Time = 110 seconds (User-Given Cycle Time) Network: 2031 AM Combined single lane Movement Performance - Vehicles Mov OD Demand Flows Arrival Flows Deg. Average Level of 95% Back of Queue Prop. Effective Average ID Mov Total HV Total HV Satn Delay Service Vehicles Distance Queued Stop Rate Speed veh/h % veh/h % v/c sec veh m per veh km/h South: Creditview 1 L LOS C T LOS B R LOS B Approach LOS B East: Kenninghall 4 L LOS E T LOS D R LOS D Approach LOS E North: Creditview 7 L LOS D T LOS A R LOS B Approach N LOS A West: Kenninghall 10 L LOS E T LOS E R LOS E Approach LOS E All Vehicles N LOS B Level of Service (LOS) Method: Delay (HCM 2000). Vehicle movement LOS values are based on average delay per movement Intersection and Approach LOS values are based on average delay for all vehicle movements. SIDRA Standard Delay Model is used. Control Delay includes Geometric Delay. Gap-Acceptance Capacity: SIDRA Standard (Akçelik M3D). HV (%) values are calculated for All Movement Classes of All Heavy Vehicle Model Designation. N1 Arrival Flow value is reduced due to capacity constraint at oversaturated upstream lanes. Processed: Thursday, November 05, :33:41 AM Copyright Akcelik and Associates Pty Ltd SIDRA INTERSECTION Project: C:\Users\skeltonv\Desktop\Creditview\400-Technical\402 Traffic analysis\sidra models\creditview single lane combined signal 2031.sip , , AECOM CANADA LTD (ONTARIO), NETWORK / 1PC
255 MOVEMENT SUMMARY Site: Argentia double 2031 PM New Site Roundabout Network: 2031 PM Combined single lane Movement Performance - Vehicles Mov OD Demand Flows Arrival Flows Deg. Average Level of 95% Back of Queue Prop. Effective Average ID Mov Total HV Total HV Satn Delay Service Vehicles Distance Queued Stop Rate Speed veh/h % veh/h % v/c sec veh m per veh km/h South: Creditview 1 L LOS B T LOS A Approach N LOS A North: Creditview 8 T LOS A R LOS A Approach LOS A West: Argentia 10 L LOS C R LOS B Approach LOS B All Vehicles N LOS B Level of Service (LOS) Method: Delay (HCM 2000). Roundabout LOS Method: Same as Signalised Intersections. Vehicle movement LOS values are based on average delay per movement Intersection and Approach LOS values are based on average delay for all vehicle movements. Roundabout Capacity Model: SIDRA Standard. SIDRA Standard Delay Model is used. Control Delay includes Geometric Delay. Gap-Acceptance Capacity: SIDRA Standard (Akçelik M3D). HV (%) values are calculated for All Movement Classes of All Heavy Vehicle Model Designation. N1 Arrival Flow value is reduced due to capacity constraint at oversaturated upstream lanes. Processed: Thursday, November 05, :35:12 AM Copyright Akcelik and Associates Pty Ltd SIDRA INTERSECTION Project: C:\Users\skeltonv\Desktop\Creditview\400-Technical\402 Traffic analysis\sidra models\creditview single lane combined signal 2031.sip , , AECOM CANADA LTD (ONTARIO), NETWORK / 1PC
256 MOVEMENT SUMMARY Site: Falconer single-lane 2031 PM - Conversion New Site Stop (Two-Way) Network: 2031 PM Combined single lane Movement Performance - Vehicles Mov OD Demand Flows Arrival Flows Deg. Average Level of 95% Back of Queue Prop. Effective Average ID Mov Total HV Total HV Satn Delay Service Vehicles Distance Queued Stop Rate Speed veh/h % veh/h % v/c sec veh m per veh km/h South: Creditview 1 L LOS F T LOS A Approach NA North: Creditview 8 T LOS F R LOS F Approach NA West: Falconer 10 L LOS F R LOS F Approach LOS F All Vehicles NA Level of Service (LOS) Method: Delay (HCM 2000). Vehicle movement LOS values are based on average delay per movement Minor Road Approach LOS values are based on average delay for all vehicle movements. NA: Intersection LOS and Major Road Approach LOS values are Not Applicable for two-way sign control since the average delay is not a good LOS measure due to zero delays associated with major road movements. SIDRA Standard Delay Model is used. Control Delay includes Geometric Delay. Gap-Acceptance Capacity: SIDRA Standard (Akçelik M3D). HV (%) values are calculated for All Movement Classes of All Heavy Vehicle Model Designation. Processed: Thursday, November 05, :35:12 AM Copyright Akcelik and Associates Pty Ltd SIDRA INTERSECTION Project: C:\Users\skeltonv\Desktop\Creditview\400-Technical\402 Traffic analysis\sidra models\creditview single lane combined signal 2031.sip , , AECOM CANADA LTD (ONTARIO), NETWORK / 1PC
257 MOVEMENT SUMMARY Site: Kenninghall single-lane 2031 PM New Site Signals - Fixed Time Cycle Time = 110 seconds (User-Given Cycle Time) Network: 2031 PM Combined single lane Movement Performance - Vehicles Mov OD Demand Flows Arrival Flows Deg. Average Level of 95% Back of Queue Prop. Effective Average ID Mov Total HV Total HV Satn Delay Service Vehicles Distance Queued Stop Rate Speed veh/h % veh/h % v/c sec veh m per veh km/h South: Creditview 1 L LOS F T LOS A R LOS B Approach LOS C East: Kenninghall 4 L LOS E T LOS D R LOS E Approach LOS E North: Creditview 7 L LOS C T LOS D R LOS D Approach N LOS D West: Kenninghall 10 L LOS E T LOS E R LOS E Approach LOS E All Vehicles N LOS C Level of Service (LOS) Method: Delay (HCM 2000). Vehicle movement LOS values are based on average delay per movement Intersection and Approach LOS values are based on average delay for all vehicle movements. SIDRA Standard Delay Model is used. Control Delay includes Geometric Delay. Gap-Acceptance Capacity: SIDRA Standard (Akçelik M3D). HV (%) values are calculated for All Movement Classes of All Heavy Vehicle Model Designation. N1 Arrival Flow value is reduced due to capacity constraint at oversaturated upstream lanes. Processed: Thursday, November 05, :35:12 AM Copyright Akcelik and Associates Pty Ltd SIDRA INTERSECTION Project: C:\Users\skeltonv\Desktop\Creditview\400-Technical\402 Traffic analysis\sidra models\creditview single lane combined signal 2031.sip , , AECOM CANADA LTD (ONTARIO), NETWORK / 1PC
258 Alternative 3 (Preferred Alternative)
259 MOVEMENT SUMMARY Site: Argentia two-lane 2021 AM Network: AM with Argentia 2 lane New Site Roundabout Movement Performance - Vehicles Mov OD Demand Flows Arrival Flows Deg. Average Level of 95% Back of Queue Prop. Effective Average ID Mov Total HV Total HV Satn Delay Service Vehicles Distance Queued Stop Rate Speed veh/h % veh/h % v/c sec veh m per veh km/h South: Creditview 1 L LOS B T LOS A Approach LOS A North: Creditview 8 T LOS A R LOS A Approach LOS A West: Argentia 10 L LOS B R LOS A Approach LOS A All Vehicles LOS A Level of Service (LOS) Method: Delay (HCM 2000). Roundabout LOS Method: Same as Signalised Intersections. Vehicle movement LOS values are based on average delay per movement Intersection and Approach LOS values are based on average delay for all vehicle movements. Roundabout Capacity Model: SIDRA Standard. SIDRA Standard Delay Model is used. Control Delay includes Geometric Delay. Gap-Acceptance Capacity: SIDRA Standard (Akçelik M3D). HV (%) values are calculated for All Movement Classes of All Heavy Vehicle Model Designation. Processed: Wednesday, January 07, :16:07 PM Copyright Akcelik and Associates Pty Ltd SIDRA INTERSECTION Project: P:\ \400-Technical\402 Traffic analysis\creditview single lane w no PHF.sip , , AECOM CANADA LTD (ONTARIO), NETWORK / 1PC
260 MOVEMENT SUMMARY Site: Kenninghall single-lane 2021 AM Network: AM with Argentia 2 lane New Site Roundabout Movement Performance - Vehicles Mov OD Demand Flows Arrival Flows Deg. Average Level of 95% Back of Queue Prop. Effective Average ID Mov Total HV Total HV Satn Delay Service Vehicles Distance Queued Stop Rate Speed veh/h % veh/h % v/c sec veh m per veh km/h South: Creditview 1 L LOS A T LOS A R LOS A Approach LOS A East: Kenninghall 4 L LOS C T LOS B R LOS B Approach LOS B North: Creditview 7 L LOS A T LOS A R LOS A Approach LOS A West: Kenninghall 10 L LOS C T LOS B R LOS B Approach LOS B All Vehicles LOS A Level of Service (LOS) Method: Delay (HCM 2000). Roundabout LOS Method: Same as Signalised Intersections. Vehicle movement LOS values are based on average delay per movement Intersection and Approach LOS values are based on average delay for all vehicle movements. Roundabout Capacity Model: SIDRA Standard. SIDRA Standard Delay Model is used. Control Delay includes Geometric Delay. Gap-Acceptance Capacity: SIDRA Standard (Akçelik M3D). HV (%) values are calculated for All Movement Classes of All Heavy Vehicle Model Designation. Processed: Wednesday, January 07, :16:07 PM Copyright Akcelik and Associates Pty Ltd SIDRA INTERSECTION Project: P:\ \400-Technical\402 Traffic analysis\creditview single lane w no PHF.sip , , AECOM CANADA LTD (ONTARIO), NETWORK / 1PC
261 MOVEMENT SUMMARY Site: Falconer single-lane 2021 AM Network: AM with Argentia 2 lane New Site Roundabout Movement Performance - Vehicles Mov OD Demand Flows Arrival Flows Deg. Average Level of 95% Back of Queue Prop. Effective Average ID Mov Total HV Total HV Satn Delay Service Vehicles Distance Queued Stop Rate Speed veh/h % veh/h % v/c sec veh m per veh km/h South: Creditview 1 L LOS A T LOS A Approach LOS A North: Creditview 8 T LOS A R LOS A Approach LOS A West: Falconer 10 L LOS B R LOS B Approach LOS B All Vehicles LOS A Level of Service (LOS) Method: Delay (HCM 2000). Roundabout LOS Method: Same as Signalised Intersections. Vehicle movement LOS values are based on average delay per movement Intersection and Approach LOS values are based on average delay for all vehicle movements. Roundabout Capacity Model: SIDRA Standard. SIDRA Standard Delay Model is used. Control Delay includes Geometric Delay. Gap-Acceptance Capacity: SIDRA Standard (Akçelik M3D). HV (%) values are calculated for All Movement Classes of All Heavy Vehicle Model Designation. Processed: Wednesday, January 07, :16:07 PM Copyright Akcelik and Associates Pty Ltd SIDRA INTERSECTION Project: P:\ \400-Technical\402 Traffic analysis\creditview single lane w no PHF.sip , , AECOM CANADA LTD (ONTARIO), NETWORK / 1PC
262 MOVEMENT SUMMARY Site: Argentia two-lane 2021 PM Network: PM with Argentia 2 lane New Site Roundabout Movement Performance - Vehicles Mov OD Demand Flows Arrival Flows Deg. Average Level of 95% Back of Queue Prop. Effective Average ID Mov Total HV Total HV Satn Delay Service Vehicles Distance Queued Stop Rate Speed veh/h % veh/h % v/c sec veh m per veh km/h South: Creditview 1 L LOS B T LOS A Approach LOS A North: Creditview 8 T LOS A R LOS A Approach LOS A West: Argentia 10 L LOS B R LOS B Approach LOS B All Vehicles LOS A Level of Service (LOS) Method: Delay (HCM 2000). Roundabout LOS Method: Same as Signalised Intersections. Vehicle movement LOS values are based on average delay per movement Intersection and Approach LOS values are based on average delay for all vehicle movements. Roundabout Capacity Model: SIDRA Standard. SIDRA Standard Delay Model is used. Control Delay includes Geometric Delay. Gap-Acceptance Capacity: SIDRA Standard (Akçelik M3D). HV (%) values are calculated for All Movement Classes of All Heavy Vehicle Model Designation. Processed: Wednesday, January 07, :19:52 PM Copyright Akcelik and Associates Pty Ltd SIDRA INTERSECTION Project: P:\ \400-Technical\402 Traffic analysis\creditview single lane w no PHF.sip , , AECOM CANADA LTD (ONTARIO), NETWORK / 1PC
263 MOVEMENT SUMMARY Site: Kenninghall single-lane 2021 PM Network: PM with Argentia 2 lane New Site Roundabout Movement Performance - Vehicles Mov OD Demand Flows Arrival Flows Deg. Average Level of 95% Back of Queue Prop. Effective Average ID Mov Total HV Total HV Satn Delay Service Vehicles Distance Queued Stop Rate Speed veh/h % veh/h % v/c sec veh m per veh km/h South: Creditview 1 L LOS A T LOS A R LOS A Approach LOS A East: Kenninghall 4 L LOS B T LOS B R LOS B Approach LOS B North: Creditview 7 L LOS C T LOS C R LOS C Approach N LOS C West: Kenninghall 10 L LOS C T LOS C R LOS C Approach LOS C All Vehicles N LOS B Level of Service (LOS) Method: Delay (HCM 2000). Roundabout LOS Method: Same as Signalised Intersections. Vehicle movement LOS values are based on average delay per movement Intersection and Approach LOS values are based on average delay for all vehicle movements. Roundabout Capacity Model: SIDRA Standard. SIDRA Standard Delay Model is used. Control Delay includes Geometric Delay. Gap-Acceptance Capacity: SIDRA Standard (Akçelik M3D). HV (%) values are calculated for All Movement Classes of All Heavy Vehicle Model Designation. N1 Arrival Flow value is reduced due to capacity constraint at oversaturated upstream lanes. Processed: Wednesday, January 07, :19:52 PM Copyright Akcelik and Associates Pty Ltd SIDRA INTERSECTION Project: P:\ \400-Technical\402 Traffic analysis\creditview single lane w no PHF.sip , , AECOM CANADA LTD (ONTARIO), NETWORK / 1PC
264 MOVEMENT SUMMARY Site: Falconer single-lane 2021 PM Network: PM with Argentia 2 lane New Site Roundabout Movement Performance - Vehicles Mov OD Demand Flows Arrival Flows Deg. Average Level of 95% Back of Queue Prop. Effective Average ID Mov Total HV Total HV Satn Delay Service Vehicles Distance Queued Stop Rate Speed veh/h % veh/h % v/c sec veh m per veh km/h South: Creditview 1 L LOS A T LOS A Approach LOS A North: Creditview 8 T LOS A R LOS A Approach LOS A West: Falconer 10 L LOS C R LOS C Approach LOS C All Vehicles LOS A Level of Service (LOS) Method: Delay (HCM 2000). Roundabout LOS Method: Same as Signalised Intersections. Vehicle movement LOS values are based on average delay per movement Intersection and Approach LOS values are based on average delay for all vehicle movements. Roundabout Capacity Model: SIDRA Standard. SIDRA Standard Delay Model is used. Control Delay includes Geometric Delay. Gap-Acceptance Capacity: SIDRA Standard (Akçelik M3D). HV (%) values are calculated for All Movement Classes of All Heavy Vehicle Model Designation. Processed: Wednesday, January 07, :19:52 PM Copyright Akcelik and Associates Pty Ltd SIDRA INTERSECTION Project: P:\ \400-Technical\402 Traffic analysis\creditview single lane w no PHF.sip , , AECOM CANADA LTD (ONTARIO), NETWORK / 1PC
265 MOVEMENT SUMMARY Site: Argentia two-lane 2031 AM Network: AM with Argentia 2 lane New Site Roundabout Movement Performance - Vehicles Mov OD Demand Flows Arrival Flows Deg. Average Level of 95% Back of Queue Prop. Effective Average ID Mov Total HV Total HV Satn Delay Service Vehicles Distance Queued Stop Rate Speed veh/h % veh/h % v/c sec veh m per veh km/h South: Creditview 1 L LOS A T LOS A Approach N LOS A North: Creditview 8 T LOS A R LOS A Approach LOS A West: Argentia 10 L LOS B R LOS A Approach LOS A All Vehicles N LOS A Level of Service (LOS) Method: Delay (HCM 2000). Roundabout LOS Method: Same as Signalised Intersections. Vehicle movement LOS values are based on average delay per movement Intersection and Approach LOS values are based on average delay for all vehicle movements. Roundabout Capacity Model: SIDRA Standard. SIDRA Standard Delay Model is used. Control Delay includes Geometric Delay. Gap-Acceptance Capacity: SIDRA Standard (Akçelik M3D). HV (%) values are calculated for All Movement Classes of All Heavy Vehicle Model Designation. N1 Arrival Flow value is reduced due to capacity constraint at oversaturated upstream lanes. Processed: Wednesday, November 04, :00:32 PM Copyright Akcelik and Associates Pty Ltd SIDRA INTERSECTION Project: C:\Users\skeltonv\Desktop\Creditview\400-Technical\402 Traffic analysis\sidra models\creditview single lane w no PHF 2031.sip , , AECOM CANADA LTD (ONTARIO), NETWORK / 1PC
266 MOVEMENT SUMMARY Site: Falconer single-lane 2031 AM Network: AM with Argentia 2 lane New Site Roundabout Movement Performance - Vehicles Mov OD Demand Flows Arrival Flows Deg. Average Level of 95% Back of Queue Prop. Effective Average ID Mov Total HV Total HV Satn Delay Service Vehicles Distance Queued Stop Rate Speed veh/h % veh/h % v/c sec veh m per veh km/h South: Creditview 1 L LOS A T LOS A Approach N LOS A North: Creditview 8 T LOS A R LOS A Approach LOS A West: Falconer 10 L LOS B R LOS B Approach LOS B All Vehicles N LOS A Level of Service (LOS) Method: Delay (HCM 2000). Roundabout LOS Method: Same as Signalised Intersections. Vehicle movement LOS values are based on average delay per movement Intersection and Approach LOS values are based on average delay for all vehicle movements. Roundabout Capacity Model: SIDRA Standard. SIDRA Standard Delay Model is used. Control Delay includes Geometric Delay. Gap-Acceptance Capacity: SIDRA Standard (Akçelik M3D). HV (%) values are calculated for All Movement Classes of All Heavy Vehicle Model Designation. N1 Arrival Flow value is reduced due to capacity constraint at oversaturated upstream lanes. Processed: Wednesday, November 04, :00:32 PM Copyright Akcelik and Associates Pty Ltd SIDRA INTERSECTION Project: C:\Users\skeltonv\Desktop\Creditview\400-Technical\402 Traffic analysis\sidra models\creditview single lane w no PHF 2031.sip , , AECOM CANADA LTD (ONTARIO), NETWORK / 1PC
267 MOVEMENT SUMMARY Site: Kenninghall single-lane 2031 AM Network: AM with Argentia 2 lane New Site Roundabout Movement Performance - Vehicles Mov OD Demand Flows Arrival Flows Deg. Average Level of 95% Back of Queue Prop. Effective Average ID Mov Total HV Total HV Satn Delay Service Vehicles Distance Queued Stop Rate Speed veh/h % veh/h % v/c sec veh m per veh km/h South: Creditview 1 L LOS A T LOS A R LOS A Approach N LOS A East: Kenninghall 4 L LOS B T LOS B R LOS B Approach LOS B North: Creditview 7 L LOS B T LOS A R LOS A Approach LOS A West: Kenninghall 10 L LOS C T LOS C R LOS C Approach LOS C All Vehicles N LOS A Level of Service (LOS) Method: Delay (HCM 2000). Roundabout LOS Method: Same as Signalised Intersections. Vehicle movement LOS values are based on average delay per movement Intersection and Approach LOS values are based on average delay for all vehicle movements. Roundabout Capacity Model: SIDRA Standard. SIDRA Standard Delay Model is used. Control Delay includes Geometric Delay. Gap-Acceptance Capacity: SIDRA Standard (Akçelik M3D). HV (%) values are calculated for All Movement Classes of All Heavy Vehicle Model Designation. N1 Arrival Flow value is reduced due to capacity constraint at oversaturated upstream lanes. Processed: Wednesday, November 04, :00:32 PM Copyright Akcelik and Associates Pty Ltd SIDRA INTERSECTION Project: C:\Users\skeltonv\Desktop\Creditview\400-Technical\402 Traffic analysis\sidra models\creditview single lane w no PHF 2031.sip , , AECOM CANADA LTD (ONTARIO), NETWORK / 1PC
268 MOVEMENT SUMMARY Site: Argentia two-lane 2031 PM Network: PM with Argentia 2 lane New Site Roundabout Movement Performance - Vehicles Mov OD Demand Flows Arrival Flows Deg. Average Level of 95% Back of Queue Prop. Effective Average ID Mov Total HV Total HV Satn Delay Service Vehicles Distance Queued Stop Rate Speed veh/h % veh/h % v/c sec veh m per veh km/h South: Creditview 1 L LOS B T LOS A Approach N LOS A North: Creditview 8 T LOS A R LOS A Approach LOS A West: Argentia 10 L LOS C R LOS B Approach LOS B All Vehicles N LOS B Level of Service (LOS) Method: Delay (HCM 2000). Roundabout LOS Method: Same as Signalised Intersections. Vehicle movement LOS values are based on average delay per movement Intersection and Approach LOS values are based on average delay for all vehicle movements. Roundabout Capacity Model: SIDRA Standard. SIDRA Standard Delay Model is used. Control Delay includes Geometric Delay. Gap-Acceptance Capacity: SIDRA Standard (Akçelik M3D). HV (%) values are calculated for All Movement Classes of All Heavy Vehicle Model Designation. N1 Arrival Flow value is reduced due to capacity constraint at oversaturated upstream lanes. Processed: Wednesday, November 04, :02:39 PM Copyright Akcelik and Associates Pty Ltd SIDRA INTERSECTION Project: C:\Users\skeltonv\Desktop\Creditview\400-Technical\402 Traffic analysis\sidra models\creditview single lane w no PHF 2031.sip , , AECOM CANADA LTD (ONTARIO), NETWORK / 1PC
269 MOVEMENT SUMMARY Site: Falconer single-lane 2031 PM Network: PM with Argentia 2 lane New Site Roundabout Movement Performance - Vehicles Mov OD Demand Flows Arrival Flows Deg. Average Level of 95% Back of Queue Prop. Effective Average ID Mov Total HV Total HV Satn Delay Service Vehicles Distance Queued Stop Rate Speed veh/h % veh/h % v/c sec veh m per veh km/h South: Creditview 1 L LOS A T LOS A Approach N LOS A North: Creditview 8 T LOS A R LOS B Approach LOS A West: Falconer 10 L LOS D R LOS C Approach LOS C All Vehicles N LOS A Level of Service (LOS) Method: Delay (HCM 2000). Roundabout LOS Method: Same as Signalised Intersections. Vehicle movement LOS values are based on average delay per movement Intersection and Approach LOS values are based on average delay for all vehicle movements. Roundabout Capacity Model: SIDRA Standard. SIDRA Standard Delay Model is used. Control Delay includes Geometric Delay. Gap-Acceptance Capacity: SIDRA Standard (Akçelik M3D). HV (%) values are calculated for All Movement Classes of All Heavy Vehicle Model Designation. N1 Arrival Flow value is reduced due to capacity constraint at oversaturated upstream lanes. Processed: Wednesday, November 04, :02:39 PM Copyright Akcelik and Associates Pty Ltd SIDRA INTERSECTION Project: C:\Users\skeltonv\Desktop\Creditview\400-Technical\402 Traffic analysis\sidra models\creditview single lane w no PHF 2031.sip , , AECOM CANADA LTD (ONTARIO), NETWORK / 1PC
270 MOVEMENT SUMMARY Site: Kenninghall single-lane 2031 PM Network: PM with Argentia 2 lane New Site Roundabout Movement Performance - Vehicles Mov OD Demand Flows Arrival Flows Deg. Average Level of 95% Back of Queue Prop. Effective Average ID Mov Total HV Total HV Satn Delay Service Vehicles Distance Queued Stop Rate Speed veh/h % veh/h % v/c sec veh m per veh km/h South: Creditview 1 L LOS A T LOS A R LOS A Approach N LOS A East: Kenninghall 4 L LOS B T LOS A R LOS A Approach LOS B North: Creditview 7 L LOS C T LOS B R LOS B Approach N LOS B West: Kenninghall 10 L LOS D T LOS C R LOS C Approach LOS C All Vehicles N LOS B Level of Service (LOS) Method: Delay (HCM 2000). Roundabout LOS Method: Same as Signalised Intersections. Vehicle movement LOS values are based on average delay per movement Intersection and Approach LOS values are based on average delay for all vehicle movements. Roundabout Capacity Model: SIDRA Standard. SIDRA Standard Delay Model is used. Control Delay includes Geometric Delay. Gap-Acceptance Capacity: SIDRA Standard (Akçelik M3D). HV (%) values are calculated for All Movement Classes of All Heavy Vehicle Model Designation. N1 Arrival Flow value is reduced due to capacity constraint at oversaturated upstream lanes. Processed: Wednesday, November 04, :02:39 PM Copyright Akcelik and Associates Pty Ltd SIDRA INTERSECTION Project: C:\Users\skeltonv\Desktop\Creditview\400-Technical\402 Traffic analysis\sidra models\creditview single lane w no PHF 2031.sip , , AECOM CANADA LTD (ONTARIO), NETWORK / 1PC
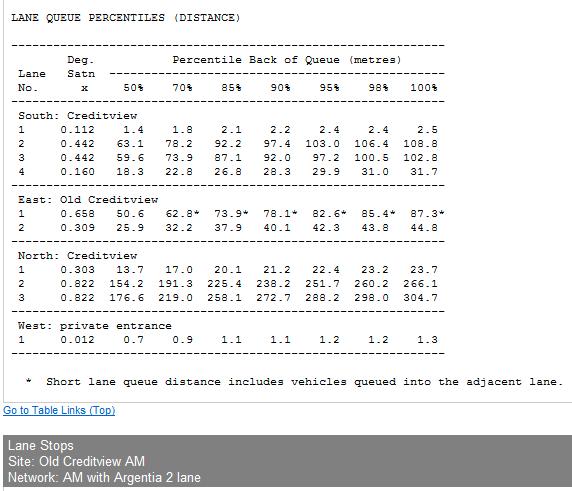
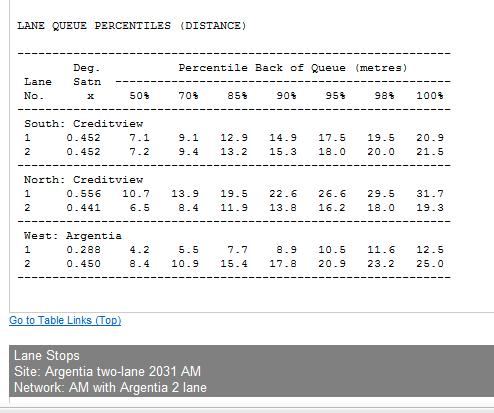
271
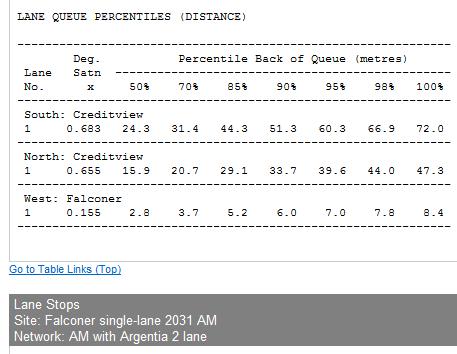

272
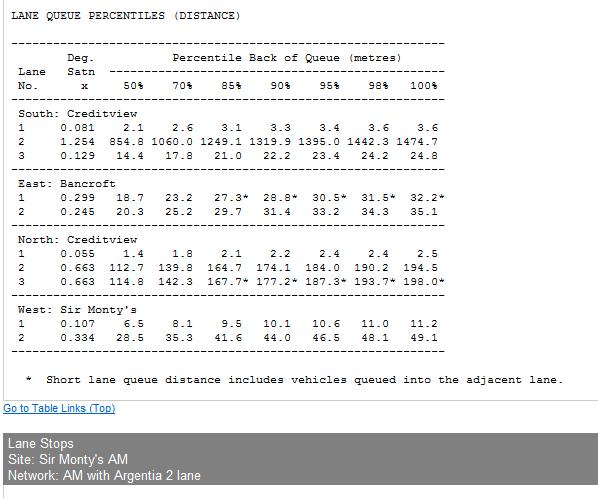
273
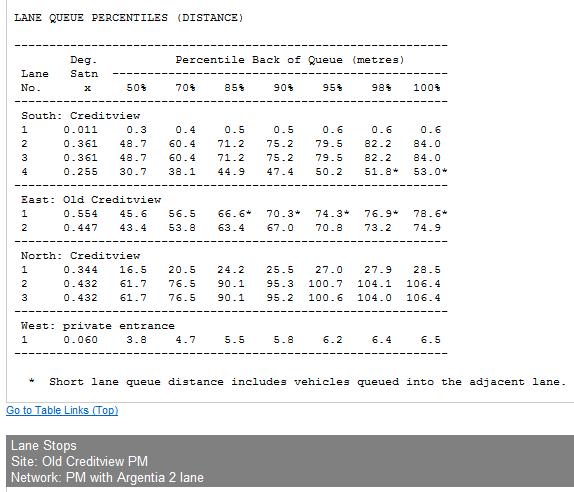
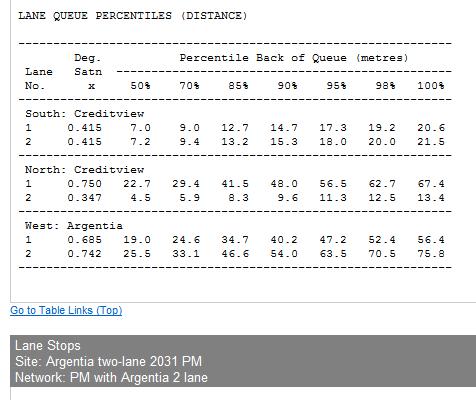
274
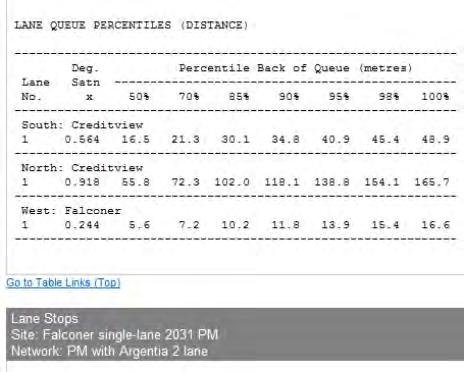
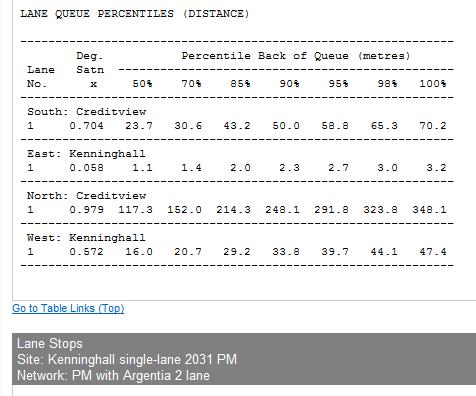
275

276
277 Alternative 4
278 Lanes, Volumes, Timings Ultimate Signalized Design Concept 3: Office Entrance & Creditview Road 2031 AM Peak Hour Lane Group EBL EBT EBR WBL WBT WBR NBL NBT NBR SBL SBT SBR Lane Configurations Volume (vph) Ideal Flow (vphpl) Lane Width (m) Grade (%) 0% 0% 0% 0% Storage Length (m) Storage Lanes Taper Length (m) Right Turn on Red Yes Yes Yes Yes Link Speed (k/h) Link Distance (m) Travel Time (s) Confl. Peds. (#/hr) Confl. Bikes (#/hr) Peak Hour Factor Growth Factor 100% 100% 100% 100% 100% 100% 161% 161% 161% 142% 142% 142% Heavy Vehicles (%) 0% 0% 0% 2% 0% 6% 0% 4% 8% 4% 4% 7% Bus Blockages (#/hr) Parking (#/hr) Mid-Block Traffic (%) 0% 0% 0% 0% Shared Lane Traffic (%) Turn Type Perm Perm Perm Perm Perm Perm pm+pt Protected Phases Permitted Phases Detector Phase Switch Phase Minimum Initial (s) Minimum Split (s) Total Split (s) Total Split (%) 30.0% 30.0% 30.0% 30.0% 30.0% 30.0% 57.3% 57.3% 57.3% 12.7% 70.0% 0.0% Yellow Time (s) All-Red Time (s) Lost Time Adjust (s) Total Lost Time (s) Lead/Lag Lag Lag Lag Lead Lead-Lag Optimize? Yes Yes Yes Yes Recall Mode None None None None None None C-Max C-Max C-Max None C-Max Intersection Summary Area Type: Other Cycle Length: 110 Actuated Cycle Length: 110 Offset: 79 (72%), Referenced to phase 2:SBTL and 6:NBTL, Start of Green Natural Cycle: 80 Control Type: Actuated-Coordinated 11/4/2015 Synchro 7 - Report AECOM Page 1
279 Lanes, Volumes, Timings Ultimate Signalized Design Concept 3: Office Entrance & Creditview Road 2031 AM Peak Hour Splits and Phases: 3: Office Entrance & Creditview Road 11/4/2015 Synchro 7 - Report AECOM Page 2
280 HCM Signalized Intersection Capacity Analysis Ultimate Signalized Design Concept 3: Office Entrance & Creditview Road 2031 AM Peak Hour Movement EBL EBT EBR WBL WBT WBR NBL NBT NBR SBL SBT SBR Lane Configurations Volume (vph) Ideal Flow (vphpl) Total Lost time (s) Lane Util. Factor Frt Flt Protected Satd. Flow (prot) Flt Permitted Satd. Flow (perm) Peak-hour factor, PHF Growth Factor (vph) 100% 100% 100% 100% 100% 100% 161% 161% 161% 142% 142% 142% Adj. Flow (vph) RTOR Reduction (vph) Lane Group Flow (vph) Heavy Vehicles (%) 0% 0% 0% 2% 0% 6% 0% 4% 8% 4% 4% 7% Turn Type Perm Perm Perm Perm Perm Perm pm+pt Protected Phases Permitted Phases Actuated Green, G (s) Effective Green, g (s) Actuated g/c Ratio Clearance Time (s) Vehicle Extension (s) Lane Grp Cap (vph) v/s Ratio Prot 0.38 c v/s Ratio Perm c c0.40 v/c Ratio Uniform Delay, d Progression Factor Incremental Delay, d Delay (s) Level of Service D D E D B C B C A Approach Delay (s) Approach LOS D D B B Intersection Summary HCM Average Control Delay 19.8 HCM Level of Service B HCM Volume to Capacity ratio 0.69 Actuated Cycle Length (s) Sum of lost time (s) 10.0 Intersection Capacity Utilization 81.2% ICU Level of Service D Analysis Period (min) 60 c Critical Lane Group 11/4/2015 Synchro 7 - Report AECOM Page 3
281 Lanes, Volumes, Timings Ultimate Signalized Design Concept 5: Argentia Road & Creditview Road 2031 AM Peak Hour Lane Group EBL EBR NBL NBT SBT SBR Lane Configurations Volume (vph) Ideal Flow (vphpl) Lane Width (m) Grade (%) 0% 0% 0% Storage Length (m) Storage Lanes Taper Length (m) Right Turn on Red Yes Yes Link Speed (k/h) Link Distance (m) Travel Time (s) Confl. Peds. (#/hr) Confl. Bikes (#/hr) Peak Hour Factor Growth Factor 100% 100% 161% 161% 142% 142% Heavy Vehicles (%) 5% 3% 2% 3% 5% 2% Bus Blockages (#/hr) Parking (#/hr) Mid-Block Traffic (%) 0% 0% 0% Shared Lane Traffic (%) Turn Type pm+ov Prot Perm Protected Phases Permitted Phases 4 6 Detector Phase Switch Phase Minimum Initial (s) Minimum Split (s) Total Split (s) Total Split (%) 26.4% 29.1% 29.1% 73.6% 44.5% 44.5% Yellow Time (s) All-Red Time (s) Lost Time Adjust (s) Total Lost Time (s) Lead/Lag Lead Lead Lag Lag Lead-Lag Optimize? Yes Yes Yes Yes Recall Mode None None None C-Max C-Max C-Max Intersection Summary Area Type: Other Cycle Length: 110 Actuated Cycle Length: 110 Offset: 0 (0%), Referenced to phase 2:NBT and 6:SBT, Start of Green, Master Intersection Natural Cycle: 80 Control Type: Actuated-Coordinated 11/4/2015 Synchro 7 - Report AECOM Page 4
282 Lanes, Volumes, Timings Ultimate Signalized Design Concept 5: Argentia Road & Creditview Road 2031 AM Peak Hour Splits and Phases: 5: Argentia Road & Creditview Road 11/4/2015 Synchro 7 - Report AECOM Page 5
283 HCM Signalized Intersection Capacity Analysis Ultimate Signalized Design Concept 5: Argentia Road & Creditview Road 2031 AM Peak Hour Movement EBL EBR NBL NBT SBT SBR Lane Configurations Volume (vph) Ideal Flow (vphpl) Total Lost time (s) Lane Util. Factor Frt Flt Protected Satd. Flow (prot) Flt Permitted Satd. Flow (perm) Peak-hour factor, PHF Growth Factor (vph) 100% 100% 161% 161% 142% 142% Adj. Flow (vph) RTOR Reduction (vph) Lane Group Flow (vph) Heavy Vehicles (%) 5% 3% 2% 3% 5% 2% Turn Type pm+ov Prot Perm Protected Phases Permitted Phases 4 6 Actuated Green, G (s) Effective Green, g (s) Actuated g/c Ratio Clearance Time (s) Vehicle Extension (s) Lane Grp Cap (vph) v/s Ratio Prot 0.07 c0.18 c c0.23 v/s Ratio Perm v/c Ratio Uniform Delay, d Progression Factor Incremental Delay, d Delay (s) Level of Service D C D A B A Approach Delay (s) Approach LOS D C B Intersection Summary HCM Average Control Delay 21.3 HCM Level of Service C HCM Volume to Capacity ratio 0.63 Actuated Cycle Length (s) Sum of lost time (s) 17.0 Intersection Capacity Utilization 66.0% ICU Level of Service C Analysis Period (min) 60 c Critical Lane Group 11/4/2015 Synchro 7 - Report AECOM Page 6
284 Lanes, Volumes, Timings Ultimate Signalized Design Concept 7: Falconer Drive & Creditview Road 2031 AM Peak Hour Lane Group EBL EBR NBL NBT SBT SBR Lane Configurations Volume (vph) Ideal Flow (vphpl) Lane Width (m) Grade (%) 0% 0% 0% Storage Length (m) Storage Lanes Taper Length (m) Link Speed (k/h) Link Distance (m) Travel Time (s) Confl. Peds. (#/hr) Confl. Bikes (#/hr) Peak Hour Factor Growth Factor 100% 100% 161% 161% 142% 142% Heavy Vehicles (%) 7% 3% 2% 2% 3% 25% Bus Blockages (#/hr) Parking (#/hr) Mid-Block Traffic (%) 0% 0% 0% Shared Lane Traffic (%) Sign Control Stop Free Free Intersection Summary Area Type: Other Control Type: Unsignalized 11/4/2015 Synchro 7 - Report AECOM Page 7
285 HCM Unsignalized Intersection Capacity Analysis Ultimate Signalized Design Concept 7: Falconer Drive & Creditview Road 2031 AM Peak Hour Movement EBL EBR NBL NBT SBT SBR Lane Configurations Volume (veh/h) Sign Control Stop Free Free Grade 0% 0% 0% Peak Hour Factor Hourly flow rate (vph) Pedestrians Lane Width (m) Walking Speed (m/s) Percent Blockage Right turn flare (veh) Median type None None Median storage veh) Upstream signal (m) px, platoon unblocked vc, conflicting volume vc1, stage 1 conf vol vc2, stage 2 conf vol vcu, unblocked vol tc, single (s) tc, 2 stage (s) tf (s) p0 queue free % cm capacity (veh/h) Direction, Lane # EB 1 EB 2 NB 1 NB 2 NB 3 SB 1 SB 2 Volume Total Volume Left Volume Right csh Volume to Capacity Queue Length 95th (m) Control Delay (s) Lane LOS F B B Approach Delay (s) Approach LOS C Intersection Summary Average Delay 0.8 Intersection Capacity Utilization 63.2% ICU Level of Service B Analysis Period (min) 60 11/4/2015 Synchro 7 - Report AECOM Page 8
286 Lanes, Volumes, Timings Ultimate Signalized Design Concept 9: Kenninghall Blvd & Creditview Road 2031 AM Peak Hour Lane Group EBL EBT EBR WBL WBT WBR NBL NBT NBR SBL SBT SBR Lane Configurations Volume (vph) Ideal Flow (vphpl) Lane Width (m) Grade (%) 0% 0% 0% 0% Storage Length (m) Storage Lanes Taper Length (m) Right Turn on Red Yes Yes Yes Yes Link Speed (k/h) Link Distance (m) Travel Time (s) Confl. Peds. (#/hr) Confl. Bikes (#/hr) Peak Hour Factor Growth Factor 100% 100% 100% 100% 100% 100% 161% 161% 161% 142% 142% 142% Heavy Vehicles (%) 0% 0% 0% 0% 20% 61% 11% 2% 60% 75% 2% 0% Bus Blockages (#/hr) Parking (#/hr) Mid-Block Traffic (%) 0% 0% 0% 0% Shared Lane Traffic (%) Turn Type Perm Perm Perm Perm Protected Phases Permitted Phases Detector Phase Switch Phase Minimum Initial (s) Minimum Split (s) Total Split (s) Total Split (%) 29.1% 29.1% 0.0% 29.1% 29.1% 0.0% 70.9% 70.9% 0.0% 70.9% 70.9% 0.0% Yellow Time (s) All-Red Time (s) Lost Time Adjust (s) Total Lost Time (s) Lead/Lag Lead-Lag Optimize? Recall Mode None None None None C-Max C-Max C-Max C-Max Intersection Summary Area Type: Other Cycle Length: 110 Actuated Cycle Length: 110 Offset: 42 (38%), Referenced to phase 2:NBTL and 6:SBTL, Start of Green Natural Cycle: 80 Control Type: Actuated-Coordinated 11/4/2015 Synchro 7 - Report AECOM Page 9
287 Lanes, Volumes, Timings Ultimate Signalized Design Concept 9: Kenninghall Blvd & Creditview Road 2031 AM Peak Hour Splits and Phases: 9: Kenninghall Blvd & Creditview Road 11/4/2015 Synchro 7 - Report AECOM Page 10
288 HCM Signalized Intersection Capacity Analysis Ultimate Signalized Design Concept 9: Kenninghall Blvd & Creditview Road 2031 AM Peak Hour Movement EBL EBT EBR WBL WBT WBR NBL NBT NBR SBL SBT SBR Lane Configurations Volume (vph) Ideal Flow (vphpl) Total Lost time (s) Lane Util. Factor Frt Flt Protected Satd. Flow (prot) Flt Permitted Satd. Flow (perm) Peak-hour factor, PHF Growth Factor (vph) 100% 100% 100% 100% 100% 100% 161% 161% 161% 142% 142% 142% Adj. Flow (vph) RTOR Reduction (vph) Lane Group Flow (vph) Heavy Vehicles (%) 0% 0% 0% 0% 20% 61% 11% 2% 60% 75% 2% 0% Turn Type Perm Perm Perm Perm Protected Phases Permitted Phases Actuated Green, G (s) Effective Green, g (s) Actuated g/c Ratio Clearance Time (s) Vehicle Extension (s) Lane Grp Cap (vph) v/s Ratio Prot c c v/s Ratio Perm v/c Ratio Uniform Delay, d Progression Factor Incremental Delay, d Delay (s) Level of Service D D D D A A B A Approach Delay (s) Approach LOS D D A A Intersection Summary HCM Average Control Delay 6.7 HCM Level of Service A HCM Volume to Capacity ratio 0.69 Actuated Cycle Length (s) Sum of lost time (s) 12.0 Intersection Capacity Utilization 81.0% ICU Level of Service D Analysis Period (min) 60 c Critical Lane Group 11/4/2015 Synchro 7 - Report AECOM Page 11
289 Lanes, Volumes, Timings Ultimate Signalized Design Concept 12: Sir Monty's Drive & Creditview Road 2031 AM Peak Hour Lane Group EBL EBT EBR WBL WBT WBR NBL NBT NBR SBL SBT SBR Lane Configurations Volume (vph) Ideal Flow (vphpl) Lane Width (m) Grade (%) 0% 0% 0% 0% Storage Length (m) Storage Lanes Taper Length (m) Right Turn on Red Yes Yes Yes Yes Link Speed (k/h) Link Distance (m) Travel Time (s) Confl. Peds. (#/hr) Confl. Bikes (#/hr) Peak Hour Factor Growth Factor 100% 100% 100% 100% 100% 100% 161% 161% 161% 142% 142% 142% Heavy Vehicles (%) 13% 6% 6% 1% 13% 7% 13% 2% 2% 38% 2% 36% Bus Blockages (#/hr) Parking (#/hr) Mid-Block Traffic (%) 0% 0% 0% 0% Shared Lane Traffic (%) Turn Type Perm Perm pm+pt pm+pt Protected Phases Permitted Phases Detector Phase Switch Phase Minimum Initial (s) Minimum Split (s) Total Split (s) Total Split (%) 30.0% 30.0% 0.0% 30.0% 30.0% 0.0% 10.0% 60.0% 0.0% 10.0% 60.0% 0.0% Yellow Time (s) All-Red Time (s) Lost Time Adjust (s) Total Lost Time (s) Lead/Lag Lead Lag Lead Lag Lead-Lag Optimize? Yes Yes Yes Yes Recall Mode None None None None None C-Max None C-Max Intersection Summary Area Type: Other Cycle Length: 110 Actuated Cycle Length: 110 Offset: 6 (5%), Referenced to phase 2:NBTL and 6:SBTL, Start of Green Natural Cycle: 100 Control Type: Actuated-Coordinated 11/4/2015 Synchro 7 - Report AECOM Page 12
290 Lanes, Volumes, Timings Ultimate Signalized Design Concept 12: Sir Monty's Drive & Creditview Road 2031 AM Peak Hour Splits and Phases: 12: Sir Monty's Drive & Creditview Road 11/4/2015 Synchro 7 - Report AECOM Page 13
291 HCM Signalized Intersection Capacity Analysis Ultimate Signalized Design Concept 12: Sir Monty's Drive & Creditview Road 2031 AM Peak Hour Movement EBL EBT EBR WBL WBT WBR NBL NBT NBR SBL SBT SBR Lane Configurations Volume (vph) Ideal Flow (vphpl) Total Lost time (s) Lane Util. Factor Frt Flt Protected Satd. Flow (prot) Flt Permitted Satd. Flow (perm) Peak-hour factor, PHF Growth Factor (vph) 100% 100% 100% 100% 100% 100% 161% 161% 161% 142% 142% 142% Adj. Flow (vph) RTOR Reduction (vph) Lane Group Flow (vph) Heavy Vehicles (%) 13% 6% 6% 1% 13% 7% 13% 2% 2% 38% 2% 36% Turn Type Perm Perm pm+pt pm+pt Protected Phases Permitted Phases Actuated Green, G (s) Effective Green, g (s) Actuated g/c Ratio Clearance Time (s) Vehicle Extension (s) Lane Grp Cap (vph) v/s Ratio Prot c0.01 c v/s Ratio Perm 0.03 c v/c Ratio Uniform Delay, d Progression Factor Incremental Delay, d Delay (s) Level of Service D D E D B B A B Approach Delay (s) Approach LOS D D B B Intersection Summary HCM Average Control Delay 16.5 HCM Level of Service B HCM Volume to Capacity ratio 0.73 Actuated Cycle Length (s) Sum of lost time (s) 13.0 Intersection Capacity Utilization 84.1% ICU Level of Service E Analysis Period (min) 60 c Critical Lane Group 11/4/2015 Synchro 7 - Report AECOM Page 14
292 Lanes, Volumes, Timings Ultimate Signalized Design Concept 17: Creditview Road & Velebit Court 2031 AM Peak Hour Lane Group SET SER NWL NWT NEL NER Lane Configurations Volume (vph) Ideal Flow (vphpl) Lane Width (m) Grade (%) 0% 0% 0% Storage Length (m) Storage Lanes Taper Length (m) Link Speed (k/h) Link Distance (m) Travel Time (s) Confl. Peds. (#/hr) Confl. Bikes (#/hr) Peak Hour Factor Growth Factor 142% 100% 100% 161% 100% 100% Heavy Vehicles (%) 2% 2% 2% 2% 2% 2% Bus Blockages (#/hr) Parking (#/hr) Mid-Block Traffic (%) 0% 0% 0% Shared Lane Traffic (%) Sign Control Free Free Stop Intersection Summary Area Type: Other Control Type: Unsignalized 11/4/2015 Synchro 7 - Report AECOM Page 15
293 HCM Unsignalized Intersection Capacity Analysis Ultimate Signalized Design Concept 17: Creditview Road & Velebit Court 2031 AM Peak Hour Movement SET SER NWL NWT NEL NER Lane Configurations Volume (veh/h) Sign Control Free Free Stop Grade 0% 0% 0% Peak Hour Factor Hourly flow rate (vph) Pedestrians Lane Width (m) Walking Speed (m/s) Percent Blockage Right turn flare (veh) Median type None None Median storage veh) Upstream signal (m) 200 px, platoon unblocked vc, conflicting volume vc1, stage 1 conf vol vc2, stage 2 conf vol vcu, unblocked vol tc, single (s) tc, 2 stage (s) tf (s) p0 queue free % cm capacity (veh/h) Direction, Lane # SE 1 SE 2 NW 1 NW 2 NW 3 NE 1 Volume Total Volume Left Volume Right csh Volume to Capacity Queue Length 95th (m) Control Delay (s) Lane LOS C F Approach Delay (s) Approach LOS F Intersection Summary Average Delay 0.6 Intersection Capacity Utilization 63.1% ICU Level of Service B Analysis Period (min) 60 11/4/2015 Synchro 7 - Report AECOM Page 16
294 Lanes, Volumes, Timings Ultimate Signalized Design Concept 20: Rivergate Place & Creditview Road 2031 AM Peak Hour Lane Group WBL WBR NBT NBR SBL SBT Lane Configurations Volume (vph) Ideal Flow (vphpl) Lane Width (m) Grade (%) 0% 0% 0% Storage Length (m) Storage Lanes Taper Length (m) Link Speed (k/h) Link Distance (m) Travel Time (s) Confl. Peds. (#/hr) Confl. Bikes (#/hr) Peak Hour Factor Growth Factor 100% 100% 161% 100% 100% 142% Heavy Vehicles (%) 2% 2% 2% 2% 2% 2% Bus Blockages (#/hr) Parking (#/hr) Mid-Block Traffic (%) 0% 0% 0% Shared Lane Traffic (%) Sign Control Stop Free Free Intersection Summary Area Type: Other Control Type: Unsignalized 11/4/2015 Synchro 7 - Report AECOM Page 17
295 HCM Unsignalized Intersection Capacity Analysis Ultimate Signalized Design Concept 20: Rivergate Place & Creditview Road 2031 AM Peak Hour Movement WBL WBR NBT NBR SBL SBT Lane Configurations Volume (veh/h) Sign Control Stop Free Free Grade 0% 0% 0% Peak Hour Factor Hourly flow rate (vph) Pedestrians Lane Width (m) Walking Speed (m/s) Percent Blockage Right turn flare (veh) Median type None None Median storage veh) Upstream signal (m) 241 px, platoon unblocked vc, conflicting volume vc1, stage 1 conf vol vc2, stage 2 conf vol vcu, unblocked vol tc, single (s) tc, 2 stage (s) tf (s) p0 queue free % cm capacity (veh/h) Direction, Lane # WB 1 NB 1 NB 2 SB 1 SB 2 SB 3 Volume Total Volume Left Volume Right csh Volume to Capacity Queue Length 95th (m) Control Delay (s) Lane LOS F C Approach Delay (s) Approach LOS F Intersection Summary Average Delay 0.6 Intersection Capacity Utilization 64.9% ICU Level of Service C Analysis Period (min) 60 11/4/2015 Synchro 7 - Report AECOM Page 18
296 Lanes, Volumes, Timings Ultimate Signalized Design Concept 3: Office Entrance & Creditview Road 2031 PM Peak Hour Lane Group EBL EBT EBR WBL WBT WBR NBL NBT NBR SBL SBT SBR Lane Configurations Volume (vph) Ideal Flow (vphpl) Lane Width (m) Grade (%) 0% 0% 0% 0% Storage Length (m) Storage Lanes Taper Length (m) Right Turn on Red Yes Yes Yes Yes Link Speed (k/h) Link Distance (m) Travel Time (s) Confl. Peds. (#/hr) Confl. Bikes (#/hr) Peak Hour Factor Growth Factor 100% 100% 100% 100% 100% 100% 161% 161% 161% 142% 142% 142% Heavy Vehicles (%) 6% 0% 0% 1% 0% 4% 0% 1% 2% 8% 1% 8% Bus Blockages (#/hr) Parking (#/hr) Mid-Block Traffic (%) 0% 0% 0% 0% Shared Lane Traffic (%) Turn Type Perm Perm Perm Perm Perm Perm pm+pt Protected Phases Permitted Phases Detector Phase Switch Phase Minimum Initial (s) Minimum Split (s) Total Split (s) Total Split (%) 33.6% 33.6% 33.6% 33.6% 33.6% 33.6% 56.4% 56.4% 56.4% 10.0% 66.4% 0.0% Yellow Time (s) All-Red Time (s) Lost Time Adjust (s) Total Lost Time (s) Lead/Lag Lag Lag Lag Lead Lead-Lag Optimize? Recall Mode None None None None None None C-Max C-Max C-Max None C-Max Intersection Summary Area Type: Other Cycle Length: 110 Actuated Cycle Length: 110 Offset: 54 (49%), Referenced to phase 2:SBTL and 6:NBTL, Start of Green Natural Cycle: 80 Control Type: Actuated-Coordinated 11/4/2015 Synchro 7 - Report AECOM Page 1
297 Lanes, Volumes, Timings Ultimate Signalized Design Concept 3: Office Entrance & Creditview Road 2031 PM Peak Hour Splits and Phases: 3: Office Entrance & Creditview Road 11/4/2015 Synchro 7 - Report AECOM Page 2
298 HCM Signalized Intersection Capacity Analysis Ultimate Signalized Design Concept 3: Office Entrance & Creditview Road 2031 PM Peak Hour Movement EBL EBT EBR WBL WBT WBR NBL NBT NBR SBL SBT SBR Lane Configurations Volume (vph) Ideal Flow (vphpl) Total Lost time (s) Lane Util. Factor Frt Flt Protected Satd. Flow (prot) Flt Permitted Satd. Flow (perm) Peak-hour factor, PHF Growth Factor (vph) 100% 100% 100% 100% 100% 100% 161% 161% 161% 142% 142% 142% Adj. Flow (vph) RTOR Reduction (vph) Lane Group Flow (vph) Heavy Vehicles (%) 6% 0% 0% 1% 0% 4% 0% 1% 2% 8% 1% 8% Turn Type Perm Perm Perm Perm Perm Perm pm+pt Protected Phases Permitted Phases Actuated Green, G (s) Effective Green, g (s) Actuated g/c Ratio Clearance Time (s) Vehicle Extension (s) Lane Grp Cap (vph) v/s Ratio Prot 0.28 c v/s Ratio Perm c c0.34 v/c Ratio Uniform Delay, d Progression Factor Incremental Delay, d Delay (s) Level of Service D C E D B C D B A Approach Delay (s) Approach LOS D D C A Intersection Summary HCM Average Control Delay 24.5 HCM Level of Service C HCM Volume to Capacity ratio 0.60 Actuated Cycle Length (s) Sum of lost time (s) 10.0 Intersection Capacity Utilization 72.8% ICU Level of Service C Analysis Period (min) 60 c Critical Lane Group 11/4/2015 Synchro 7 - Report AECOM Page 3
299 Lanes, Volumes, Timings Ultimate Signalized Design Concept 5: Argentia Road & Creditview Road 2031 PM Peak Hour Lane Group EBL EBR NBL NBT SBT SBR Lane Configurations Volume (vph) Ideal Flow (vphpl) Lane Width (m) Grade (%) 0% 0% 0% Storage Length (m) Storage Lanes Taper Length (m) Right Turn on Red Yes Yes Link Speed (k/h) Link Distance (m) Travel Time (s) Confl. Peds. (#/hr) Confl. Bikes (#/hr) Peak Hour Factor Growth Factor 100% 100% 161% 161% 142% 142% Heavy Vehicles (%) 1% 1% 3% 1% 2% 0% Bus Blockages (#/hr) Parking (#/hr) Mid-Block Traffic (%) 0% 0% 0% Shared Lane Traffic (%) Turn Type pm+ov Prot Perm Protected Phases Permitted Phases 4 6 Detector Phase Switch Phase Minimum Initial (s) Minimum Split (s) Total Split (s) Total Split (%) 28.2% 27.3% 27.3% 71.8% 44.5% 44.5% Yellow Time (s) All-Red Time (s) Lost Time Adjust (s) Total Lost Time (s) Lead/Lag Lead Lead Lag Lag Lead-Lag Optimize? Yes Yes Yes Yes Recall Mode None None None C-Max C-Max C-Max Intersection Summary Area Type: Other Cycle Length: 110 Actuated Cycle Length: 110 Offset: 0 (0%), Referenced to phase 2:NBT and 6:SBT, Start of Green, Master Intersection Natural Cycle: 80 Control Type: Actuated-Coordinated 11/4/2015 Synchro 7 - Report AECOM Page 4
300 Lanes, Volumes, Timings Ultimate Signalized Design Concept 5: Argentia Road & Creditview Road 2031 PM Peak Hour Splits and Phases: 5: Argentia Road & Creditview Road 11/4/2015 Synchro 7 - Report AECOM Page 5
301 HCM Signalized Intersection Capacity Analysis Ultimate Signalized Design Concept 5: Argentia Road & Creditview Road 2031 PM Peak Hour Movement EBL EBR NBL NBT SBT SBR Lane Configurations Volume (vph) Ideal Flow (vphpl) Total Lost time (s) Lane Util. Factor Frt Flt Protected Satd. Flow (prot) Flt Permitted Satd. Flow (perm) Peak-hour factor, PHF Growth Factor (vph) 100% 100% 161% 161% 142% 142% Adj. Flow (vph) RTOR Reduction (vph) Lane Group Flow (vph) Heavy Vehicles (%) 1% 1% 3% 1% 2% 0% Turn Type pm+ov Prot Perm Protected Phases Permitted Phases 4 6 Actuated Green, G (s) Effective Green, g (s) Actuated g/c Ratio Clearance Time (s) Vehicle Extension (s) Lane Grp Cap (vph) v/s Ratio Prot 0.12 c c0.31 v/s Ratio Perm v/c Ratio Uniform Delay, d Progression Factor Incremental Delay, d Delay (s) Level of Service D D D B C B Approach Delay (s) Approach LOS D C C Intersection Summary HCM Average Control Delay 28.3 HCM Level of Service C HCM Volume to Capacity ratio 0.75 Actuated Cycle Length (s) Sum of lost time (s) 17.0 Intersection Capacity Utilization 75.7% ICU Level of Service D Analysis Period (min) 60 c Critical Lane Group 11/4/2015 Synchro 7 - Report AECOM Page 6
302 Lanes, Volumes, Timings Ultimate Signalized Design Concept 7: Falconer Drive & Creditview Road 2031 PM Peak Hour Lane Group EBL EBR NBL NBT SBT SBR Lane Configurations Volume (vph) Ideal Flow (vphpl) Lane Width (m) Grade (%) 0% 0% 0% Storage Length (m) Storage Lanes Taper Length (m) Link Speed (k/h) Link Distance (m) Travel Time (s) Confl. Peds. (#/hr) Confl. Bikes (#/hr) Peak Hour Factor Growth Factor 100% 100% 161% 161% 142% 142% Heavy Vehicles (%) 0% 0% 1% 2% 1% 0% Bus Blockages (#/hr) Parking (#/hr) Mid-Block Traffic (%) 0% 0% 0% Shared Lane Traffic (%) Sign Control Stop Free Free Intersection Summary Area Type: CBD Control Type: Unsignalized 11/4/2015 Synchro 7 - Report AECOM Page 7
303 HCM Unsignalized Intersection Capacity Analysis Ultimate Signalized Design Concept 7: Falconer Drive & Creditview Road 2031 PM Peak Hour Movement EBL EBR NBL NBT SBT SBR Lane Configurations Volume (veh/h) Sign Control Stop Free Free Grade 0% 0% 0% Peak Hour Factor Hourly flow rate (vph) Pedestrians Lane Width (m) Walking Speed (m/s) Percent Blockage Right turn flare (veh) Median type None None Median storage veh) Upstream signal (m) px, platoon unblocked vc, conflicting volume vc1, stage 1 conf vol vc2, stage 2 conf vol vcu, unblocked vol tc, single (s) tc, 2 stage (s) tf (s) p0 queue free % cm capacity (veh/h) Direction, Lane # EB 1 EB 2 NB 1 NB 2 NB 3 SB 1 SB 2 Volume Total Volume Left Volume Right csh Volume to Capacity Queue Length 95th (m) Control Delay (s) Lane LOS F B D Approach Delay (s) Approach LOS F Intersection Summary Average Delay 6.7 Intersection Capacity Utilization 81.3% ICU Level of Service D Analysis Period (min) 60 11/4/2015 Synchro 7 - Report AECOM Page 8
304 Lanes, Volumes, Timings Ultimate Signalized Design Concept 9: Kenninghall Blvd & Creditview Road 2031 PM Peak Hour Lane Group EBL EBT EBR WBL WBT WBR NBL NBT NBR SBL SBT SBR Lane Configurations Volume (vph) Ideal Flow (vphpl) Lane Width (m) Grade (%) 0% 0% 0% 0% Storage Length (m) Storage Lanes Taper Length (m) Right Turn on Red Yes Yes Yes Yes Link Speed (k/h) Link Distance (m) Travel Time (s) Confl. Peds. (#/hr) Confl. Bikes (#/hr) Peak Hour Factor Growth Factor 100% 100% 100% 100% 100% 100% 161% 161% 161% 142% 142% 142% Heavy Vehicles (%) 0% 0% 1% 0% 11% 0% 1% 2% 0% 75% 2% 0% Bus Blockages (#/hr) Parking (#/hr) Mid-Block Traffic (%) 0% 0% 0% 0% Shared Lane Traffic (%) Turn Type Perm Perm pm+pt Perm Protected Phases Permitted Phases Detector Phase Switch Phase Minimum Initial (s) Minimum Split (s) Total Split (s) Total Split (%) 27.3% 27.3% 0.0% 27.3% 27.3% 0.0% 22.7% 72.7% 0.0% 50.0% 50.0% 0.0% Yellow Time (s) All-Red Time (s) Lost Time Adjust (s) Total Lost Time (s) Lead/Lag Lead Lag Lag Lead-Lag Optimize? Yes Yes Yes Recall Mode None None None None None C-Max C-Max C-Max Intersection Summary Area Type: Other Cycle Length: 110 Actuated Cycle Length: 110 Offset: 32 (29%), Referenced to phase 2:NBTL and 6:SBTL, Start of Green Natural Cycle: 120 Control Type: Actuated-Coordinated 11/4/2015 Synchro 7 - Report AECOM Page 9
305 Lanes, Volumes, Timings Ultimate Signalized Design Concept 9: Kenninghall Blvd & Creditview Road 2031 PM Peak Hour Splits and Phases: 9: Kenninghall Blvd & Creditview Road 11/4/2015 Synchro 7 - Report AECOM Page 10
306 HCM Signalized Intersection Capacity Analysis Ultimate Signalized Design Concept 9: Kenninghall Blvd & Creditview Road 2031 PM Peak Hour Movement EBL EBT EBR WBL WBT WBR NBL NBT NBR SBL SBT SBR Lane Configurations Volume (vph) Ideal Flow (vphpl) Total Lost time (s) Lane Util. Factor Frt Flt Protected Satd. Flow (prot) Flt Permitted Satd. Flow (perm) Peak-hour factor, PHF Growth Factor (vph) 100% 100% 100% 100% 100% 100% 161% 161% 161% 142% 142% 142% Adj. Flow (vph) RTOR Reduction (vph) Lane Group Flow (vph) Heavy Vehicles (%) 0% 0% 1% 0% 11% 0% 1% 2% 0% 75% 2% 0% Turn Type Perm Perm pm+pt Perm Protected Phases Permitted Phases Actuated Green, G (s) Effective Green, g (s) Actuated g/c Ratio Clearance Time (s) Vehicle Extension (s) Lane Grp Cap (vph) v/s Ratio Prot c v/s Ratio Perm 0.01 c0.01 c v/c Ratio Uniform Delay, d Progression Factor Incremental Delay, d Delay (s) Level of Service D D D D E A B B Approach Delay (s) Approach LOS D D B B Intersection Summary HCM Average Control Delay 18.4 HCM Level of Service B HCM Volume to Capacity ratio 0.85 Actuated Cycle Length (s) Sum of lost time (s) 9.0 Intersection Capacity Utilization 96.1% ICU Level of Service F Analysis Period (min) 60 c Critical Lane Group 11/4/2015 Synchro 7 - Report AECOM Page 11
307 Lanes, Volumes, Timings Ultimate Signalized Design Concept 12: Sir Monty's Drive & Creditview Road 2031 PM Peak Hour Lane Group EBL EBT EBR WBL WBT WBR NBL NBT NBR SBL SBT SBR Lane Configurations Volume (vph) Ideal Flow (vphpl) Lane Width (m) Grade (%) 0% 0% 0% 0% Storage Length (m) Storage Lanes Taper Length (m) Right Turn on Red Yes Yes Yes Yes Link Speed (k/h) Link Distance (m) Travel Time (s) Confl. Peds. (#/hr) Confl. Bikes (#/hr) Peak Hour Factor Growth Factor 100% 100% 100% 100% 100% 100% 161% 161% 161% 142% 142% 142% Heavy Vehicles (%) 0% 0% 5% 1% 0% 4% 2% 2% 1% 1% 1% 0% Bus Blockages (#/hr) Parking (#/hr) Mid-Block Traffic (%) 0% 0% 0% 0% Shared Lane Traffic (%) Turn Type Perm Perm pm+pt pm+pt Protected Phases Permitted Phases Detector Phase Switch Phase Minimum Initial (s) Minimum Split (s) Total Split (s) Total Split (%) 30.0% 30.0% 0.0% 30.0% 30.0% 0.0% 9.1% 60.9% 0.0% 9.1% 60.9% 0.0% Yellow Time (s) All-Red Time (s) Lost Time Adjust (s) Total Lost Time (s) Lead/Lag Lead Lag Lead Lag Lead-Lag Optimize? Yes Yes Yes Yes Recall Mode None None None None None C-Max None C-Max Intersection Summary Area Type: Other Cycle Length: 110 Actuated Cycle Length: 110 Offset: 21 (19%), Referenced to phase 2:NBTL and 6:SBTL, Start of Green Natural Cycle: 90 Control Type: Actuated-Coordinated 11/4/2015 Synchro 7 - Report AECOM Page 12
308 Lanes, Volumes, Timings Ultimate Signalized Design Concept 12: Sir Monty's Drive & Creditview Road 2031 PM Peak Hour Splits and Phases: 12: Sir Monty's Drive & Creditview Road 11/4/2015 Synchro 7 - Report AECOM Page 13
309 HCM Signalized Intersection Capacity Analysis Ultimate Signalized Design Concept 12: Sir Monty's Drive & Creditview Road 2031 PM Peak Hour Movement EBL EBT EBR WBL WBT WBR NBL NBT NBR SBL SBT SBR Lane Configurations Volume (vph) Ideal Flow (vphpl) Total Lost time (s) Lane Util. Factor Frt Flt Protected Satd. Flow (prot) Flt Permitted Satd. Flow (perm) Peak-hour factor, PHF Growth Factor (vph) 100% 100% 100% 100% 100% 100% 161% 161% 161% 142% 142% 142% Adj. Flow (vph) RTOR Reduction (vph) Lane Group Flow (vph) Heavy Vehicles (%) 0% 0% 5% 1% 0% 4% 2% 2% 1% 1% 1% 0% Turn Type Perm Perm pm+pt pm+pt Protected Phases Permitted Phases Actuated Green, G (s) Effective Green, g (s) Actuated g/c Ratio Clearance Time (s) Vehicle Extension (s) Lane Grp Cap (vph) v/s Ratio Prot c0.05 c0.53 v/s Ratio Perm 0.04 c v/c Ratio Uniform Delay, d Progression Factor Incremental Delay, d Delay (s) Level of Service D D D D C B B C Approach Delay (s) Approach LOS D D B C Intersection Summary HCM Average Control Delay 22.8 HCM Level of Service C HCM Volume to Capacity ratio 0.74 Actuated Cycle Length (s) Sum of lost time (s) 13.0 Intersection Capacity Utilization 89.5% ICU Level of Service E Analysis Period (min) 60 c Critical Lane Group 11/4/2015 Synchro 7 - Report AECOM Page 14
310 Lanes, Volumes, Timings Ultimate Signalized Design Concept 17: Creditview Road & 2031 PM Peak Hour Lane Group SET SER NWL NWT NEL NER Lane Configurations Volume (vph) Ideal Flow (vphpl) Lane Width (m) Grade (%) 0% 0% 0% Storage Length (m) Storage Lanes Taper Length (m) Link Speed (k/h) Link Distance (m) Travel Time (s) Confl. Peds. (#/hr) Confl. Bikes (#/hr) Peak Hour Factor Growth Factor 142% 100% 100% 161% 100% 100% Heavy Vehicles (%) 2% 2% 2% 2% 2% 2% Bus Blockages (#/hr) Parking (#/hr) Mid-Block Traffic (%) 0% 0% 0% Shared Lane Traffic (%) Sign Control Free Free Stop Intersection Summary Area Type: Other Control Type: Unsignalized 11/4/2015 Synchro 7 - Report AECOM Page 15
311 HCM Unsignalized Intersection Capacity Analysis Ultimate Signalized Design Concept 17: Creditview Road & 2031 PM Peak Hour Movement SET SER NWL NWT NEL NER Lane Configurations Volume (veh/h) Sign Control Free Free Stop Grade 0% 0% 0% Peak Hour Factor Hourly flow rate (vph) Pedestrians Lane Width (m) Walking Speed (m/s) Percent Blockage Right turn flare (veh) Median type None None Median storage veh) Upstream signal (m) 251 px, platoon unblocked vc, conflicting volume vc1, stage 1 conf vol vc2, stage 2 conf vol vcu, unblocked vol tc, single (s) tc, 2 stage (s) tf (s) p0 queue free % cm capacity (veh/h) Direction, Lane # SE 1 SE 2 NW 1 NW 2 NW 3 NE 1 Volume Total Volume Left Volume Right csh Volume to Capacity Queue Length 95th (m) Control Delay (s) Lane LOS C F Approach Delay (s) Approach LOS F Intersection Summary Average Delay 2.3 Intersection Capacity Utilization 65.7% ICU Level of Service C Analysis Period (min) 60 11/4/2015 Synchro 7 - Report AECOM Page 16
312 Lanes, Volumes, Timings Ultimate Signalized Design Concept 20: Rivergate Place & Creditview Road 2031 PM Peak Hour Lane Group WBL WBR NBT NBR SBL SBT Lane Configurations Volume (vph) Ideal Flow (vphpl) Lane Width (m) Grade (%) 0% 0% 0% Storage Length (m) Storage Lanes Taper Length (m) Link Speed (k/h) Link Distance (m) Travel Time (s) Confl. Peds. (#/hr) Confl. Bikes (#/hr) Peak Hour Factor Growth Factor 100% 100% 161% 100% 100% 142% Heavy Vehicles (%) 2% 2% 2% 2% 2% 2% Bus Blockages (#/hr) Parking (#/hr) Mid-Block Traffic (%) 0% 0% 0% Shared Lane Traffic (%) Sign Control Stop Free Free Intersection Summary Area Type: Other Control Type: Unsignalized 11/4/2015 Synchro 7 - Report AECOM Page 17
313 HCM Unsignalized Intersection Capacity Analysis Ultimate Signalized Design Concept 20: Rivergate Place & Creditview Road 2031 PM Peak Hour Movement WBL WBR NBT NBR SBL SBT Lane Configurations Volume (veh/h) Sign Control Stop Free Free Grade 0% 0% 0% Peak Hour Factor Hourly flow rate (vph) Pedestrians Lane Width (m) Walking Speed (m/s) Percent Blockage Right turn flare (veh) Median type None None Median storage veh) Upstream signal (m) 248 px, platoon unblocked vc, conflicting volume vc1, stage 1 conf vol vc2, stage 2 conf vol vcu, unblocked vol tc, single (s) tc, 2 stage (s) tf (s) p0 queue free % cm capacity (veh/h) Direction, Lane # WB 1 NB 1 NB 2 SB 1 SB 2 SB 3 Volume Total Volume Left Volume Right csh Volume to Capacity Queue Length 95th (m) Control Delay (s) Lane LOS F B Approach Delay (s) Approach LOS F Intersection Summary Average Delay 0.3 Intersection Capacity Utilization 61.7% ICU Level of Service B Analysis Period (min) 60 11/4/2015 Synchro 7 - Report AECOM Page 18
314 Alternative 5 (Ultimate Solution)
315 MOVEMENT SUMMARY Site: Argentia two-lane 2031 AM Network: Creditview AM lane New Site Roundabout Movement Performance - Vehicles Mov OD Demand Flows Arrival Flows Deg. Average Level of 95% Back of Queue Prop. Effective Average ID Mov Total HV Total HV Satn Delay Service Vehicles Distance Queued Stop Rate Speed veh/h % veh/h % v/c sec veh m per veh km/h South: Creditview 1 L LOS B T LOS A Approach LOS A North: Creditview 8 T LOS B R LOS B Approach LOS B West: Argentia 10 L LOS B R LOS A Approach LOS A All Vehicles LOS B Level of Service (LOS) Method: Delay (HCM 2000). Roundabout LOS Method: Same as Signalised Intersections. Vehicle movement LOS values are based on average delay per movement Intersection and Approach LOS values are based on average delay for all vehicle movements. Roundabout Capacity Model: SIDRA Standard. SIDRA Standard Delay Model is used. Control Delay includes Geometric Delay. Gap-Acceptance Capacity: SIDRA Standard (Akçelik M3D). HV (%) values are calculated for All Movement Classes of All Heavy Vehicle Model Designation. Processed: Wednesday, November 04, :07:16 PM Copyright Akcelik and Associates Pty Ltd SIDRA INTERSECTION Project: C:\Users\skeltonv\Desktop\Creditview\400-Technical\402 Traffic analysis\sidra models\creditview two lane.sip , , AECOM CANADA LTD (ONTARIO), NETWORK / 1PC
316 MOVEMENT SUMMARY Site: Falconer two-lane 2031 AM Network: Creditview AM lane New Site Roundabout Movement Performance - Vehicles Mov OD Demand Flows Arrival Flows Deg. Average Level of 95% Back of Queue Prop. Effective Average ID Mov Total HV Total HV Satn Delay Service Vehicles Distance Queued Stop Rate Speed veh/h % veh/h % v/c sec veh m per veh km/h South: Creditview 1 L LOS A T LOS A Approach LOS A North: Creditview 8 T LOS A R LOS A Approach LOS A West: Falconer 10 L LOS B R LOS A Approach LOS A All Vehicles LOS A Level of Service (LOS) Method: Delay (HCM 2000). Roundabout LOS Method: Same as Signalised Intersections. Vehicle movement LOS values are based on average delay per movement Intersection and Approach LOS values are based on average delay for all vehicle movements. Roundabout Capacity Model: SIDRA Standard. SIDRA Standard Delay Model is used. Control Delay includes Geometric Delay. Gap-Acceptance Capacity: SIDRA Standard (Akçelik M3D). HV (%) values are calculated for All Movement Classes of All Heavy Vehicle Model Designation. Processed: Wednesday, November 04, :07:16 PM Copyright Akcelik and Associates Pty Ltd SIDRA INTERSECTION Project: C:\Users\skeltonv\Desktop\Creditview\400-Technical\402 Traffic analysis\sidra models\creditview two lane.sip , , AECOM CANADA LTD (ONTARIO), NETWORK / 1PC
317 MOVEMENT SUMMARY Site: Kenninghall two lane 2031 AM Network: Creditview AM lane New Site Roundabout Movement Performance - Vehicles Mov OD Demand Flows Arrival Flows Deg. Average Level of 95% Back of Queue Prop. Effective Average ID Mov Total HV Total HV Satn Delay Service Vehicles Distance Queued Stop Rate Speed veh/h % veh/h % v/c sec veh m per veh km/h South: Creditview 1 L LOS A T LOS A R LOS A Approach LOS A East: Kenninghall 4 L LOS B T LOS A R LOS A Approach LOS B North: Creditview 7 L LOS A T LOS A R LOS A Approach LOS A West: Kenninghall 10 L LOS B T LOS A R LOS A Approach LOS A All Vehicles LOS A Level of Service (LOS) Method: Delay (HCM 2000). Roundabout LOS Method: Same as Signalised Intersections. Vehicle movement LOS values are based on average delay per movement Intersection and Approach LOS values are based on average delay for all vehicle movements. Roundabout Capacity Model: SIDRA Standard. SIDRA Standard Delay Model is used. Control Delay includes Geometric Delay. Gap-Acceptance Capacity: SIDRA Standard (Akçelik M3D). HV (%) values are calculated for All Movement Classes of All Heavy Vehicle Model Designation. Processed: Wednesday, November 04, :07:16 PM Copyright Akcelik and Associates Pty Ltd SIDRA INTERSECTION Project: C:\Users\skeltonv\Desktop\Creditview\400-Technical\402 Traffic analysis\sidra models\creditview two lane.sip , , AECOM CANADA LTD (ONTARIO), NETWORK / 1PC
318 MOVEMENT SUMMARY Site: Argentia two-lane 2031 PM Network: Creditview PM lane New Site Roundabout Movement Performance - Vehicles Mov OD Demand Flows Arrival Flows Deg. Average Level of 95% Back of Queue Prop. Effective Average ID Mov Total HV Total HV Satn Delay Service Vehicles Distance Queued Stop Rate Speed veh/h % veh/h % v/c sec veh m per veh km/h South: Creditview 1 L LOS B T LOS A Approach LOS A North: Creditview 8 T LOS B R LOS B Approach LOS B West: Argentia 10 L LOS B R LOS A Approach LOS B All Vehicles LOS A Level of Service (LOS) Method: Delay (HCM 2000). Roundabout LOS Method: Same as Signalised Intersections. Vehicle movement LOS values are based on average delay per movement Intersection and Approach LOS values are based on average delay for all vehicle movements. Roundabout Capacity Model: SIDRA Standard. SIDRA Standard Delay Model is used. Control Delay includes Geometric Delay. Gap-Acceptance Capacity: SIDRA Standard (Akçelik M3D). HV (%) values are calculated for All Movement Classes of All Heavy Vehicle Model Designation. Processed: Wednesday, November 04, :10:09 PM Copyright Akcelik and Associates Pty Ltd SIDRA INTERSECTION Project: C:\Users\skeltonv\Desktop\Creditview\400-Technical\402 Traffic analysis\sidra models\creditview two lane.sip , , AECOM CANADA LTD (ONTARIO), NETWORK / 1PC
319 MOVEMENT SUMMARY Site: Falconer two-lane 2031 PM Network: Creditview PM lane New Site Roundabout Movement Performance - Vehicles Mov OD Demand Flows Arrival Flows Deg. Average Level of 95% Back of Queue Prop. Effective Average ID Mov Total HV Total HV Satn Delay Service Vehicles Distance Queued Stop Rate Speed veh/h % veh/h % v/c sec veh m per veh km/h South: Creditview 1 L LOS A T LOS A Approach LOS A North: Creditview 8 T LOS A R LOS A Approach LOS A West: Falconer 10 L LOS B R LOS A Approach LOS A All Vehicles LOS A Level of Service (LOS) Method: Delay (HCM 2000). Roundabout LOS Method: Same as Signalised Intersections. Vehicle movement LOS values are based on average delay per movement Intersection and Approach LOS values are based on average delay for all vehicle movements. Roundabout Capacity Model: SIDRA Standard. SIDRA Standard Delay Model is used. Control Delay includes Geometric Delay. Gap-Acceptance Capacity: SIDRA Standard (Akçelik M3D). HV (%) values are calculated for All Movement Classes of All Heavy Vehicle Model Designation. Processed: Wednesday, November 04, :10:09 PM Copyright Akcelik and Associates Pty Ltd SIDRA INTERSECTION Project: C:\Users\skeltonv\Desktop\Creditview\400-Technical\402 Traffic analysis\sidra models\creditview two lane.sip , , AECOM CANADA LTD (ONTARIO), NETWORK / 1PC
320 MOVEMENT SUMMARY Site: Kenninghall two lane 2031 PM Network: Creditview PM lane New Site Roundabout Movement Performance - Vehicles Mov OD Demand Flows Arrival Flows Deg. Average Level of 95% Back of Queue Prop. Effective Average ID Mov Total HV Total HV Satn Delay Service Vehicles Distance Queued Stop Rate Speed veh/h % veh/h % v/c sec veh m per veh km/h South: Creditview 1 L LOS A T LOS A R LOS A Approach LOS A East: Kenninghall 4 L LOS B T LOS A R LOS A Approach LOS B North: Creditview 7 L LOS B T LOS A R LOS A Approach LOS A West: Kenninghall 10 L LOS B T LOS A R LOS A Approach LOS A All Vehicles LOS A Level of Service (LOS) Method: Delay (HCM 2000). Roundabout LOS Method: Same as Signalised Intersections. Vehicle movement LOS values are based on average delay per movement Intersection and Approach LOS values are based on average delay for all vehicle movements. Roundabout Capacity Model: SIDRA Standard. SIDRA Standard Delay Model is used. Control Delay includes Geometric Delay. Gap-Acceptance Capacity: SIDRA Standard (Akçelik M3D). HV (%) values are calculated for All Movement Classes of All Heavy Vehicle Model Designation. Processed: Wednesday, November 04, :10:09 PM Copyright Akcelik and Associates Pty Ltd SIDRA INTERSECTION Project: C:\Users\skeltonv\Desktop\Creditview\400-Technical\402 Traffic analysis\sidra models\creditview two lane.sip , , AECOM CANADA LTD (ONTARIO), NETWORK / 1PC

321
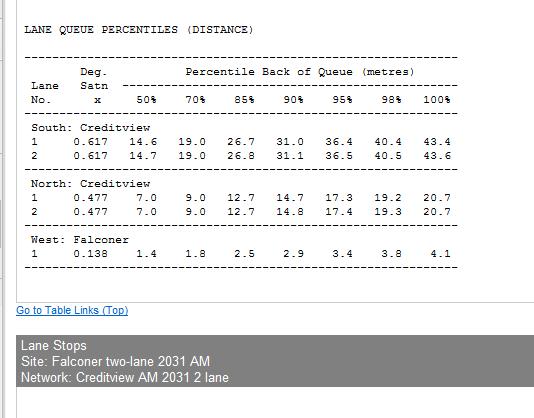
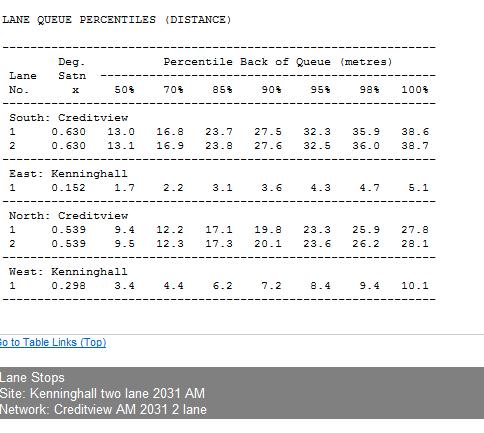
322
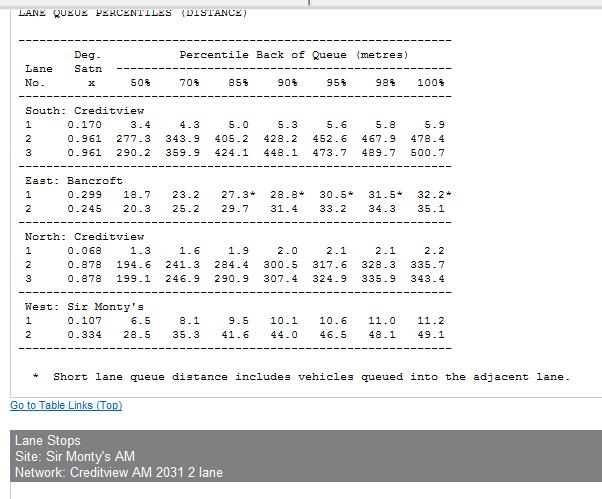
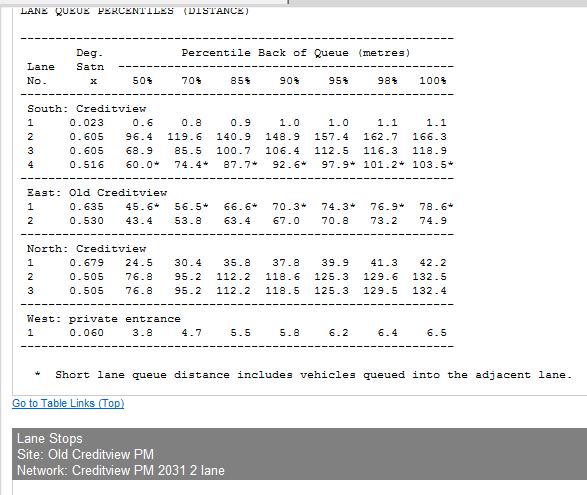
323

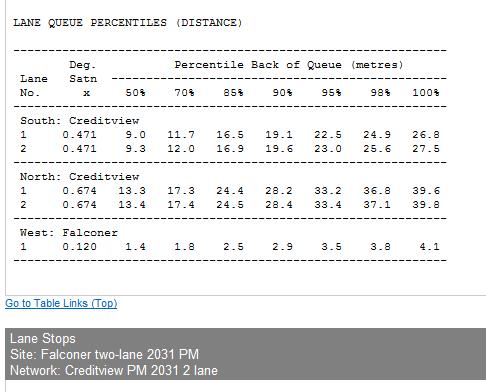
324
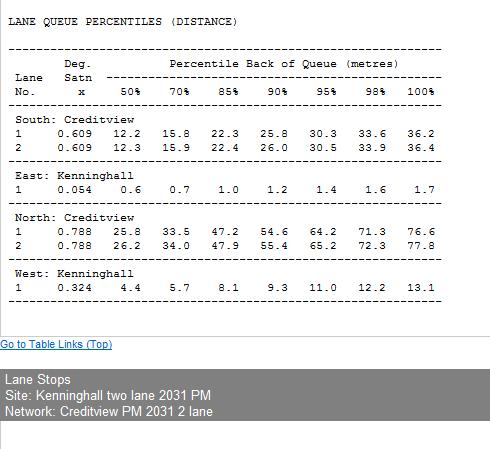

325
APPENDIX C1 TRAFFIC ANALYSIS DESIGN YEAR TRAFFIC ANALYSIS
 APPENDIX C1 TRAFFIC ANALYSIS DESIGN YEAR TRAFFIC ANALYSIS DESIGN YEAR TRAFFIC ANALYSIS February 2018 Highway & Bridge Project PIN 6754.12 Route 13 Connector Road Chemung County February 2018 Appendix
TRAFFIC IMPACT ANALYSIS
 TRAFFIC IMPACT ANALYSIS Emerald Isle Commercial Development Prepared by SEPI Engineering & Construction Prepared for Ark Consulting Group, PLLC March 2016 I. Executive Summary A. Site Location The Emerald
To: File From: Adrian Soo, P. Eng. Markham, ON File: Date: August 18, 2015
 Memo To: From: Adrian Soo, P. Eng. Markham, ON : 165620021 Date: Reference: E.C. Row Expressway, Dominion Boulevard Interchange, Dougall Avenue Interchange, and Howard 1. Review of Interchange Geometry
V. DEVELOPMENT OF CONCEPTS
 Martin Luther King, Jr. Drive Extension FINAL Feasibility Study Page 9 V. DEVELOPMENT OF CONCEPTS Throughout the study process several alternative alignments were developed and eliminated. Initial discussion
Clean Harbors Canada, Inc.
 Clean Harbors Canada, Inc. Proposed Lambton Landfill Expansion Environmental Assessment Terms of Reference Transportation Assessment St. Clair Township, Ontario September 2009 itrans Consulting Inc. 260
Downtown One Way Street Conversion Technical Feasibility Report
 Downtown One Way Street Conversion Technical Feasibility Report As part of the City s Transportation Master Plan, this report reviews the technical feasibility of the proposed conversion of the current
Environmental Assessment Derry Road and Argentia Road Intersection
 Air and Noise Study Environmental Assessment Derry Road and Argentia Road Intersection Project 11-4295 City of Mississauga, Region of Peel October 17, 2014 1 Region of Peel Environmental Assessment for
TRAFFIC IMPACT STUDY DERRY GREEN CORPORATE BUSINESS PARK MILTON SECONDARY PLAN MODIFICATION
 TRAFFIC IMPACT STUDY DERRY GREEN CORPORATE BUSINESS PARK MILTON SECONDARY PLAN MODIFICATION TRAFFIC IMPACT STUDY DERRY GREEN CORPORATE BUSINESS PARK MILTON SECONDARY PLAN MODIFICATION DECEMBER 24 UPDATED
West Hills Shopping Centre Lowe s Expansion Traffic Impact Study
 West Hills Shopping Centre Lowe s Expansion Traffic Impact Study Prepared for: Armel Corporation January 2015 Paradigm Transportation Solutions Ltd. 22 King Street South, Suite 300 Waterloo ON N2J 1N8
LAWRENCE TRANSIT CENTER LOCATION ANALYSIS 9 TH STREET & ROCKLEDGE ROAD / 21 ST STREET & IOWA STREET LAWRENCE, KANSAS
 LAWRENCE TRANSIT CENTER LOCATION ANALYSIS 9 TH STREET & ROCKLEDGE ROAD / 21 ST STREET & IOWA STREET LAWRENCE, KANSAS TRAFFIC IMPACT STUDY FEBRUARY 214 OA Project No. 213-542 TABLE OF CONTENTS 1. INTRODUCTION...
Traffic Impact Analysis 5742 BEACH BOULEVARD MIXED USE PROJECT
 Traffic Impact Analysis 5742 BEACH BOULEVARD MIXED USE PROJECT CITY OF BUENA PARK Prepared by Project No. 14139 000 April 17 th, 2015 DKS Associates Jeffrey Heald, P.E. Rohit Itadkar, T.E. 2677 North Main
105 Toronto Street South, Markdale Transportation Impact Study. Paradigm Transportation Solutions Limited
 105 Toronto Street South, Markdale Transportation Impact Study Paradigm Transportation Solutions Limited December 2016 Project Summary Project Number 162060 December 2016 Client Zelinka Priamo Ltd 318
RTE. 1 at RTE. 637 & RTE. 639
 INTERSECTION SAFETY STUDY Prepared for: Virginia Department of Transportation Central Region Operations Traffic Engineering (UPC #81378, TO 12-092) DAVENPORT Project Number: 13-368 / /2014 RTE. 1 at RTE.
Traffic Impact Study Proposed Residential Development (Watson Parkway North - Starwood Drive Node, City of Guelph)
") Traffic Impact Study Proposed Residential Development (Watson Parkway North - Starwood Drive Node, City of Guelph) Prepared By: 332 Lorne Avenue East Stratford ON N5A 6S4 Prepared for: Paul Kemper, President
Traffic Impact Study Proposed Residential Development (Watson Parkway North - Starwood Drive Node, City of Guelph) Prepared By: 332 Lorne Avenue East Stratford ON N5A 6S4 Prepared for: Paul Kemper, President
Trafalgar Road & Lower Base Line Transportation Study Ontario Inc.
 Trafalgar Road & Lower Base Line Transportation Study 1255723 Ontario Inc. Trafalgar Road & Lower Base Line Transportation Study 1255723 Ontario Inc. 1465 Pickering Parkway Suite 200 Pickering ON L1V 7G7
APPENDIX E. Traffic Analysis Report
 APPENDIX E Traffic Analysis Report THIS PAGE INTENTIONALLY BLANK EAGLE RIVER TRAFFIC MITIGATION PHASE I OLD GLENN HIGHWAY/EAGLE RIVER ROAD INTERSECTION IMPROVEMENTS TRAFFIC ANALYSIS Eagle River, Alaska
EXECUTIVE SUMMARY. The following is an outline of the traffic analysis performed by Hales Engineering for the traffic conditions of this project.
 EXECUTIVE SUMMARY This study addresses the traffic impacts associated with the proposed Shopko redevelopment located in Sugarhouse, Utah. The Shopko redevelopment project is located between 1300 East and
PROJECT: Wilkinson Road Corridor Improvement Traffic Management Planning Project SUBJECT: Traffic Analysis
 TECHNICAL MEMORANDUM DATE: September 10, 2014 PROJECT 5861.03 NO: PROJECT: Wilkinson Road Corridor Improvement Traffic Management Planning Project SUBJECT: Traffic Analysis TO: Steve Holroyd - District
Traffic Engineering Study
 Traffic Engineering Study Bellaire Boulevard Prepared For: International Management District Technical Services, Inc. Texas Registered Engineering Firm F-3580 November 2009 Executive Summary has been requested
RESPONSE TO TRAFFIC IMPACT STUDY COMMENTS
 RESPONSE TO TRAFFIC IMPACT STUDY COMMENTS Proposed Gas Station 40 Arthur Street (Highway 26), Town of the Blue Mountains (Thornbury), County of Grey, Ontario AUGUST 2013 August 27, 2013 MR. REG RUSSWURM
Craig Scheffler, P.E., PTOE HNTB North Carolina, P.C. HNTB Project File: Subject
 TECHNICAL MEMORANDUM To Kumar Neppalli Traffic Engineering Manager Town of Chapel Hill From Craig Scheffler, P.E., PTOE HNTB North Carolina, P.C. Cc HNTB Project File: 38435 Subject Obey Creek TIS 2022
HIGHWAY 28 FUNCTIONAL DESIGN
 HIGHWAY 28 FUNCTIONAL DESIGN PUBLIC OPEN HOUSE #1 WEDNESDAY, MARCH 12, 2014 Stantec Presenters: Brad Vander Heyden, Project Engineer Neal Cormack, Project Manager Dave Parker, Project Engineer Beth Thola,
BARRHAVEN FELLOWSHIP CRC 3058 JOCKVALE ROAD OTTAWA, ONTARIO TRANSPORTATION BRIEF. Prepared for:
 BARRHAVEN FELLOWSHIP CRC 3058 JOCKVALE ROAD OTTAWA, ONTARIO TRANSPORTATION BRIEF Prepared for: Barrhaven Fellowship CRC 3058 Jockvale Road Ottawa, ON K2J 2W7 December 7, 2016 116-649 Report_1.doc D. J.
INTERSECTION CONTROL EVALUATION
 INTERSECTION CONTROL EVALUATION Trunk Highway 22 and CSAH 21 (E Hill Street/Shanaska Creek Road) Kasota, Le Sueur County, Minnesota November 2018 Trunk Highway 22 and Le Sueur CSAH 21 (E Hill Street/Shanaska
MEMO VIA . Ms. Amy Roth DPS Director, City of Three Rivers. To:
 MEMO To: Ms. Amy Roth DPS Director, City of Three Rivers VIA EMAIL From: Michael J. Labadie, PE Julie M. Kroll, PE, PTOE Brandon Hayes, PE, P.Eng. Fleis & VandenBrink Date: January 5, 2017 Re: Proposed
Lacey Gateway Residential Phase 1
 Lacey Gateway Residential Phase Transportation Impact Study April 23, 203 Prepared for: Gateway 850 LLC 5 Lake Bellevue Drive Suite 02 Bellevue, WA 98005 Prepared by: TENW Transportation Engineering West
MILLERSVILLE PARK TRAFFIC IMPACT ANALYSIS ANNE ARUNDEL COUNTY, MARYLAND
 MILLERSVILLE PARK TRAFFIC IMPACT ANALYSIS ANNE ARUNDEL COUNTY, MARYLAND Prepared for: Department of Public Works Anne Arundel County Prepared by: URS Corporation 4 North Park Drive, Suite 3 Hunt Valley,
King County Metro. Columbia Street Transit Priority Improvements Alternative Analysis. Downtown Southend Transit Study. May 2014.
 King County Metro Columbia Street Transit Priority Improvements Alternative Analysis Downtown Southend Transit Study May 2014 Parametrix Table of Contents Introduction... 1 Methodology... 1 Study Area...
Vanier Parkway and Presland Road Residential Development Transportation Impact Study
 Vanier Parkway and Presland Road Residential Development Transportation Impact Study Final Report (Revised) March 2011 Submitted to: Groupe Lépine Ottawa Project No. 09-1613 Submitted by: Groupe Lépine
Bennett Pit. Traffic Impact Study. J&T Consulting, Inc. Weld County, Colorado. March 3, 2017
 Bennett Pit Traffic Impact Study J&T Consulting, Inc. Weld County, Colorado March 3, 217 Prepared By: Sustainable Traffic Solutions, Inc. http://www.sustainabletrafficsolutions.com/ Joseph L. Henderson,
Traffic Impact Statement (TIS)
") Traffic Impact Statement (TIS) Vincentian PUDA Collier County, FL 10/18/2013 Prepared for: Global Properties of Naples Prepared by: Trebilcock Consulting Solutions, PA 2614 Tamiami Trail N, Suite 615 1205
Traffic Impact Statement (TIS) Vincentian PUDA Collier County, FL 10/18/2013 Prepared for: Global Properties of Naples Prepared by: Trebilcock Consulting Solutions, PA 2614 Tamiami Trail N, Suite 615 1205
Craigieburn Employment Precinct North and English Street
 Craigieburn Employment Precinct North and English Street METROPOLITAN PLANNING AUTHORITY Intersection Analyses 7 February 2014 Intersection Analyses Craigieburn Employment Precinct North and English Street
Lakeside Terrace Development
 Lakeside Terrace Development City of Barrie, County of Simcoe Traffic Brief for: Type of Document: Final Report Project Number: JDE 1617 Date Submitted: April 29 th, 216 4/29/16 John Northcote, P.Eng.
Appendix C-5: Proposed Refinements Rail Operations and Maintenance Facility (ROMF) Traffic Impact Analysis. Durham-Orange Light Rail Transit Project
 Traffic Impact Analysis. Durham-Orange Light Rail Transit Project") Appendix C-5: Proposed Refinements Rail Operations and Maintenance Facility (ROMF) Traffic Impact Analysis Durham-Orange Light Rail Transit Project July 25, 218 ROMF Transportation Impact Analysis Version
Appendix C-5: Proposed Refinements Rail Operations and Maintenance Facility (ROMF) Traffic Impact Analysis Durham-Orange Light Rail Transit Project July 25, 218 ROMF Transportation Impact Analysis Version
MEMORANDUM. Figure 1. Roundabout Interchange under Alternative D
 MEMORANDUM Date: To: Liz Diamond, Dokken Engineering From: Subject: Dave Stanek, Fehr & Peers Western Placerville Interchanges 2045 Analysis RS08-2639 Fehr & Peers has completed a transportation analysis
Escondido Marriott Hotel and Mixed-Use Condominium Project TRAFFIC IMPACT ANALYSIS REPORT
 Escondido Marriott Hotel and Mixed-Use Condominium Project TRAFFIC IMPACT ANALYSIS REPORT Prepared for Phelps Program Management 420 Sixth Avenue, Greeley, CO 80632 Prepared by 5050 Avenida Encinas, Suite
RICHMOND OAKS HEALTH CENTRE 6265 PERTH STREET OTTAWA, ONTARIO TRANSPORTATION BRIEF. Prepared for: Guycoki (Eastern) Limited.
 Limited.") RICHMOND OAKS HEALTH CENTRE 6265 PERTH STREET OTTAWA, ONTARIO TRANSPORTATION BRIEF Prepared for: Guycoki (Eastern) Limited June 16, 2016 116-638 Brief_1.doc D. J. Halpenny & Associates Ltd. Consulting
RICHMOND OAKS HEALTH CENTRE 6265 PERTH STREET OTTAWA, ONTARIO TRANSPORTATION BRIEF Prepared for: Guycoki (Eastern) Limited June 16, 2016 116-638 Brief_1.doc D. J. Halpenny & Associates Ltd. Consulting
MERIVALE PRIORITY SQUARE 2852 MERIVALE ROAD CITY OF OTTAWA TRANSPORTATION BRIEF. Prepared for: ONT Inc. 25 Winding Way Nepean, Ontario K2C 3H1
 MERIVALE PRIORITY SQUARE 2852 MERIVALE ROAD CITY OF OTTAWA TRANSPORTATION BRIEF Prepared for: 2190986ONT Inc. 25 Winding Way Nepean, Ontario K2C 3H1 October 6, 2010 110-502 Report_1.doc D. J. Halpenny
Airport Road Improvements
 Airport Road Improvements October 2015 ENVIRONMENTAL STUDY REPORT Airport Road from 1.0 km north of Mayfield to 0.6 km north of King Street Town of Caledon D TRAFFIC STUDY & ROUNDABOUT EVALUATIONS Airport
The major roadways in the study area are State Route 166 and State Route 33, which are shown on Figure 1-1 and described below:
 3.5 TRAFFIC AND CIRCULATION 3.5.1 Existing Conditions 3.5.1.1 Street Network DRAFT ENVIRONMENTAL IMPACT REPORT The major roadways in the study area are State Route 166 and State Route 33, which are shown
INDUSTRIAL DEVELOPMENT
 INDUSTRIAL DEVELOPMENT Traffic Impact Study Plainfield, Illinois August 2018 Prepared for: Seefried Industrial Properties, Inc. TABLE OF CONTENTS Executive Summary 2 Introduction 3 Existing Conditions
Appendix 5. Haymeadow Interim Traffic Analysis
 Appendix 5 Haymeadow Interim Traffic Analysis 20 MEMORANDUM To: From: Rick Pylman Gary Brooks Bill Fox Date: September 15, 2016 Project: Subject: Haymeadow Evaluation of interim access configuration Currently
Table 1 - Land Use Comparisons - Proposed King s Wharf Development. Retail (SF) Office (SF) 354 6,000 10, Land Uses 1
 Office (SF) 354 6,000 10, Land Uses 1") Ref. No. 171-6694 Phase 2 November 23, 217 Mr. David Quilichini, Vice President Fares & Co. Developments Inc. 31 Place Keelson Sales Centre DARTMOUTH NS B2Y C1 Sent Via Email to David@faresinc.com RE:
Ref. No. 171-6694 Phase 2 November 23, 217 Mr. David Quilichini, Vice President Fares & Co. Developments Inc. 31 Place Keelson Sales Centre DARTMOUTH NS B2Y C1 Sent Via Email to David@faresinc.com RE:
RE: A Traffic Impact Statement for a proposed development on Quinpool Road
 James J. Copeland, P.Eng. GRIFFIN transportation group inc. 30 Bonny View Drive Fall River, NS B2T 1R2 May 31, 2018 Ellen O Hara, P.Eng. Project Engineer DesignPoint Engineering & Surveying Ltd. 200 Waterfront
Table of Contents INTRODUCTION... 3 PROJECT STUDY AREA Figure 1 Vicinity Map Study Area... 4 EXISTING CONDITIONS... 5 TRAFFIC OPERATIONS...
 Crosshaven Drive Corridor Study City of Vestavia Hills, Alabama Table of Contents INTRODUCTION... 3 PROJECT STUDY AREA... 3 Figure 1 Vicinity Map Study Area... 4 EXISTING CONDITIONS... 5 TRAFFIC OPERATIONS...
DEVELOPMENT PROPERTY 1627 MAXIME STREET CITY OF OTTAWA TRANSPORTATION OVERVIEW. Prepared for: Subhas Bhargava. July 9, Overview_1.
 DEVELOPMENT PROPERTY 1627 MAXIME STREET CITY OF OTTAWA TRANSPORTATION OVERVIEW Prepared for: Subhas Bhargava July 9, 2015 115-620 Overview_1.doc D. J. Halpenny & Associates Ltd. Consulting Transportation
TRANSPORTATION IMPACT STUDY ALCONA SOUTH SECONDARY PLAN SLEEPING LION DEVELOPMENT TOWN OF INNISFIL
 TRANSPORTATION IMPACT STUDY ALCONA SOUTH SECONDARY PLAN SLEEPING LION DEVELOPMENT TOWN OF INNISFIL Prepared For: 1602850 Ontario Ltd. 2800 Highway 7 Vaughan, Ontario L4K 1W8 Prepared By: URS Canada Inc.
ZINFANDEL LANE / SILVERADO TRAIL INTERSECTION TRAFFIC ANALYSIS
 ZINFANDEL LANE / SILVERADO TRAIL INTERSECTION TRAFFIC ANALYSIS UPDATED TRAFFIC STUDY FOR THE PROPOSED RAYMOND VINEYARDS WINERY USE PERMIT MODIFICATION #P11-00156 AUGUST 5, 2014 PREPARED BY: OMNI-MEANS,
King Soopers #116 Thornton, Colorado
 Traffic Impact Study King Soopers #116 Thornton, Colorado Prepared for: Galloway & Company, Inc. T R A F F I C I M P A C T S T U D Y King Soopers #116 Thornton, Colorado Prepared for Galloway & Company
Traffic Impact Study Speedway Gas Station Redevelopment
 Traffic Impact Study Speedway Gas Station Redevelopment Warrenville, Illinois Prepared For: Prepared By: April 11, 2018 Table of Contents 1. Introduction... 1 2. Existing Conditions... 4 Site Location...
830 Main Street Halifax Regional Municipality
 830 Main Street Halifax Regional Municipality Traffic Impact Statement Final Report Prepared by: GRIFFIN transportation group inc. 30 Bonny View Drive Fall River, NS B2T 1R2 www.griffininc.ca Prepared
Transportation & Traffic Engineering
 Transportation & Traffic Engineering 1) Project Description This report presents a summary of findings for a Traffic Impact Analysis (TIA) performed by A+ Engineering, Inc. for the Hill Country Family
INTERCHANGE OPERTIONS STUDY Interstate 77 / Wallings Road Interchange
 INTERCHANGE OPERTIONS STUDY Interstate 77 / Wallings Road Interchange City of Broadview Heights, Cuyahoga County, Ohio Prepared For: City of Broadview Heights Department of Engineering 9543 Broadview Road
Traffic Feasibility Study
 Traffic Feasibility Study Town Center South Robbinsville Township, Mercer County, New Jersey December 19, 2017 Prepared For Robbinsville Township Department of Community Development 2298 Route 33 Robbinsville,
Mr. Kyle Zimmerman, PE, CFM, PTOE County Engineer
 Los Alamos County Engineering Division 1925 Trinity Drive, Suite B Los Alamos, NM 87544 Attention: County Engineer Dear Kyle: Re: NM 502 Transportation Corridor Study and Plan Peer Review Los Alamos, New
Volume 1 Traffic Impact Analysis Turtle Creek Boulevard Dallas, Texas. Kimley-Horn and Associates, Inc. Dallas, Texas.
 Volume 1 Traffic Impact Analysis 2727 Dallas, Texas June 18, 2018 Kimley-Horn and Associates, Inc. Dallas, Texas Project #064523000 Registered Firm F-928 Traffic Impact Analysis 2727 Dallas, Texas Prepared
King Street & Wyman Road Transportation Impact Study & Transportation Demand Management. Paradigm Transportation Solutions Limited
 King Street & Wyman Road Transportation Impact Study & Transportation Demand Management Paradigm Transportation Solutions Limited April 28 Project Summary Project Number 822 April 28 Client RISE Commercial
Proposed location of Camp Parkway Commerce Center. Vicinity map of Camp Parkway Commerce Center Southampton County, VA
 Proposed location of Camp Parkway Commerce Center Vicinity map of Camp Parkway Commerce Center Southampton County, VA Camp Parkway Commerce Center is a proposed distribution and industrial center to be
TRAFFIC SIGNAL DESIGN REPORT KING OF PRUSSIA ROAD & RAIDER ROAD RADNOR TOWNSHIP PENNSYLVANIA
 TRAFFIC SIGNAL DESIGN REPORT KING OF PRUSSIA ROAD & RAIDER ROAD RADNOR TOWNSHIP PENNSYLVANIA PREPARED FOR: UNIVERSITY OF PENNSYLVANIA HEALTH SYSTEM 34 CIVIC CENTER BOULEVARD PHILADELPHIA, PA 1987 (61)
TRAFFIC IMPACT STUDY FOR ST. JOSEPH'S ELEMENTARY SCHOOL ADDITION
 CATHOLIC DISTRICT SCHOOL BOARD OF EASTERN ONTARIO P.O. 61992 TRAFFIC IMPACT STUDY FOR ST. JOSEPH'S ELEMENTARY SCHOOL ADDITION SEPTEMBER 5, 218 TRAFFIC IMPACT STUDY FOR ST. JOSEPH'S ELEMENTARY SCHOOL ADDITION
APPENDIX B Traffic Analysis
 APPENDIX B Traffic Analysis Rim of the World Unified School District Reconfiguration Prepared for: Rim of the World School District 27315 North Bay Road, Blue Jay, CA 92317 Prepared by: 400 Oceangate,
Prepared For: Toronto Transit Commission 1138 Bathurst Street Toronto, Ontario M5R 3H2. Prepared By:
 TRAFFIC IMPACT STUDY FOR THE TTC MCNICOLL BUS GARAGE CITY OF TORONTO Prepared For: Toronto Transit Commission 1138 Bathurst Street Toronto, Ontario M5R 3H2 Prepared By: Canada Inc. 4th Floor, 3 Leek Crescent
Traffic Impact Analysis. Alliance Cole Avenue Residential Site Dallas, Texas. Kimley-Horn and Associates, Inc. Dallas, Texas.
 Traffic Impact Analysis Alliance Cole Avenue Residential Site Dallas, Texas February 15, 2018 Kimley-Horn and Associates, Inc. Dallas, Texas Project #064524900 Registered Firm F-928 Traffic Impact Analysis
TIMBERVINE TRANSPORTATION IMPACT STUDY FORT COLLINS, COLORADO JANUARY Prepared for:
 TIMBERVINE TRANSPORTATION IMPACT STUDY FORT COLLINS, COLORADO JANUARY 2014 Prepared for: Hartford Companies 1218 W. Ash Street Suite A Windsor, Co 80550 Prepared by: DELICH ASSOCIATES 2272 Glen Haven Drive
886 March Road McDonald's Transportation Study
 McDonald's Restaurants of Canada Limited March 2013 886 March Road McDonald's Transportation Study Submitted by: HDR Corporation 100 York Boulevard, Suite 300 Richmond Hill, ON L4B 1J8 (905) 882-4100 www.hdrinc.com
Proposed Inn at Bellefield Traffic Impact Assessment
 Proposed Inn at Bellefield Traffic Impact Assessment Town of Hyde Park Dutchess County, New York Prepared for: T-Rex Hyde Park Owner LLC 500 Mamroneck Avenue, Suite 300 Harrison, NY 10528 June 21, 2017
Proposed CVS/pharmacy
 Traffic Impact and Access Study Proposed CVS/pharmacy West Main Street (Route 1) at Hull Street Clinton, Connecticut PREPARED FOR Arista Development LLC 520 Providence Highway, Suite 9 Norwood, Massachusetts
MINERVA PARK SITE TRAFFIC IMPACT STUDY M/I HOMES. September 2, 2015
 5500 New Albany Road Columbus, Ohio 43054 Phone: 614.775.4500 Fax: 614.775.4800 Toll Free: 1-888-775-EMHT emht.com 2015-1008 MINERVA PARK SITE TRAFFIC IMPACT STUDY M/I HOMES September 2, 2015 Engineers
LCPS Valley Service Center
 Traffic Impact Study LCPS Valley Service Center Loudoun County, Virginia November 4, 2015 Prepared For: Loudoun County Public Schools 21000 Education Court Ashburn, VA 20148 Prepared by: 1140 Connecticut
Table of Contents. Traffic Impact Analysis Capital One Building at Schilling Place
 Traffic Impact Analysis Capital One Building at Schilling Place Table of Contents Executive Summary... 1 1. Introduction... 4 2. Project Description... 4 3. Background Information... 4 4. Study Scope...
APPENDIX G TRAFFIC STUDY TECHNICAL MEMORANDUM
 APPENDIX G TRAFFIC STUDY TECHNICAL MEMORANDUM TECHNICAL MEMORANDUM To: From: Date: Subject: Jerry Flores - AECOM Brian A. Marchetti, AICP September 9, 5 DRAFT Traffic Study LABOE Channel 5 Studio Relocation
BERKELEY DOWNTOWN AREA PLAN PROGRAM ENVIRONMENTAL IMPACT REPORT TRAFFIC IMPACT ANALYSIS
 BERKELEY DOWNTOWN AREA PLAN PROGRAM ENVIRONMENTAL IMPACT REPORT TRAFFIC IMPACT ANALYSIS Prepared for: City of Berkeley Prepared by: REVISED JANUARY 9, 2009 Berkeley Downtown Area Plan Program EIR Traffic
Date: February 7, 2017 John Doyle, Z-Best Products Robert Del Rio. T.E. Z-Best Traffic Operations and Site Access Analysis
 Memorandum Date: February 7, 07 To: From: Subject: John Doyle, Z-Best Products Robert Del Rio. T.E. Z-Best Traffic Operations and Site Access Analysis Introduction Hexagon Transportation Consultants, Inc.
Section 5.0 Traffic Information
 Section 5.0 Traffic Information 10.0 TRANSPORTATION MDM Transportation Consultants, Inc. (MDM) has prepared an evaluation of transportation impacts for the proposed evaluation for the expansion of the
Transit City Etobicoke - Finch West LRT
 Delcan Corporation Transit City Etobicoke - Finch West LRT APPENDIX D Microsimulation Traffic Modeling Report March 2010 March 2010 Appendix D CONTENTS 1.0 STUDY CONTEXT... 2 Figure 1 Study Limits... 2
TRAFFIC DATA. Existing Derousse Ave./River Rd. AM LOS Analysis Existing Derousse Ave./River Rd. PM LOS Analysis
 Appendix E NJ TRANSIT Pennsauken Junction Transit Center and Park & Ride RiverLINE and Atlantic City Line Pennsauken Township, Camden County, New Jersey TRAFFIC DATA Background Traffic Information for
Alpine Highway to North County Boulevard Connector Study
 Alpine Highway to North County Boulevard Connector Study prepared by Avenue Consultants March 16, 2017 North County Boulevard Connector Study March 16, 2017 Table of Contents 1 Summary of Findings... 1
Traffic Impact Analysis West Street Garden Plots Improvements and DuPage River Park Garden Plots Development Naperville, Illinois
 Traffic Impact Analysis West Street Garden Plots Improvements and DuPage River Park Garden Plots Development Naperville, Illinois Submitted by April 9, 2009 Introduction Kenig, Lindgren, O Hara, Aboona,
Re: Addendum No. 4 Transportation Overview 146 Mountshannon Drive Ottawa, Ontario
 April 18 th, 2017 Mr. Kevin Yemm Vice President, Land Development Richraft Group of Companies 2280 St. Laurent Boulevard, Suite 201 Ottawa, Ontario (Tel: 613.739.7111 / e-mail: keviny@richcraft.com) Re:
TRAFFIC IMPACT STUDY FOR SONIC DRIVE-IN RESTAURANT. Vallejo, CA. Prepared For:
 TRAFFIC IMPACT STUDY FOR SONIC DRIVE-IN RESTAURANT Vallejo, CA Prepared For: ELITE DRIVE-INS, INC. 2190 Meridian Park Blvd, Suite G Concord, CA 94520 Prepared By: KD Anderson & Associates 3853 Taylor Road,
CHAPTER 9: VEHICULAR ACCESS CONTROL Introduction and Goals Administration Standards
 9.00 Introduction and Goals 9.01 Administration 9.02 Standards 9.1 9.00 INTRODUCTION AND GOALS City streets serve two purposes that are often in conflict moving traffic and accessing property. The higher
December 5, Red Bank Planning Board Municipal Building 90 Monmouth Street Red Bank, NJ 07701
 Dynamic Traffic, LLC www.dynamic-traffic.com 1904 Main Street Lake Como, NJ 07719 T. 732.681.0760 December 5, 2016 Red Bank Planning Board Municipal Building 90 Monmouth Street Red Bank, NJ 07701 Re: Traffic
Ryan Coyne, PE City Engineer City of Rye 1051 Boston Post Road Rye, NY Boston Post Road Realignment and Roundabout Design Report
 March 6, 2015 Ryan Coyne, PE City Engineer City of Rye 1051 Boston Post Road Rye, NY 10580 RE: JMC Project 14108 Boston Post Road Roundabout Boston Post Road and Parsons Street City of Rye, NY Dear Ryan:
Traffic Impact Analysis Update
 Willow Bend Traffic Impact Analysis Update TABLE OF CONTENTS Page I. INTRODUCTION -------------------------------------------------------------------------------------------- 1 II. EXISTING CONDITIONS
TABLE OF CONTENTS SECTION PAGE. Executive Summary... xii
 TABLE OF CONTENTS SECTION PAGE Executive Summary... xii 1.0 Introduction... 1 1.1 Study Area... 2 1.2 Traffic Impact Analysis Scenarios... 4 1.3 Study Area - City of Orange... 4 2.0 Project Description
144&176 John St. and 200 John St. & 588 Charlotte St. Hotel and Residential Subdivision Development
 Solmar Development Corp. 144&176 John St. and 2 John St. & 588 Charlotte St. Hotel and Residential Subdivision Development TRANSPORTATION IMPACT STUDY 18145 November 217 LEA Consulting Ltd. Consulting
Mississauga Bus Rapid Transit Preliminary Design Project
 Mississauga Bus Rapid Transit Preliminary Design Project PUBLIC INFORMATION CENTRE OCTOBER 2008 WELCOME The Mississauga Bus Rapid Transit (BRT) Project Thank you for attending this Public Information Centre.
4.14 TRANSPORTATION AND CIRCULATION
 4.14 TRANSPORTATION AND CIRCULATION 4.14.1 Summary Table 4.14-1 summarizes the identified environmental impacts, proposed mitigation measures, and residual impacts of the proposed project with regard to
TRAFFIC IMPACT STUDY DERRY GREEN CORPORATE BUSINESS PARK MILTON SECONDARY PLAN MODIFICATION
 TRAFFIC IMPACT STUDY DERRY GREEN CORPORATE BUSINESS PARK MILTON SECONDARY PLAN MODIFICATION TRAFFIC IMPACT STUDY DERRY GREEN CORPORATE BUSINESS PARK MILTON SECONDARY PLAN MODIFICATION DECEMBER 2014 UPDATED
Mineola Village Green
 Traffic Impact Analysis Report Mineola Village Green 199 2 nd Street Mineola, New York Prepared for Mineola Metro LLC c/o Lalezarian Properties 1999 Marcus Avenue, Suite 310 Lake Success, NY 11042 Prepared
GASOLINE SERVICE STATION 1618, 1622 ROGER STEVENS DRIVE OTTAWA, ONTARIO TRANSPORTATION IMPACT ASSESSMENT. Prepared for:
 GASOLINE SERVICE STATION 1618, 1622 ROGER STEVENS DRIVE OTTAWA, ONTARIO TRANSPORTATION IMPACT ASSESSMENT Prepared for: Invecta Development (Ottawa) Corporation 758 Shanks Height Milton, ON L9T 7P7 May
Oakbrook Village Plaza City of Laguna Hills
 Oakbrook Village Plaza City of Laguna Hills Traffic Impact Analysis Prepared by: HDR Engineering 3230 El Camino Real, Suite 200 Irvine, CA 92602 October 2012 Revision 3 D-1 Oakbrook Village Plaza Laguna
Shirk Road at State Route 198 Interchange Analysis Tulare County, California
 Shirk Road at State Route 198 Interchange Analysis Tulare County, California DRAFT REPORT Prepared By Tulare County Association of Governments (TCAG) April 2013 Table of Contents Introduction:... 3 Project
TRAFFIC IMPACT ANALYSIS FOR. McDONALD S RESTAURANT IN CARMICAEL Sacramento County, CA. Prepared For:
 TRAFFIC IMPACT ANALYSIS FOR McDONALD S RESTAURANT IN CARMICAEL Sacramento County, CA Prepared For: McDonald s USA, LLC Pacific Sierra Region 2999 Oak Road, Suite 900 Walnut Creek, CA 94597 Prepared By:
Interstate Operations Study: Fargo-Moorhead Metropolitan Area Simulation Output
 NDSU Dept #2880 PO Box 6050 Fargo, ND 58108-6050 Tel 701-231-8058 Fax 701-231-6265 www.ugpti.org www.atacenter.org Interstate Operations Study: Fargo-Moorhead Metropolitan Area 2015 Simulation Output Technical
INTERSECTION ANALYSIS PARK AVENUE AND BRADDOCK ROAD (FROSTBURG, MD) FOR LENHART TRAFFIC CONSULTING, INC.
 FOR LENHART TRAFFIC CONSULTING, INC.") INTERSECTION ANALYSIS FOR PARK AVENUE AND BRADDOCK ROAD (FROSTBURG, MD) Prepared for: City of Frostburg, Maryland & Allegany County Commissioners Prepared by: LENHART TRAFFIC CONSULTING, INC. TRAFFIC ENGINEERING
INTERSECTION ANALYSIS FOR PARK AVENUE AND BRADDOCK ROAD (FROSTBURG, MD) Prepared for: City of Frostburg, Maryland & Allegany County Commissioners Prepared by: LENHART TRAFFIC CONSULTING, INC. TRAFFIC ENGINEERING
Appendix H: Construction Impacts H-2 Transportation
 Appendix H: Construction Impacts H-2 Transportation \ AECOM 71 W. 23 rd Street New York, NY 10010 www.aecom.com 212 366 6200 tel 212 366 6214 fax Memorandum To CC Subject Robert Conway Donald Tone Construction
Traffic Impact Analysis for 2171 Rosecrans Avenue
 Traffic Impact Analysis for 2171 Rosecrans Avenue Prepared for: Continental Development Corporation Revised May 2016 LA16-2831 Prepared by: Fehr & Peers 600 Wilshire Blvd, Suite 1050 Los Angeles, CA 90017
One Harbor Point Residential
 Residential Gig Harbor, WA Transportation Impact Analysis January 23, 2017 Prepared for: Neil Walter Company PO Box 2181 Tacoma, WA 98401 Prepared by: TENW Transportation Engineering NorthWest 11400 SE
TRAFFIC AND TRANSPORTATION TECHNICAL MEMORANDUM
 TRAFFIC AND TRANSPORTATION TECHNICAL MEMORANDUM for ENVIRONMENTAL ASSESSMENT US 460 Bypass Interchange and Southgate Drive Relocation State Project No.: 0460-150-204, P101, R201, C501, B601; UPC 99425